Abstract
In this study, in order to promote the development of far-reaching marine aquaculture equipment in an intelligent direction and solve the problems related to power supply, a tidal current energy harvesting device for a low-velocity sea area is proposed. For low-velocity waters in farming areas, the device can effectively harness tidal energy to provide a stable power supply to open sea cages. A mathematical model of the Savonius turbine blade is established, and the influence of the distance between the impeller center and the water surface on the energy capture efficiency of the turbine is analyzed through numerical simulation. Using ANSYS2021R1 software, the velocity field of the floating body is simulated, and the overall structure and anchoring system of the power generation device is designed. In order to verify the effectiveness of the power generation device, a test model is built and a physical model test is carried out. The variation in parameters related to the relative distance between the impeller and the water under different flow velocities is tested, and the test data are analyzed. The test results show that the floating body can increase the flow speed by 10%. Optimizing the blade number and order of the S-turbine can capture more than 20% of the energy. Under different flow velocities, the capture power of the impeller first increases and then decreases with increasing distance from the water. When the center of the impeller is one-quarter of the impeller diameter higher than the water surface, the output power of the impeller is at the maximum. This indicates that the proposed power generation device can effectively use tidal energy under different water depth conditions and provide a stable power supply for far-reaching marine aquaculture equipment.
1. Introduction
According to the estimates of UNESCO, the theoretical reserve of global ocean energy is as high as 7.66 × 10⁵ GW, and annual electricity generation can exceed 2 × 10⁴ TW·h, which is sufficient to meet the global electricity demand [1,2]. Among many marine energies, tidal current energy is generated under the influence of Earth–moon gravity and has strong predictability. Its global reserve is about 3000 GW, which is mainly distributed in countries with vast coastlines, such as China, the United Kingdom, the United States, and Canada [3]. The energy density of tidal flow energy is very high, about four times that of wind energy and 300 times that of solar energy [4], and the development cost is low; therefore, it has high development feasibility and good market application prospects [5,6].
A hydraulic turbine is a machine that converts tidal energy into mechanical energy that is widely used in marine, renewable energy, and other fields. Hydraulic turbines are divided into two categories: horizontal axis and vertical axis [7]. Horizontal-axis tidal turbines are the most commonly used devices to harness tidal currents. However, vertical-axis tidal turbines have reached the same level of technology [8]. Samadi et al. optimized a new type of turbine with a half-cylinder guide plate by adding it to the Savonius tidal turbine, increasing the power coefficient to 0.38 when the optimal TSR is 0.68 [9]. Shen et al. combined computational fluid dynamics (CFD) and proxy model methods to reveal the relationships between turbine performance, airfoil shape, and flow characteristics at low flow rates [10]. Mei Yuan et al. used Fluent ANSYS2021R1 software to construct three-dimensional models of straight blade-type and spiral-type turbines, analyzing the torque characteristics and energy capture efficiency under different twist angles, different tip velocity ratios, and different flow rates [11]. Combining numerical simulation and wind tunnel tests, Li Yan et al. studied the static start-up performance of two-blade and three-blade Savonius wind turbines with end plates under different wind speeds and analyzed the flow field. The results show that, for a two-blade Savonius wind turbine, the average starting torque of a wind turbine with an end plate is increased by 85.4% compared with a wind turbine without an end plate, and the reverse starting torque is small [12]. Wang Shenghu et al. studied the influence of triangular array structural parameters, dynamic parameters, TSR, initial flow rate, and rotation on the overall flow reduction performance [13]. Yang Zizhong used numerical simulation tests and the BP neural network combined with the NSGA-II multi-objective optimization algorithm to optimize five parameters—overlap rate, clearance rate, inner and outer arc angle, inner arc radius, and diversion groove size—and compared and analyzed the performance of the optimal MBC, S, and MB impellers [14]. Wakui et al. studied the influence of different installation positions of Savonius wind turbines on composite wind turbines [15]. Asadi et al. studied the influence of relative installation angle on the combined performance of linear wing vertical axis wind turbines and Savonius wind turbines [16]. Chen et al. conducted wind tunnel tests on Savonius wind turbines with two and three blades. Their results showed that, under certain structural parameters, the reverse torque of the three-blade Savonius wind turbine could be eliminated, and the fluctuation range of torque was reduced compared with that of the two-blade Savonius wind turbine [17]. Gupta et al. combined a three-blade Darrieus wind turbine with a three-blade Savonius wind turbine and conducted a wind tunnel test to verify its feasibility [18]. Tang et al. combined SMM with a genetic algorithm to discuss the non-stationary problem of cycloidal propeller airfoil optimization [19]. Gao et al. designed a composite blade. In order to make better use of the energy in the low-speed sea area and solve the start-up problem, the tidal energy capture performance at low velocity was studied [20]. Yan et al. studied the influence of sweepback design on the hydrodynamic performance of airfoil blades [21]. Jiao et al. studied the relationship between the positive and negative characteristics of the “S” airfoil and the bidirectional pump through numerical calculations and experiments and found that a good airfoil shape can enhance the function of the blade and reduce energy loss [22]. Du et al. used neural networks and proxy models to design a fast reflection optimization framework for the performance evaluation of the blade airfoil [23]. Bangga et al. found that blade profile thickness is an important factor affecting the performance of highly robust rotors [24].
Domestic and foreign scholars’ research on the Savonius turbine has mainly focused on wind power generation, while there have been few studies on tidal current power generation. The blade tip speed ratio of the classical airfoil studied is much higher than that of the Savonius turbine, and it is not suitable for low-flow waters. Thus, there is a requirement for further study focused on the Savonius turbine for tidal flow energy capture. Therefore, in combination with the characteristics of far-reaching aquaculture areas and aquaculture facilities, this study innovatively proposes an elevating tidal current power generation device based on deep-water cages. By changing the water turbine outlet distance, the negative action of water flow on the impeller convex surface can be reduced to improve the power generation efficiency of the device.
2. Overview of Energy Harvesting Devices
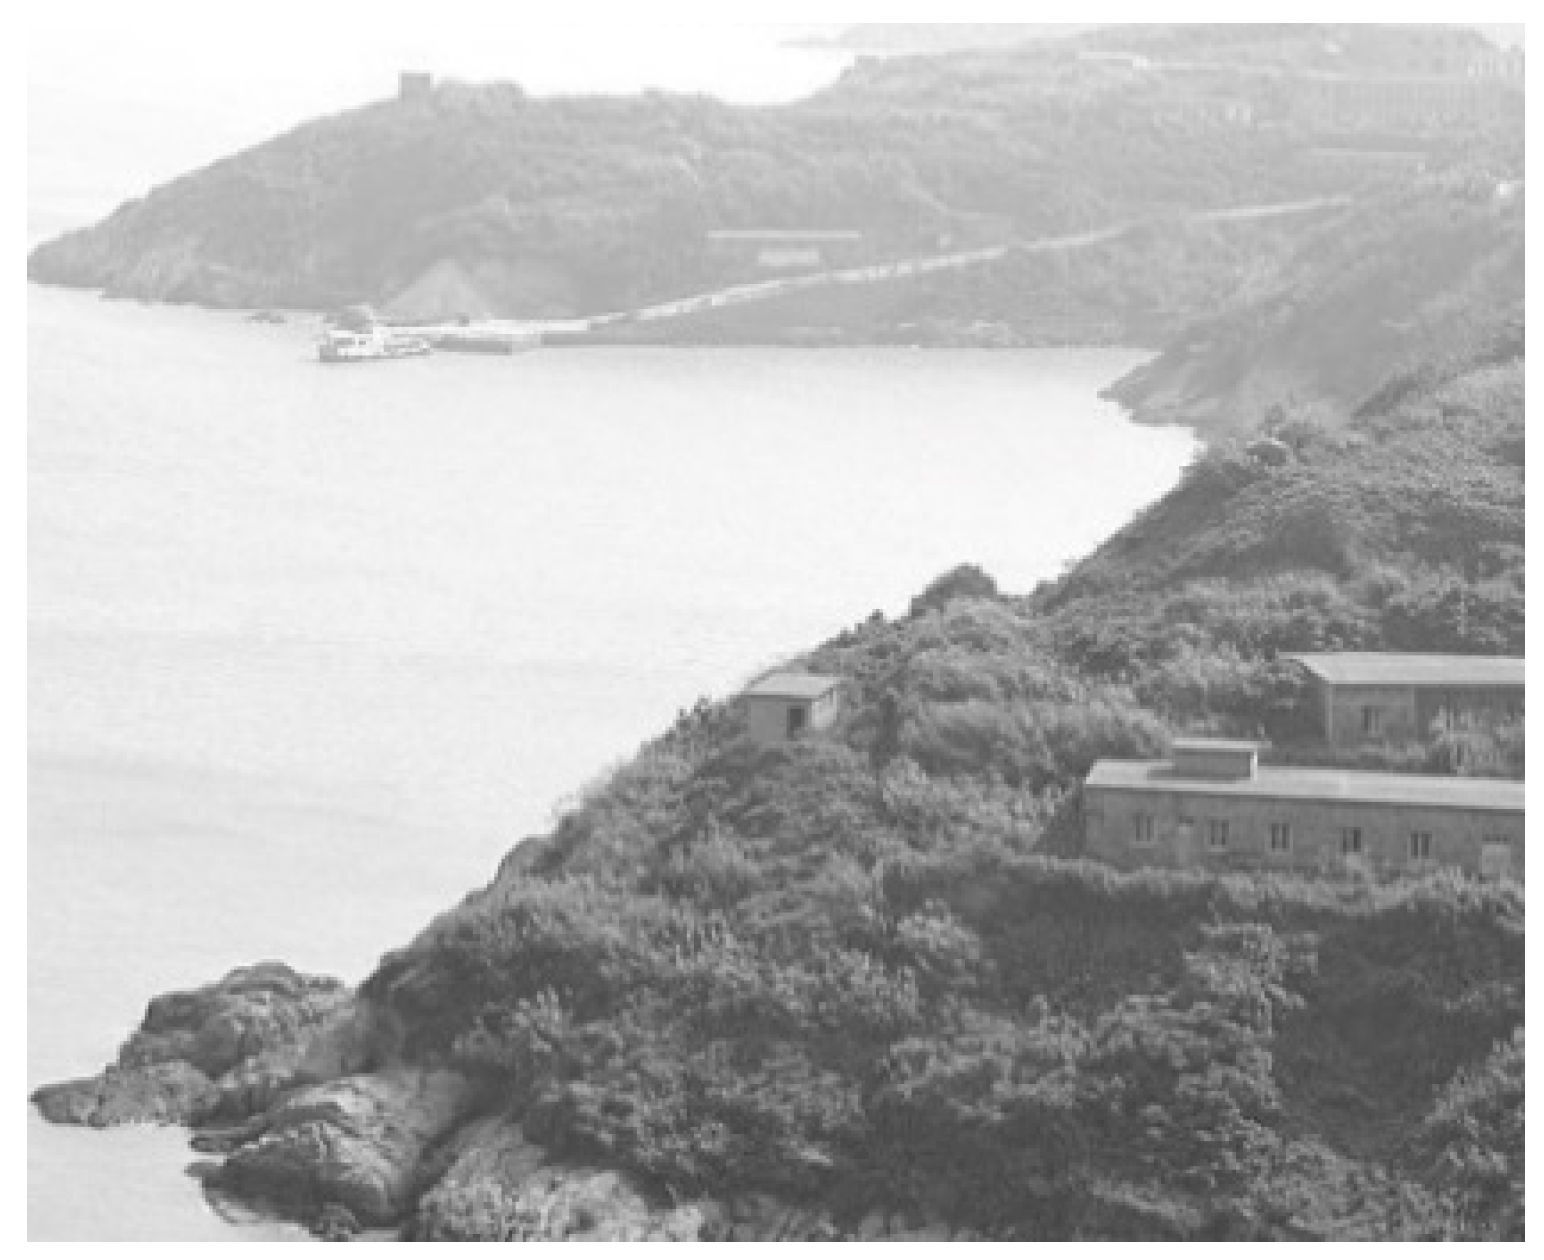
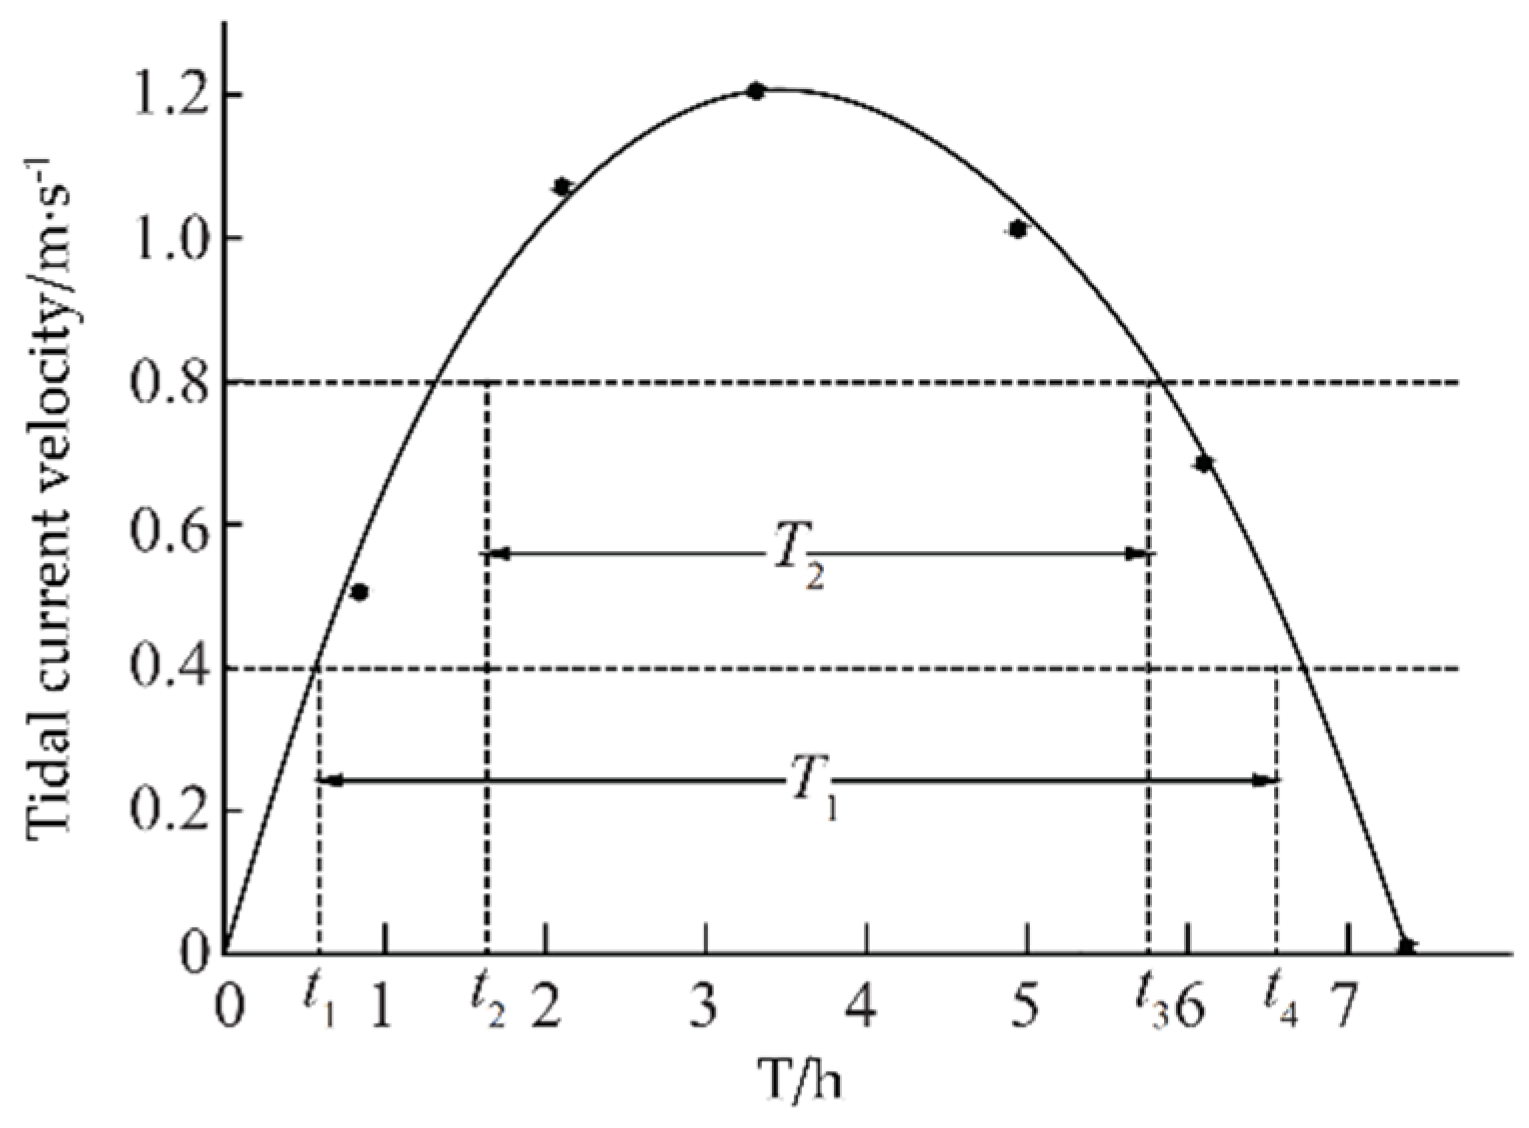
2.1. Sea Area Characteristic Analysis
The lifting-type tidal current power generation device is intended to be placed in the sea area of the Yushan Islands, as shown in Figure 1. In a field test of the tidal current velocity in this area, it was found that the period T of the tidal current is about 12.42 h, and this is a regular semi-diurnal tide; that is, there are two high tides and two low tides in a day, and the adjacent high tide velocity and low tide velocity are basically equal. Moreover, it was found that the maximum spring tide velocity in this area is about 1.2 m/s. According to the actual measured data, the curve fitting of the velocity change in the first high tide (or low tide) is shown in Figure 2.
Figure 1.
Yushan Islands.
Figure 2.
Half-daily tidal flow velocity fitting curve.
Origin 2021 9.8 software was used to analyze and fit the measured velocity data, and the mathematical model of the velocity in the sea area was obtained as follows:
where is the maximum flow rate of the power flow, 1.2 m/s; T is the semi-daily cycle of the tide, generally 12.42 h; is the average maximum flow velocity amplitude, which is calculated as 1.1 m/s; K is the amplitude fluctuation coefficient, calculated as K = 0.14; and is the semilunar period (i.e., the period of major and minor tides), which is generally 354.37 h (14.57 d).
The energy capture power formula of the power generation device is as follows:
where is the energy conversion efficiency; ρ is the density of seawater, ; is the real-time flow rate, ; and is the blade sweep area, m2.
In a half-day cycle, the energy captured by the power plant is as follows:
where Ts is the effective time for the impeller to operate in a half-day cycle. The Savonius turbine has the advantage of low starting torque. In a tidal cycle, the operation time of the Savonius turbine is much longer than that of the horizontal shaft turbine and the vertical shaft lift turbine. In addition, it is difficult to reach a turbine blade tip speed ratio of 1.5 under this sea condition. The resistance-type Savonius turbine has the best power coefficient. In summary, it is reasonable and feasible to use a Savonius turbine in this power generation device.
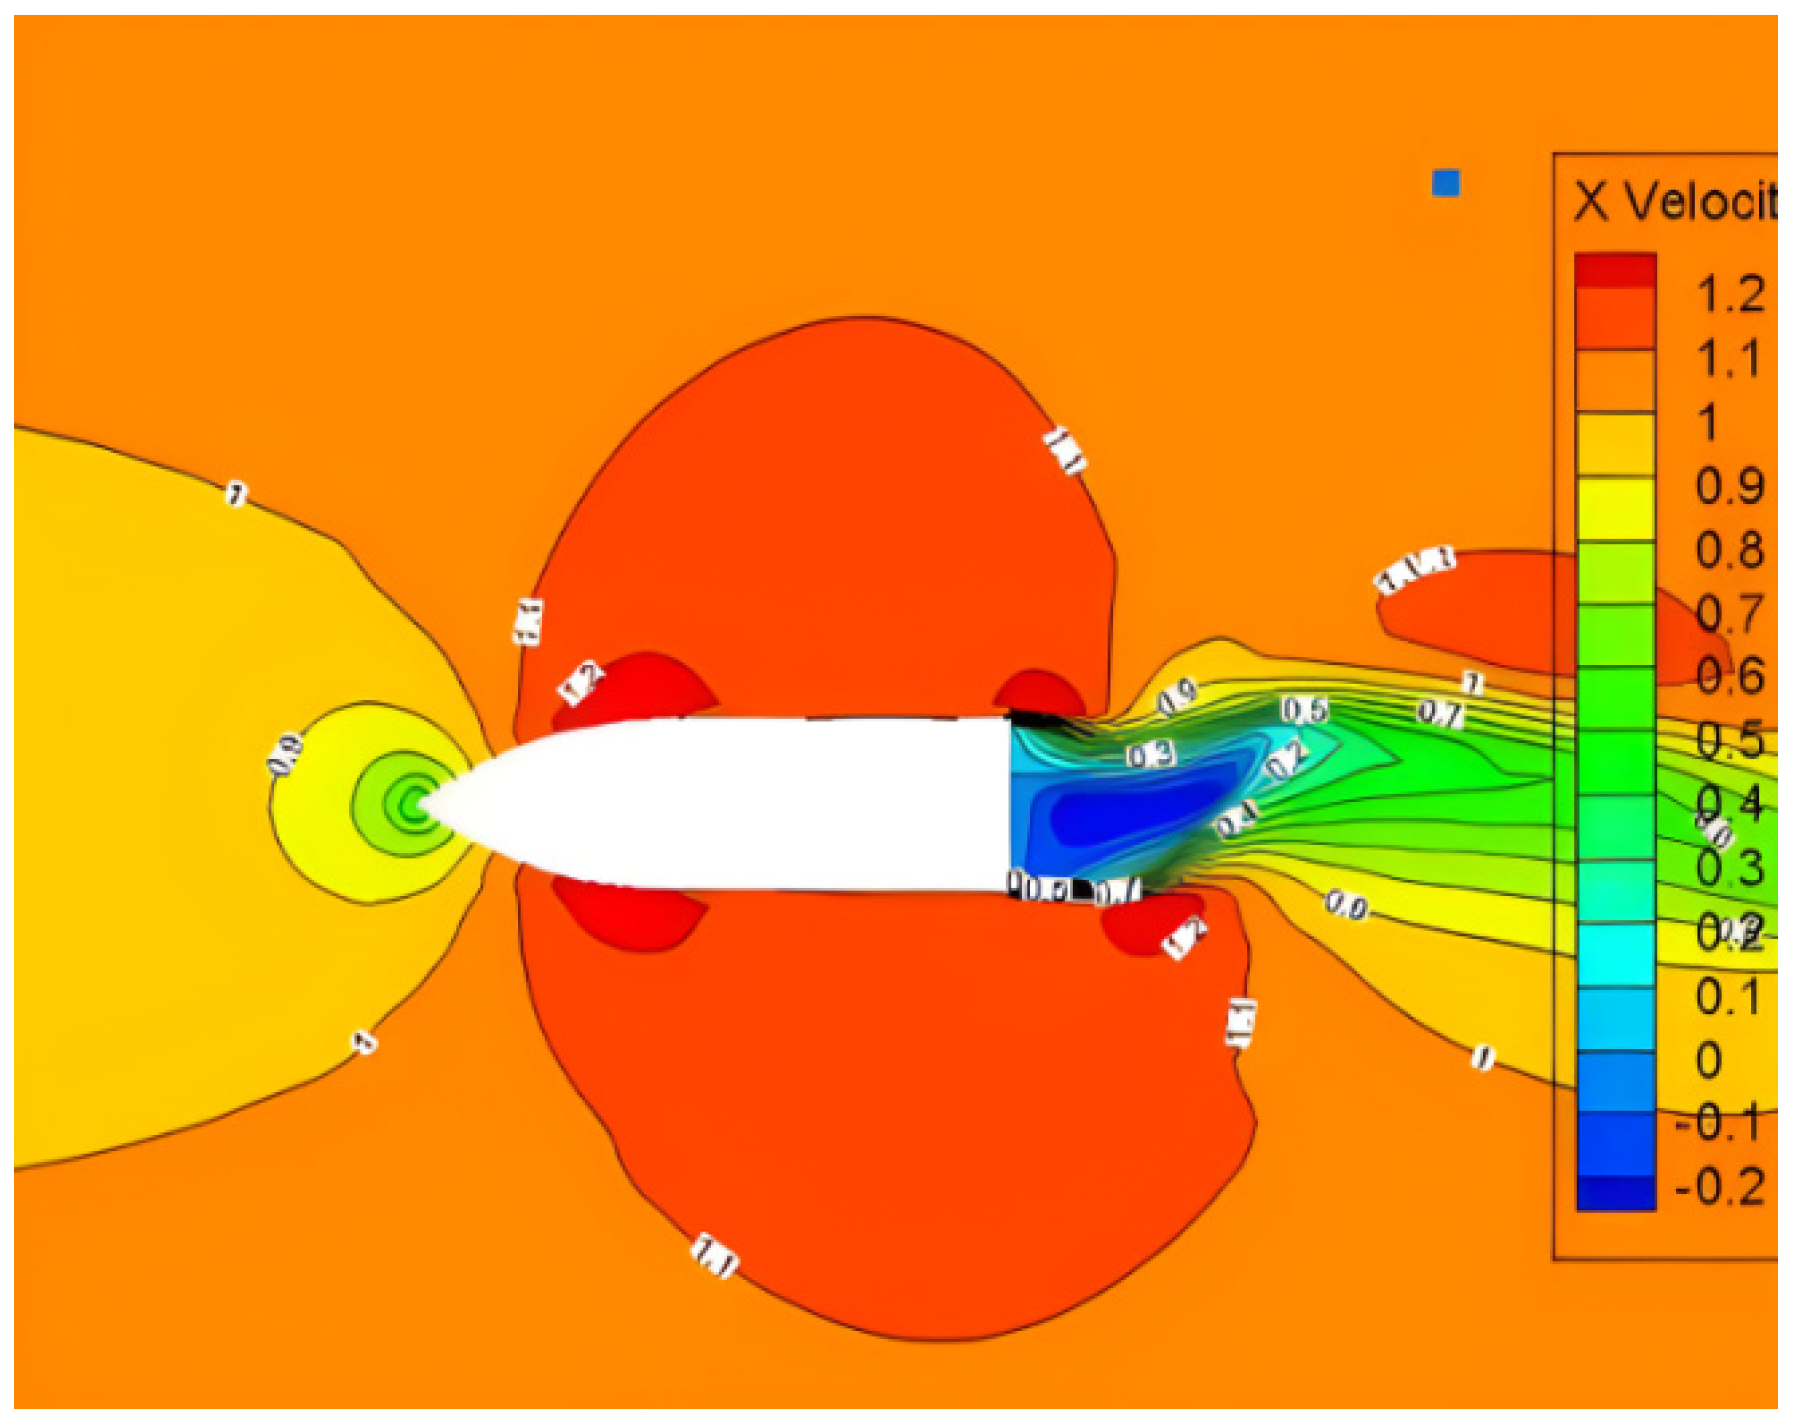
2.2. Design of a Floating Body with a Flow Velocity Increase
The floating body is the main frame of the deep-water cage and the carrier of the power generation device. Based on the ship design theory and the role of the deflector hood in increasing the flow velocity, this study uses the ship shape as a template to design the shape of the floating body and sets the arc shape on the two side walls of the end of the floating body. By directing the water flow to both sides of the floating body, the flow rate of the water turbine on both sides of the floating body can be increased, and the flow rate of the cage culture area in the middle of the floating body can be reduced. The Ansys simulation software is used to simulate the flow of the floating body. The velocity is set to 1 m/s, and the contour map of the velocity flow field around the floating body is obtained. The values of the contour plot are displayed in the form of a scalar plot, as shown in Figure 3. It can be observed in the figure that the water velocity on both sides of the floating body is increased by at least 10%, and the diversion effect is remarkable.
Figure 3.
Flow simulation diagram of the floating body.
2.3. Design of Mooring System
The tide does not always flow in the same direction, especially when the tide rises and falls. Therefore, in order to adapt to the changes in the direction of the current and adjust the position of the power generation device in time, the power flow in all directions can be converted into energy and make full use of the floating body by increasing the diversion rate. The automatic water system has become one of the important factors to improve power generation efficiency. In this regard, combined with the characteristics of the floating body of the ship type, the single-point anchoring method was adopted, such that the floating body can automatically meet the water according to the direction of the power flow. Thus, the impeller is always facing the tidal current, thus greatly reducing the cost of deep-sea mooring.
2.4. Comparison and Analysis of Energy Capture Mechanism
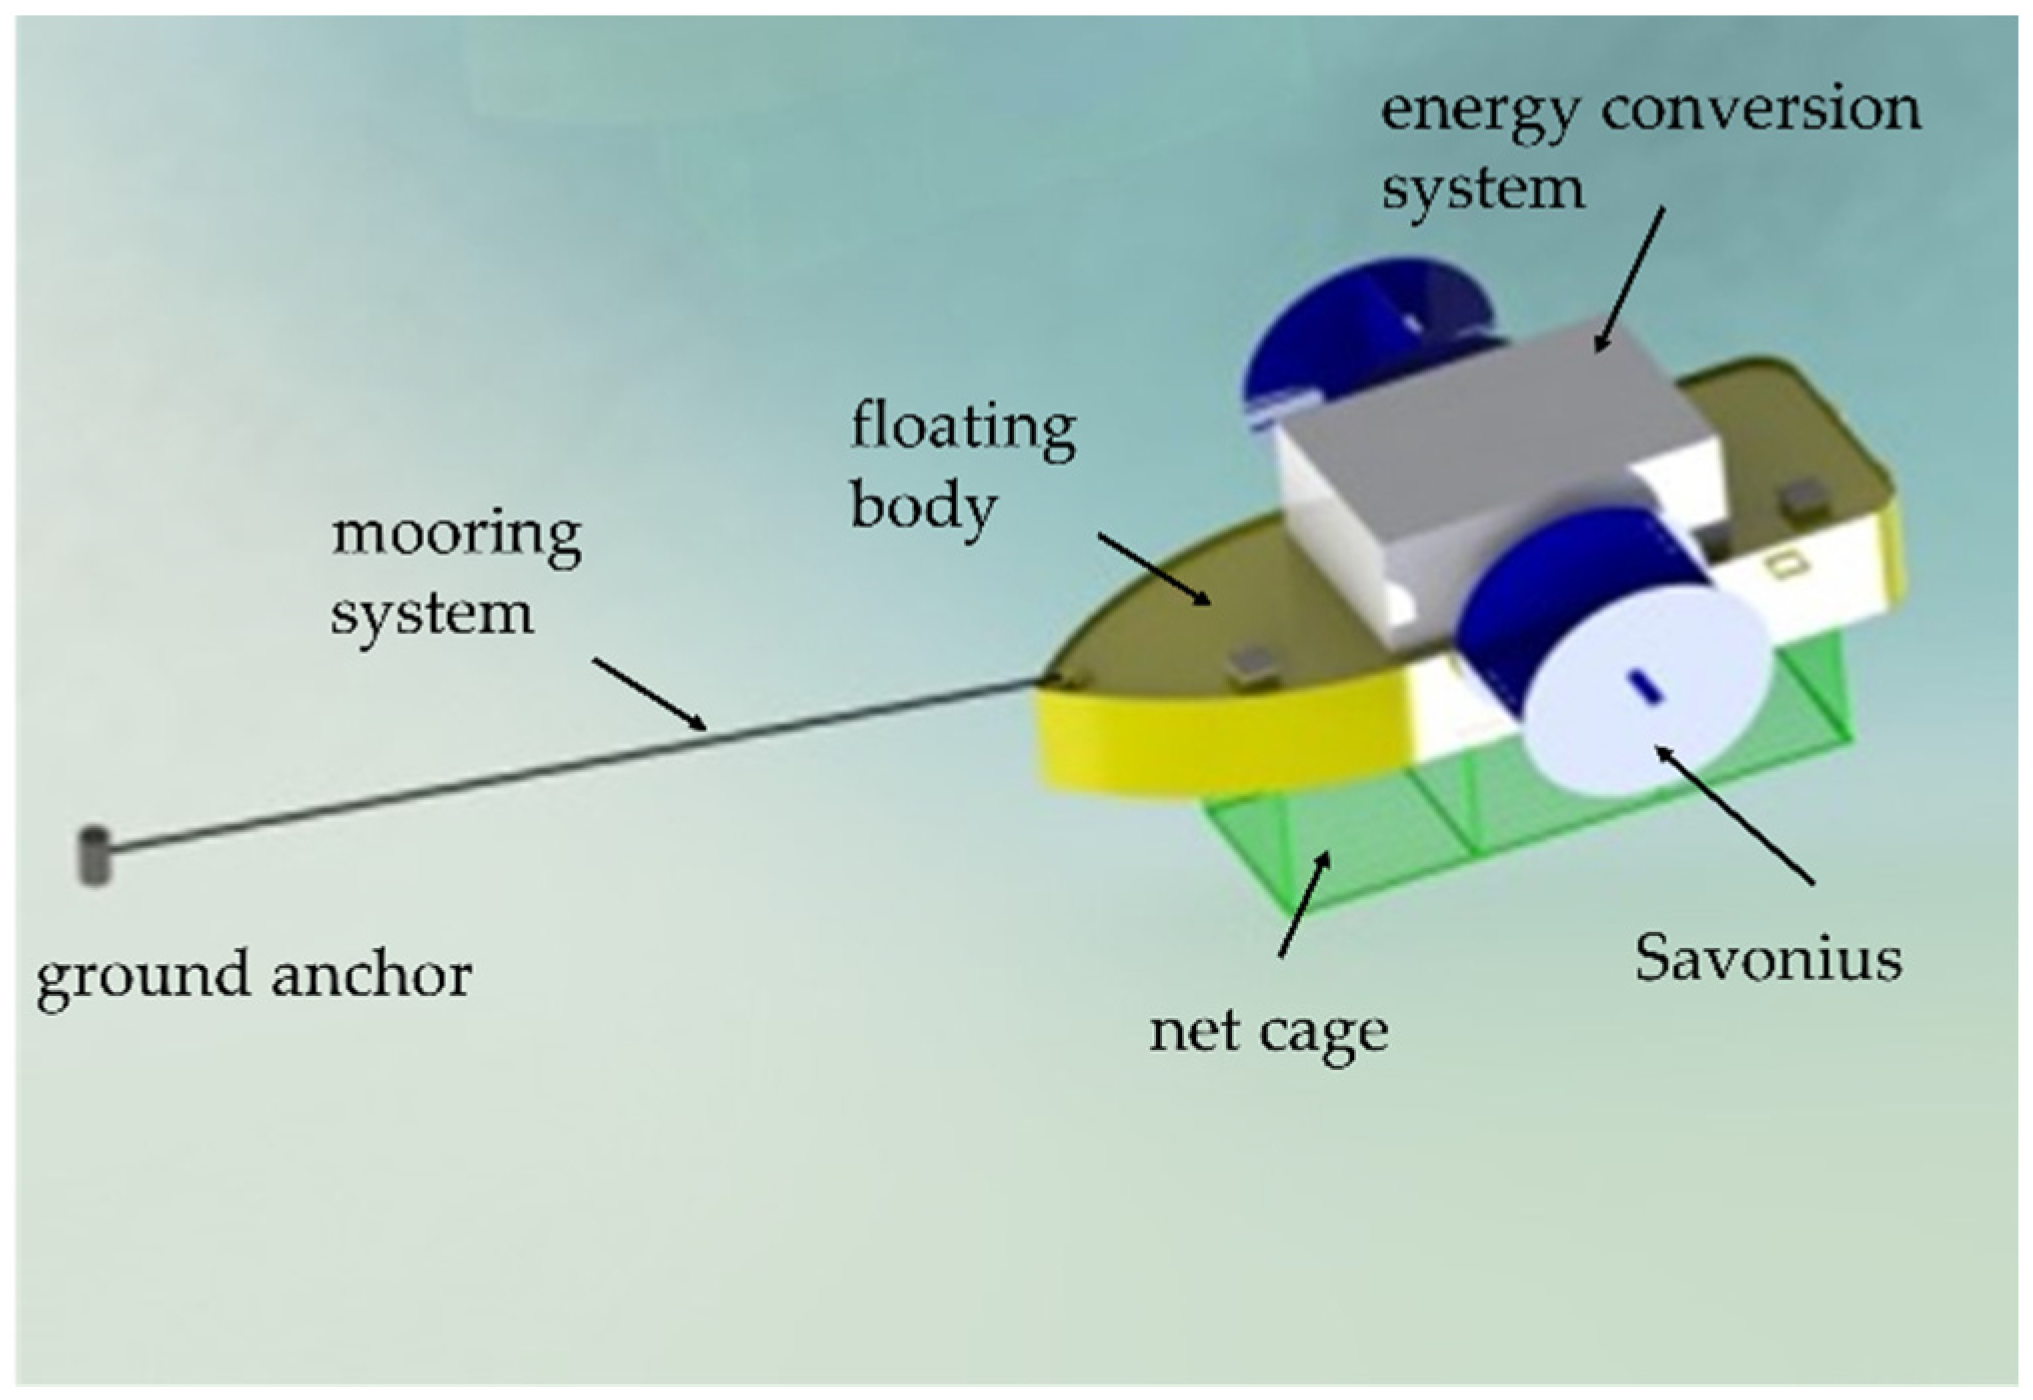
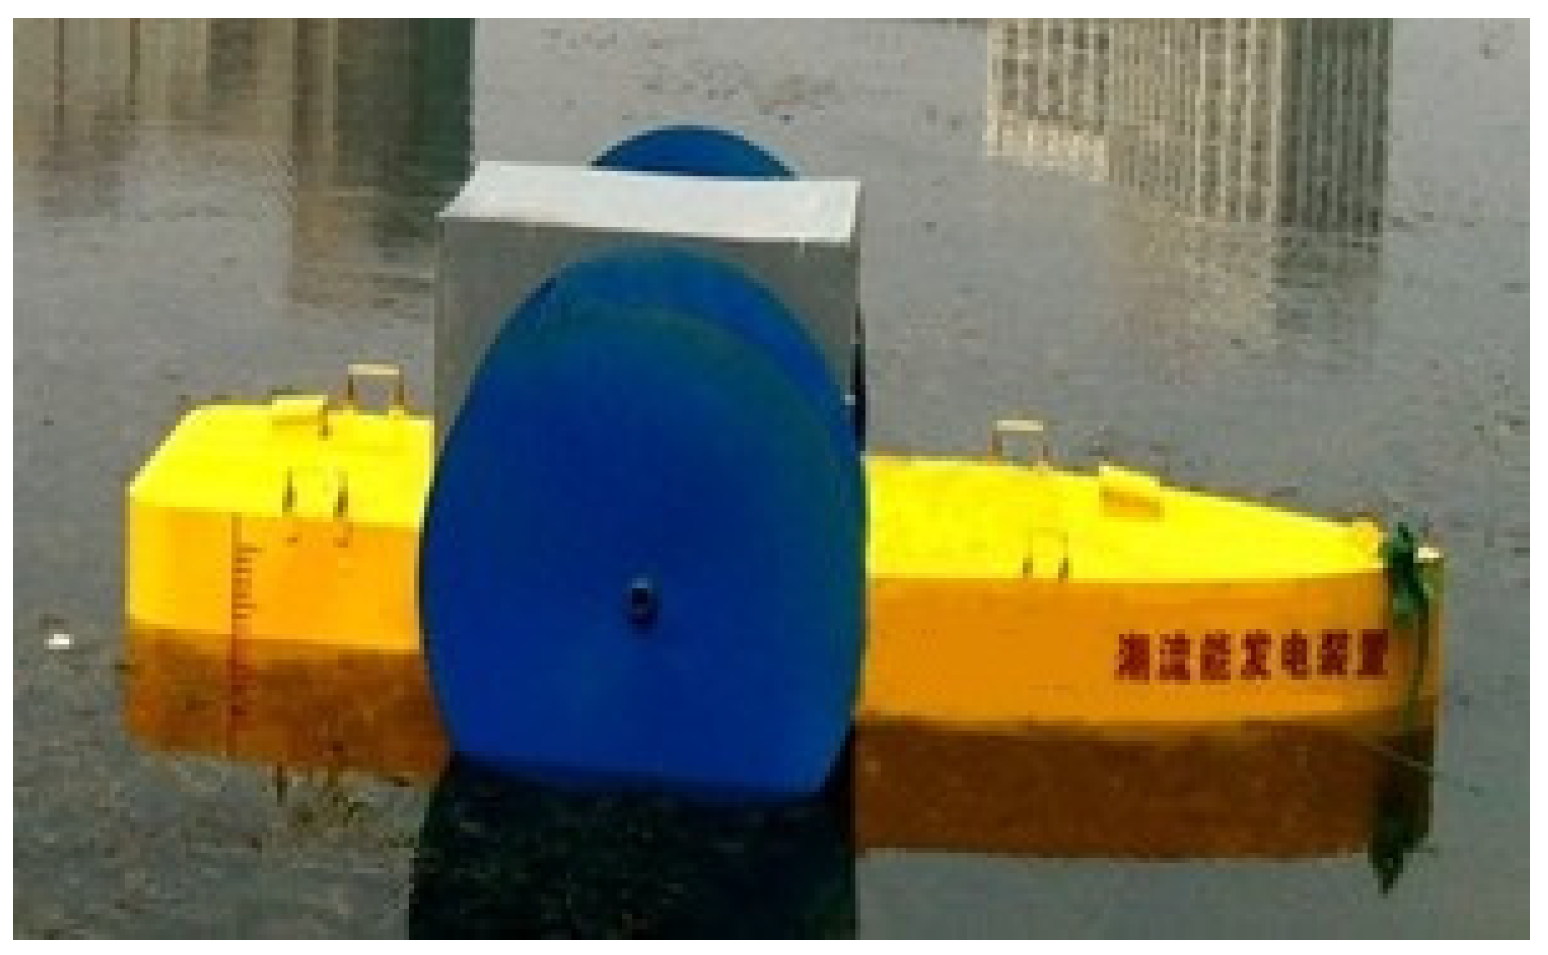
The structure form of the impeller is directly related to the power generation efficiency and hydrodynamic performance of the power generation device. The impeller of the tidal current power generation device is mainly divided into the horizontal-axis type and the vertical-axis type, as shown in Figure 4 and Figure 5.
Figure 4.
Horizontal shaft water turbine.
Figure 5.
Vertical shaft turbine.
The comparison of key points is shown in Table 1. Horizontal axis power flow energy harvesting devices, such as NACA airfoil, are lift-type blades, which are suitable for low flow rates according to the airfoil. Vertical axis tidal current power generation devices are mainly divided into H-type impellers (Darrieus lift-type) and S-type impellers (resistance-type Savonius turbine). The S-type turbine can begin to output power at a very low flow rate and can continue to output at a large flow rate. The flow rate has a wide range of utilization, simple structure, and convenient manufacturing and maintenance, but low efficiency. The H-type turbine cannot be started at low flow rates, or the start-up requirements are difficult, resulting in a decrease in overall efficiency.
Table 1.
Comparison of key points of energy harvesting mechanisms.
2.5. Overall Scheme
Based on the above design and selection of a floating body, anchoring system, and energy capture mechanism, a preliminary model was obtained, as shown in Figure 6. On the ship-type floating body, the S-type water turbine is installed on both sides, and the position of the whole energy harvesting device from the water surface is controlled by the lifting of the ship-type sealing floating body. The energy capture device is fixed on the bottom by a single-point mooring method. Hydrodynamic parameters of the model are shown in Table 2.
Figure 6.
A lifting-type tidal energy capture device.
Table 2.
Hydrodynamic parameters of the model.
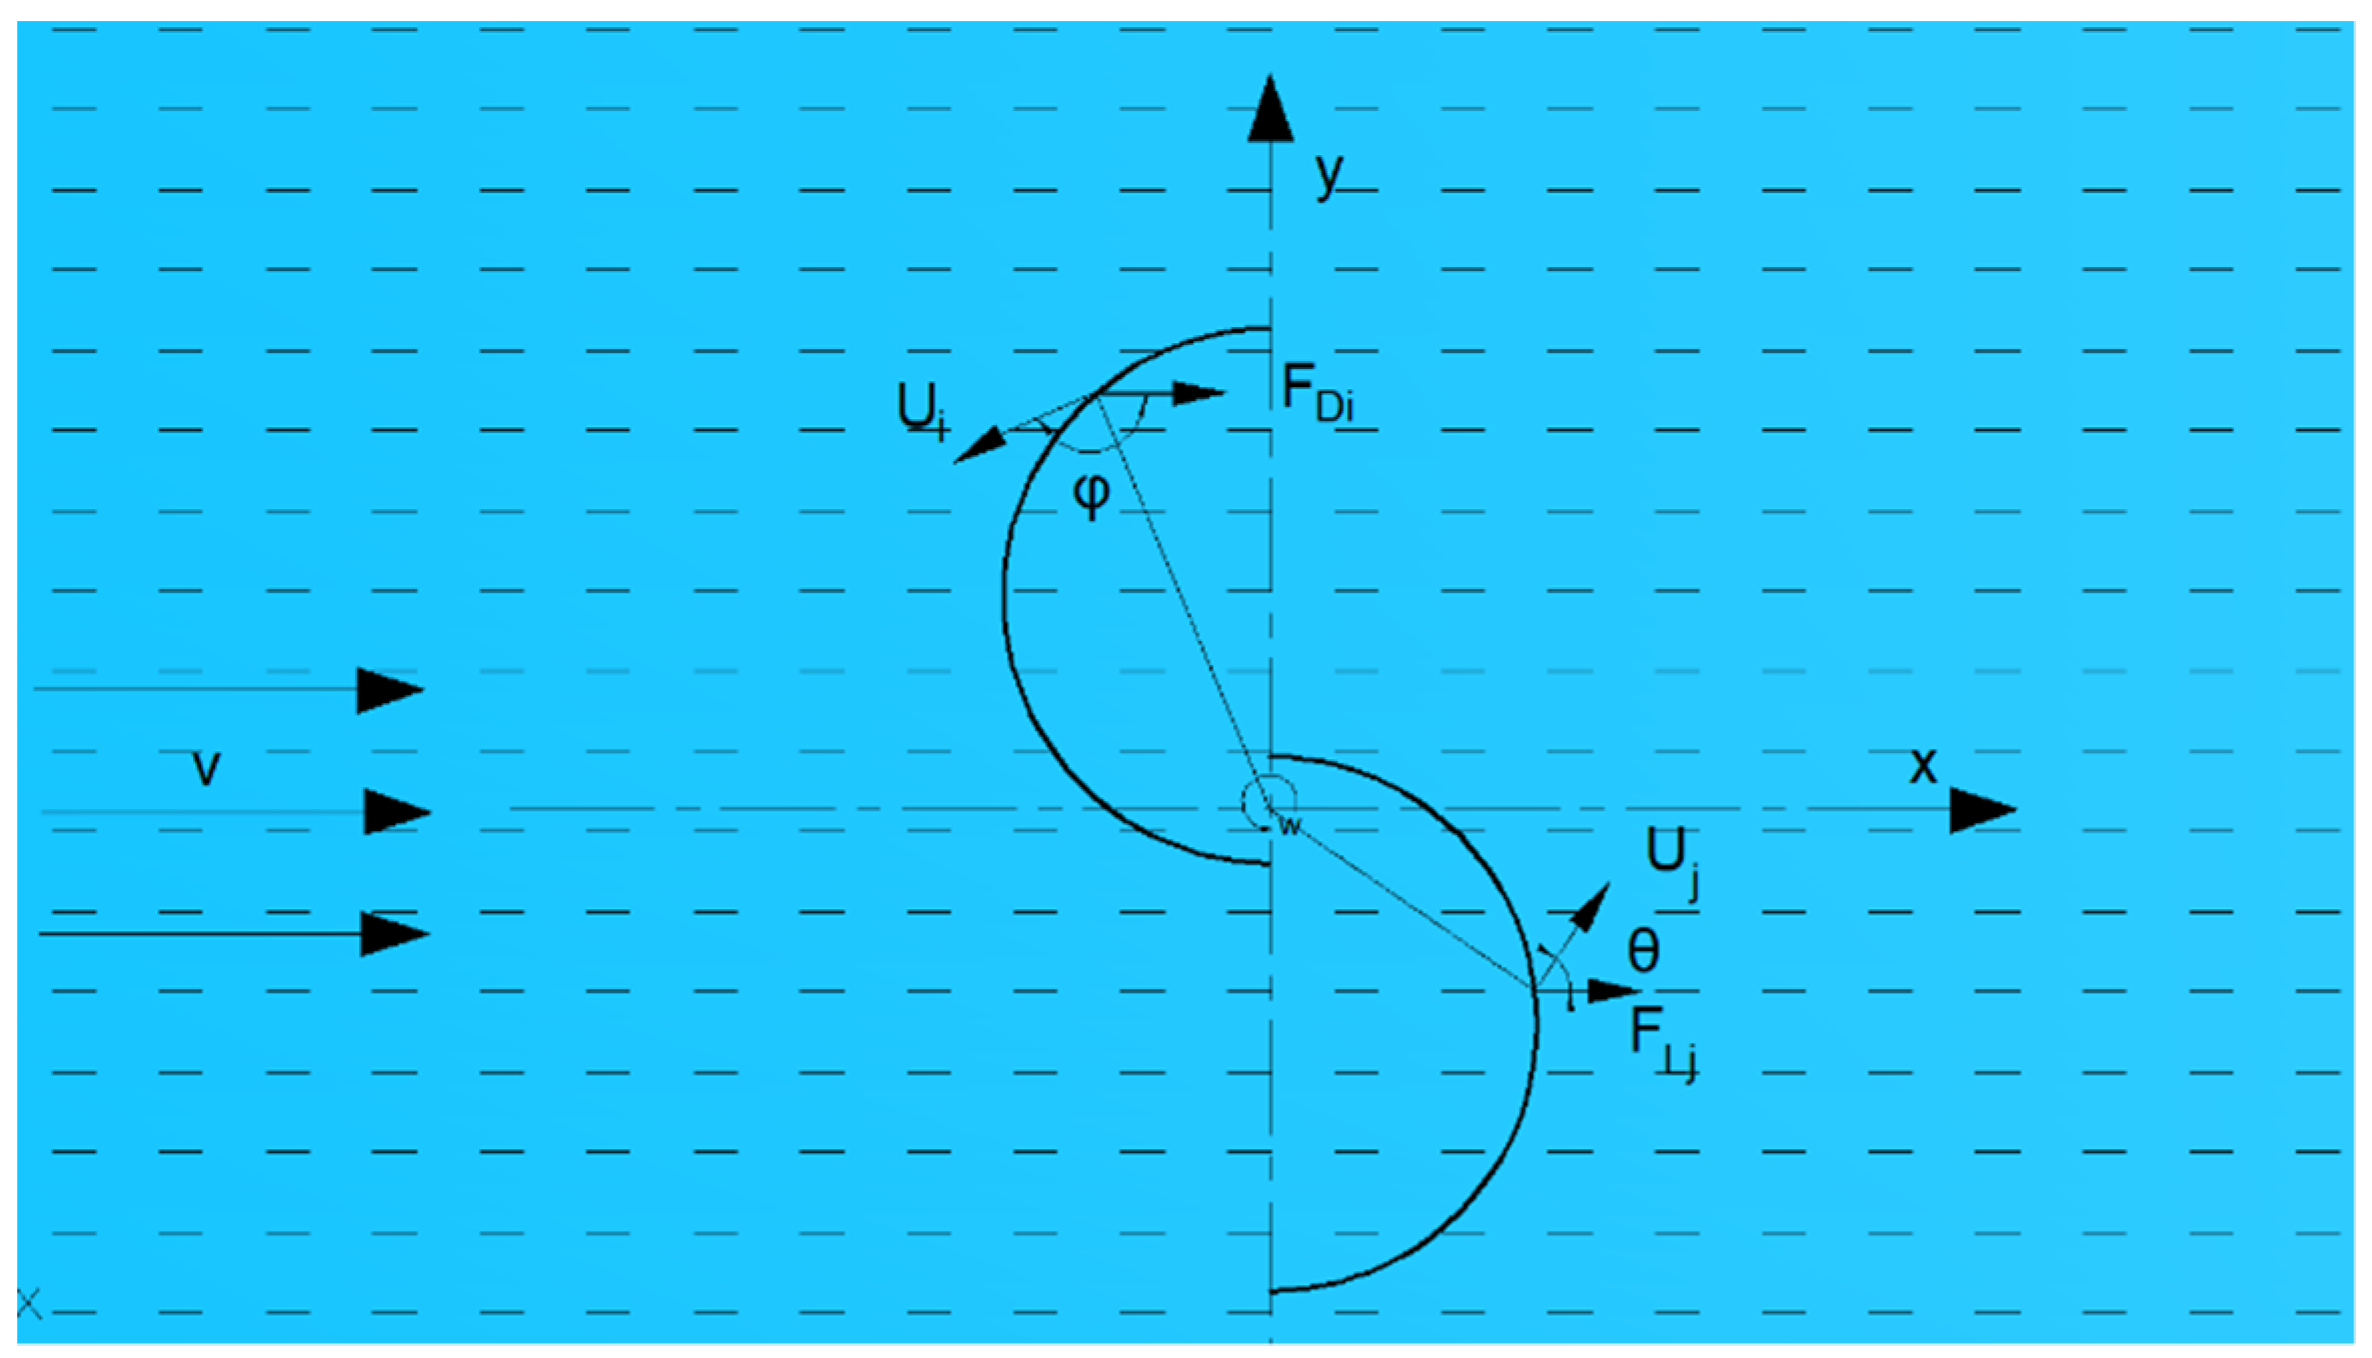
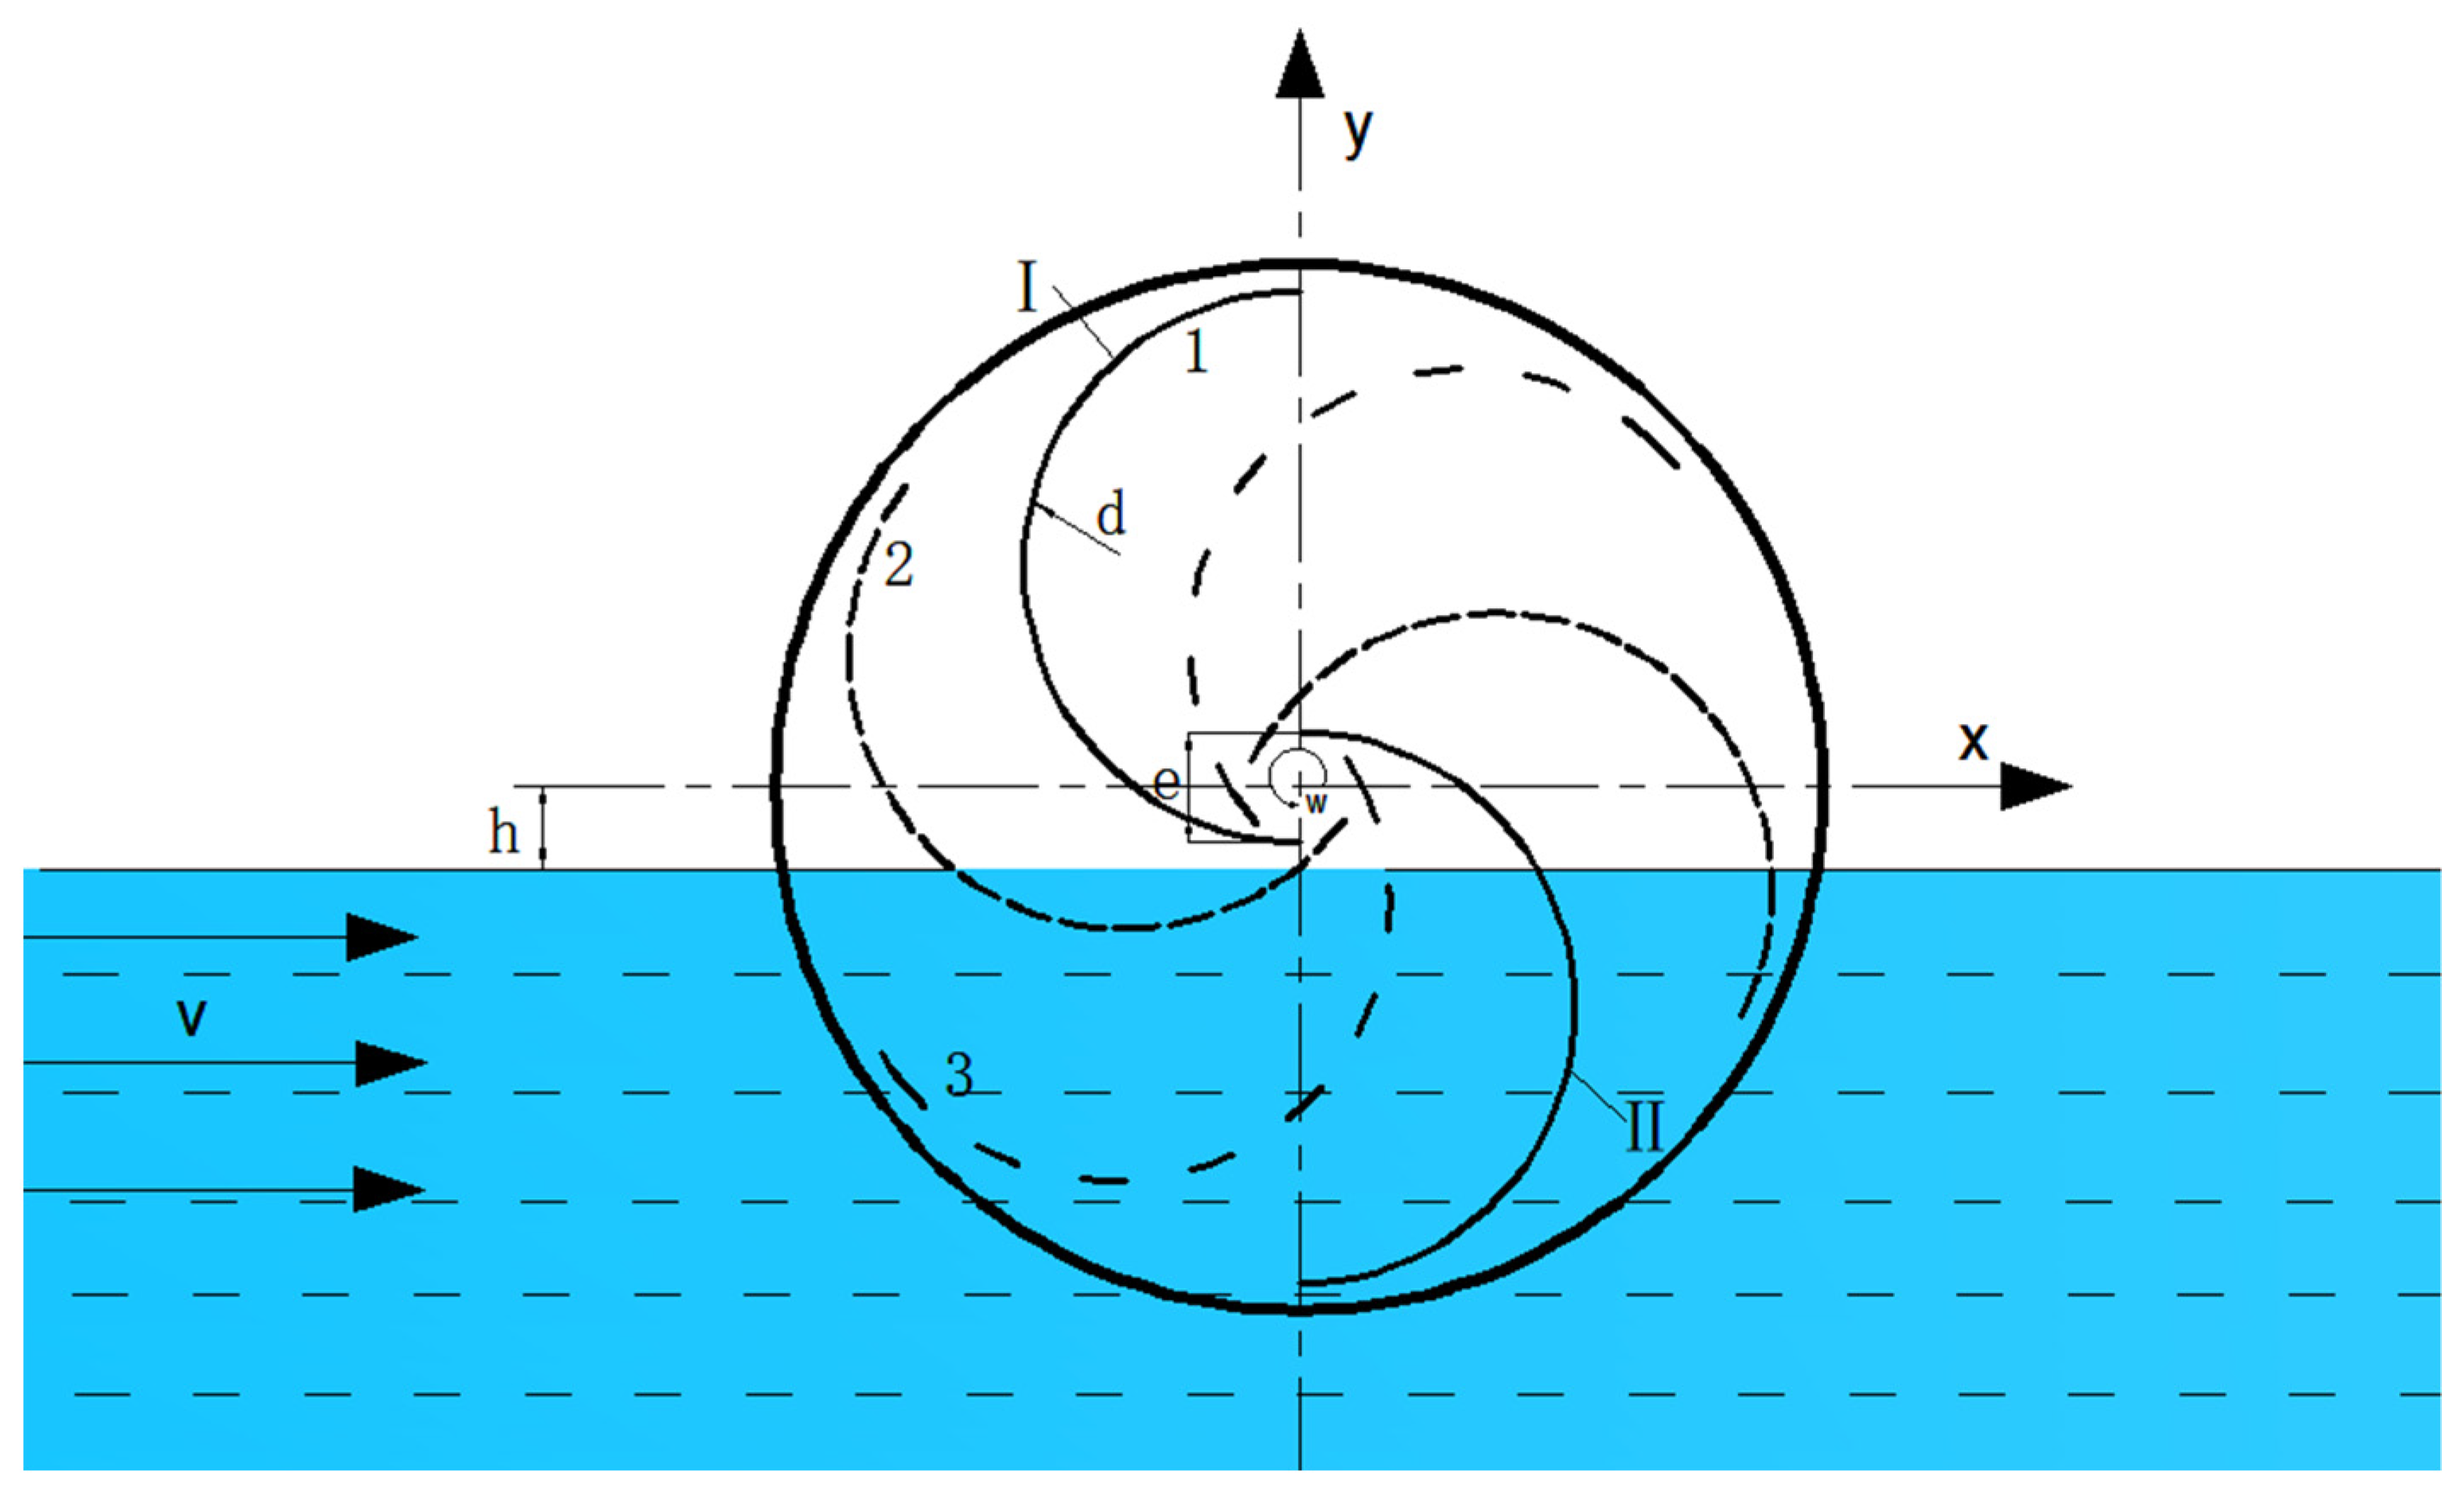
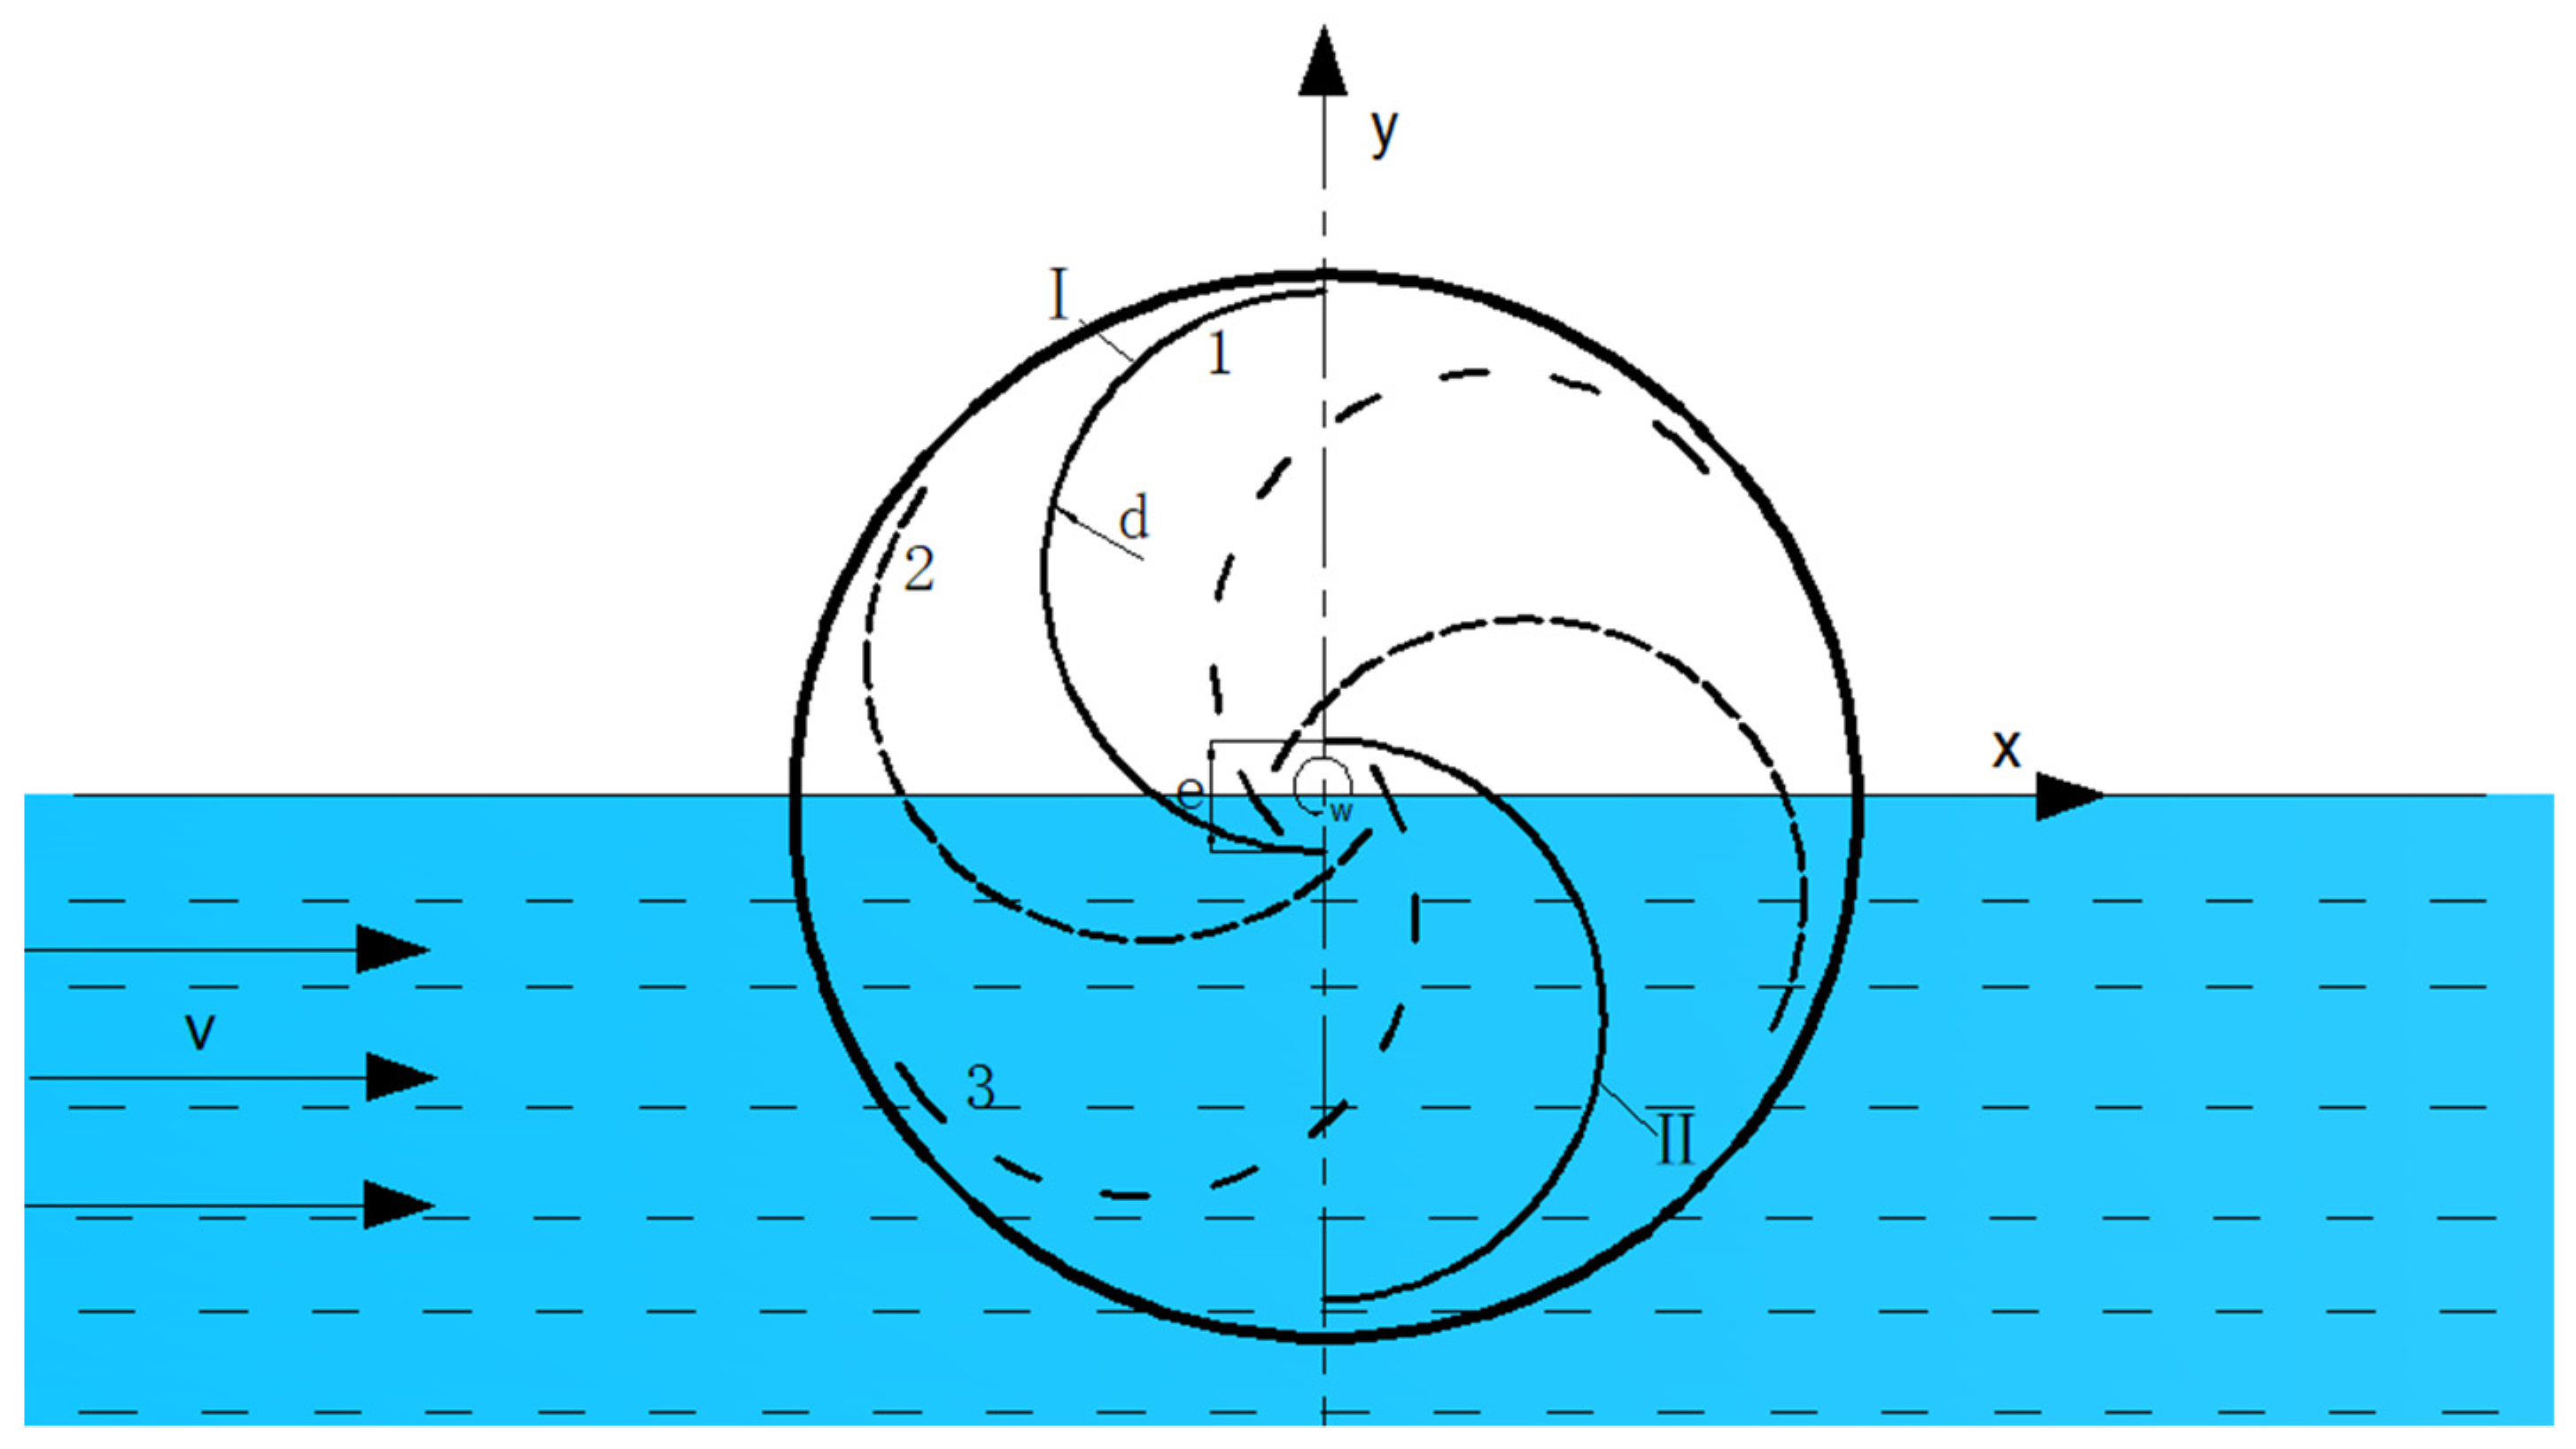
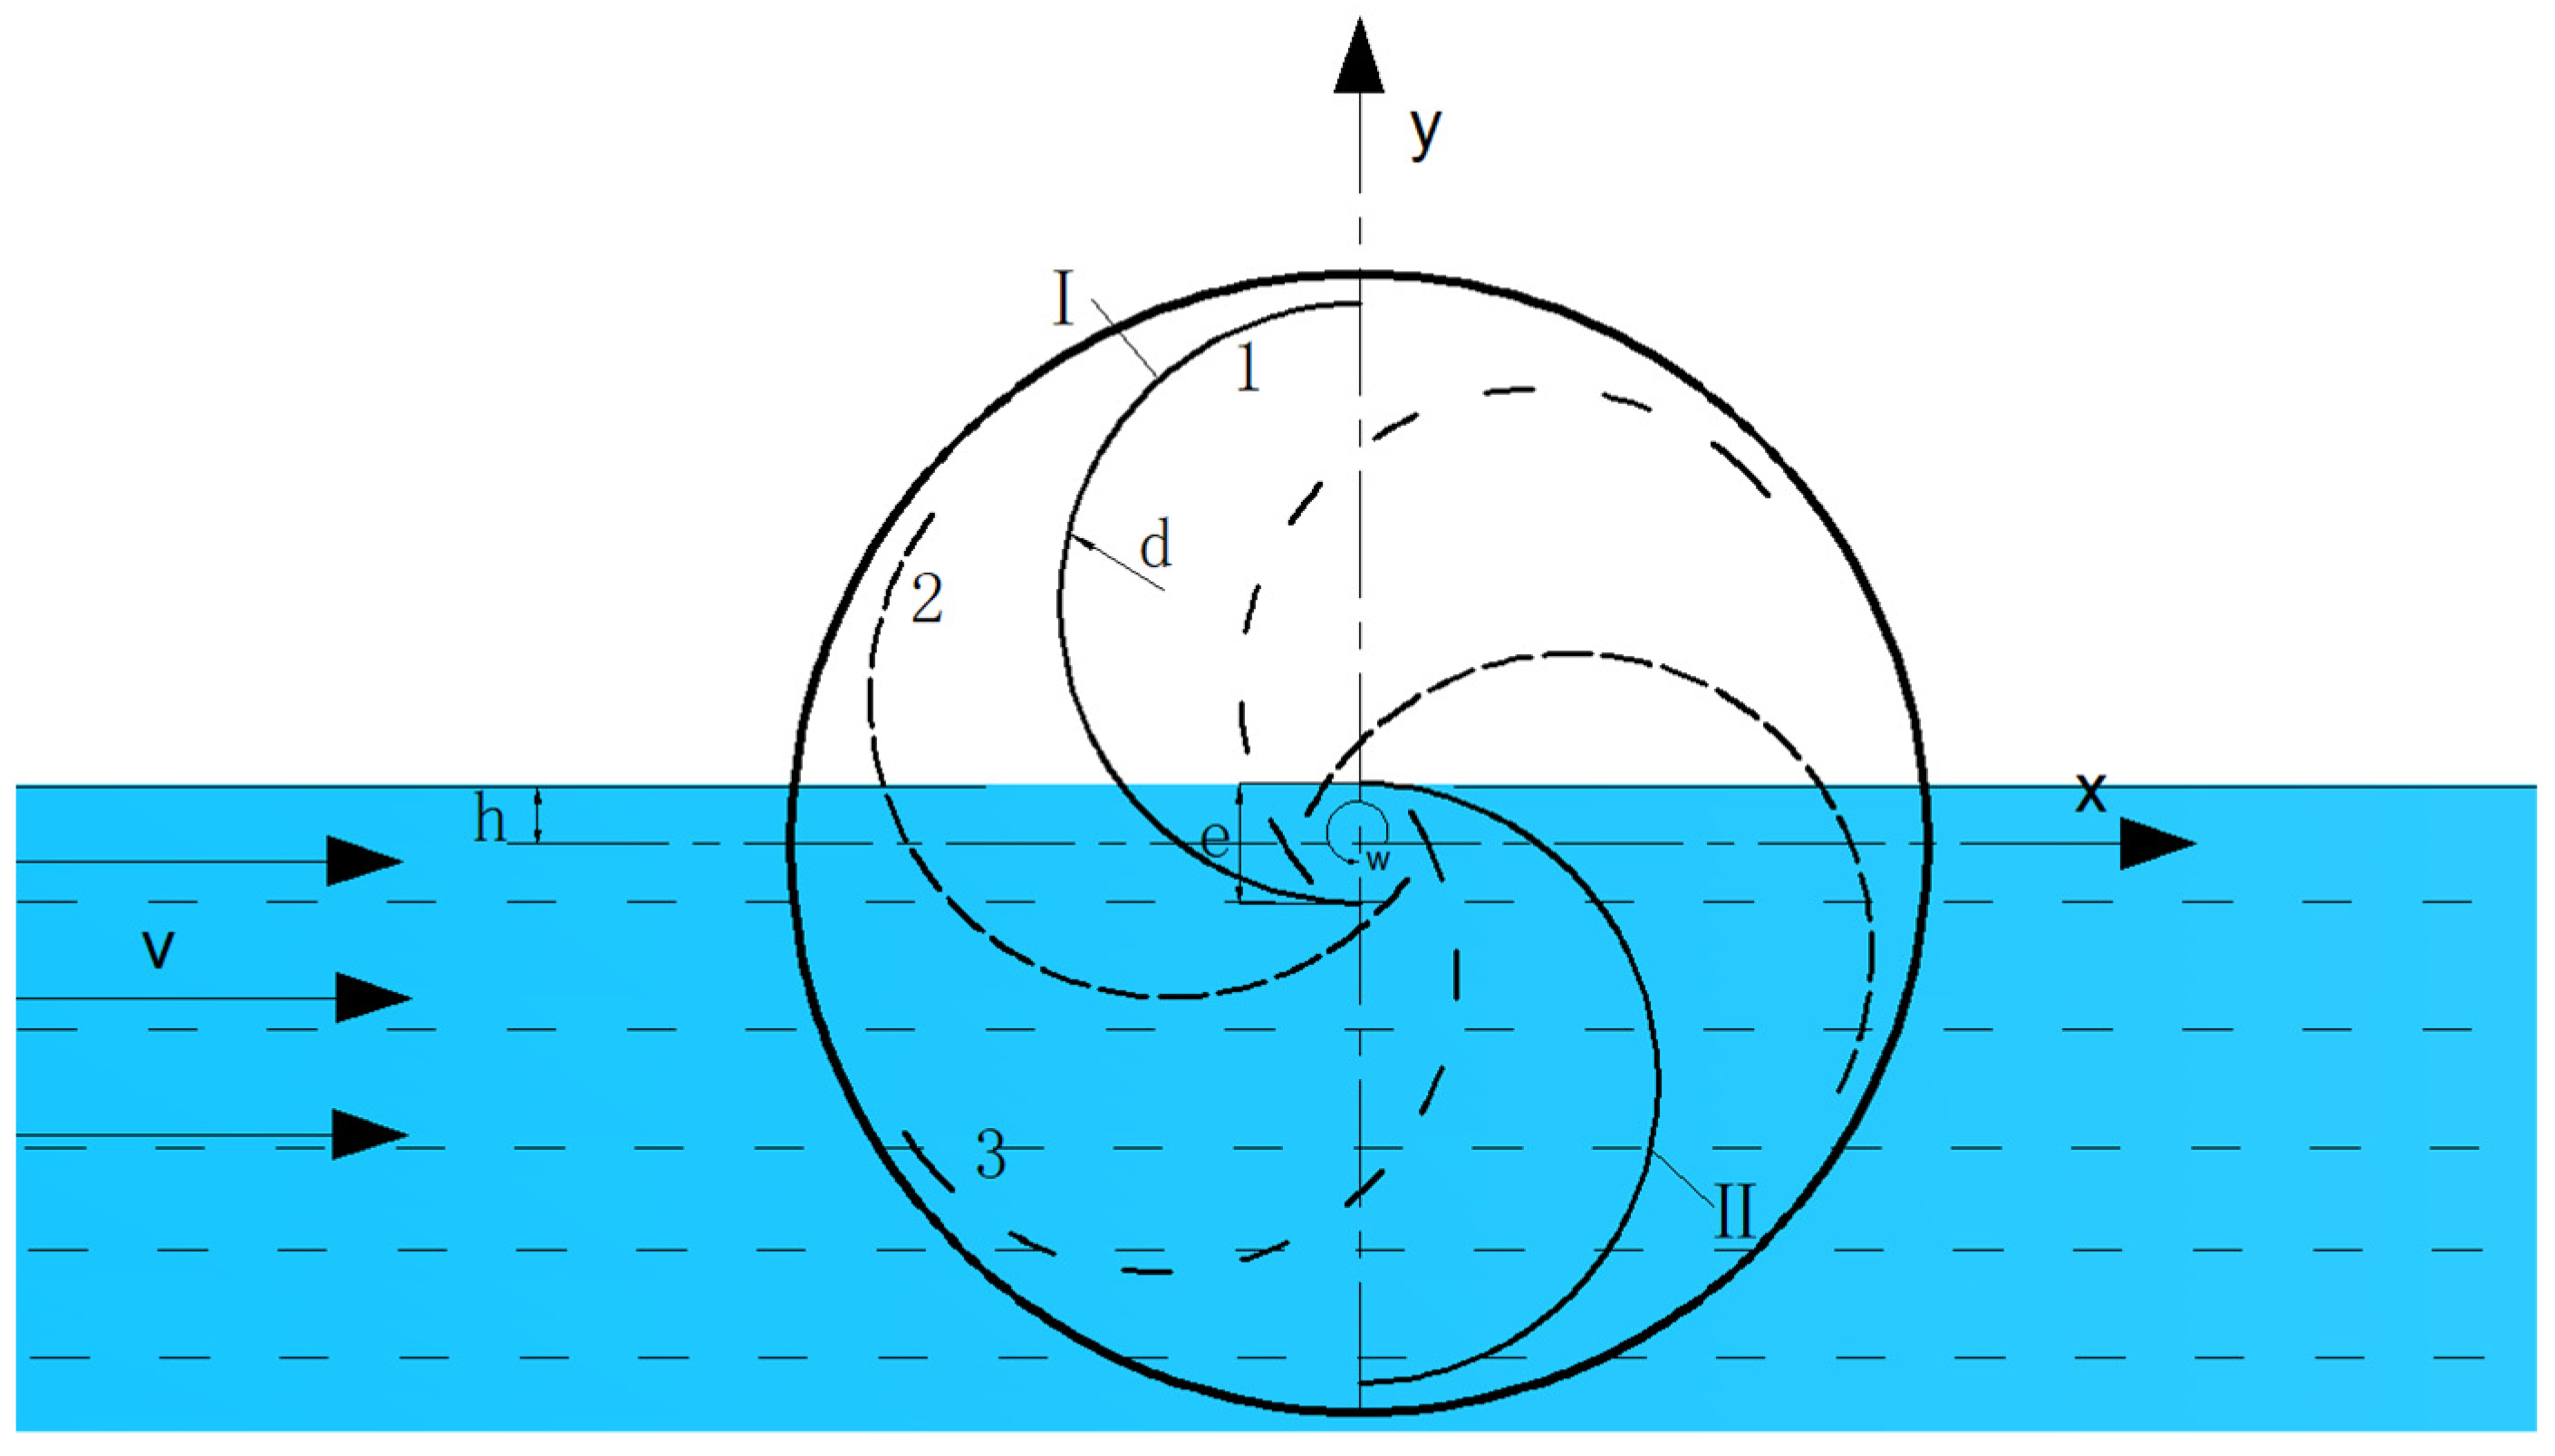
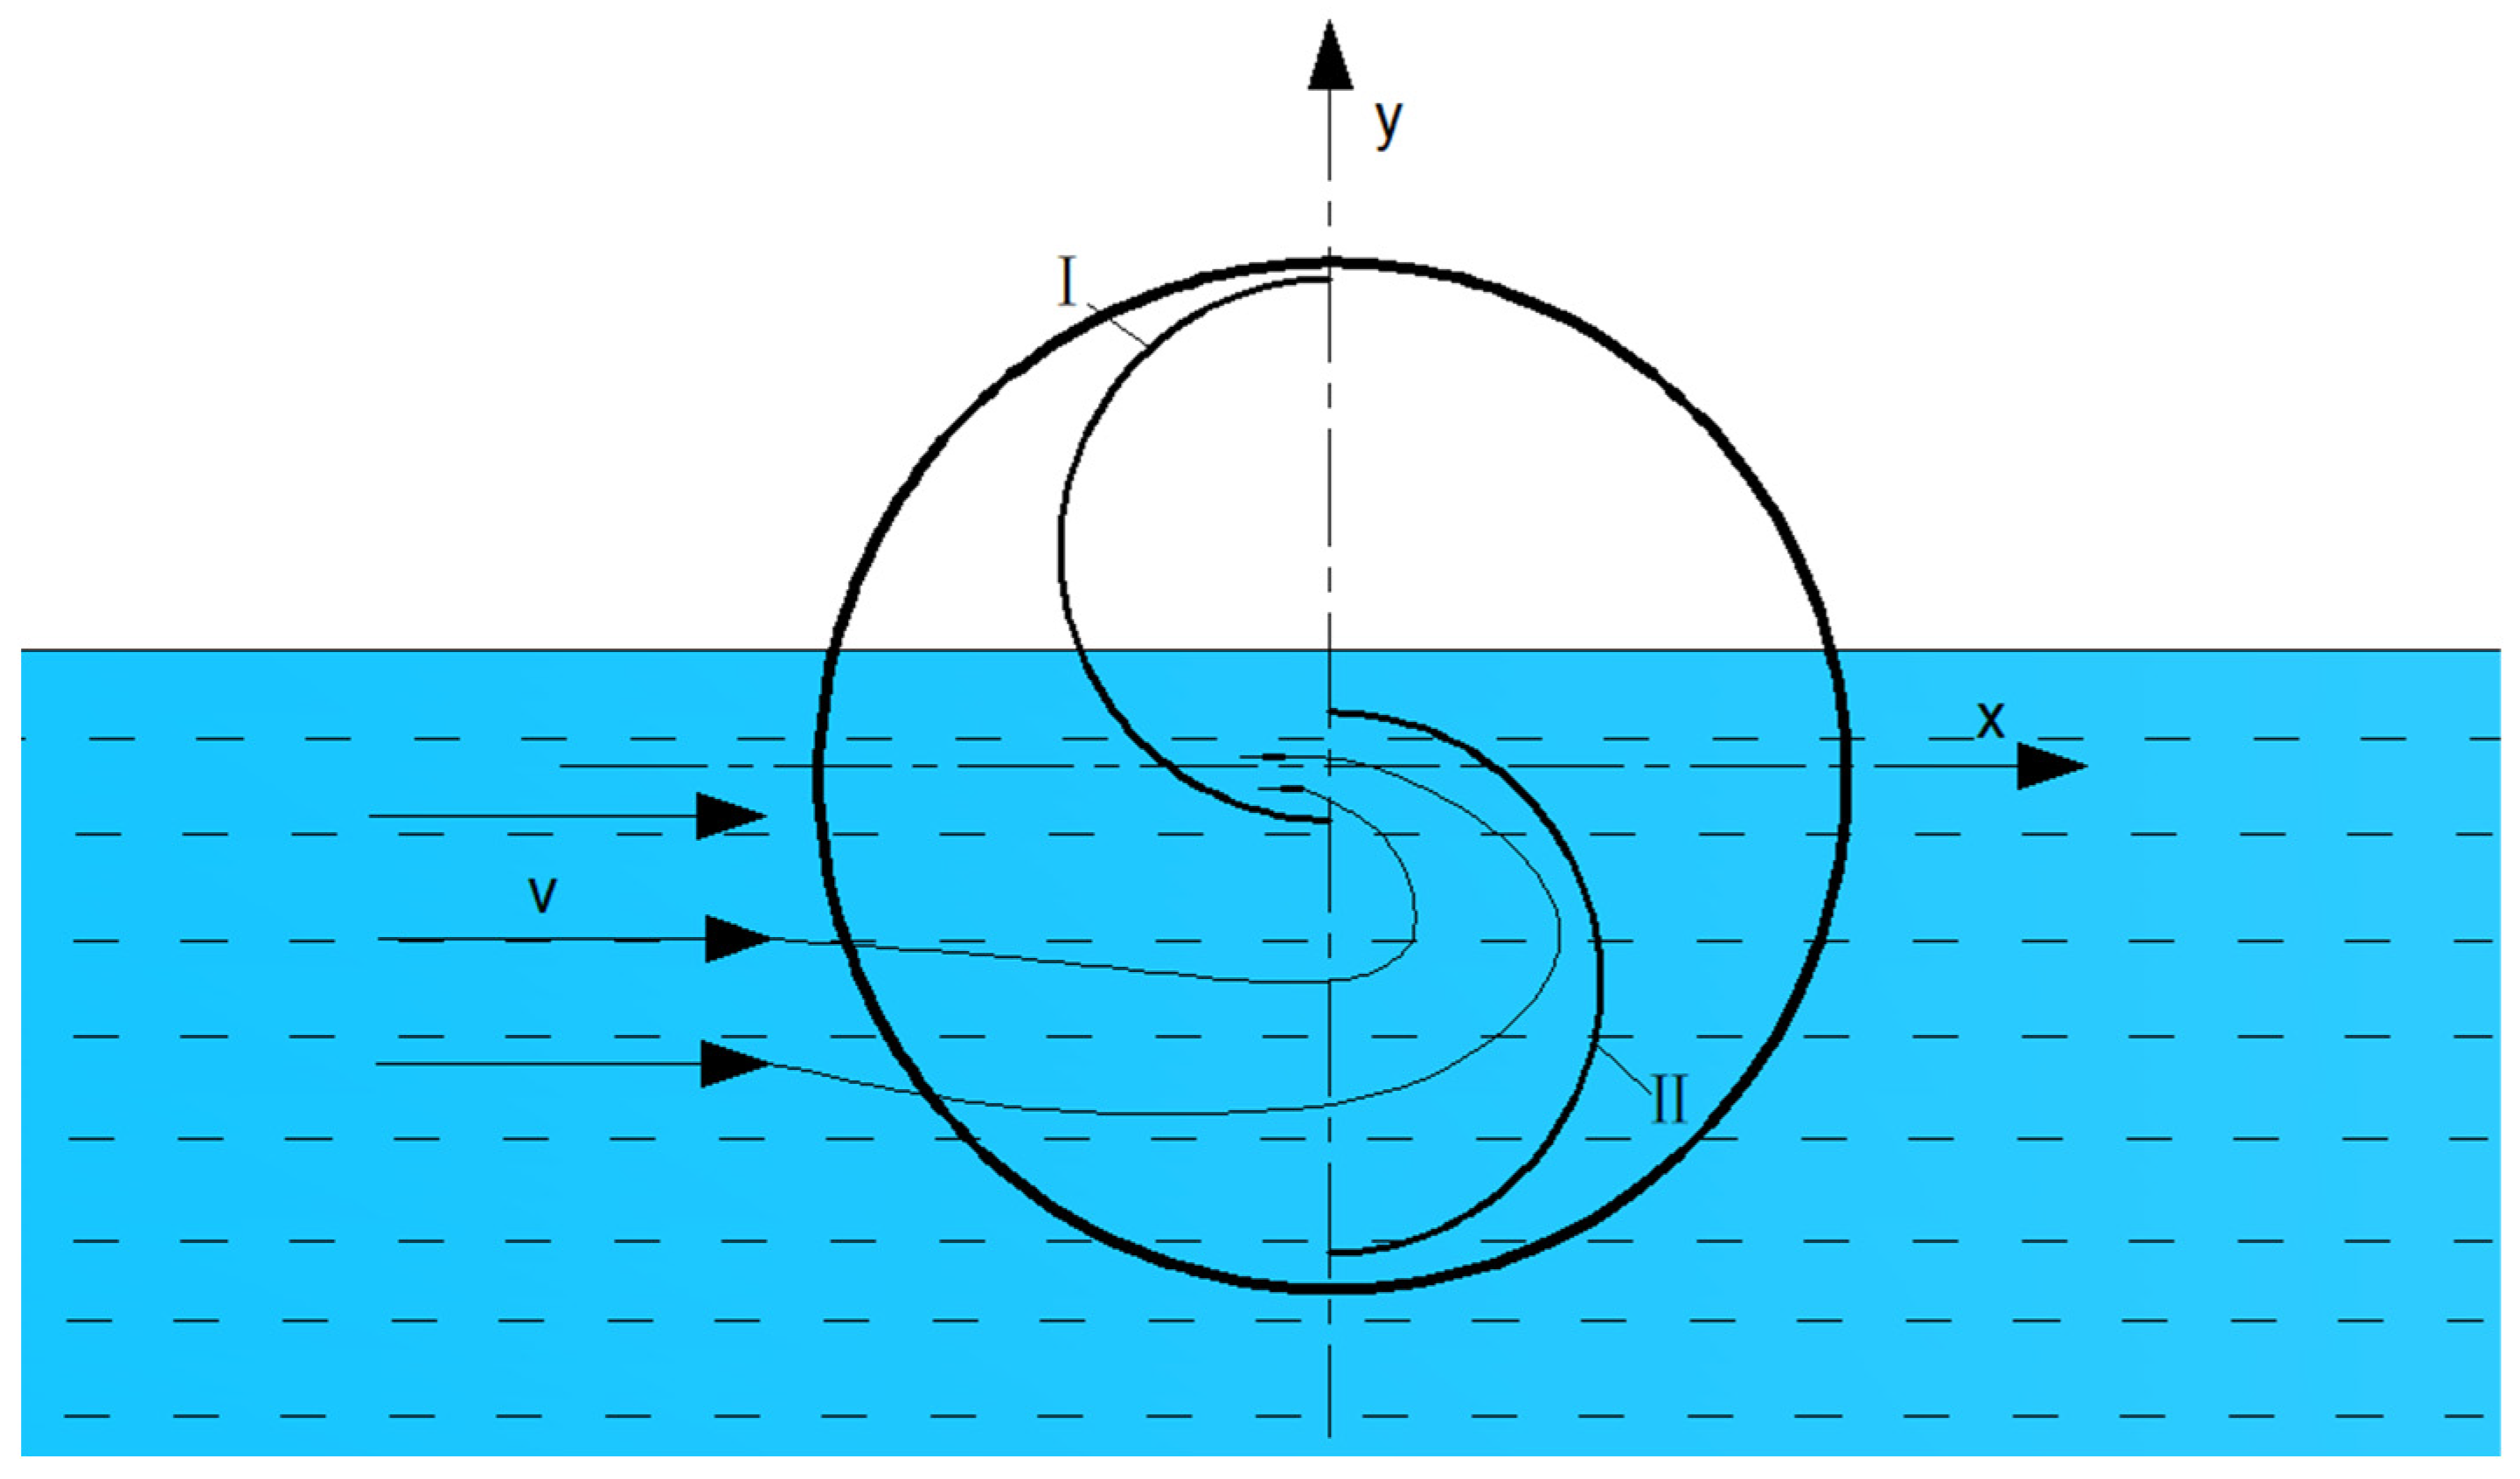
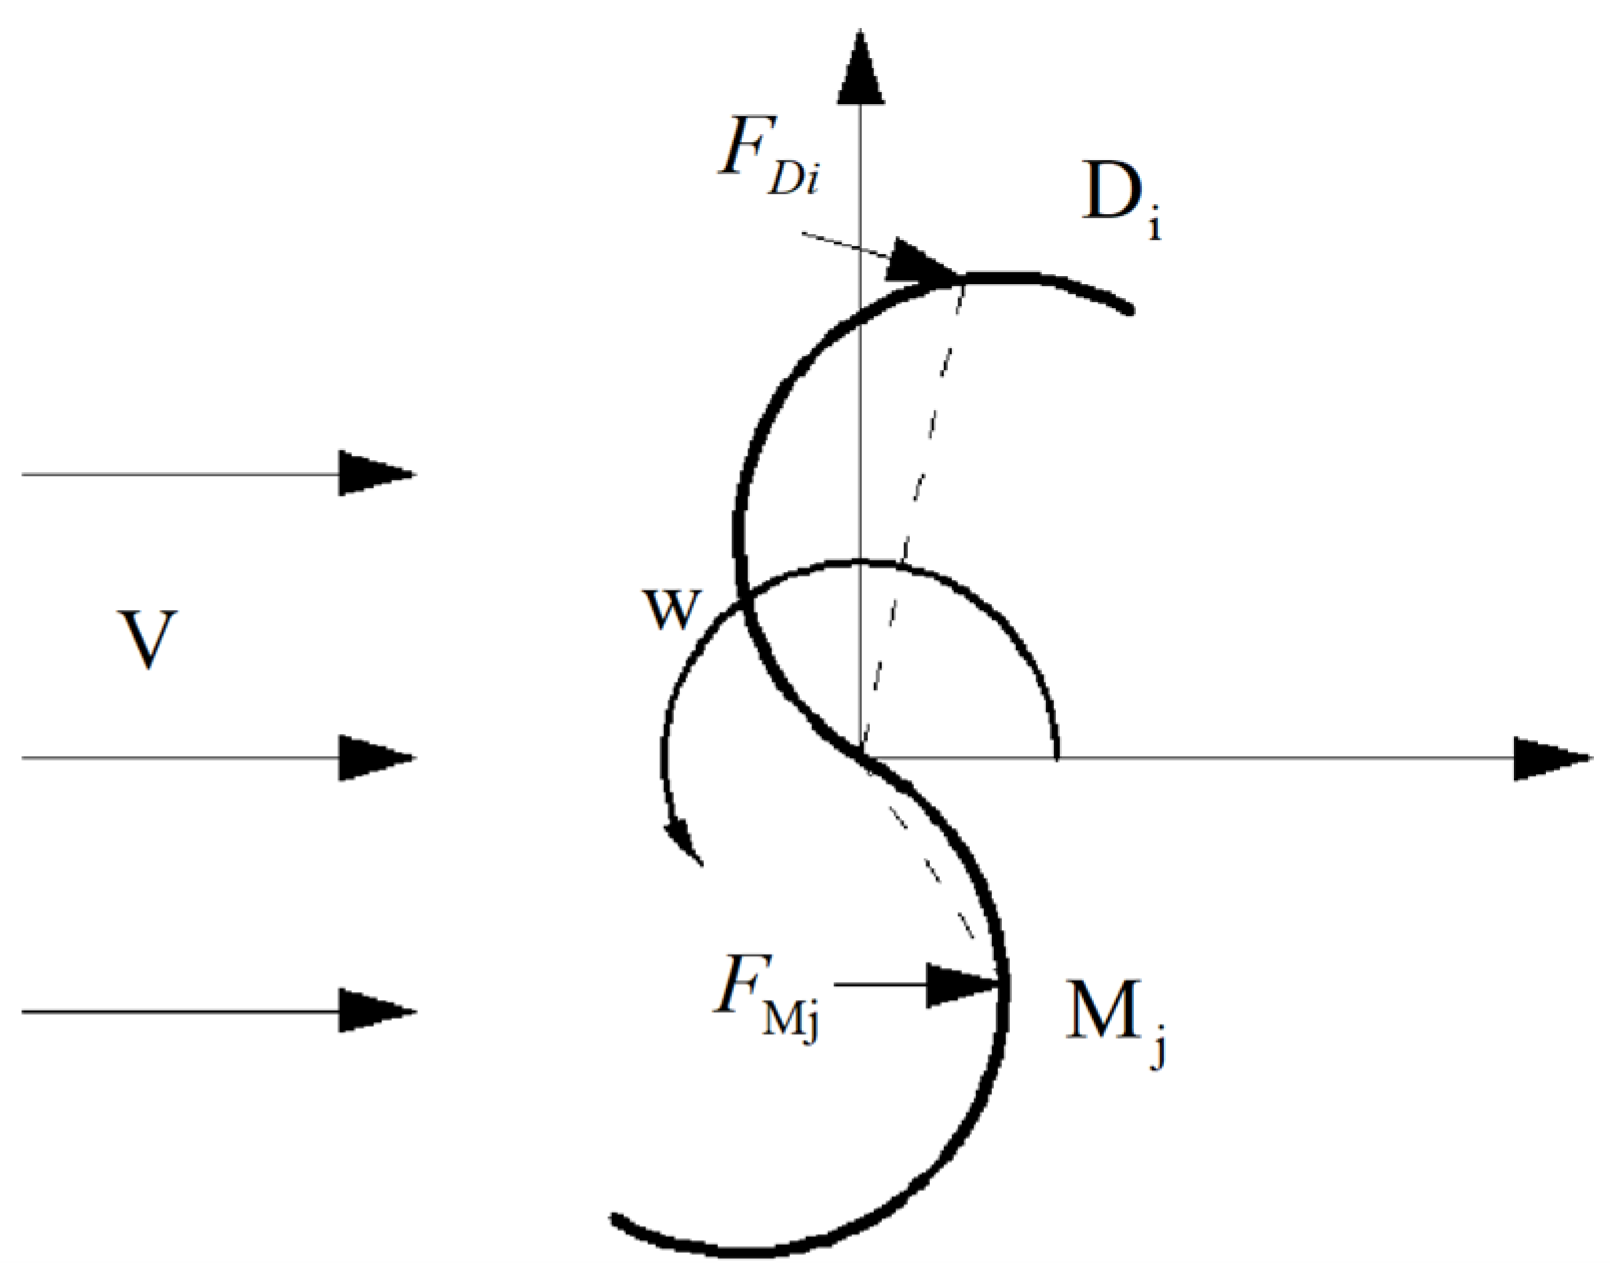
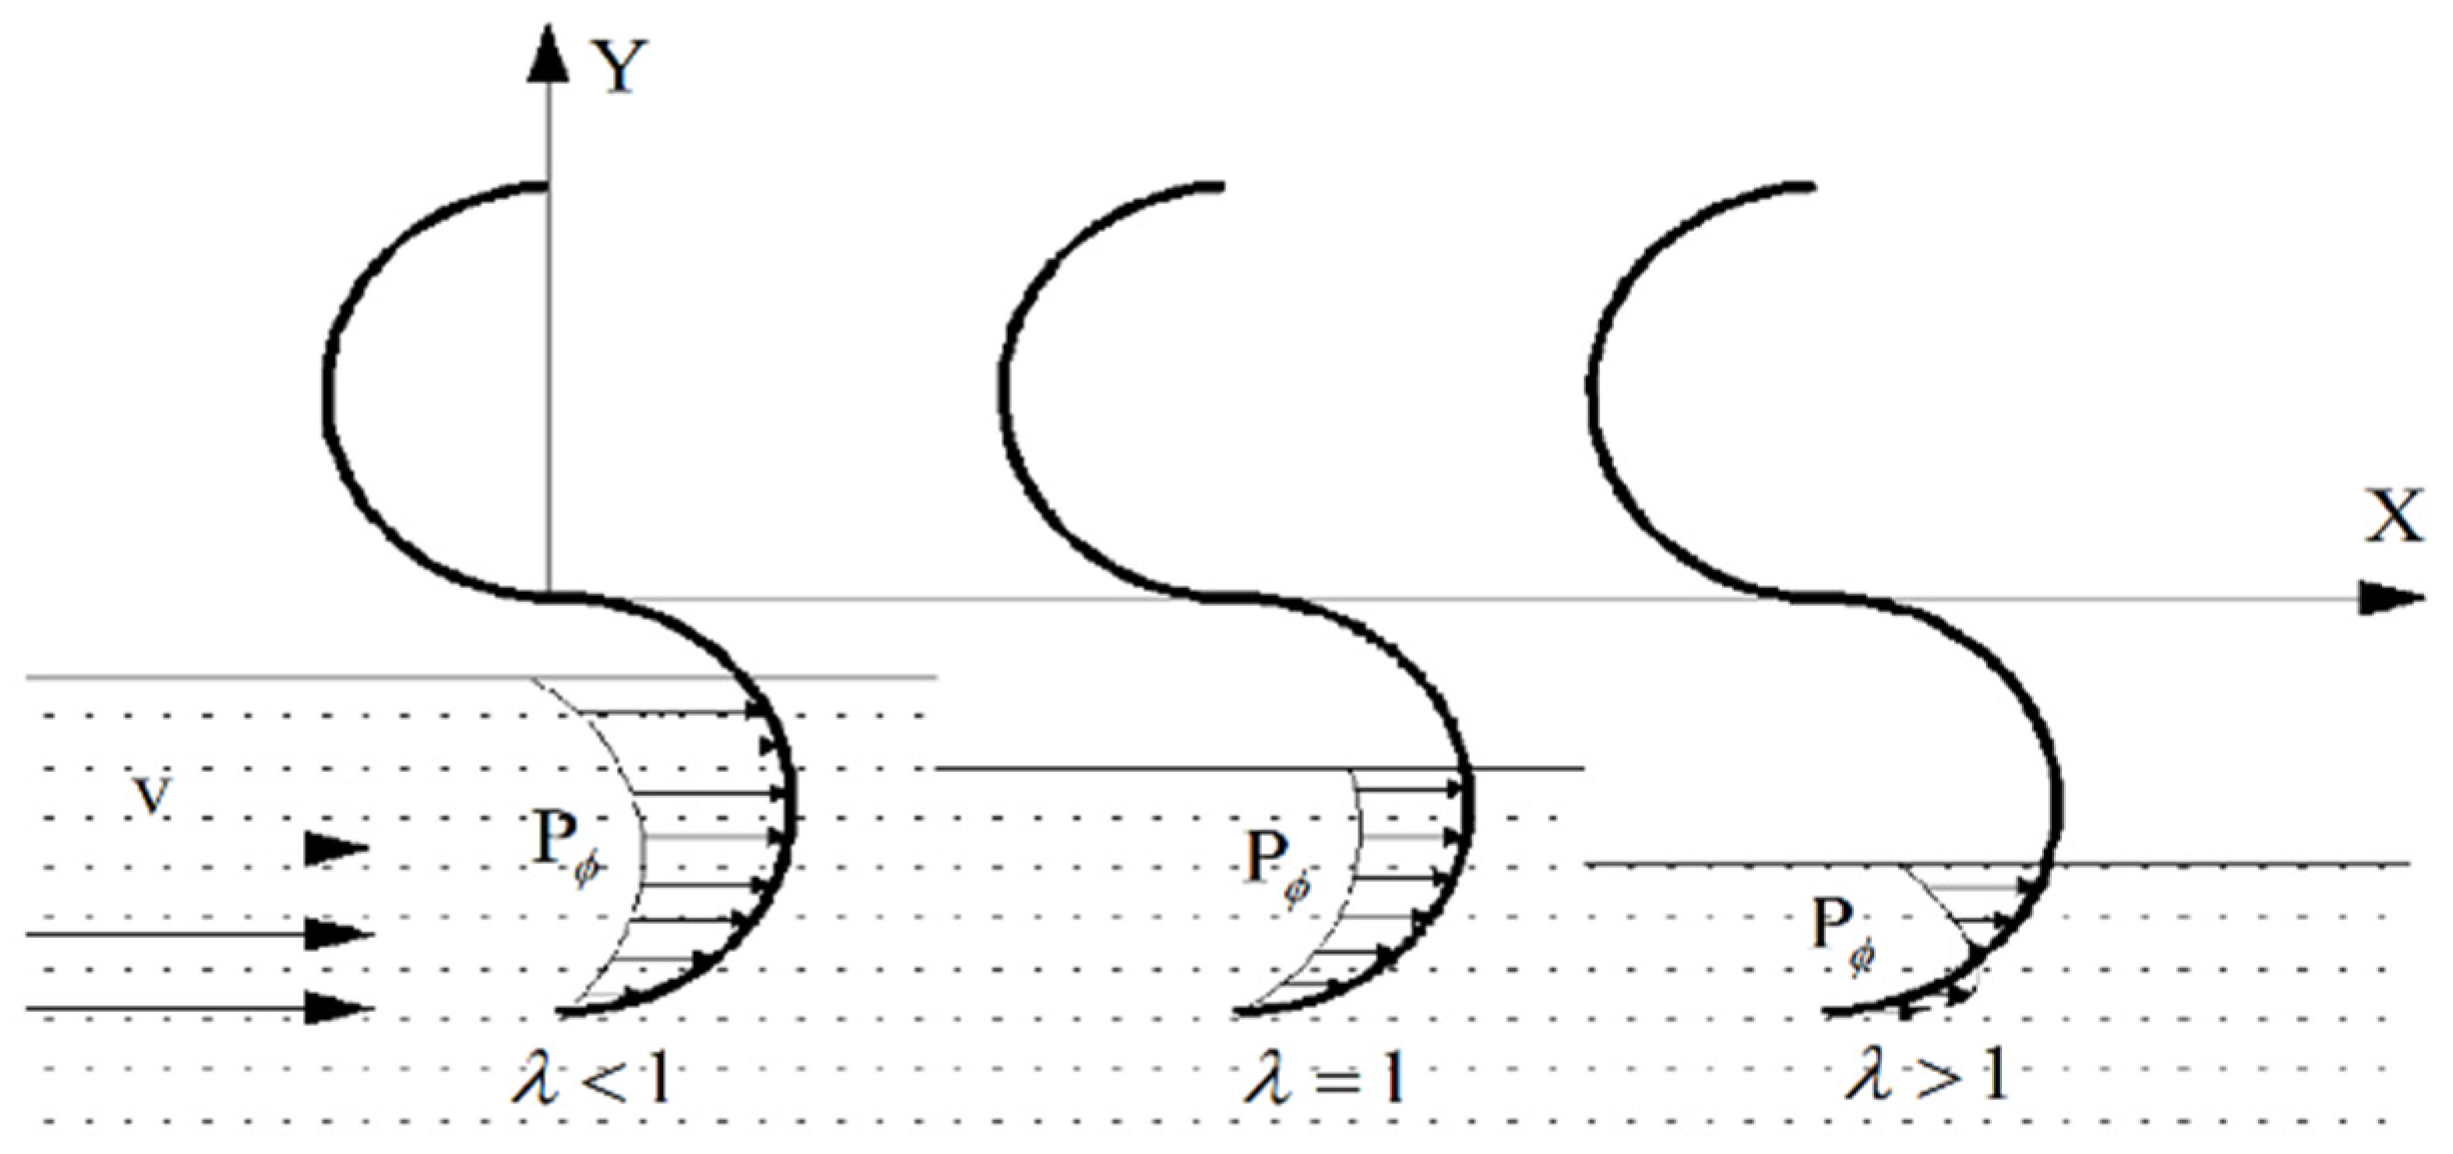
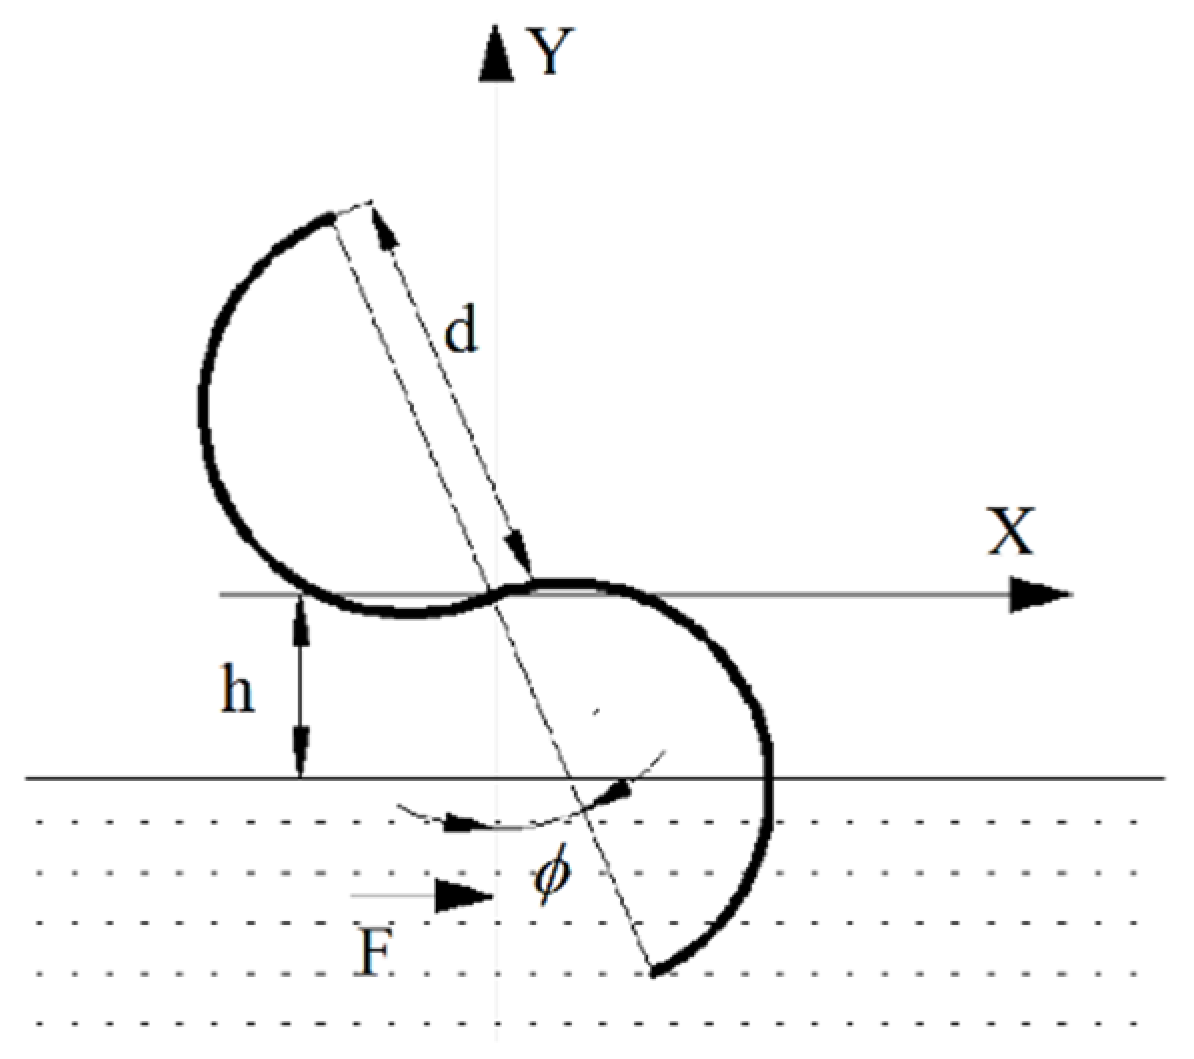
3. Theoretical Analysis of Savonius Water Turbine
The mass flow of water through an area of S is and the input power is :
where is the density of seawater, ; is the radial projected area of the impeller, , equal to the product of the width and diameter of the impeller; and is the velocity of the water, .
The output power of the impeller is as follows:
where is the impeller power, ; and are the resistance coefficients of concave and convex surfaces, respectively; and is the blade tip linear velocity, .
The energy transformation ratio is as follows:
The work analysis when the impeller is completely underwater is shown in Figure 7.
Figure 7.
Schematic diagram of work carried out with the full impeller underwater.
When the impeller rotates under the action of water flow, the water flow generates a positive action on the concave surface of the impeller, and the work conducted in unit time is ; when negative action is generated on the convex surface of the impeller, the magnitude of the work conducted in unit time is :
In the formulas, and are the forces acting on the micro-area of the concave and convex surfaces of the impeller, respectively.
Therefore, the work carried out by the water flow to the impeller in the unit time is as follows:
According to Formula (9), in order to improve the power of an S-type turbine, it is necessary to reduce the energy of water flow on the convex surface of the impeller. The power of the water flow on the impeller can be increased by reducing the inundation degree of the impeller in the water.
In this study, the work of the impeller under three different working conditions was analyzed by using the momentum and Bernoulli theorems.
The blade diameter of the impeller is designated as d, and the overlap ratio is . Under the working condition, when the draft depth of the impeller is less than , that is, the height h of the center of the impeller from the water surface is greater than , as shown in Figure 8, at this time, the blade moves from position I to position II, and the water flow does not move the impeller. When the blade moves from position II to position III, in addition to the negative action of the pressure difference on both sides of the blade and the flow impact force, the impeller also needs to overcome the negative action of the buoyancy force on the blade.
Figure 8.
Working diagram of a few impellers under water.
Under working condition 2, as shown in Figure 9, when the draft depth of the impeller is exactly , that is, , compared with condition I, the blade needs to overcome the work of pressure difference resistance and flow impact force from position I to position II. Because the submergence degree of the blade in water is greater than the former, the positive action of the water flow on the blade is greater than that of the blade. From position II to position III, the water flow generates negative action on the blade to generate positive action, and there is no negative impact on the impeller buoyancy.
Figure 9.
Schematic diagram of work conducted with half of the impeller under water.
Under working condition 3, the draft depth of the impeller is greater than , as shown in Figure 10. Compared with condition 2, the blade needs to overcome more negative action caused by the pressure difference from position I to position III. Then, in the process of the blade moving from position III to position I, assuming that the water velocity behind the concave surface of the impeller is very small and negligible, it can be concluded that in this section the water causes the same positive action on the impeller.
Figure 10.
Working diagram of most impellers underwater.
At the same time, there is reverse water flow in the overlapping area, as shown in Figure 11, which has a driving effect on the concave surface of the blade and increases the effective torque of the impeller for rotating work.
Figure 11.
Reverse flow diagram.
In summary, the draft depth of the impeller has the most tidal power in the range of .
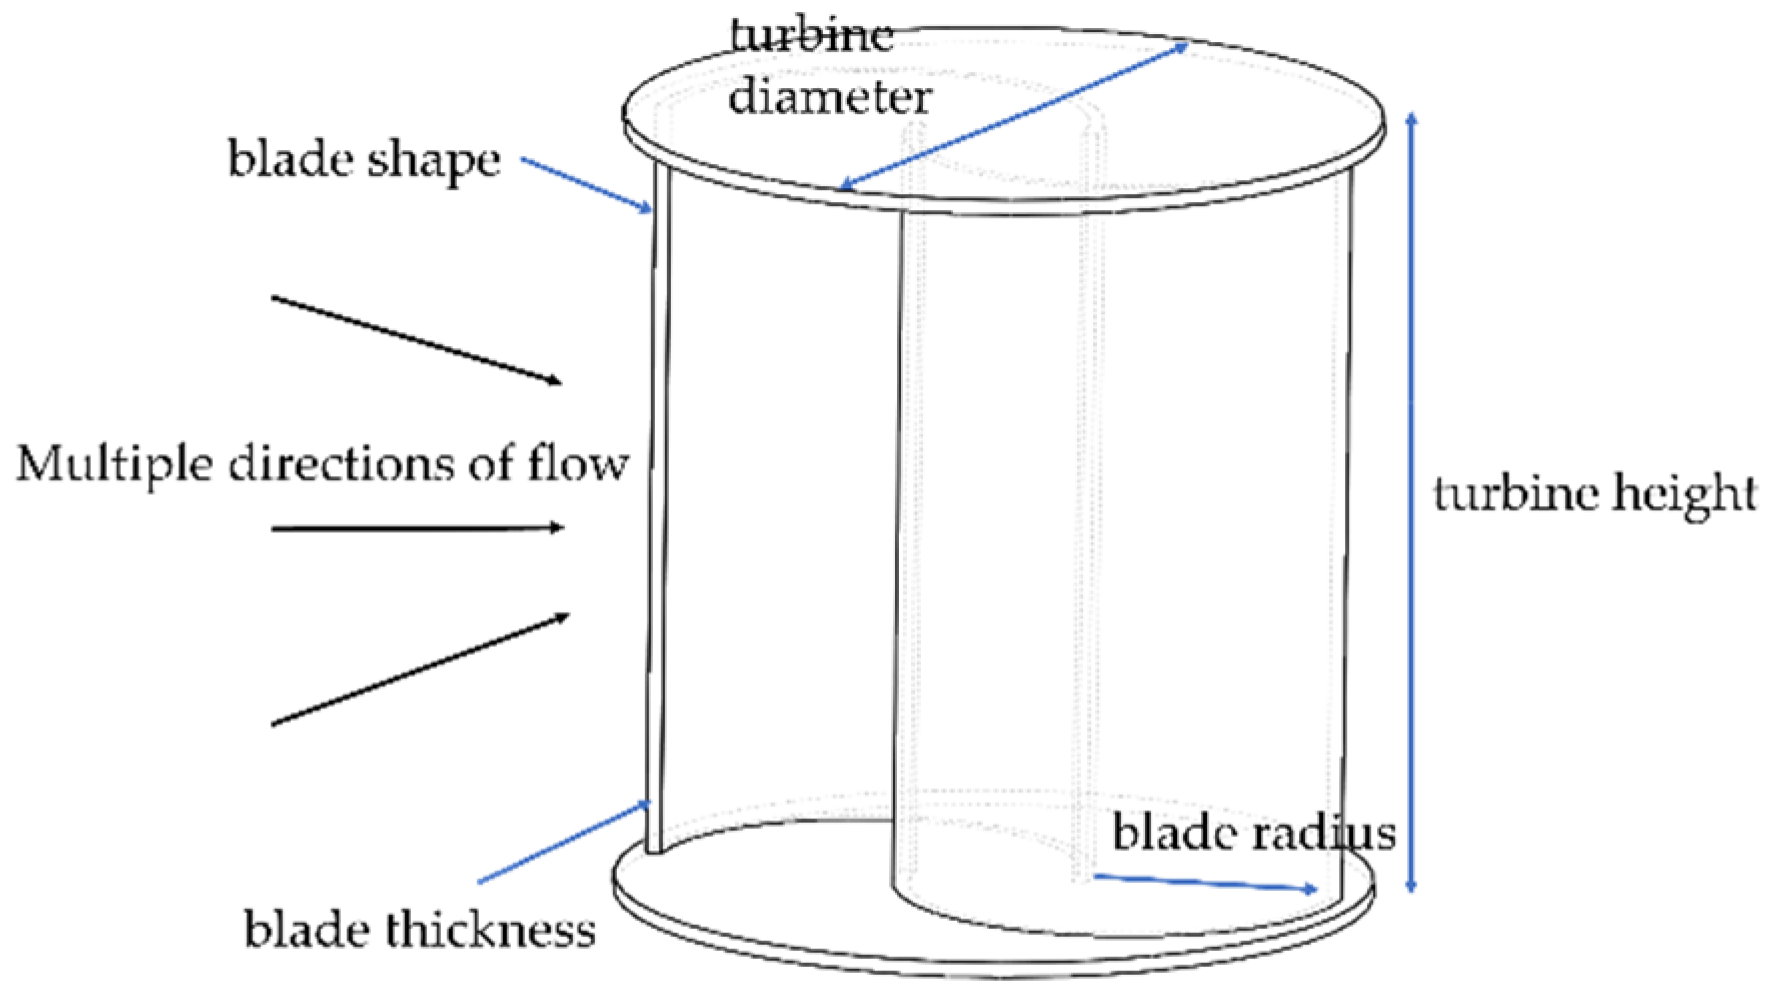
4. Impeller Parameters
In this study, the whole deep-water cage is placed in a floating body with dimensions of 4 m long, 2 m wide, and 0.9 m high, including a feeding system, in which the motor power of the feeding system is 1.5 kw. The feeding time is one hour a day, and the electricity consumption is about 1.5 degrees a day. A settling system requires two solenoid valves, each of which has a rated power of 50 w and a power consumption of 0.1 degrees per day. The power consumption of the monitoring system is 1.6 degrees per day; therefore, the maximum electricity consumption of the entire cage is about 3.2 degrees. The whole deep-sea cage system needs to be equipped with a power generation device with an average power of 140 w or more, and with a water flow speed of 1 m/s as the design flow rate. Moreover, the blade sweeping area needs to be at least 10 , the final blade height is 2.8 m, and the blade diameter is 2 m.
In order to study the energy capture performance of the power flow capture device, the structure of the energy capture device was compared, analyzed, and optimized. The number of blades of the S-type turbine, the order of the S-type turbine, and the distance from the water of the S-type turbine were mainly studied. The parameters of experimental conditions are shown in Table 3. A picture of the energy capture device is shown in Figure 12.
Table 3.
Experimental condition parameter table.
Figure 12.
Image of the energy capture device.
The physical model experiment was carried out in a still-water lake. The distance of the turbine center from the water surface was controlled by controlling the inlet water of the pressurized water tank of the floating body of a ship, and the speed of the floating body was controlled by a stepper motor pulling the steel rope on the floating body, so as to simulate the flow of various velocities. After the energy capture device is increased through the gearbox, it drives the generator to generate electricity, converts the mechanical energy into electrical energy, and stores it in the battery. Siemens PLC is the main control system, which can communicate with the monitoring program written by the upper computer using LabVIEW. The control system automatically records and displays various parameters during operation, such as blade speed, torque, power, and so on.
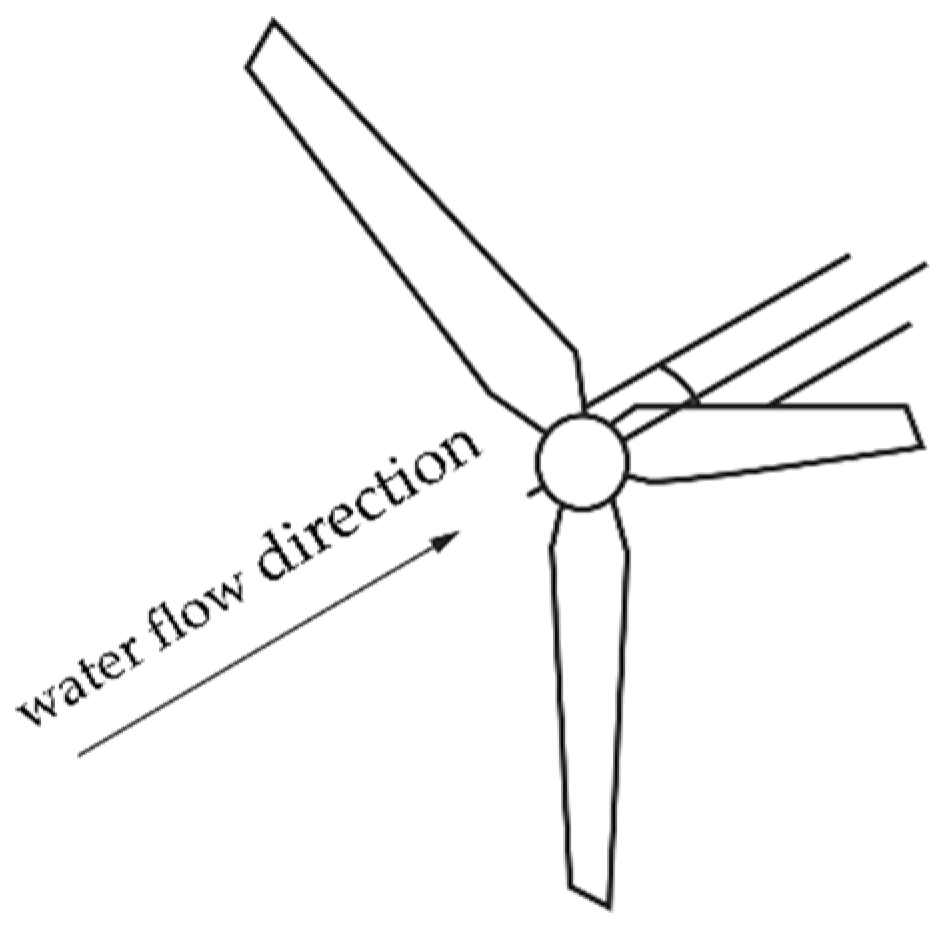
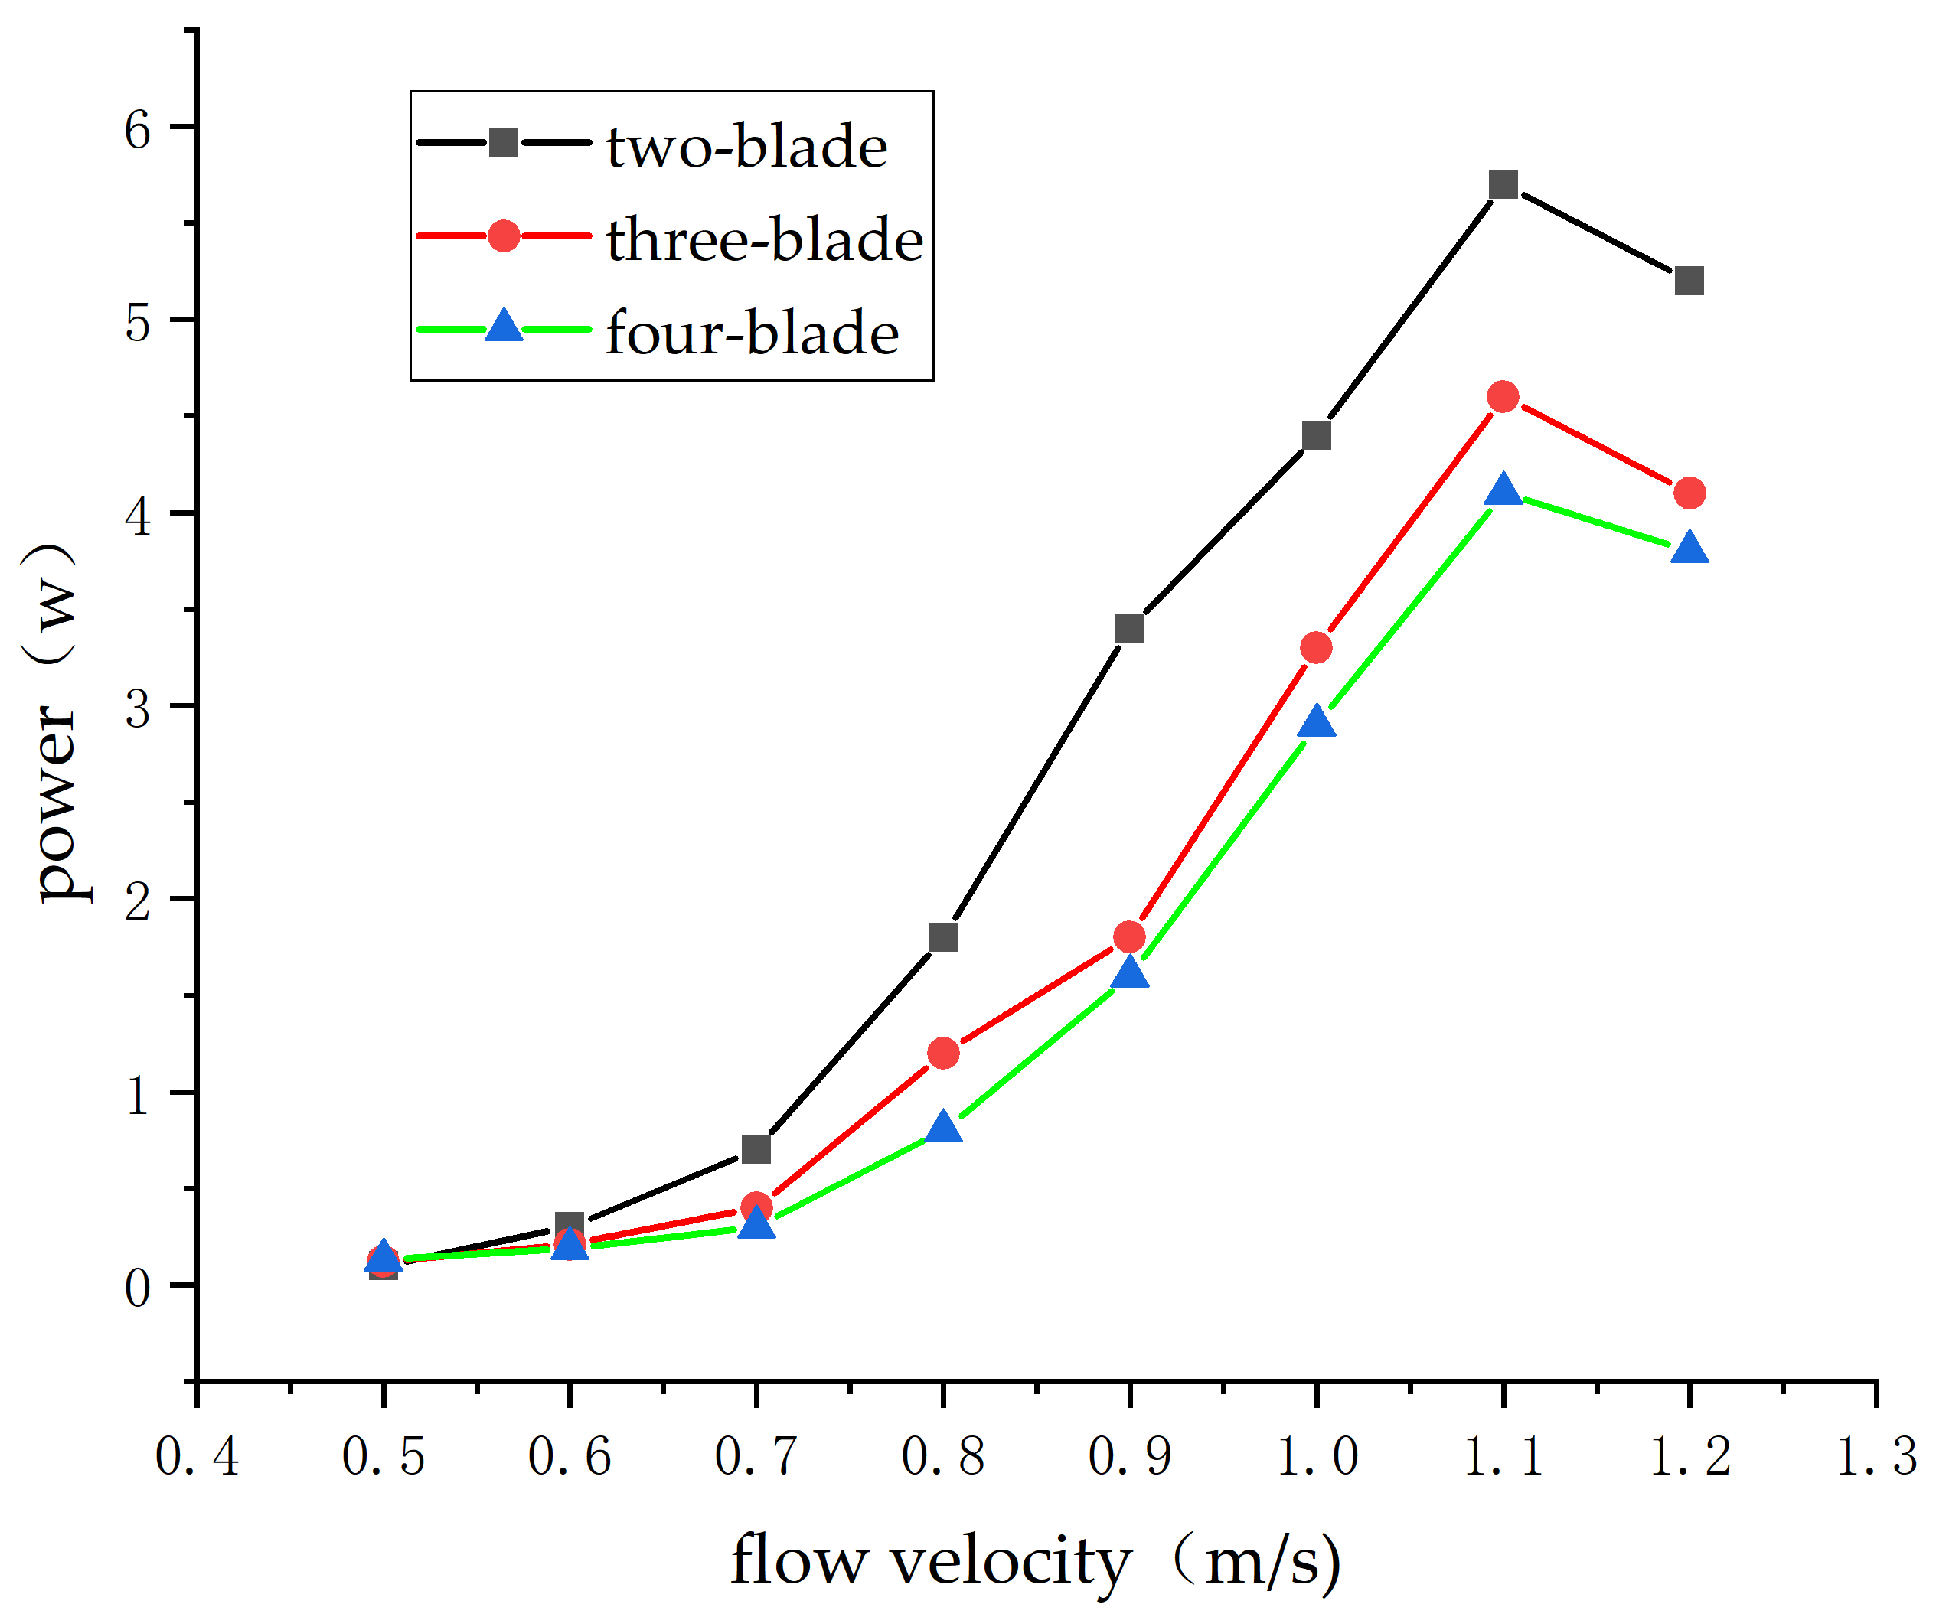
4.1. The Influence of Blade Number
When the blades are immersed in water, the energy capture performance of the two-blade Savonius impeller is better than that of the three- and four-blade Savonius impellers. This is because in the case of the 120° distribution of the three blades and the 90° distribution of the four blades, at some moments, when the water flow acts on the front blade, the generated water flow acts on the rear blade, thus hindering the rotation of the entire impeller. However, too many blades will lead to too small water flow space between blades and serious interference between blades, which reduces the energy capture efficiency of the turbines. The test results are shown in Figure 13. In summary, an impeller with two blades was selected in this study with a 180° blade distribution.
Figure 13.
Energy capture diagram with different numbers of blades.
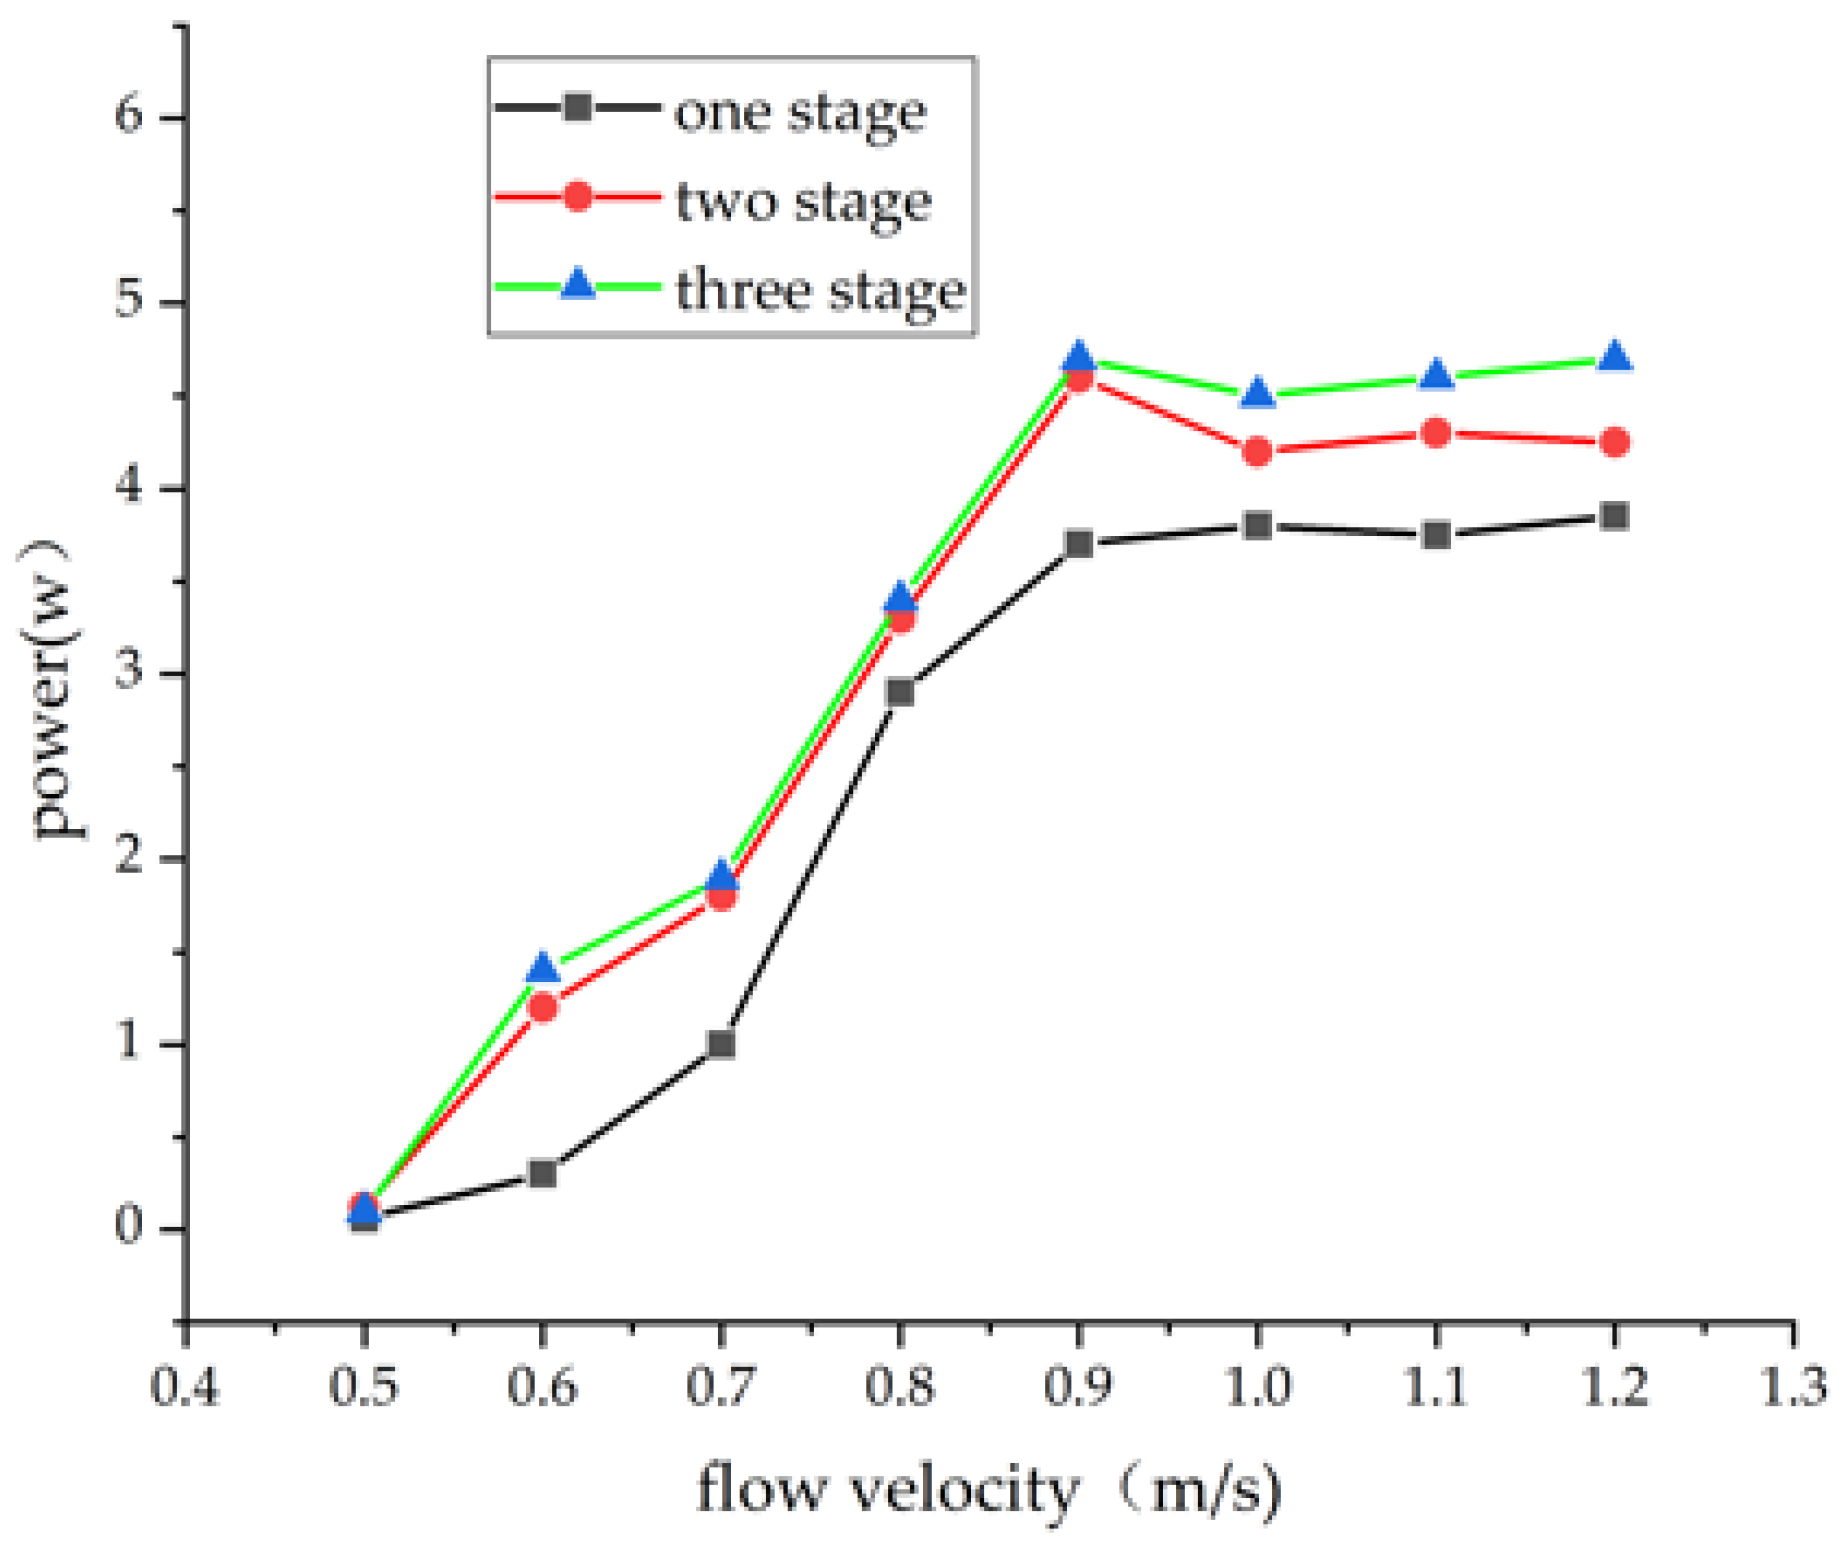
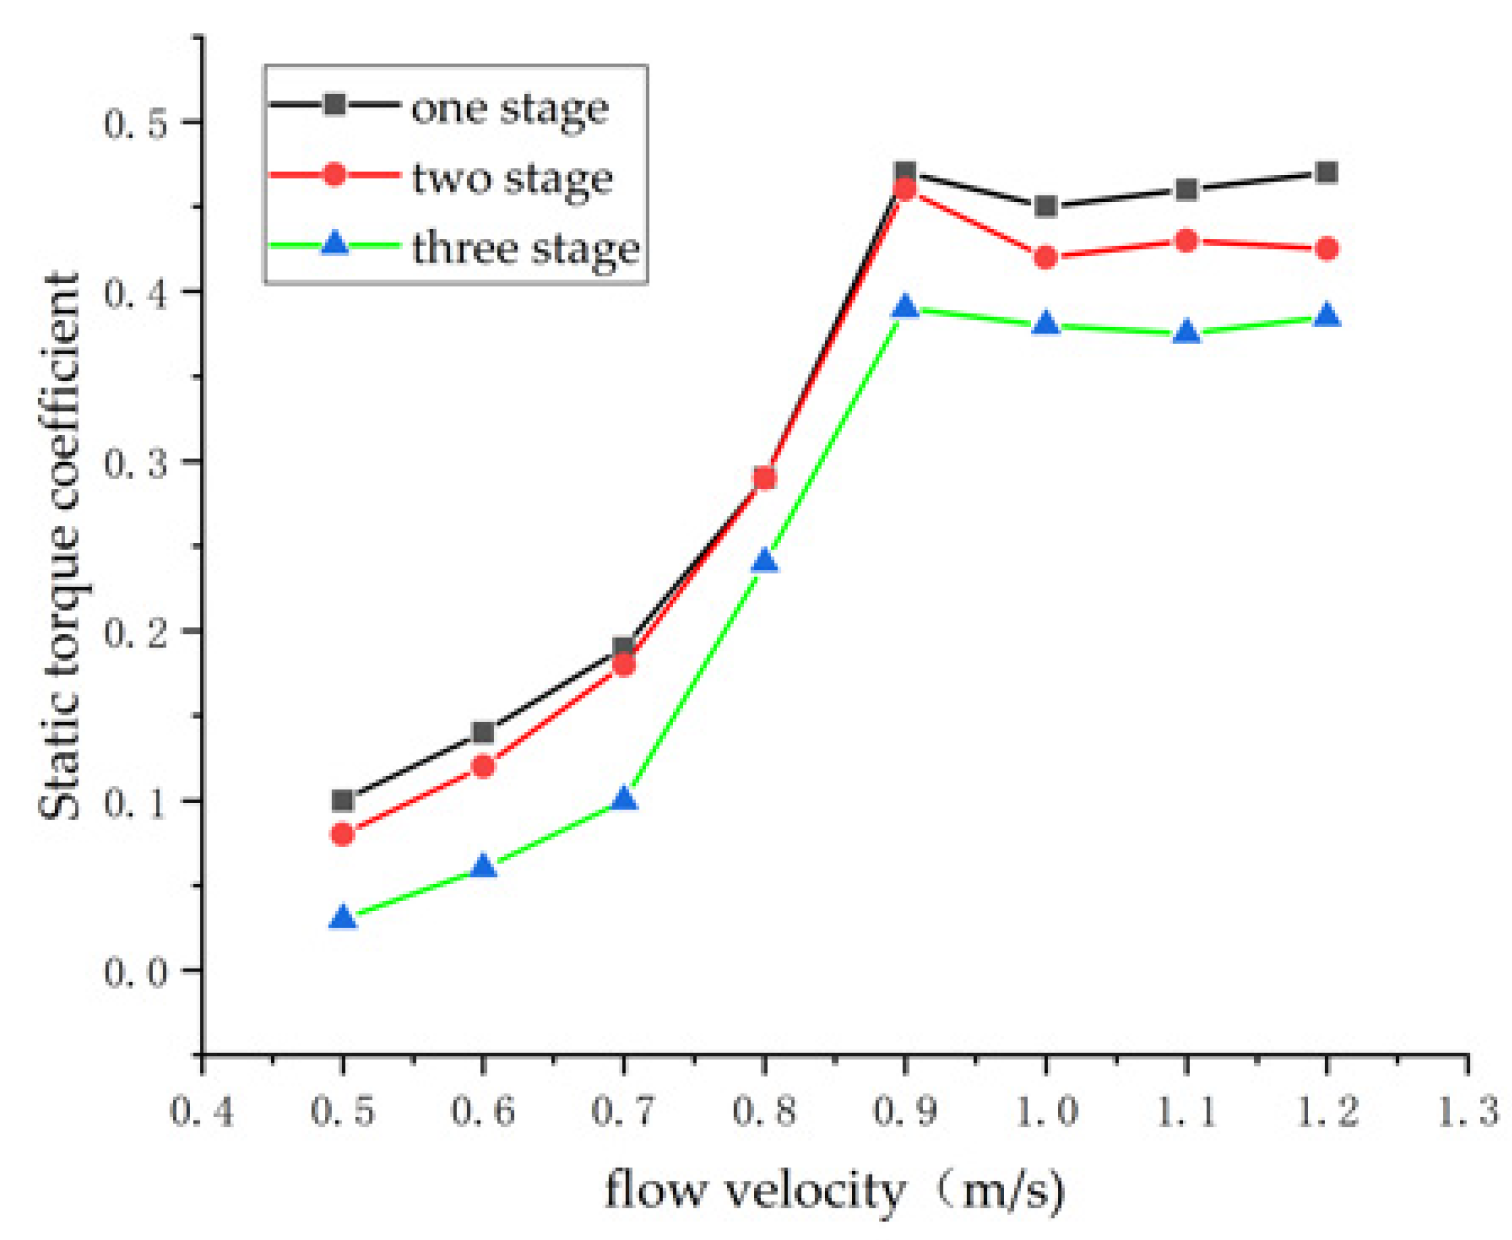
4.2. The Influence of Stage Number
The starting torque of traditional first-order turbines varies sinusoidal with the angle between the blade and water flow direction and fluctuates greatly. In some places, the torque even drops to almost zero. The initial position of the blade has little influence on the starting torque, and its dynamic characteristics become smooth. The output characteristics of the turbine are more stable. There is a 90° relative dislocation between the two sets of impels, and the number of blades is four, so it is more conducive to small flow start-up. However, an increase in the order of the impeller also leads to an increase in the turbine’s moment of inertia, which reduces the energy utilization efficiency of tidal energy. The experimental results are shown in Figure 14 and Figure 15. The results show that second- and third-order S-type turbines have better energy capture advantages than traditional first-order turbines, and the static torque coefficient is relatively small. Considering the consistency of both sides of the floating body of the ship shape, two sets of first-order impellers with a dislocation of 90° were selected in this study, as shown in Figure 16.
Figure 14.
Energy capture diagram.
Figure 15.
Static torque coefficient diagram.
Figure 16.
Blade arrangement.
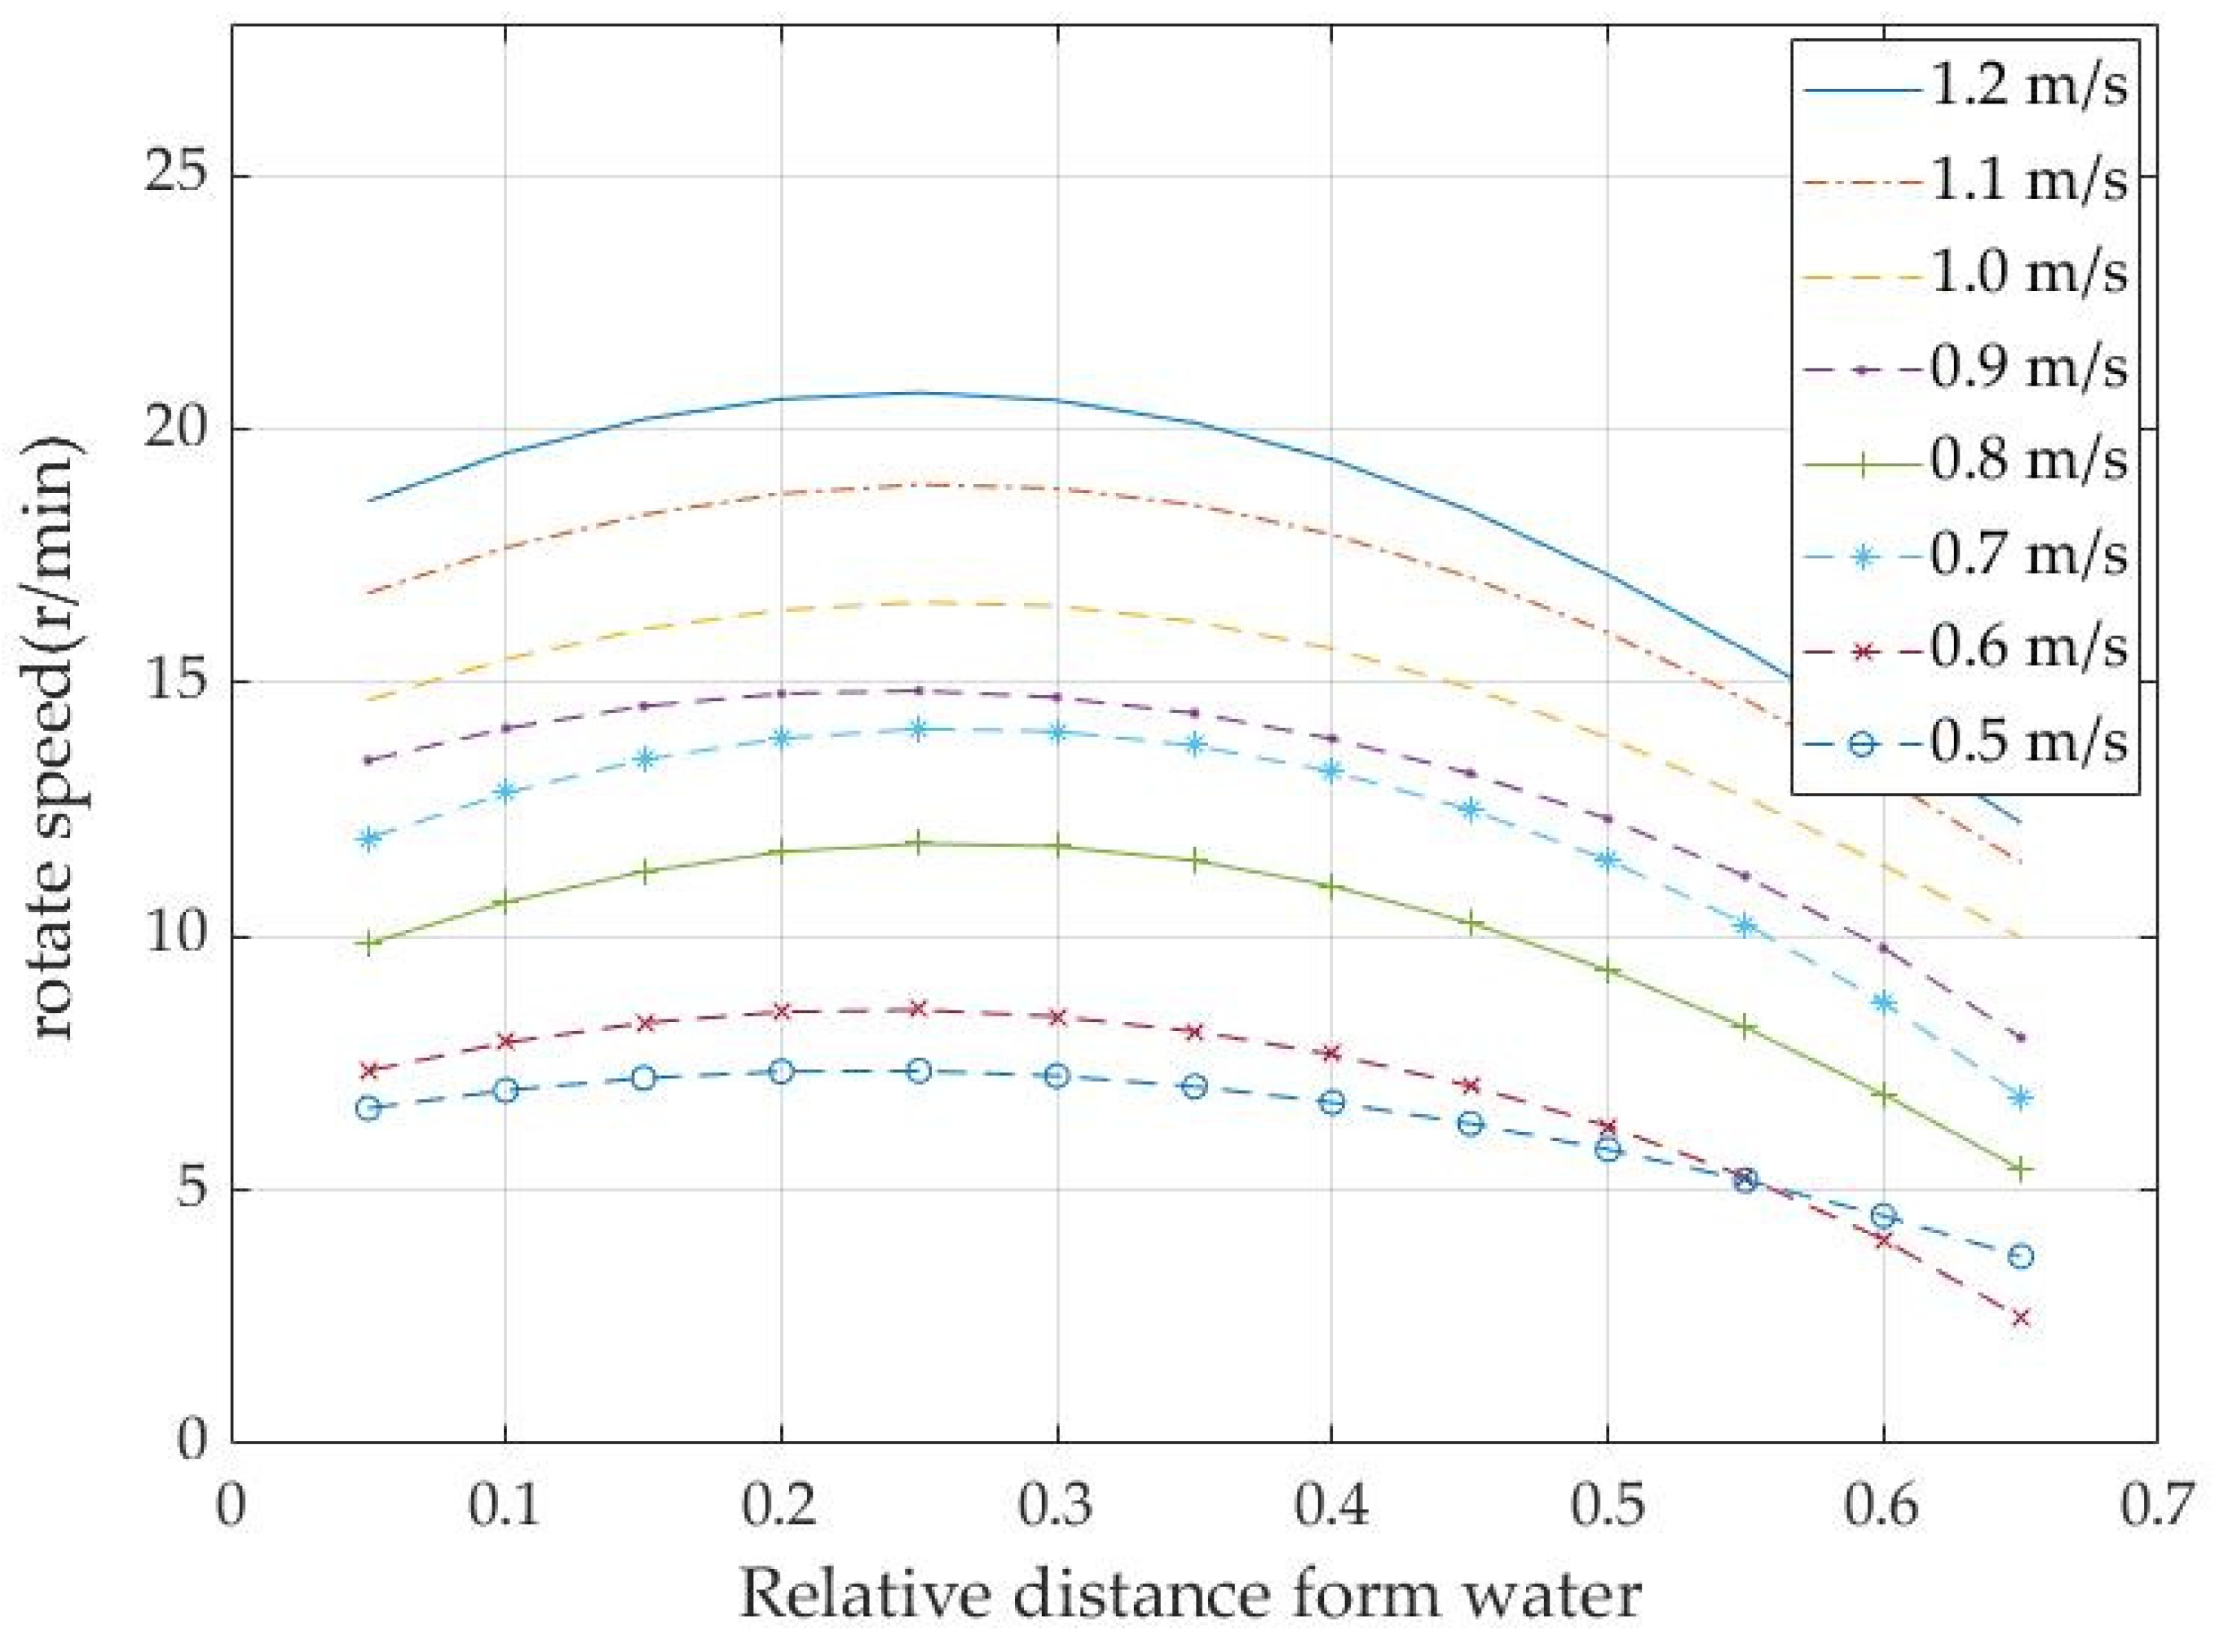
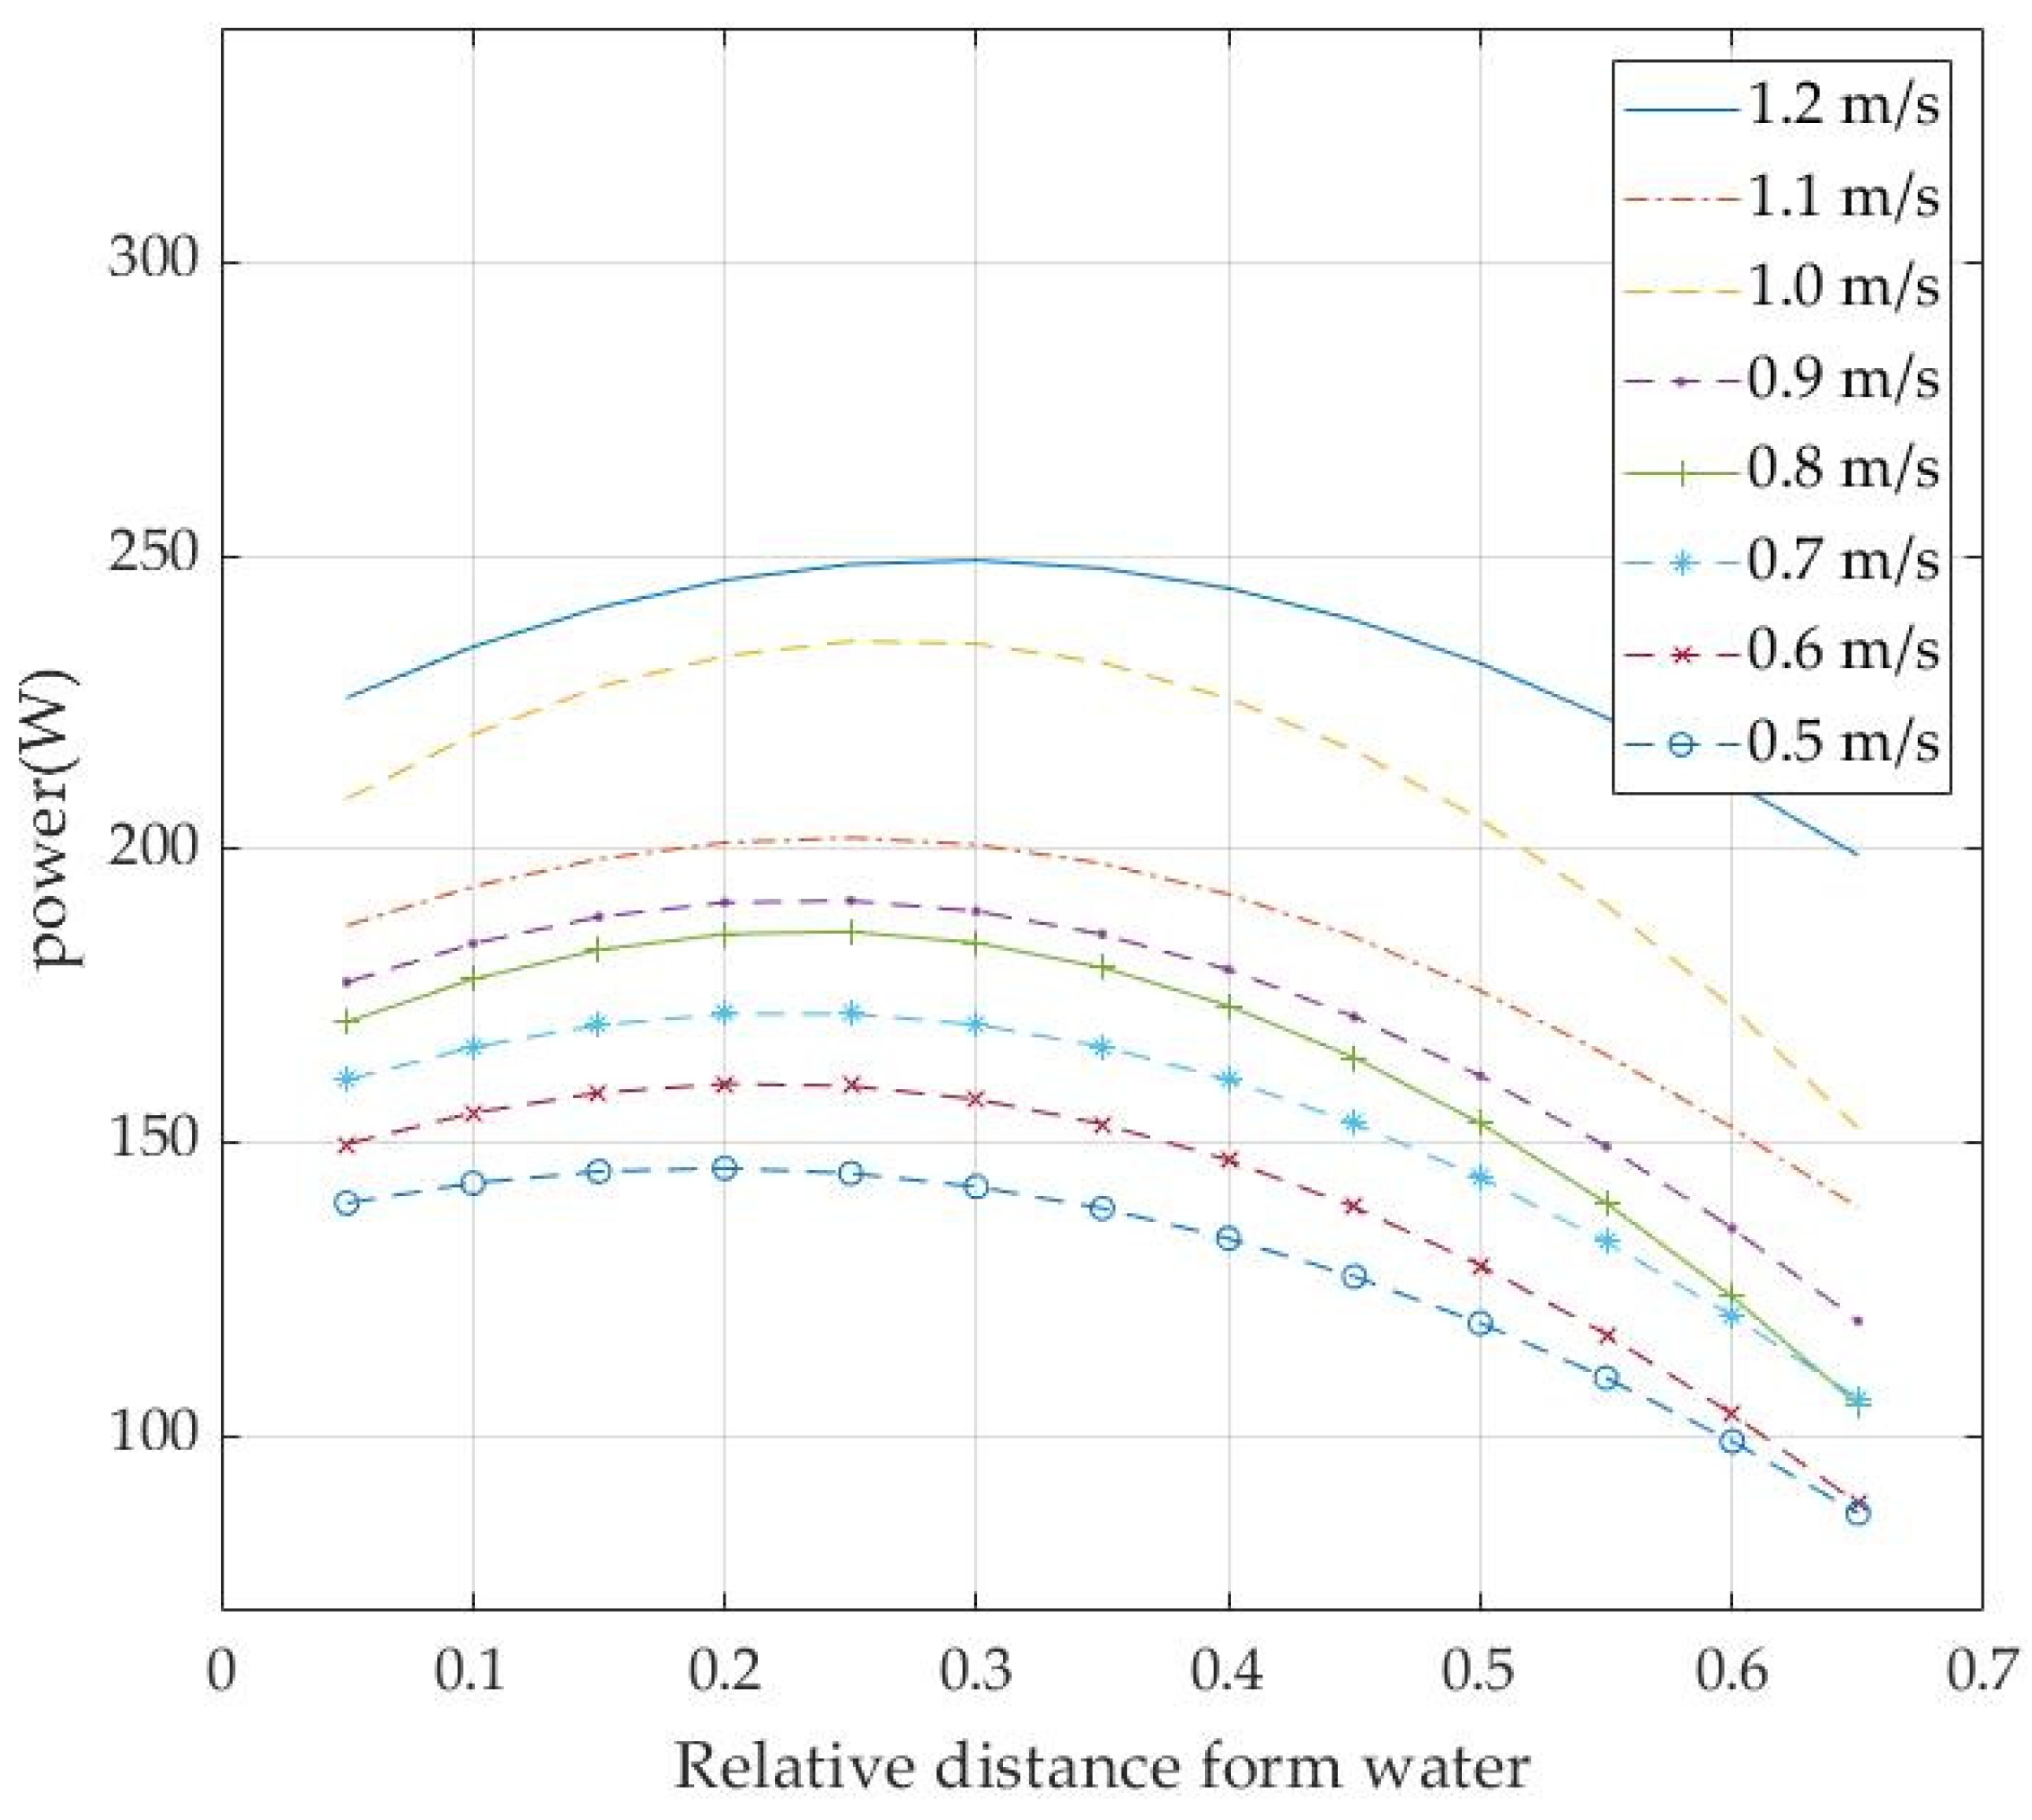
4.3. The Influence of Distance from Water
The impeller of a traditional resistance turbine (such as the S-impeller) is completely underwater, and each blade of the impeller is present during one operating cycle.
Generating negative action for a period of time, as shown in Figure 17, is precisely the feature that prevents the impeller from achieving higher efficiency.
Figure 17.
Force analysis of traditional S-shaped blade.
Chauvin et al. proposed a mathematical model based on the pressure drop of blades to calculate the torque and power of an S-type turbine with clearance s/d = 0, whose torque can be expressed as follows:
The above torque is composed of two parts: represents the resistance part of the turbine and represents the drive part of the turbine. Assuming that the pressure difference between the backward and forward blades is and , respectively, the total torque can be expressed as follows:
The average power P is obtained by integrating the torque from 0 to :
When and are zero, that is, the upper part of the impeller is not subject to the resistance of the water flow, and the total torque and average power of the impeller are increased accordingly. Based on the above analysis, this study presents a lifting-type tidal current power generation test device. The relationship between the distance between the turbine center and the water surface and the power generation efficiency of the power plant is investigated in this study.
For an impeller with a certain ratio of height to diameter, its torque and speed vary with the draft depth of the impeller. As shown in Figure 18, when the blade tip velocity ratio λ is less than one, the size of the torque increases with the increase in the depth of the draft, and reaches the maximum value when the depth reaches the center of the impeller. However, the rotational speed decreases with the increase in draft depth. When the tip velocity ratio λ is greater than one, there is always a point in the radial direction where the horizontal component of the linear velocity is equal to the water velocity. The horizontal component speed of the blade below this point is greater than the water flow speed; therefore, the water pressure of the blade is opposite to its movement direction, forming a negative torque. The horizontal component speed of the blade above this point is less than the water flow speed, the water pressure on the blade is the same as its movement direction, and the water flow pushes the blade to operate. Assuming that when the water flow speed is V, the blade draft depth is 1/2 D-h and the blade tip velocity ratio λ is just one. Then, when the blade draft depth is less than 1/2 D-h, the blade tip velocity ratio λ is greater than one, and thus the blade speed increases and the torque decreases. When the draft depth of the blade is greater than 1/2 D-h, the blade tip speed ratio λ is less than one, and thus the blade speed decreases and the torque increases.
Figure 18.
The force analysis of the blade.
Refer to the force analysis of a single impeller in water, as shown in Figure 19.
Figure 19.
Force analysis of single blade.
According to the calculation scheme of the drag-type blade, the calculation formula of external fluid resistance is given as follows:
where is the fluid density; is the relative velocity of the fluid; is the effective area of the object; and is the drag coefficient.
The thrust force of the water flow on the blade of a single turbine is as follows:
where is the length of the impeller; is the impeller diameter; is the distance between the center of the impeller and the water surface; and is the phase angle of the impeller.
When the impeller rotates once it performs as follows:
Power:
where . Therefore,
From the above analysis, it can be seen that when the speed or torque of the impeller reaches the maximum, the power of the impeller does not necessarily reach the maximum. Only when the product of torque and speed reaches the maximum can the power of the impeller reach the maximum.
5. Results Analysis and Discussion
Based on the power demand, the blades of the S-type turbine and the order of the S-type turbine are optimized on the basis of a ship-type floating body design and single-anchor chain design. According to theoretical derivation, experimental verification is carried out. Based on the structure size of the impeller, in order to ensure the continuous operation of the impeller, the height h of the center of the impeller from the water surface is at most 0.7 m; the height h of the center of the impeller from the water surface is 0.1 m, 0.2 m, 0.3 m, 0.4 m, 0.5 m, 0.6 m, and 0.7 m; and the relative distance from the water varies from 0.1 to 0.6. Figure 20 shows a chart drawn based on the experimental data of parameters related to the relative distance between the impeller and the water measured at different water velocities. The relative distance from water is the ratio of the distance from water to the diameter of the impeller.
Figure 20.
Impeller speed chart.
As analyzed in Figure 19, when the relative distance from water is small (that is, the draft depth of the impeller is large), with the increase in its value, the gradient of the reduction in the torque of the concave blade by the water flow is smaller than the reduction gradient of the resistance distance of the water flow to the convex blade and the friction torque between the shaft and the bearing. Therefore, when the relative distance from water changes from 0.1 to 0.2, the impeller speed increases slightly. When the distance from the water increases to a certain value (that is, the draft depth of the impeller decreases to a certain value), the torque of the water flow on the concave surface of the impeller is less than the sum of the resistance moment of the convex surface and the friction moment between the impeller and the bearing and the load; thus, the rotational speed of the impeller begins to fall. When the relative distance from the water changes from 0.3 to 0.6, the rotational speed of the impeller begins to decrease. The maximum speed of the impeller is obtained between 0.2 and 0.3 relative distance from the water.
As shown in Figure 21, it can be seen from the curve that because there are diversion surfaces on both sides of the floating body and the convex surface of the impeller does not generate negative performance above the water surface, the output power of the impeller still reaches more than 130 w even if the water flow speed is 0.5 m/s. When the water flow velocity is low, the maximum output power of the impeller appears when the relative distance from the water is small. This is because, with the increase in the relative distance from the water, the increased gradient of the impeller speed is smaller than that caused by the decreased gradient of the impeller torque. With the increase in the flow speed, the relative distance from the water under the maximum output power of the impeller also increases, and the gradient of the increase in the impeller speed is greater than the gradient of the decrease in the impeller torque. In summary, the output power of the impeller increases first and then decreases with the increase in the relative distance from the water. When the relative distance from the water reaches about 0.25, the speed and torque of the impeller begin to decrease, and thus the power also changes accordingly.
Figure 21.
Impeller power diagram.
6. Conclusions
In this article, based on the study of tidal current energy capture under low-velocity sea conditions, a lifting tidal current power generation device suitable for open sea cages was proposed. The following conclusions were drawn.
1. The design of the shape of the ship’s floating body plays a beneficial role in guiding the flow and accelerates the fluid flow on both sides of the floating body; as a result, the flow rate is increased by more than 10% and the energy capture efficiency of the power generation device is improved. The single-point anchor system plays an adaptive role in water, automatically adjusting to the direction of the incoming flow and prolonging the effective energy capture time of the power generation device.
2. For low-velocity sea areas, an S-type turbine is more suitable for a sedimentation tidal flow capture device. At the same time, the S-type turbine is optimized. Due to the negative torque of multi-blade turbines, the capture power of two-blade S-type turbines is 20% higher than that of three- and four-blade turbines.
3. Compared with first-order S-type turbines, second- and third-order S-type turbines have better energy capture performance. At the same time, the static torque coefficient is relatively smaller with more S-turbine steps. The starting performance of the S-turbine is improved by 5%.
4. At different water flow speeds, with the gradual increase in water flow velocity, the energy capture power also increases correspondingly, and the overall trend is first increased and then decreased. Each impeller has an optimal relative distance from the water, making it the maximum output power, and the optimal distance from the water is about one-quarter of the impeller diameter.
At present, S-type turbines are mainly used in wind power generation, and their application in open sea cages needs to be further studied. In order to capture more ocean energy, the blade shape and layout spacing of an S-type turbine can be optimized according to typical sea conditions. At the same time, the capture power under different wave sea conditions also needs to be further studied.
Author Contributions
Conceptualization, Y.W. and L.B.; methodology, L.B.; validation, L.B. and Y.W.; formal analysis, L.B.; data curation, L.B. and C.J.; writing—original draft preparation, L.B.; writing—review and editing, Y.W.; visualization, C.J. and F.H.; supervision, H.L.; project administration, J.C. and Y.W.; funding acquisition, J.C. and Y.W. All authors have read and agreed to the published version of the manuscript.
Funding
This research was co-funded by the following three projects: Ningbo Municipal Science and Technology Innovation 2025 Major Project, 2020Z076; Ningbo Natural Science Foundation Project, 2023J172; and Ningbo Municipal Major Science and Technology Research and Unveiling Project, 20212ZDYF020015.
Institutional Review Board Statement
Not applicable.
Informed Consent Statement
Not applicable.
Data Availability Statement
Data are contained within the article.
Conflicts of Interest
The authors declare no conflicts of interest.
Nomenclature
| Nomenclature | |
| Maximum flow rate | |
| Semi-daily cycle of the power flow | |
| Energy utilization coefficient | |
| Real-time flow rate | |
| Blade sweep area | |
| Ts | Effective time for the impeller to operate in a half-day cycle |
| Radial projected area of the impeller | |
| Velocity of the water | |
| Impeller power | |
| Concave resistance coefficient | |
| Convex resistance coefficient | |
| Blade tip linear velocity | |
| PL | Energy of water flow against concave surface per unit time |
| PD | Energy of water flow on a convex surface per unit of time |
| FLj | Force of micro-area on a concave surface |
| FDi | Force of the micro-area on a convex surface |
| dw | Water action on the impeller per unit of time |
| Resistance part of the turbine | |
| Driving part of the turbine | |
| Relative fluid velocity | |
| Body effective area | |
| Resistance coefficient | |
| Length of the impeller | |
| Distance of the impeller center from the water surface | |
| Impeller diameter | |
| Phase angle of the impeller | |
| Greek Symbols | |
| Density of seawater (kg/m3) | |
| Gravitational acceleration (m/s2) | |
| Abbreviation | |
| S-type turbine | Savonius-type turbine |
| PLC | Programmable Logic Controller |
| LabVIEW | Laboratory Virtual Instrument Engineering Workbench |
References
- Zheng, J.-H.; Zhang, J.-S. Recent advances and key technologies in marine energy utilization engineering. J. Hohai Univ. Nat. Sci. 2015, 43, 450–455. [Google Scholar]
- Zhang, J.; Tang, Z.; Qian, F. A review of recent advances and key technologies in ocean thermal energy conversion. J. Hohai Univ. Nat. Sci. 2019, 47, 55–64. [Google Scholar]
- Li, S.-H.; Li, F.; Wang, J. Current situation and development suggestions of Marine energy development in China. Ocean Dev. Manag. 2014, 9, 7. [Google Scholar]
- Zhang, J.-S.; Wang, G.-H.; Lin, X.-F. A Review of Recent Development and Key Technology Problems in Utilization of Tidal Stream Energy. J. Hohai Univ. Nat. Sci. 2021, 49, 220–232. [Google Scholar]
- Li, G.; Zhu, W.-D. Tidal Current Energy Haresting Technologies: A Review of Current Satus and Life Cycle Assessment. Renew. Sustain. Energy Rev. 2023, 179, 113269. [Google Scholar] [CrossRef]
- Sun, K.; Chen, T.-Y. Current Status and Trends of Research on Ocean Tidal Energy Generation Technology. Ship Eng. 2024, 46, 16–27. [Google Scholar]
- Khan, M.J.; Bhuyan, G.; Iqbal, M.T.; Quaicoe, J.E. Hydrokinetic energy conversion systems and assessment of horizontal and vertical axis turbines for river and tidal applications: A technology status review. Appl. Energy 2009, 86, 1823–1835. [Google Scholar] [CrossRef]
- Pucci, M.; Spina, R.; Zanforlin, S. Vertical-Axis Tidal Turbines: Model Development and Farm Layout Design. Energies 2024, 17, 2366. [Google Scholar] [CrossRef]
- Mohammad, S.; Madjid, H.G.; Babak, S.M. Performance enhancement of low speed current savonius tidal turbines through adding semi-cylindrical deflectors. Ocean Eng. 2022, 259, 111873. [Google Scholar]
- Shen, C.; Zhang, J.; Ding, C.; Wang, S. Simulation Analysis and Experimental Study on Airfoil Optimization of Low-Velocity Turbine. J. Mar. Sci. Eng. 2024, 12, 303. [Google Scholar] [CrossRef]
- Mei, Y.; Li, Q.-P.; Chen, S.-F.; Wang, Q.-B. Study on Hydrodynamic Performance of Savonius Turbine. Water Resour. Power 2022, 40, 180–183. [Google Scholar]
- Li, Y.; Deng, Q.-Y.; Yang, S.-B.; Tong, G.-Q.; Feng, F. Influence of end plate on starting performance of Savonius wind turbines. J. Drain. Irrig. Mach. Eng. 2024, 42, 463–469. [Google Scholar]
- Wang, S.-H.; Jiang, C.-H.; Chen, J.-H.; Li, H.; Wu, S.-R. Research on the flow reduction performance of a savonius hydrokinetic rotor with a triangular array. Mar. Sci. 2024, 48, 64–74. [Google Scholar]
- Yang, Z.-Z.; Song, R.-Y.; Liu, B.-Y.; Ren, C.-J.; Lin, Z. Multi-objective Optimization of A New Savonius-type Impeller Parameters with Slots. Water Resour. Power 2023, 41, 203–206. [Google Scholar]
- Wakui, T.; Tanzawa, Y.; Hashizume, T.; Nagao, T. Hybrid configuration of Darrieus and Savonius rotors for standalone wind turbine-generator systems. Electr. Eng. Jpn. 2005, 3, 13–22. [Google Scholar] [CrossRef]
- Asadi, M.; Hassanzadeh, R. Effects of internal rotor parameters on the performance of a two bladed Darrieustwo bladed Savonius hybrid wind turbine. Energy Conv. Manag. 2021, 238, 114109.1–114109.16. [Google Scholar] [CrossRef]
- Chen, L.; Chen, J.; Xu, H.-T. Wind tunnel investigation on the two- and three-blade Savonius rotor with central shaft at different gap ratio. J. Renew. Sustain. Energy 2016, 8, 013303. [Google Scholar] [CrossRef]
- Gupta, R.; Biswas, A.; Sharma, K.K. Comparative study of a three-bucket Savonius rotor with a combined three-bucket Savonius-three-bladed Darrieus rotor. Renew. Energy 2007, 33, 1974–1981. [Google Scholar] [CrossRef]
- Tang, J.-W.; Hu, Y.; Song, B.-F.; Yang, H. Unsteady Aerodynamic Optimization of Airfoil for Cycloidal Propellers Based on Surrogate Model. J. Aircr. 2017, 54, 1241–1256. [Google Scholar] [CrossRef]
- Gao, R.-J.; Chen, J.-H.; Zhang, J.-J.; Zhou, S.-Y.; Xu, H.-F.; Wu, J.-D.; Qian, X.-H. Hydrodynamic Study on Energy Capturing Performance of Horizontal Axis Blades under Sub-Low Speed Tidal Current. China Ocean Eng. 2020, 34, 374–386. [Google Scholar] [CrossRef]
- Yan, Y.-T.; Xu, S.-M.; Liu, C.; Zhang, X.; Chen, J.-M.; Zhang, X.-M.; Dong, Y.-J. Research on the Hydrodynamic Performance of a Horizontal-Axis Tidal Current Turbine with Symmetrical Airfoil Blades Based on Swept-Back Models. J. Mar. Sci. Eng. 2022, 10, 1515. [Google Scholar] [CrossRef]
- Jiao, H.-F.; Wang, M.-C.; Liu, H.-Y.; Chen, S.-S. Positive and Negative Performance Analysis of the Bi-Directional Full-Flow Pump with an “S” Shaped Airfoil. J. Mar. Sci. Eng. 2023, 11, 1188. [Google Scholar] [CrossRef]
- Du, X.-S.; He, P.; Martins, J. Rapid airfoil design optimization via neural networks-based parameterization and surrogate modeling. Aerosp. Sci. Technol. 2021, 113, 106701. [Google Scholar] [CrossRef]
- Bangga, G.; Hutani, S.; Heramarwan, H. The Effects of Airfoil Thickness on Dynamic Stall Characteristics of High-Solidity Vertical Axis Wind Turbines. Adv. Theory Simul. 2021, 4, 2000204. [Google Scholar] [CrossRef]
Disclaimer/Publisher’s Note: The statements, opinions and data contained in all publications are solely those of the individual author(s) and contributor(s) and not of MDPI and/or the editor(s). MDPI and/or the editor(s) disclaim responsibility for any injury to people or property resulting from any ideas, methods, instructions or products referred to in the content. |
© 2024 by the authors. Licensee MDPI, Basel, Switzerland. This article is an open access article distributed under the terms and conditions of the Creative Commons Attribution (CC BY) license (https://creativecommons.org/licenses/by/4.0/).