Article

Early Diagenetic Processes in the Sediments of the Krka River Estuary

Division for Marine and Environmental Research, Ruđer Bošković Institute, Bijenička Cesta 54, 10000 Zagreb, Croatia
*
Author to whom correspondence should be addressed.
J. Mar. Sci. Eng. 2024, 12(3), 466; https://doi.org/10.3390/jmse12030466
Submission received: 15 February 2024 / Revised: 5 March 2024 / Accepted: 6 March 2024 / Published: 8 March 2024
(This article belongs to the Special Issue Biogeochemistry of Trace Elements in the Marine Environment)

Abstract

:
To study the processes that govern the post-depositional mobility of metals in the estuarine sediment, five sediment cores were sampled in the Krka River estuary (Croatia). The obtained concentration ranges in the pore water were 0.057–49.7 μM for Fe, 0.310–100 μM for Mn, 0.068–26.8 nM for Co, 0.126–153 nM for Cu, 11.5–2793 nM for Zn, 0.222–31.3 nM for Pb, 4.09–59.4 nM for U, 38.8–2228 nM for Mo, and 0.065–2.29 nM for As. The vertical distribution of metals in the dissolved and solid fraction of the sediment, coupled with other diagenetic tracers (e.g., dissolved sulphide), demonstrate the importance of early diagenetic reactions, in particular Fe and Mn oxyhydroxide and sulphate reduction, for the cycling of metals in the sediment. The redox zonation in the sediment was compressed, and the suboxic zone occurs immediately below the sediment–water interface. The estimated benthic fluxes in the estuary were 5220 kg y−1 for Fe, 27,100 kg y−1 for Mn, 6.00 kg y−1 for Co, 20.5 kg y−1 for Cu, 5.16 kg y−1 for Pb, 111 kg y−1 for Mo, and 87.3 kg y−1 for As. The riverine input was more important than the benthic flux, except in the case of Mn and Fe.

1. Introduction

Estuaries, due to their convenient location at the junction of the sea and land, are of exceptional importance for humans as areas ideal for urban settlements and recreational use, as well as locations for ports and industrial plants [1,2]. However, intense human activities have often degraded the sensitive and complex estuarine ecosystems [3]. The metals and metalloids (referred to hereafter as metals) are one of the biggest threats to the aquatic environment due to their toxicity, non-degradable nature, and capacity for accumulation [4,5,6]. Metals are naturally occurring in the environment; however, due to various anthropogenic activities, such as mining, traffic, agriculture, and wastewater discharge, their concentrations have increased globally. When metals enter the estuarine environment, their adsorption to suspended particles in the water column, incorporation into biogenic material, and consequent deposition in sediments occur very quickly [7]. Nevertheless, the sediment is not just a final repository of pollutants, but also a potential long-term secondary source, due to the various physicochemical and biological processes, which cause metals to release from the solid to the dissolved phase and diffuse to the water column [8,9,10,11,12].
Metals’ mobility is affected by numerous factors, such as physicochemical conditions in the water column and sediment (salinity, Eh, pH) [13,14] and sediment composition (content of clay minerals, sulphides, carbonates, Mn and Fe oxyhydroxides, organic matter (OM)) [14]. As a primary driver of early diagenesis, OM mineralisation is known to have a significant impact on the partitioning of metals between the solid and dissolved phases of the sediment. The oxic zone in the estuarine and coastal sediment is usually very thin, extending in only a few millimetres or centimetres of the uppermost sediment layer [15,16]; therefore, other oxidants (Mn and Fe oxyhydroxides, sulphates) may play a more important role in the OM degradation [8,17,18,19]. In the suboxic zone of the sediment, the reductive dissolution of Mn and Fe oxyhydroxides occurs, and it is accompanied by the release of associated metals into the pore water. The dissolved metals diffuse upward and downward from the suboxic zone of the sediment. The dissolved metals that diffuse toward the sediment–water interface (SWI), may again be removed from the pore water by adsorption onto or coprecipitation with newly formed Mn and Fe oxyhydroxides or carbonates [13,18,19]. The downward diffusion of the dissolved metals, into the anoxic zone of the sediment where dissolved sulphide is produced by sulphate-reducing bacteria, may be limited by the formation of dissolved metal-sulphide complexes, precipitation of metal sulphide, or coprecipitation with newly formed Fe sulphide minerals [17,18,20,21,22]. Furthermore, the dissolved OM (DOM) may play an important role in the distribution of metals between the solid and dissolved phase in the anoxic zone of the sediment [13,18,23,24]. It is evident that the degradation of OM governs the recycling of metals in the sediments, either through primary diagenetic processes such as reductive dissolution of Mn and Fe oxyhydroxides, or through secondary processes, which may be directly or indirectly linked to the OM degradation, such as the formation of metal precipitates, modification of surface properties of adsorptive particles, and complexation of metals with DOM [25]. Understanding the processes and factors that control the post-depositional recycling of metals in the sediment is crucial in the evaluation of the fate of these contaminants in the aquatic environment. It has been shown that studying the distribution of metals in dissolved (pore water) and solid fractions of the sediment, and in the overlying water column, can give valuable information on biogeochemical processes taking place in the sediment during the early diagenesis [13,25].
This research aimed to gain a better understanding of the metal dynamics in the sediments of a salt wedge estuary that has been partially exposed to anthropogenic impact. The Krka River estuary has attracted the attention of many scientists in the past decades due to its many interesting features, such as a boundary freshwater–seawater interface enriched with trace elements, nutrients, and organic matter [26,27,28,29]. As a result, many papers have been published describing various physical, chemical, and biological aspects of the water column [26,27,28,29,30,31,32,33,34,35,36,37], and to a lesser extent, sediment characteristics [2,38,39,40]. In this study, the geochemical parameters of the pore water were used as indicators of processes that govern the distribution of the metals in the sediment, not only to gain knowledge about the Krka River estuary but also to contribute to the overall understanding of salt wedge estuarine environments.

2. Materials and Methods
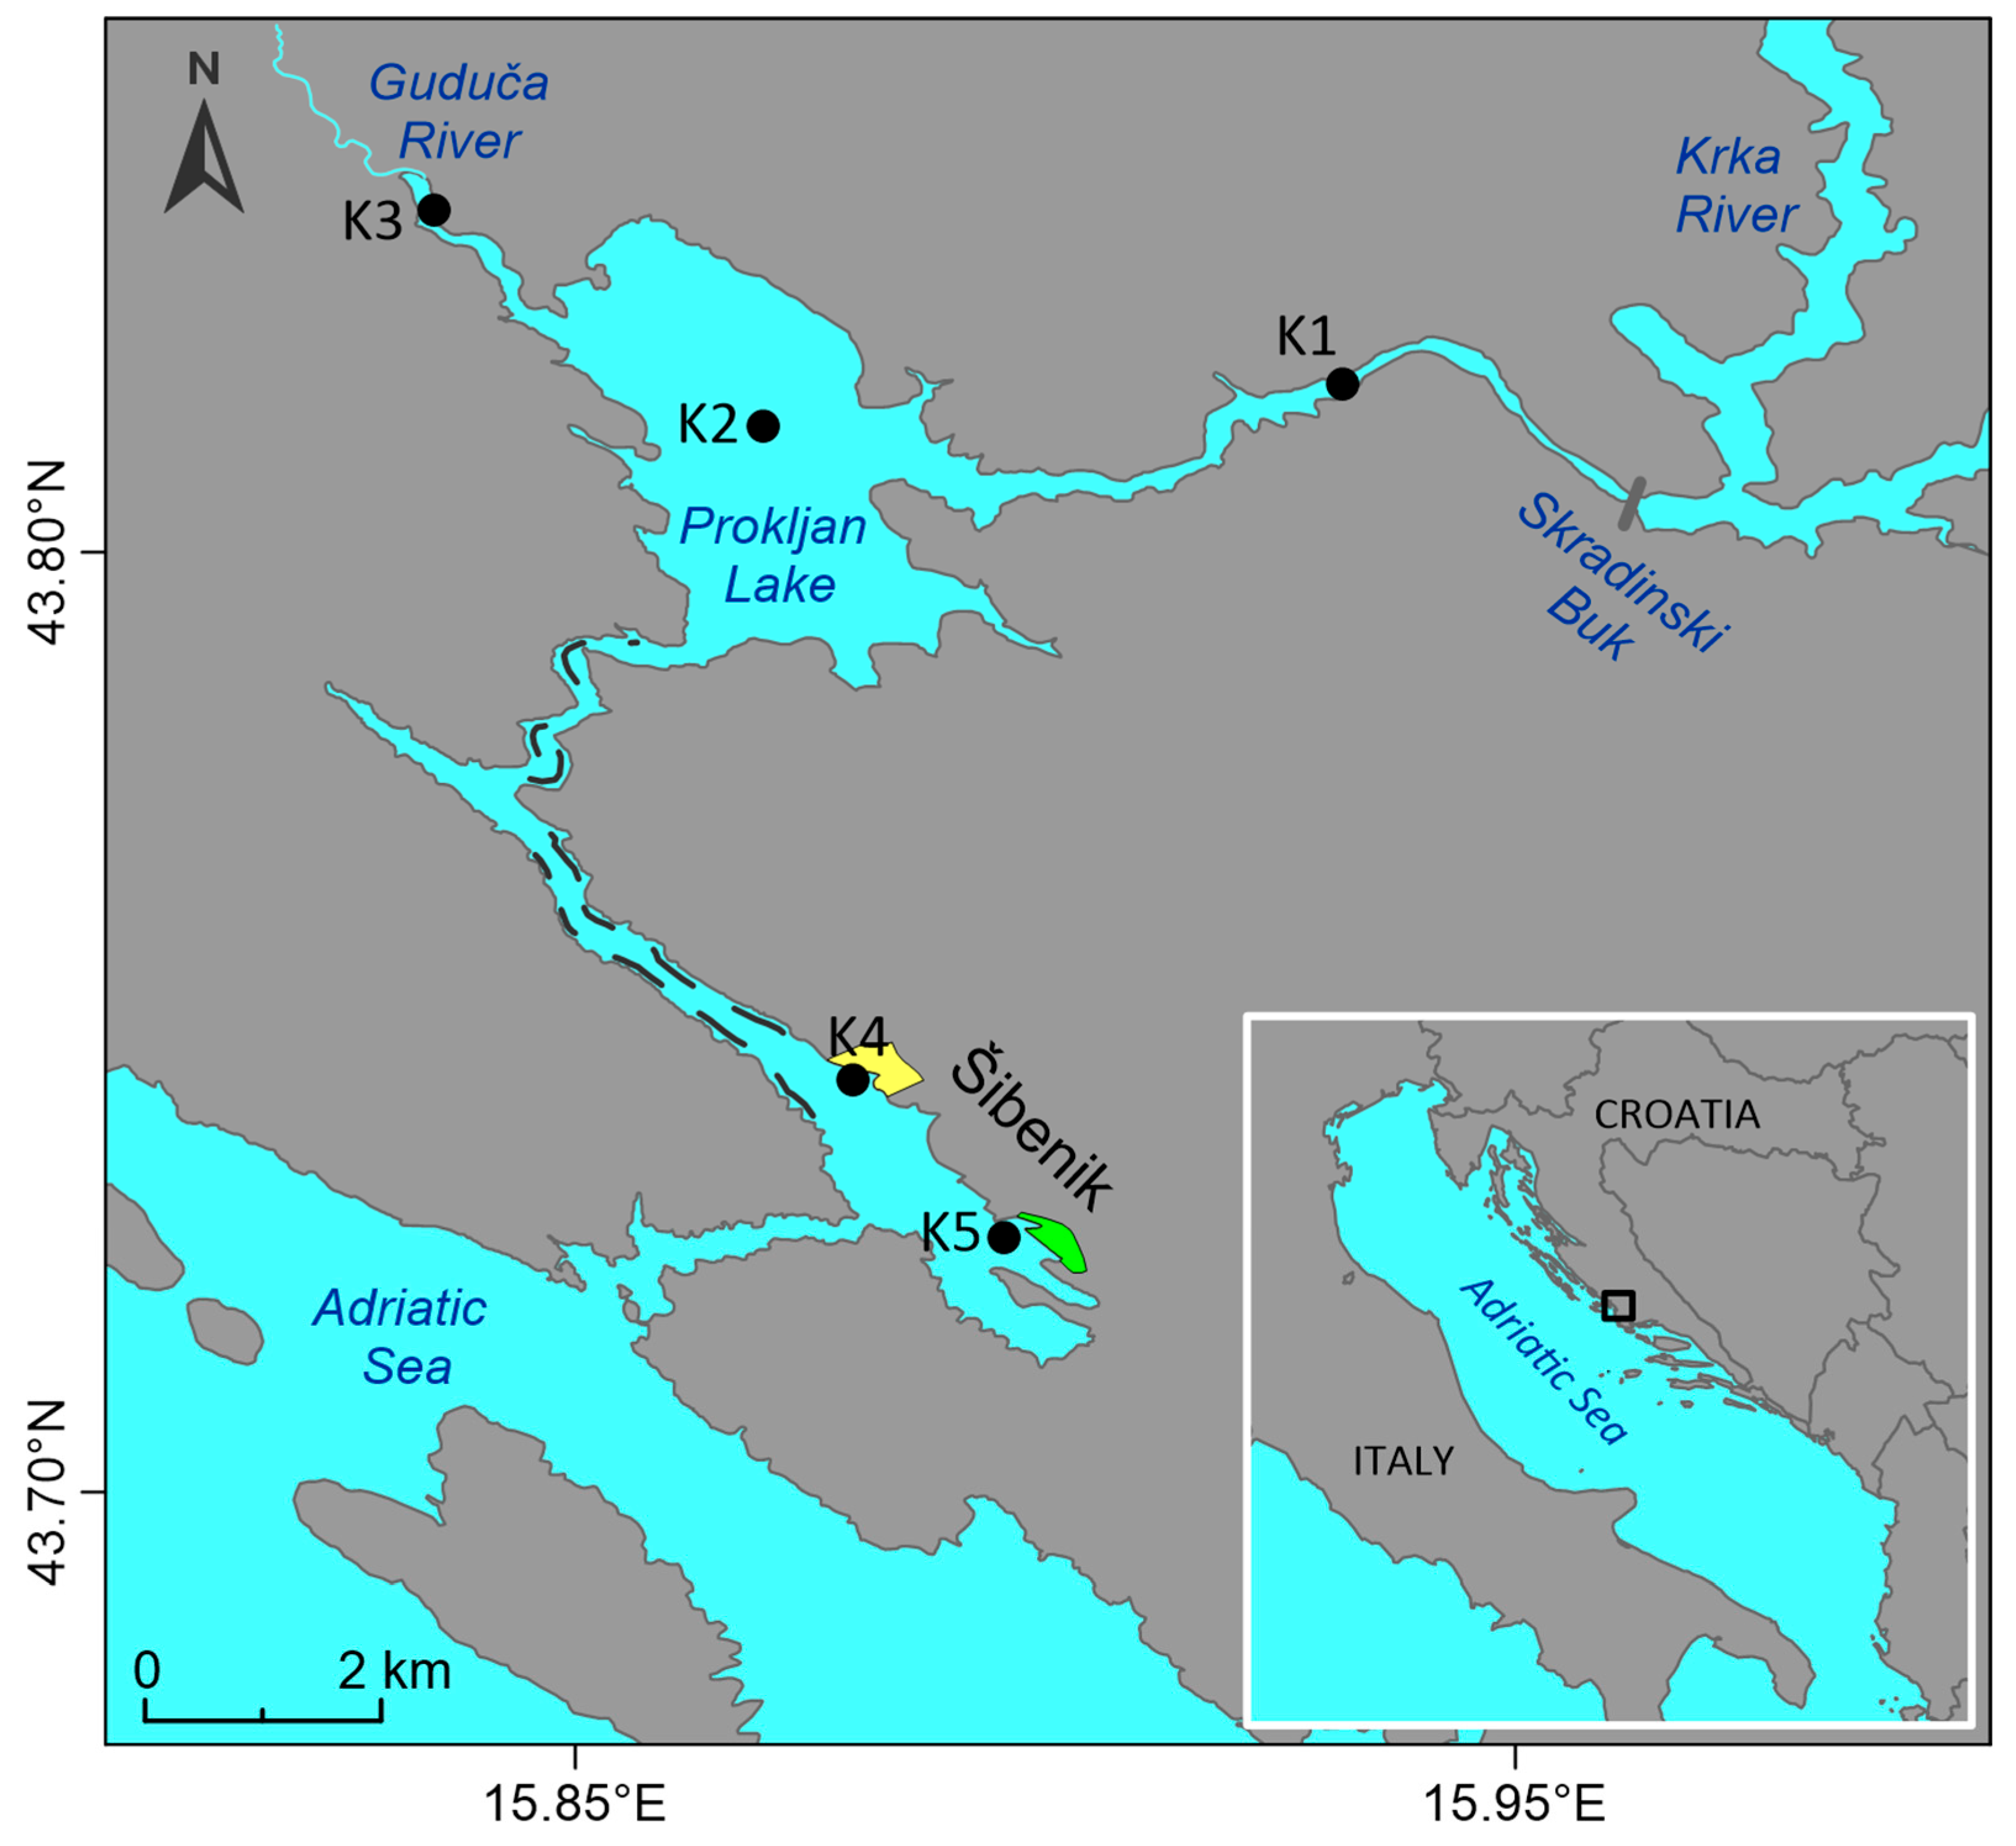
2.1. Study Site

The Krka River estuary (KRE) is located in the central part of the eastern Adriatic coast (Figure 1). It extends approximately 23 km from its mouth to the last waterfall on the Krka River, called Skradinski Buk. The estuary is relatively narrow, with two wider parts, Prokljan Lake and Šibenik Bay [35,36]. One of the main characteristics of the KRE is its permanent vertical stratification, which results from its low tidal range (0.2–0.5 m) and its specific geography. There are three distinct layers, the surface fresh/brackish water moving seaward, the bottom seawater layer moving landward, and a sharp halocline (ranging in thickness from only a few cm up to 1.5 m) in between. The depth of the halocline varies depending on the freshwater input from the Krka River, whose mean annual discharge is ~50 m3 s−1 with considerable seasonal variations ranging from 5 to 480 m3 s−1 [41]. The water exchange time is also dependent on the Krka River inflow; for freshwater, it is 6 to 20 days in winter and up to 80 days in summer, whereas, for seawater, it is 50 to 100 days in winter and up to 250 days in summer [34]. According to Cindrić et al. [33], the amount of suspended particulate matter in the KRE is low (typically less than 6 mg L−1), likely due to the numerous lakes in the freshwater part of the Krka River, which are formed by the tufa barriers and serve as traps for particulates. The main source of terrigenous particulate material that enters the KRE is a small tributary Guduča River, which flows into Prokljan Lake. The catchment area of the Guduča River is mainly composed of Upper Eocene-Oligocene flysch and flysch-like deposits, and there are no tufa barriers along the watercourse that could retain particulate material [38,41].
Based on the sediment characteristics, the estuary can be divided into two parts, the upper and lower estuary. In the upper estuary, the input of particulate matter through the small tributary Guduča strongly influences the type and rate (2–5 mm year−1 [42]) of sedimentation, whereas, in the lower estuary, the input of terrigenous particles is very low, the sedimentation rate is typically lower than 1 mm year−1 [42], and the marine carbonate sedimentation predominates [39]. There is also a difference in the anthropogenic impact. The upper estuary is rather unpolluted because there are only a few small settlements in this area, with no industrial facilities. Furthermore, the freshwater part of the Krka River, which precedes the estuary, is a national park, therefore there are no significant contamination sources upstream of the estuary. The possible sources of contamination in this part of the estuary are agricultural activities and nautical tourism. In the lower estuary, however, sediment contamination with metals was recorded, linked to the anthropogenic impact of the city of Šibenik [40,43,44,45,46,47]. The major sources of contamination in the lower estuary were the Fe-Mn industry, the bulk cargo port (main cargo raw phosphates and artificial fertilisers), untreated wastewater discharge, and the repair shipyard [47]. The Fe-Mn factory was operating for 50 years, until the mid-nineties, and during that time, no pollution control measures were implemented. Industrial fumes and dust were emitted directly into the air while metallurgical slag was partially spread around or deposited near the smelter [48]. Although production stopped 30 years ago, and the remediation of the area was completed in 2013, the impact of factory activities can still be seen in the surface sediment [47]. Moreover, for many years, untreated communal and industrial wastewater was discharged into the estuary from 33 separate outflows along the waterfront. Since 2007, wastewater has been treated and discharged into the open sea. The shipyard activities are a proven major source of Hg for the lower estuary [49].

2.2. Sampling and Sample Pretreatment

Sediment cores were sampled at 5 locations in the KRE (the upper estuary: K1–K3; the lower estuary: K4–K5) (Table S1). Sampling was performed in the summer and winter of 2017. Sampling locations were chosen to represent different sedimentation areas within the estuary. Location K1 represents carbonate sedimentation under the influence of the Krka River; K2 represents sedimentation of a mixture of carbonate and terrigenous particles without anthropogenic influence; K3 represents sedimentation of terrigenous particles; K4 represents marine carbonate sedimentation with the influence of the Fe-Mn industry; K5 represents marine carbonate sedimentation with the former wastewater discharge outflow and port activity. The duplicate undisturbed sediment cores (diameter = 10 cm, length = 60 cm, Plexiglas) were sampled by a scuba diver at each location. The first core was used for sediment slicing, i.e., collecting subsamples of pore water and sediment, whereas the second core was used for sampling the overlying water. At each location, the depth profiles of the physicochemical parameters (dissolved oxygen, pH, temperature, salinity) in the water column were measured using a multiparameter probe (EXO2, YSI, Yellow Springs, OH, USA).
The sediment cores were transferred to the laboratory immediately after sampling and processed on the same day. Processing of the first core was performed in a glove box under inert conditions (N2) to prevent oxidation of the samples. To retrieve pore water and sediment samples, the core was sliced into 2 cm thick sections. Each subsample was placed in 3 × 50 mL centrifuge tubes and centrifuged (Eppendorf Centrifuge 5804, Hamburg, Germany) at 4000 rpm for 15 min to extract the pore water from the sediment. The pore water was filtered (cellulose-nitrate syringe filters, 0.2 μm, Sartorius, Göttingen, Germany) and stored in different containers depending on the planned analyses. For measurement of dissolved organic carbon (DOC) and inorganic carbon (DIC), samples were stored in 24 mL glass tubes with Teflon/silicon septum, preserved with 20 μL of 1 M NaN3 (Sigma Aldrich, St. Louis, MO, USA), and kept at 4 °C until analysis. The glass tubes were pre-cleaned in the following manner: cleaned with 10% HCl, rinsed with MQ (Milli-Q water, 18.2 MΩ, Millipore, Burlington, VT, USA), and calcined at 450 °C for 4 h. For the multi-elemental analysis, pore water samples were acidified with ultrapure concentrated HNO3 (ROTIPURAN® Supra, Carl Roth, Karlsruhe, Germany) to pH < 2. For the determination of orthophosphates (PO43−), ammonium (NH4+), sulphates (SO42−), and dissolved sulphides (∑HS) samples were stored in 2 mL microtubes. To preserve ∑HS, 0.5 mL of the trap solution (ZnCl2 (Acros Ogranics, Geel, Belgium), gelatine (Fisher Scientific UK, Loughborough, UK), chloroform (Carlo Erba, Emmendingen, Germany) [50]) was inserted into the microtube before adding the sample. The sediment subsamples were stored at −20 °C until further analysis.
The overlying water samples were collected from the second sediment core (the bottom water was collected with sediment in the core) with the help of a homemade syringe system, which consisted of six 60 mL syringes interconnected by Teflon tubes two by two, which allowed simultaneous sampling of 120 mL of water at 3 different levels (2 cm, 5 cm, and 15 cm from the sediment surface). The overlying water samples were processed in the same way as pore water samples.

2.3. Porewater and Overlying Water Analysis

For the determination of trace element concentrations (Fe, Mn, Co, Cu, Zn, Pb, U, Mo, As) in pore water and overlying water samples, high resolution inductively coupled plasma mass spectrometer (HR ICP-MS, Element 2, Thermo Finnigan, Bremen, Germany) was used. To minimise the matrix effect, samples were diluted 10 times with 2% HNO3 (ROTIPURAN® Supra, Carl Roth, Karlsruhe, Germany). Indium was used as an internal standard. A matrix matching (10× diluted seawater) external four-point calibration (0, 0.1, 1, and 10 μg L−1) was used for quantification of trace metals. For the validation of the analysis, the nearshore seawater reference material for trace metals (CASS-5, National Research Council of Canada, Ottawa, ON, Canada) was used. Average concentrations (n = 68) obtained in CASS-5 CRM agreed with the certified values (Table S2).
A Shimadzu TOC-VCSH analyser (Shimadzu, Kyoto, Japan) was used to measure DOC and DIC concentrations. Calibration was performed with potassium hydrogen phthalate (C8H5KO4) and hydrogen sodium carbonate/sodium carbonate (NaHCO3/Na2CO3) standard solutions, with an accuracy of 0.02 mgC L−1 [27,51]. The analytical validity of the method was confirmed by measuring certified reference material ION-96.4 (Environment Canada, Burlington, ON, Canada). All the measured concentrations agreed with the certified values.
Concentrations of PO43−, NH4+, SO42−, and ∑HS were measured spectrophotometrically by UV/VIS spectrophotometer (Lambda 45, Perkin Elmer, Waltham, MA, USA). The SO42− concentrations were determined by the turbidimetric method. Briefly, 40 uL of 1 M HCl and 200 uL of reagent (0.4 M BaCl2 (Suprapur®, Merck, Darmstad, Germany) and Tween® 20 (Fisher Scientific, Geel, Belgium) diluted by 4) were mixed with 2 mL of sample previously diluted by factor 50. The turbidity was recorded at 650 nm. The NH4+ concentrations were measured using the Spectroquant® 1.14752 kit (Merck, Darmstadt, Germany). The ∑HS was analysed using Spectroquant® Kit 1.14779 (Merck, Darmstadt, Germany). The PO43− concentrations were measured using the method developed by Murphy and Riley [52,53].

2.4. Sediment Analysis

The semi-total element (Fe, Mn, Co, Cu, Zn, Pb, U, Mo, As, S, P) concentrations in the sediment solid phase were determined by HR ICP-MS. Before analysis, samples were freeze-dried, sieved < 2 mm, grounded using Planetary Ball Mill PM 100 (Retch, Haan, Germany), and digested with aqua regia (~100 mg of sediment, 2.5 mL of HNO3 and 7.5 mL of HCl (Trace Analysis grade, Fisher Scientific, Waltham, MA, USA)), in the UltraWAVE Single Reaction Chamber Microwave Digestion System (Milestone Srl, Sorisole, Italy) as described in Cukrov et al. [49]. Digested samples were diluted with 2% HNO3 (Suprapur®, Merck, Darmstadt, Germany). Indium was used as an internal standard. The marine sediment reference material (PACS-2, National Research Council of Canada) was used for the validation of the digestion method (Table S3).
Organic carbon (Corg) in the sediment of the KRE was measured using a Flash 2000 CHNS Analyzer equipped with MAS™ 200R autosampler (Thermo Scientific, Wathman, MA, USA). For the analysis, 10–15 mg (core K5—5 mg) of sediment was inserted into the combustion reactor together with an appropriate amount of oxygen. The sediment was not treated for the analysis of N and TC. Before analysis of Corg, sediment was treated with HCl (6 M, Trace Analysis grade, Fisher Scientific, Waltham, MA, USA) to remove the inorganic C. For the validation of analysis, the Soil NC Reference Material (Thermo Scientific, Wathman, USA) was used. The measured concentrations agreed with the certified values.

2.5. The Benthic Diffusive Fluxes

The benthic diffusive fluxes of metals from the sediment to the overlying water column were calculated using Fick’s first law of diffusion:
F l u x = Φ D s e d 𝜕 C 𝜕 x ,
where Φ is porosity, Dsed is the diffusion coefficient in the pore water, and (∂C/∂x) is the concentration gradient at the SWI. The porosity was calculated based on bulk density and water content [54] and was >0.7 in the uppermost part of all sampled cores. Therefore, Dsed was calculated using the following empirical equitation [55]:
D s e d = Φ 2 D ( Φ > 0.7 ) ,
where D is the diffusion coefficient in water adjusted to in situ temperature using the Stokes–Einstein equation. Diffusion coefficients were taken from Li and Gregory [56], for V it was assumed to be equal to the one of Mo (MoO42−) [57]. The concentration gradient was estimated from the concentration difference between the uppermost pore water sample and the overlying water sample divided by the depth of the uppermost pore water sample (2 cm). The positive fluxes indicate diffusion from the overlying water into the sediment, while negative fluxes indicate the release of the metal from the sediment to the overlying water column.

3. Results

3.1. Pore Water Characterisation

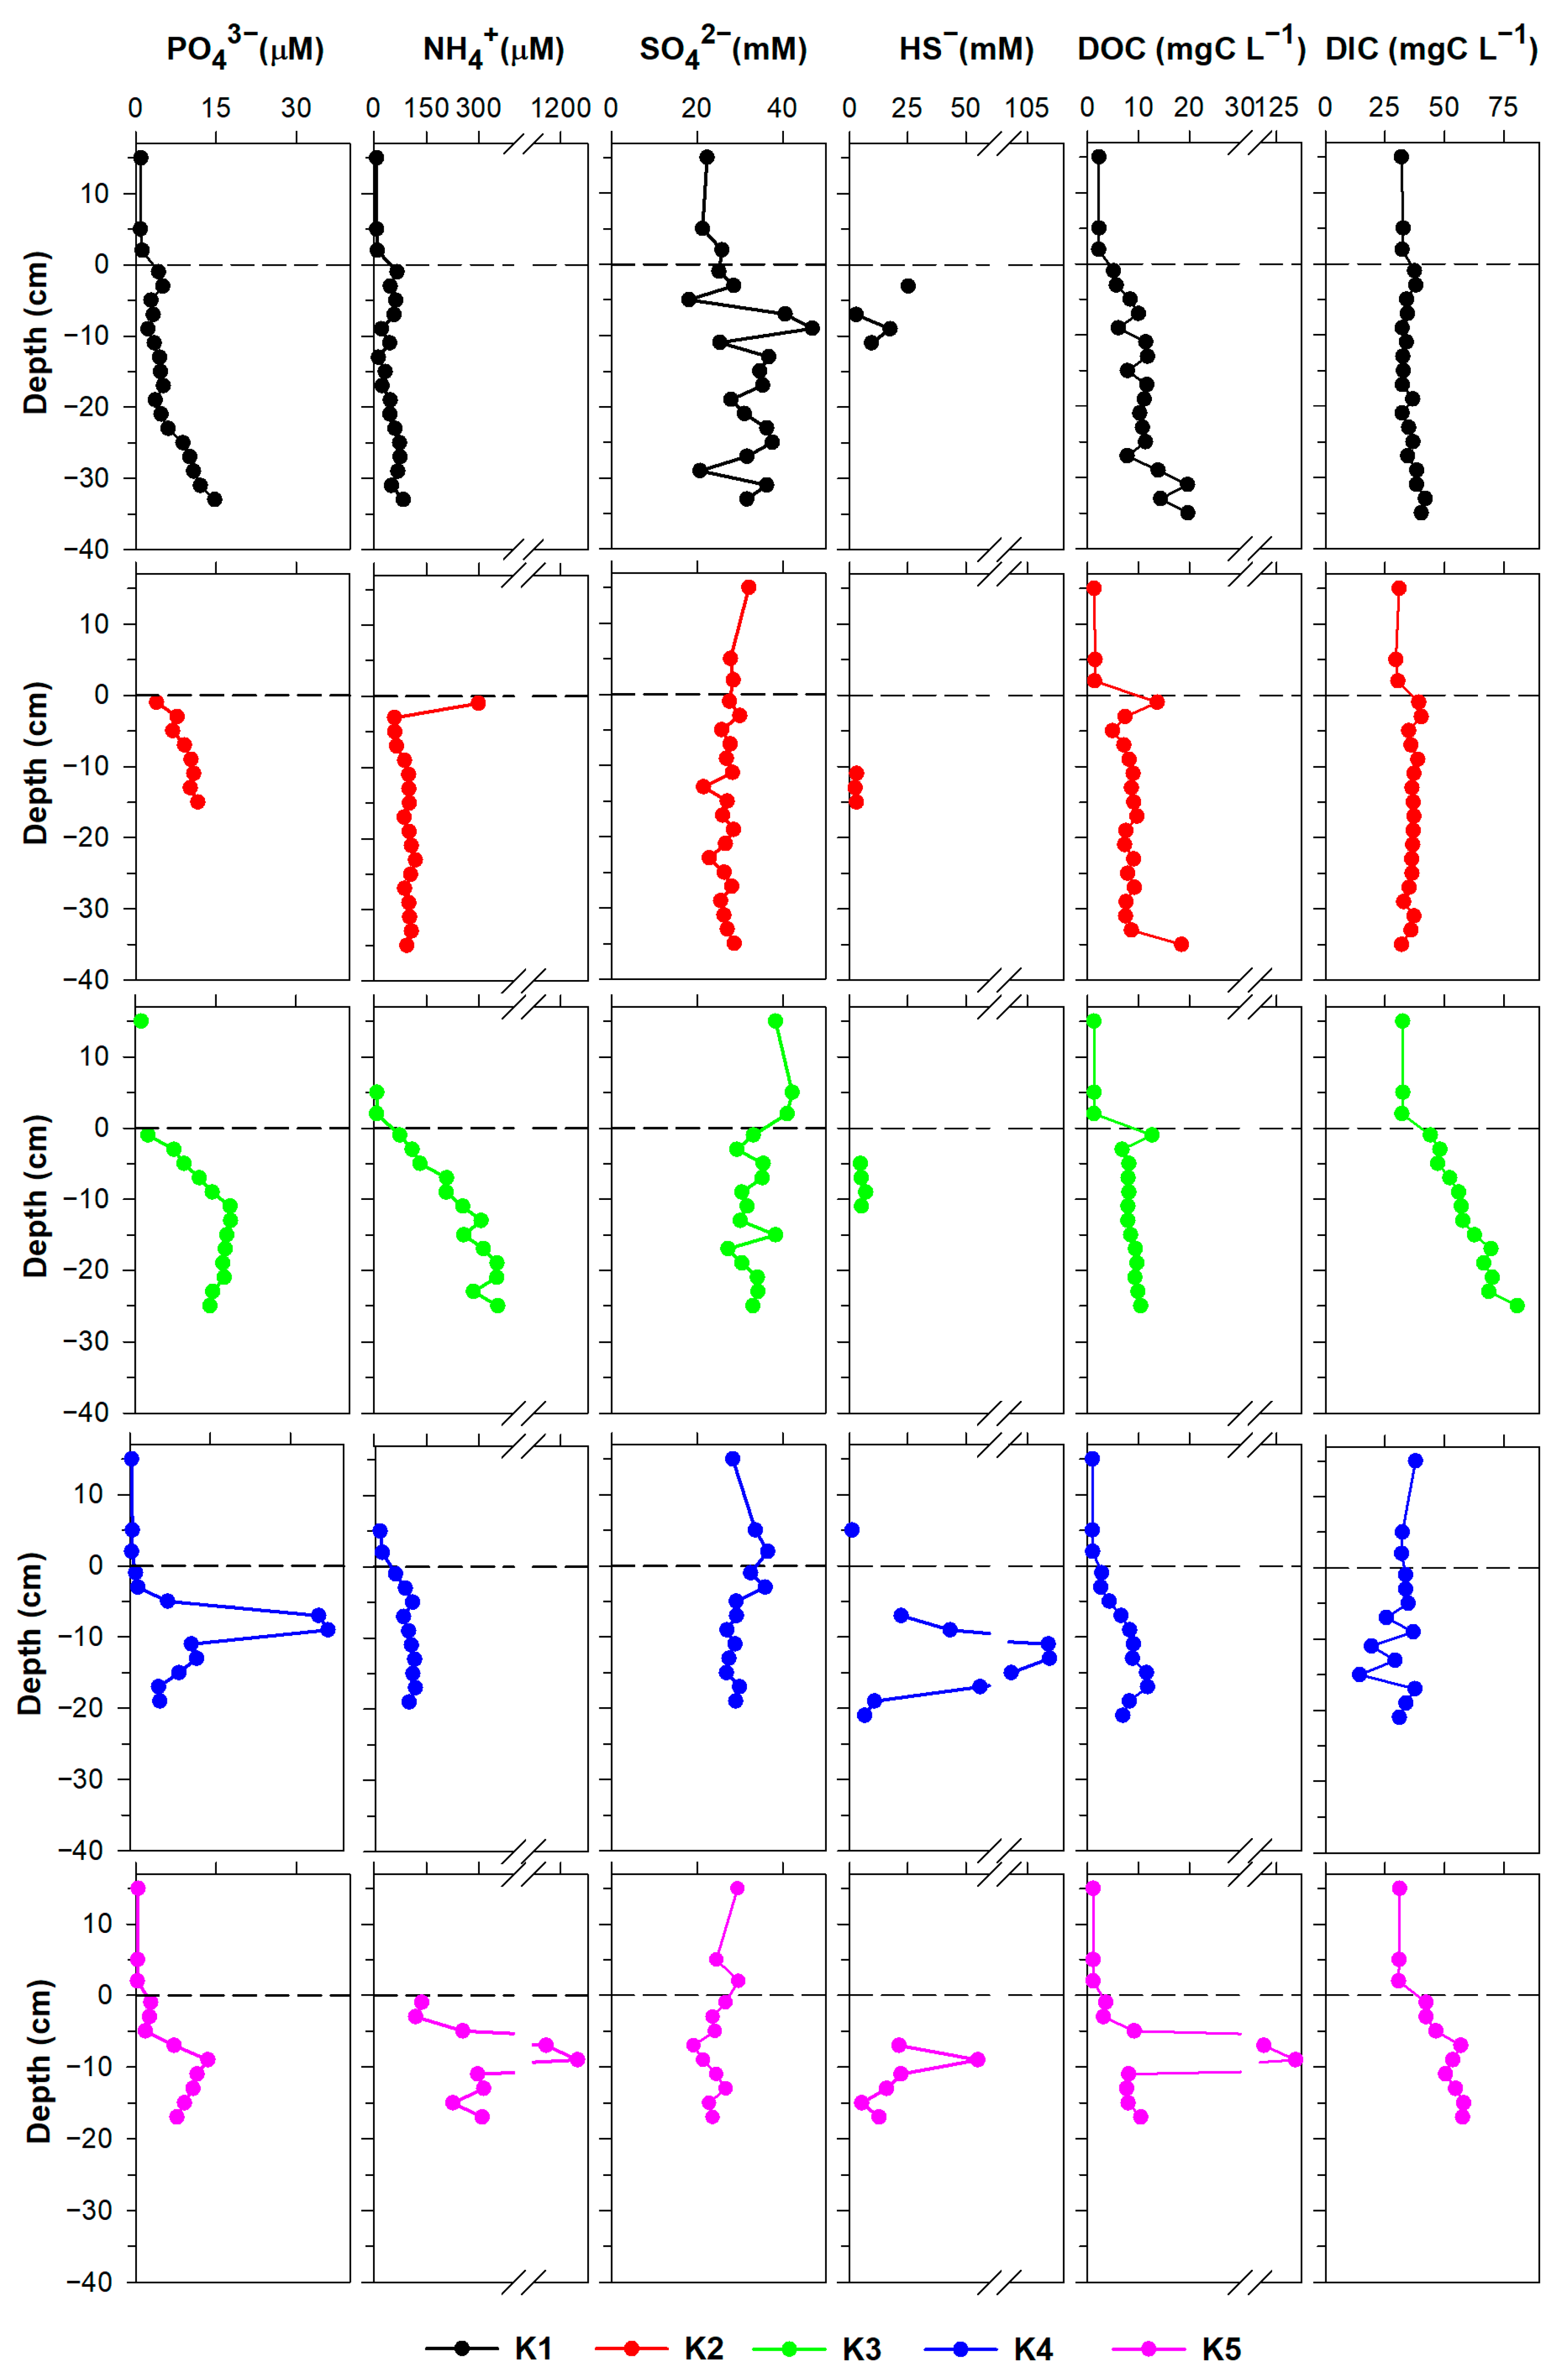
3.1.1. Major Dissolved Species
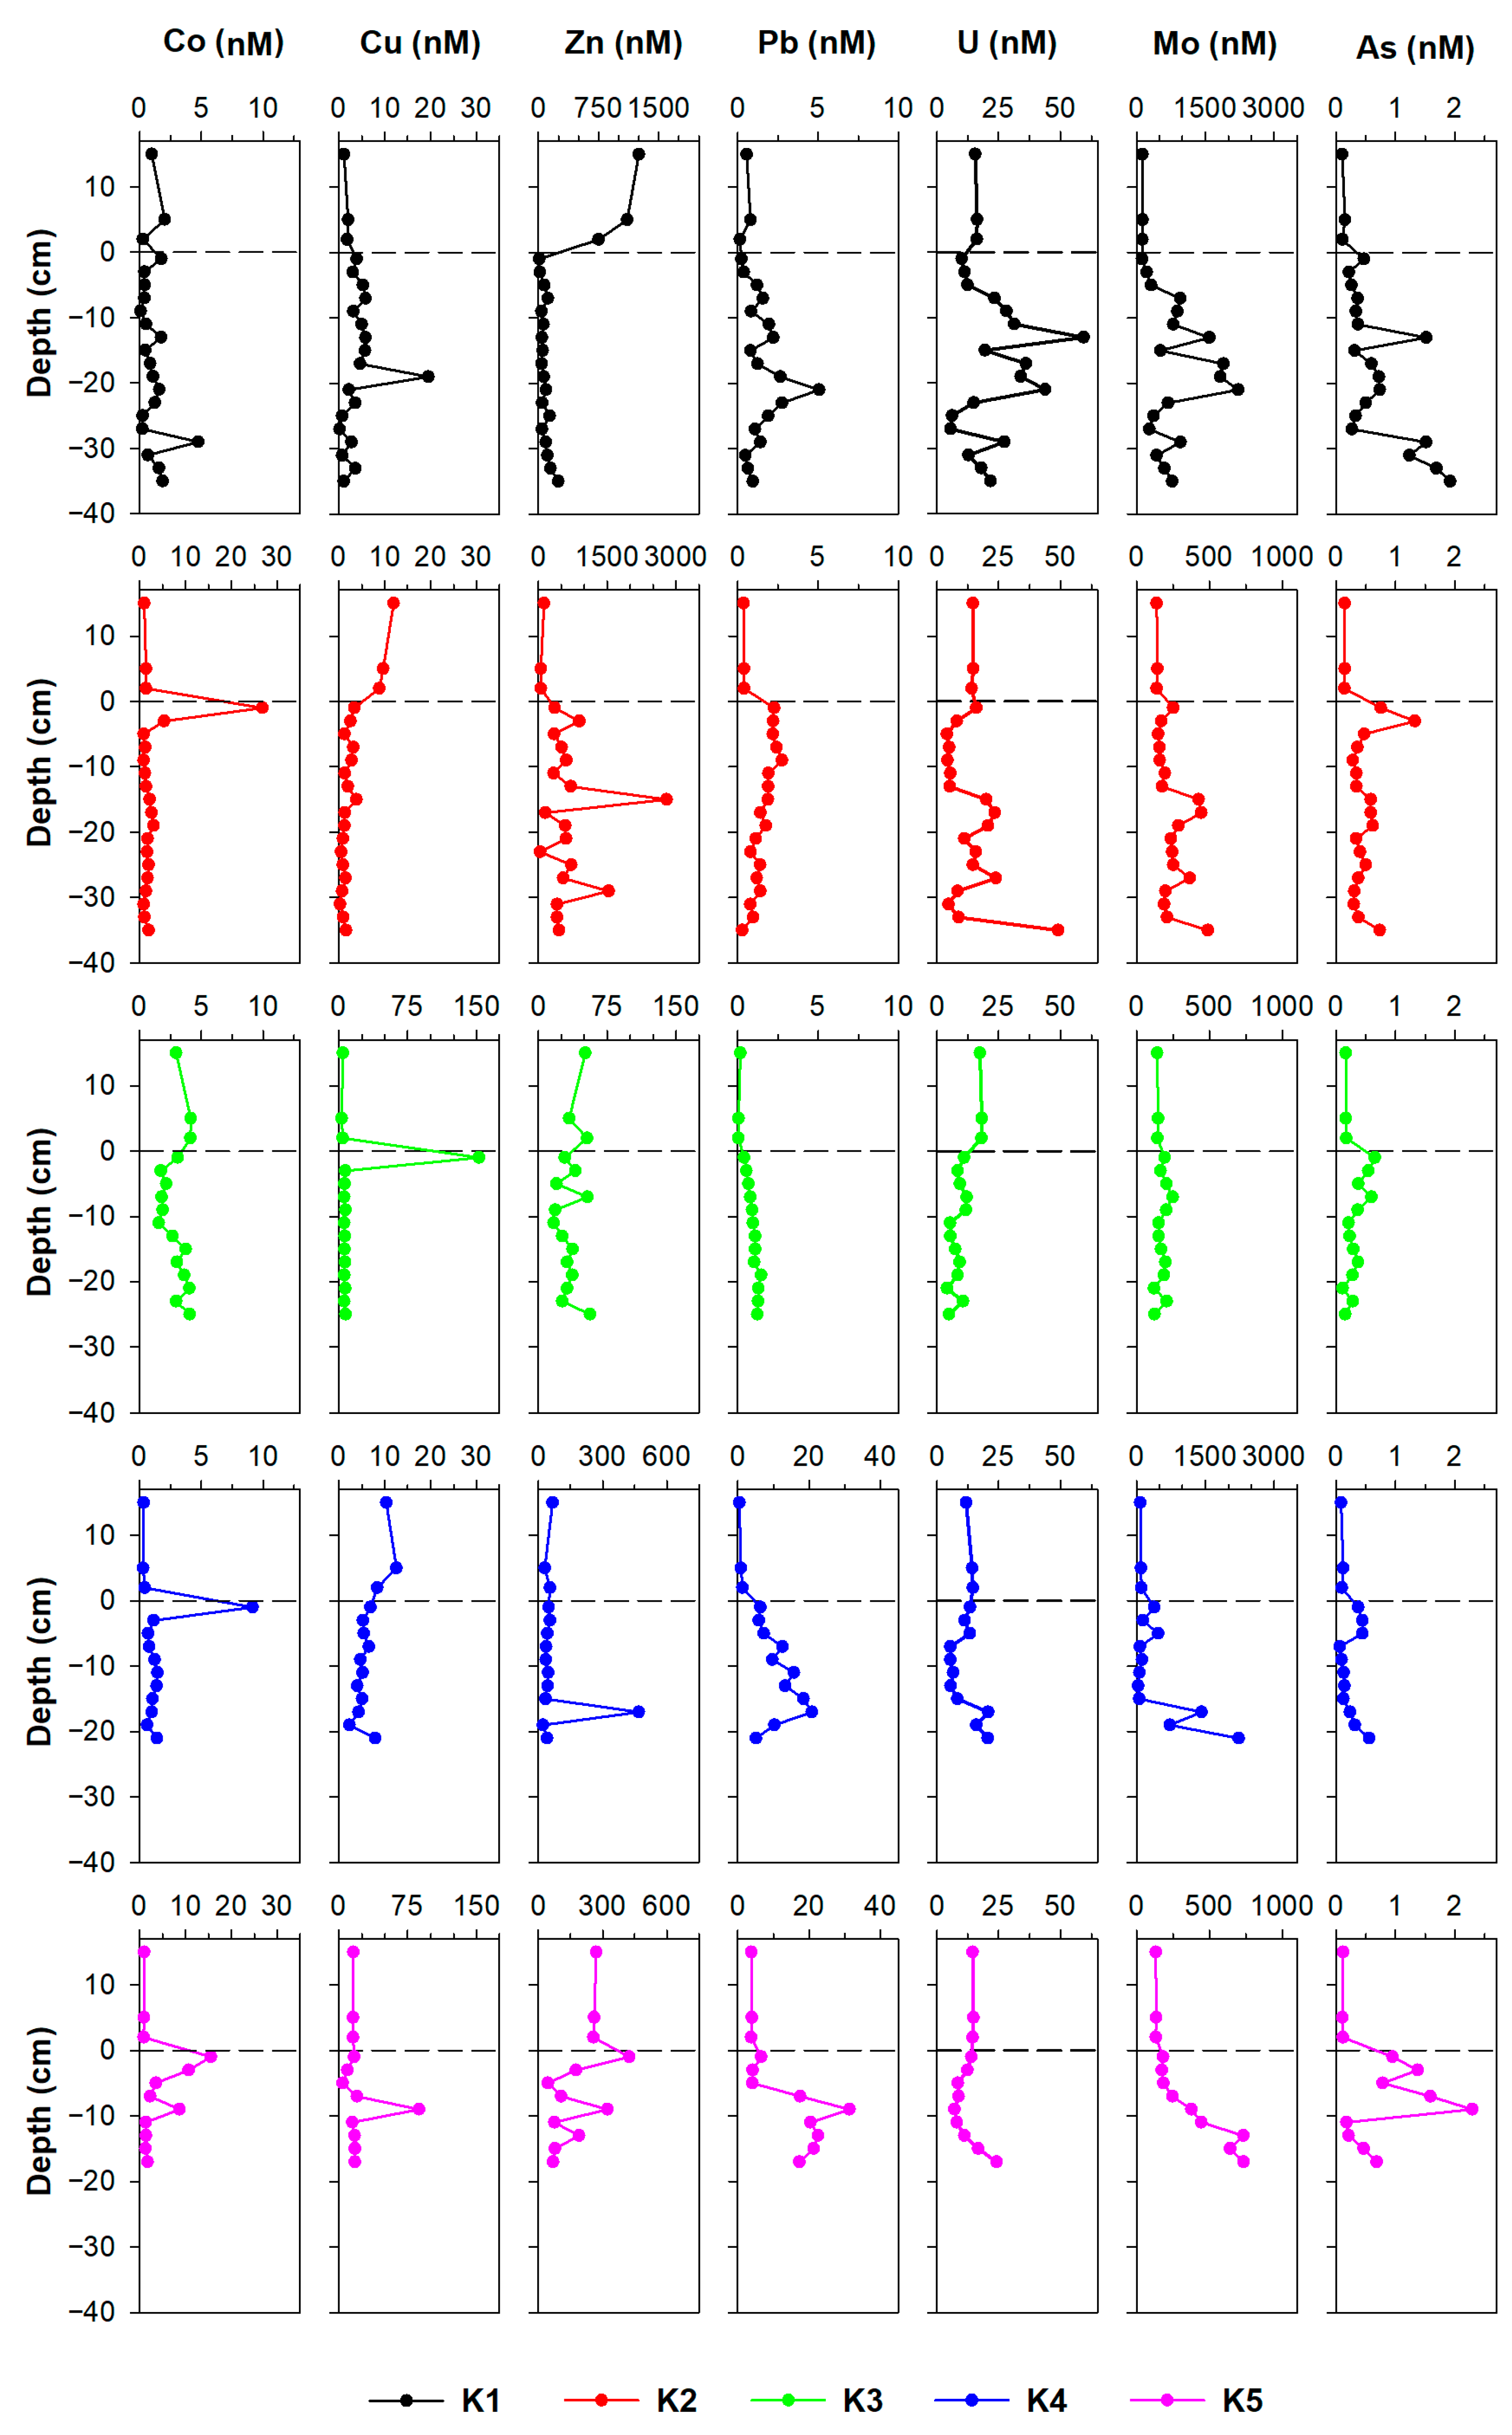
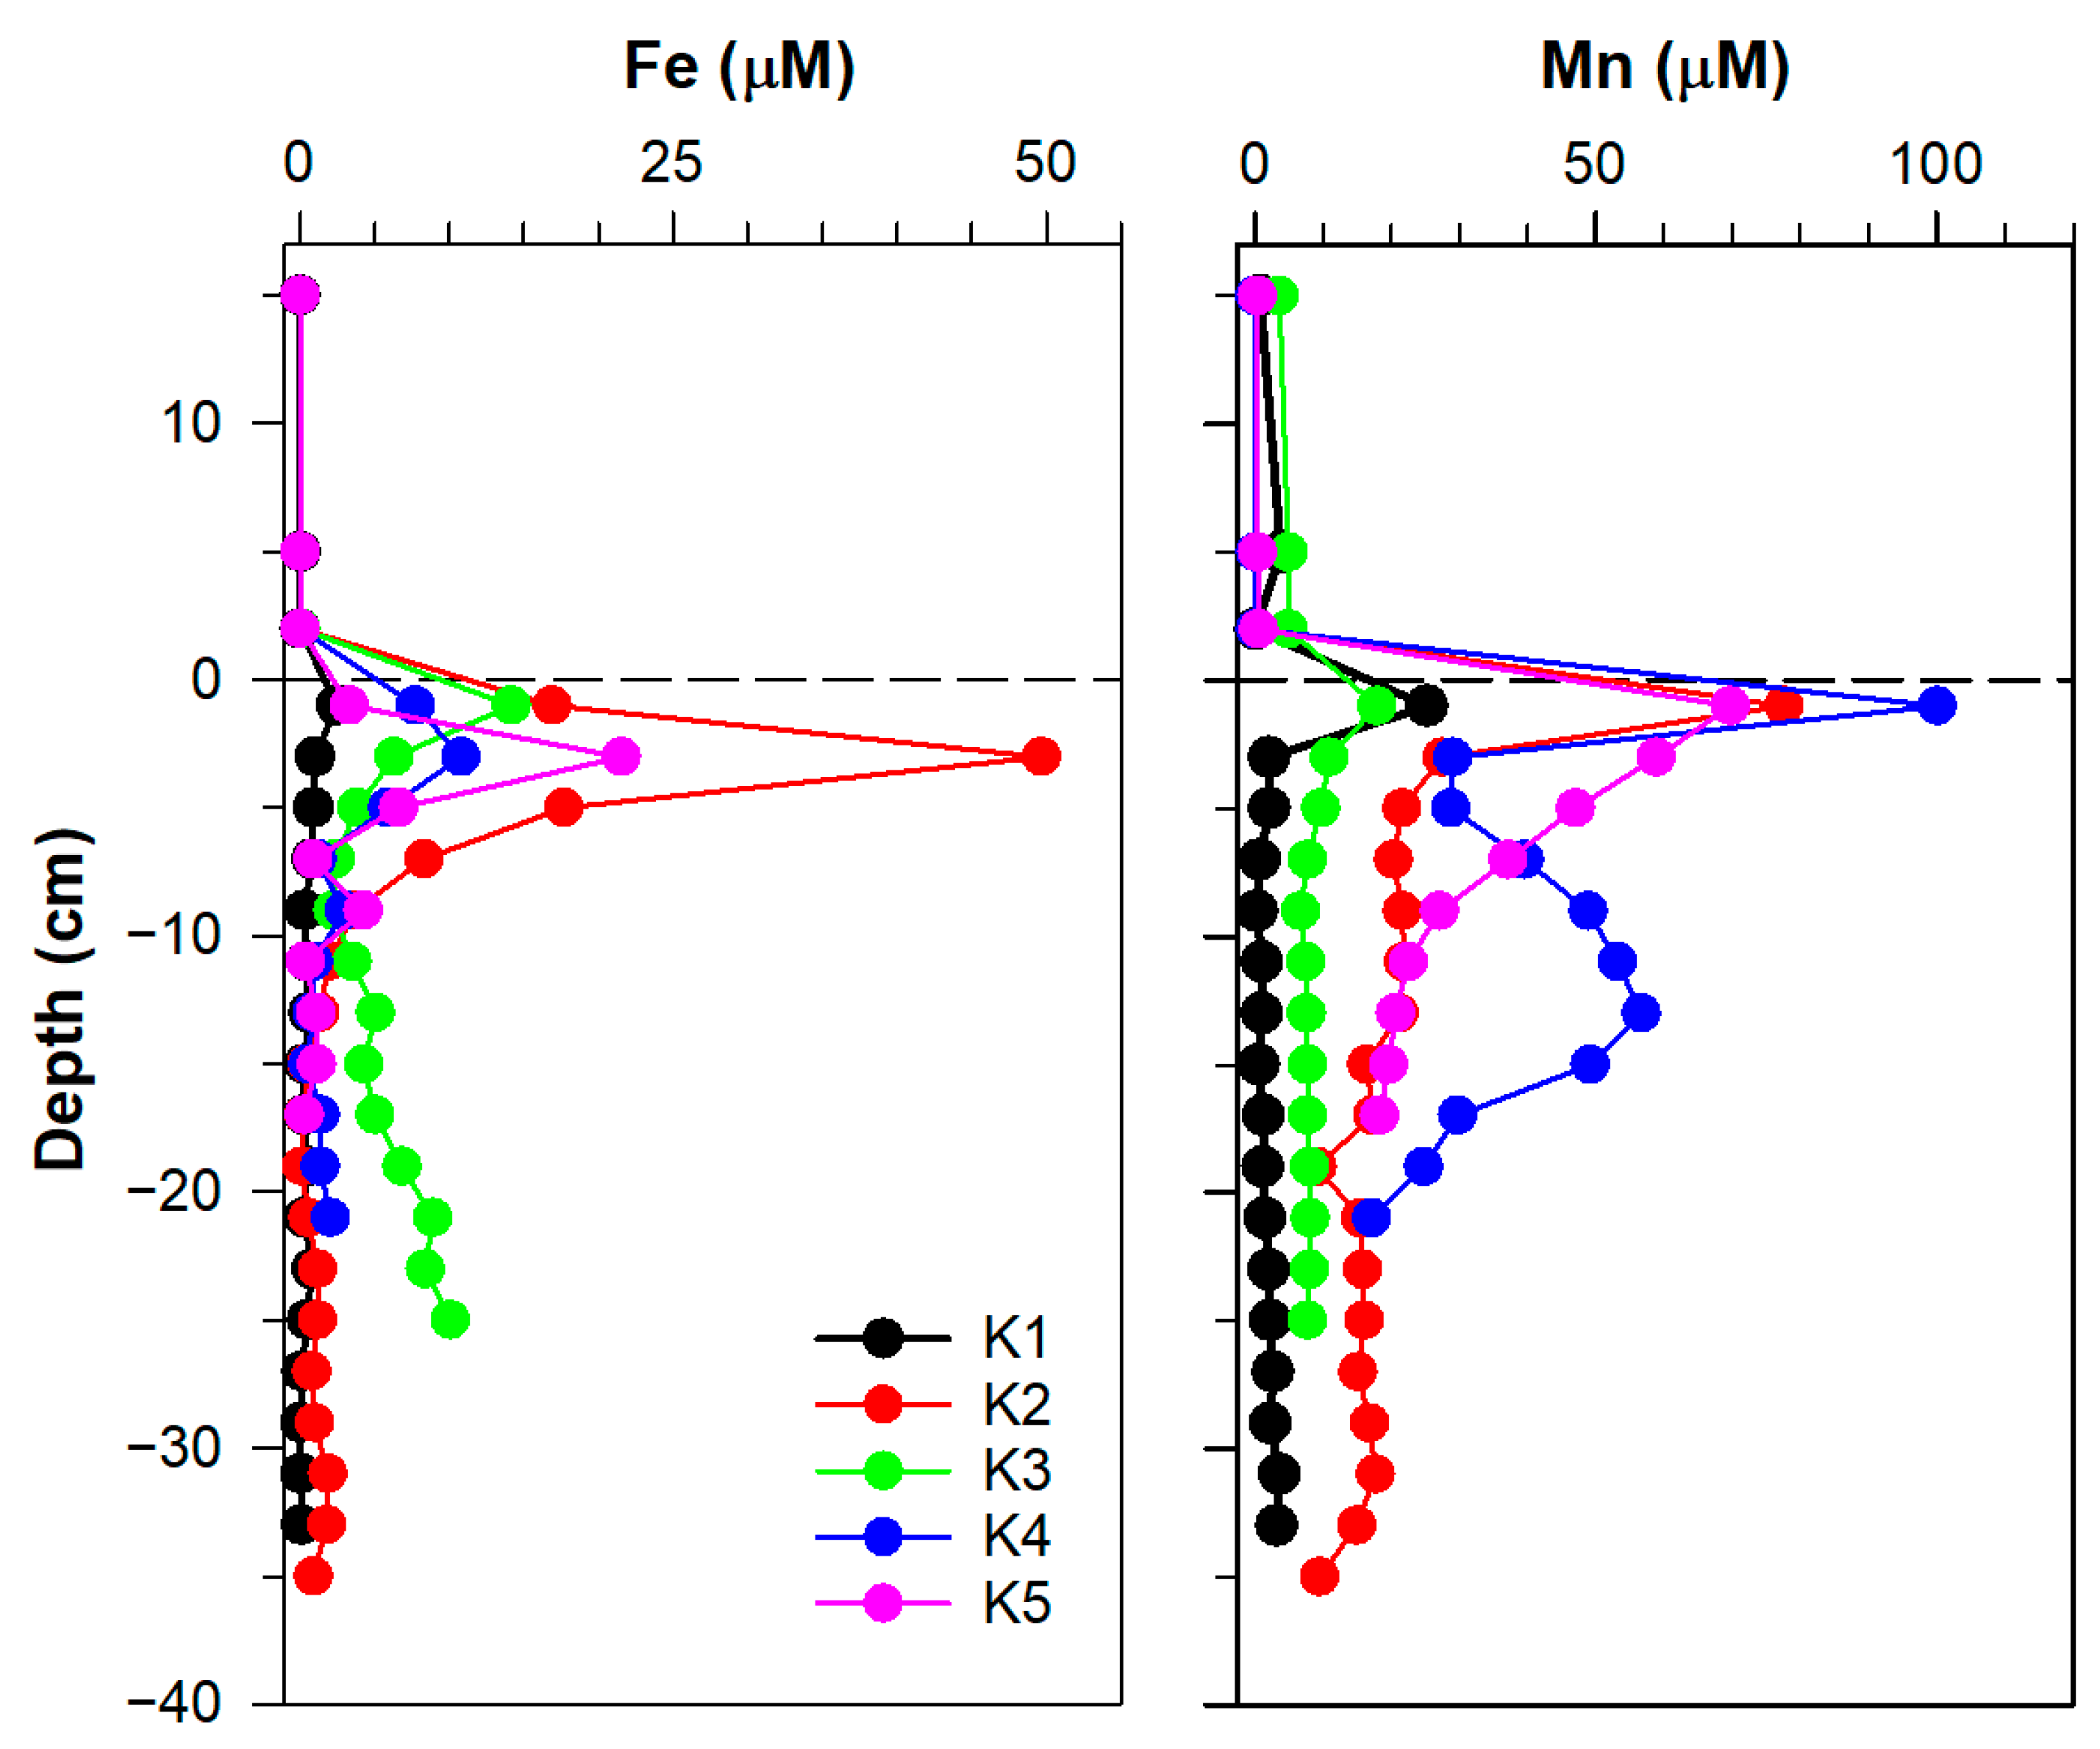
The vertical profiles of PO43−, NH4+, SO42−, ∑HS, DOC, and DIC in the overlying and pore water at five sampling sites are shown in Figure 2. All these parameters, except SO42, had lower concentrations in the overlying water than in the pore water. In some cases, they were even below the detection limit of the method, such as in the case of NH4+ at sites K2 and K5, and ∑HS at all sites. The SO42− concentrations ranged between 7.81 and 43.8 μM in the overlying water and between 18.1 and 46.9 μM in the pore water.
The obtained concentration ranges for PO43− were 0.28–1.14 μM in the overlying water and 1.06–37.0 μM in the pore water. The vertical distribution pattern was similar on all sites, except at K1. The PO43− increased downwards until reaching the highest value at depths ~10–15 cm and decreased afterwards. At site K1, PO43− concentrations increased gradually with depth, and the highest value was recorded in the bottommost sediment core layer. The NH4+ concentrations were found in the range of 7.22–23.9 μM in the overlying water and 12.4–1262 μM in the pore water. At sites K1, K2, and K3 the vertical profiles of NH4+ were quite uniform with concentrations below 120 μM, except for the sharp peak at the SWI at site K2. At site K3 there was a gradual increase of concentrations until 15 cm of depth, followed by a slight decrease until the bottom of the core. The highest NH4+ concentrations in the estuary were found at site K5, where a marked peak was observed at a depth of 6–10 cm. The ∑HS was detected at all sites, but not in all sediment layers. The measured concentration range in the pore water was 2.43–111 μM, with the highest concentrations found at site K4, followed by site K5. In the overlying water, ∑HS was detected only in one sample at site K4.
DOC and DIC concentrations measured in the pore water were substantially higher than those measured in the overlying water column, especially the DOC. The obtained ranges in the overlying water column were 0.973–2.26 mgC L−1 for DOC and 29.6–37.8 mgC L−1 for DIC, whereas the ranges in the pore water were 2.61–137 mgC L−1 for DOC and 14.4–80.6 mgC L−1 for DIC (Figure 2). There was intra-site variation in the vertical profiles of DOC; at the sites K2 and K3 there was a marked peak just below the SWI, whereas at the other sites higher values were observed deeper in the sediment (10 cm and deeper). The DIC vertical profiles at sites K1 and K2 were quite uniform, while at sites K3 and K5, values increased in the downward direction.
The downcore profiles of dissolved Fe and Mn are given in Figure 3. The dissolved Mn concentrations in the overlying water were 0.058–4.94 μM and in the pore water 0.310–100 μM. The Mn vertical distribution pattern was similar at all sites, with the marked peak just below the SWI. At site K4, there was an additional increase in Mn concentrations at a depth of 10–15 cm. The dissolved Fe followed a similar distribution as Mn, with a sharp increase below the SWI, at the sites K1 and K3 in the same layer as Mn, and at the sites K2, K4, and K5 in the following sediment layer (2–4 cm). The obtained ranges in the overlying water were 0.008–0.053 μM and in the pore water 0.057–49.7 μM.

3.1.2. Trace Metals

Trace element concentrations in the overlying water were found in the following ranges: 0.271–4.14 nM for Co, 1.09–15.6 nM for Cu, 30.0–1251 nM for Zn, 0.024–3.91 nM for Pb, 11.9–18.1 nM for U, 79.3–148 nM for Mo, and 0.085–0.171 nM for As (Figure 4 and Figure S1, Tables S4–S8).
Trace element concentrations in the pore water were generally higher than in the overlying water, except in the case of U. The obtained ranges were as follows: 0.068–26.8 nM for Co, 0.126–153 nM for Cu, 11.5–2793 nM for Zn, 0.222–31.3 nM for Pb, 4.09–59.4 nM for U, 38.8–2228 nM for Mo, and 0.065–2.29 nM for As (Figure 4 and Figure S1, Tables S4–S8). From the pore water profiles, it can be seen that there is considerable variation from site to site, and from element to element. The sharp increase in concentration at the SWI can be seen for Co at sites K2, K4, and K5, for Cu at site K3, and for As at all five sites. However, in many cases, the highest concentrations were found deeper in the sediment, at about 10 cm depth and more. Vertical profiles of U show a higher concentration in the overlying water than in the first centimetres below the SWI. Thereafter, concentrations vary but generally increase with depth and exceed those observed in pore water.

3.2. Sediment Characterisation

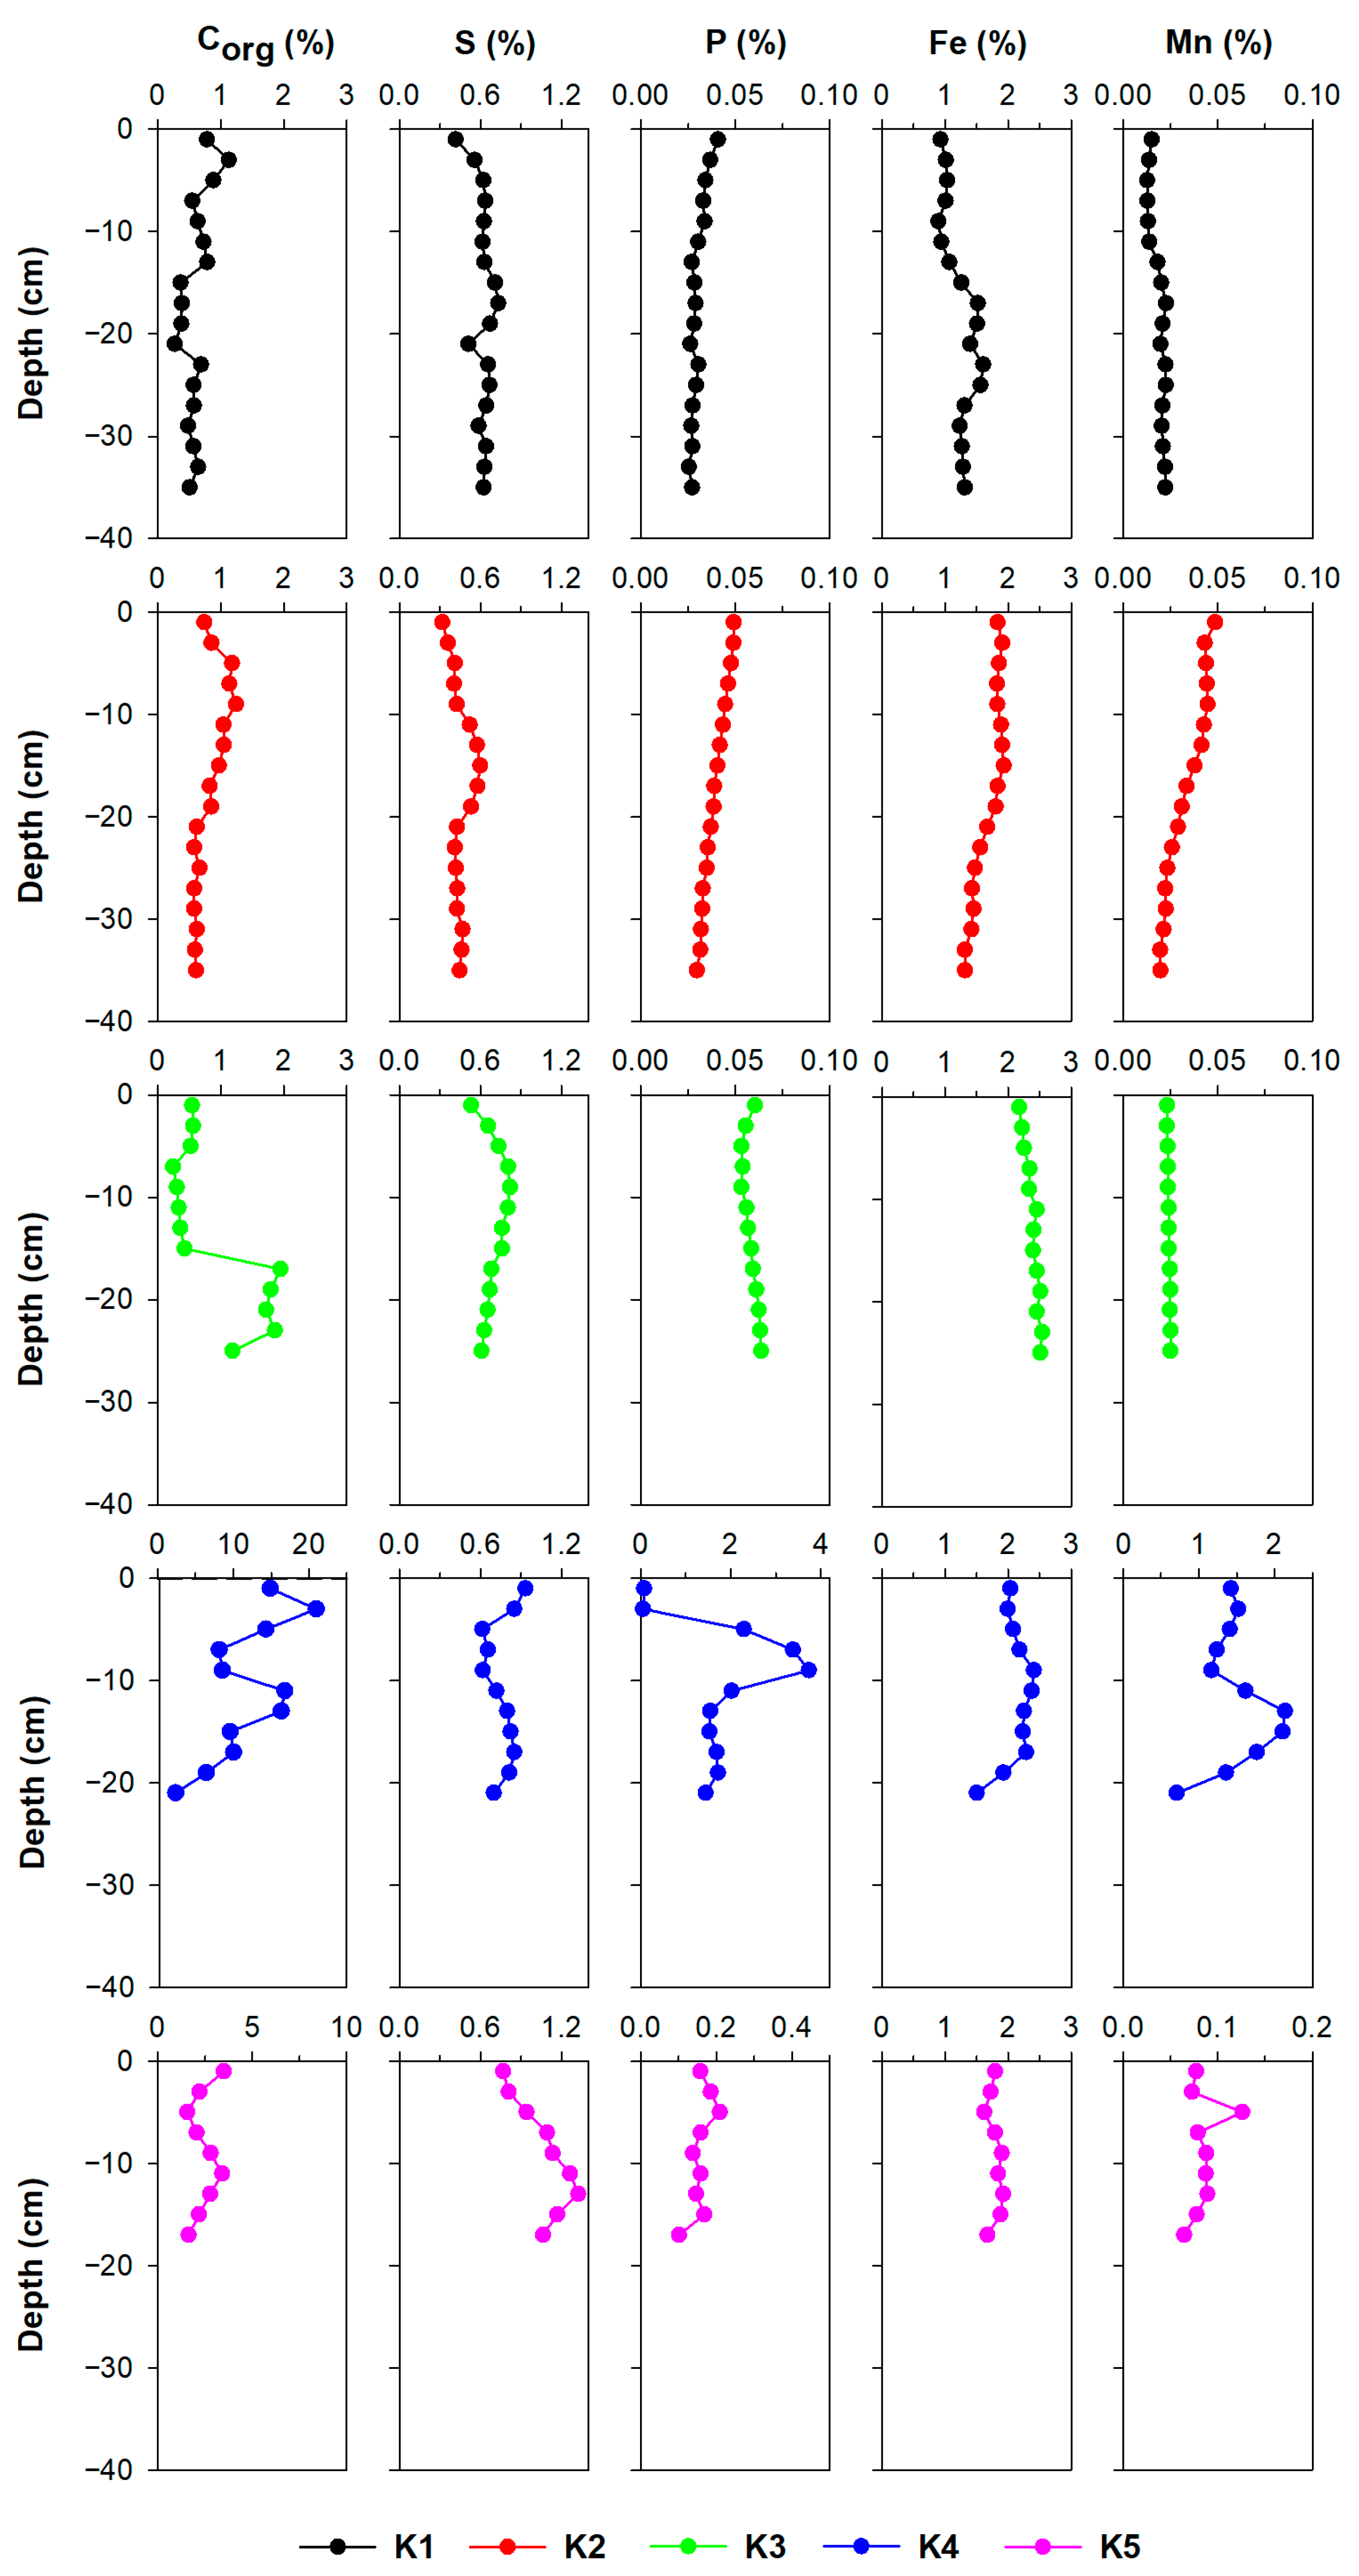
3.2.1. Fe, Mn, S, P, and Corg
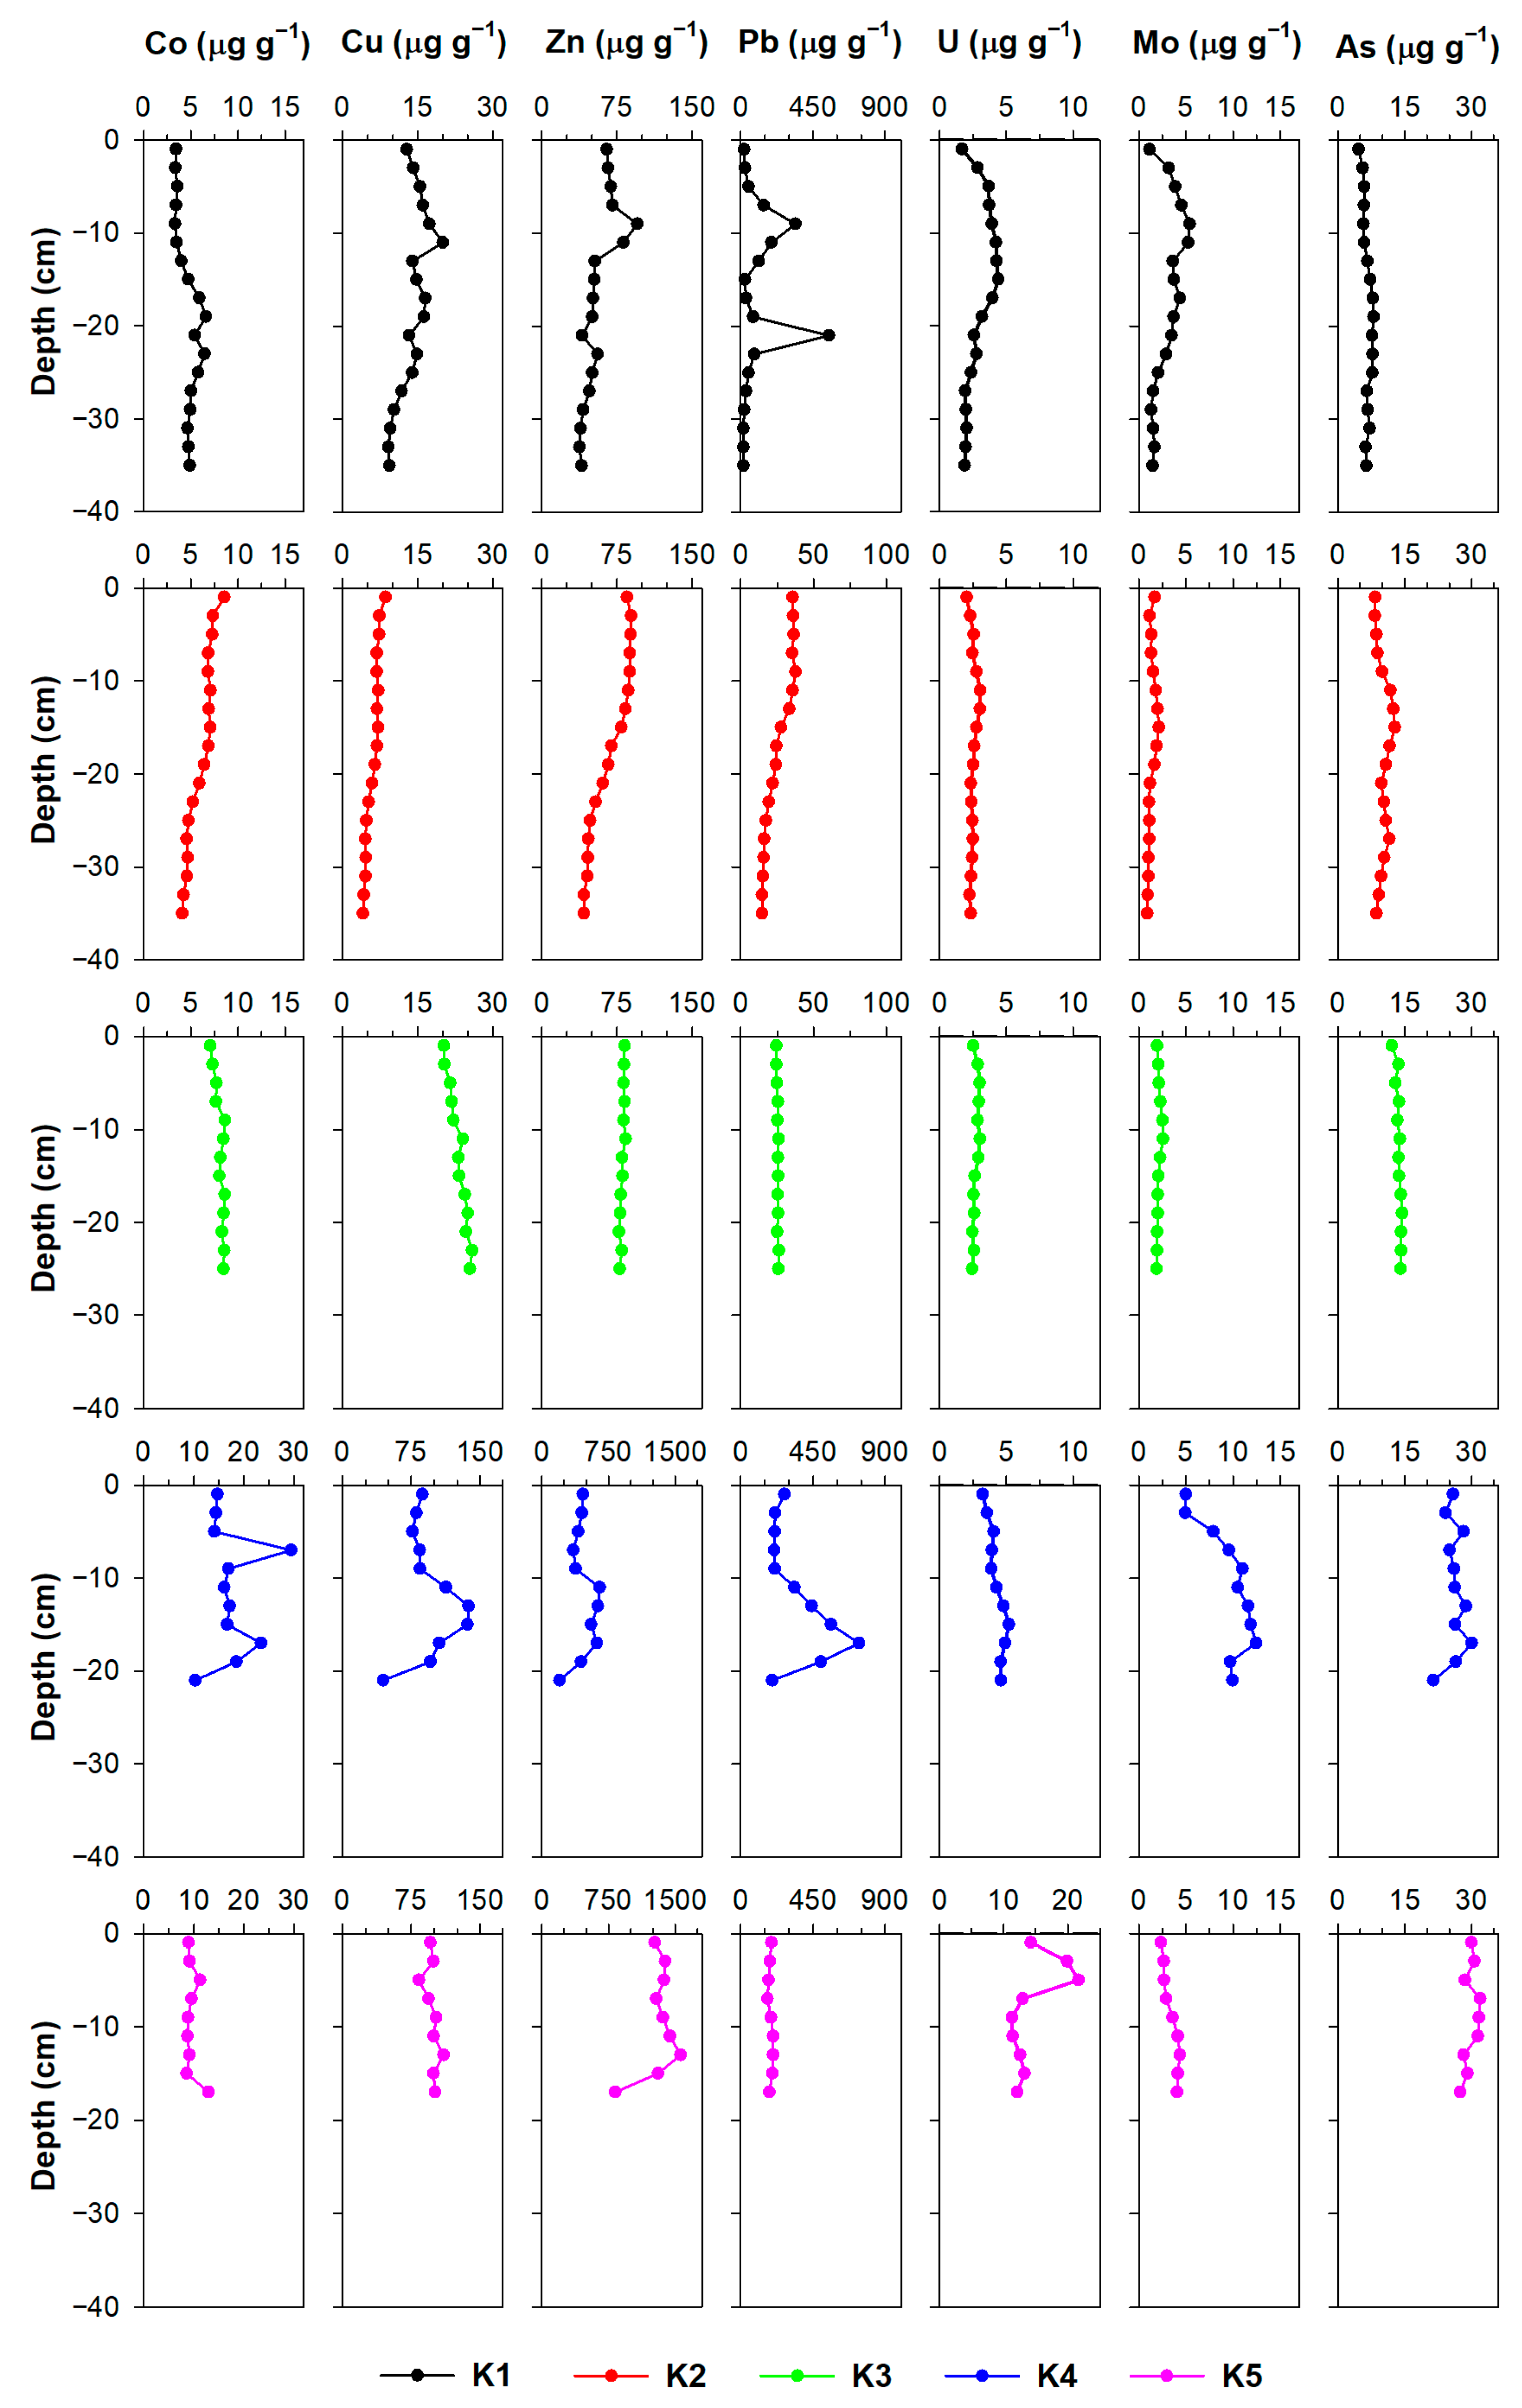
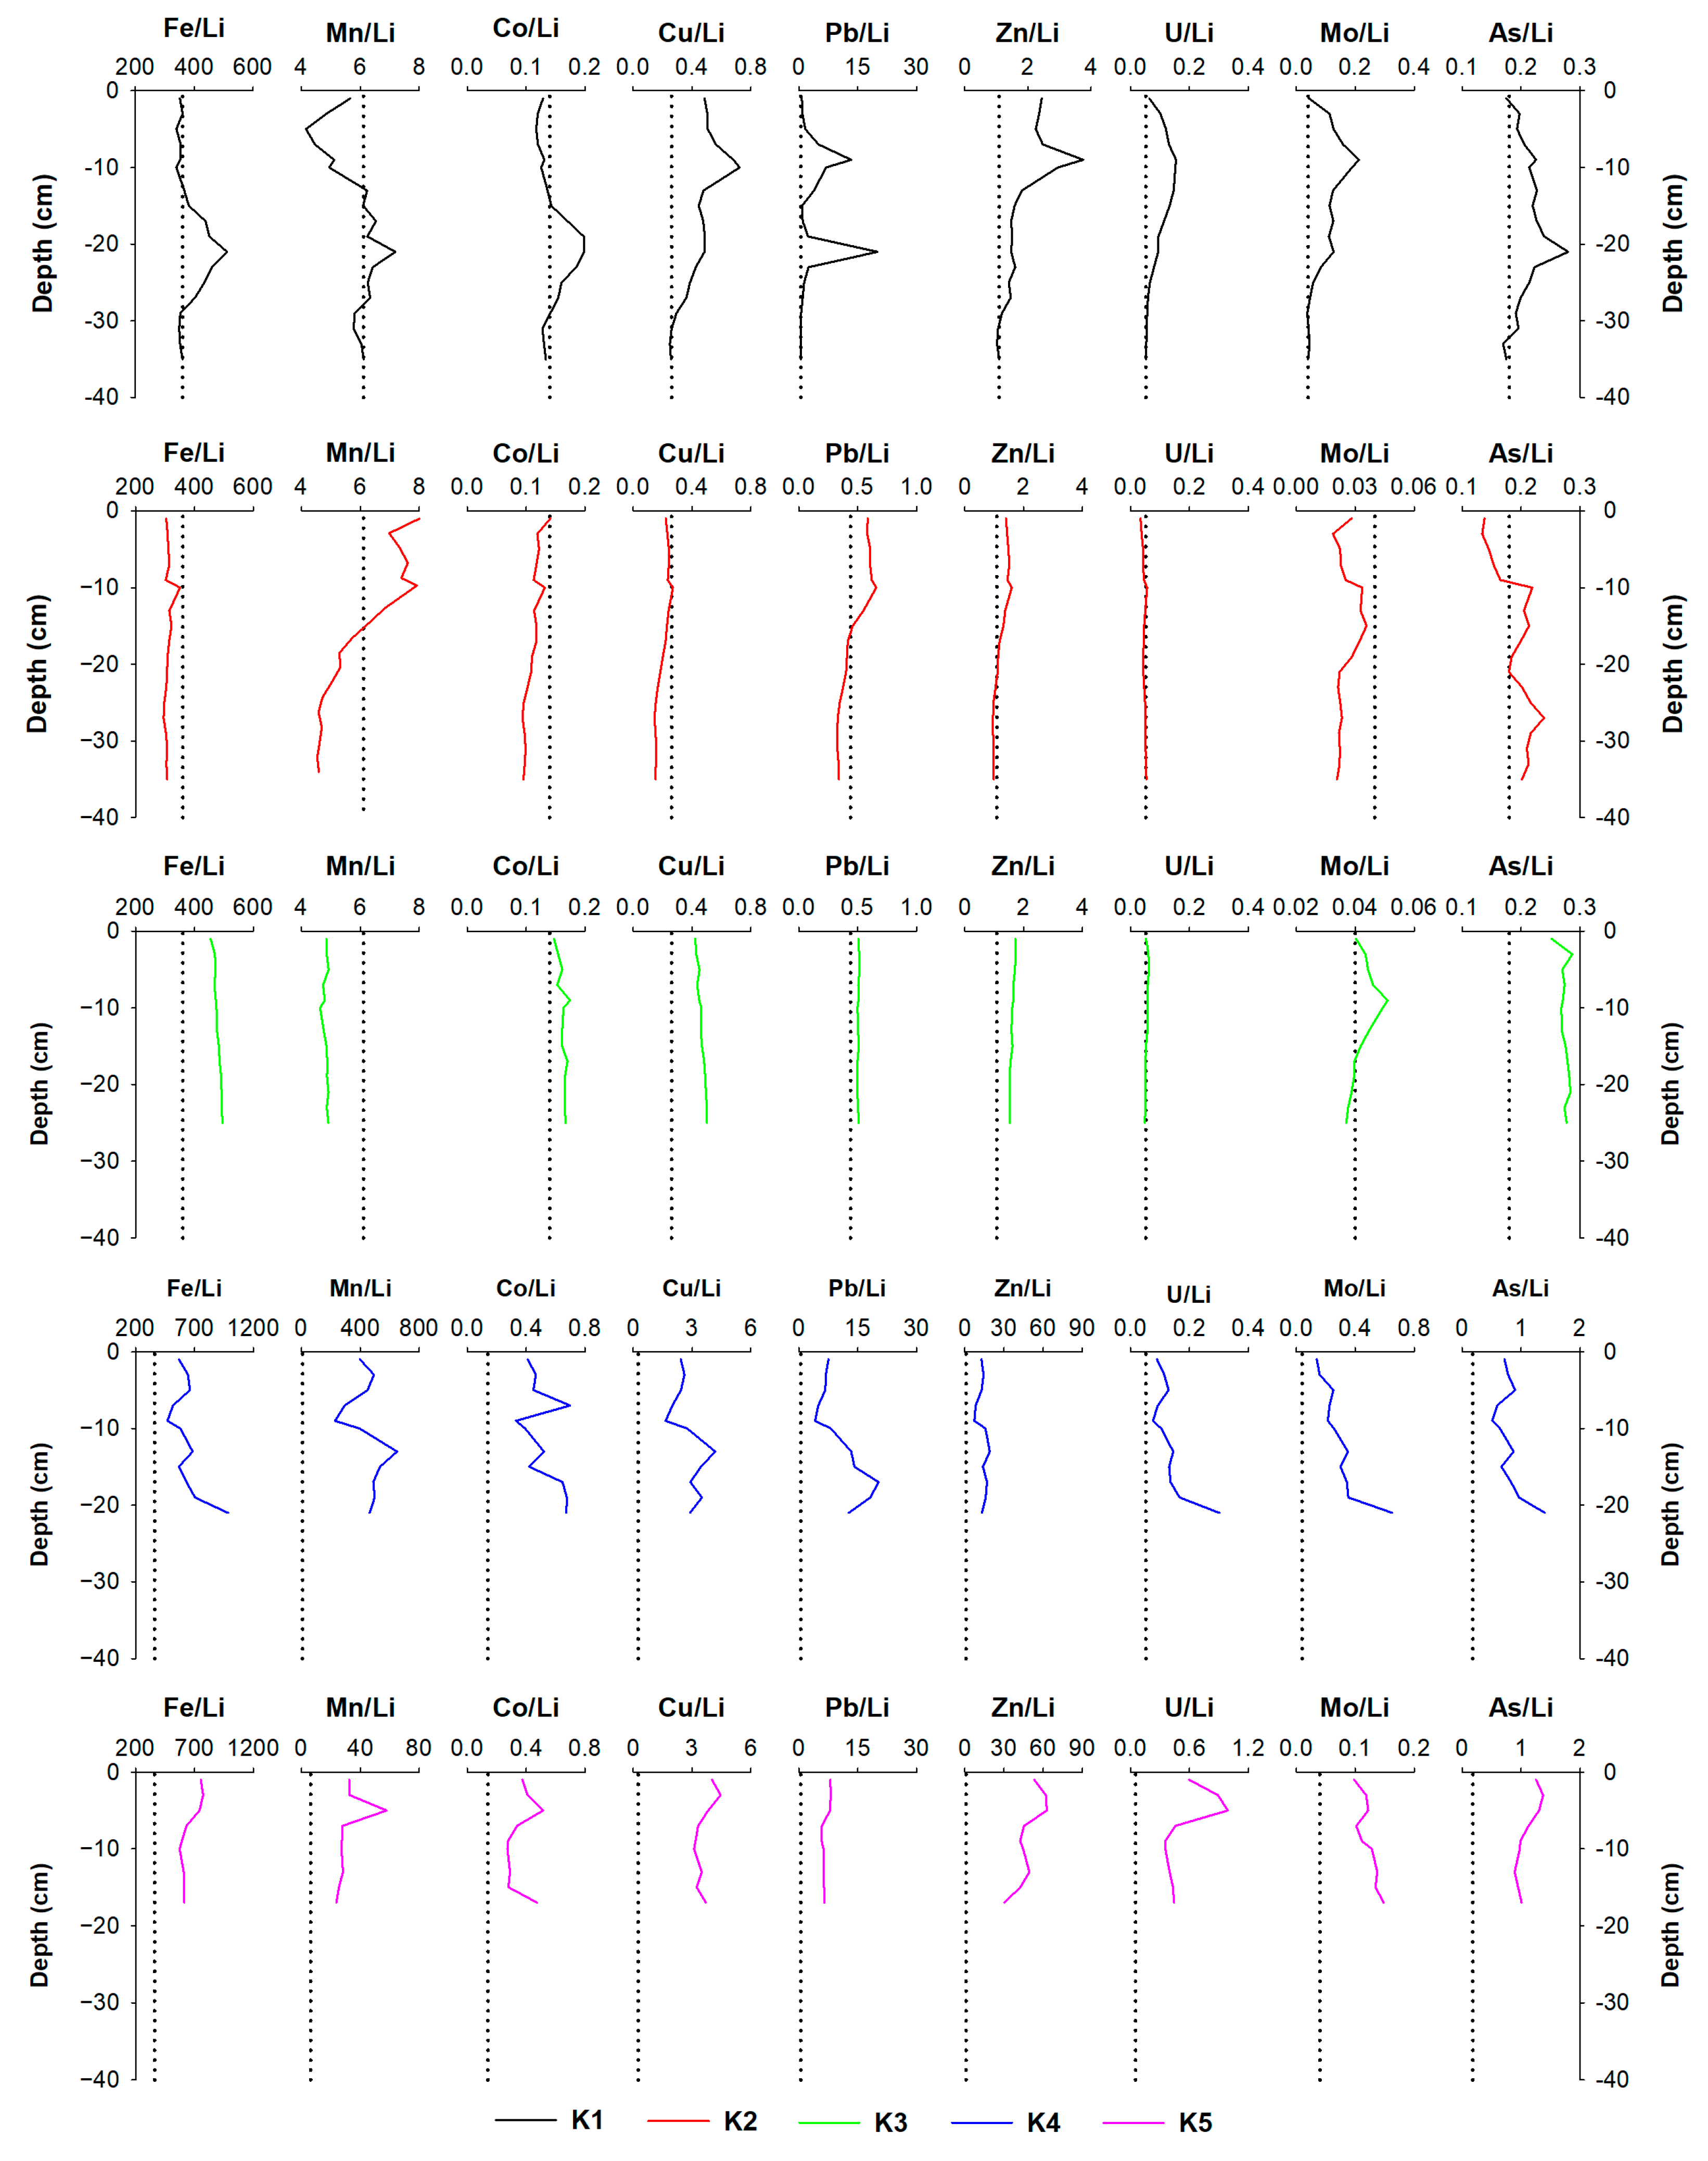
Vertical distributions of Fe, Mn, S, P, and Corg in the sediment cores K1–K5 are shown in Figure 5 and Figure S2 and Tables S9–S13. The organic carbon concentrations in sediment cores K1–K3 ranged from 0.269 to 1.13%, from 0.576 to 1.24%, and from 0.244 to 1.95%. The highest concentrations of Corg (2.39–21%) were found in core K4, followed by core K5 with a concentration range of 1.56–3.49%. Lower P values were recorded in cores K1–K3 (0.026–0.064%) than in cores K4 and K5 (0.032–3.38%). As in the case of Corg, the highest concentrations of P were recorded in core K4. In the first 4 cm of the core, P concentrations were at the level of those recorded in cores K1–K3, but then the concentrations rose sharply to 3.38% at a depth of about 10 cm. At location K5, the values were in the range 0.101–0.209%. Concentrations of Fe in the study area were found in the range of 0.896–2.54%. The vertical distribution patterns varied intra-site. Concentrations of Mn were found in the range of 0.013–2.14%. Large differences in Mn concentrations were observed between cores K1–K3 and K4–K5. Namely, in cores K1 and K2 the concentrations did not exceed 0.03%, in core K3 0.05%, while the maximum concentration in core K4 was 2.14%. This pronounced increase in Mn content in the sediment is a consequence of pollution from the electrode and ferroalloy factory. The factory has been closed for almost 30 years; nevertheless, its influence is still visible in the sediment [47]. At location K5, concentrations ranged from 0.065 to 0.126%. Although the concentrations here are several times lower than at the K4 location, which is in proximity to the factory, its influence can be seen at site K5 as well.

3.2.2. Metals

The concentrations of analysed metals (Co, Cu, Zn, Pb, U, Mo, As) are given in Figure 6 and Figure S3 and Tables S9–S13. What can be clearly seen from Figure 6 is the difference between sites K1–K3 and K4–K5. For all of the reported elements, higher concentrations were obtained at the sites K4–K5. This is in good agreement with previous findings that demonstrate anthropogenic input of metals at these two sites [47].
The highest concentrations of Co, Cu, Pb, and Mo were found in the core K4. The downward Co distribution in the core K4 was characterised by two marked increases, at depths of 6–8 cm (29.5 μg g−1) and 16–18 cm (23.4 μg g−1). Copper, Zn, and Pb followed a similar distribution pattern in the core K4, with a substantial increase at the depth of 10–20 cm, followed by a marked decrease in the bottommost layer of the core. The maximum Pb concentration recorded in core K4 was extremely high, 737 μg g−1. The very high concentrations were also observed at the site K1. The vertical distribution of Pb in core K1 is characterised by a wide range of concentrations (15.3–550 μg g−1) and two pronounced peaks, at depths of 8–10 cm (340 μg g−1) and 20–22 cm (550 μg g−1). Significantly lower concentrations were recorded in cores K2 and K3, below 40 μg g−1.
The highest content of Zn and U was found in core K5. Uranium distribution at site K5 was characterised by two pronounced maximums, in the 6–8 cm (21.7 μg g−1) and 4–6 cm (786 μg g−1) layers, respectively. Zinc concentrations in the K5 core were extremely high with a maximum of 1561 μg g−1 at a depth of 12–14 cm. Zinc was also significantly elevated in the core of K4, where the maximum concentration was 650 μg g−1.
Concentrations of As at locations K1–K3 were lower than 15 μg g−1, while at locations K4 and K5, concentrations varied in the range 21.4–30.1 μg g−1, and 27.5–32.0 μg g−1.
The range of Mo concentrations in cores K1–K5 was 0.575 μg g−1 to 12.5 μg g−1. A similar vertical distribution was observed in all cores. Concentrations increased with depth to a maximum value at depths between 8 and 18 cm (depending on the core), and then decreased to the bottom of the core.

4. Discussion

4.1. The Impact of Natural (Diagenetic) Processes and Anthropogenic Input on Metal Distribution in the Solid Phase of the Sediment

Sediment is a very complex system in which the vertical distribution of metals can be influenced by many different factors such as particle size, input of terrigenous material, and anthropogenic input, but also early diagenetic processes. Therefore, the enrichment factors (EF) were calculated [47] and geochemical normalisation with Li was performed to compensate for mineralogical and granulometric variability in the sediment and to facilitate distinguishing anthropogenic from natural (diagenetic and terrigenous) sources of metals in the sediment. The EF was calculated using the following equation:
E F = M L i s a m p l e M L i b a c k g r o u n d
where M refers to the metal for which EF is being calculated. The results from the deepest layer of the K1 core were used as a background value. The sedimentation rate at the K1 site is 2 mm year−1 [42], hence the observed layer was deposited before the industrial development in the study area [47]. The concentrations of Li in cores K1–K5 were previously published [46] and are shown in Tables S9–S13. The sediments may be divided into five different classes based on the calculated EF [58]: EF < 2, deficiency to low enrichment; EF 2–5, moderate enrichment; EF 5–20, significant enrichment; EF 20–40, very high enrichment; EF > 40, extremely high enrichment.
From the EFs (Table 1) and vertical profiles of the metal/Li ratios in the sediment (Figure 7), it is apparent that the lower estuary (K4–K5) is highly affected by anthropogenic activities, which has been previously reported [47]. In the upper estuary, at site K1, the calculated EFs indicated low to moderate enrichment for all elements except Pb. The distribution pattern of Pb is characterised by the two marked peaks at the depths of ~10 cm and ~20 cm, showing even extremely high enrichment. In the sediment cores K2 and K3, however, EFs were below the value of 2 for all the analysed elements, inferring that there is no anthropogenic enrichment in the sediment. Therefore, the vertical distribution pattern of metals reflects variability in the particulate material input and the post-depositional changes due to the early diagenetic processes.
For example, the departure of metal/Li ratios from the background metal/Li ratios in the core K3, coupled with the low EFs, indicated that increased concentrations of analysed metals are a result of the different sources of material in sediment cores. The terrigenous particulate material brought by the tributary Guduča River plays a major role in the sediment composition at site K3, and it seems that it was quite uniform during the deposition time of the sampled sediment. At sites K1 and K2, on the other hand, it seems that post-depositional changes have more importance. The departure of metal/Li ratios (e.g., Fe, Co, As, Zn, Cu, Pb) was noted in the core K2 at depths of ~10 cm, and in the core K1 at depths ~10 cm and ~20. In the case of the K2 core and the first enrichment in the core K1 (Zn, Cu), these enrichments co-occur with the increase of S content in the sediment solid fraction and the detection of ∑HS in the pore water, thus implying that there is a possible formation of the sulphide solid phase. Usually, Fe is the principal sulphide-generating metal [59], and the other metals may be coprecipitated and/or adsorbed to FeSx solid phases and/or form discrete metal sulphide phases [19,59,60]. Although dissolved sulphide was not detected in the pore water of core K1 at the depth of the second enrichment (~20 cm), this may be due to rapid reaction with metal cations, and subsequent removal from the pore water.
In the upper estuary, moreover, the moderate enrichment of Mo and its departure from the background Mo/Li ratio were observed at the depth where the ∑HS, the end-product of the sulphate reduction, was present. It is known that Mo is soluble under oxidising conditions, while it precipitates when conditions turn anoxic. It was believed that MoVI reduces to MoIV under sulphide conditions and forms a highly insoluble MoIVS2 phase [61,62]. However, a different reducing mechanism was proposed by Erickson and Helz [63]. Mo in the form of the highly inactive molybdate (MoVIO42−) can be found in the oxidised water, whereas under sulphide conditions, oxygen atoms in MoVIO42− may be replaced with sulphur atoms, forming a complex (MoVIOnS42−). Due to the formation of this complex, Mo is more likely to be bound to OM or solid phase Fe, and consequently removed from the pore water. Due to the co-occurrence of Mo sediment enrichment and the presence of ∑HS in the pore water, it can be inferred that enrichment is a result of the formation of the authigenic solid phase. The threshold value for authigenic Mo formation, most likely by coprecipitation of the Mo-Fe-S phase is ~0.1 μM [6]; therefore, the ∑HS levels at sites K1–K3 were enough for the Mo authigenesis. The U enrichment in the anoxic zone of the sediment may also be assigned to the authigenic formation of the solid phase. In the oxic waters, U may be found in the form of UVI which forms highly soluble carbonate complexes (UO2(CO3−2)3−4). UVI is reduced to UIV in anoxic pore water, and adsorbed or precipitated, probably as uraninite (UIVO2) at a depth corresponding to the Fe oxyhydroxides reduction or below [61,64,65].
At sites K4 and K5, there is evidence of long-term contamination in sediments, resulting from the dust emitted directly from the Fe-Mn factory and subsequently deposited in the estuary, dispersal of the slag deposited on the grounds of the factory area, and the cargo operations in the port [47]. Although the anthropogenic input dominantly governs the content of metals in the cores K4–K5, early diagenetic processes should also be considered when interpreting the results. In particular, the pronounced Mn increase recorded in the 4–6 cm sediment layer in core K5 can most likely be attributed to the diffusion of Mn from the reduction zone of Mn oxyhydroxide deeper into the sediment, and its re-precipitation. Specifically, part of the Mn2+ can be precipitated from the pore water as pure or mixed carbonate and phosphate phases, or to a lesser extent as sulphide phases, under reducing conditions where manganese concentrations reach sufficiently high levels [66,67,68,69]. In the core K4, moreover, high ∑HS concentrations recorded (>100 μM) in the pore water can lead to the formation of solid metal phases, through the precipitation of metal cations as sulphides [59,70], e.g., Zn, Cu, or Cd, or through the reduction of metal oxyanions [70], like those of U.

4.2. Cycling of Fe and Mn in the Pore Water

It is well-known that early diagenetic processes govern the distribution of metals between the dissolved and solid phases of the sediment. To study the partitioning of metals in sediment, pore water is often used, as a very good indicator of the type and rate of diagenetic processes [25,71]. In the coastal and estuarine sediments, the primary process responsible for the recycling and partitioning of elements is the OM mineralisation, and a related Mn and Fe oxyhydroxides reduction. In general, these processes take place within a few centimetres of the SWI [9,72,73,74]. However, the compression of the classical diagenetic sequence is often observed, resulting in a very thin oxic layer (<1 cm). This kind of behaviour was also seen in the KRE, where vertical profiles of dissolved Mn and Fe showed a sharp rise below the SWI across the estuary, but the intensity of mobilisation differed among the sites. In cores K2, K4, and K5, the increase of the dissolved Fe was at a lower depth (2–4 cm) than dissolved Mn (0–2 cm), which is consistent with the ideal redox sequence of the estuarine sediments [75]. At sites K1 and K3, however, the redox zones were more compressed, resulting in the Mn and Fe peaks in the same layer, just below the SWI (0–2 cm). The observed pronounced compression of the redox zones may be related to the reduced amount of O2 in the water column (Figure S4). Namely, in the KRE, the seawater residence time increases in the landward direction, causing a decrease in O2 levels in the near-bottom seawater in the upper estuary. Moreover, according to Legović et al. [35], hypoxia can occur in autumn in the upper part of the estuary, as a result of the phytoplankton bloom and marked vertical stratification of the estuary, which prevents the mixing of the oxygen-depleted bottom water layer with the oxygen-rich surface layer. In case of absence of the autumn rains, hypoxia may be observed even in the winter months.
Consistent with the distribution patterns of Mn and Fe in sediment cores from the KRE, the other parameters used as tracers of diagenetic processes (NH4+, PO43−, ƩHS, DIC, DOC) showed similar behaviour in the entire estuary, following the classic diagenetic sequence. The degradation of the OM reflects in the pore water as the gradual progressive increase in NH4+ and PO43− seen at all sampling locations, and the DIC release at sites K3–K5; ƩHS was detected in the pore water at all sampling sites, but the ΣHS concentrations at site K4 were much higher than at the other sites. Given the availability of SO42− and OM control ƩHS concentrations, it is not surprising that the ƩHS concentration reported at this site was significantly greater than in the rest of the estuary. All stations in the estuary have sulphate concentrations within the same range due to resupply from the bottom saltwater; however, the Corg content at the Fe-Mn factory site was significantly greater than at other sample locations. Furthermore, it was observed at all sites that the decrease in the dissolved Fe concentrations cooccurs with the presence of ƩHS in the sediment layer. This is due to the formation of insoluble solid phases. Namely, the dissolved Fe produced by the reduction of Fe oxyhydroxides in the suboxic zone of the sediment diffuses down the core into the anoxic zone, where it reacts with ƩHS, a product of microbially mediated SO42− reduction. The downward diffusion of dissolved Mn, moreover, is mainly controlled by carbonates [17,66,76], given that Mn has a very low affinity for sulphides [21,59,77]. The results of Prohić and Kniewald [2], who showed that Mn is primarily bonded to the carbonate fraction of the KRE sediments, confirm that carbonate precipitation is the major mechanism in pore water for consuming Mn.

4.3. The Post-Depositional Mobility of Metals

High concentrations of dissolved Mn and Fe in the suboxic layer of the sediment are frequently accompanied by elevated levels of other metals that are released into the pore water through the reductive dissolution of their supporting phases, which include biogenic material and Mn and Fe oxyhydroxides. At sites K2, K4, and K5, for instance, the significant increase in dissolved Co below the SWI is probably associated with the Mn mobilisation, as the peak of Co corresponds to the one of Mn, and the adsorption of Co by MnO2 is well documented in the literature [78]. Additionally, it is often reported that the mobility of As below the SWI is closely linked to the cycling of Fe [13,79,80,81], due to the adsorption on or coprecipitation of As with Fe oxyhydroxides. This type of behaviour is also observed in the KRE, where the release of As in the suboxic zone of the sediment was observed at all sites. At site K3, the marked peak of dissolved Cu was recorded at the SWI. As Cu is considered a bioactive element, the release of Cu into the pore water is often attributed to its link to biogenic material and microbial OM degradation [12,71,72,82,83]. In the KRE, though, due to the compression of the redox zones, it is challenging to determine with absolute confidence which carrier phase—biogenic material, Mn and Fe oxyhydroxides—contributed more to the build-up of Cu in the pore water.
What is interesting is the presence of dissolved metal (Co, Cu, As, Zn, Pb) species in the anoxic zone, as it is known that they form insoluble sulphide minerals in the anoxic sediments. Although this finding is unexpected, it was already observed elsewhere and attributed to (i) the reduction of less reactive Mn and Fe oxyhydroxides deeper in the sediment, in the zone of sulphate reduction [13,74,79,84,85]; (ii) metal binding with DOM [18,19,72,74,86], thus reducing their solubility despite the sulphide presence; (iii) the formation of dissolved metal polysulfide complexes [18,19,24,60,74]; and (iv) metals-sulphides-DOM ternary interactions [18,19,74,87].
The redox-sensitive elements Mo and U exist in the form of dissolved high valence states (MoVIO42− and UO2(CO3−2)3−4) in the oxidised waters and generally behave conservatively. However, when conditions turn euxinic (Mo) or anoxic (U) they are scavenged from the pore water by adsorption or precipitation. In the KRE, Mo and U demonstrated similar vertical distribution patterns at all sites except K5, where U anthropogenically induced enrichment was observed because of the spillage of phosphates and phosphate fertilisers in the port during transhipment [47]. An interesting finding in the KRE is that even though Mo and U should be insoluble under anoxic conditions, dissolved Mo and U were recorded in the anoxic zone of the sediment at all sites, except K3. This unusual behaviour has already been observed for U in marine and estuarine sediments [82,88,89]. The occurrence of dissolved U in anoxic sediments has been attributed to the presence of sampling artefacts, e.g., reoxidation of solid phase authigenic UIV during sediment core treatment [90] or the possible presence of authigenic colloidal phases in the dissolved phase that could cross the 0.2 um pore size filters [88]. Dang et al. [89] and Audry et al. [82], however, reject the sampling artefacts hypothesis and propose that the U release into anoxic/euxinic sediment pore water is a result of a specific suite of biogeochemical processes, such as oxidation (biotic or abiotic) of authigenic UIV or formation of stable dissolved complexes (carbonate, OM) that enhance U solubility [89].

4.4. The Benthic Diffusive Fluxes in the KRE

The early diagenetic processes change the partitioning of metals between the solid and dissolved phases of the sediment. If dissolved metal accumulates at or close to the SWI, and the concentration of metal in the pore water exceeds the one in the overlying water, the concentration gradient will result in the diffusive flux of metal from the sediment to the water column. Benthic diffusive fluxes of analysed elements in the KRE are given in Table 2.
It can be seen that estimated Mn and Fe benthic diffusive fluxes were even several orders higher than those of other observed elements; however, they were in line with previously reported values [19,80,91]. The significant benthic flux of Mn and Fe in KRE, directed from the sediment to the overlying water column, is not surprising, given that vertical profiles of pore water indicated compression of diagenetic zones. In all locations, Mn reduction took place immediately below the SWI (0–2 cm), while Fe reduction occurred either in the same sedimentary layer or in the following one (2–4 cm). The dissolved Mn and Fe build up in the pore water and are being diffused upwards across the SWI. At sites K1 and K3, located in the upper estuary, the influence of the benthic diffusive flux to the Mn and Fe concentrations in the overlying water column was evident. The concentrations in the overlying water were significantly increased compared to the concentrations measured in the seawater layer at the same sites (K1: 0.364–85.9 nM (Mn), 1.79–5.19 nM (Fe); K3: 4.57–16.3 nM (Mn), 1.79–18.4 nM (Fe) [92]). At sites K4 and K5, located closer to the estuarine mouth, benthic flux was not shown to have an impact on overlying concentrations for Fe, and it was significantly less pronounced for Mn compared to sites K1 and K3. Differences between sites in the KRE can be explained by different water residence times, namely the residence time increases landwards, which leads to a decrease of the O2 level in the bottom water of the upper estuary. Whereas in the lower estuary, the bottom layer contains water rich in O2 which came recently from the adjacent open sea [35], causing the oxidation and precipitation of released Fe and Mn.
Together with Mn and Fe, the other elements that were associated with Mn and/or Fe oxyhydroxides are being released in the pore water and subsequently diffused to the overlying water column. The diffusive fluxes of Pb and As are directed from the sediment to the overlying water column at all sites, indicating that sediment acts as a source of these elements for the overlying water column in the KRE, no matter the differences in sediment composition or season between the sites. The diffusive fluxes of Co, Cu, and Mo, further, imply that there is diffusion from the sediment to the water column at most of the sampling locations, thus confirming the importance of the sediment as a metal source.
In some coastal and estuarine areas, benthic fluxes were demonstrated to be an important source of the metals for the overlying water column [93], in some cases of the same magnitude or even higher than riverine input [72,94,95]. In this study, the average calculated benthic diffusive fluxes (the ones directed from the sediment to the water column) were extrapolated to the entire estuarine area (25 × 106 m2) and compared to the estimated input of metals via the Krka River (Table 3). The estimation was based on the mean annual discharge of the Krka River (50 m3 s−1) [41] and the mean dissolved trace metal concentrations measured in the Krka River. The concentrations were as follows: 25.1 nM (1.40 μg L−1) for Fe, 81.7 nM (4.49 μg L−1) for Mn, 0.289 nM (0.017 μg L−1) for Co, 3.43 nM (0.218 μg L−1) for Cu, 0.044 nM (0.009 μg L−1) for Pb, 5.98 nM (0.574 μg L−1) for Mo, and 2.15 nM (0.161 μg L−1) for As. In the KRE, the benthic fluxes were lower than riverine fluxes, except in the case of Fe and Mn. Evidently, sediment in the KRE is a significant source of Fe and Mn for the water column.
This is the result of the high Mn content in the sediment due to the former existence of the ferromanganese industry in the KRE [47], and the post-depositional remobilisation of Mn and Fe due to the reductive dissolution of Mn and Fe minerals that takes place just below the SWI. Although the riverine input is more important than benthic fluxes for the other metals in the KRE, the benthic fluxes should not be neglected, especially in the case of As and Pb, whose benthic flux values are approximately 35% of riverine flux values.

5. Conclusions

The post-depositional mobility of metals in the KRE is governed by the early diagenetic process linked to the degradation of the OM, in particular by the reductive dissolution of Mn and Fe oxyhydroxides and sulphate reduction. The dissolved metals that are released to the pore water through Mn and Fe reduction diffuse upwards and downwards from the sediment suboxic zone. The down-core diffusion of metals is limited by the authigenic formation of solid phases, in the sediment zone where ∑HS, the end-product of the sulphate reduction, is present. The interesting finding is the presence of dissolved metal peaks in the anoxic zone of the sediment, which may be explained by the reduction of less reactive Mn and Fe oxyhydroxides deeper in the sediment (in the zone of sulphate reduction) or by the formation of complexes (metal-DOM, metal-sulphide, metal-sulphide-DOM) that increase the solubility of metals.
Due to the compression of the classical digenetic sequence in the sediment, the Mn and Fe reduction occurs just below the SWI; thus, released metals easily diffuse into the overlying water. Although estimated benthic fluxes of metals are in most cases lower than input by the main watercourse (the Krka River), they should not be neglected.

Supplementary Materials

The following supporting information can be downloaded at: https://www.mdpi.com/article/10.3390/jmse12030466/s1, Figure S1. The vertical distribution of metals (Co, Cu, Zn, Pb, U, Mo, V, As, and Cr) in the overlying water and pore water of sediment cores K1–K5. The dashed line marks the sediment–water interface (SWI); Figure S2. The vertical distribution of Corg, S, P, Fe, and Mn in the sediment cores K1–K5; Figure S3. The vertical distribution of metals (Co, Cu, Zn, Pb, U, Mo, and As) in the sediment cores K1–K5; Figure S4. The physicochemical parameters measured in the water column at sampling locations K1–K5 in the Krka River estuary; Table S1. Information on cores sampled in the Krka River estuary: Core ID, sampling location, water column depth (m), core depth (cm) and sampling date; Table S2. Indicators of long-term measurements (n = 68) of elemental concentration (μg L−1) in the CASS-5 certified seawater reference material for trace metals (NRCC) using HR ICP-MS with indicated limits of detection (LOD) and quantification (LOQ) in seawater samples. For measurement purposes (HR ICP-MS), the sample is diluted 10× with ultra-pure water (Milli-Q); Table S3. The analytical results and recovery rates of the certified reference material PACS-2 (National Research Council of Canada). Tables S4–S8. Chemical composition of the overlying water and pore water samples from the K1, K2, K3, K4 and K5 sampling locations (ow—overlying water, pw—pore water, numbers in the sample name indicate distance from the bottom for the overlying water or sediment layer from which pore water was extracted). Values are expressed in μg L−1; Tables S9–S13. Chemical composition of the K1, K2, K3, K4, and K5 sediment cores. Sample names indicate the sediment layer depth (cm). Values are expressed in μg g−1.

Author Contributions

Conceptualization, D.O. and N.C. (Neven Cukrov); methodology, D.O.; formal analysis, N.C. (Nuša Cukrov), D.O. and N.C. (Neven Cukrov); investigation, N.C. (Nuša Cukrov), D.O. and N.C. (Neven Cukrov); resources, D.O. and N.C. (Neven Cukrov); writing—original draft preparation, N.C. (Nuša Cukrov); writing—review and editing, D.O. and N.C. (Neven Cukrov); visualization, N.C. (Nuša Cukrov); supervision, N.C. (Neven Cukrov); funding acquisition, D.O. All authors have read and agreed to the published version of the manuscript.

Funding

This work was financially supported by the Croatian Science Foundation under project IP-2014-09-7530.

Institutional Review Board Statement

Not applicable.

Informed Consent Statement

Not applicable.

Data Availability Statement

The raw data supporting the conclusions of this article will be made available by the authors on request.

Conflicts of Interest

The authors declare no conflicts of interest.

References

  1. Ridgway, J.; Shimmield, G. Estuaries as Repositories of Historical Contamination and Their Impact on Shelf Seas. Estuar. Coast. Shelf Sci. 2002, 55, 903–928. [Google Scholar] [CrossRef]
  2. Prohić, E.; Kniewald, G. Heavy Metal Distribution in Recent Sediments of the Krka River Estuary—An Example of Sequential Extraction Analysis. Mar. Chem. 1987, 22, 279–297. [Google Scholar] [CrossRef]
  3. Kennish, M.J. Environmental Threats and Environmental Future of Estuaries. Environ. Conserv. 2002, 29, 78–107. [Google Scholar] [CrossRef]
  4. Dou, Y.; Li, J.; Zhao, J.; Hu, B.; Yang, S. Distribution, Enrichment and Source of Heavy Metals in Surface Sediments of the Eastern Beibu Bay, South China Sea. Mar. Pollut. Bull. 2013, 67, 137–145. [Google Scholar] [CrossRef]
  5. Wang, L.F.; Yang, L.Y.; Kong, L.H.; Li, S.; Zhu, J.R.; Wang, Y.Q. Spatial Distribution, Source Identification and Pollution Assessment of Metal Content in the Surface Sediments of Nansi Lake, China. J. Geochem. Explor. 2014, 140, 87–95. [Google Scholar] [CrossRef]
  6. Zhang, C.; Yu, Z.G.; Zeng, G.M.; Jiang, M.; Yang, Z.Z.; Cui, F.; Zhu, M.Y.; Shen, L.Q.; Hu, L. Effects of Sediment Geochemical Properties on Heavy Metal Bioavailability. Environ. Int. 2014, 73, 270–281. [Google Scholar] [CrossRef] [PubMed]
  7. Valdés, J.; Vargas, G.; Sifeddine, A.; Ortlieb, L.; Guiñez, M. Distribution and Enrichment Evaluation of Heavy Metals in Mejillones Bay (23°S), Northern Chile: Geochemical and Statistical Approach. Mar. Pollut. Bull. 2005, 50, 1558–1568. [Google Scholar] [CrossRef] [PubMed]
  8. Saulnier, I.; Mucci, A. Trace Metal Remobilization Following the Resuspension of Estuarine Sediments: Saguenay Fjord, Canada. Appl. Geochem. 2000, 15, 191–210. [Google Scholar] [CrossRef]
  9. Tankere-Muller, S.; Zhang, H.; Davison, W.; Finke, N.; Larsen, O.; Stahl, H.; Glud, R.N. Fine Scale Remobilisation of Fe, Mn, Co, Ni, Cu and Cd in Contaminated Marine Sediment. Mar. Chem. 2007, 106, 192–207. [Google Scholar] [CrossRef]
  10. Tessier, E.; Garnier, C.; Mullot, J.U.; Lenoble, V.; Arnaud, M.; Raynaud, M.; Mounier, S. Study of the Spatial and Historical Distribution of Sediment Inorganic Contamination in the Toulon Bay (France). Mar. Pollut. Bull. 2011, 62, 2075–2086. [Google Scholar] [CrossRef] [PubMed]
  11. Kalnejais, L.H.; Martin, W.R.; Bothner, M.H. The Release of Dissolved Nutrients and Metals from Coastal Sediments Due to Resuspension. Mar. Chem. 2010, 121, 224–235. [Google Scholar] [CrossRef]
  12. Duan, L.Q.; Song, J.M.; Yu, Y.; Yuan, H.M.; Li, X.G.; Li, N. Spatial Variation, Fractionation and Sedimentary Records of Mercury in the East China Sea. Mar. Pollut. Bull. 2015, 101, 434–441. [Google Scholar] [CrossRef] [PubMed]
  13. Rigaud, S.; Radakovitch, O.; Couture, R.M.; Deflandre, B.; Cossa, D.; Garnier, C.; Garnier, J.M. Mobility and Fluxes of Trace Elements and Nutrients at the Sediment-Water Interface of a Lagoon under Contrasting Water Column Oxygenation Conditions. Appl. Geochem. 2013, 31, 35–51. [Google Scholar] [CrossRef]
  14. Ho, H.H.; Swennen, R.; Cappuyns, V.; Vassilieva, E.; Van Gerven, T.; Van Tran, T. Speciation and Mobility of Selected Trace Metals (As, Cu, Mn, Pb and Zn) in Sediment with Depth in Cam River-Mouth, Haiphong, Vietnam. Aquat. Geochem. 2013, 19, 57–75. [Google Scholar] [CrossRef]
  15. Kristensen, E. Organic Matter Diagenesis at the Oxic/Anoxic Interface in Coastal Marine Sediments, with Emphasis on the Role of Burrowing Animals. Hydrobiologia 2000, 426, 1–24. [Google Scholar] [CrossRef]
  16. Cai, W.-J.; Sayles, F.L. Oxygen Penetration Depths and Fluxes in Marine Sediments. Mar. Chem. 1996, 52, 123–131. [Google Scholar] [CrossRef]
  17. Kalnejais, L.H.; Martin, W.R.; Bothner, M.H. Porewater Dynamics of Silver, Lead and Copper in Coastal Sediments and Implications for Benthic Metal Fluxes. Sci. Total Environ. 2015, 517, 178–194. [Google Scholar] [CrossRef]
  18. Dang, D.H.; Lenoble, V.; Durrieu, G.; Omanović, D.; Mullot, J.U.; Mounier, S.; Garnier, C. Seasonal Variations of Coastal Sedimentary Trace Metals Cycling: Insight on the Effect of Manganese and Iron (Oxy)Hydroxides, Sulphide and Organic Matter. Mar. Pollut. Bull. 2015, 92, 113–124. [Google Scholar] [CrossRef]
  19. Duan, L.; Song, J.; Liang, X.; Yin, M.; Yuan, H.; Li, X.; Ren, C.; Zhou, B.; Kang, X.; Yin, X. Dynamics and Diagenesis of Trace Metals in Sediments of the Changjiang Estuary. Sci. Total Environ. 2019, 675, 247–259. [Google Scholar] [CrossRef]
  20. Sundby, B. Transient State Diagenesis in Continental Margin Muds. Mar. Chem. 2006, 102, 2–12. [Google Scholar] [CrossRef]
  21. Morse, J.W.; Luther, G.W. Chemical Influences on Trace Metal-Sulfide Interactions in Anoxic Sediments. Geochim. Cosmochim. Acta 1999, 63, 3373–3378. [Google Scholar] [CrossRef]
  22. Rosenthal, Y.; Lam, P.; Boyle, E.A.; Thomson, J. Authigenic Cadmium Enrichments in Suboxic Sediments: Precipitation and Postdepositional Mobility. Sci. Lett. 1995, 132, 99–111. [Google Scholar] [CrossRef]
  23. Charriau, A.; Lesven, L.; Gao, Y.; Leermakers, M.; Baeyens, W.; Ouddane, B.; Billon, G. Trace Metal Behaviour in Riverine Sediments: Role of Organic Matter and Sulfides. Appl. Geochem. 2011, 26, 80–90. [Google Scholar] [CrossRef]
  24. Wang, F.; Tessier, A. Zero-Valent Sulfur and Metal Speciation in Sediment Porewaters of Freshwater Lakes. Environ. Sci. Technol. 2009, 43, 7252–7257. [Google Scholar] [CrossRef] [PubMed]
  25. Van Den Berg, G.A.; Loch, J.P.G.; Van Der Heijdt, L.M.; Zwolsman, J.J.G. Geochemical Behaviour of Trace Metals in Freshwater Sediments. Trace Met. Environ. 2000, 4, 517–533. [Google Scholar] [CrossRef]
  26. Bilinski, H.; Kwokal, Ž.; Plavšić, M.; Wrischer, M.; Branica, M. Mercury Distribution in the Water Column of the Stratified Krka River Estuary (Croatia): Importance of Natural Organic Matter and of Strong Winds. Water Res. 2000, 34, 2001–2010. [Google Scholar] [CrossRef]
  27. Louis, Y.; Garnier, C.; Lenoble, V.; Mounier, S.; Cukrov, N.; Omanović, D.; Pižeta, I. Kinetic and Equilibrium Studies of Copper-Dissolved Organic Matter Complexation in Water Column of the Stratified Krka River Estuary (Croatia). Mar. Chem. 2009, 114, 110–119. [Google Scholar] [CrossRef]
  28. Sempéré, R.; Cauwet, G. Occurrence of Organic Colloids in the Stratified Estuary of the Krka River (Croatia). Estuar. Coast. Shelf Sci. 1995, 40, 105–114. [Google Scholar] [CrossRef]
  29. Viličić, D.; Legović, T.; Žutić, V. Vertical Distribution of Phytoplankton in a Stratified Estuary. Aquat. Sci. 1989, 51, 31–46. [Google Scholar] [CrossRef]
  30. Šupraha, L.; Bosak, S.; Ljubešić, Z.; Mihanović, H.; Olujić, G.; Mikac, I.; Viličić, D. Cryptophyte Bloom in a Mediterranean Estuary: High Abundance of Plagioselmis Cf. Prolonga in the Krka River Estuary (Eastern Adriatic Sea). Sci. Mar. 2014, 78, 329–338. [Google Scholar] [CrossRef]
  31. Djogić, R.; Pižeta, I.; Branica, M. Electrochemical Determination of Dissolved Uranium in Krka River Estuary. Wat. Res. 2001, 35, 1915–1920. [Google Scholar] [CrossRef]
  32. Elbaz-Poulichet, F.; Ming Guan, D.; Martin, J.-M. Trace Metal Behaviour in a Highly Stratified Mediterranean Estuary: The Krka (Yugoslavia). Mar. Chem. 1991, 32, 211–224. [Google Scholar] [CrossRef]
  33. Cindrić, A.M.; Garnier, C.; Oursel, B.; Pižeta, I.; Omanović, D. Evidencing the Natural and Anthropogenic Processes Controlling Trace Metals Dynamic in a Highly Stratified Estuary: The Krka River Estuary (Adriatic, Croatia). Mar. Pollut. Bull. 2015, 94, 199–216. [Google Scholar] [CrossRef]
  34. Legović, T. Exchange of Water in a Stratified Estuary with an Application to Krka (Adriatic Sea). Mar. Chem. 1991, 32, 121–135. [Google Scholar] [CrossRef]
  35. Legović, T.; Petricioli, D.; Žutić, V. Hypoxia in a Pristine Stratified Estuary (Krka, Adriatic Sea). Mar. Chem. 1991, 32, 347–359. [Google Scholar] [CrossRef]
  36. Legović, T.; Žutić, V.; Gržetić, Z.; Cauwet, G.; Precali, R.; Viličić, D. Eutrophication in the Krka Estuary. Mar. Chem. 1994, 46, 203–215. [Google Scholar] [CrossRef]
  37. Gržetić, Z.; Precali, R.; Degobbis, D.; Škrivanić, A. Nutrient Enrichment and Phytoplankton Response in an Adriatic Karstic Estuary. Mar. Chem. 1991, 32, 313–331. [Google Scholar] [CrossRef]
  38. Prohić, E.; Juračić, M. Heavy Metals in Sediments—Problems Concerning Determination of the Anthropogenic Influence. Study in the Krka River Estuary, Eastern Adriatic Coast, Yugoslavia. Environ. Geol. Water Sci. 1989, 13, 145–151. [Google Scholar] [CrossRef]
  39. Juračić, M.; Prohić, E. Mineralogy, Sources of Particles, and Sedimentation in the Krka River Estuary (Croatia). Geološki Vjesnik 1991, 44, 195–200. [Google Scholar]
  40. Martinčić, D.; Kwokal, Ž.; Branica, M. Distribution of Zinc, Lead, Cadmium and Copper between Different Size Fractions of Sediments II. The Krka River Estuary and the Kornati Islands (Central Adriatic Sea). Sci. Total Environ. 1990, 95, 217–225. [Google Scholar] [CrossRef]
  41. Bonacci, O.; Andrić, I.; Roje-Bonacci, T. Hydrological Analysis of Skradinski Buk Tufa Waterfall (Krka River, Dinaric Karst, Croatia). Environ. Earth Sci. 2017, 76, 669. [Google Scholar] [CrossRef]
  42. Cukrov, N.; Barišić, D.; Juračić, M. Calculated Sedimentation Rate in the Krka River Estuary Using Vertical Distribution of 137Cs. Rapp. Comm. Int. Mer Medit. 2007, 38, 81. [Google Scholar]
  43. Mikac, N.; Kwokal, Z.; May, K.; Branica, M. Mercury Distribution in the Krka River Estuary (Eastern Adriatic Coast). Mar. Chem. 1989, 28, 109–126. [Google Scholar] [CrossRef]
  44. Martinčič, D.; Kwokal, Ž.; Stoeppler, M.; Branica, M. Trace Metals in Sediments from the Adriatic Sea. Sci. Total Environ. 1989, 84, 135–147. [Google Scholar] [CrossRef]
  45. Kwokal, Z.; Franiković-Bilinski, S.; Bilinski, H.; Branica, M. A Comparison of Anthropogenic Mercury Pollution in Kastela Bay (Croatia) with Pristine Estuaries in Ore (Sweden) and Krka (Croatia). Mar. Pollut. Bull. 2002, 44, 1152–1157. [Google Scholar] [CrossRef]
  46. Bogner, D.; Ujević, I.; Zvonarić, T.; Barić, A. Distribution of Selected Trace Metals in Coastal Surface Sediments from the Middle and South Adriatic. Fresenius Environ. Bull. 2004, 13, 1281–1287. [Google Scholar]
  47. Cukrov, N.; Cindrić, A.-M.; Omanović, D.; Cukrov, N. Spatial Distribution, Ecological Risk Assessment, and Source Identification of Metals in Sediments of the Krka River Estuary (Croatia). Sustainability 2024, 16, 1800. [Google Scholar] [CrossRef]
  48. Oreščanin, V.; Barišić, D.; Mikelić, L.; Lovrenčić, I.; Rubčić, M.; Rožmarić-Mačefat, M.; Lulić, S. Environmental Contamination Assessment of the Surroundings of the Ex-Šibenik’s Ferro-Manganese Smelter, Croatia. J. Environ. Sci. Health Part A 2004, 39, 2493–2506. [Google Scholar] [CrossRef]
  49. Cukrov, N.; Doumandji, N.; Garnier, C.; Tucaković, I.; Dang, D.H.; Omanović, D.; Cukrov, N. Anthropogenic Mercury Contamination in Sediments of Krka River Estuary (Croatia). Environ. Sci. Pollut. Res. 2020, 27, 7628–7638. [Google Scholar] [CrossRef]
  50. Metzger, E.; Simonucci, C.; Viollier, E.; Sarazin, G.; Prévot, F.; Jézéquel, D. Benthic Response to Shellfish Farming in Thau Lagoon: Pore Water Signature. Estuar. Coast. Shelf Sci. 2007, 72, 406–419. [Google Scholar] [CrossRef]
  51. Oursel, B.; Garnier, C.; Durrieu, G.; Mounier, S.; Omanović, D.; Lucas, Y. Dynamics and Fates of Trace Metals Chronically Input in a Mediterranean Coastal Zone Impacted by a Large Urban Area. Mar. Pollut. Bull. 2013, 69, 137–149. [Google Scholar] [CrossRef]
  52. Murphy, J.; Riley, J.P. A Single-Solution Method for the Determination of Soluble Phosphate in Sea Water. J. Mar. Biol. Assoc. U. K. 1958, 37, 9–14. [Google Scholar] [CrossRef]
  53. Murphy, J.; Riley, J.P. A Modified Single Solution Method for the Determination of Phosphate in Natural Waters. Anal Chim Acta 1962, 27, 31–36. [Google Scholar] [CrossRef]
  54. Storms, M.A.; Natland, J.H. (Eds.) Ocean Drilling Program, 132 Initial Reports; Ocean Drilling Program: College Station, TX, USA, 1991; Volume 132. [Google Scholar]
  55. Ullman, W.J.; Sandstrom, M.W. Dissolved Nutrient Fluxes from the Nearshore Sediments of Bowling Green Bay, Central Great Barrier Reef Lagoon (Australia). Estuar. Coast. Shelf Sci. 1987, 24, 289–303. [Google Scholar] [CrossRef]
  56. Yuan-Hui, L.; Gregory, S. Diffusion of Ions in Sea Water and in Deep-Sea Sediments. Geochim. Cosmochim. Acta 1974, 38, 703–714. [Google Scholar] [CrossRef]
  57. Scholz, F.; Hensen, C.; Noffke, A.; Rohde, A.; Liebetrau, V.; Wallmann, K. Early Diagenesis of Redox-Sensitive Trace Metals in the Peru Upwelling Area—Response to ENSO-Related Oxygen Fluctuations in the Water Column. Geochim. Cosmochim. Acta 2011, 75, 7257–7276. [Google Scholar] [CrossRef]
  58. Sutherland, R.A. Bed Sediment-Associated Trace Metals in an Urban Stream, Oahu, Hawaii. Environ. Geol. 2000, 39, 611–627. [Google Scholar] [CrossRef]
  59. Billon, G.; Ouddane, B.; Laureyns, J.; Boughriet, A. Chemistry of Metal Sulfides in Anoxic Sediments. Phys. Chem. Chem. Phys. 2001, 3, 3586–3592. [Google Scholar] [CrossRef]
  60. Huerta-Diaz, M.A.; Tessier, A.; Carignan, R. Geochemistry of Trace Metals Associated with Reduced Sulfur in Freshwater Sediments. Appl. Geochem. 1998, 13, 213–233. [Google Scholar] [CrossRef]
  61. Crusius, J.; Calvert, S.; Pedersen, T.; Sage, D. EPSL Rhenium and Molybdenum Enrichments in Sediments as Indicators of Oxic, Suboxic and Sulfidic Conditions of Deposition. Earth Planet. Sci. Lett. 1996, 145, 65–78. [Google Scholar] [CrossRef]
  62. Helz, G.R.; Miller, C.V.; Charnock, J.M.; Mosselmans, J.F.W.; Pattrick, R.A.D.; Garner, C.D.; Vaughan, D.J. Mechanism of Molybdenum Removal from the Sea and Its Concentration in Black Shales: EXAFS Evidence. Geochim. Cosmochim. Acta 1996, 60, 3631–3642. [Google Scholar] [CrossRef]
  63. Erickson, B.E.; Helz, G.R. Molybdenum(VI) Speciation in Sulfidic Waters: Stability and Lability of Thiomolybdates. Geochim. Et Cosmochim. Acta 2000, 64, 1149–1158. [Google Scholar] [CrossRef]
  64. Morford, J.L.; Emerson, S. The Geochemistry of Redox Sensitive Trace Metals in Sediments. Geochim. Cosmochim. Acta 1999, 63, 1735–1750. [Google Scholar] [CrossRef]
  65. Zheng, Y.; Anderson, R.F.; Van Geen, A.; Fleisher, M.Q. Remobilization of Authigenic Uranium in Marine Sediments by Bioturbation. Geochim. Cosmochim. Acta 2002, 66, 1759–1772. [Google Scholar] [CrossRef]
  66. Burdige, D.J. The Biogeochemistry of Manganese and Iron Reduction in Marine Sediments. Earth-Sci. Rev. 1993, 35, 249–284. [Google Scholar] [CrossRef]
  67. Ingri, J.; Pekka, L.; Dauvalter, V.; Rodushkin, I.; Peinerud, E. Manganese Redox Cycling in Lake Imandra Manganese Redox Cycling in Lake Imandra: Impact on Nitrogen and the Trace Metal Sediment Record Manganese Redox Cycling in Lake Imandra. Biogeosci. Discuss 2011, 8, 273–321. [Google Scholar] [CrossRef]
  68. Gorny, J.; Billon, G.; Noiriel, C.; Dumoulin, D.; Lesven, L.; Madé, B. Chromium Behavior in Aquatic Environments: A Review. Environ. Rev. 2016, 24, 503–516. [Google Scholar] [CrossRef]
  69. Dellwig, O.; Schnetger, B.; Meyer, D.; Pollehne, F.; Häusler, K.; Arz, H.W. Impact of the Major Baltic Inflow in 2014 on Manganese Cycling in the Gotland Deep (Baltic Sea). Front. Mar. Sci. 2018, 5, 248. [Google Scholar] [CrossRef]
  70. Sitte, J.; Akob, D.M.; Kaufmann, C.; Finster, K.; Banerjee, D.; Burkhardt, E.M.; Kostka, J.E.; Scheinost, A.C.; Büchel, G.; Küsel, K. Microbial Links between Sulfate Reduction and Metal Retention in Uranium- and Heavy Metal-Contaminated Soil. Appl. Environ. Microbiol. 2010, 76, 3143–3152. [Google Scholar] [CrossRef]
  71. Gavriil, A.M.; Angelidis, M.O. Metal Diagenesis in a Shallow Semi-Enclosed Marine System in the Aegean Sea, Greece. Estuar. Coast. Shelf Sci. 2006, 70, 487–498. [Google Scholar] [CrossRef]
  72. Santos-Echeandia, J.; Prego, R.; Cobelo-García, A.; Millward, G.E. Porewater Geochemistry in a Galician Ria (NW Iberian Peninsula): Implications for Benthic Fluxes of Dissolved Trace Elements (Co, Cu, Ni, Pb, V, Zn). Mar. Chem. 2009, 117, 77–87. [Google Scholar] [CrossRef]
  73. Prajith, A.; Rao, V.P.; Chakraborty, P. Distribution, Provenance and Early Diagenesis of Major and Trace Metals in Sediment Cores from the Mandovi Estuary, Western India. Estuar. Coast. Shelf Sci. 2016, 170, 173–185. [Google Scholar] [CrossRef]
  74. Jokinen, S.A.; Jilbert, T.; Tiihonen-Filppula, R.; Koho, K. Terrestrial Organic Matter Input Drives Sedimentary Trace Metal Sequestration in a Human-Impacted Boreal Estuary. Sci. Total Environ. 2020, 717, 137047. [Google Scholar] [CrossRef] [PubMed]
  75. Jorgensen, B.B.; Kasten, S. Sulfur Cycling and Methane Oxidation. In Marine Geochemistry; Springer: Berlin/Heidelberg, Germany, 2006; pp. 271–309. ISBN 3540321438. [Google Scholar]
  76. Wang, W.; Wang, W.X. Trace Metal Behavior in Sediments of Jiulong River Estuary and Implication for Benthic Exchange Fluxes. Environ. Pollut. 2017, 225, 598–609. [Google Scholar] [CrossRef]
  77. Gao, Y.; Lesven, L.; Gillan, D.; Sabbe, K.; Billon, G.; De Galan, S.; Elskens, M.; Baeyens, W.; Leermakers, M. Geochemical Behavior of Trace Elements in Sub-Tidal Marine Sediments of the Belgian Coast. Mar. Chem. 2009, 117, 88–96. [Google Scholar] [CrossRef]
  78. Murray, J.W.; Dillard, J.G. The Oxidation of Cobalt(II) Adsorbed on Manganese Dioxide. Geochim. Cosmochim. Acta 1979, 43, 781–787. [Google Scholar] [CrossRef]
  79. Tapia, J.; Audry, S. Control of Early Diagenesis Processes on Trace Metal (Cu, Zn, Cd, Pb and U) and Metalloid (As, Sb) Behaviors in Mining- and Smelting-Impacted Lacustrine Environments of the Bolivian Altiplano. Appl. Geochem. 2013, 31, 60–78. [Google Scholar] [CrossRef]
  80. Sondi, I.; Mikac, N.; Vdović, N.; Ivanić, M.; Furdek, M.; Škapin, S.D. Geochemistry of Recent Aragonite-Rich Sediments in Mediterranean Karstic Marine Lakes: Trace Elements as Pollution and Palaeoredox Proxies and Indicators of Authigenic Mineral Formation. Chemosphere 2017, 168, 786–797. [Google Scholar] [CrossRef]
  81. Dang, D.H.; Tessier, E.; Lenoble, V.; Durrieu, G.; Omanović, D.; Mullot, J.U.; Pfeifer, H.R.; Mounier, S.; Garnier, C. Key Parameters Controlling Arsenic Dynamics in Coastal Sediments: An Analytical and Modeling Approach. Mar. Chem. 2014, 161, 34–46. [Google Scholar] [CrossRef]
  82. Audry, S.; Blanc, G.; Schäfer, J.; Chaillou, G.; Robert, S. Early Diagenesis of Trace Metals (Cd, Cu, Co, Ni, U, Mo, and V) in the Freshwater Reaches of a Macrotidal Estuary. Geochim. Cosmochim. Acta 2006, 70, 2264–2282. [Google Scholar] [CrossRef]
  83. Shaw, M. Early Diagenesis in Differing Depositional Environments: The Response of Transition Metals in Pore Water. Geochim. Cosmochim. Acta 1990, 54, 1233–1246. [Google Scholar] [CrossRef]
  84. Egger, M.; Lenstra, W.; Jong, D.; Meysman, F.J.R.; Sapart, C.J.; Van Der Veen, C.; Röckmann, T.; Gonzalez, S.; Slomp, C.P. Rapid Sediment Accumulation Results in High Methane Effluxes from Coastal Sediments. PLoS ONE 2016, 11, e0161609. [Google Scholar] [CrossRef]
  85. Mucci, A.; Richard, L.-F.; Lucotte, M.; Guignard, C. The Differential Geochemical Behavior of Arsenic and Phosphorus in the Water Column and Sediments of the Saguenay Fjord Estuary, Canada. Aquat. Geochem. 2000, 6, 293–324. [Google Scholar] [CrossRef]
  86. Lourino-Cabana, B.; Lesven, L.; Billon, G.; Denis, L.; Ouddane, B.; Boughriet, A. Benthic Exchange of Sedimentary Metals (Cd, Cu, Fe, Mn, Ni and Zn) in the Dele River (Northern France). Environ. Chem. 2012, 9, 485–494. [Google Scholar] [CrossRef]
  87. Hoffmann, M.; Mikutta, C.; Kretzschmar, R. Bisulfide Reaction with Natural Organic Matter Enhances Arsenite Sorption: Insights from X-Ray Absorption Spectroscopy. Environ. Sci. Technol. 2012, 46, 11788–11797. [Google Scholar] [CrossRef] [PubMed]
  88. Chaillou, G.; Anschutz, P.; Lavaux, G.; Schäfer, J.; Blanc, G. The Distribution of Mo, U, and Cd in Relation to Major Redox Species in Muddy Sediments of the Bay of Biscay. Mar. Chem. 2002, 80, 41–59. [Google Scholar] [CrossRef]
  89. Dang, D.H.; Evans, R.D.; Wang, W.; Omanović, D.; El Houssainy, A.; Lenoble, V.; Mullot, J.U.; Mounier, S.; Garnier, C. Uranium Isotope Geochemistry in Modern Coastal Sediments: Insights from Toulon Bay, France. Chem. Geol. 2018, 481, 133–145. [Google Scholar] [CrossRef]
  90. Anderson, R.F.; Lehuray, A.P.; Fleisher, M.Q.; Murray, J.W. Uranium Deposition in Saanich Inlet Sediments, Vancouver Island. Geochim. Cosmochim. Acta 1989, 53, 2205–2213. [Google Scholar] [CrossRef]
  91. Petranich, E.; Croce, S.; Crosera, M.; Pavoni, E.; Faganeli, J.; Adami, G.; Covelli, S. Mobility of Metal(Loid)s at the Sediment-Water Interface in Two Tourist Port Areas of the Gulf of Trieste (Northern Adriatic Sea). Environ. Sci. Pollut. Res. 2018, 25, 26887–26902. [Google Scholar] [CrossRef]
  92. Cukrov, N. Metal Dynamics in the Sediments of the Krka River Estuary. Ph.D. Thesis, University of Zagreb, Zagreb, Croatia, 2021. [Google Scholar]
  93. Sakellari, A.; Plavšić, M.; Karavoltsos, S.; Dassenakis, M.; Scoullos, M. Assessment of Copper, Cadmium and Zinc Remobilization in Mediterranean Marine Coastal Sediments. Estuar. Coast. Shelf Sci. 2011, 91, 1–12. [Google Scholar] [CrossRef]
  94. Rivera-Duarte, I.; Flegal, A.R. Porewater Gradients and Diffusive Benthic Fluxes of Co, Ni, Cu, Zn, and Cd in San Francisco Bay. Croat. Chem. Acta 1997, 70, 389–417. [Google Scholar]
  95. Williams, M.R.; Millward, G.E.; Nimmo, M.; Fones, G. Fluxes of Cu, Pb and Mn to the North-Eastern Irish Sea: The Importance of Sedimental and Atmospheric Inputs. Mar. Pollut. Bull. 1998, 36, 366–375. [Google Scholar] [CrossRef]
Figure 1. Map of the Krka River estuary. The yellow polygon represents the former Fe-Mn factory, and the green polygon represents the Šibenik Port. The black square represents the study area.
Jmse 12 00466 g001
Figure 2. The pore water profiles of PO43−, NH4+, SO42−, ∑HS, DOC, and DIC in the sediment cores K1–K5. The dashed line marks the sediment–water interface (SWI).
Jmse 12 00466 g002
Figure 3. The pore water profiles of dissolved Fe and Mn in the sediment cores K1–K5. The dashed line marks the sediment–water interface (SWI).
Jmse 12 00466 g003
Figure 4. The vertical distribution of metals (Co, Cu, Zn, Pb, U, Mo, V, As, and Cr) in the overlying water and pore water of sediment cores K1–K5. The dashed line marks the sediment–water interface (SWI). Note that the scale for each plot may be different.
Jmse 12 00466 g004
Figure 5. The vertical distribution of Corg, S, P, Fe, and Mn in the sediment cores K1–K5. Note that the scale for each plot may be different.
Jmse 12 00466 g005
Figure 6. The vertical distribution of metals (Co, Cu, Zn, Pb, U, Mo, and As) in the sediment cores K1–K5. Note that the scale for each plot may be different.
Jmse 12 00466 g006
Figure 7. The vertical distribution of metal/Li ratios in the sediment cores K1–K5. The dotted line represents the local background value. Note that the metal/Li scale for each plot may be different.
Jmse 12 00466 g007
Table 1. The minimum, maximum and mean value of calculated EFs for cores K1–K5.
EF
K1K2K3K4K5
MinMaxMeanMinMaxMeanMinMaxMeanMinMaxMeanMinMaxMean
U1.002.991.860.6491.100.9040.9341.211.061.465.842.626.8119.210.6
Fe0.9421.421.070.8190.9750.8611.261.381.331.312.731.771.592.151.82
Mn0.6791.180.9470.7421.310.9770.7580.8060.79037.210672.63.879.445.13
Co0.8761.481.090.7021.060.8291.101.311.212.475.233.872.033.852.68
Cu0.9722.811.740.5641.050.7771.641.951.816.4216.310.912.117.314.0
Zn0.9413.441.670.8781.471.121.401.581.486.7917.512.627.757.644.0
Pb0.95345.57.920.7371.491.041.131.171.159.3546.224.213.218.415.4
As0.9691.601.200.7651.361.091.441.641.572.908.014.615.097.846.26
Mo0.9305.262.470.4610.8830.6250.9131.261.053.4416.17.302.433.673.03
Table 2. The benthic diffusive fluxes of metals at the SWI in the Krka River estuary. The negative fluxes (in bold) indicate the release of metals from the sediment to the overlying water column.
ElementFlux (nmol cm−2 y−1)
K1K2K3K4K5
Fe−129−912−747−274−160
Mn−1206−3741−613−3178−2996
Co−0.080−1.370.054−0.310−0.709
Cu−0.1120.295−7.860.051−0.061
Zn38.9−16.11.270.219−7.95
Pb−0.008−0.136−0.025−0.238−0.186
Mo0.619−8.16−3.50−13.2−3.20
U0.188−0.0580.2150.0240.015
As−4.24−7.17−5.49−2.10−8.71
Table 3. Comparison between the estimated benthic fluxes (the Krka River estuary) and riverine fluxes of the metals (Krka River).
Benthic FluxRiverine Flux
(kg y−1)(kg y−1)
Fe52202210
Mn27,1007080
Co6.0026.9
Cu20.5344
Pb5.1614.4
Mo111905
As87.3254
Disclaimer/Publisher’s Note: The statements, opinions and data contained in all publications are solely those of the individual author(s) and contributor(s) and not of MDPI and/or the editor(s). MDPI and/or the editor(s) disclaim responsibility for any injury to people or property resulting from any ideas, methods, instructions or products referred to in the content.

