Article

Analysis of Factors Affecting Vacuum Formation and Drainage in the Siphon-Vacuum Drainage Method for Marine Reclamation

1
College of Civil Engineering and Architecture, Zhejiang University, Hangzhou 310058, China
2
Ocean College, Zhejiang University, Zhoushan 316021, China
3
Zhejiang Seaport Engineering Construction Consultants Co., Ltd., Ningbo 315800, China
4
Zhejiang Electric Power Design Institute, Hangzhou 310012, China
5
Power China Huadong Engineering Corporation Limited, Hangzhou 311122, China
*
Author to whom correspondence should be addressed.
J. Mar. Sci. Eng. 2024, 12(3), 430; https://doi.org/10.3390/jmse12030430
Submission received: 21 January 2024 / Revised: 17 February 2024 / Accepted: 23 February 2024 / Published: 28 February 2024
(This article belongs to the Special Issue Advance in Marine Geotechnical Engineering)

Abstract

:
Traditional drainage methods for marine reclamation typically consume large amounts of energy and have a negative environmental impact. The siphon-vacuum drainage method (SVD) automatically forms a vacuum and drains using less energy. It has significant potential for research and application. In this study, a theoretical model is used to calculate the vacuum formation process and drainage rate. Qualitative analysis and global sensitivity analysis were conducted to investigate the effect of various factors in the SVD on vacuum formation and drainage. The qualitative analysis suggests that modifying the length and diameter of the siphon pipe and the thickness of the sealing soil column to increase the siphon rate can improve the vacuum degree and drainage efficiency. Sobol global sensitivity analysis reveals that the sealing soil column thickness is the main factor affecting the vacuum, with a first-order sensitivity index accounting for up to 79.48%. The impact of cylinder diameter and the local resistance coefficient (0.43%) can be almost neglected. A fitting equation for estimating the maximum achievable vacuum is provided. Calculations show that the vacuum formed by the SVD can reach over 80 kPa. This work can help optimize SVD design and advance environmentally friendly marine reclamation projects.

1. Introduction

Many developed regions are situated in coastal areas, benefiting from access to maritime resources and trade routes. The demand for land is escalating due to population growth and economic expansion in these areas. The marine reclamation method can be used to increase the land area in coastal regions [1]. Marine dredged soil, commonly utilized in reclamation, has characteristics including high compressibility, high water content, low bearing capacity, and low permeability [2,3,4]. The drainage consolidation method is economical and efficient, making it a prevalent choice for large-scale marine reclamation [5,6,7,8]. Techniques such as surcharge preloading, vacuum preloading, and electroosmosis are often employed for drainage [9,10,11]. The surcharge preloading applies an external load to the soil surface to promote water expulsion. The vacuum preloading enhances drainage by creating a vacuum under a membrane, reducing pore water pressure. Electroosmosis uses electric currents to drive water and ion movement, facilitating soil dewatering. Among them, vacuum preloading is widely used. It has been implemented in various projects, including the Tianjin Lingang Economic Zone in China [12], the expansion of Fisherman Island in Australia [13], and land reclamation in Singapore [14].
However, vacuum preloading requires a considerable amount of electricity. Traditional vacuum pumps require 75 kW for every 10,000 m2 of soft soil, and a new water and gas separation vacuum pump demands 25 kW [15]. In most cases, vacuum preloading lasts at least 90 days. If the electricity originates from coal, this process will result in significant carbon dioxide emissions. Furthermore, the transmission and maintenance of the vacuum will consume a considerable amount of materials [16]. Taking the maintenance of the vacuum as an example, a significant amount of plastic film is required for sealing. The production and disposal of plastic film can lead to greenhouse gas emissions. Additionally, the abandonment of plastic film can lead to soil and water pollution. Today, climate change and environmental pollution have become global concerns [17,18]. Consequently, exploring low-carbon and environmentally friendly methods is an effective measure to alleviate these issues.
Siphon is a gravity-driven drainage method that operates without the need for external power [19]. However, the siphon drainage at high lift will be interrupted due to air accumulation. Cai et al. [20] found that small-diameter siphon pipes could solve this problem, allowing the siphon to work effectively for a long time. These small-diameter siphon pipes have been successfully applied in slope drainage engineering. Sun et al. [21] applied the siphon drainage method to soft soil drainage first. The pore water within the soft soil seeps into the vertical drainage wells under the action of a siphon. The model tests have shown that siphon drainage could reduce the water level in soft soil, enhance drainage efficiency, lower the pore water pressure, and thereby increase the effective stress of the soft soil. Shen et al. [22] conducted a full-scale field test on improving soft soil using the siphon drainage method. The results indicated a 2.78 m drop in groundwater levels and a settlement of 17.82 cm after 16.5 days of employing siphon. This method eliminates the necessity for vacuum pumps, sealing membranes, and sand cushions. Furthermore, it is easy to construct and maintain in engineering projects. In summary, the siphon drainage method emerges as an economical, low-carbon, and environmentally friendly method for improving marine dredged soil. However, groundwater seepage occurs due to its own weight in siphon drainage. The drainage effect of the siphon drainage method on surface soil is not as effective as vacuum preloading, which relies on vacuum pressure.
In vacuum preloading, the vacuum pressure is used to discharge pore water, thereby inducing soil consolidation [23]. In addition, the drainage rate has an impact on both project duration and costs. The increase in vacuum pressure can facilitate drainage. Therefore, the effectiveness and economy of the siphon drainage method for improving soft soils can be enhanced by the addition of vacuum pressure. The siphon-vacuum drainage method (SVD) is shown in Figure 1. This method uses a siphon to automatically create vacuum pressure innovatively in soft soil. Shu et al. [24] have studied the mechanism of vacuum formation and developed a theoretical model to calculate the vacuum pressure and drainage rate. The vacuum pressure and drainage are influenced by factors in the SVD. In order to achieve greater vacuum pressure and better drainage effectiveness, it is necessary to analyze the factors in the SVD.
This research aims to improve understanding of how SVD factors affect vacuum formation and drainage for better marine reclamation. Firstly, the model for calculating the vacuum pressure and drainage rate is summarized. Then, the qualitative effects of each factor on vacuum formation and drainage are analyzed by the calculation results. Moreover, a global sensitivity analysis was conducted to obtain the proportion that each factor affects vacuum formation. Finally, the maximum vacuum degree that can be formed theoretically by the SVD was calculated. The results of this study can serve as a basis for the optimized design of the SVD.

2. Qualitative Analysis of Vacuum Pressure and Drainage

2.1. Calculation Method

2.1.1. Cylindrical Model

When dealing with large-scale marine dredged soil, a large number of vertical drainage wells are typically inserted into the dredged soil. The strength of marine dredged soils is improved, as pore water flows into vertical drainage wells. The vertical drainage bodies are arranged in a certain form. As shown in Figure 2, the common forms of arrangement are square and equilateral triangles. Square and hexagonal units are obtained by uniformly dividing the soil layers. The units are simplified to a circle for ease of calculation. The conversion equations between the diameter of the circle (de) and the spacing of the vertical drainage wells (l) are, respectively:
d e = l 4 / π
d e = l 2 3 / π
When improving marine dredged soil with the SVD, the siphon pipes and permeable chambers will be inserted into the soil layer. The simplified cylindrical model of a single permeable chamber is shown in Figure 3. The bottom and sides of the cylinder are impermeable. The initial groundwater level is located at the surface of the soil layer. The bottom of the permeable chamber is situated at the bottom of the cylinder, and the permeable chamber is sealed by saturated dredged soil. The thickness of the sealing soil column above the chamber is represented by hs. The center point at the bottom of the permeable chamber serves as the origin (0, 0) for a two-dimensional axisymmetric coordinate system.

2.1.2. Calculation Equations

After the SVD starts, both the air pressure and the water level in the permeable chamber will decrease. The air pressure at point A (pA, t) will become negative. The pore water in the dredged soil will seep into the permeable chamber and then be discharged through the siphon. A theoretical model of vacuum formation has been developed by Shu et al. [24]. The model involves detailed equations derivations for the three processes of siphon drainage, seepage drainage, and changes in air pressure. The calculations are based on the principle of energy conservation for siphon drainage The Dupuit assumption is used to describe the distribution of seepage velocities. The non-steady seepage process is broken down into a sequence of steady flows, which are solved iteratively. It is assumed that the gas within the permeable chamber dissolves and releases in water almost immediately.
In this study, the equations in the model are generalized and simplified. The SVD factors involved in the three processes are summarized. The flow rate of siphon drainage (Uout, t) and the amount of gas dissolved in it (Vout, t) can be expressed by Equations (3)–(5):
a out ,   t = h w ,   t 1 + p A ,   t 1 γ w H 0 + p s γ w g L 1 d 4 d pc 4 + ζ i u out ,   t 1 2 2 L π 2 r 4 λ u out ,   t 1 2 4 π 2 r 5
U out ,   t = π r 2 i = 1 t 1 a out ,   t i Δ t + a out ,   t Δ t 2 Δ t
V out ,   t = γ w h w ,   t 1 h c + p A ,   t 1 + p s p s V m U out ,   t
where aout, t is the acceleration of siphon at time t; hw, t−1 is the water level in the permeable chamber at time t−1; pA, t−1 is the air pressure of point A at time t−1; uout, t−1 is the siphon drainage velocity at time t−1; H0 is the depth of the permeable chamber; ps is the standard atmospheric pressure (101.3 kPa); ζi and λ are the local and frictional resistance coefficients of the siphon pipe, respectively; γw is the weight of water; d and r are the diameter and radius of the siphon pipe, respectively; dpc is the diameter of the permeable chamber; Δt is the time interval; hc is the distance between the inlet of the siphon pipe and the bottom of the permeable chamber; and Vm is the solubility of gas dissolved in water under standard atmospheric pressure. According to Equations (3)–(5), the factors L, d, dpc, ζi, and λ in the SVD are related to the siphon drainage.
The water level (h′w, t) and the total volume of gas (V′all, t) in the permeable chamber after siphon drainage are as follows:
h w ,   t = h w ,   t 1 U out ,   t / π r pc 2
V all ,   t = V all ,   t 1 V out ,   t
where rpc is the radius of the permeable chamber, and Vall, t−1 is the total volume of gas in the chamber at time t−1.
The gas in the chamber will reach a balance between dissolution and release. The relationship between the total volume of gas in the chamber (V′all, t) and the air pressure at point A (pA, t) can be expressed as follows:
π H 0 h s h w ,   t p A ,   t + p s r pc 2 / p s + 0.5 γ w h w ,   t + p A ,   t + p s V m π h w ,   t r pc 2 / p s = V all ,   t
where hs is the thickness of the sealing soil column. The first term on the left side of the equation represents the volume of the gaseous gas in the cavity, while the second term represents the volume of the dissolved gas in the water within the chamber. According to Equations (6)–(8), the factors hs and dpc in the SVD are related to the changes in air pressure.
Due to the short time of vacuum formation, the seepage at this stage is dominated by the horizontal direction. Therefore, only seepage in the horizontal direction is considered in this model. The flow rate of the seepage (Uin, t) and the amount of gas dissolved in it (Vin, t) can be expressed by Equations (9) and (10).
U in ,   t = 2 π K h Δ t ln d e d pc 0 H 0 h s H 0 H r pc , z , t dz
V in ,   t = 2 π K h Δ t ln d e d pc 0 H 0 h s γ w H 0 z + p s p s V m H 0 H r pc , z , t dz
where H(rpc, z, t) represents the boundary conditions at the outlet of seepage, and Kh is the horizontal hydraulic conductivity. According to Equations (9) and (10), the factors Kh, hs, de, and dpc in the SVD are related to the seepage drainage.

2.2. Results and Discussion of Vacuum Pressure and Drainage

The above equations were compiled using MATLAB. Time was discretized into multiple steps, and the iterative calculation method is based on the results of the previous step to compute the results of the next step. The calculations within each step follow the sequence of siphon drainage, resulting in changes in air pressure and water level, subsequent seepage, and the corresponding variations of air pressure and water level. When the air pressure reaches its minimum value, the process of vacuum formation is considered complete.

2.2.1. Vacuum Pressure

The theoretical model has been validated by full-scale field test results [24], with one such test result depicted in Figure 4, including both measured and calculated results. Table 1 provides the parameters of the field test. In the test, permeable chambers were arranged in a square pattern with a spacing of 0.9 m. The diameter (de) of the cylinder was calculated to be 1.015 m according to Equation (1). As shown in Figure 4, the model calculation results are in good agreement with the measured results. At 351 s, the measured results show that the air pressure reaches its minimum value at −42.7 kPa, the model calculation result is −41.5 kPa. The air pressure rapidly decreases in the first 50 s. After 100 s, the rate of air pressure decline significantly slows down. Before 400 s, the air pressure stabilizes essentially.
Although the theoretical model disregards the time for gas dissolution and release in water, it still effectively simulates the vacuum formation process. Thus, the model can be used to analyze the impact of various factors on vacuum formation. If more accurate equations could be proposed to represent seepage and siphon drainage, the calculated results of the vacuum formation process would align more closely with the measured results.

2.2.2. Drainage

The water storage within the chamber is influenced by both siphon drainage and seepage drainage. The siphon drainage reduces the water storage within the chamber, while seepage drainage increases it. The flow rates of siphon drainage and seepage drainage are calculated based on the theoretical model described above. The model parameters are as given in Table 1. The model calculation results for the flow rate of siphon drainage and seepage drainage are given in Figure 5. The area of the shaded part is the result of the change in water storage within the chamber. The process of vacuum formation is divided into an early stage and a later stage. In the early stage, the flow rate of the siphon experiences a brief, rapid increase, and it is significantly greater than that of seepage. Hence, siphon drainage plays a dominant role in the variability of water storage within the chamber during this early stage. Subsequently, the flow rate of the siphon decreased while the flow rate of seepage gradually increased. The impact of seepage drainage in the later stage is strengthened. At 400 s, the flow rate of seepage drainage is very similar to that of siphon drainage.
The flow change trends of siphon and seepage by calculations are consistent with theoretical analysis. Considering the agreement between the calculated and measured results of air pressure, it is believed that the model can be utilized to calculate the seepage flow rate. Thus, the calculated results can also be used to analyze the effects of various factors on seepage. However, for computational efficiency, the model uses stable well flow theory instead of actual unstable seepage, which makes it unsuitable for calculating seepage over extended periods.
The effectiveness of the SVD in improving marine dredged soil is related to the amount of pore water discharge. The pore water is discharged through seepage. Therefore, the flow rate of seepage drainage was selected to evaluate the effectiveness of the SVD in discharging pore water from marine dredged soil.

2.3. Results and Discussion on the Impact of Factors

The discharge of pore water from marine dredged soil using the SVD involves three main processes: siphoning, air pressure changes in the chamber, and seepage. Therefore, the siphon, chamber size, and seepage flow rate are the primary aspects influencing vacuum formation and drainage. Factors affecting the siphon flow rate include the siphon pipe length (L), the minor head loss coefficient of the siphon pipe (ζ), and the diameter of the siphon pipe (d). Factors influencing chamber size include the thickness of the sealing soil column (hs) and the diameter of the permeable chamber (dpc). Additionally, factors affecting the flow rate of seepage include the horizontal permeability coefficient (Kh), the diameter of the permeable chamber (dpc), and the diameter of the cylindrical model (de).
Based on the engineering conditions and the dimensions of existing materials, different values for these factors are selected to calculate vacuum formation and drainage. Furthermore, the effects of these factors on vacuum formation and drainage were analyzed. The factor values for the reference scenario (0-0) are shown in Table 1. Fourteen scenarios have been designed to investigate the influence of seven factors. Table 2 provides the values for these fourteen scenarios.

2.3.1. Diameter of Siphon Pipe

Figure 6 presents the variation curves of vacuum formation and drainage rate (total seepage rate) for different diameters of siphon pipes (d). As shown in Figure 6a, there are significant differences observed in the pressure variation among the three scenarios during the early stage. In the later stage, the pressure change for all three scenarios becomes relatively gradual. The larger the diameter of the siphon pipe (d), the smaller the final air pressure formed (greater vacuum degree). The impact of the diameter (d) on the final vacuum degree is relatively small. A comparison between Figure 6b and Figure 6a reveals that the impact of the diameter of the siphon pipe (d) on drainage is similar to its effect on vacuum formation. The effect of the siphon pipe diameter (d) on drainage and vacuum formation is similar when comparing Figure 6b with Figure 6a.
The diameter of the siphon pipe (d) primarily affects the siphon rate and does not directly influence seepage. A larger siphon rate results in a faster decrease in water storage and air pressure within the chamber (cavity enlargement). The seepage rate is increased by the smaller water pressure (volume of water storage) and air pressure in the chamber. Additionally, the siphon primarily impacts the early stage of drainage. Therefore, the diameter of the siphon pipe (d) mainly affects the vacuum formation and drainage in the early stages. Although the vacuum degree and drainage rate can be increased by using a larger diameter of siphon pipe (d), the increase is small.

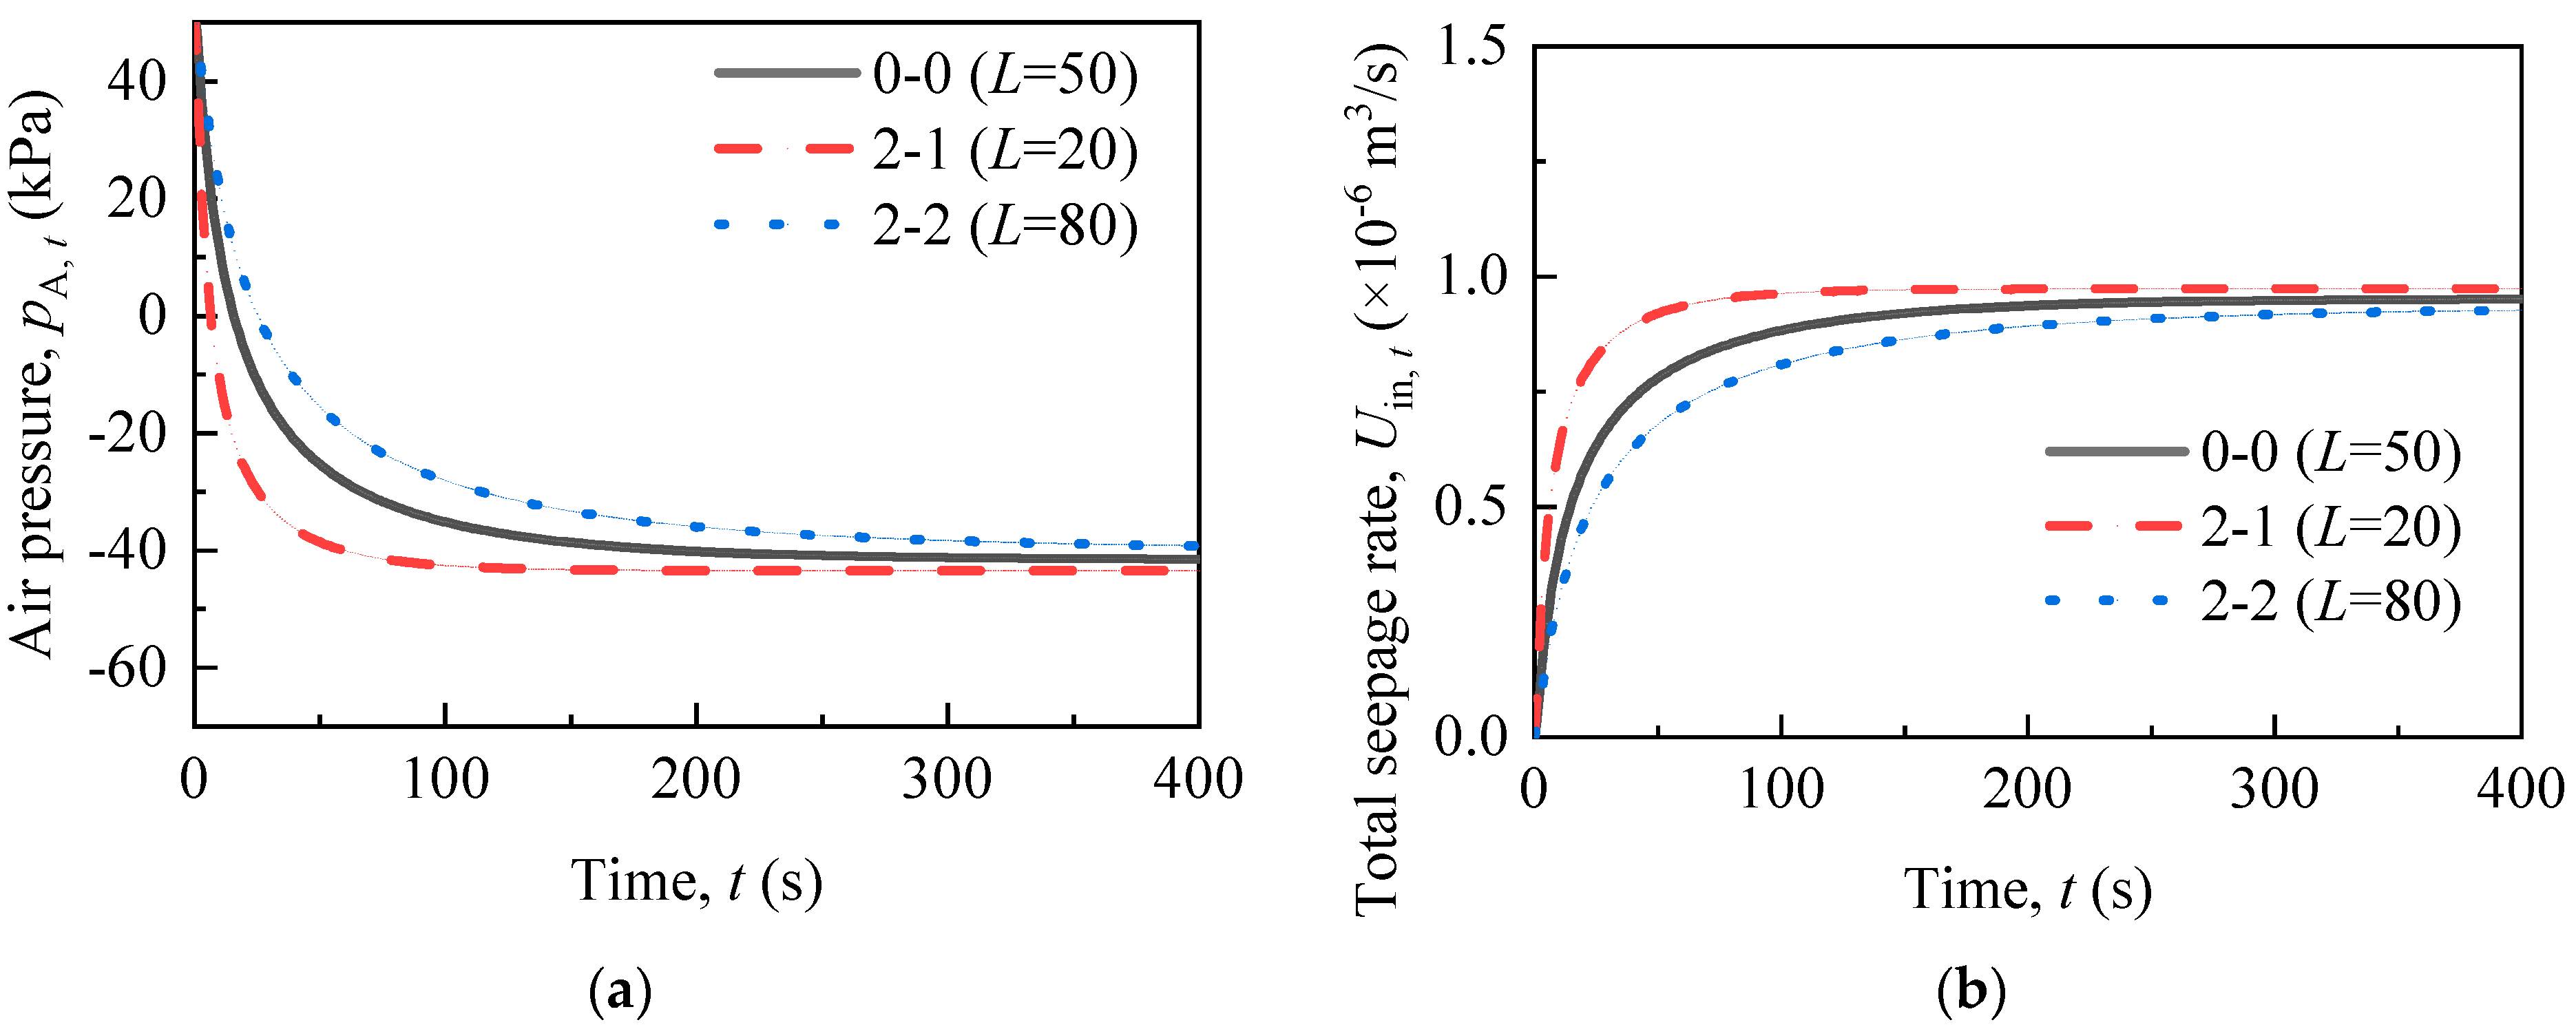
2.3.2. Length of Siphon Pipe

As the siphon pipe length (L) increases, the resulting vacuum degree and drainage rate decrease, as shown in Figure 7. The siphon pipe length (L) affects the frictional resistance along the siphon pipe. As a result, it also only influences the early stages of vacuum formation and drainage through the siphon rate. The frictional resistance increases due to the increase in siphon pipe length (L). This resistance diminishes the siphon rate, thereby resulting in a lower vacuum degree. It is observed that the siphon pipe length (L) has a relatively minor effect on the final vacuum degree and drainage rate, according to Figure 7.

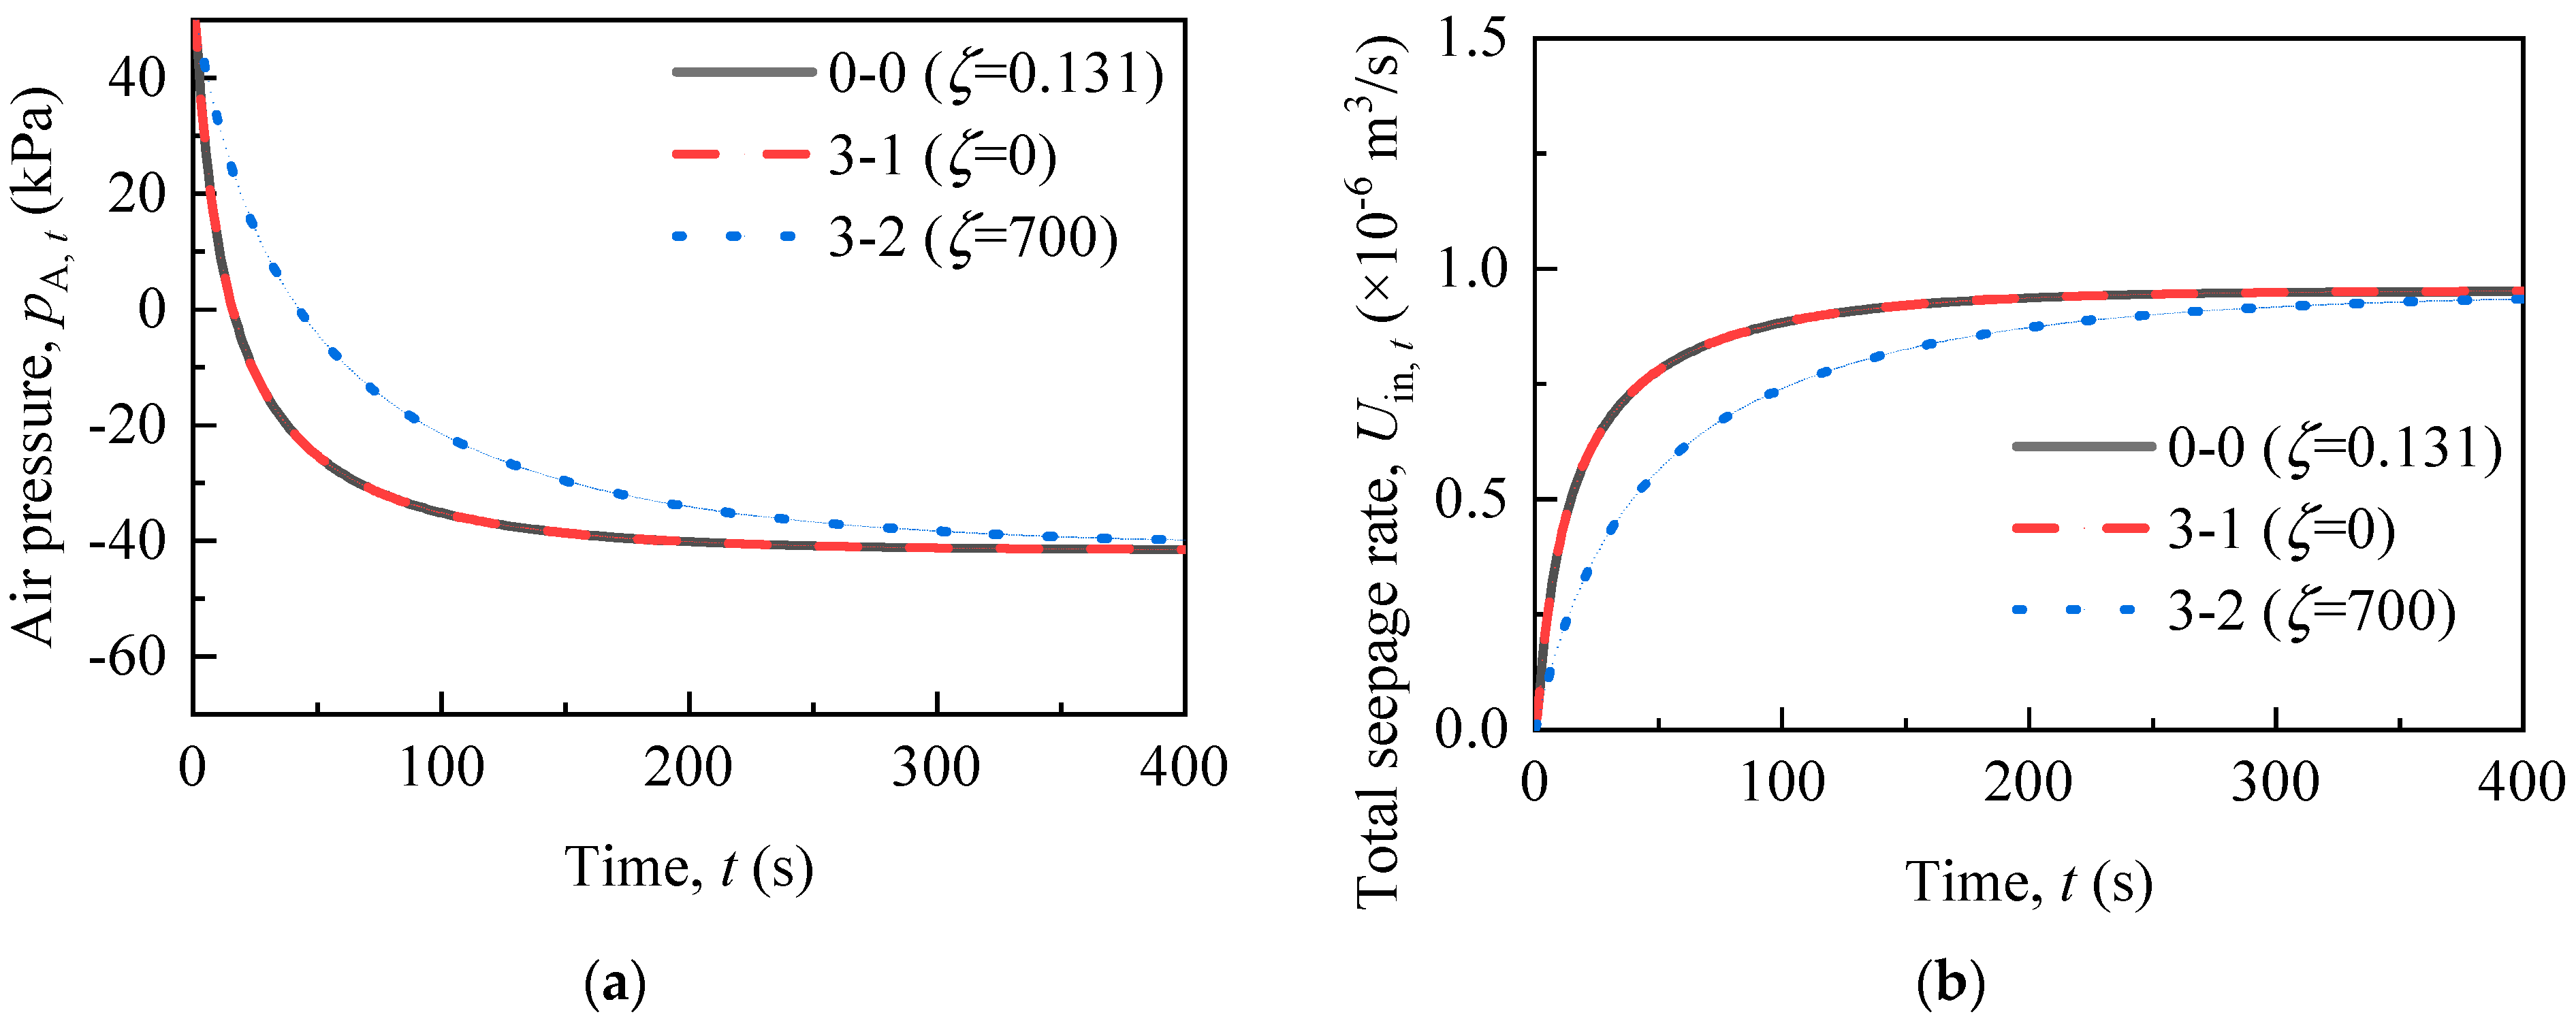
2.3.3. Local Resistance Coefficient of Siphon Pipe

The local resistance coefficient (ζ) affects vacuum formation and drainage in the same way as the siphon pipe length (L). The siphon rate can be reduced by increasing the local resistance coefficient (ζ). Figure 8 shows that the process of vacuum formation and the increase in drainage rate slows down at a local resistance coefficient of 700. However, the final vacuum degree and drainage rate are almost unaffected. A local resistance coefficient (ζ) of 700 is an unusually large value. This unusual local resistance may occur when the siphon pipe is accidentally bent. However, the local resistance hardly discounts the final vacuum degree and drainage rate formed by the SVD. It shows that the siphon pipe has some resistance to risk. The siphon pipe can effectively perform its intended function when it is neither leaking nor clogging.

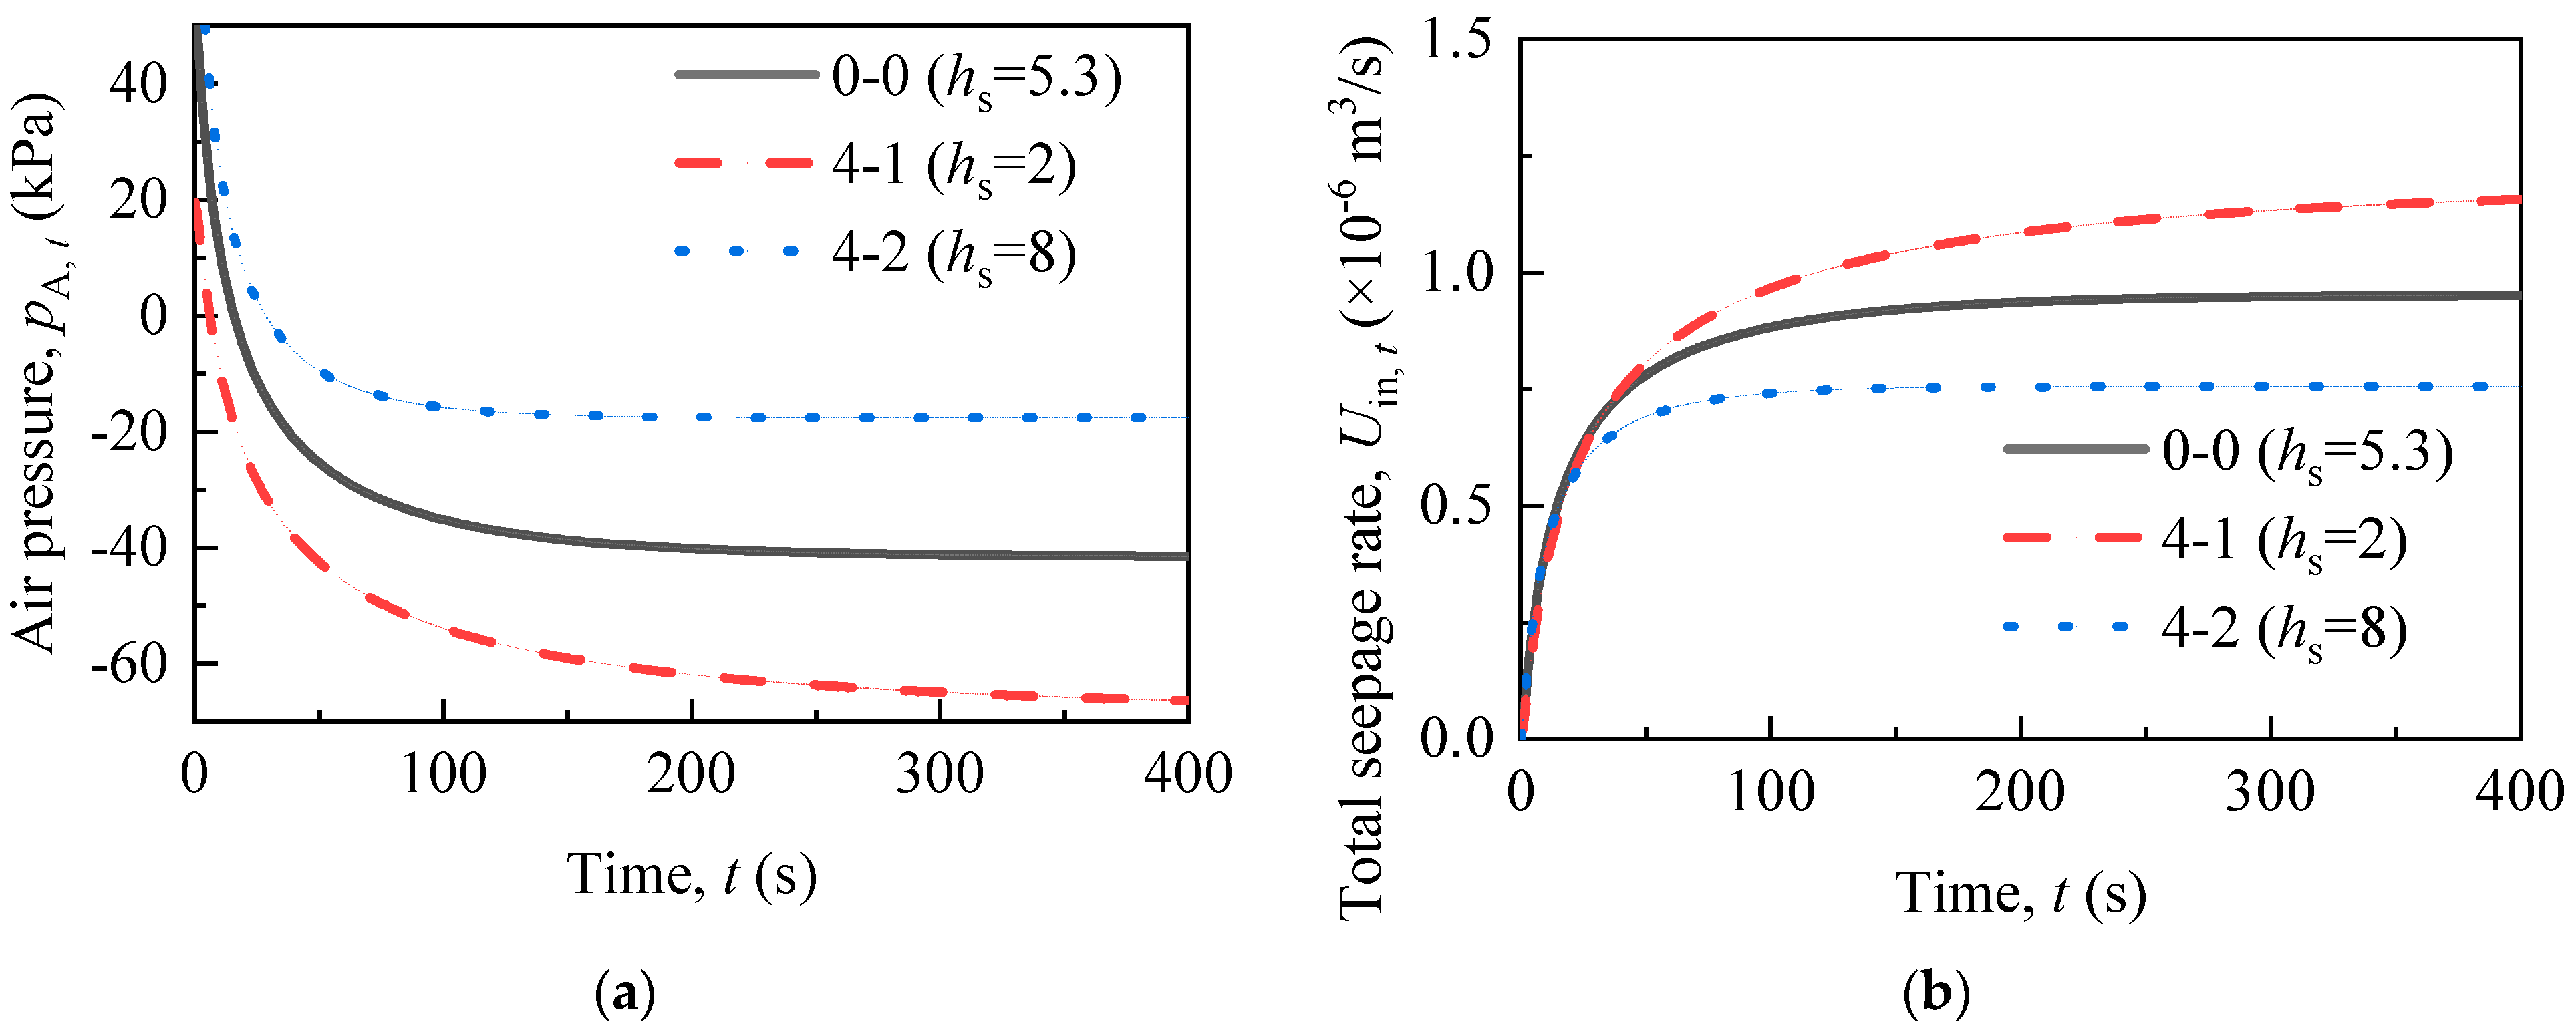
2.3.4. Thickness of Sealing Soil Column

The thickness of the sealing soil column (hs) determines the height of the permeable chamber. The cavity formation and air pressure changes are influenced by the volume of the permeable chamber. The surface area of the chamber determines the cross-sectional area of the seepage. As shown in Figure 9a, the thickness (hs) has a significant impact on the early stage of vacuum formation and the final vacuum degree. A lower thickness (hs) results in more water storage in the chamber. More time is required to discharge more water storage in order to achieve a balance between siphon and seepage rates. Hence, the process of vacuum formation will be more gradual and prolonged in scenarios where the thickness (hs) is smaller.
The effect of the thickness of the sealing soil column (hs) on the drainage rate is similar to its effect on the vacuum formation (Figure 9a,b). The thickness (hs) affects both the vacuum formation and the cross-sectional area. In scenario 4-1, a greater vacuum degree results in a greater seepage velocity. Additionally, the cross-sectional area in scenario 4-1 is larger, resulting in a greater seepage rate. Consequently, the difference in seepage rates between the three scenarios gradually becomes significant in the later stages.
The effect of the sealing soil column thickness (hs) on both vacuum formation and drainage rate is significant. Decreasing the thickness of the sealing soil column (hs) is beneficial for increasing both the final vacuum degree and the drainage rate. Therefore, it is an important factor that requires particular attention in engineering applications.

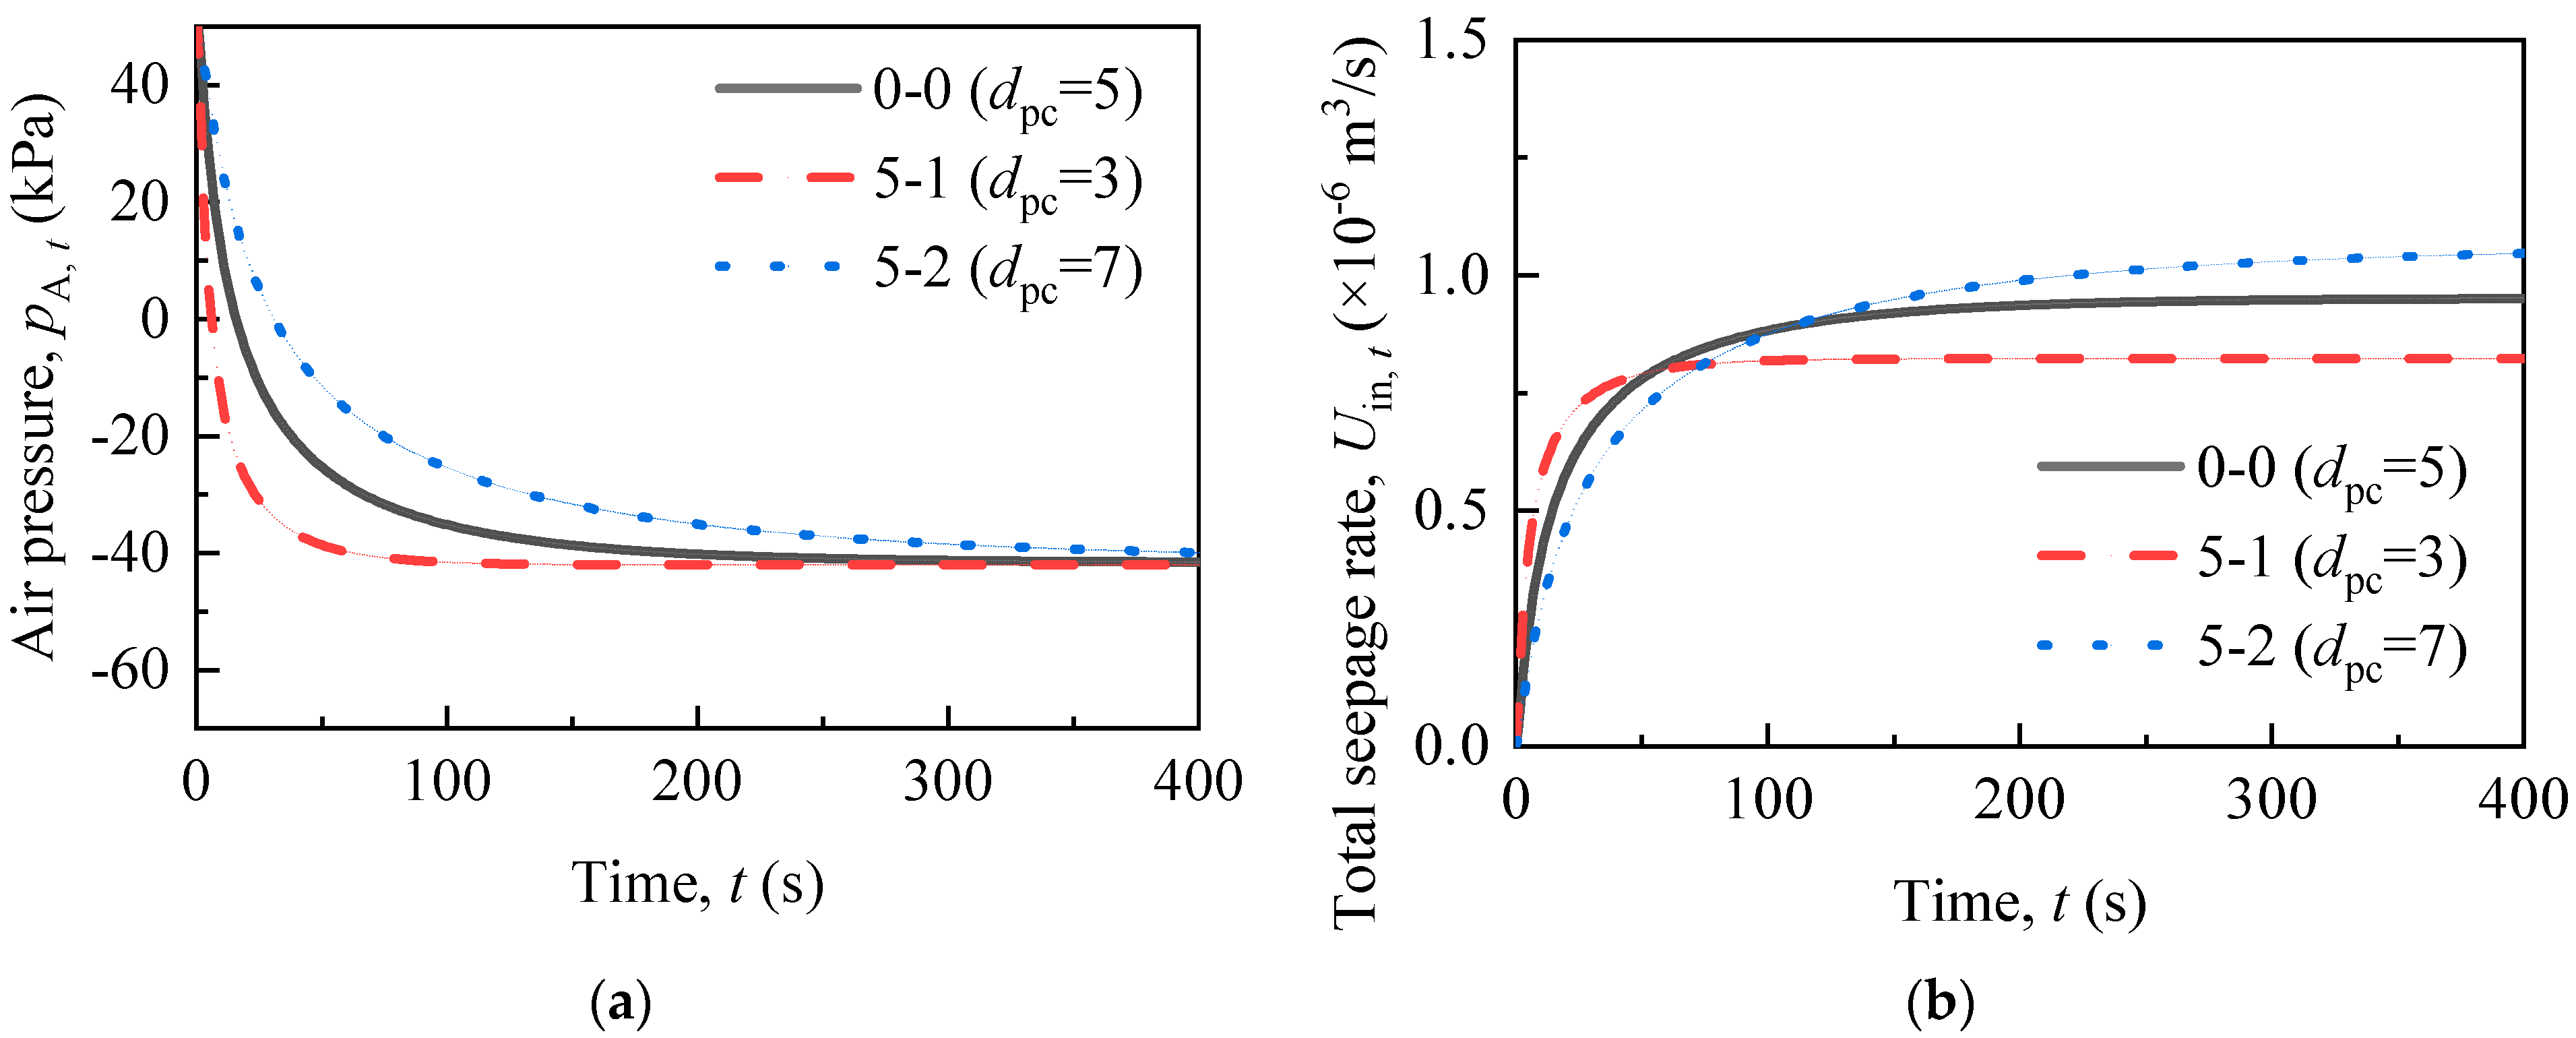
2.3.5. Diameter of Permeable Chamber

The vacuum formation curves at different diameters of the permeable chambers (dpc) are presented in Figure 10a. The diameter of the chambers (dpc) affects both the permeable chamber volume and the cross-sectional area of the seepage, which is similar to the thickness of the sealing soil column (hs). However, the effects of the two on vacuum formation are not the same. The diameter of the chamber (dpc) changes the time required to achieve a stable vacuum degree but has very little effect on the final vacuum degree. This is because the increase in the diameter of the permeable chamber has a greater promoting effect on seepage, leading to the seepage flow rate approaching the siphon flow rate more quickly.
There is an intersection in the drainage rate curves between scenarios 5-1 and 5-2 (Figure 10b). The increase in the diameter (dpc) slows down the vacuum formation, resulting in a slow growth of the seepage rate in the early stages. However, the vacuum degrees of the three scenarios are essentially similar in the later stage. A larger diameter of the chamber (dpc) results in a greater cross-sectional area, enabling a higher seepage rate in the later stage. Therefore, increasing the inner diameter of the permeable chamber (dpc) appropriately can expedite drainage and reduce construction time.

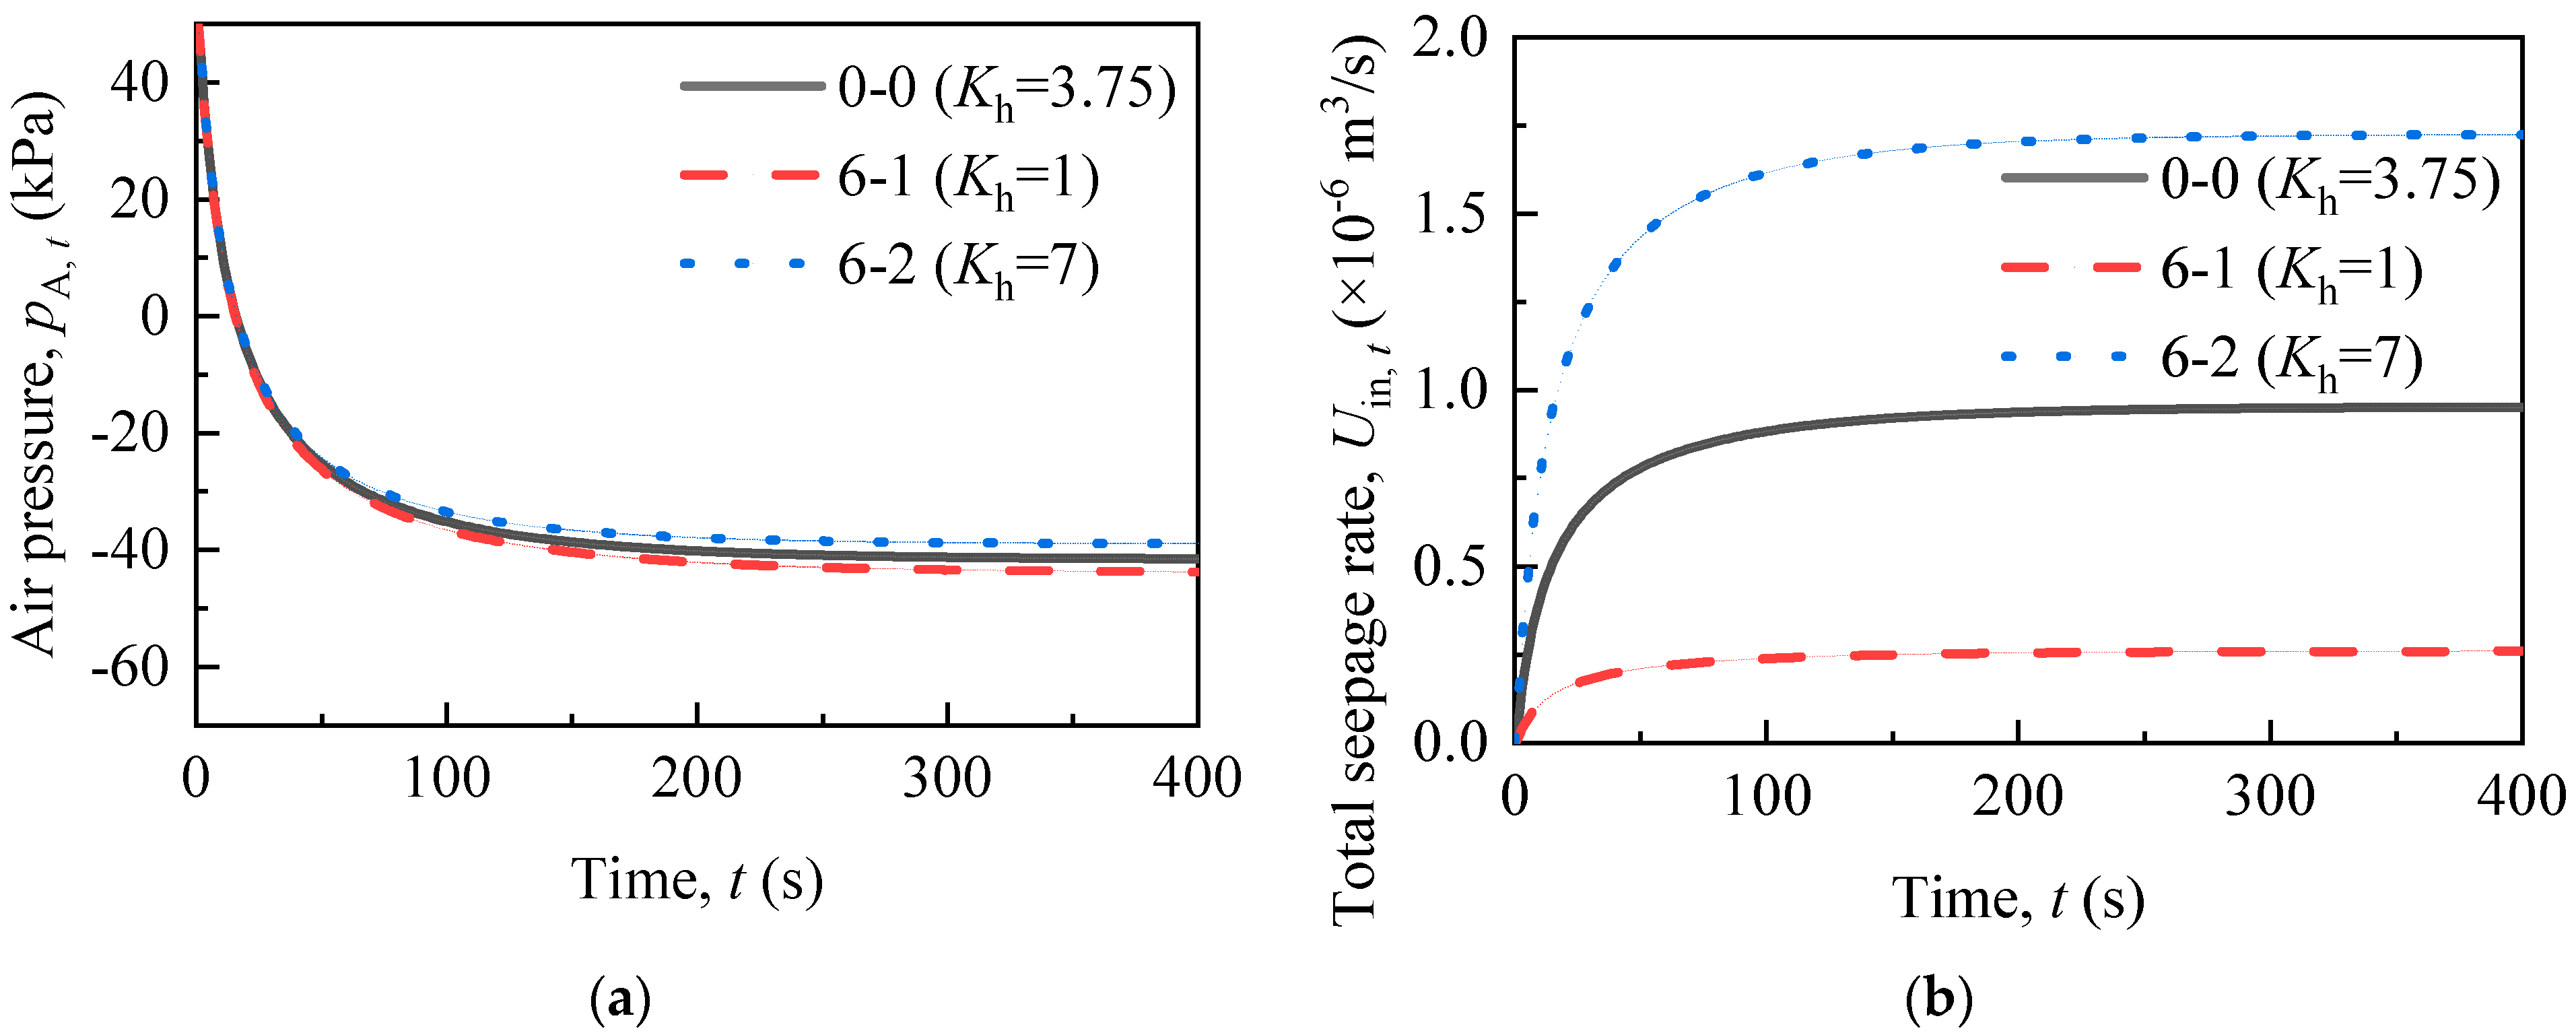
2.3.6. Horizontal Hydraulic Conductivity

The seepage rate is influenced directly by the horizontal hydraulic conductivity (Kh). Therefore, the horizontal hydraulic conductivity (Kh) primarily influences the later stages of vacuum formation and drainage. As shown in Figure 11, the influence of the horizontal hydraulic conductivity (Kh) on the seepage rate is significant, while its effect on the vacuum degree is minor. It shows that the vacuum formation in low-permeability soil is mainly affected by siphon drainage and permeable chamber size. The hydraulic conductivity is an inherent property of the soil and can be challenging to adjust. However, a higher hydraulic conductivity contributes to drainage.

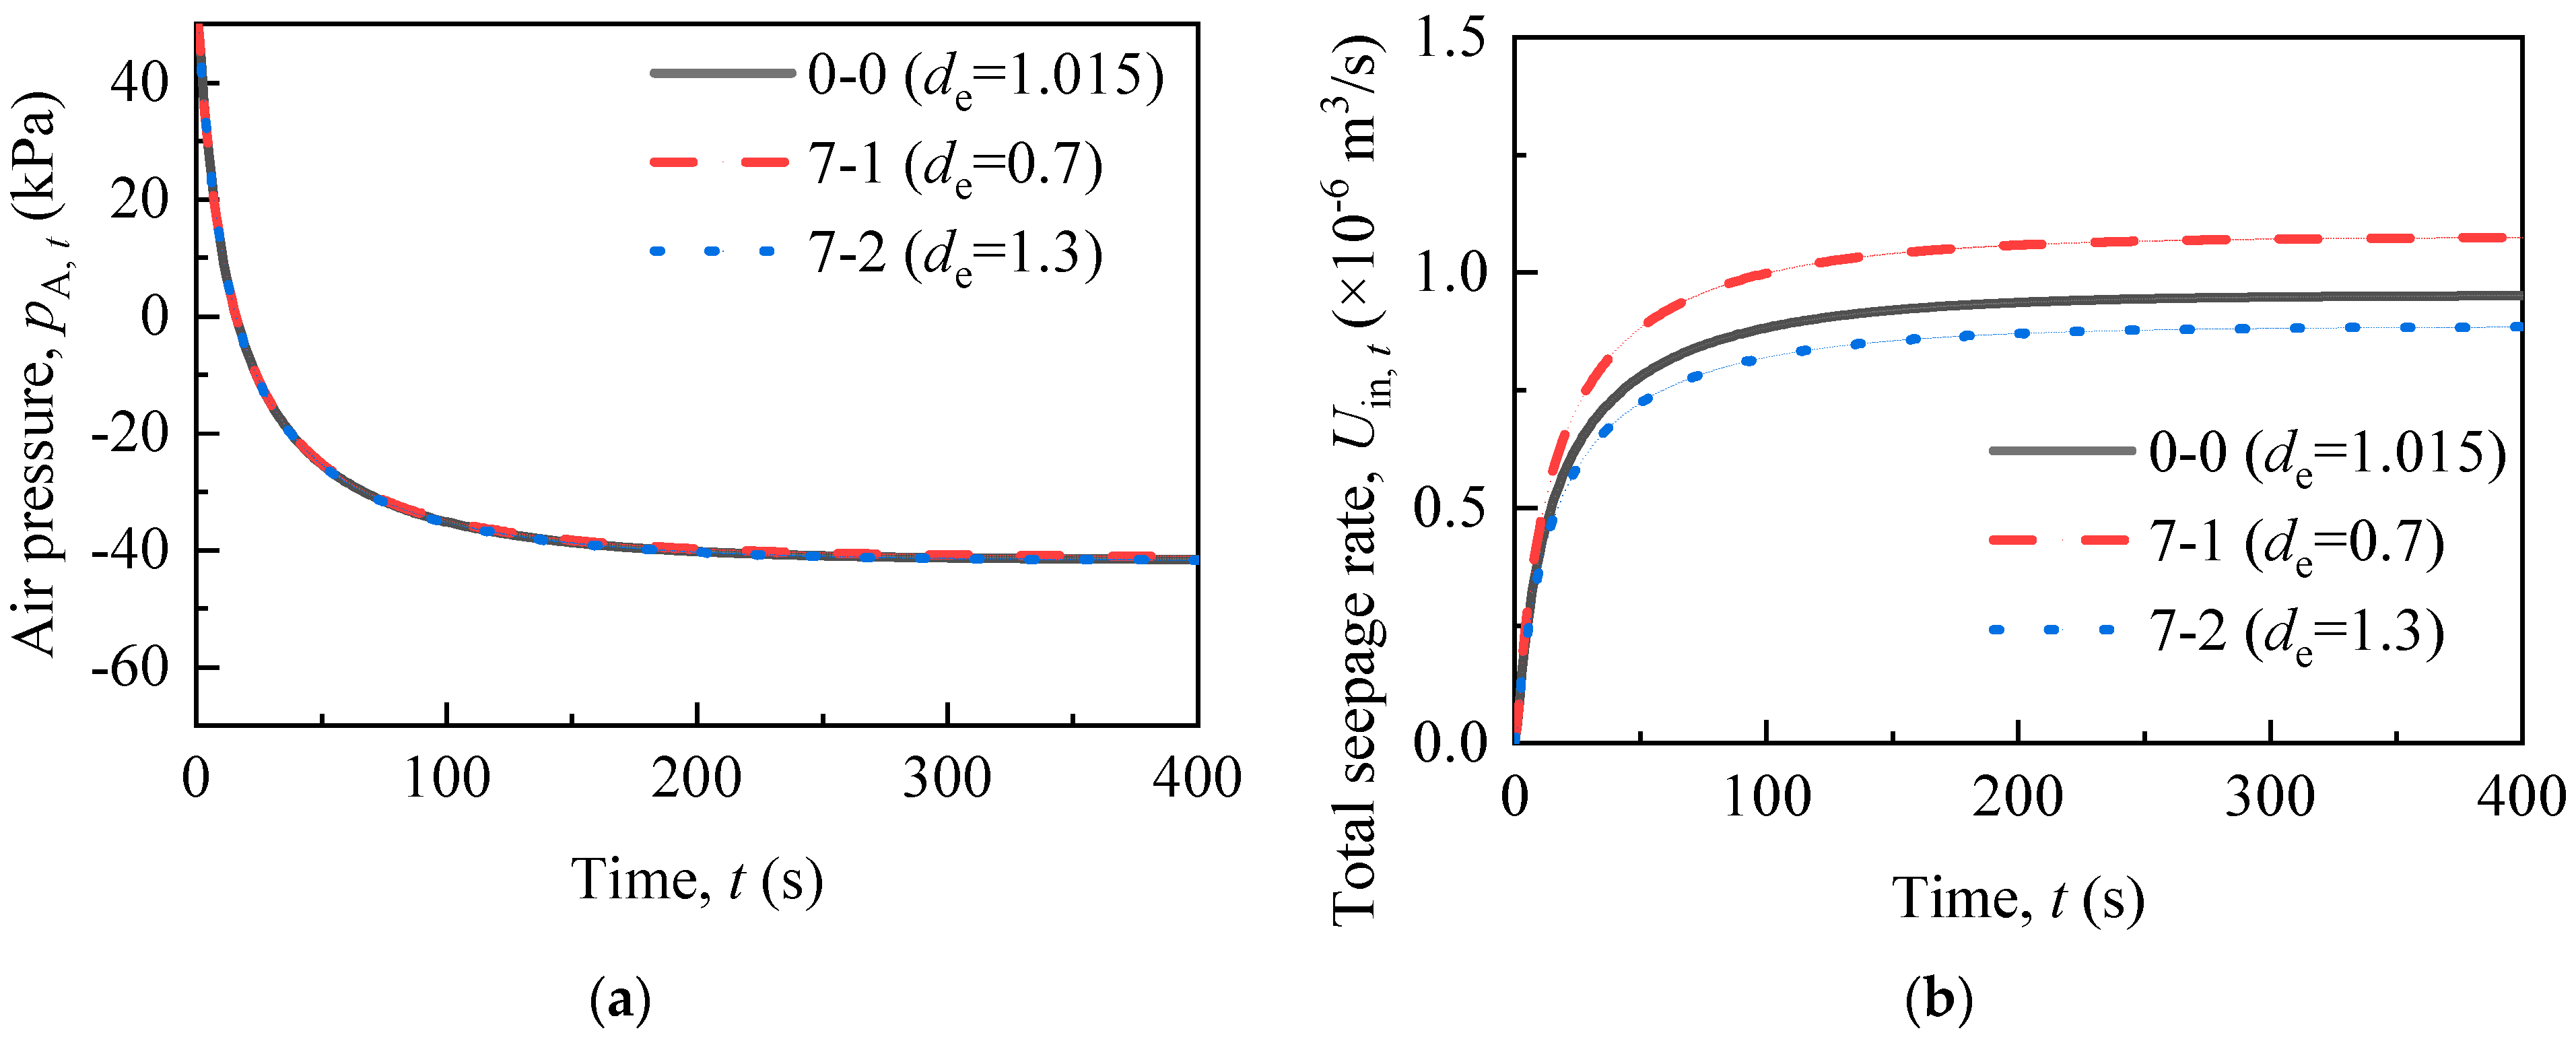
2.3.7. Cylinder Diameter

The cylinder diameter affects drainage by influencing the seepage rate. Its impact pattern is similar to that of the horizontal hydraulic conductivity (Kh). However, the effect of cylinder diameter on seepage is not as significant as the effect of the horizontal hydraulic conductivity (Kh). As shown in Figure 12, the cylinder diameter has almost no impact on vacuum formation and only a minor influence on drainage. The cylinder diameter can be determined based on the cost and duration of the project.

3. Global Sensitivity Analysis

3.1. Global Sensitivity Analysis Method

The global sensitivity analysis method has the ability to analyze the sensitivity of multiple factors simultaneously. It can extend the range of factor change to the entire domain while allowing each factor to have different ranges of variation and achieve simultaneous changes. Sobol is a widely applied global sensitivity analysis method. Several scholars have already employed this method in various fields such as geotechnical engineering, agriculture, materials science, and environmental studies [25,26,27,28,29]. The impact proportion of each factor on the final vacuum degree can be calculated using Sobol. This enables the optimization of design factors in the SVD.
The core principle of the Sobol is to decompose the function model into individual factors and their combinations. The corresponding sensitivity indices are obtained by calculating the impact of the variance of individual or multiple input factors on the total output variance. The calculation equations for Sobol are as follows [29,30]:
The function model f(X) can be decomposed into a sum of 2p increasing terms to obtain the Equation (11).
f ( X ) = f 0 + i = 1 p f i ( x i ) + i , j = 1 , 2 , , p i < j f i , j ( x i , x j ) + + f 1 , 2 , , p ( x 1 , x 2 , , x p )
where f(0) is a constant; X = [x1, x2,…, xi,…, xp], xi is a performance indicator or influence factor, and i = 1, 2,…, p.
The total variance (V) and bias-variance (Vi) of Sobol are denoted as:
V = f 2 ( X ) d X f 0 2
V i = f i 2 d x i
The expression for the decomposition of the total variance into the bias-variance is:
V = i = 1 p V i + i , j = 1 , 2 , , p i < j V i , j + + V 1 , 2 , , p
The Sobol sensitivity indices can be obtained by dividing both sides of Equation (14) by V:
1 = i = 1 p S i + i , j = 1 , 2 , , p i < j S i , j + + S 1 , 2 , , p
where Si is the first-order sensitivity index, indicating the influence of the variation of factor i on the model output; Si,j is the second-order sensitivity index, indicating the joint influence of simultaneous variations in factors i and j on the model output; and SiT is the total-order sensitivity index, indicating the sum of sensitivity indices for factor i across all orders.
The sensitivity indices can serve as indicators to evaluate the importance of various factors. Before calculating the sensitivity indices for each factor, a reasonable range of values (minimum to maximum) must be defined for the seven factors under study, as shown in Table 3. Then, the factors are sampled using the sobolset function in MATLAB. The random numbers generated by this sampling method form a low-discrepancy sequence, which is uniform and efficient. Figure 13 shows the 200 randomly collected data points for the thickness of the sealing soil column (hs), with a uniform data distribution. The sampling dimension for this study is seven, meaning that each set of samples contains seven data points (one for each factor). To eliminate the influence of sample size on the results, a series of sample libraries were obtained by incrementing the sample size at intervals of 50 (50, 100, 150, etc.). First-order and total-order sensitivity indices were calculated for each sample library.

3.2. Results and Discussion

As shown in Figure 14, the sensitivity indices calculated in this study converge well. The first-order and total-order sensitivity indices obtained are essentially stable when the sample size exceeds 2000 sets. Table 4 provides the first-order and total-order sensitivity indices for the seven parameters when the sample size is 5000. The first-order sensitivity indices are ranked from highest to lowest as follows: 0.7772 (hs), 0.0731 (d), 0.0618 (L), 0.0419 (Kh), 0.0196 (dpc), 0.0024 (de), and 0.0018 (ζ). The sum of the first-order sensitivity indices has reached 0.9779. The total-order sensitivity indices are ranked from highest to lowest as follows: 0.7825 (hs), 0.0861 (d), 0.0749 (L), 0.0483 (Kh), 0.0273 (dpc), 0.0027 (de), and 0.0024 (ζ). The thickness of the sealing soil column (hs) has an extremely high impact on the vacuum degree. Its first-order sensitivity index accounts for 79.48%, and the total-order sensitivity index accounts for 76.40%. This significantly exceeds the impact of other factors. Therefore, the thickness of the sealing soil column (hs) is the factor that needs the most attention in the SVD design. The results of the global sensitivity analysis are consistent with the analysis results in Section 2.3. The diameter of the permeable chamber (dpc) and the local resistance coefficient of the siphon pipe (ζ) have a very small impact on the final vacuum degree.

4. Calculation of Maximum Vacuum Degree

The thickness of the sealing soil column (hs) has an impact of approximately 80% on the vacuum degree. Therefore, exploring the quantitative relationship between vacuum degree and sealing soil column thickness (hs) is valuable for assessing the maximum vacuum degree that the SVD can form. First, the values of the remaining six factors are determined to be L = 50 m, ζ = 0.131, d = 5 mm, dpc = 5 cm, Kh = 3.75 × 10⁻⁹ m/s, and de = 1.015 m. The range of values for the thickness of the sealing soil column (hs) is [0.1, 0.9] m. Secondly, based on the theoretical model, calculate the maximum vacuum degree (Max|pA, t|) under different thicknesses of the sealing soil column (hs), as shown in Figure 15. Finally, a fitting equation for the calculation results of the maximum vacuum degree is obtained:
Max p A ,   t k = 0.0164 h s 3 0.3979 h s 2 5.8132 h s + 81.08         0.1 h s 9.9
The determination coefficient (R2) of the fitting curve is 1, indicating a good fit. When hs = 0.1 m, the vacuum degree can reach 80.49 kPa. The smaller the sealing soil column thickness (hs), the greater the vacuum degree that can be automatically formed in the SVD. Additionally, it can shorten the path for pore water from the upper soil to seep into the vertical drainage well (permeable chamber). Thus, using smaller thicknesses of the sealing soil column (hs) can enhance the reinforcement effect on soft soil. Naturally, this should be done while ensuring proper sealing.

5. Conclusions

Siphon-vacuum drainage is a promising method for marine reclamation, with the potential to reduce the environmental impact and operational costs. In this study, the factors influencing vacuum formation and drainage in the SVD have been comprehensively analyzed. The findings provide a basis for optimizing the design of the SVD in marine reclamation projects, leading to more sustainable and efficient land development along coastal regions. The following conclusions can be drawn:
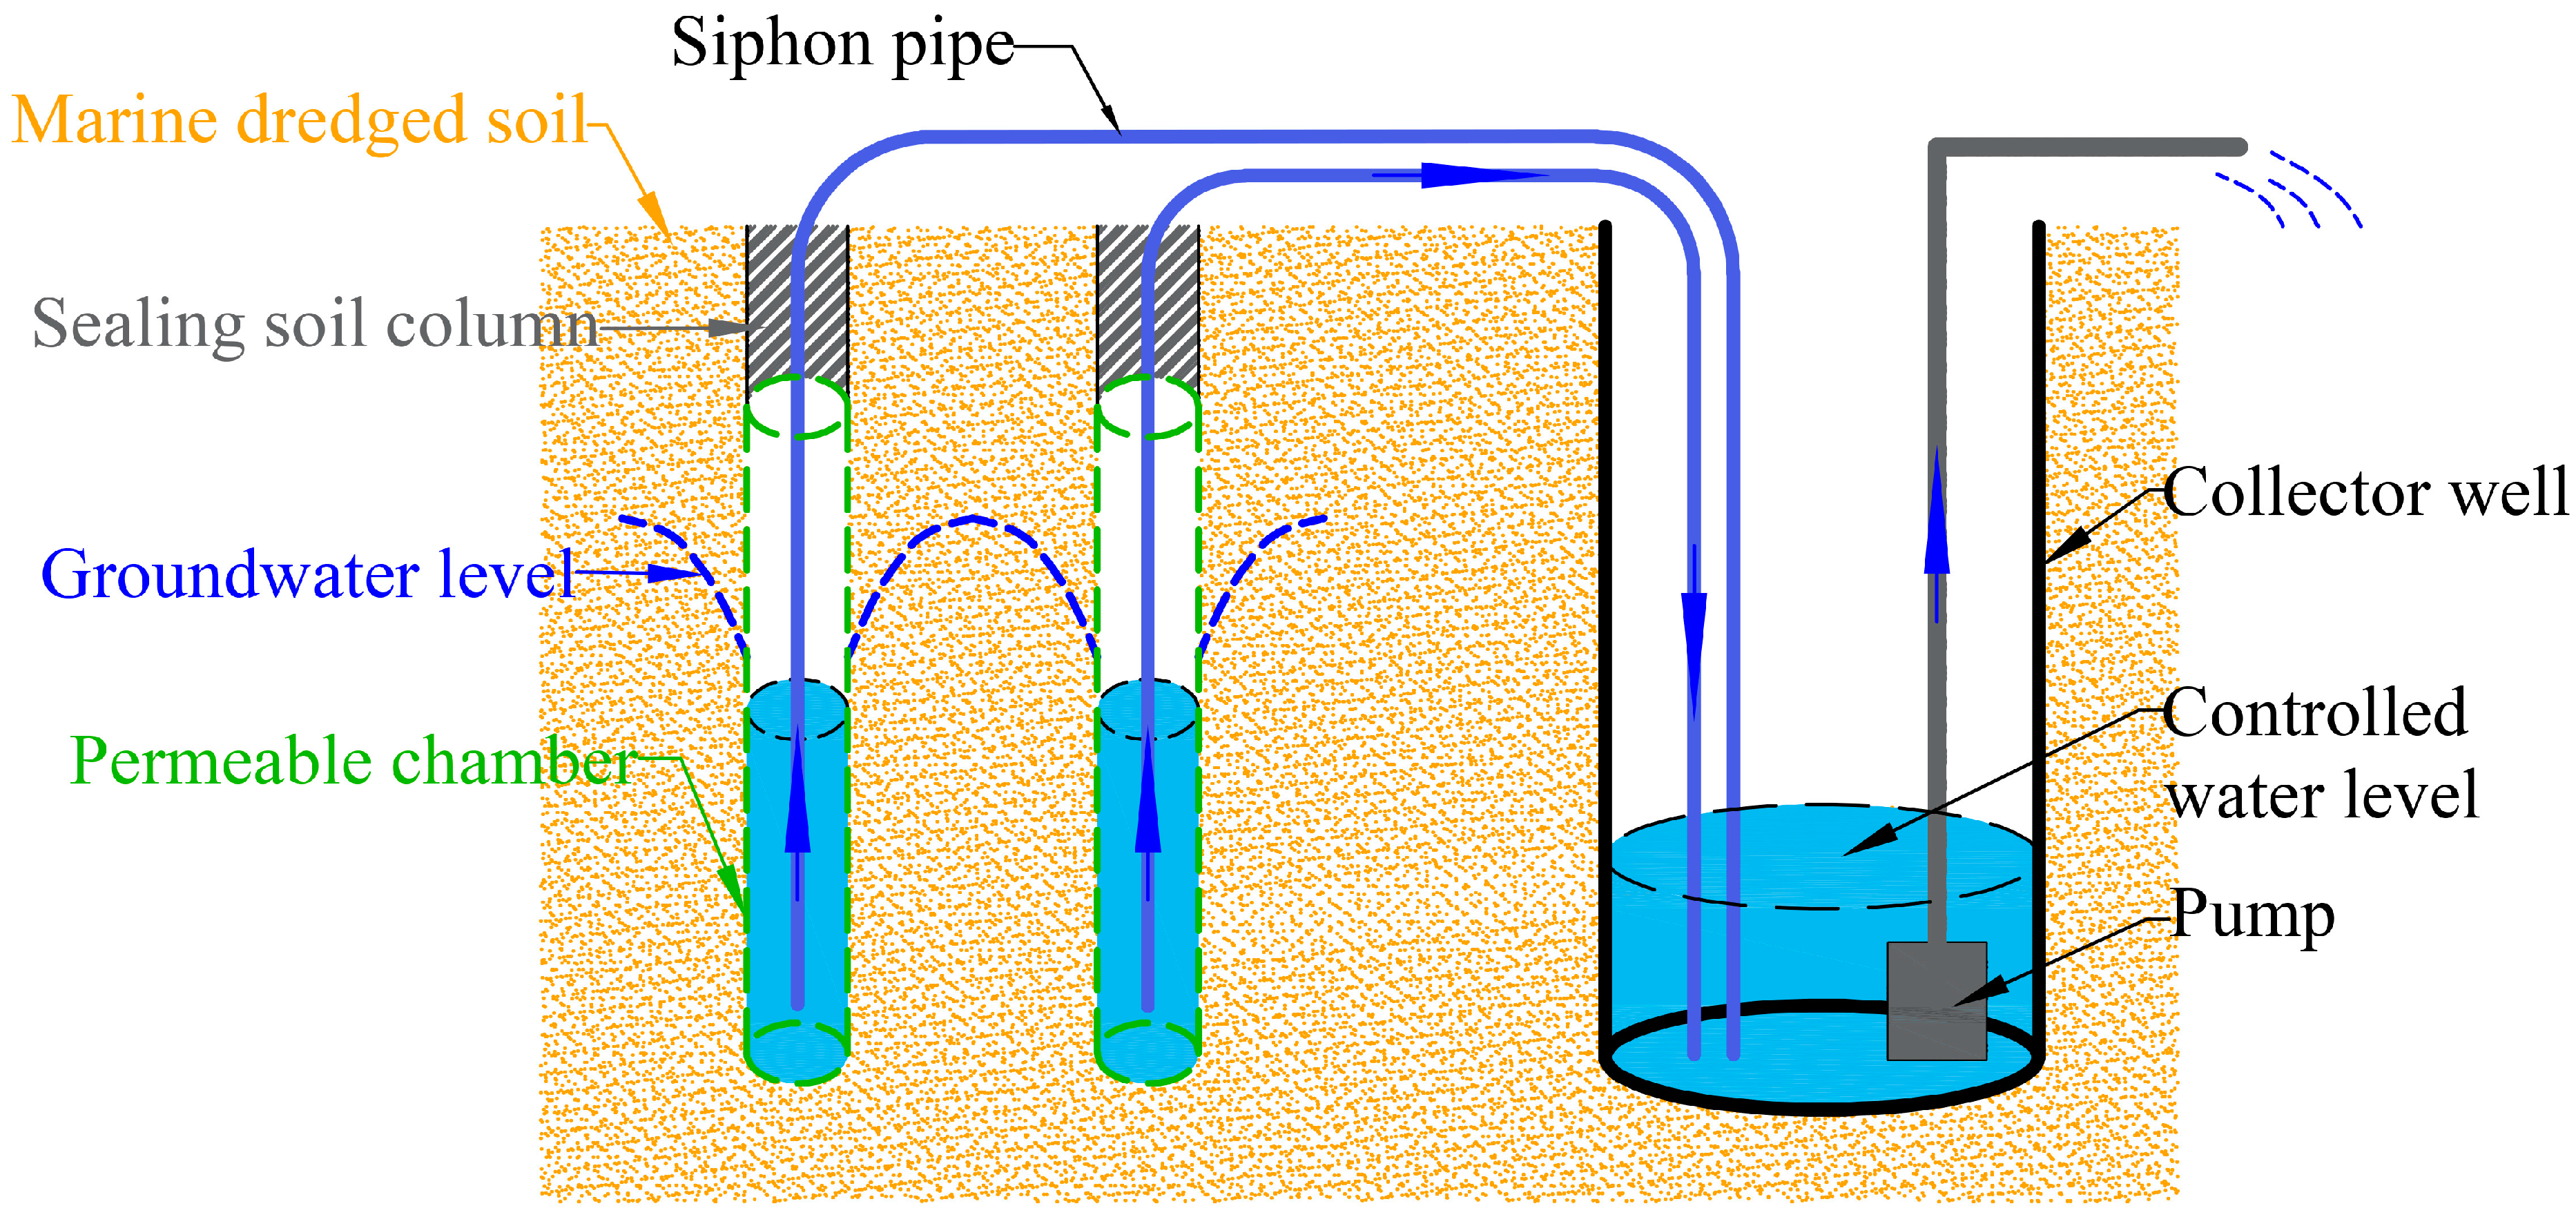
  • After the SVD is started, a vacuum gradually forms inside the permeable chamber. The duration of the vacuum formation process is generally less than 400 s. During this process, the seepage drainage rate gradually increases. The siphon rate (Uout, t) initially rises rapidly and then decreases slowly, gradually approaching the seepage rate (Uin, t). The siphon drainage plays a dominant role in the water storage change within the permeable chamber during the early stages.
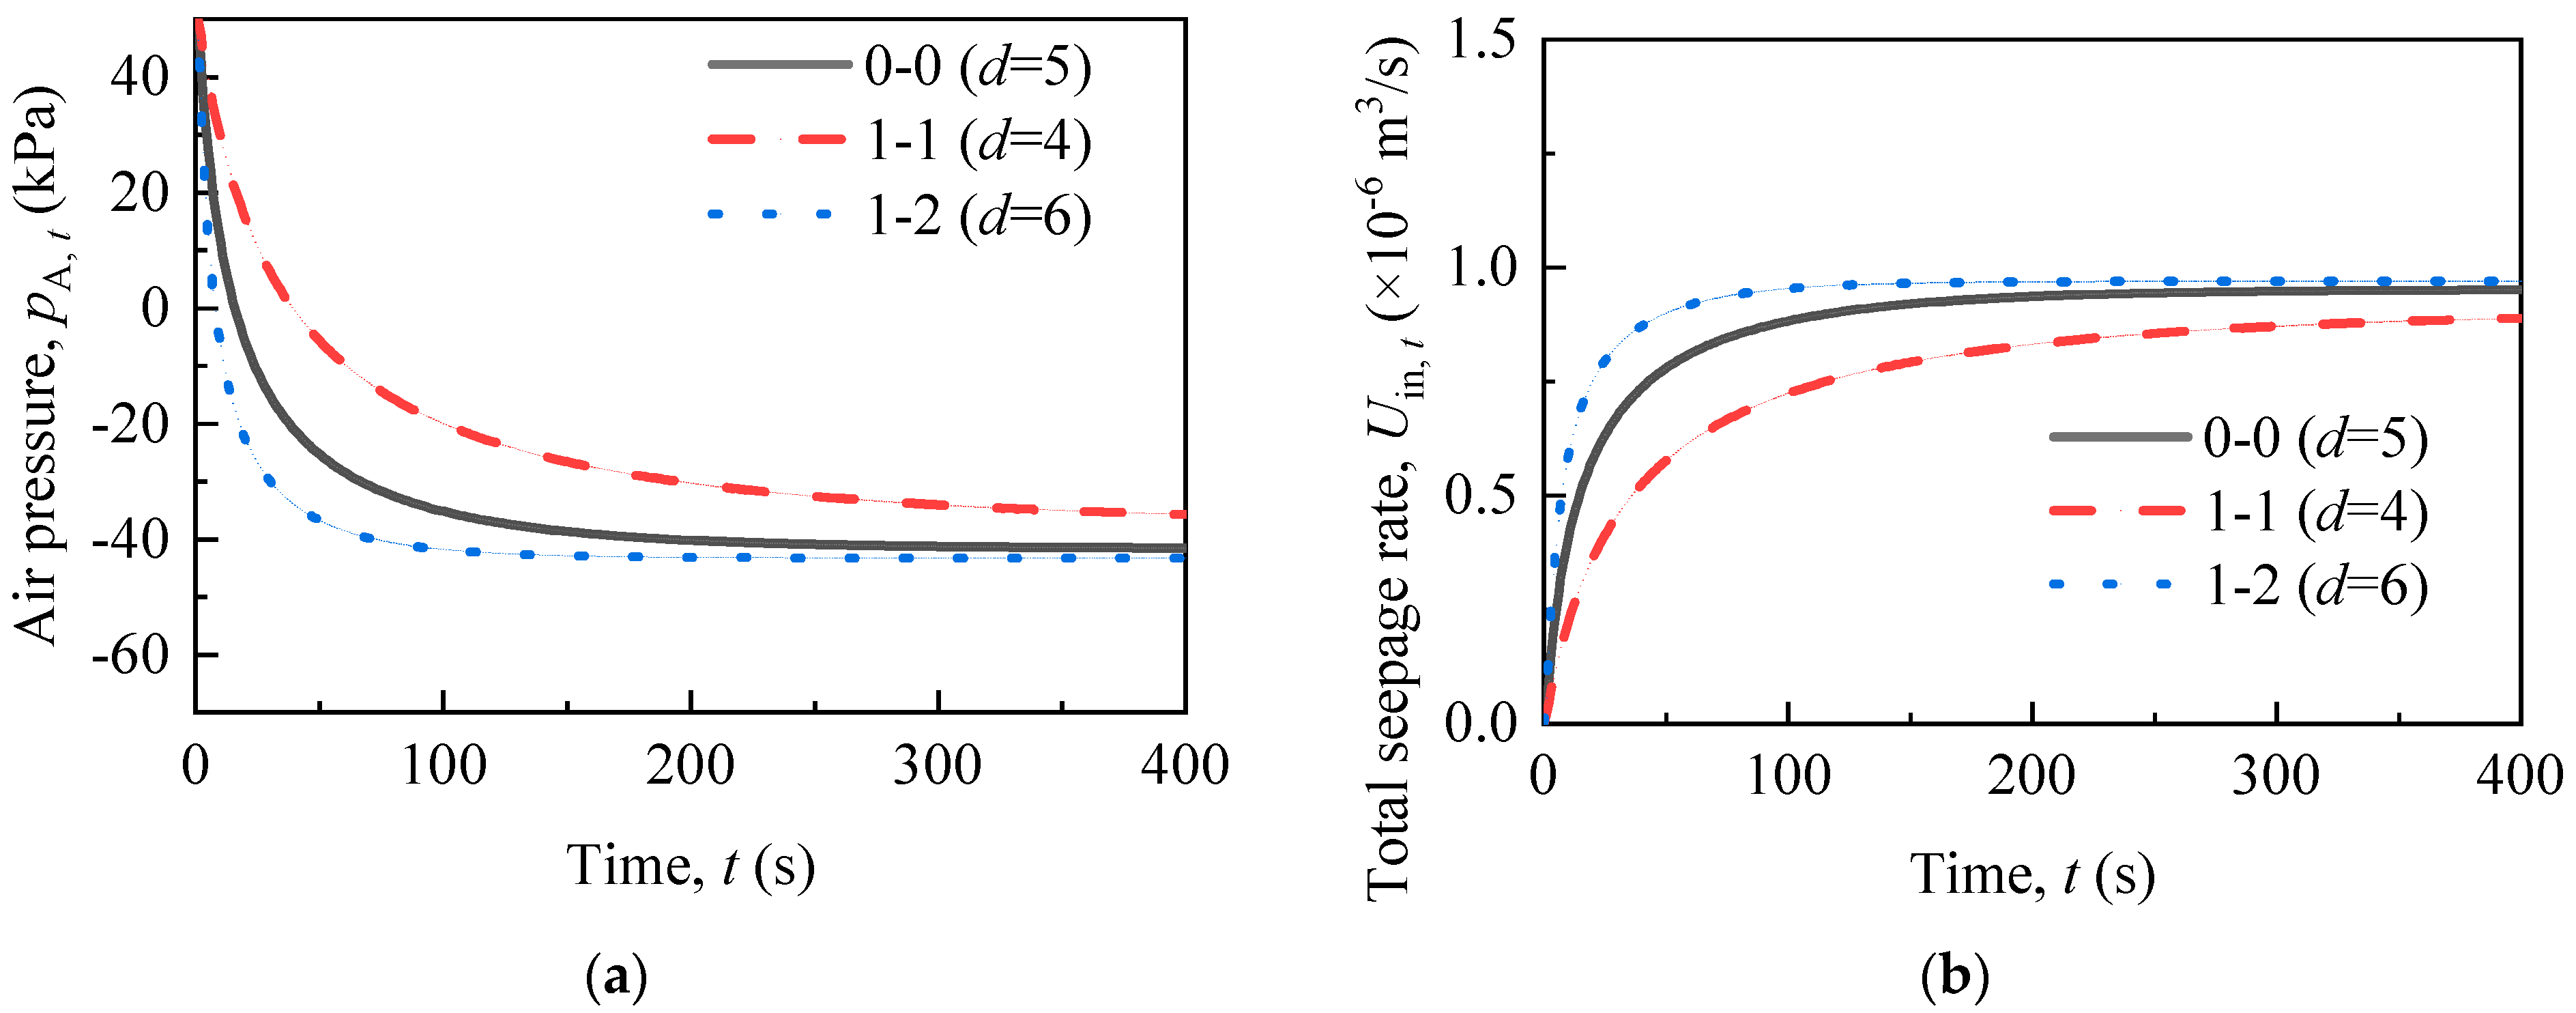
  • The length (L), local resistance coefficient (ζ), and diameter of the siphon pipe (d) influence the early stages of vacuum formation and drainage by affecting the siphon. Increasing the siphon rate (Uout, t) can lead to a greater vacuum degree and drainage rate. Reducing the thickness of the sealing soil column (hs) can create a larger vacuum degree, resulting in a larger cross-sectional area and drainage rate. The diameter of the permeable chamber (dpc) primarily affects the drainage rate through the cross-sectional area.
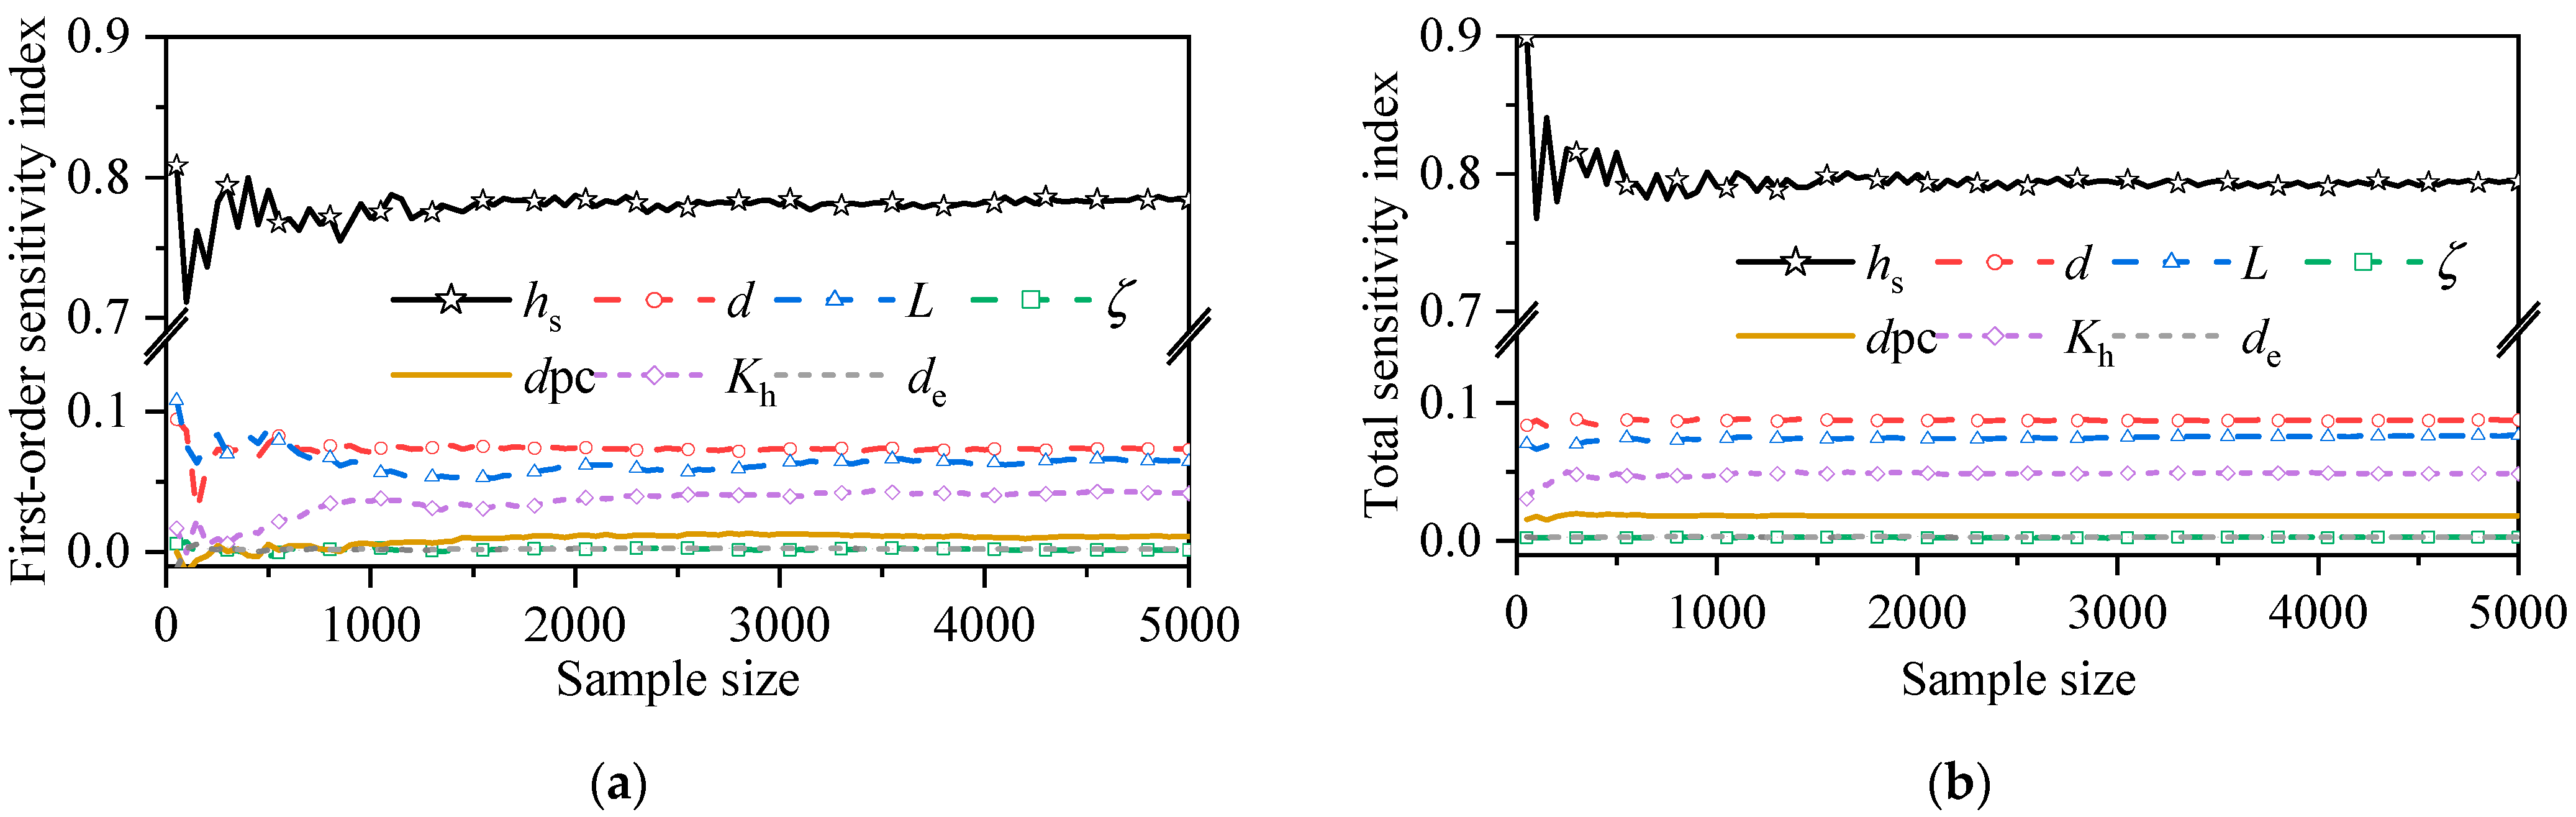
  • The first-order sensitivity indices are as follows: 0.7772 (the sealing soil column thickness, hs), 0.0731 (the siphon pipe diameter, d), 0.0618 (the siphon pipe length, L), 0.0419 (the horizontal hydraulic conductivity, Kh), 0.0196 (the permeable chamber diameter, dpc), 0.0024 (the cylinder diameter, de), and 0.0018 (the local resistance coefficient, ζ). The sealing soil column thickness (hs) has an extremely high impact on the vacuum degree, accounting for 79.48%. The combined impact of the cylinder diameter (de) and local resistance coefficient (ζ) on the vacuum degree accounts for only 0.43%.
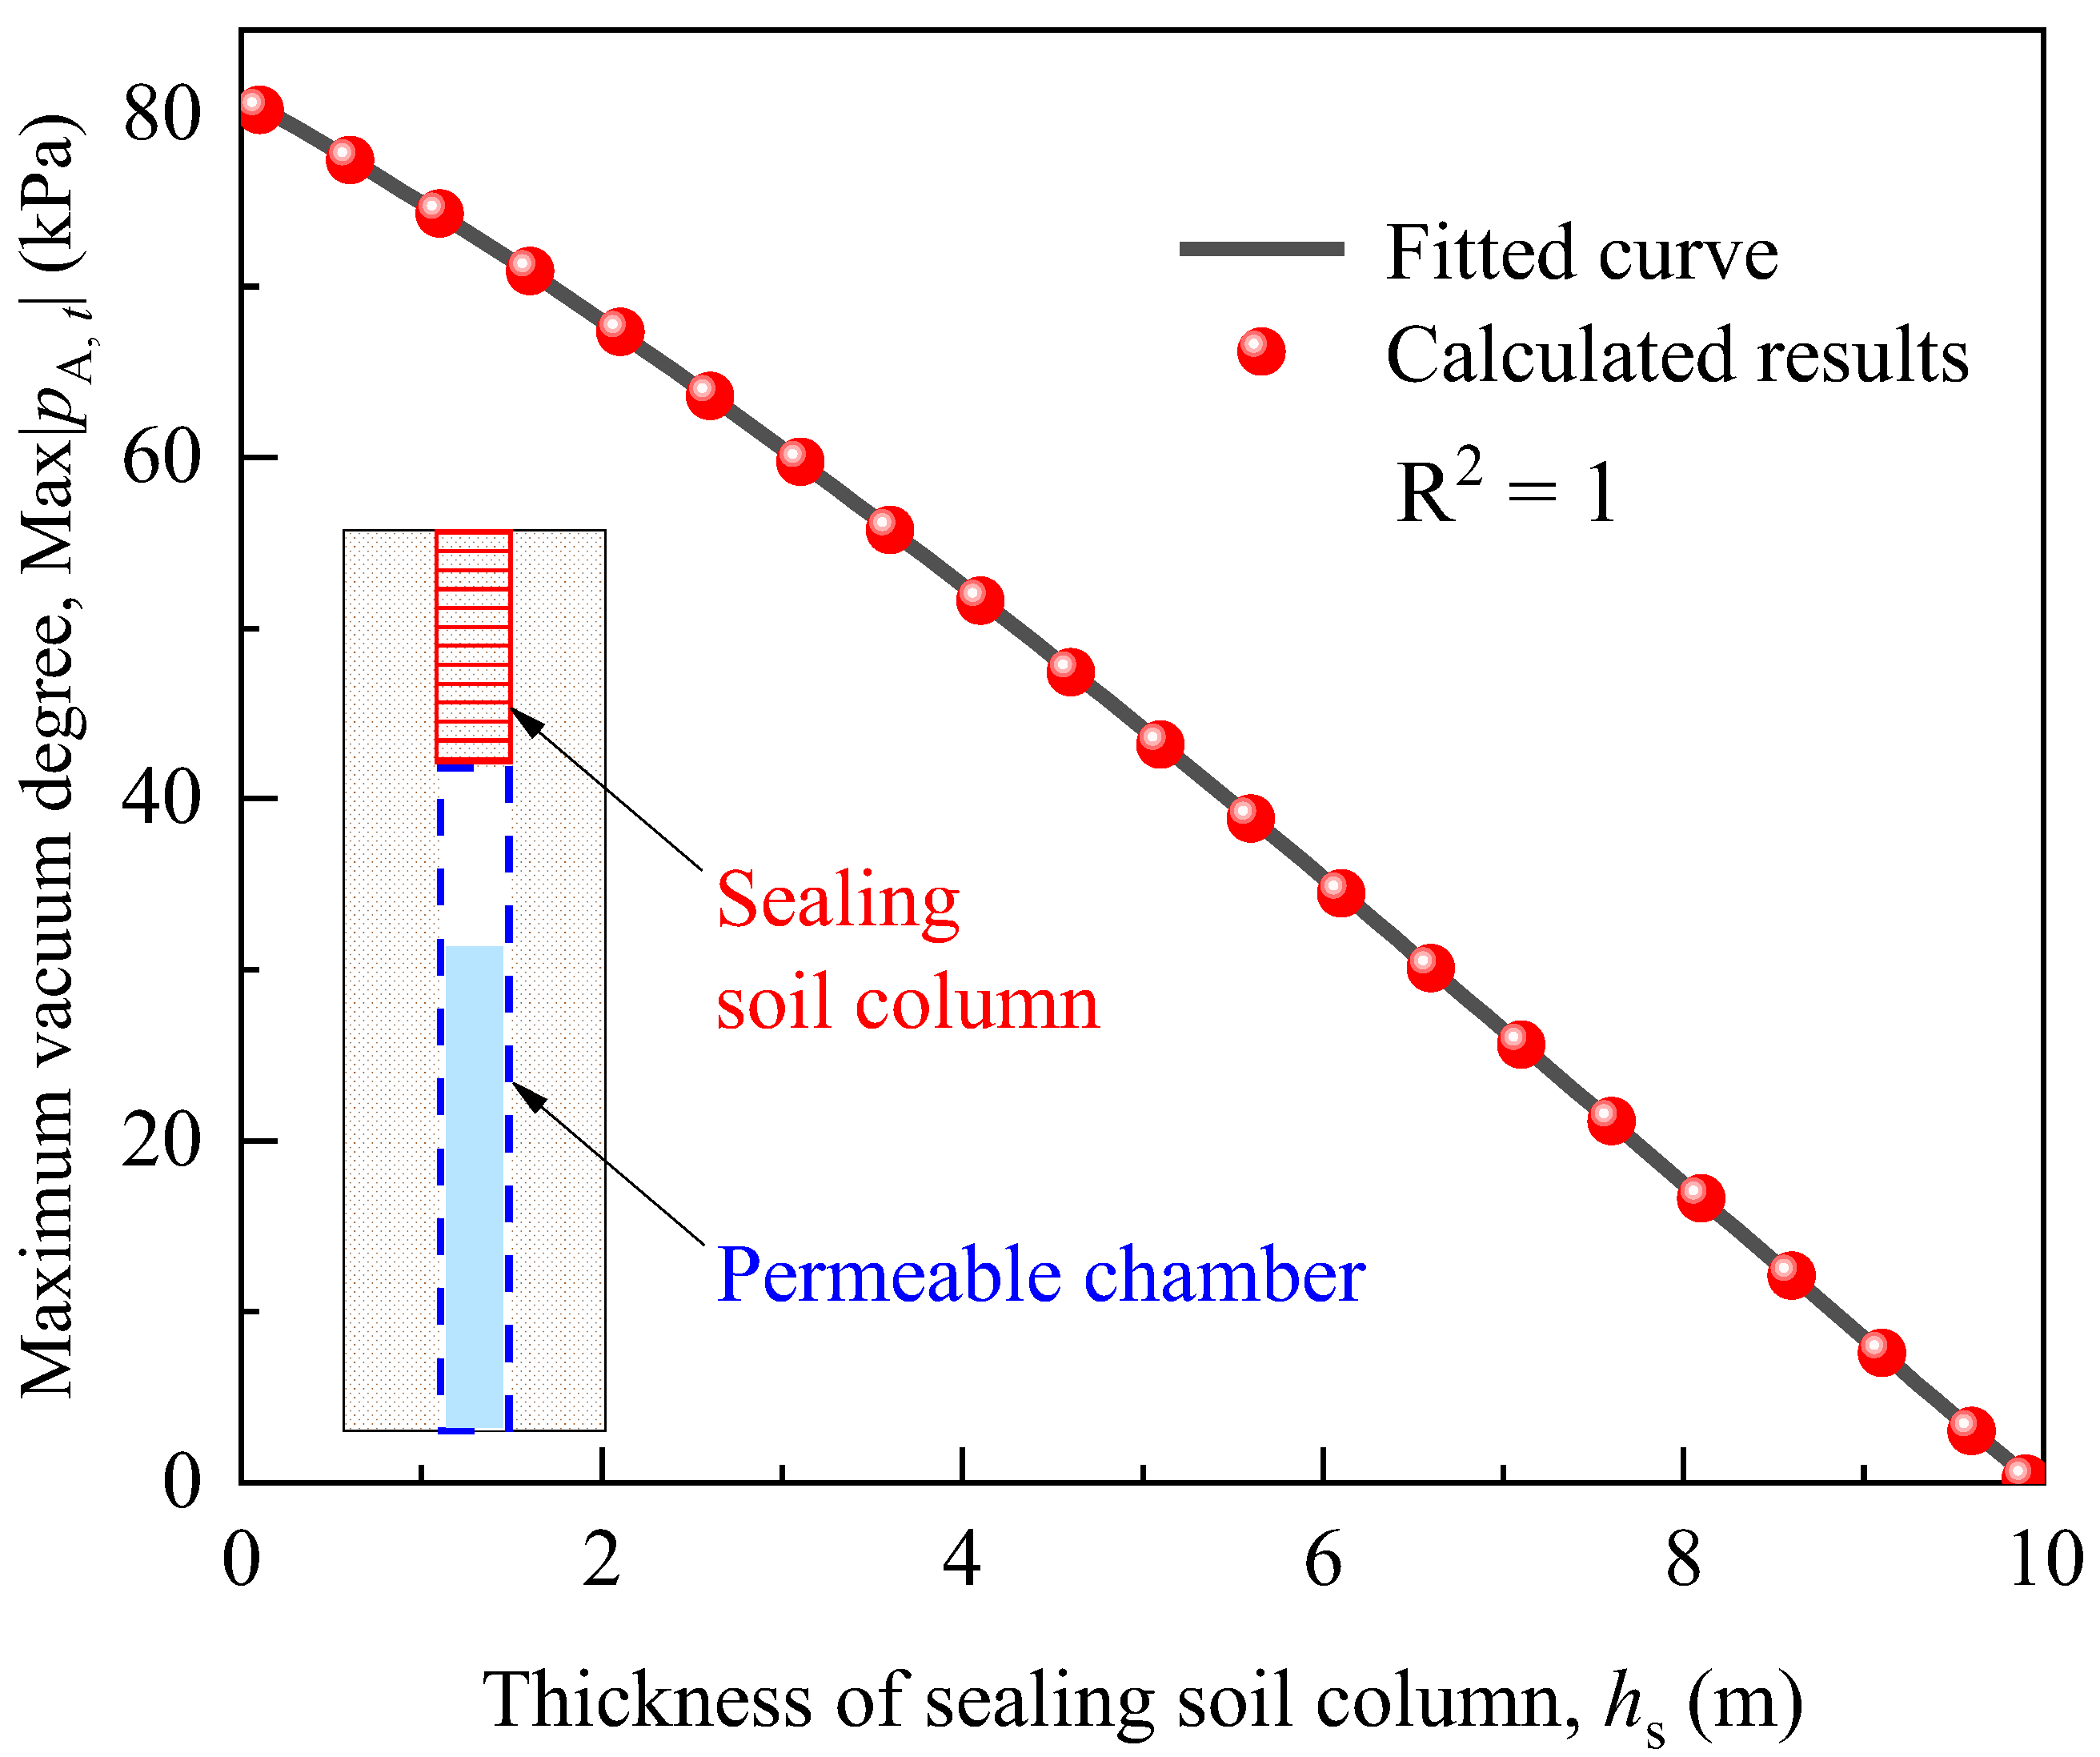
  • A fitting curve was obtained that describes the relationship between the maximum vacuum degree (Max|pA, t|) and different sealing soil column thicknesses (hs). Calculations indicate that the maximum vacuum degree (Max|pA, t|) can exceed 80 kPa. Reducing the sealing soil column thickness (hs) can also shorten the path for pore water in the upper soil to seep into the vertical drainage well. Therefore, using the smallest possible sealing soil column thickness (hs) while ensuring sealing can enhance the improvement effect.

Author Contributions

Conceptualization, J.S. and H.S.; methodology, J.S. and J.W.; software, Q.S.; validation, J.S., J.W. and Q.S.; investigation, J.S. and J.W.; resources, K.C. and H.S.; data curation, J.S.; writing—original draft preparation, J.S. and J.W.; writing—review and editing, K.C. and H.S.; visualization, J.S.; supervision, K.C. and H.S.; project administration, K.C. and H.S.; funding acquisition, K.C. and H.S. All authors have read and agreed to the published version of the manuscript.

Funding

This study was supported by the National Natural Science Foundation of China (42230702).

Institutional Review Board Statement

Not applicable.

Informed Consent Statement

Informed consent was obtained from all subjects involved in the study.

Data Availability Statement

Some or all data, models, or codes that support the findings of this study are available from the corresponding author upon reasonable request.

Conflicts of Interest

Author Kexing Chen is employed by the Zhejiang Electric Power Design Institude. The author Jun Wang is employed by Zhejiang Seaport Engineering Construction Consultants Co., Ltd. and is concurrently a on-the-job doctoral student at the Ocean College, Zhejiang University. The author Qingsong Shen has recently completed his PhD at the College of Civil Engineering and Architecture, Zhejiang University, and is now employed by Power China Huadong Engineering Corporation Limited. The remaining authors declare that the research was conducted in the absence of any commercial or financial relationships that could be construed as a potential conflict of interest.

References

  1. Liu, J.J.; Li, J.K.; Lei, H.Y.; Zheng, G.; Jin, Y.W. Ground Improvement of Dredged Fills with Two Improved Vacuum Preloading Methods: Case Study. J. Geotech. Geoenviron. Eng. 2022, 148, 05022008. [Google Scholar] [CrossRef]
  2. Malekzadeh, M.; Sivakugan, N. One-dimensional electrokinetic stabilization of dredged mud. Mar. Georesources Geotechnol. 2017, 35, 603–609. [Google Scholar] [CrossRef]
  3. Shinsha, H.; Kumagai, T. Material properties of solidified soil grains produced from dredged marine clay. Soils Found. 2018, 58, 678–688. [Google Scholar] [CrossRef]
  4. Dahal, B.K.; Zheng, J.J.; Zhang, R.J.; Song, D.B. Enhancing the mechanical properties of marine clay using cement solidification. Mar. Georesources Geotechnol. 2019, 37, 755–764. [Google Scholar] [CrossRef]
  5. Karunaratne, G.P. Prefabricated and electrical vertical drains for consolidation of soft clay. Geotext. Geomembr. 2011, 29, 391–401. [Google Scholar] [CrossRef]
  6. Mesri, G.; Khan, A.Q. Ground Improvement Using Vacuum Loading Together with Vertical Drains. J. Geotech. Geoenvironmental Eng. 2012, 138, 680–689. [Google Scholar] [CrossRef]
  7. Li, J.F.; Chen, H.E.; Yuan, X.Q.; Shan, W.C. Analysis of the Effectiveness of the Step Vacuum Preloading Method: A Case Study on High Clay Content Dredger Fill in Tianjin, China. J. Mar. Sci. Eng. 2020, 8, 38. [Google Scholar] [CrossRef]
  8. Xia, C.Q.; Deng, Y.B.; Zhu, M.; Niu, J.J.; Zheng, L.K.; Chen, X.S. One-Dimensional Solar Energy Thermal Consolidation Model Testing and Analytical Calculation for Marine Soft Clays. J. Mar. Sci. Eng. 2022, 10, 1634. [Google Scholar] [CrossRef]
  9. Spross, J.; Larsson, S. Probabilistic observational method for design of surcharges on vertical drains. Geotechnique 2021, 71, 226–238. [Google Scholar] [CrossRef]
  10. Ge, S.Q.; Jiang, W.H.; Zheng, L.W.; Xie, X.Y.; Xie, K.H.; Feng, G.H.; Zhang, X.L. Theoretical analysis and experimental verification of large deformation electro-osmosis consolidation treatment of dredged slurry. Eng. Geol. 2023, 312, 106924. [Google Scholar] [CrossRef]
  11. Ge, S.Q.; Ma, Y.; Wang, K.; Zheng, L.W.; Xie, X.Y.; Chen, X.H.; Yu, H.S. Unsaturated hydro-mechanical-electro-chemical coupling based on mixture-coupling theory: A unified model. Int. J. Eng. Sci. 2023, 191, 103914. [Google Scholar] [CrossRef]
  12. Lei, H.Y.; Feng, S.X.; Wang, L.; Jin, Y.W. Field instrumentation and settlement prediction of ground treated with straight-line vacuum preloading. Geomech. Eng. 2019, 19, 447–462. [Google Scholar] [CrossRef]
  13. Indraratna, B.; Rujikiatkamjorn, C.; Baral, P.; Ameratunga, J. Performance of marine clay stabilised with vacuum pressure: Based on Queensland experience. J. Rock Mech. Geotech. Eng. 2019, 11, 598–611. [Google Scholar] [CrossRef]
  14. Lam, K.P.; Wu, S.F.; Chu, J. Field trial of a membraneless vacuum preloading system for soft soil improvement. Proc. Inst. Civ. Eng. -Ground Improv. 2020, 173, 40–50. [Google Scholar] [CrossRef]
  15. Zheng, G.; Liu, J.J.; Lei, H.Y.; Rahman, M.S.; Tan, Z.K. Improvement of very soft ground by a high-efficiency vacuum preloading method: A case study. Mar. Georesources Geotechnol. 2017, 35, 631–642. [Google Scholar] [CrossRef]
  16. Lei, H.Y.; Lu, H.B.; Liu, J.J.; Zheng, G. Experimental Study of the Clogging of Dredger Fills under Vacuum Preloading. Int. J. Geomech. 2017, 17, 04017117. [Google Scholar] [CrossRef]
  17. Orlove, B.; Lazrus, H.; Hovelsrud, G.K.; Giannini, A. Recognitions and Responsibilities On the Origins and Consequences of the Uneven Attention to Climate Change around the World. Curr. Anthropol. 2014, 55, 249–275. [Google Scholar] [CrossRef]
  18. Khan, S.A.R.; Ponce, P.; Yu, Z. Technological innovation and environmental taxes toward a carbon-free economy: An empirical study in the context of COP-21. J. Environ. Manag. 2021, 298, 113418. [Google Scholar] [CrossRef]
  19. Garrett, R.E. Principles of Siphons. J. World Aquac. Soc. 1991, 22, 1–9. [Google Scholar] [CrossRef]
  20. Cai, Y.L.; Sun, H.Y.; Shang, Y.Q.; Xiong, X.L. An investigation of flow characteristics in slope siphon drains. J. Zhejiang Univ. Sci. A 2014, 15, 22–30. [Google Scholar] [CrossRef]
  21. Sun, H.Y.; Wu, G.; Liang, X.; Yan, X.; Wang, D.F.; Wei, Z.L. Laboratory modeling of siphon drainage combined with surcharge loading consolidation for soft ground treatment. Mar. Georesources Geotechnol. 2018, 36, 940–949. [Google Scholar] [CrossRef]
  22. Shen, Q.S.; Wang, J.; Sun, H.Y.; Shu, J.W.; Shang, Y.Q. Analysis of the influence of siphon hole spacing on soft-soil drainage effect. Proc. Inst. Civ. Eng. -Geotech. Eng. 2023. ahead of print. [Google Scholar] [CrossRef]
  23. Qian, J.H.; Zhao, W.B.; Cheung, Y.K.; Lee, P.K.K. The theory and practice of vacuum preloading. Comput. Geotech. 1992, 13, 103–118. [Google Scholar] [CrossRef]
  24. Shu, J.W.; Sun, H.Y.; An, N. Theoretical and field investigation into the vacuum formation in the siphon-vacuum drainage system for soft ground improvement. Can. Geotech. J. 2024. [Google Scholar] [CrossRef]
  25. Zhang, C.; Chu, J.G.; Fu, G.T. Sobol’s sensitivity analysis for a distributed hydrological model of Yichun River Basin, China. J. Hydrol. 2013, 480, 58–68. [Google Scholar] [CrossRef]
  26. Rohmer, J.; Loschetter, A.; Raucoules, D.; de Michele, M.; Raffard, D.; Le Gallo, Y. Revealing the surface deformation induced by deep CO<sub>2</sub> injection in vegetated/agricultural areas: The combination of corner-reflectors, reservoir simulations and spatio-temporal statistics. Eng. Geol. 2015, 197, 188–197. [Google Scholar] [CrossRef]
  27. Ghasemizade, M.; Baroni, G.; Abbaspour, K.; Schirmer, M. Combined analysis of time-varying sensitivity and identifiability indices to diagnose the response of a complex environmental model. Environ. Model. Softw. 2017, 88, 22–34. [Google Scholar] [CrossRef]
  28. Hamdia, K.M.; Silani, M.; Zhuang, X.Y.; He, P.F.; Rabczuk, T. Stochastic analysis of the fracture toughness of polymeric nanoparticle composites using polynomial chaos expansions. Int. J. Fract. 2017, 206, 215–227. [Google Scholar] [CrossRef]
  29. Ke, H.; Hu, J.; Xu, X.B.; Wu, X.W.; Li, Y.C.; Lan, J.W. Analytical solution of leachate flow to vertical wells in municipal solid waste landfills using a dual-porosity model. Eng. Geol. 2018, 239, 27–40. [Google Scholar] [CrossRef]
  30. Sobol, I. On sensitivity Estimation for Nonlinear Mathematical Models; Keldysh Applied Mathematics Institute: Moscow, Russia, 1990; pp. 112–118. [Google Scholar]
Figure 1. Schematic diagram of the SVD.
Jmse 12 00430 g001
Figure 2. Form of vertical drainage wells arrangement: (a) square; (b) equilateral triangle.
Jmse 12 00430 g002
Figure 3. Schematic diagram of a cylindrical model of a single permeable chamber.
Jmse 12 00430 g003
Figure 4. Test results and calculations of air pressure changes.
Jmse 12 00430 g004
Figure 5. Drainage flow rate of siphon and seepage.
Jmse 12 00430 g005
Figure 6. (a) Vacuum formation and (b) drainage rate under the influence of the siphon pipe diameter.
Jmse 12 00430 g006
Figure 7. (a) Vacuum formation and (b) drainage rate under the influence of the siphon pipe length.
Jmse 12 00430 g007
Figure 8. (a) Vacuum formation and (b) drainage rate under the influence of the minor head loss coefficient of siphon pipe.
Jmse 12 00430 g008
Figure 9. (a) Vacuum formation and (b) drainage rate under the influence of the thickness of sealing soil column.
Jmse 12 00430 g009
Figure 10. (a) Vacuum formation and (b) drainage rate under the influence of the permeable chamber diameter.
Jmse 12 00430 g010
Figure 11. (a) Vacuum formation and (b) drainage rate under the influence of the horizontal permeability coefficients.
Jmse 12 00430 g011
Figure 12. (a) Vacuum formation and (b) drainage rate under the influence of the cylinder diameter.
Jmse 12 00430 g012
Figure 13. Distribution of randomly collected data points for sealing soil column thickness.
Jmse 12 00430 g013
Figure 14. Sensitivity indices of various factors corresponding to different sample sizes: (a) first-order; (b) total-order.
Jmse 12 00430 g014
Figure 15. Maximum vacuum degree achievable with different thicknesses of sealing soil column.
Jmse 12 00430 g015
Table 1. The parameters and their values required for the model calculation.
ParametersValues
Thickness of sealing soil column, hs (m)5.3
Length of siphon pipe,
L (m)
50
Distance between the inlet of the siphon pipe and the bottom of the permeable chamber,
hc (m)
1
Depth of the permeable chamber, H0 (m)18
Horizontal hydraulic conductivity, Kh (m/s)3.75 × 10−9
Cylinder diameter, de (m)1.015
Diameter of permeable chamber, dpc (m)5 × 10⁻²
Diameter of siphon pipe,
d (m)
5 × 10⁻³
Time interval, Δt (s)0.01
Local resistance coefficient of siphon pipe, ζi0.131
Table 2. Factor values of each scenario.
NumberFactorDiameter of Siphon Pipe,
d (mm)
Length of Siphon Pipe, L (m)Local Resistance Coefficient of Siphon Pipe, ζThickness of Sealing Soil Column, hs (m)Diameter of Permeable Chamber, dpc (cm)Horizontal Hydraulic Conductivity, Kh (×10−9 m/s)Cylinder Diameter, de (m)
0-0/5500.1315.353.751.015
1-1d4500.1315.353.751.015
1-2 6500.1315.353.751.015
2-1L5200.1315.353.751.015
2-2 5800.1315.353.751.015
3-1ζ55005.353.751.015
3-2 5507005.353.751.015
4-1hs5500.131253.751.015
4-2 5500.131853.751.015
5-1dpc5500.1315.333.751.015
5-2 5500.1315.373.751.015
6-1Kh5500.1315.3511.015
6-2 5500.1315.3571.015
7-1de5500.1315.353.750.7
7-2 5500.1315.353.751.3
Table 3. Range of factor values.
FactorDiameter of Siphon Pipe,
d (mm)
Length of Siphon Pipe, L (m)Local Resistance Coefficient of Siphon Pipe, ζThickness of Sealing Soil Column, hs (m)Diameter of Permeable Chamber, dpc (cm)Horizontal Hydraulic Conductivity, Kh (×10−9 m/s)Cylinder Diameter, de (m)
Maximum value620070098101.5
Minimum value42001310.5
Table 4. The first-order and total-order sensitivity indices of various factors when the sample size is 5000.
FactorDiameter of Siphon Pipe,
d (mm)
Length of Siphon Pipe, L (m)Local Resistance Coefficient of Siphon Pipe, ζThickness of Sealing Soil Column, hs (m)Diameter of Permeable Chamber, dpc (cm)Horizontal Hydraulic Conductivity, Kh (×10−9 m/s)Cylinder Diameter, de (m)
Si0.07310.06180.00180.77720.01960.04190.0024
ΣSi0.9779
Si/ΣSi7.48%6.32%0.18%79.48%2.00%4.28%0.25%
SiT0.08610.07490.00240.78250.02730.04830.0027
ΣSiT1.0242
SiT/ΣSiT8.41%7.31%0.23%76.40%2.67%4.72%0.26%
Disclaimer/Publisher’s Note: The statements, opinions and data contained in all publications are solely those of the individual author(s) and contributor(s) and not of MDPI and/or the editor(s). MDPI and/or the editor(s) disclaim responsibility for any injury to people or property resulting from any ideas, methods, instructions or products referred to in the content.

