Article

An Improved VO Method for Collision Avoidance of Ships in Open Sea

1
Intelligent Transportation Systems Research Center, Wuhan University of Technology, Wuhan 430070, China
2
National Engineering Research Center for Water Transport Safety, Wuhan 430070, China
3
National Engineering Research Center of Ship & Shipping Control System, Shanghai 200134, China
4
Beibu Gulf Port Qinzhou Terminal Co., Ltd., Qinzhou 535000, China
*
Author to whom correspondence should be addressed.
J. Mar. Sci. Eng. 2024, 12(3), 402; https://doi.org/10.3390/jmse12030402
Submission received: 20 December 2023 / Revised: 20 January 2024 / Accepted: 13 February 2024 / Published: 26 February 2024

Abstract

:
In order to effectively deal with collisions in various encounter situations in open water environments, a ship collision avoidance model was established, and multiple constraints were introduced into the velocity obstacle method, a method to determine the ship domain by calculating the safe distance of approach was proposed. At the same time, the ship collision avoidance model based on the ship domain is analyzed, and the relative velocity set of the collision cone is obtained by solving the common tangent line within the ellipse. The timing of starting collision avoidance is determined by calculating the ship collision risk, and a method for ending collision avoidance is proposed. Finally, by comparing the simulation experiments of the improved algorithm with those of the traditional algorithm and the actual ship experiment results of manual ship maneuvering, it is shown that the method can effectively avoid collisions based on safe encounter distances that comply with navigation experience in different encounter situations. At the same time, it has better performance in collision avoidance behavior. It has certain feasibility and practical applicability.

1. Introduction

Compared with other types of transportation, maritime transportation costs are much lower, and its transportation capacity is huge. With the increasing prosperity of international trade, maritime transportation as an important mode of transportation has achieved great development. At the same time, the industry of ship construction is developing in the direction of intellectualization and enlargement in capacity, which has further improved the transportation efficiency of shipping. However, due to the huge volume of shipping business and a more complex navigation environment, ship navigation safety faces important challenges and impacts [1].
The safety of ship navigation has always been an important area of concern and research by domestic and foreign scholars. According to water accident surveys, most water accidents are caused by human factors, and ship collision accidents account for an important proportion of them [2]. With the continuous development of intelligent and networked technologies, the automation level of ships has been significantly improved. Therefore, research on autonomous ship collision avoidance has also become a focus in the field of safe ship navigation [3]. Continuous research and development in this field provides new opportunities and challenges for preventing accidents and reducing collision risks, which is of great significance to ship navigation safety.
One of the focuses of research on ship collision avoidance behavior is the timing of taking collision avoidance actions and the safe passage distance. The research results in this area mainly focus on the ship domain and the dynamic boundary. The concept of ship domain was first proposed by Fujii [4] and used statistical methods to establish an elliptical ship domain model related to the ship length. Goodwin [5] considered the Convention on the International Regulations for Preventing Collisions at Sea, 1972 (COLREGs) and established a ship domain consisting of three unequal sector regions. However, these ship domains do not take into account the influence of human factors, environmental factors, and ship maneuverability, and their practical application results are not ideal. Smierzchalski [6] determined a hexagonal ship domain model using ship speed and parameters of turning test. Wang et al. [7] fully considered relevant factors such as COLREGs, ship maneuverability, and length and speed of ships, and proposed a quaternary ship domain. These methods determine the size of the ship domain by finding the minimum passage distance of the ship. In order to prevent the ship domain from being infringed, Davi et al. [8] proposed the concept of the dynamic boundary based on the Goodwin model, and defined the dynamic boundary as the domain where the ship begins to take collision avoidance actions. However, because the dynamic boundary cannot take into account the impact of ship speed on collision avoidance timing, the prediction accuracy of the dynamic boundary is not high. Therefore, most researchers use ship collision risk models to predict collision avoidance timing. In the early days, most ships used distance at closest point of approach (DCPA) and time at closest point of approach (TCPA) to estimate the collision risk of the ship to avoid collisions. Although this method is intuitive, simple, and has advantages, factors such as distance, ship speed ratio, and target ship maneuvering may be ignored in the calculation, resulting in inaccurate prediction results [9]. With the development of computer technology, new methods are constantly emerging. Currently, researchers use fuzzy theory, expert systems, and neural network methods [10] to calculate ship collision risk. Chen et al. [11] used neural network and fuzzy reasoning to propose a calculation method for ship collision risk. Zhao et al. [12] combined the ship domain model and the collision risk model, used the quaternary ship domain to determine the safe distance and considered the COLREGs, and proposed a fuzzy evaluation-based calculation method for unmanned surface vessel collision risk. Li et al. [13] proposed an improved Rule-aware Time-varying Collision Risk Model, which considers the estimation of target ship motion and the corresponding risk uncertainty analysis process, and integrates ship maneuverability, COLREGs, and good seamanship. Abebe et al. [14] proposed a new method for calculating the collision risk index (CRI) by combining machine learning with D-S theory to increase the efficiency of the computations while preserving the prediction accuracy of the CRI.
Research on ship collision avoidance mainly focuses on two aspects: ship collision avoidance models and path planning methods. Ship collision avoidance models can be divided into ship domain model and collision risk model. In terms of path planning and collision avoidance, safe navigation of ships requires efficient collision avoidance algorithms to deal with dynamic environments. Commonly used algorithms include artificial potential field method [15], A* algorithm [16], particle swarm algorithm [17], etc. These traditional ship collision avoidance algorithms are simple and easy to understand, and have strong search capabilities in global planning. However, they are mostly used to avoid collisions with static obstacles. They cannot respond quickly in the dynamic environment during navigation and may fall into local optimal solution [18].
When dealing with dynamic obstacles or complex encounter situations, the velocity obstacle (VO) algorithm can more flexibly adapt to situation changes and provide a more accurate collision avoidance strategy. At the same time, it is easier to generate a global optimal solution than traditional methods. Therefore, the VO algorithm is widely used by researchers. Hong et al. [19] constructed an obstacle model and a collision risk model, and completed the dynamic obstacle avoidance of unmanned surface vessels by introducing the VO algorithm with multiple constraints. Zhang et al. [20] combined the dynamic window method and the VO algorithm, and proposed a virtual obstacle method; Ma et al. [21] introduced the artificial potential field method and inland river collision avoidance rule constraints into the VO algorithm to achieve collision avoidance of stand-on ships and static obstacles; Zhang et al. [22] proposed a collision avoidance decision-making system for inland river ships based on the VO algorithm, and improved the ship motion model (MMG) suitable for inland rivers; Wang et al. [23] proposed a new collision avoidance decision-making system specifically designed for autonomous ships, where the VO algorithm is combined with a finite state machine (FSM) and considers various constraints such as ship maneuverability, COLREGs, and navigation technology.
Nevertheless, there are some problems in applying the traditional VO algorithm for ship collision avoidance. When ships are in different encounter situations, they will use different safe distance of approach to pass by, and this algorithm often simplifies obstacles into circular targets, resulting in the same encounter distance between two ships in different situations, which is obviously not in line with navigation reality. COLREGs has detailed regulations on ship collision avoidance. The traditional VO algorithm may have certain limitations in complying with these rules, making it difficult to achieve strict compliance with COLREGs [24]. At the same time, the traditional VO algorithm applied to ship collision avoidance can only provide a collision avoidance strategy based on the current status, but it is obviously difficult to determine how to avoid collision at the right time; the method of ending collision avoidance mostly uses T C P A < 0 , while under this condition, when collision avoidance ends and returns to the original course or track, TCPA will experience a trend of first increasing and then decreasing, which means that the own ship will create a collision risk with the target ship again when returning to the original course or track [25].
Therefore, in order to make up for the shortcomings of the traditional algorithm, this paper combines COLREGs and draws on the suggestions of experienced captains, introduces these experiences into the VO algorithm, and proposes a ship domain of the same proportion as the Fujii model, so that the give-way ship can comply with COLREGs. Based on the rules, the collision avoidance action of the two ships is completed with the optimal collision avoidance course angle. Finally, we also propose a method for determining when to start and end collision avoidance. These improvements are designed to improve the safety and efficiency of ship collision avoidance and make it more in line with the needs of actual navigation situations. The specific flow chart is shown in Figure 1.

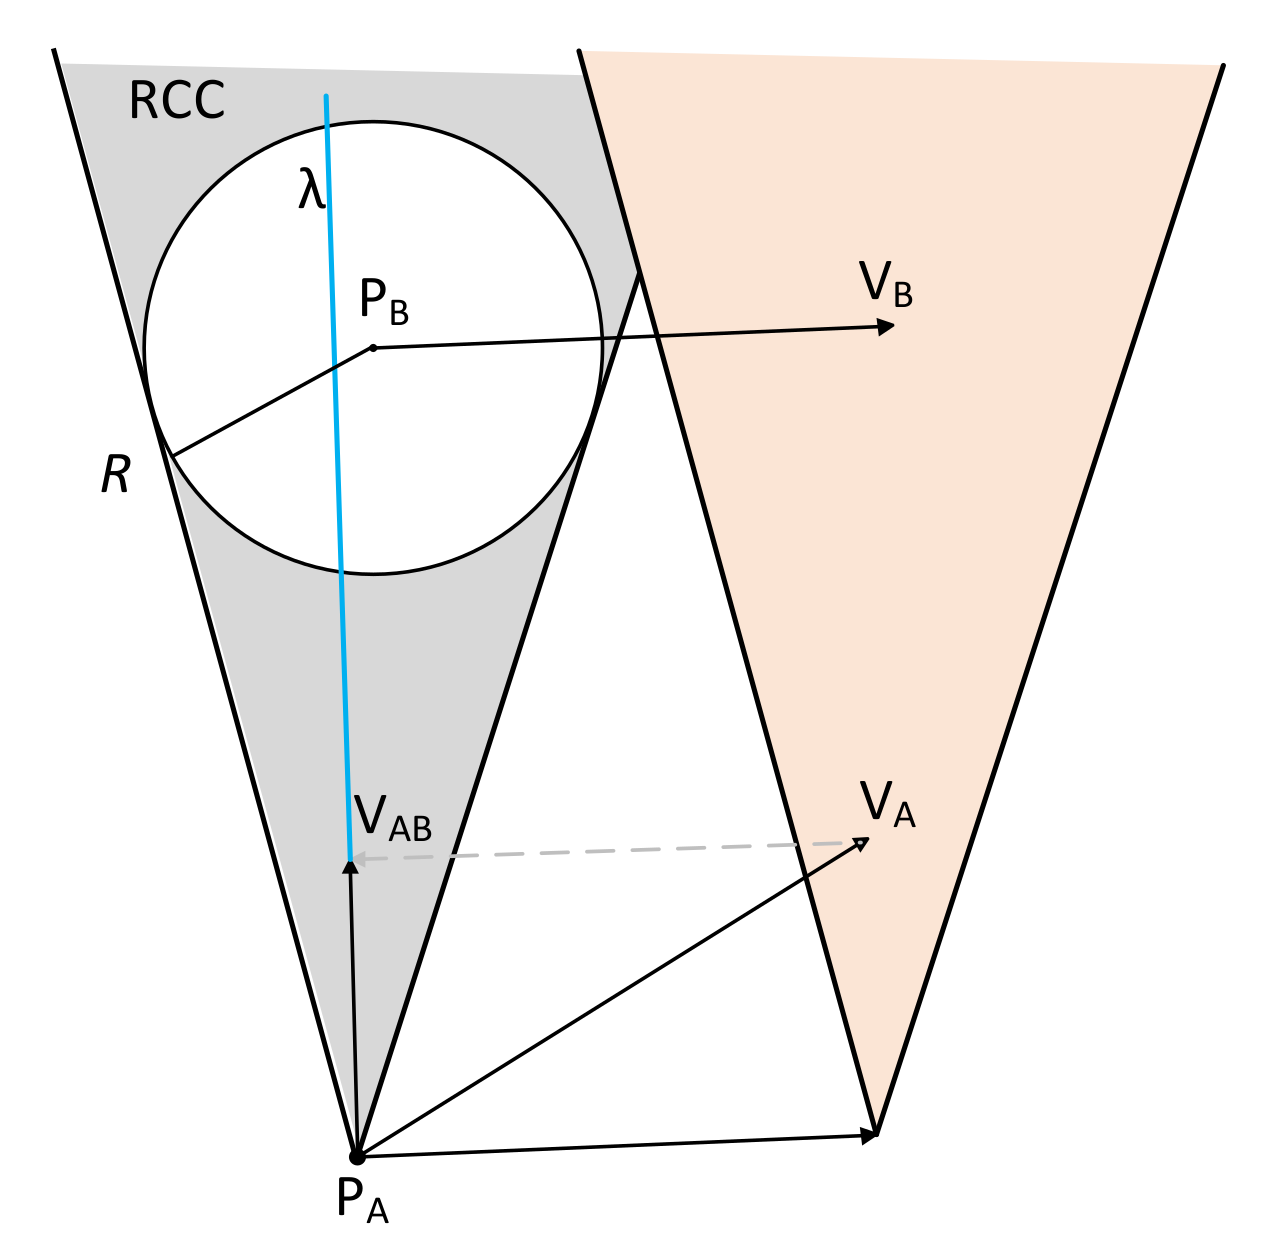
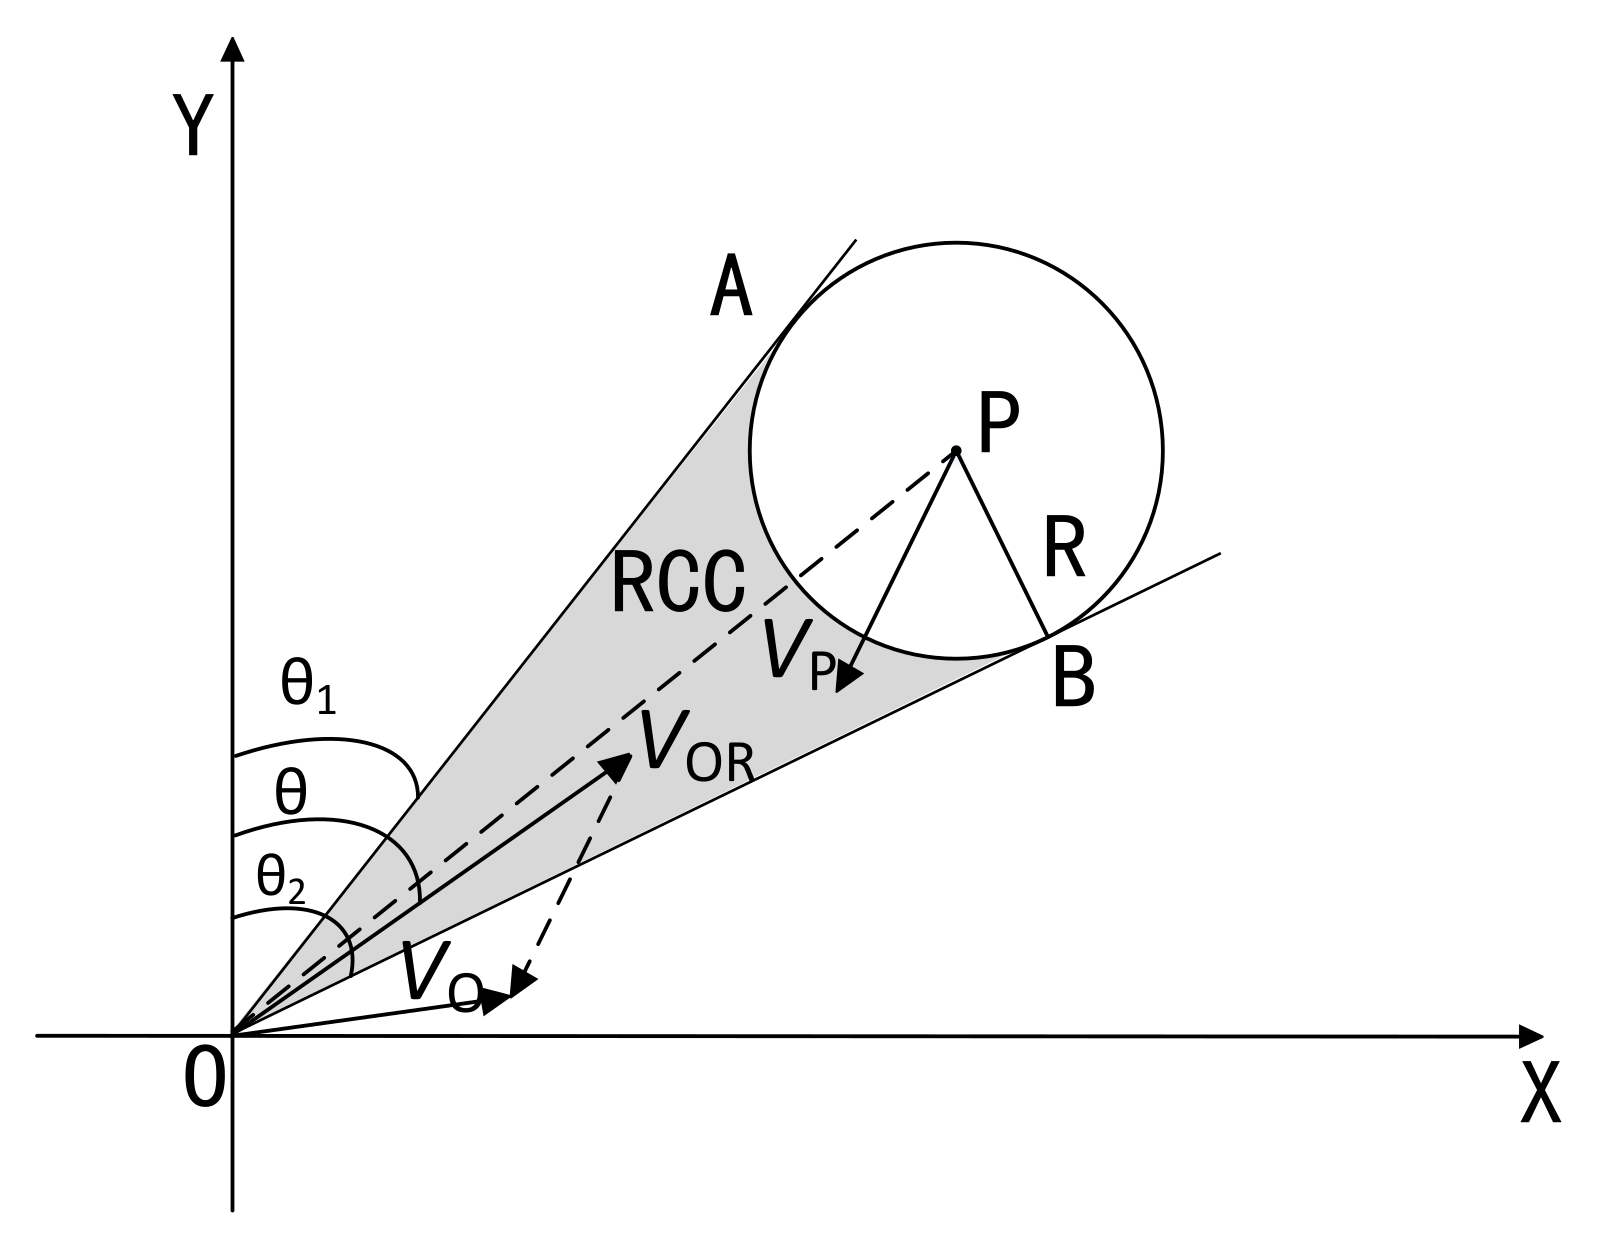
2. The Velocity Obstacle Algorithm

2.1. Methods and Principles

Assume that the position of ship A is P A , the velocity is V A , and the radius is R A ; obstacle B is located at P B , the velocity is V B , and the radius is R B . According to the radius of the robot, the obstacle is expanded into a circle with radius R , R = R A + R B . Then the mobile robot can be simplified into a particle [26].
As shown in Figure 2, define the relative velocity of A and B as V A B = V A V B . When the robot moves at the relative velocity V A B , the obstacle can be regarded as a static obstacle; a ray λ P A , V A B denotes a line starting from point A (denoted as P A ) in the direction of vector V A B (representing the vector from point A to point B), assuming that the relative velocity V A B remains unchanged, when the ray λ P A , V A B intersects the obstacle B, it is considered that A and B will collide at some time in the future. The set of V A B that cause A and B to collide is defined as Relative Collision Cone (RCC), that is, the relative collision area in the relative velocity space of A and B, which can be expressed as:
R C C = V A B λ P A , V A B B
Translate the relative collision cone along the direction of V A B to the end of the velocity vector to form a new cone-shaped area, the absolute collision cone. If V A falls into this area, A and B will collide at some point in the future, causing A and B to collide. The set of V A is called Velocity Obstacle:
V O = R C C V A
where represents the Minkowski sum. If V A is adjusted so that it does not belong to the velocity vector in the VO set, the robot can avoid obstacles and prevent collisions and continue to move.

2.2. Application in Ship

The VO algorithm is mainly used in collision avoidance of robots, using the expanded volume of the robot as a collision area to avoid collisions. This method allows two robots to complete collision avoidance behaviors at a relatively close distance. Later, the VO algorithm was gradually applied to ship collision avoidance. Due to the ship-to-ship effect, if ships also encounter each other at a close distance during collision avoidance, the risk of ship collision will be greatly increased [27]. Therefore, ships need to ensure that they pass at a safe distance during the encounter. The safe distance can be defined as safe distance of approach ( S D A ) [28]. As shown in Figure 3, the VO algorithm is used to establish a ship collision avoidance model. Turn the own ship into a particle, represented by O , and the velocity vector is V O ; set the target ship as a circle with a radius of R = S D A , so that the two ships maintain a safe distance, represented by P, and the velocity vector is V P , then the relative velocity of the two ships is V O P = V O V P .
At this time, the target ship can be regarded as stationary when the own ship is sailing at velocity V o p . If the relative velocity V o p falls within the cone R C C in the figure, then the two ships will collide at some point. That is, V o p R C C , then the own ship and the target ship are in danger of collision; if V o p R C C , then the own ship and the target ship are safe. To sum up, the core of the VO algorithm is to determine the collision cone, as shown with grey area in Figure 3.
In Figure 3, the relative coordinates (ship mounted coordinate system) were built, in which the y-axis points north, and the x-axis points east. The clockwise rotation angle of the positive y-axis is the course angle. Assuming that the own ship’s routes OA and OB are tangent to the radius of the target ship, the course angle of OA is θ 1 , the course angle of OB is θ 2 , the relative velocity of the own ship is V R , and the course angle is θ . In order to avoid collision, θ should satisfy θ θ 1 , θ 2 .
Assume the current position of the own ship ( X O , Y O ) and the position of the target ship ( X P , Y P ) , then θ 1 can be obtained by the following formula:
θ 1 = θ O P A O P
where θ O P is the angle between the line segment O P and the y-axis. The calculation formula of θ O P and A O P is as follows:
θ O P = arctan ( X P X O Y P Y O )
A O P = arcsin ( r ( Y P Y O ) 2 + ( X P X O ) 2 )
Substitute Formulas (4) and (5) into Formula (3) to get:
θ 1 = arctan ( X P X O Y P Y O ) arcsin ( r ( Y P Y O ) 2 + ( X P X O ) 2 )
In the same way, θ R can be calculated:
θ 2 = arctan ( X P X O Y P Y O ) + arcsin ( r ( Y P Y O ) 2 + ( X P X O ) 2 )
In summary, if θ θ 1 , θ 2 , then the two ships are in danger of collision; otherwise, the two ships are safe.

3. Improved Velocity Obstacle

3.1. Velocity Obstacle Based on the Ship Domain

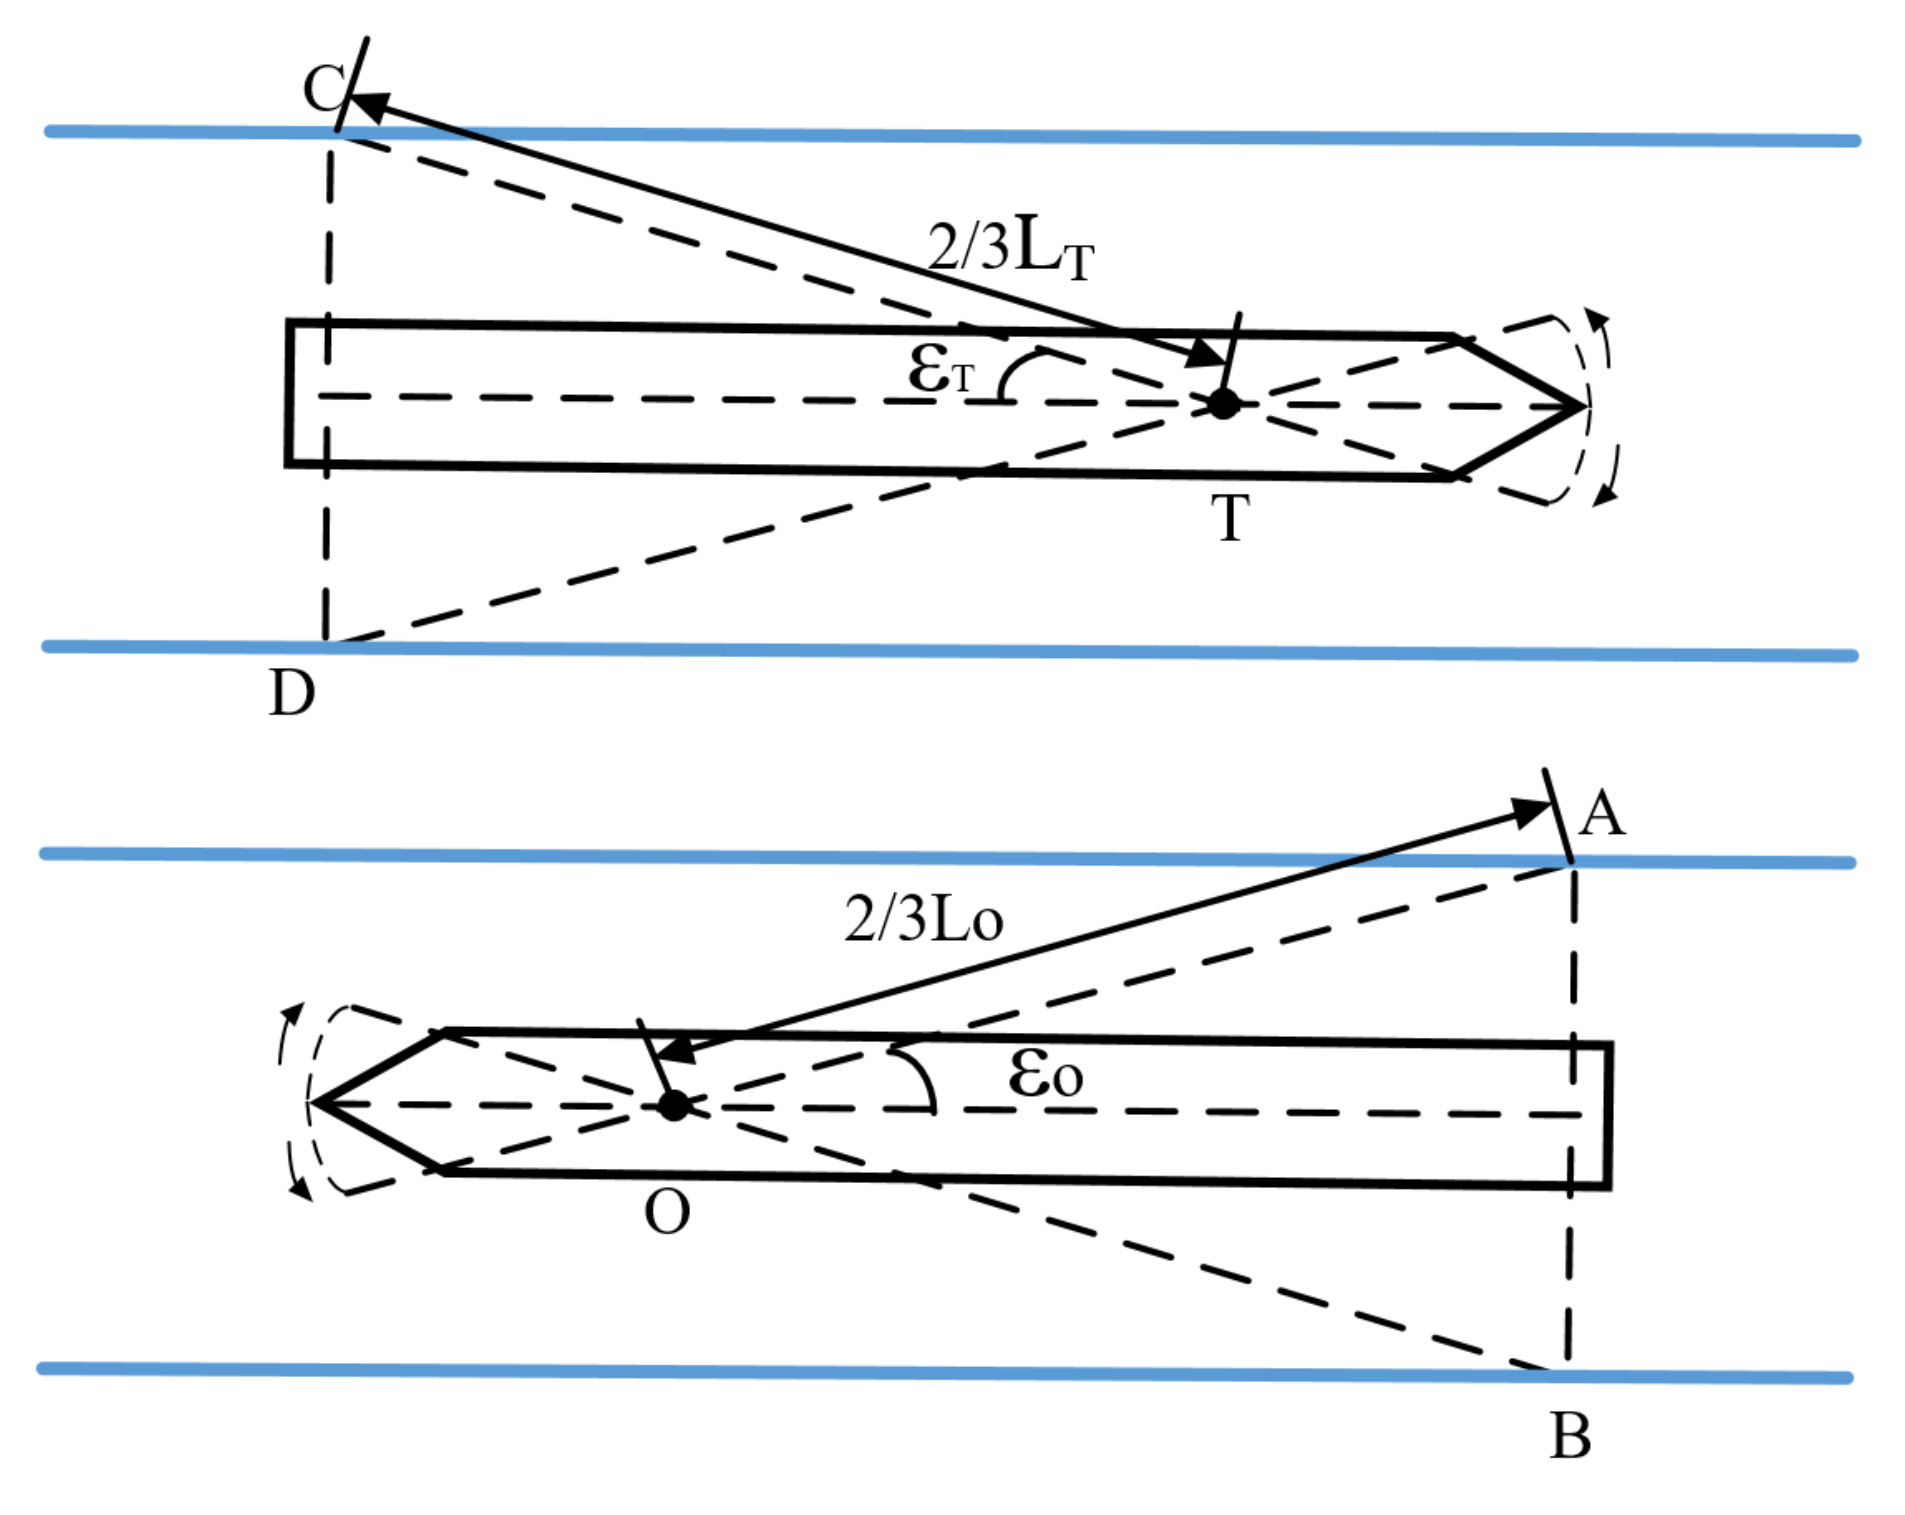
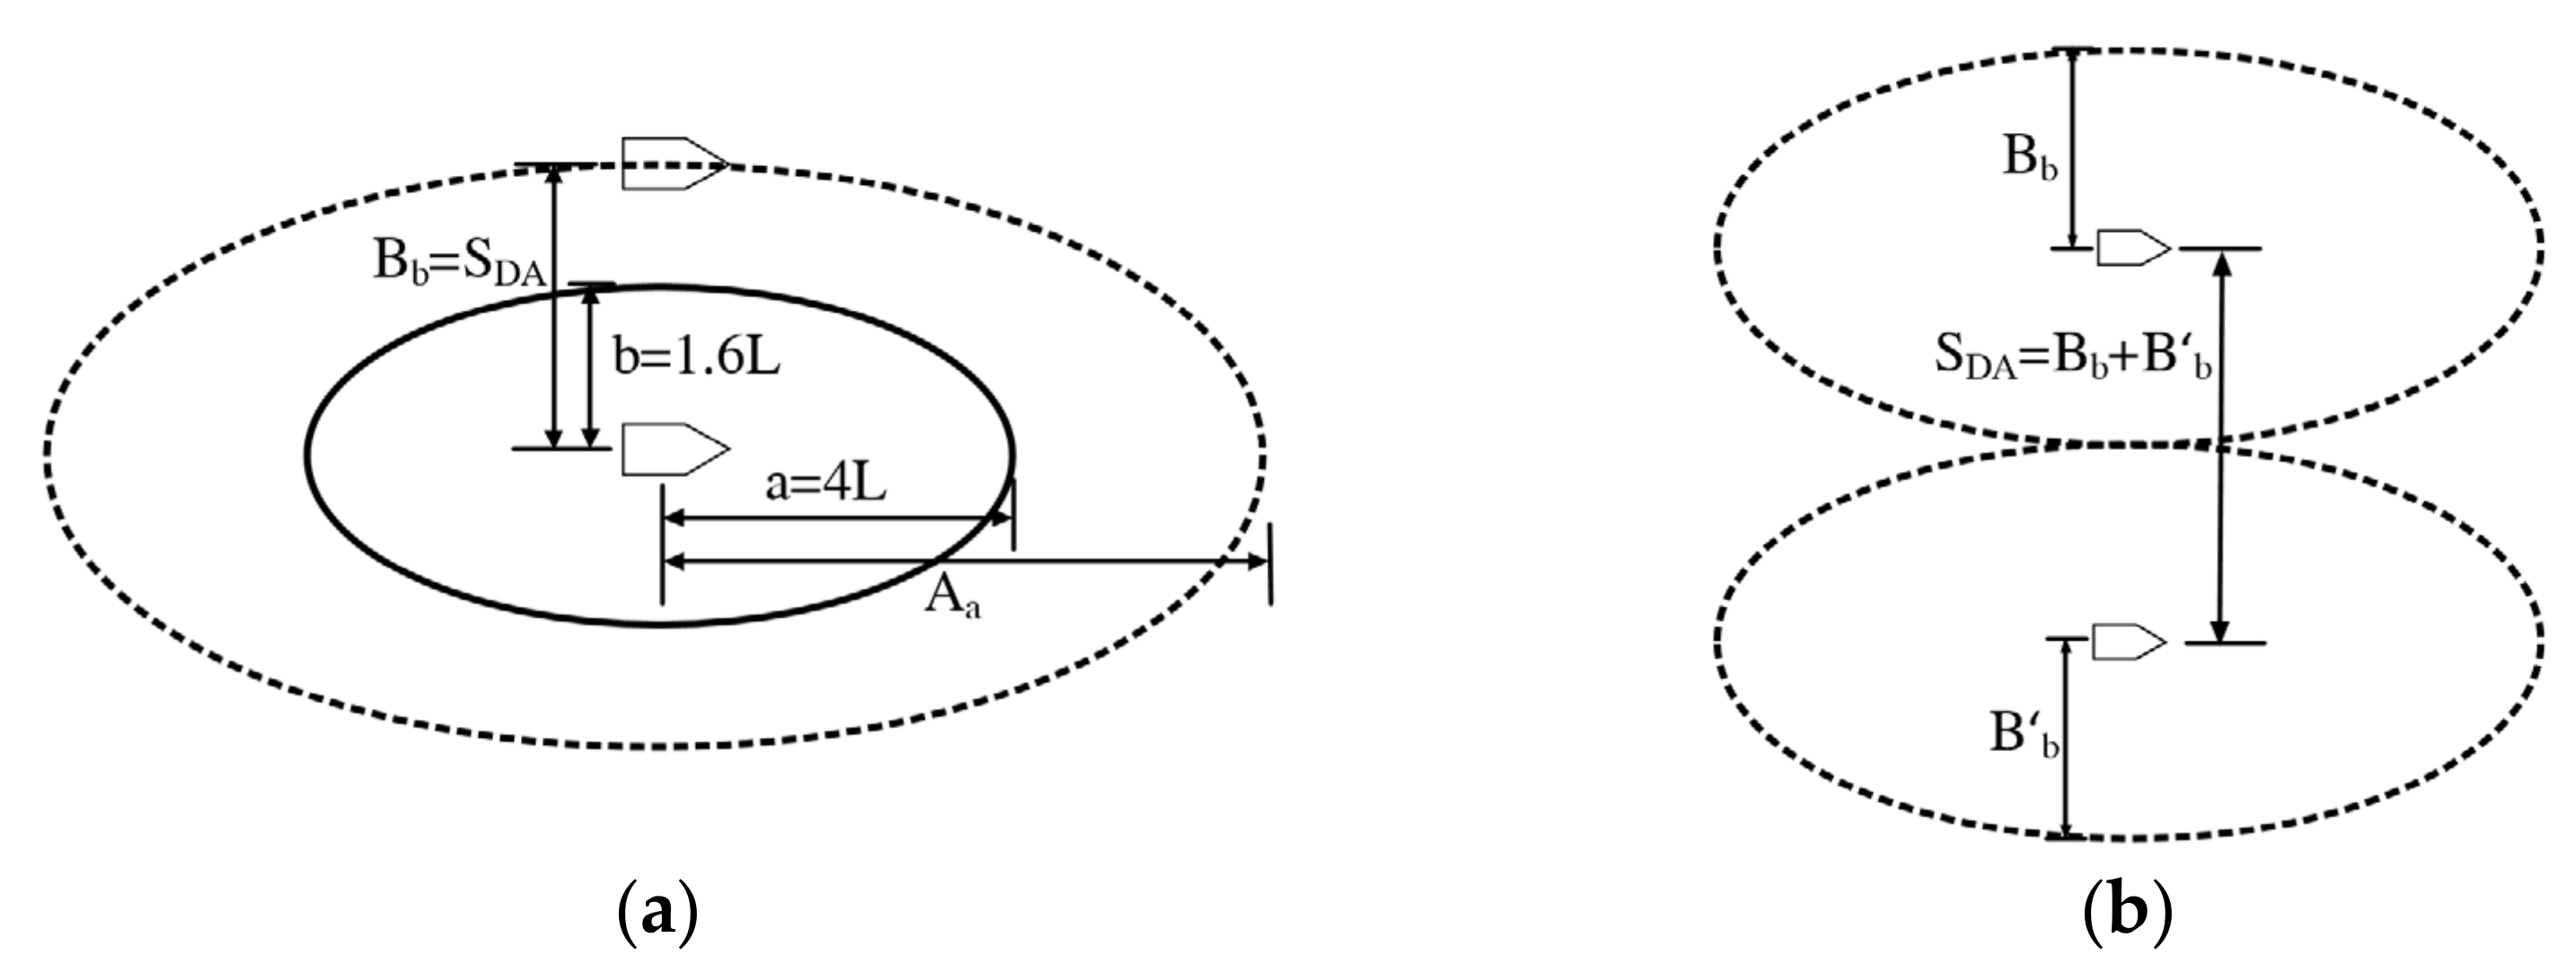
3.1.1. Determine the Ship Domain

In general, the value of safe distance of approach ( S D A ) is vaguely defined based on the interpretation of rules by captains, human experts, and the practical experience of ship pilots [29]. However, the same value of safe distance of approach often appears in different encounter situations, resulting in a decrease in collision avoidance accuracy. Therefore, this paper establishes a mathematical model to quantify S D A based on the calculating method of safe distance of approach proposed by Li [30] and Chen [31], COLREGs, and navigation practices.
The quantification of S D A is divided into two parts, collision area and operating margin. The collision area requires a circular area that takes the size of the two ships, the estimated relative position error, and the error caused by the ship’s navigational yaw motion into consideration. First, Kalman filter [32] is used to calculate the track error of the ship when sailing. Assuming that the filter variance is P, the 2P is regarded as the systematic error caused by environmental interference such as wind, waves, and currents.
During the navigation process, the ship’s trajectory is not a line, but a track belt due to course deviation. Generally, the turning center of a ship is about one-third of the width of the ship position at the bow. As shown in Figure 4, assuming the length of the ship is L and the course deviation is ε , the width of the ship’s track band is:
W O = 2 × 2 3 L O · s i n ε O W T = 2 × 2 3 L T · s i n ε T
where L O , W O , ε O represent the length of own ship, the width of the trajectory belt and course deviation, and L T , W T , ε T represent the length of target ship, the width of the trajectory belt and course deviation. Therefore, the error in collision between the two ships due to course deviation is 1 2 ( W O + W T ) .
And based on the size of the two ships, the radius R c of the ship collision area is obtained by
R c = L o + L T + 2 P + 1 2 ( W O + W T )
where L o and L T represent the length of the own ship and the target ship, respectively, and P is the filter variance.
The operating margin is the distance between the own ship and the target ship after the own ship turns 90° at full speed and full rudder angle. Based on the above analysis, the value of S D A in each encounter situation can be obtained:
  • Head-on situation and crossing situation: S D A = R f ;
  • Own ship being overtaken by the target ship: S D A = R f A d ;
  • Own ship overtaking the target ship: S D A = R f V s × T 90 ;
  • Other situations: S D A = R f D T / 2 .
where R f = R c + A d + ( V s × T 90 ) , T 90 , A d , D T , and V s are, respectively, the time for the ship to rotate 90° at full speed and full rudder angle, the advance, the tactical diameter of the turning, and the relative speed. Figure 5 shows the various parameters of the ship turning test.
Generally, the critical safe distance of approach is largest in crossing situations, lower in overtaking situations, and smallest in head-on situations [31]. However, using the above formula to evaluate S D A in an overtaking situation is much smaller than the actual navigation requirements.
Therefore, this paper makes S D A in the overtaking situation equal to the value in the head-on situation. In maritime traffic, it is believed that to ensure ships sail safely and effectively, a certain safety distance must be kept between ships, and this safety distance can be called as the ship domain radius [33]. Therefore, the ship domain can be determined by the safety distance of approach. To improve the accuracy and safety of ship collision avoidance operation, an elliptical-type ship domain model with the same long and short axis ratio as the Fujii model for collision avoidance is adopted.
The Fujii model takes into account the International Regulations for Preventing Collisions at Sea, ensuring that collision avoidance decisions comply with international regulations, contributing to the compliant autonomous collision avoidance of vessels. As an elliptical model compared to a circular model, it better aligns with the length-to-width ratio of vessels and maintains the minimum distance between two vessels, especially in head-on and crossing encounter situations. However, since the Fujii model is mainly applied to large ships, the length calculated by this model is much smaller than S D A when applied to small- and medium-size ships. To solve this problem, in Figure 6a, a scaling factor f is introduced to enlarge the original semidiameters in Fujii model, shown as black solid ellipse. The dotted ellipse is a schematic diagram of the ship domain, in which the major axis semidiameter A a and minor axis semidiameter B b are enlarged by f . B b is exactly equal to S D A . Meanwhile, the scaling factor can be defined as f = B b / b = A a / a , while, a , b are the major and minor axis semidiameters of Fujii model ellipse, equal to 4 times and 1.6 times of the ship’s length, respectively, to ensure the encounter distance between ships greater than (at least equal to) S D A to prevent the target ship invading the own ship domain.
In addition, it should be emphasized that when the target ship is always located outside the boundary of the own ship’s domain, it can be considered that the own ship’s domain is not infringed; at the same time, it cannot be considered the target ship’s domain is not infringed by the own ship, as the sizes of these two ships’ domains may not be the same. Therefore, this paper adopts the mutual non-intrusion principle between these two ships, the S D A can be defined as the sum of minor axis semidiameters of these two ships’ domains. As a result, the minimum distance between two ships in overtaking encounters is always larger than S D A , as shown in Figure 6b.

3.1.2. Collision Avoidance Analysis Based on Elliptical Ship Domain

The traditional VO algorithm uses the “expanding circle” method to simply superimpose the collision area. If the shapes of both moving objects are irregular, this method would introduce larger errors. This paper adopts the method of finding common tangent lines of two ships’ ellipse domains to avoid errors.
Draw two inner common tangent lines in the ship domains of the own ship and the target ship, as shown in Figure 7. Draw parallel lines OM and ON of these two inner common tangent lines through the origin O to form the relative collision cone RCC, the shadow area. In order to avoid collision, the relative velocity V p needs to fall outside the RCC. Assume the common tangent equation A x + B y + C = 0 , the ship domain equation of the own ship is y = f o ( x ) , and the ship domain equation of the target ship is y = f p ( x ) . The four common tangents (including two inner common tangents and two outer common tangents) can be found by the joint equation, after which the two internal tangents are identified by the relationship between the size of the angle between the common tangent and the positive direction of the y-axis to obtain the range of relative collision area.
Let θ i ( i = 1 , 2 , 3 , 4 ; 0 θ i < 2 π ) be the angles between these four common tangents and the positive direction of the y-axis. Sort θ i according to size: 0 θ 1 < θ 2 θ 3 < θ 4 < 2 π . Under normal circumstances, the two internal common tangents are the minimum and maximum values, respectively, but it is necessary to additionally consider the situation where the common tangents are on both sides of the y-axis. θ represents the set of relative velocity angles that cause the own ship and the target ship to collide:
θ θ 1 , θ 4 θ 0 , θ 1 θ 2 , 2 π θ 0 , θ 2 θ 3 , 2 π θ 0 , θ 3 θ 4 , 2 π θ 4 θ 1 < π θ 2 θ 1 > π θ 3 θ 2 > π θ 4 θ 3 > π
The own ship will collide with the target ship if the relative velocity of own ship and target ship satisfies θ at a certain moment during sailing. In order to avoid the collision, it is necessary to select the desired relative velocity angle R V ( 0 R V < 2 π ) that can avoid the relative collision cone, and in the ideal situation, making R V equal to the boundary angle of the relative collision cone can ensure that the ships go through at a safe distance during collision avoidance operation. However, in the collision avoidance process, to avoid the influence of small perturbations on the collision avoidance system due to environmental interference and other uncertainty factors, resulting in the mutual infringement of the ship domains of the two ships, a correction factor θ r is introduced to modify the R V θ r = R V θ r , so that the R V θ r is always outside the relative collision cone RCC.

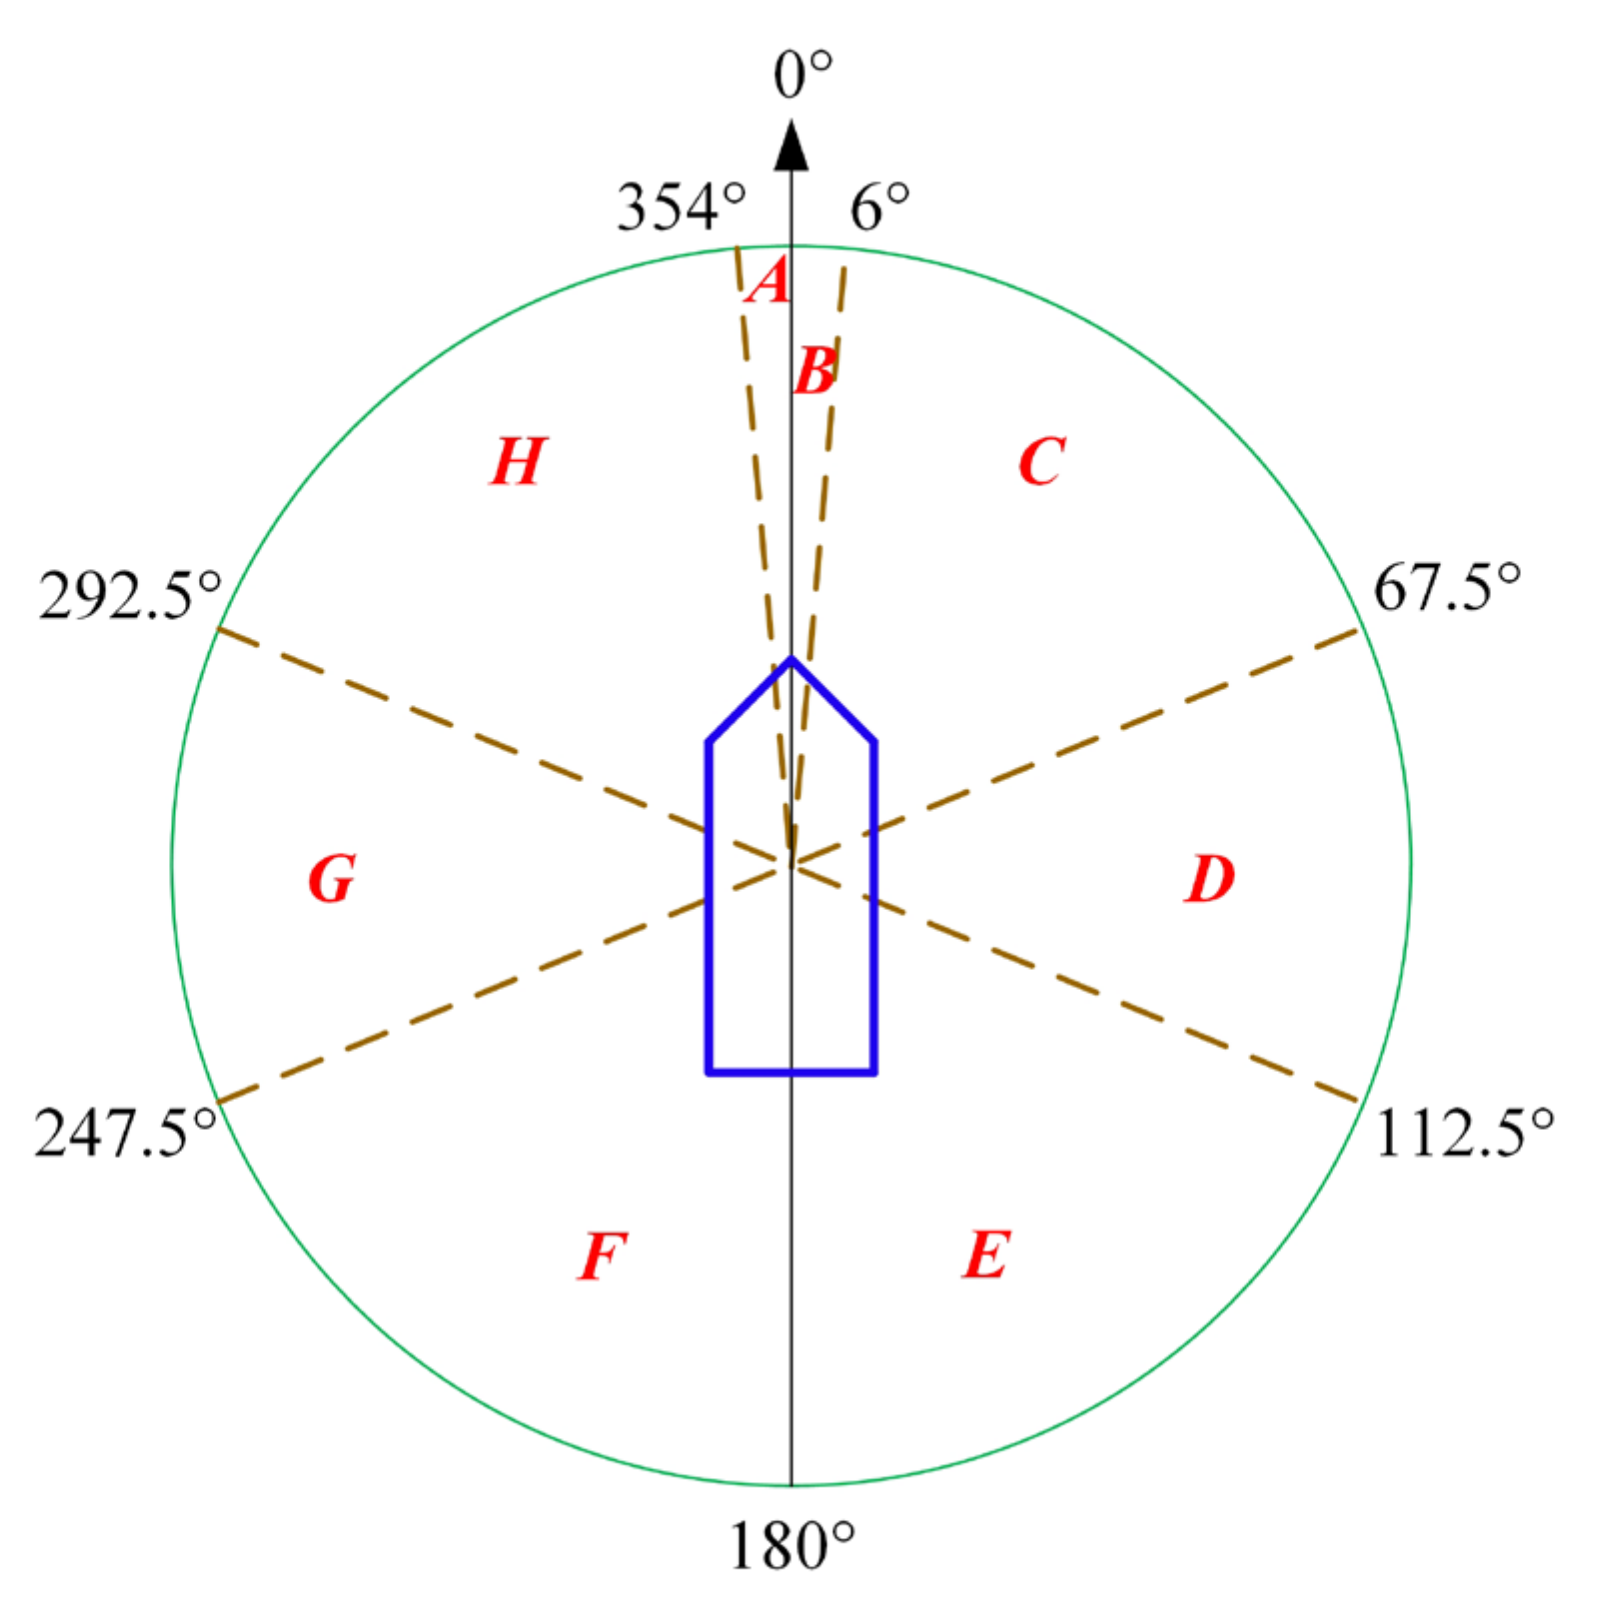
3.2. Application to the Convention on the International Regulations for Preventing Collisions at Sea

When selecting the desired relative velocity angle R V θ r , the traditional VO algorithm generally uses an angle closer to the original velocity vector to update the R V θ r . However, to avoid collisions, ships must conduct collision avoidance operations according to COLREGs. Therefore, when updating R V , each type of encounter situation should be checked according to COLREGs. This paper put forward a method to classify encounter situations [34] referring to the COLREGs, as shown in Figure 8.
The initial encounter situation of ships is divided into three situations: head-on, crossing, and overtaking situation. As in different types of encounter situations, different actions should be adopted. Based on the target ship’s initial position, cross situations could be divided into starboard crossing and port crossing. Ulteriorly, the course difference between these two ships could be a useful item to classify the overtaking, crossing, and head-on situations. As shown in Table 1, when the target ship appears in area C, while the course difference between these two ships falls in 180–270°, this kind of crossing encounter situations could be called small course difference crossing from starboard side, for own ship, turning right and pass on the stern of target ship is suitable. When the target ship appears in area D, while the course difference between these two ships falls in 270–360°, this kind of crossing encounter situations could be called as large course difference crossing form starboard side, for own ship, turning right and pass on the stern of target ship could be dangerous, turning left may be the only suitable action. Similarly, descriptions of other kinds of encounter situations and the suitable actions for the own ship are put forward in Table 1 based on multiple rounds of discussion with seven experienced captains, maritime experts, and autopilot system developers.
At the same time, according to the analysis of encounter situations by Zhong [35], the initial distance between the own ship and target ship could be divided into collision danger, close-quarters situation, and imminent danger according to the avoidance stage, as shown in Table 2. Significantly, imminent danger means the minimum safe turning space of the own ship, equals to S D A .
Select the expected relative velocity R V when the ship is in collision danger. The selected rules could be classified as follows:
  • In head-on and starboard crossing, the ship is the give-way ship, and could alter its course according to the description in Table 1 to avoid collision. That is:
    R V = θ 4 + θ r θ 1 + θ r θ 2 + θ r θ 3 + θ r θ 4 θ 1 < π , θ θ 1 , θ 4 θ 2 θ 1 > π , θ 0 , θ 1 θ 2 , 2 π θ 3 θ 2 > π , θ 0 , θ 2 θ 3 , 2 π θ 4 θ 3 > π , θ 0 , θ 3 θ 4 , 2 π
  • For port side crossing encounter situation where the target ship overtakes the own ship, the own ship is the stand-on ship and should keep its course and speed, and there is no need to calculate R V ;
  • When the own ship is overtaking the target ship and the own ship’s velocity V O module is greater than the target ship, the own ship is the give-way ship and should alter course to avoid collision. According to the 7–8th row of Table 1, the RV can be concluded as follows:
    R V = θ 1 θ r θ 2 θ r θ 3 θ r θ 4 θ r θ 4 θ 1 < π , θ θ 1 , θ 4 θ 2 θ 1 > π , θ 0 , θ 1 θ 2 , 2 π θ 3 θ 2 > π , θ 0 , θ 2 θ 3 , 2 π θ 4 θ 3 > π , θ 0 , θ 3 θ 4 , 2 π
After determining the vector R V through the above method, the course or velocity of the own ship should be controlled by automatic systems making the relative velocity angle of the own ship and the target ship approaching the R V to conduct dynamic collision avoidance. This method could operate well in simulation systems; however, the ship’s speed adjustment frequency is too high for the actual engine system, and in this research, the ship’s speed is not changeable to prevent engine damage. For actual ship’s collision avoidance operation at sea, we mainly adjust course. The expected course C m that the ship can avoid the relative collision cone RCC is obtained by the following formula:
tan R V = V o sin C m V P x V o cos C m V P y
where V P x is the component of the target ship’s speed along the x-axis, and V P y is the component of the target ship’s speed along the y-axis. If C m has two values, choose the desired course which is closer to the current course.

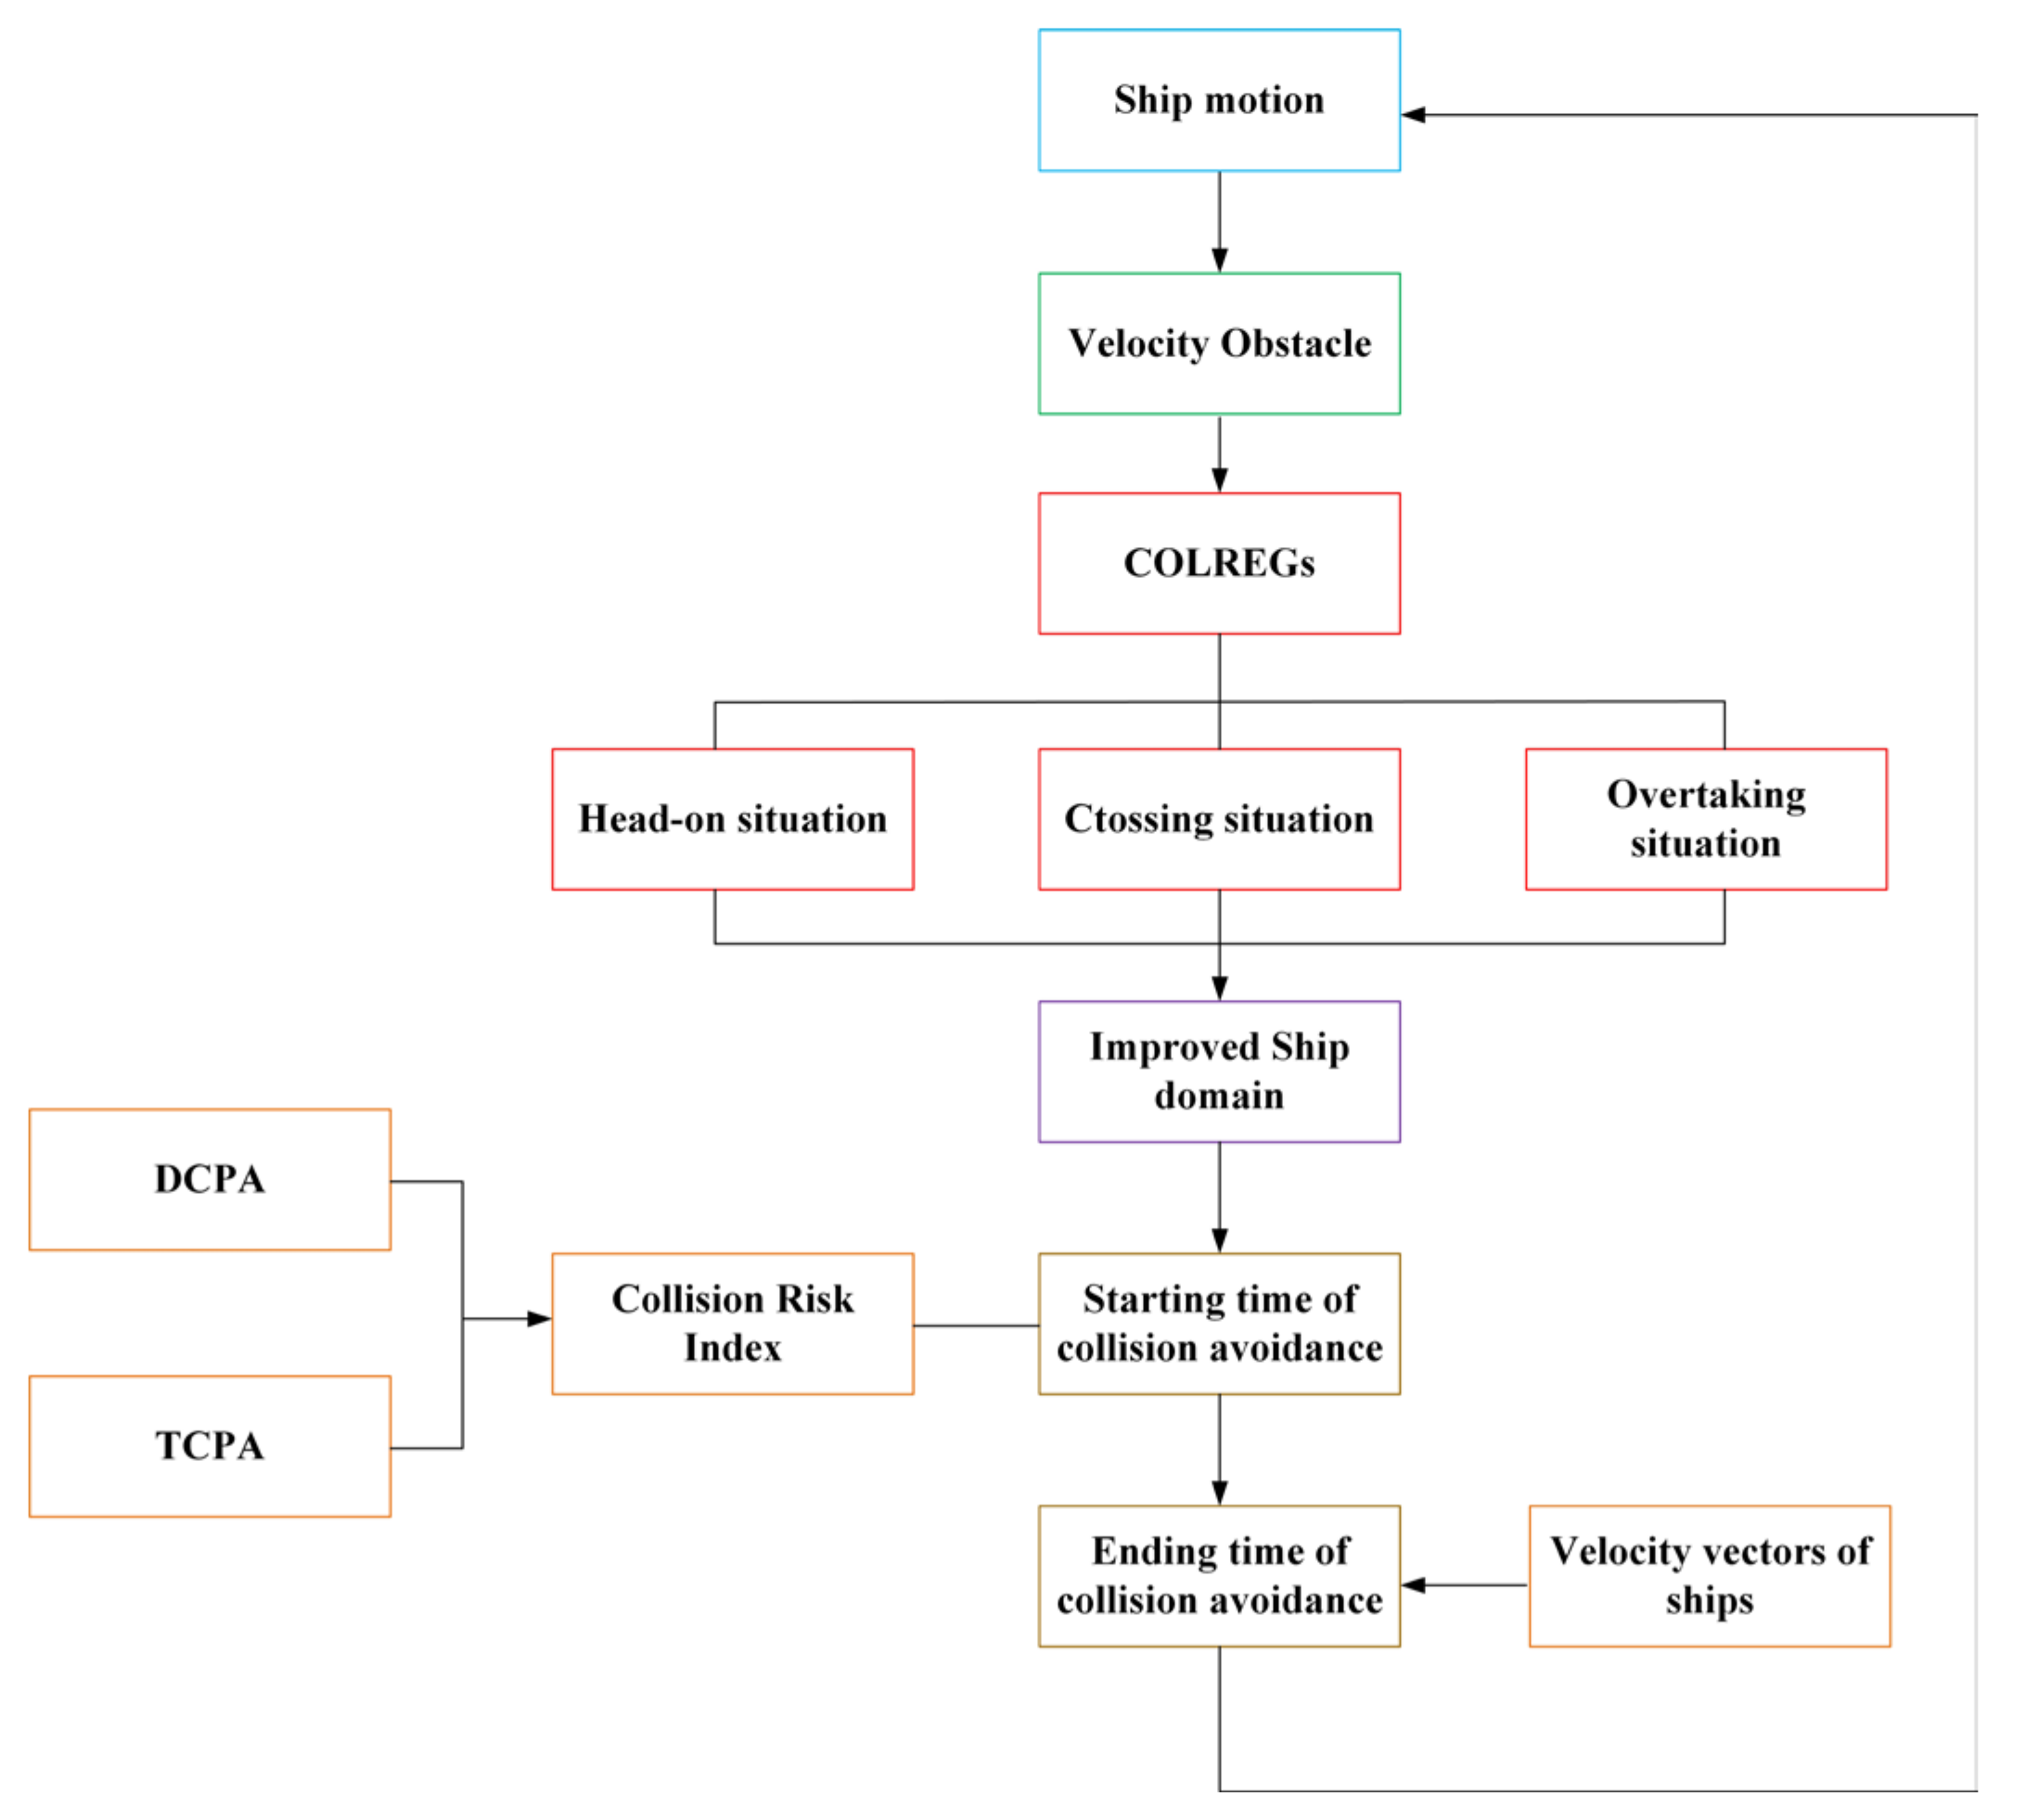
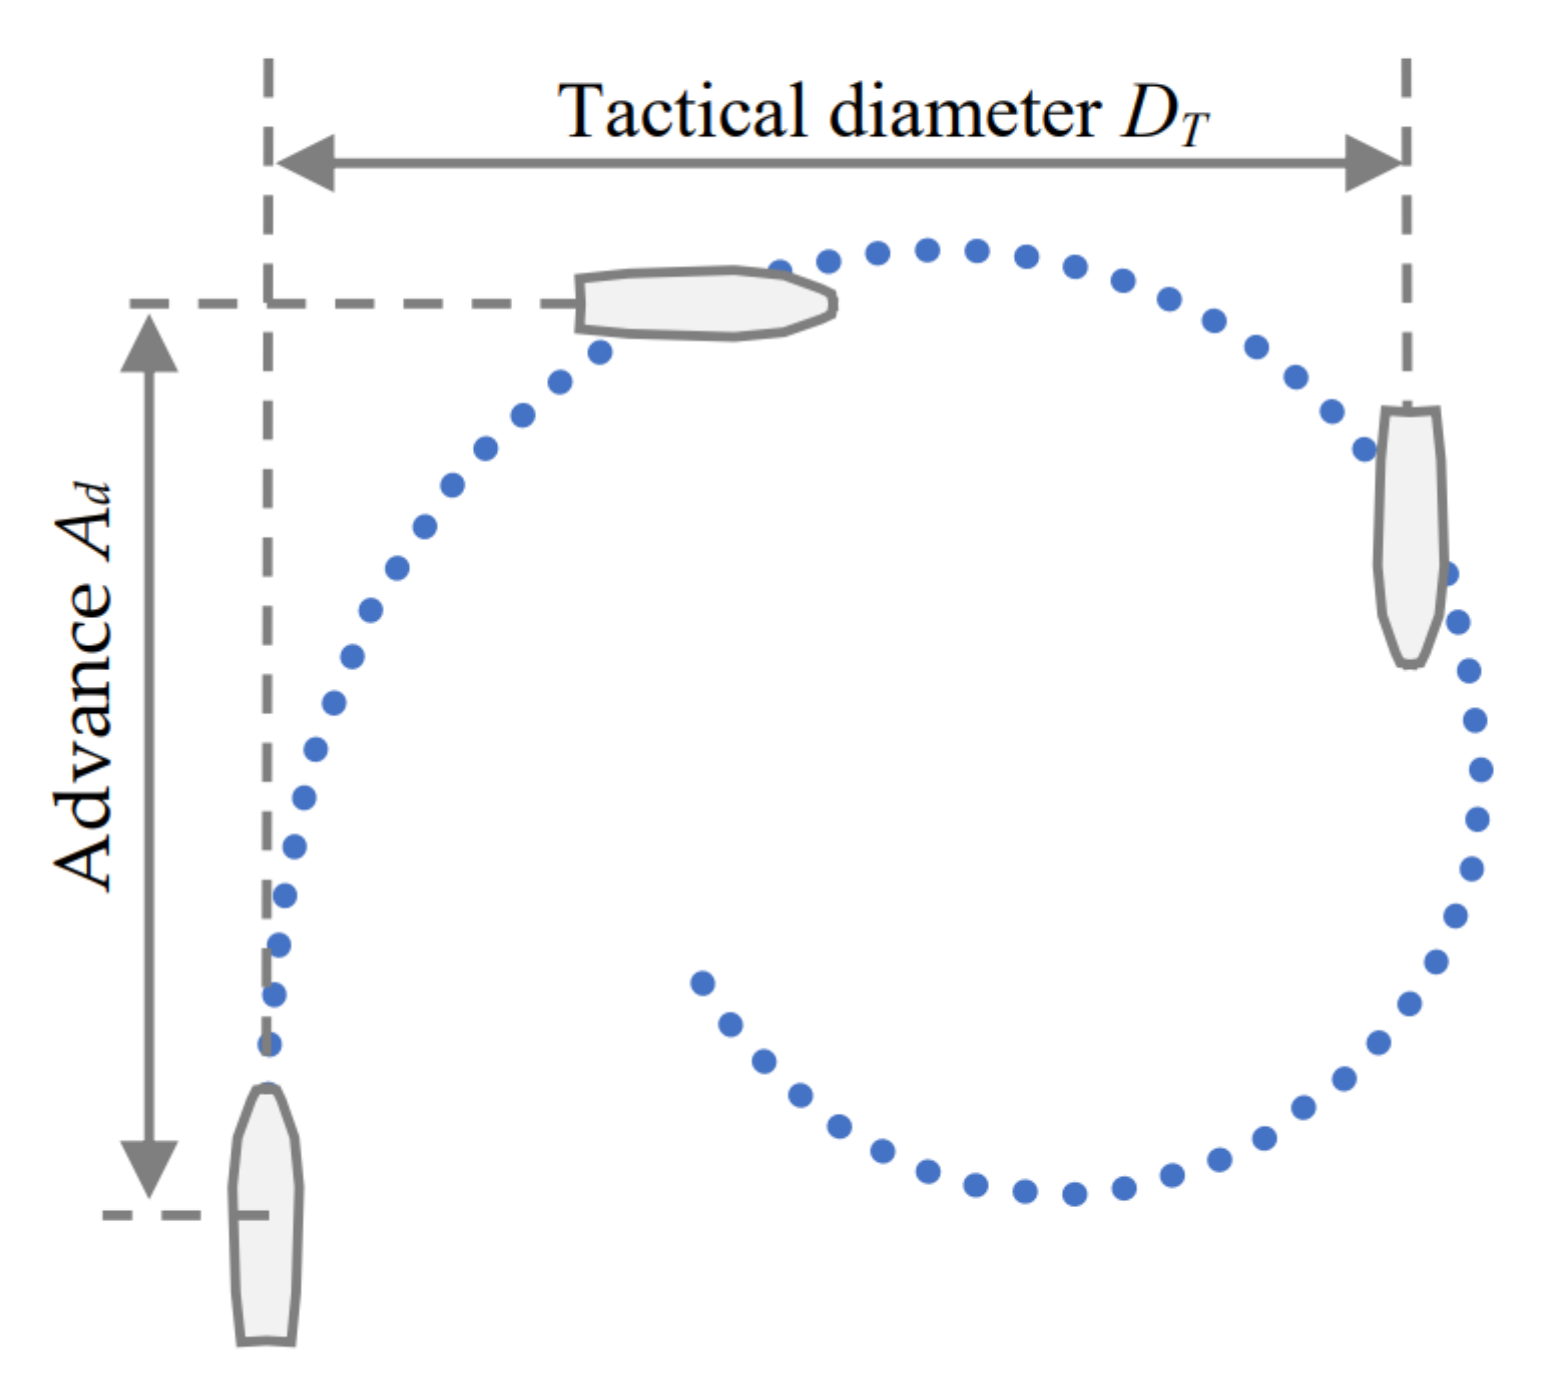
3.3. The Determination of the Start and End Time of Collision Avoidance

3.3.1. Collision Risk Determines the Start Time of Collision Avoidance

In actual situations, there are many factors that affect Collision Risk Index (CRI). Subjective factors include sea state, visibility, etc. Objective factors include DCPA, TCPA, etc. This paper introduced the weighted sum of the corresponding membership functions of DCPA and TCPA to generate the collision risk, thereby determining the start time of collision avoidance [36].
  • Membership function of DCPA could be written as a piecewise function μ D C P A :
    μ D C P A = 1 1 2 1 2 sin π d 2 d 1 D C P A d 1 + d 2 2 0 D C P A d 1 d 1 < D C P A < d 2 d 2 D C P A
    where d 1 indicates the minimum distance between two ships, in this paper d 1 is the minimum distance at which the ship domains of the two ships are tangent; d 2 indicates the minimum distance at which the two ships can safely pass, d 2 = 2 d 1 .
  • Membership function of TCPA could also be written as a piecewise function μ T C P A :
    μ T C P A = 1 t 2 T C P A t 2 t 1 2 0 T C P A t 1 t 1 < T C P A < t 2 T C P A t 2
    where,
    t 1 = D 1 2 D C P A 2 V r D C P A D 1 V r D C P A D 1 D C P A > D 1
    t 2 = D 2 2 D C P A 2 V r
    where D 1 is the distance between these two ships at the last opportunity to use helm, which is generally 12 times the length of the own ship; D 2 is the dynamic boundary, that is, the distance at which the own ship starts turning, and is obtained as follows:
    D 2 = 1.7 cos B t 19 ° + 4.4 + 2.89 c o s 2 B t 19 °
    where B t is the true direction of the target ship relative to own ship.
By weighting the membership functions of DCPA and TCPA, the collision risk of the ship is obtained as:
μ r = α d · μ D C P A + α t · μ T C P A
where α d and α t are the weighting coefficients of their respective functions.
The ship starts to avoid collision when it meets the following two conditions:
  • The relative velocity vectors of the two ships are in the relative collision cone RCC;
  • Based on the collision avoidance test results of multiple encounter situations and the collision avoidance suggestions of the experienced captain, the ship collision risk assessment μ r is larger than 0.72.

3.3.2. Conditions for Ending Collision Avoidance

Theoretically, T C P A < 0 means the collision risk is low enough, and returning to original course or track should be conducted; however, in our simulation, the desired course C m oscillation is caused by the algorithm. The reason is that returning to the original course makes T C P A greater than zero. To avoid this phenomenon, the collision avoidance could be terminated when the ship satisfies Equation (20).
V L O S R C C , V o r i g R C C V d e s R C C
where V L O S is the velocity vector of trajectory tracking planning, V o r i g is the velocity vector when the own ship moves along the original course direction at the current speed, and V d e s is the velocity vector when the own ship moves along the original track direction at the current speed.

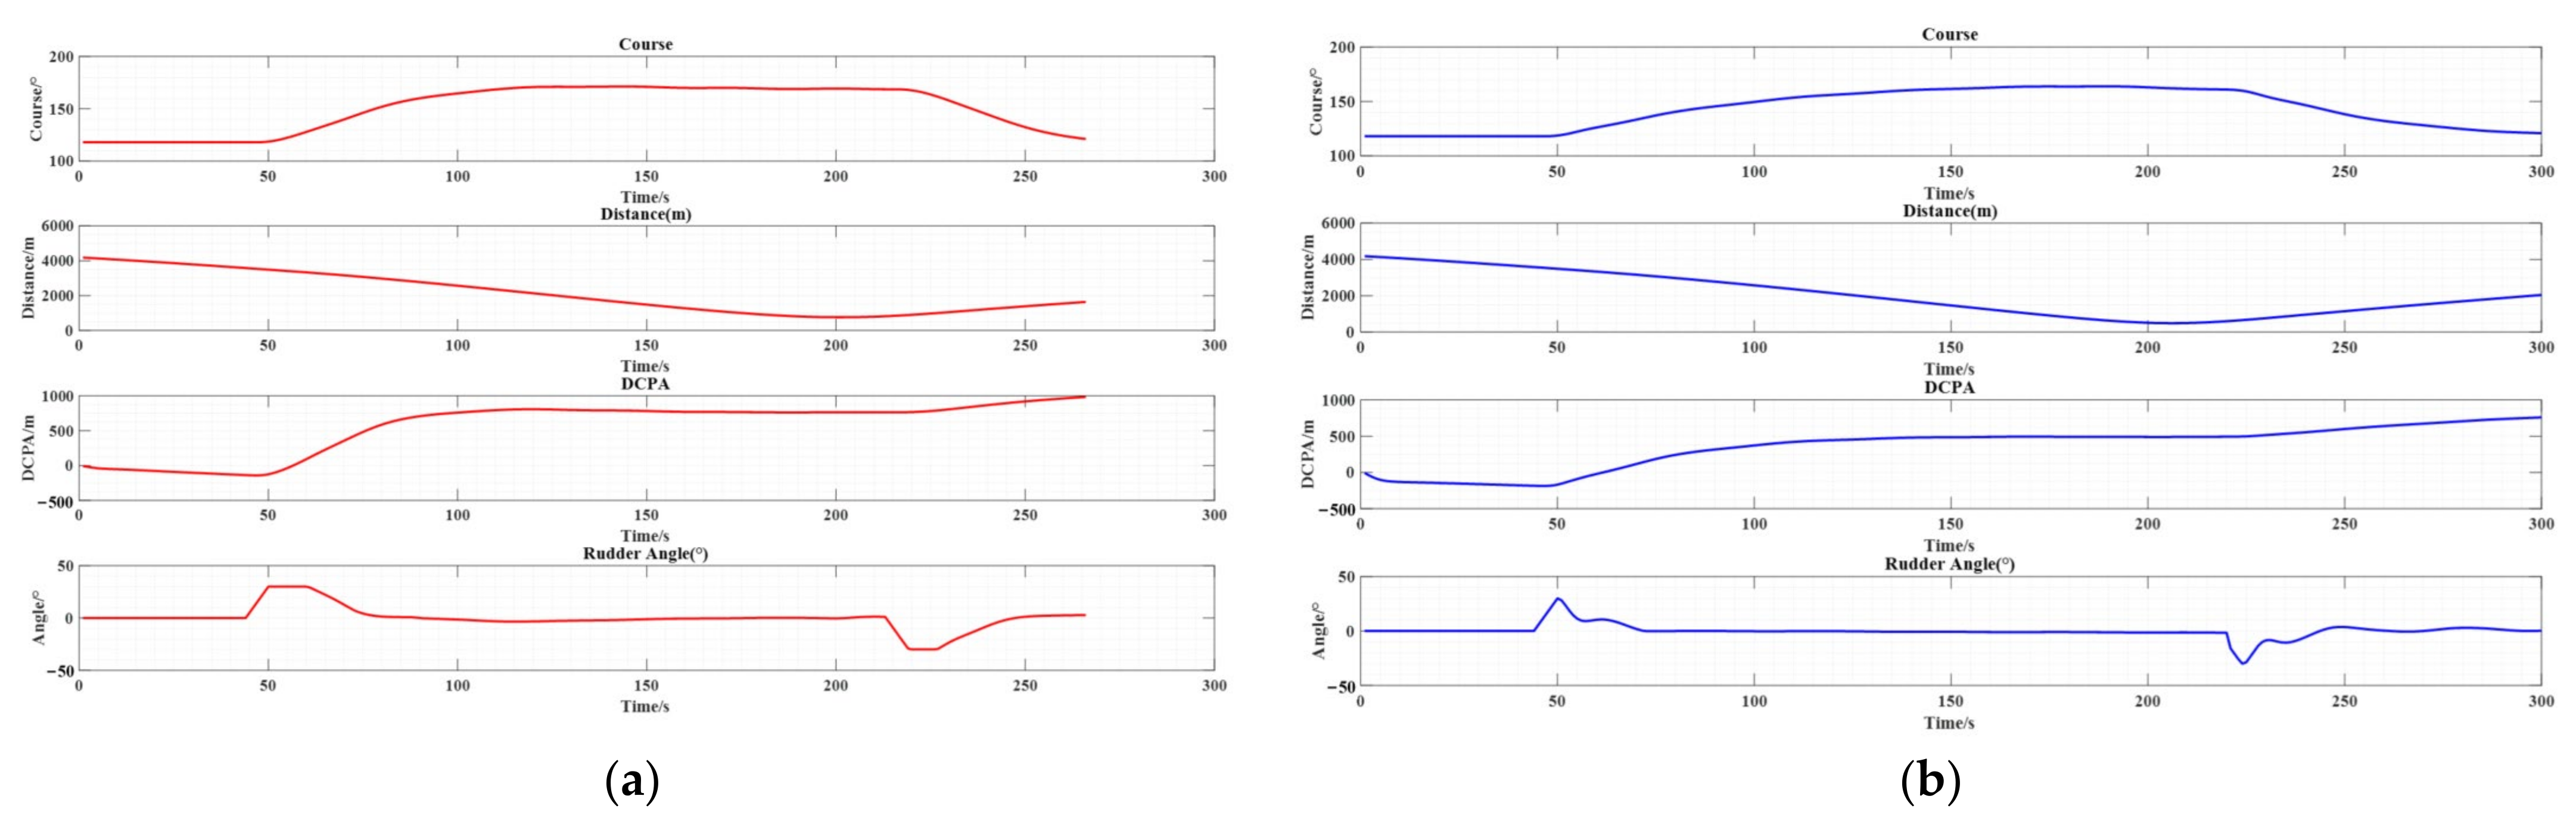
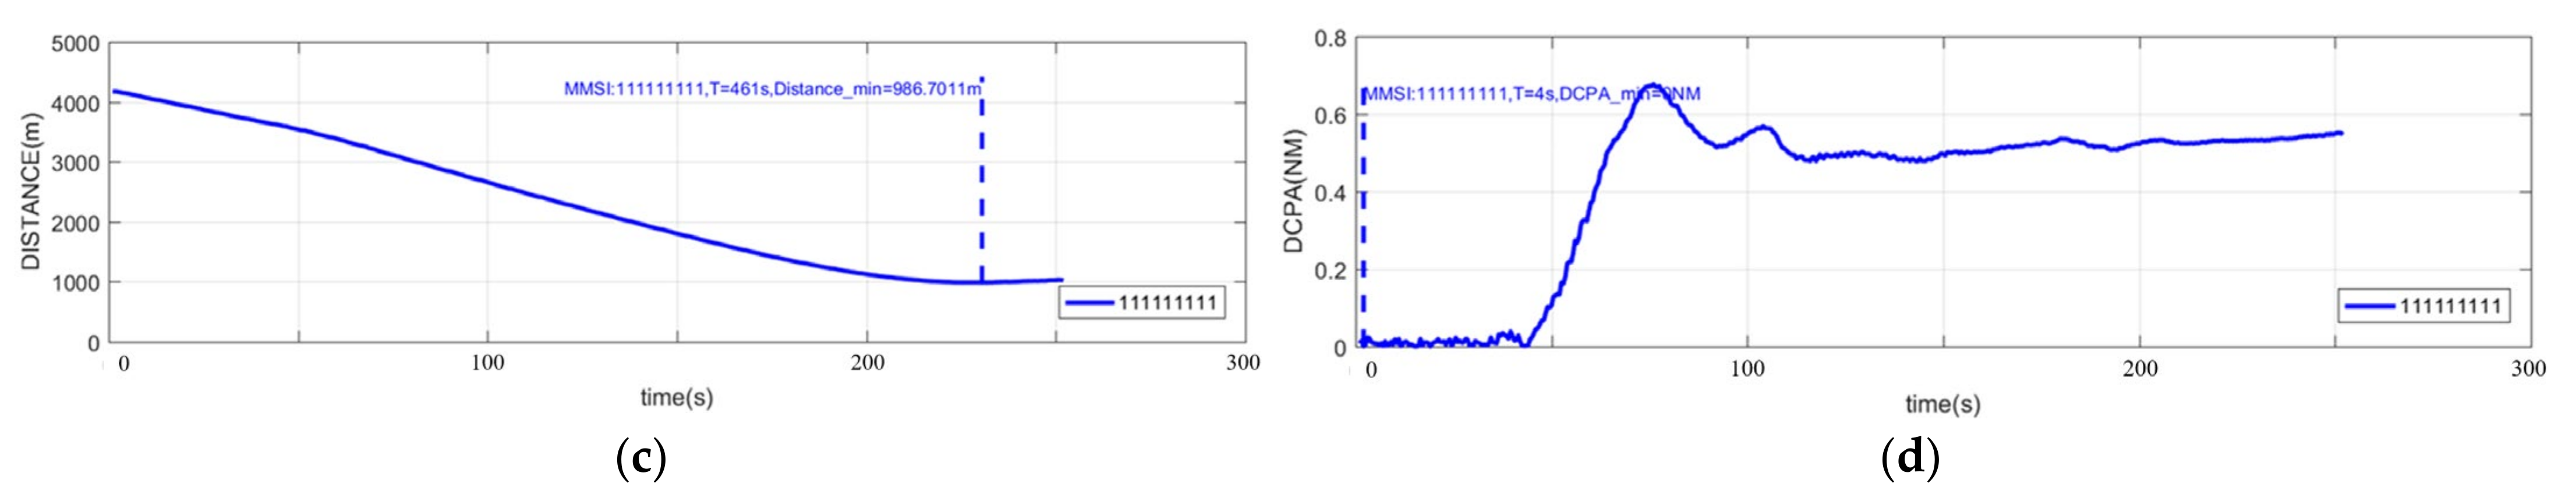
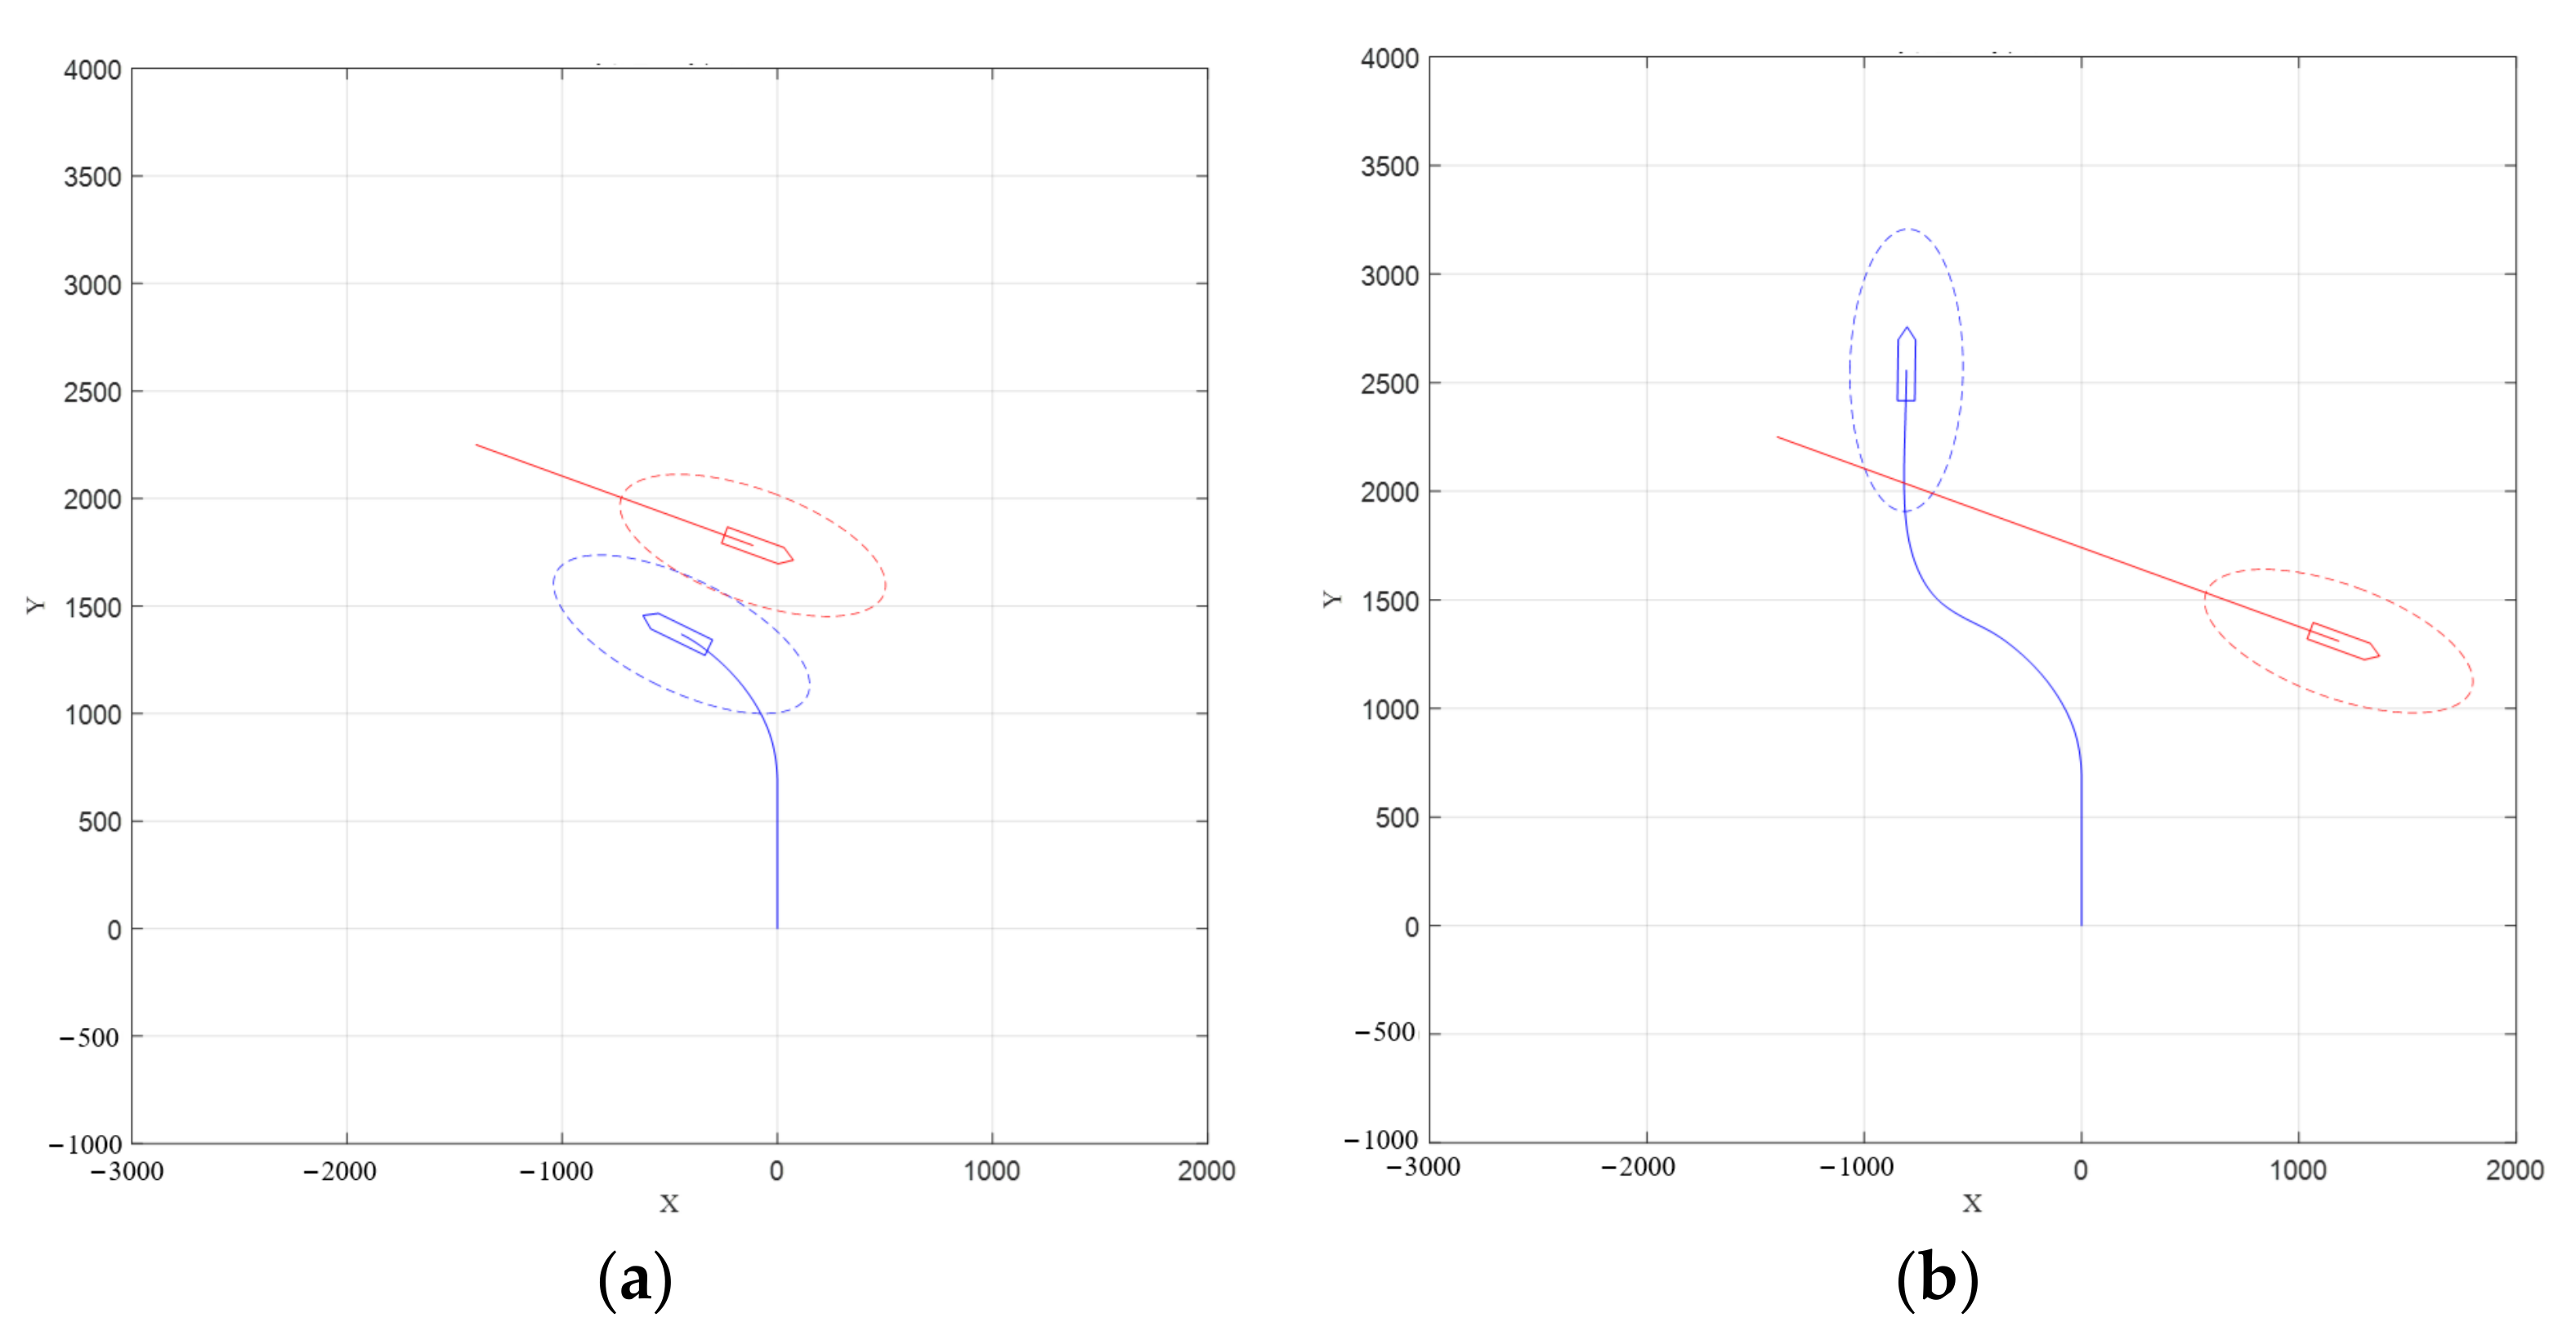
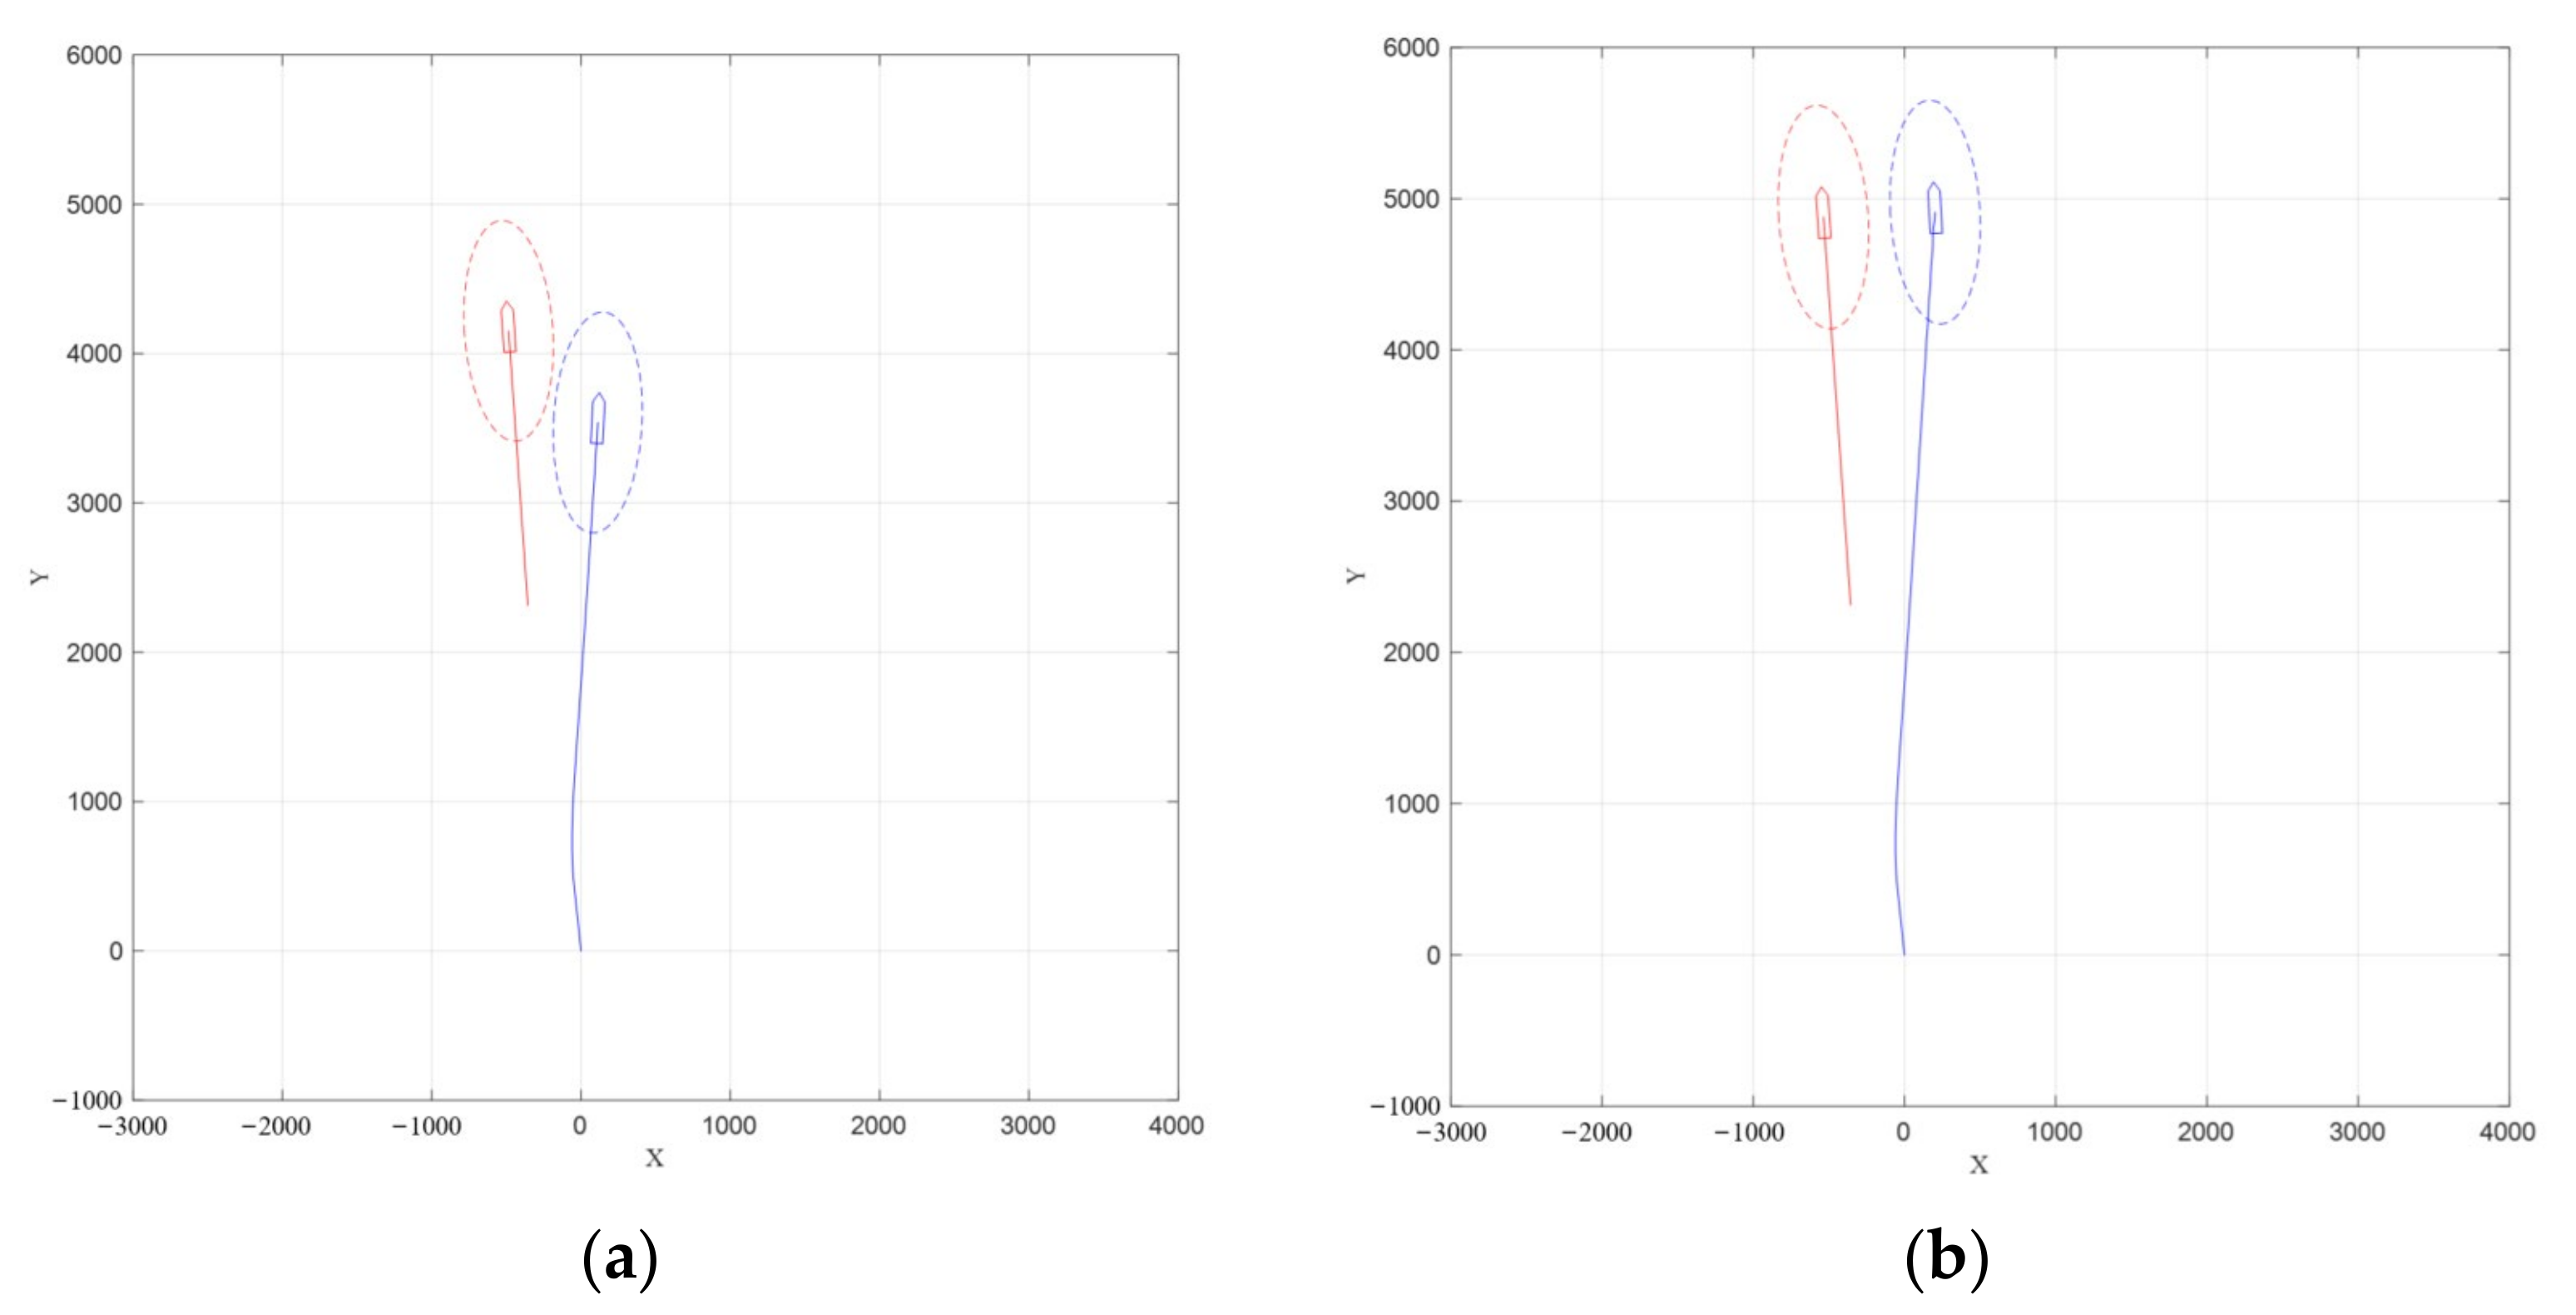
4. Experimental Results and Analysis

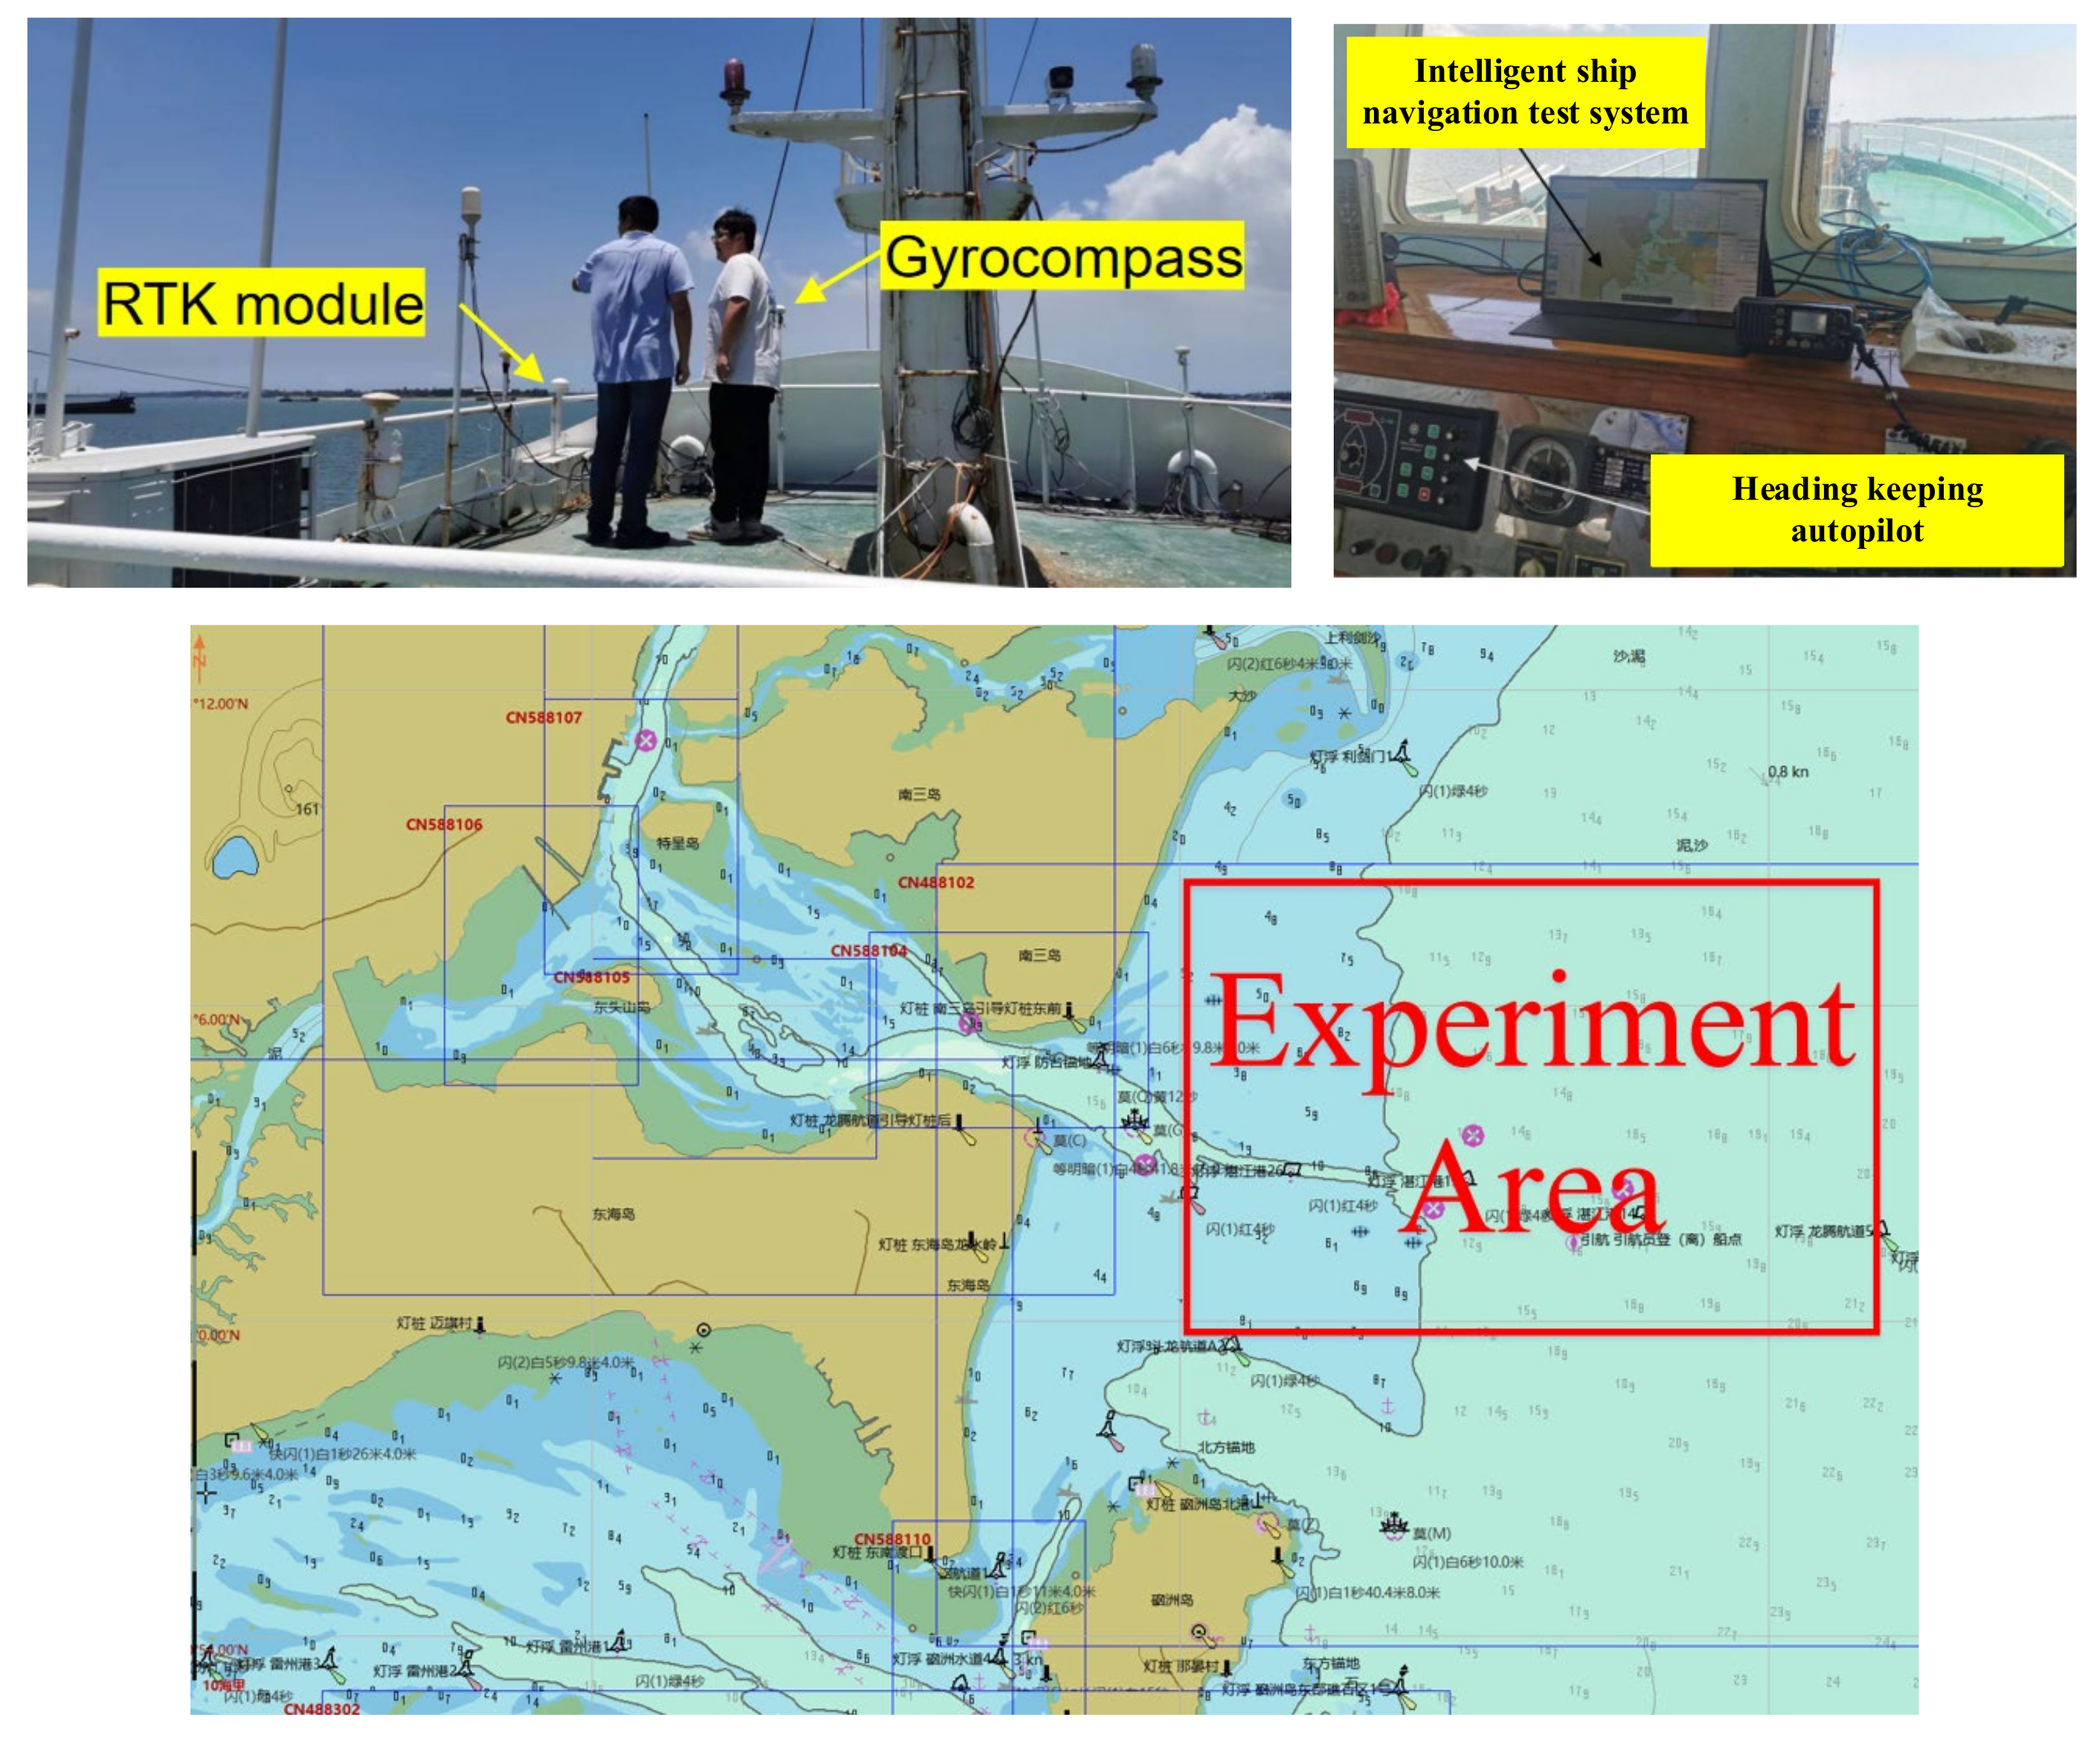
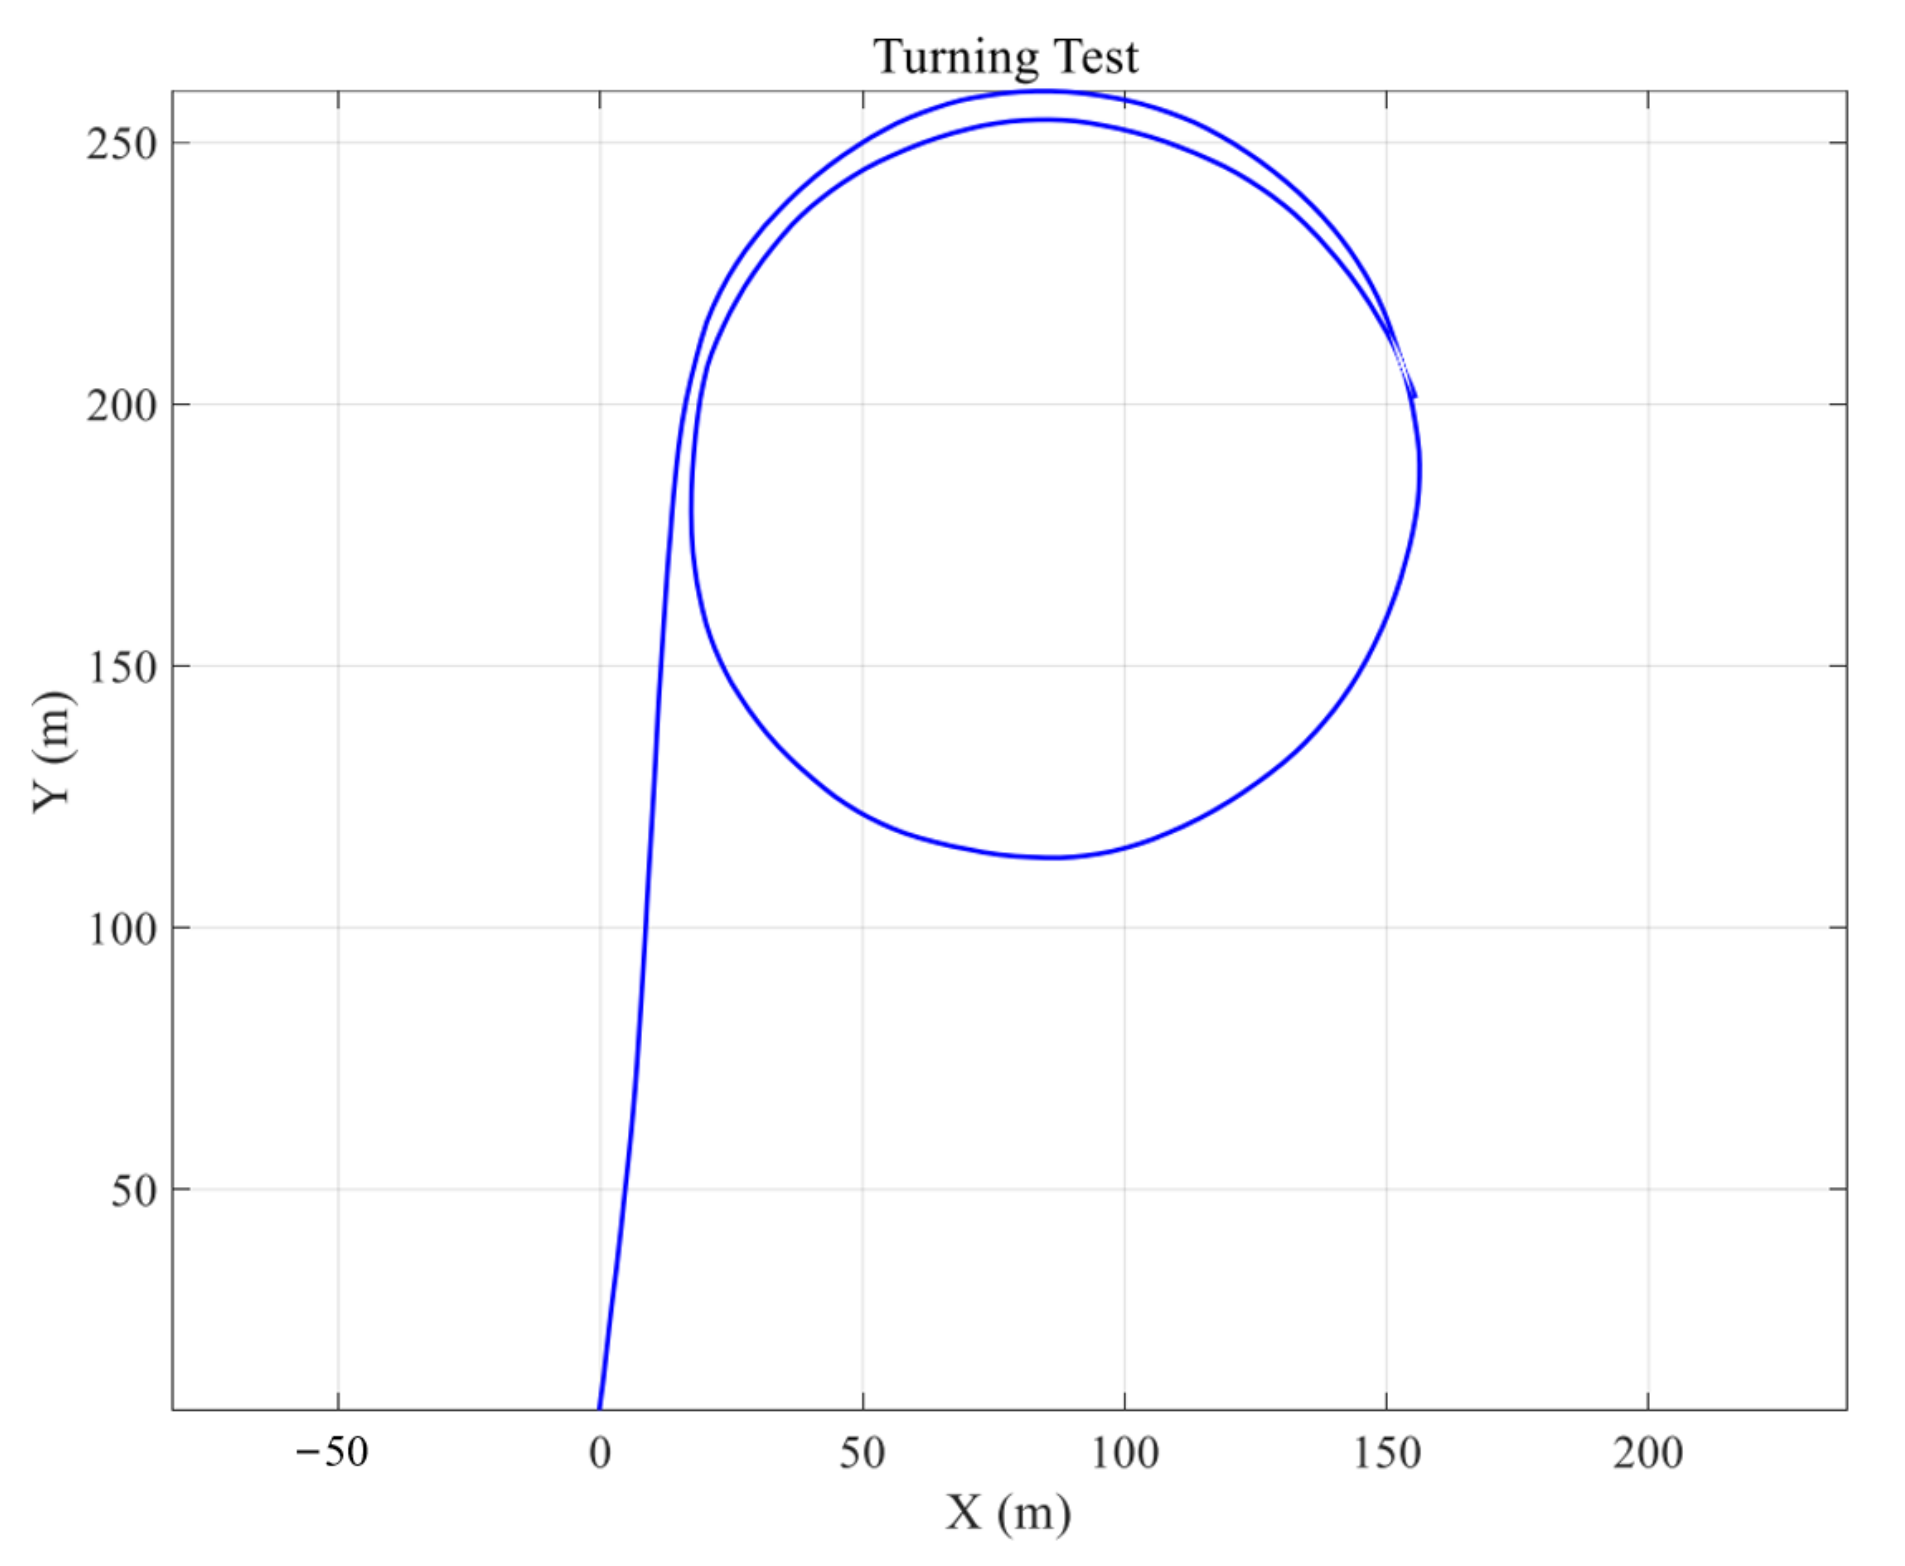
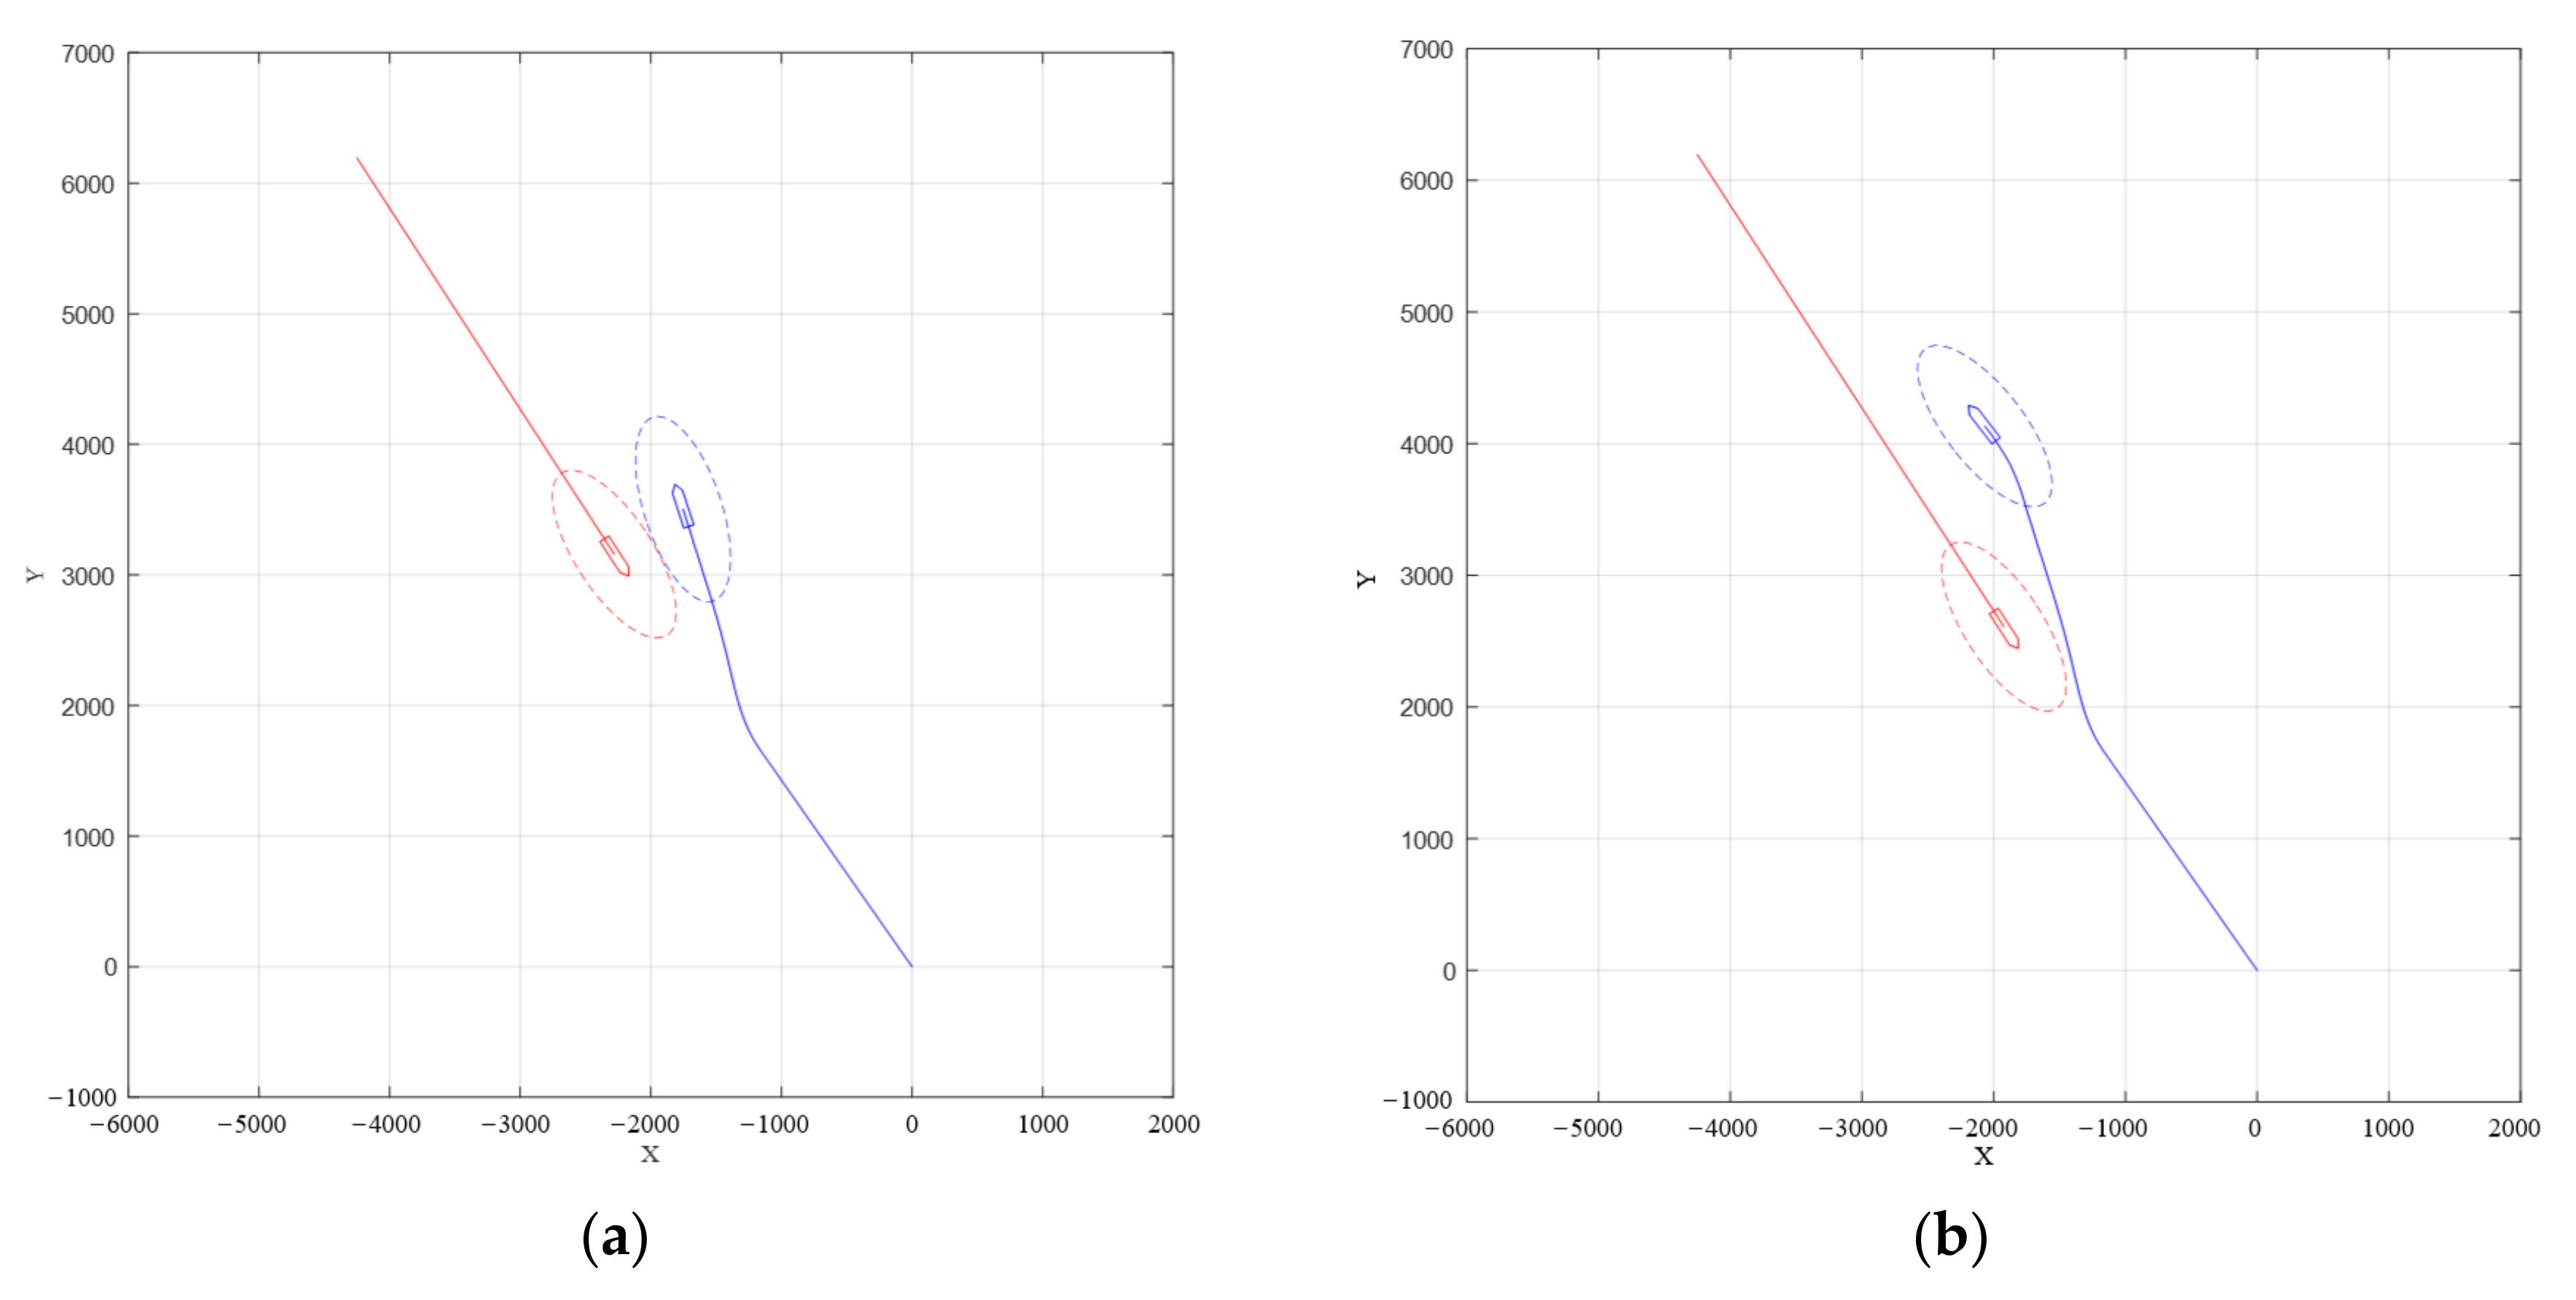
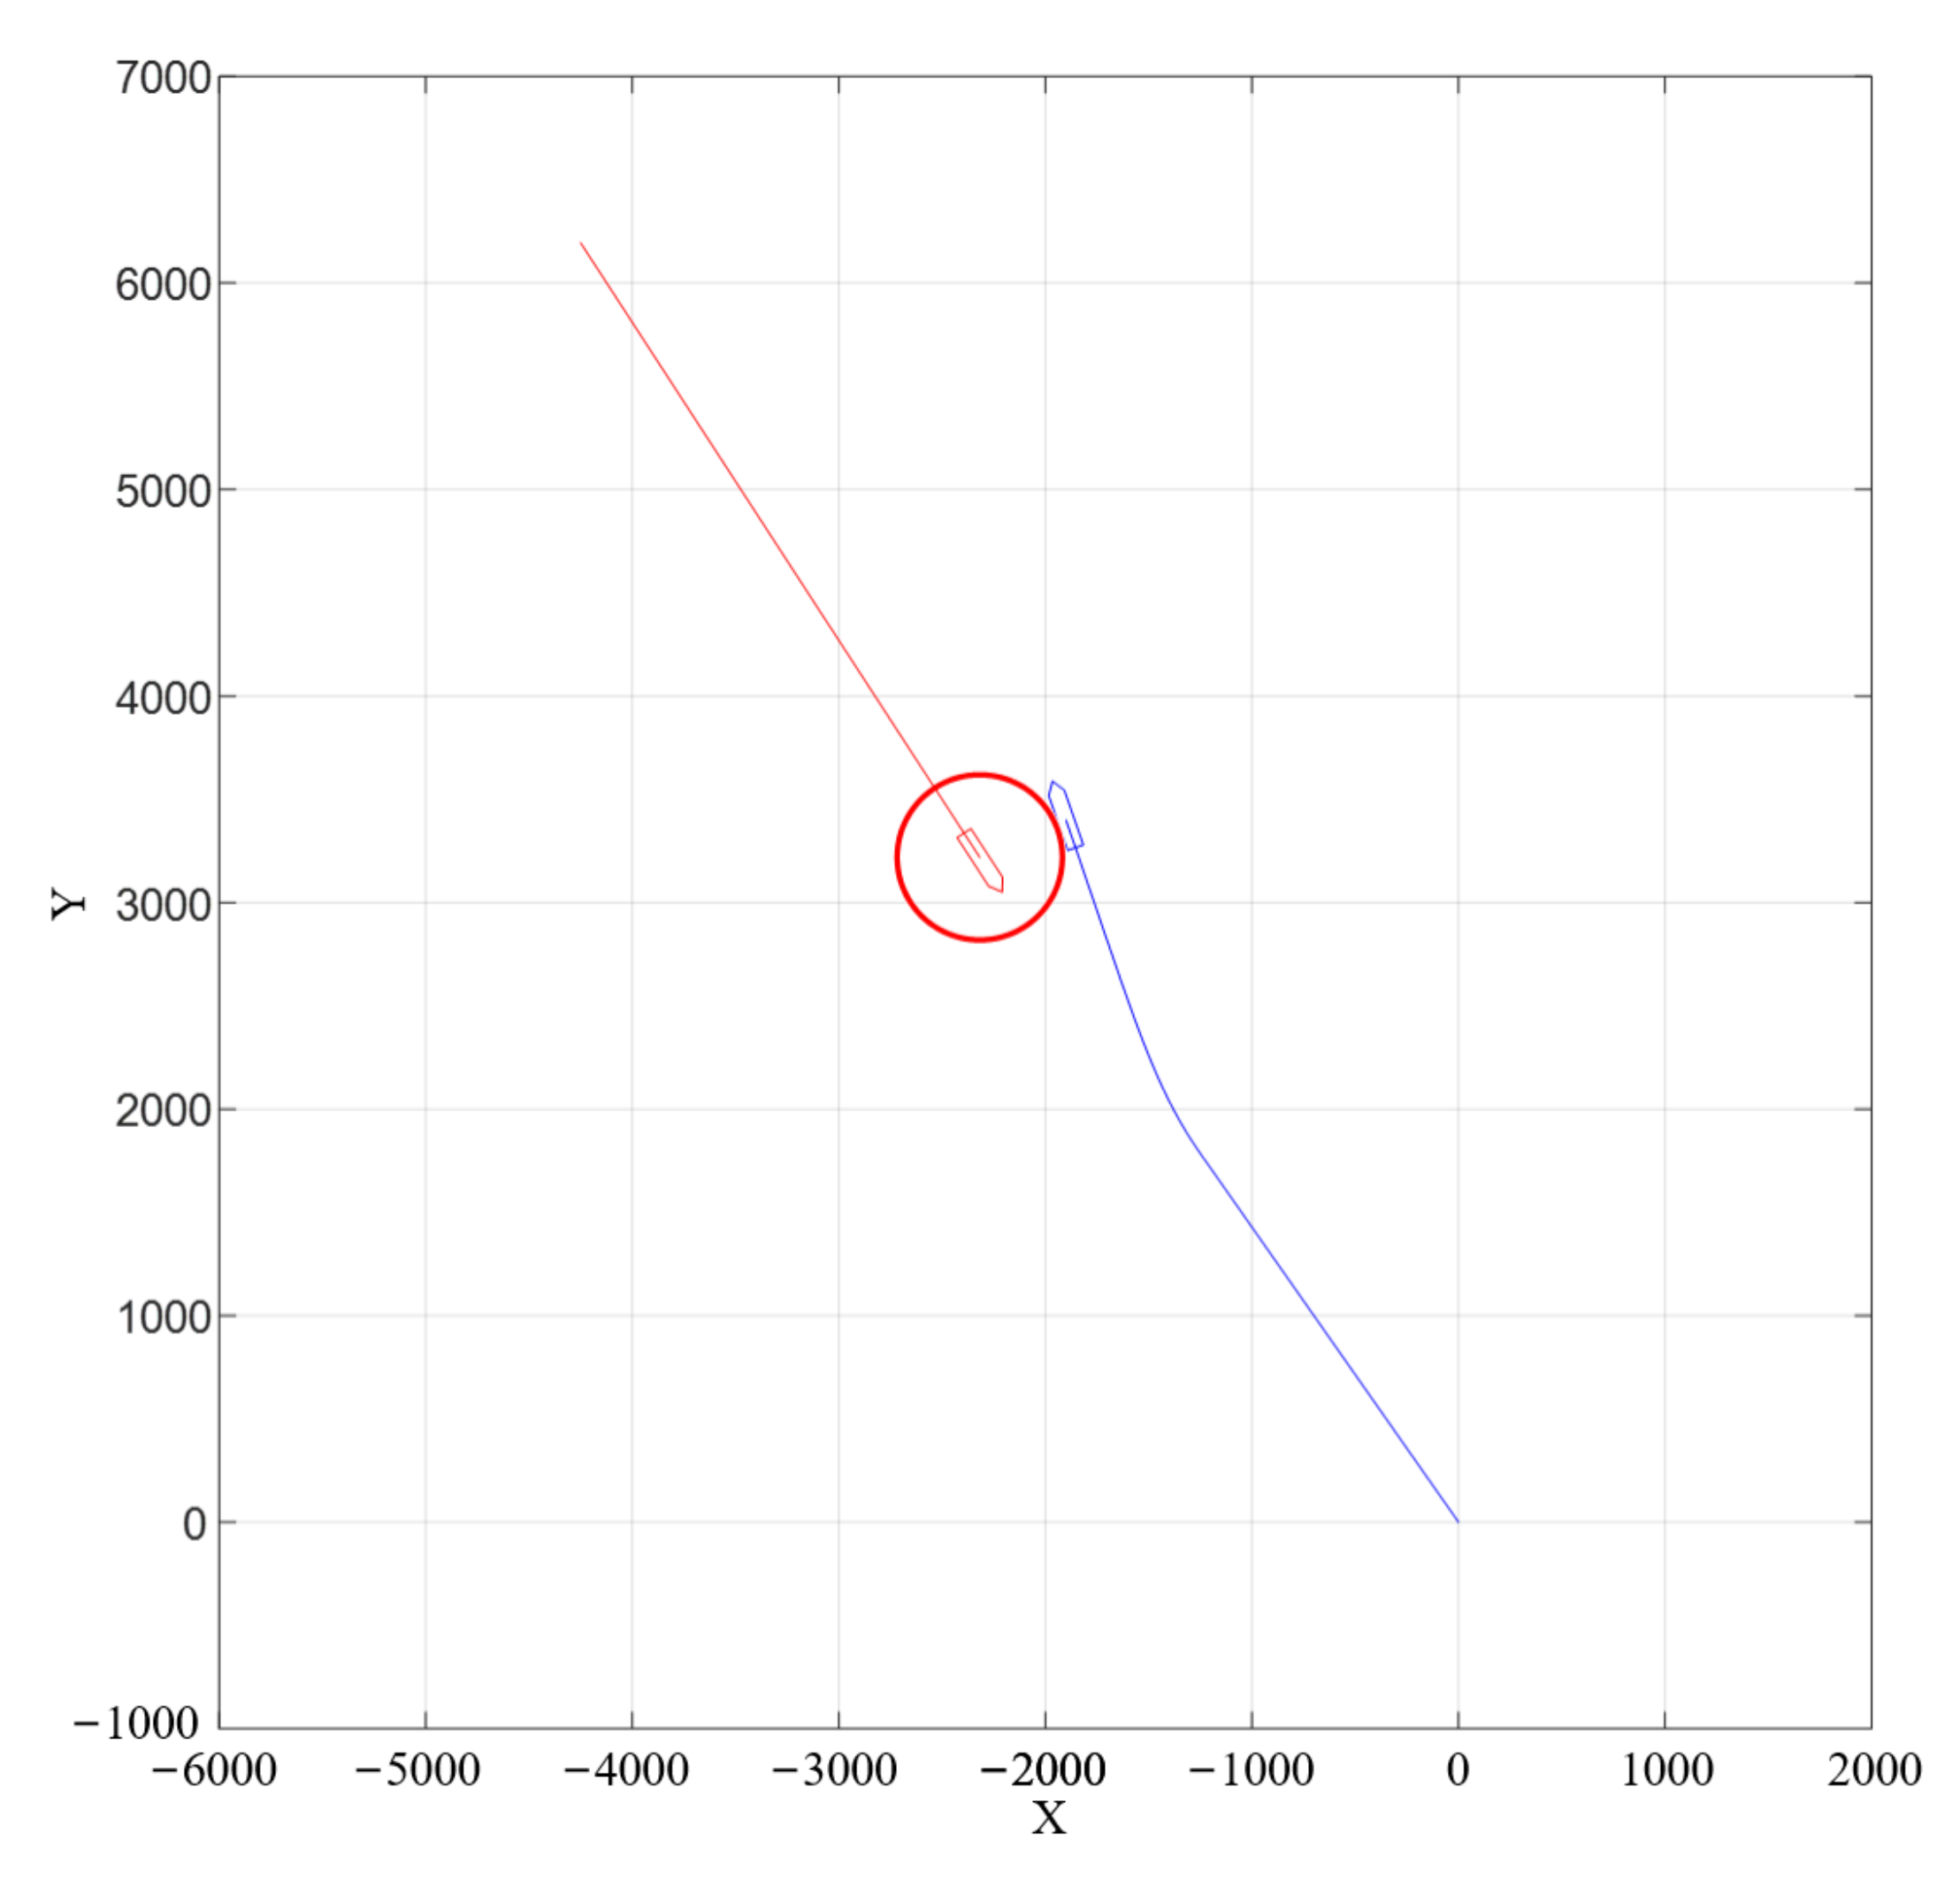
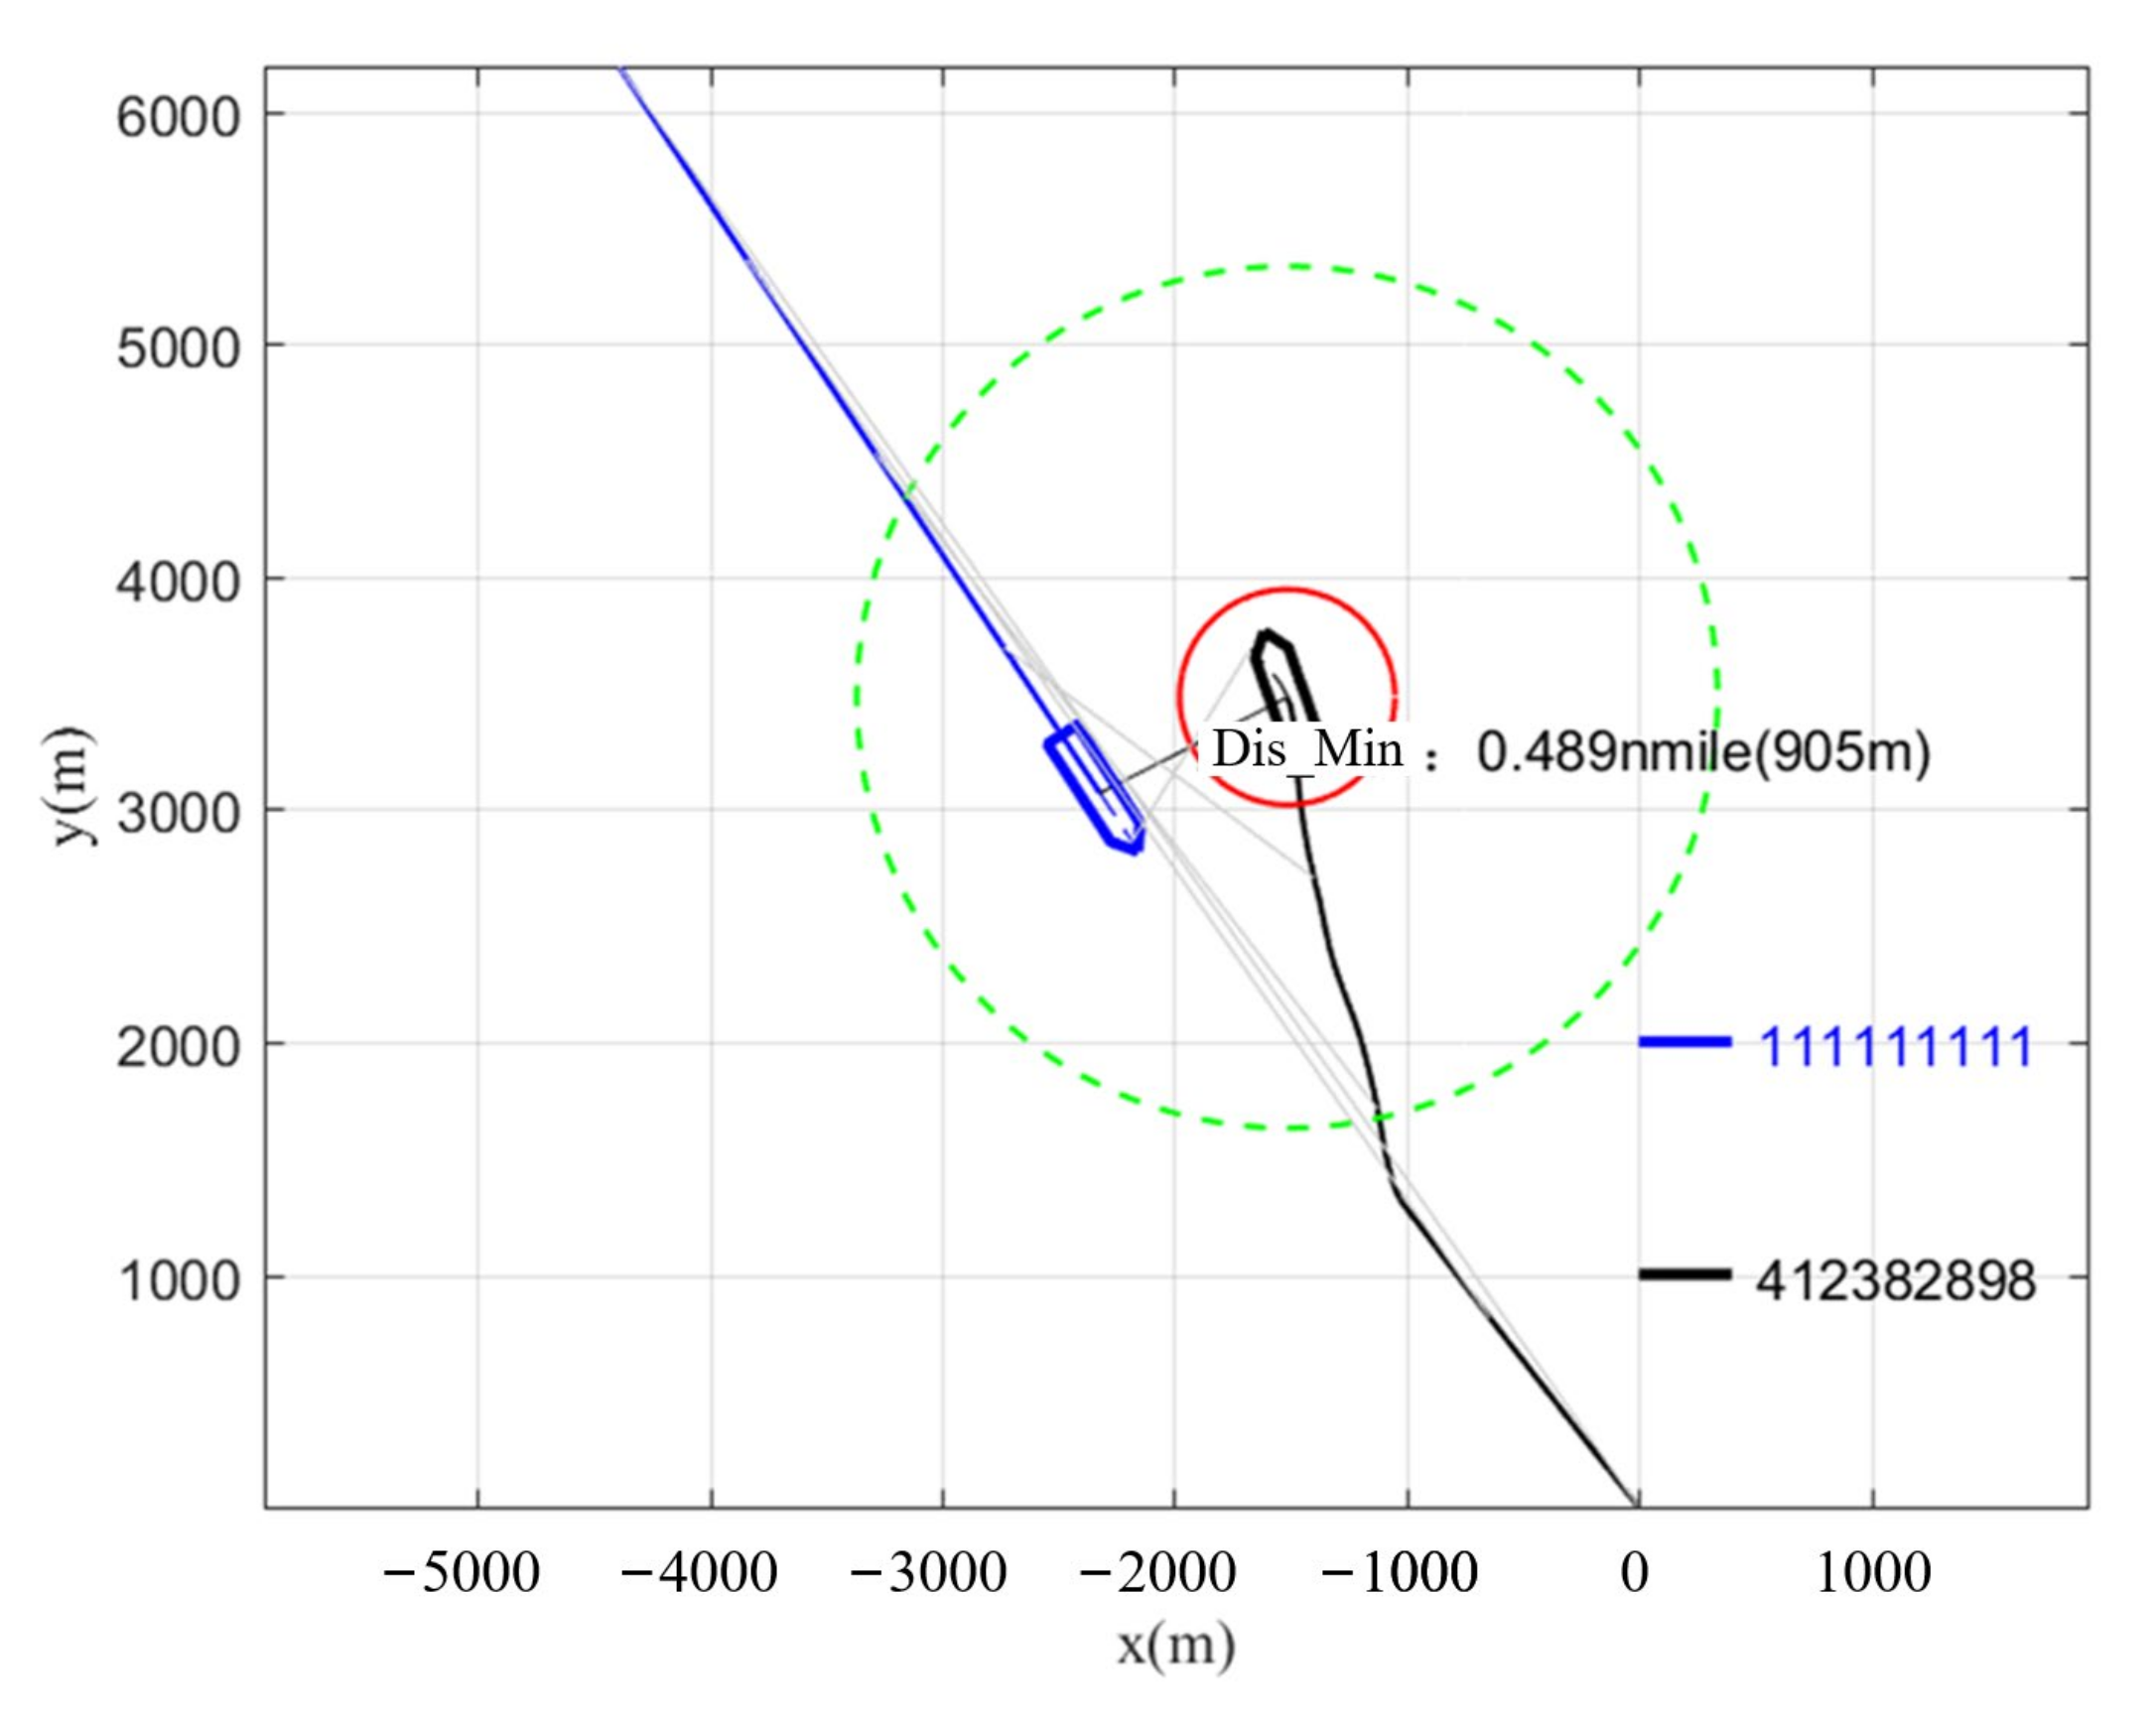
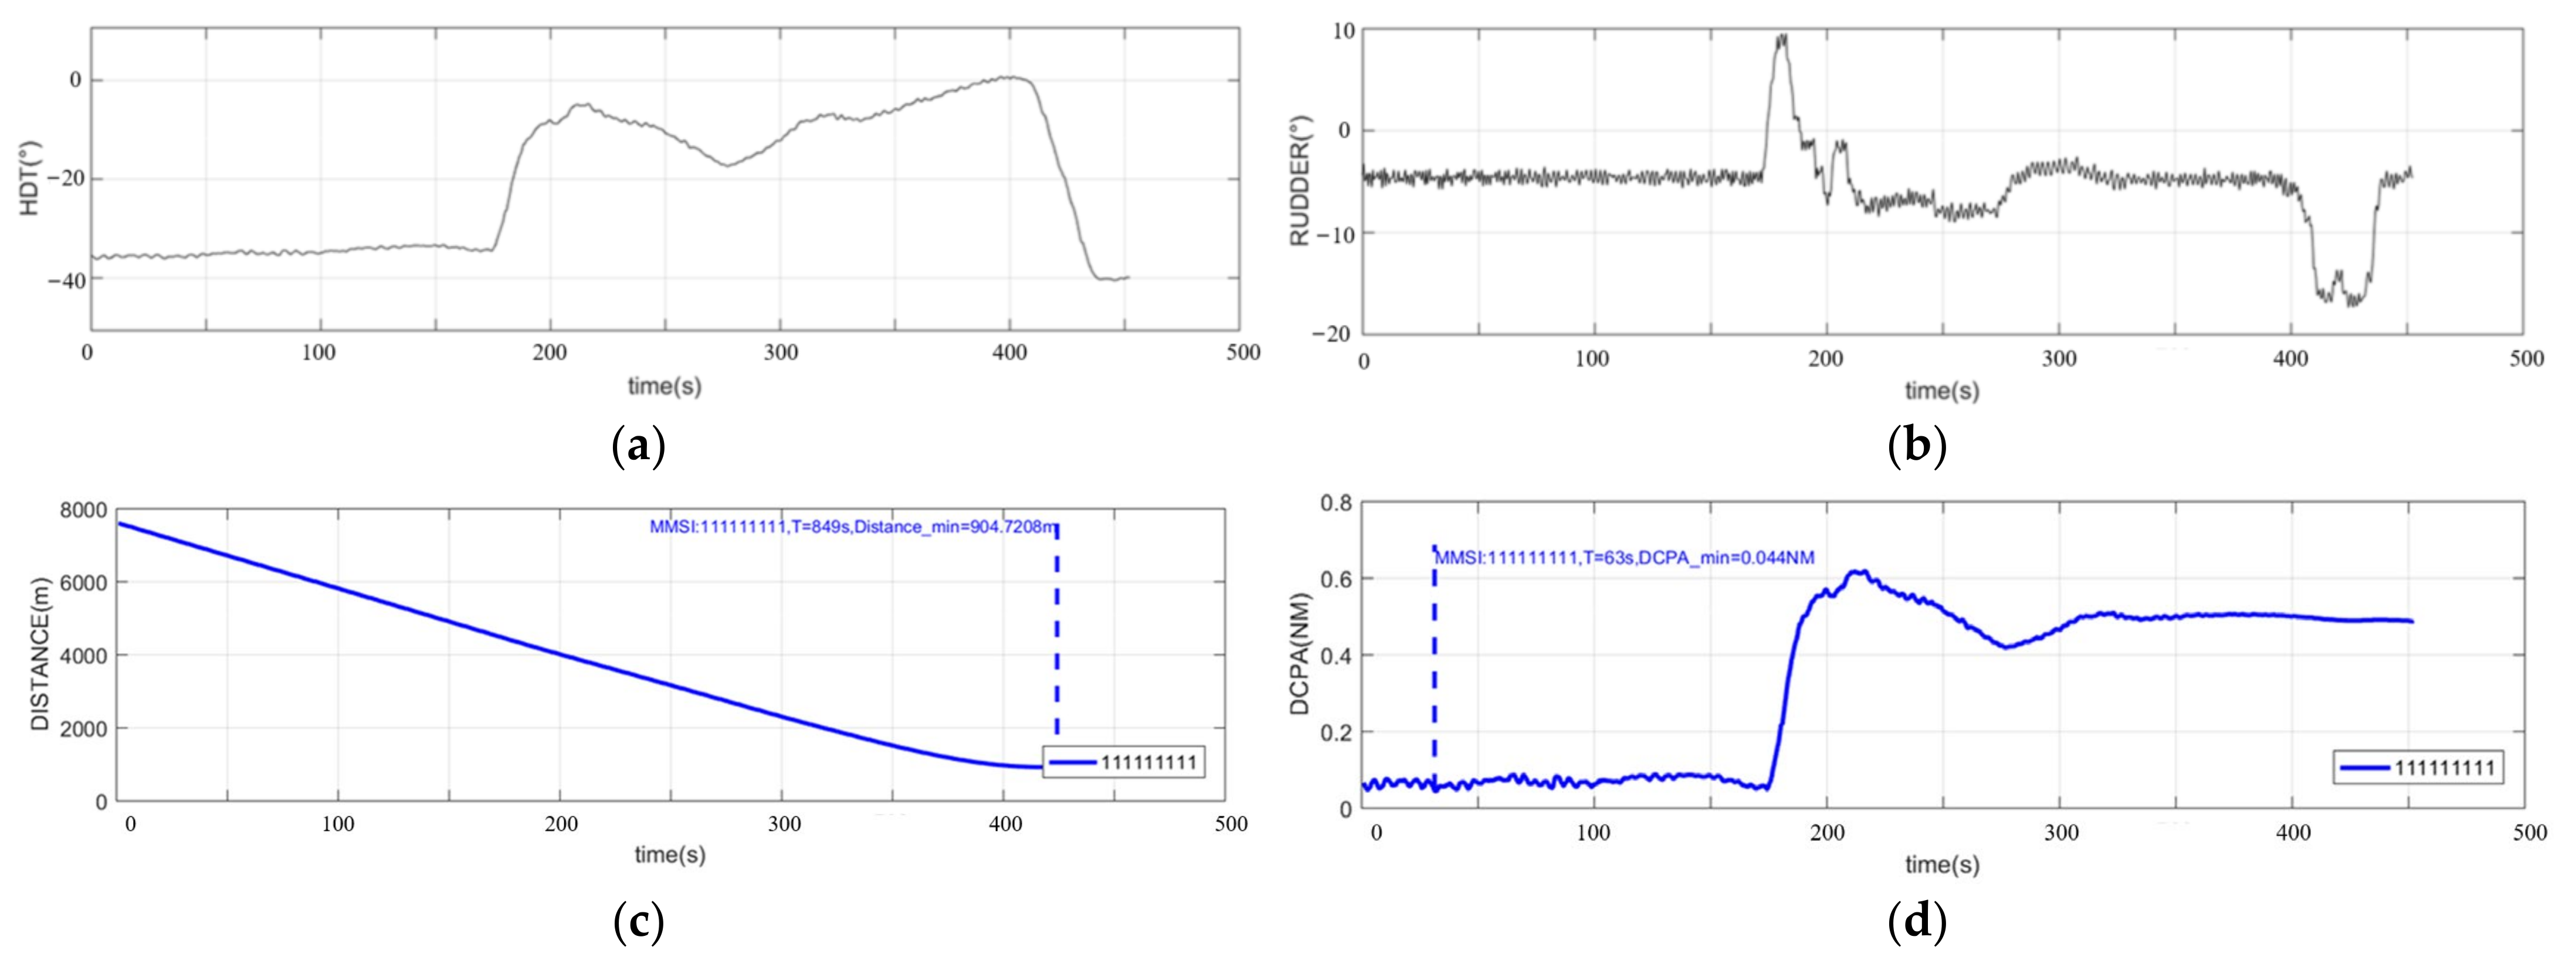
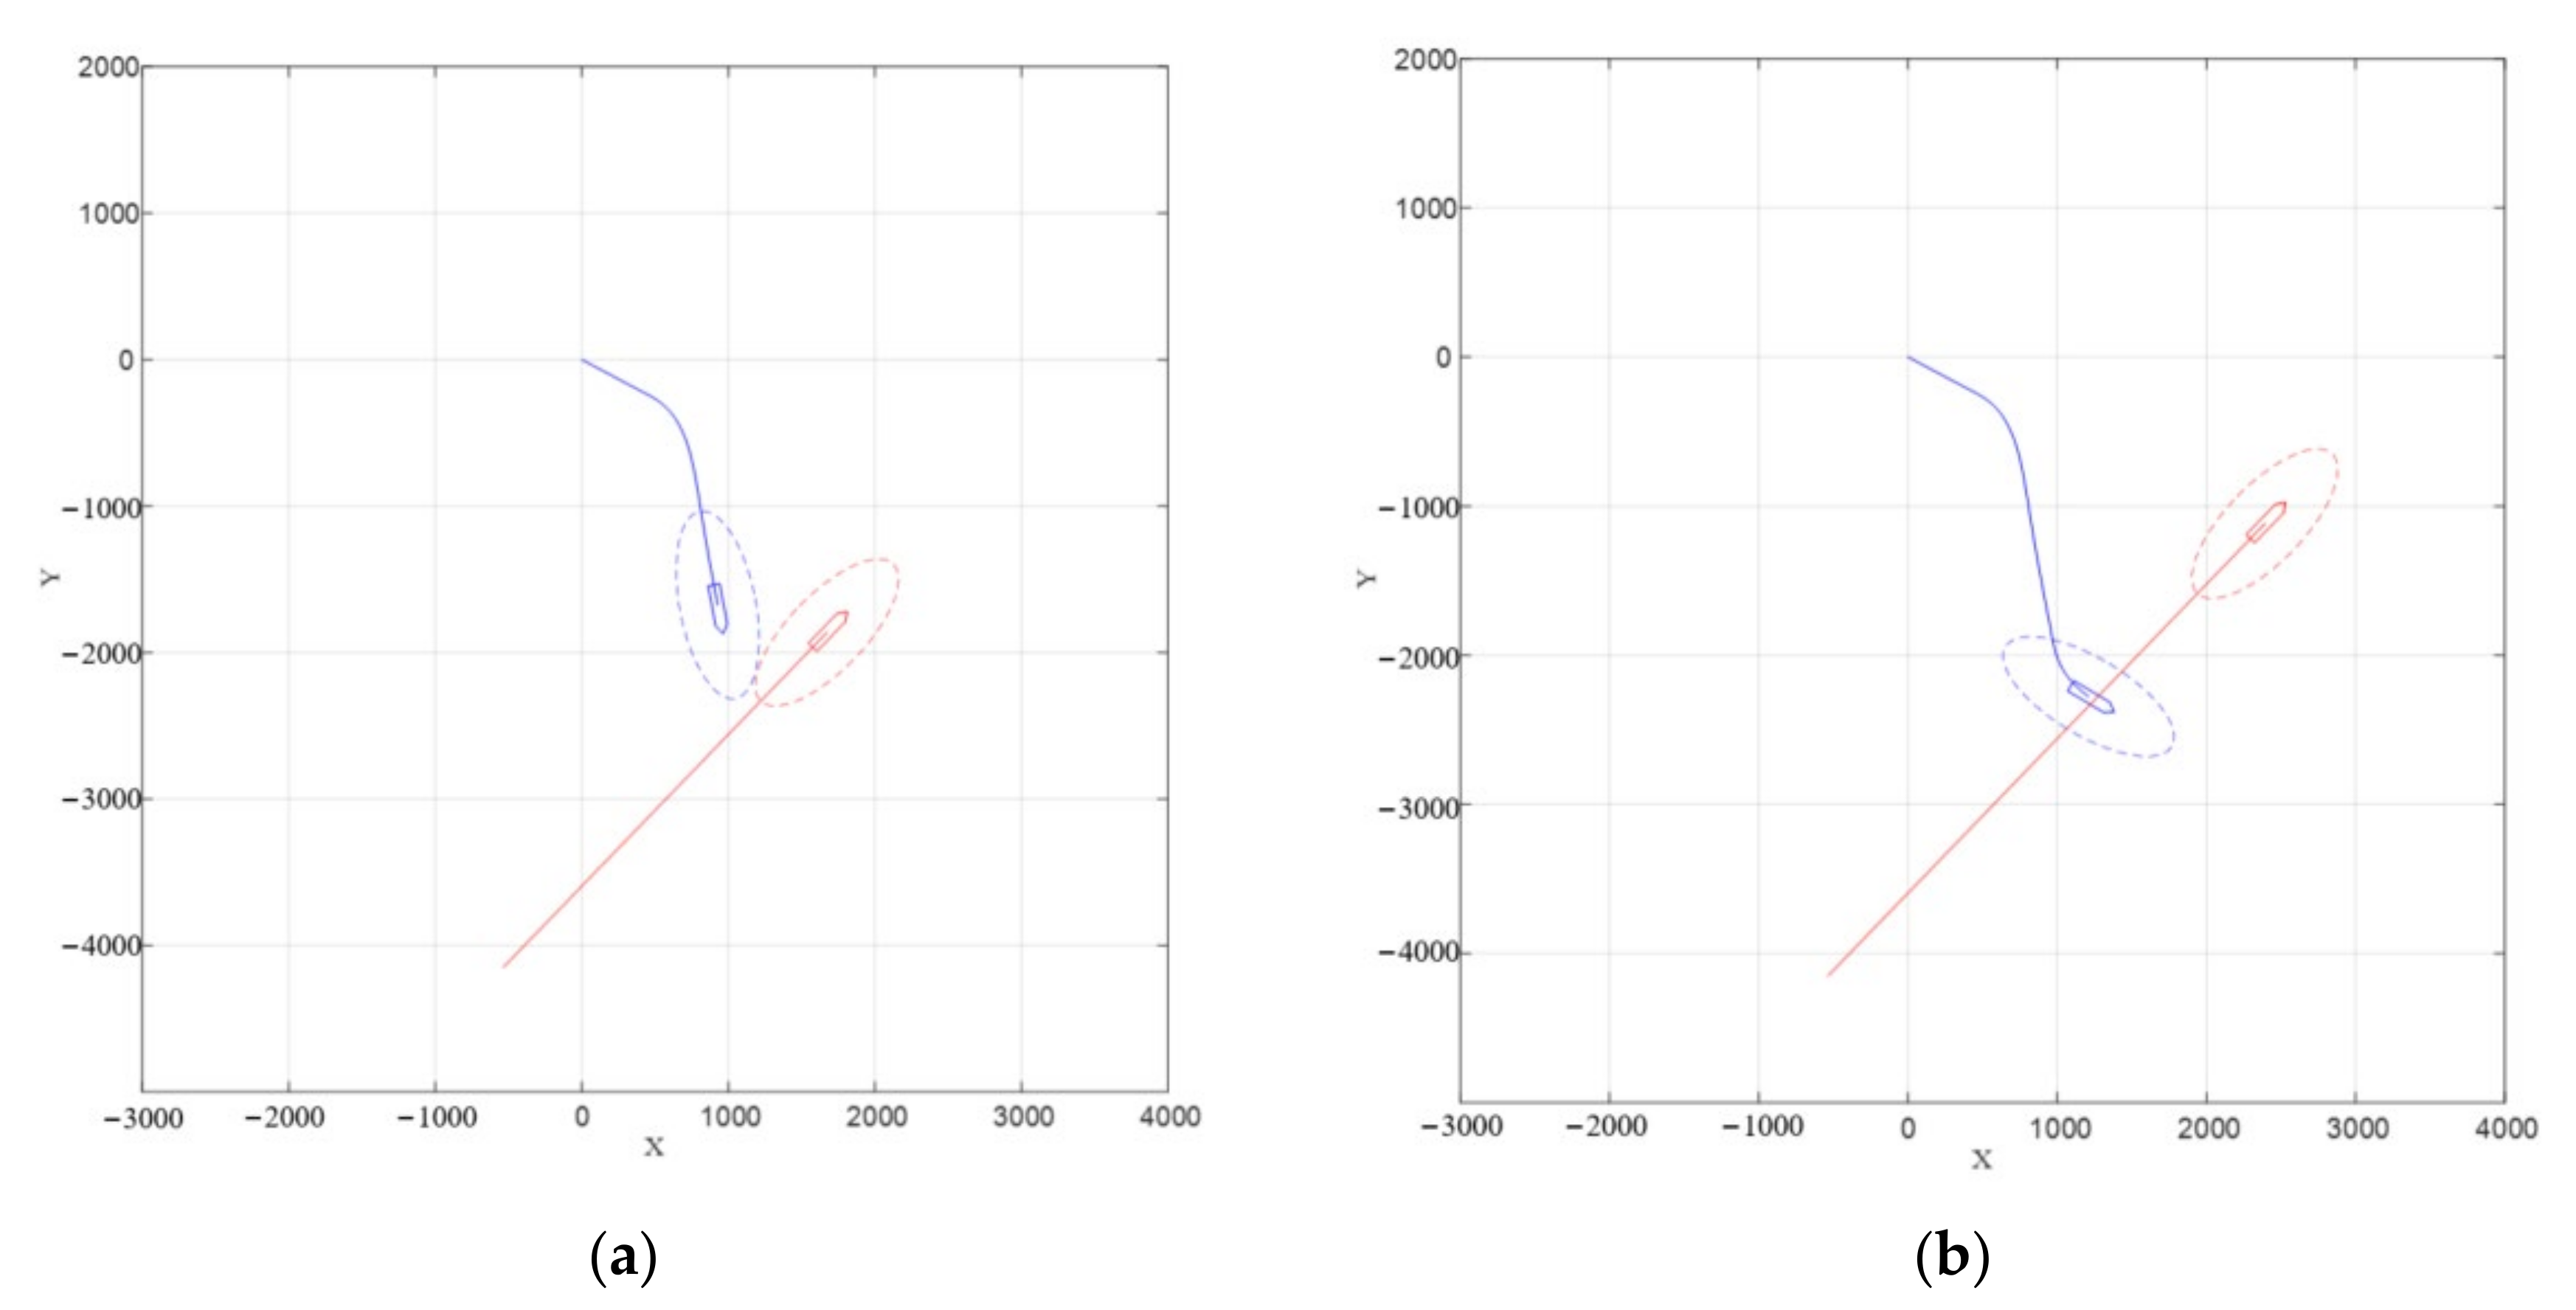
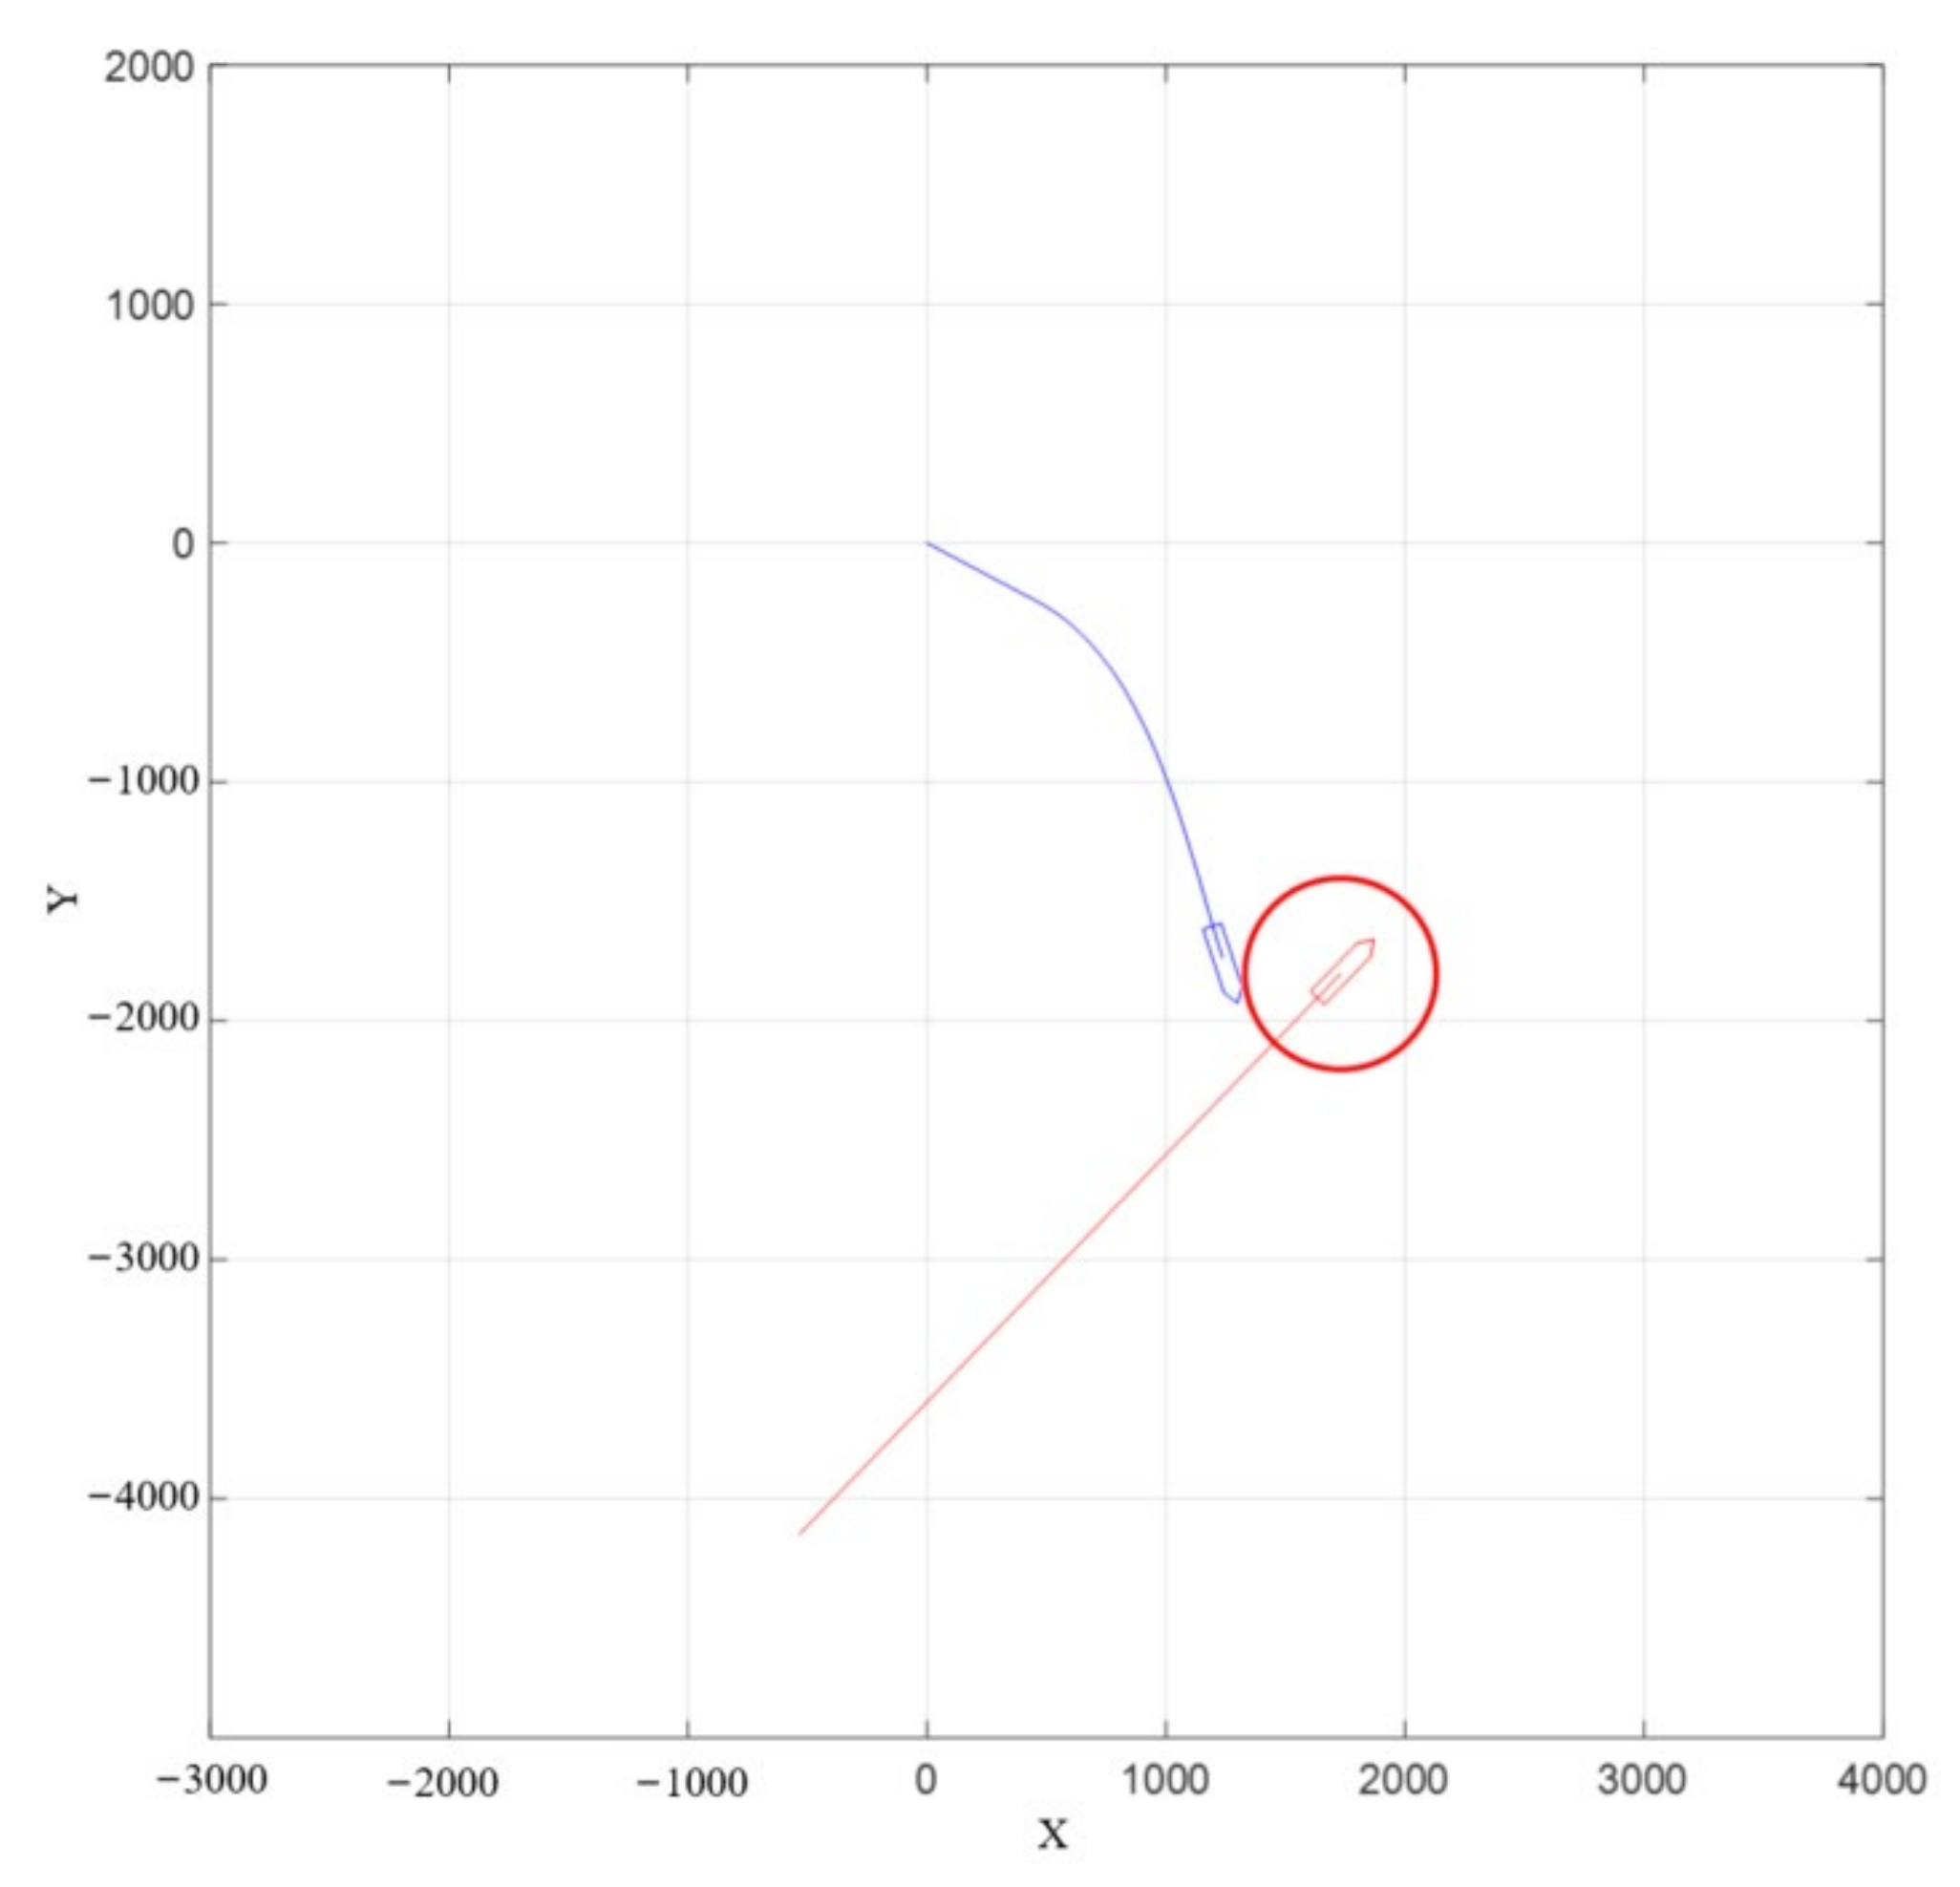
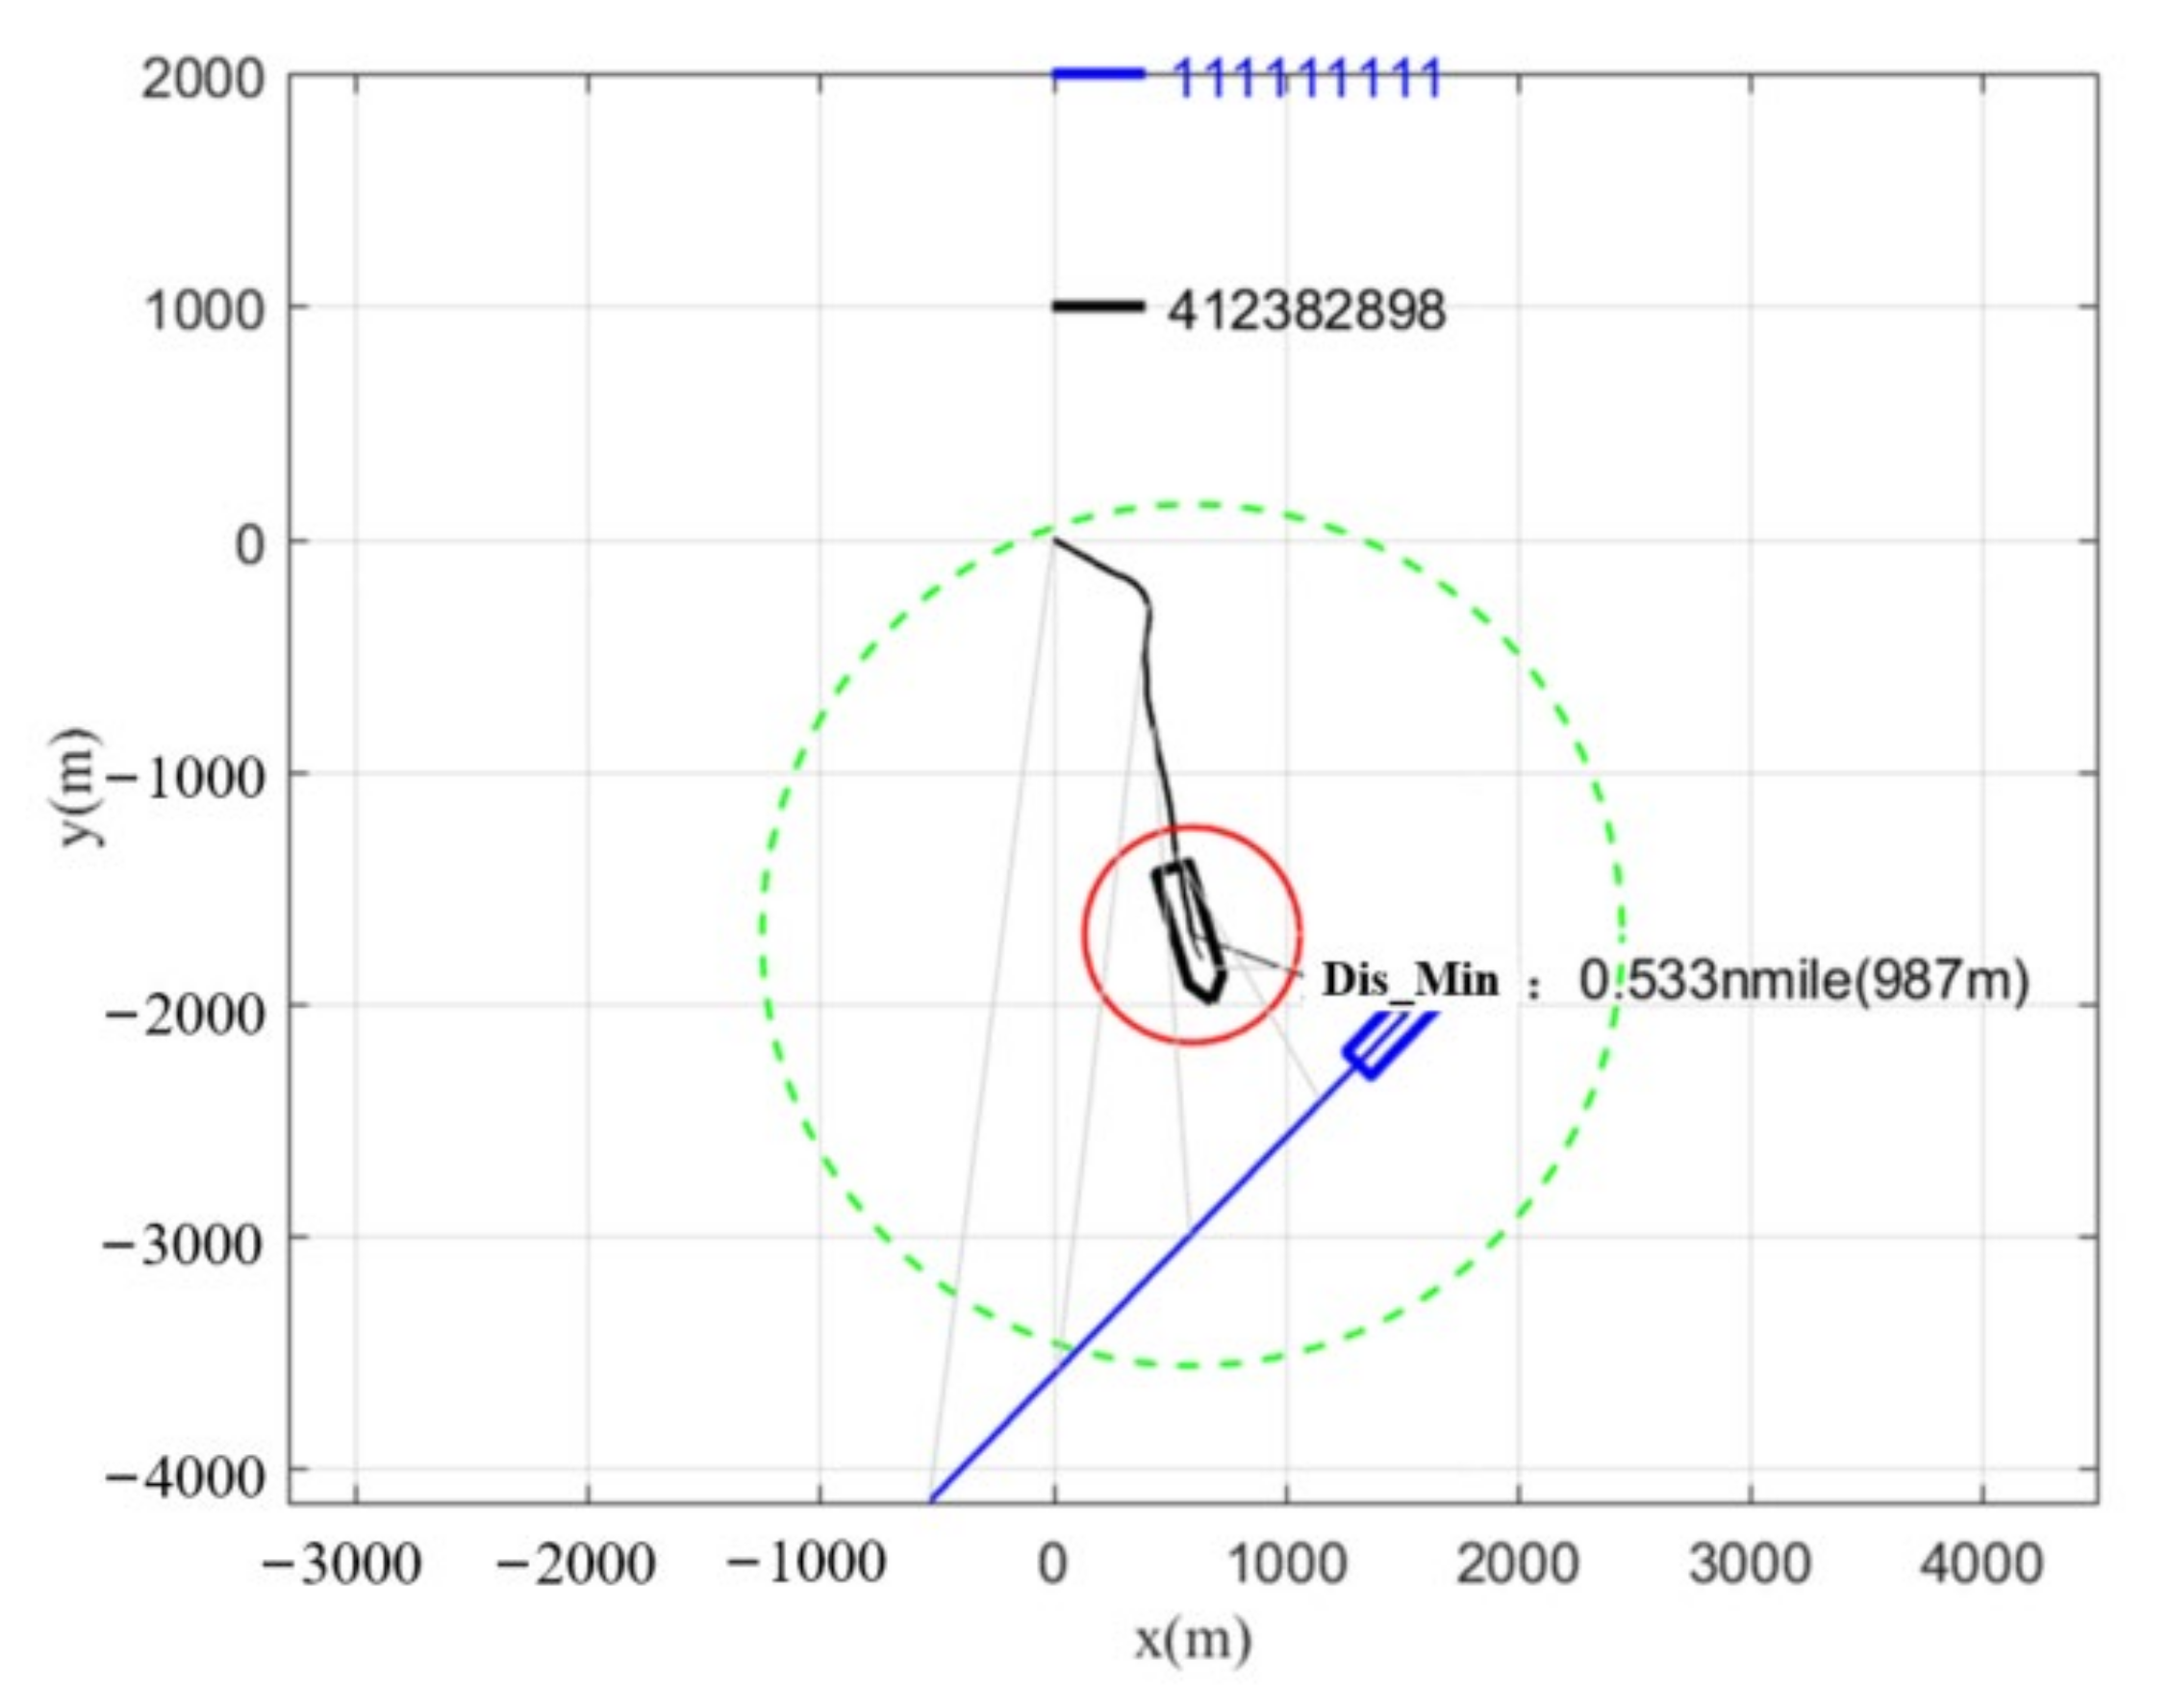
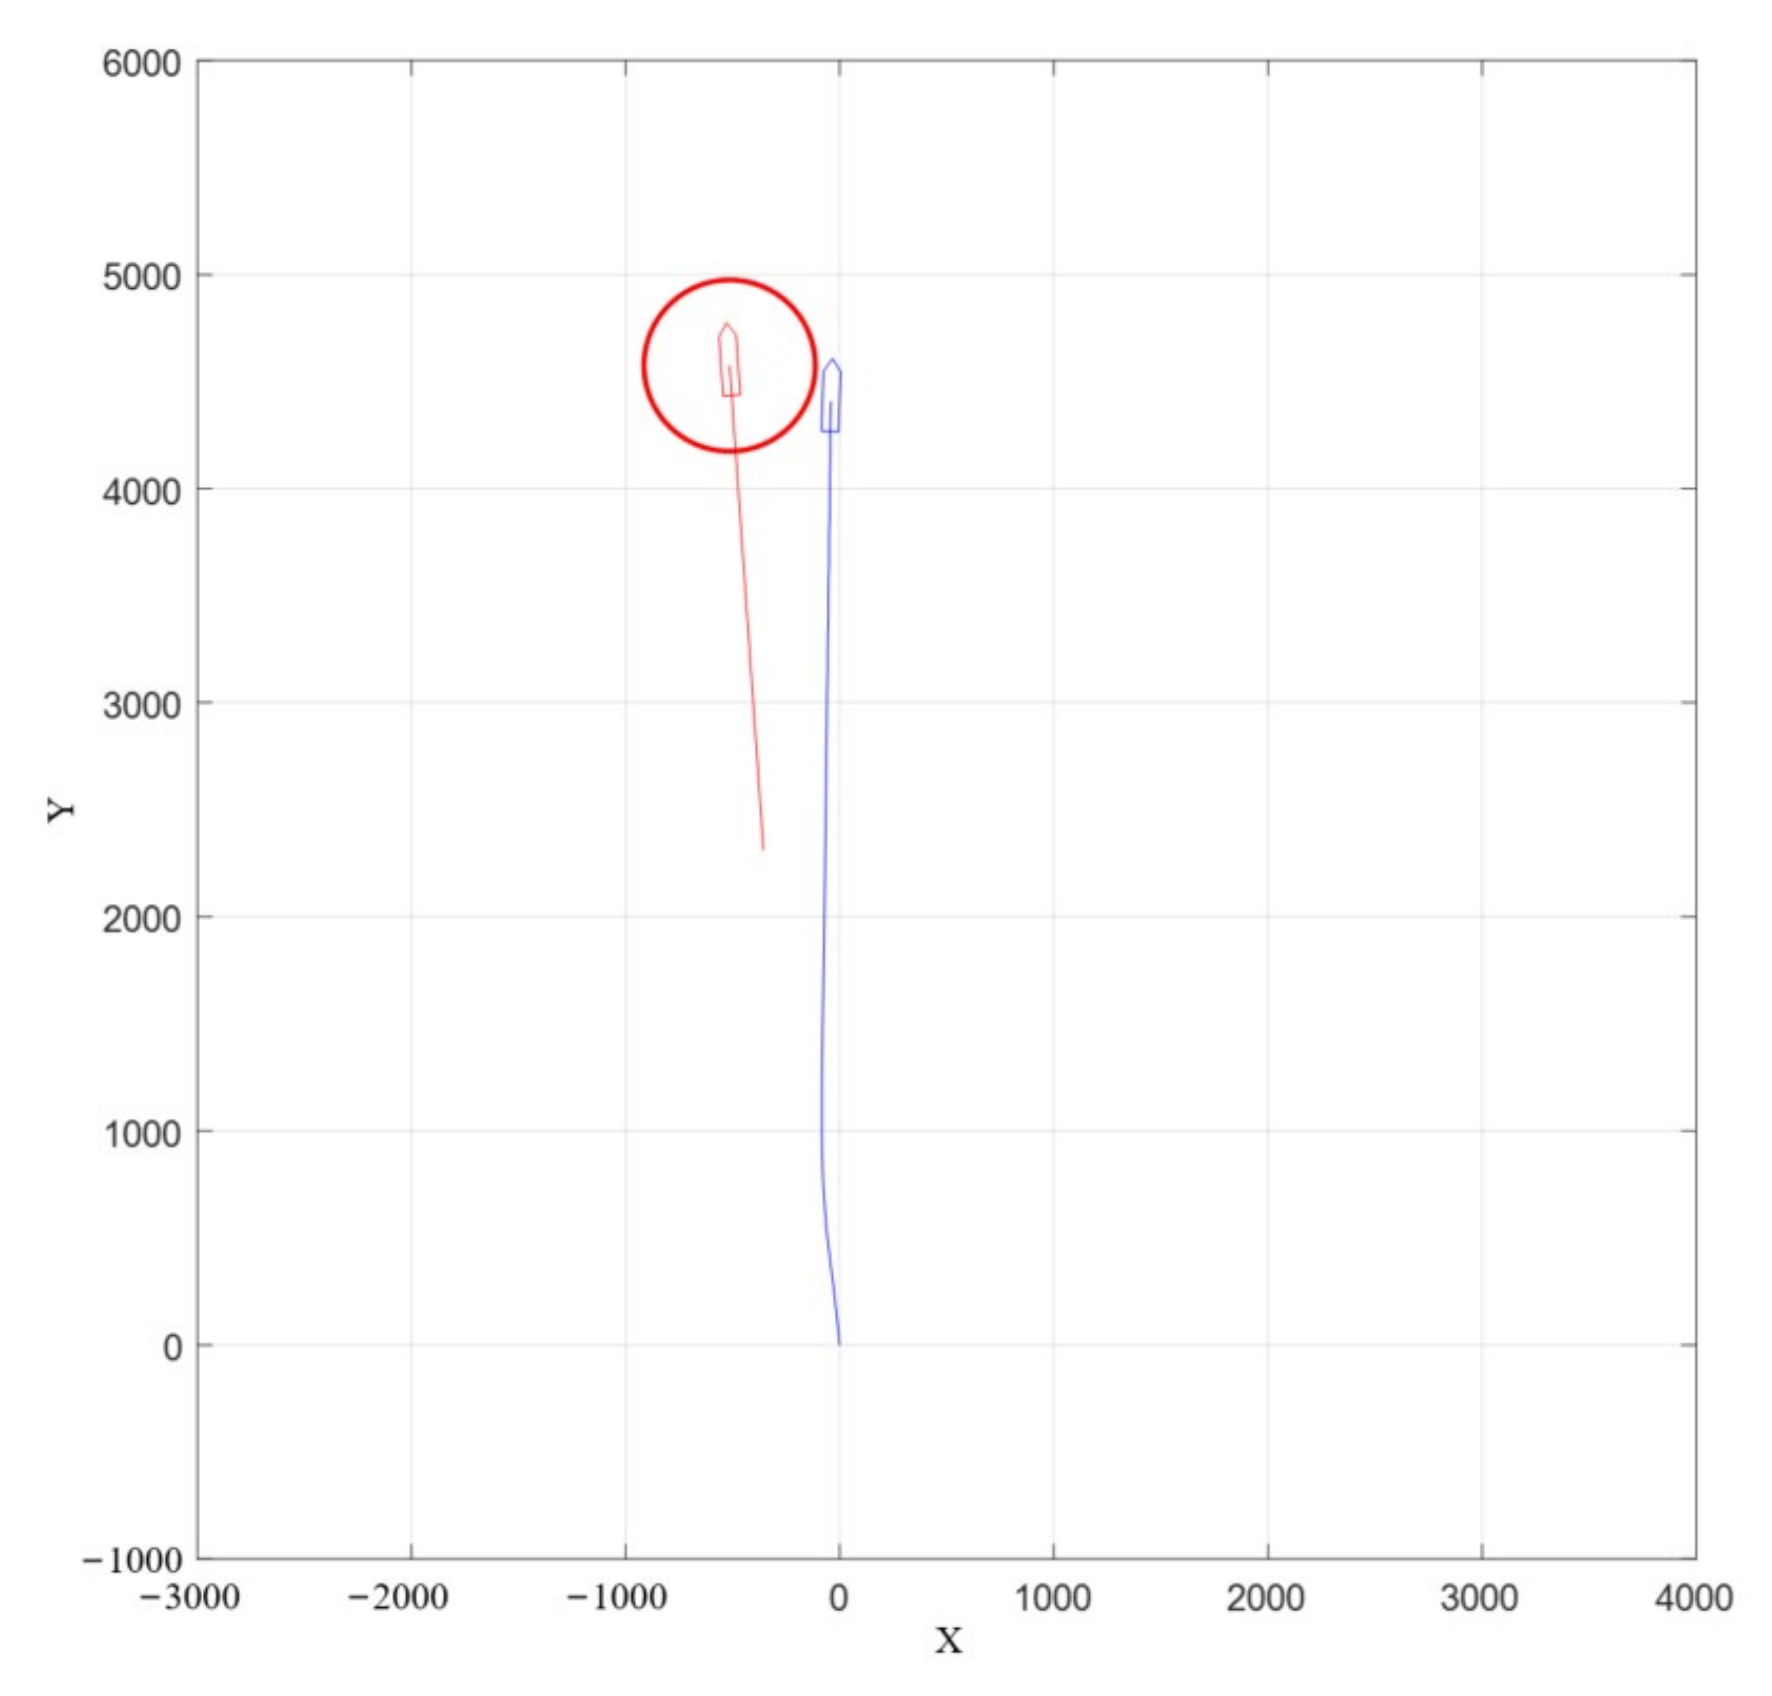
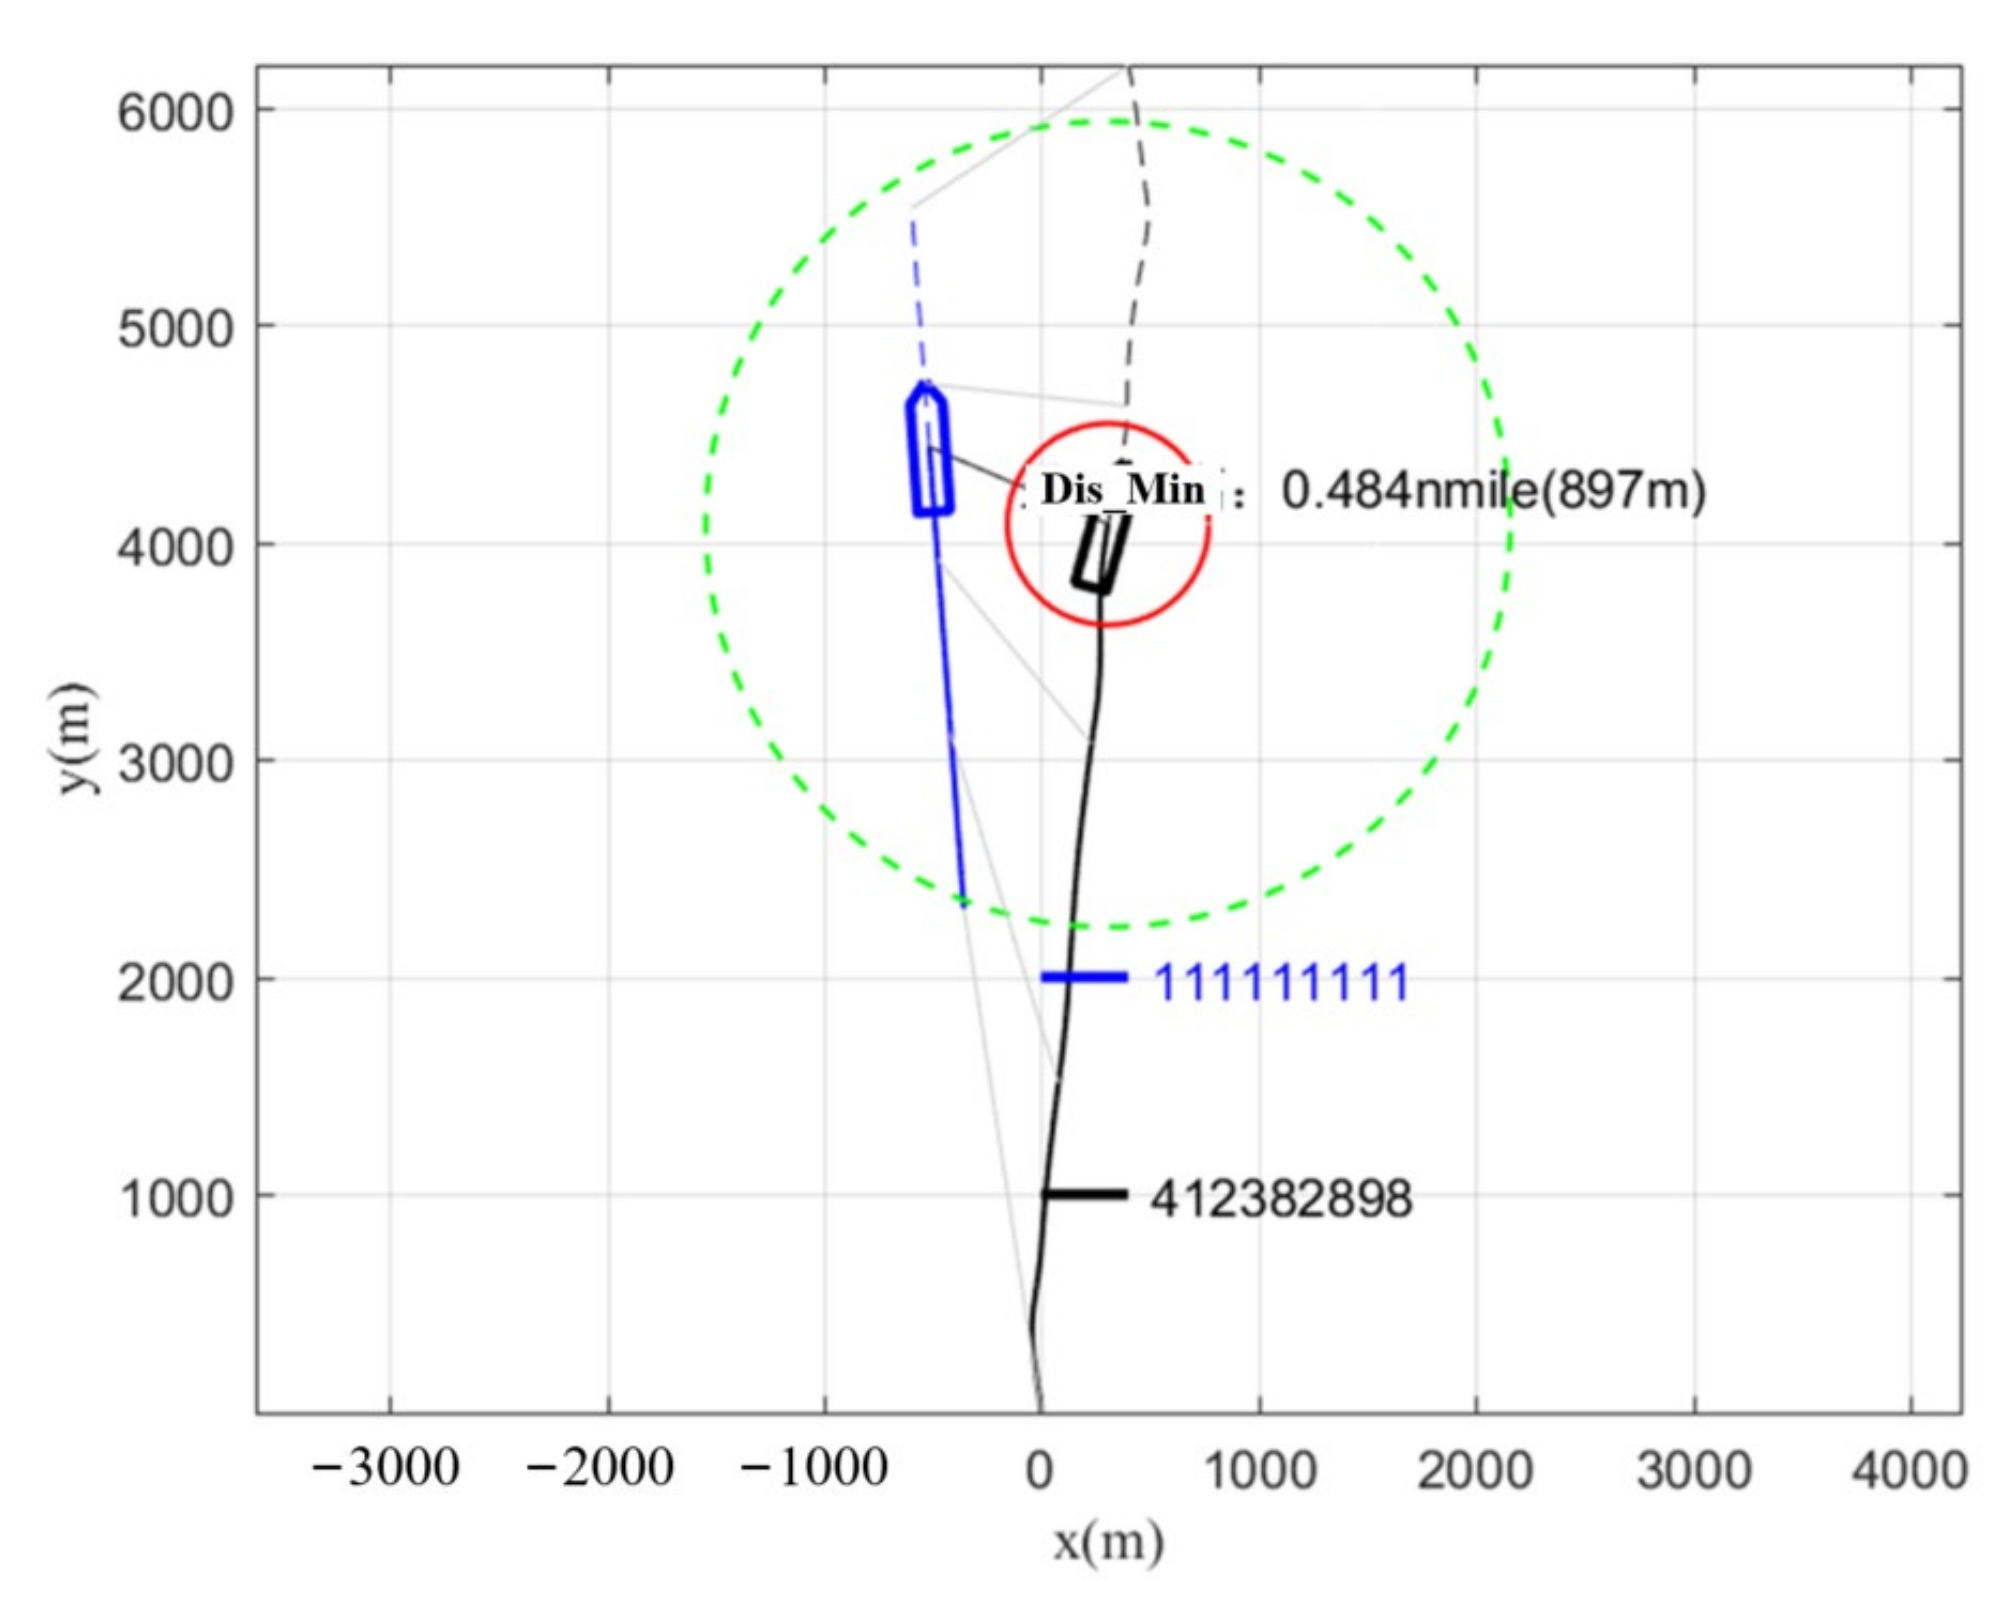
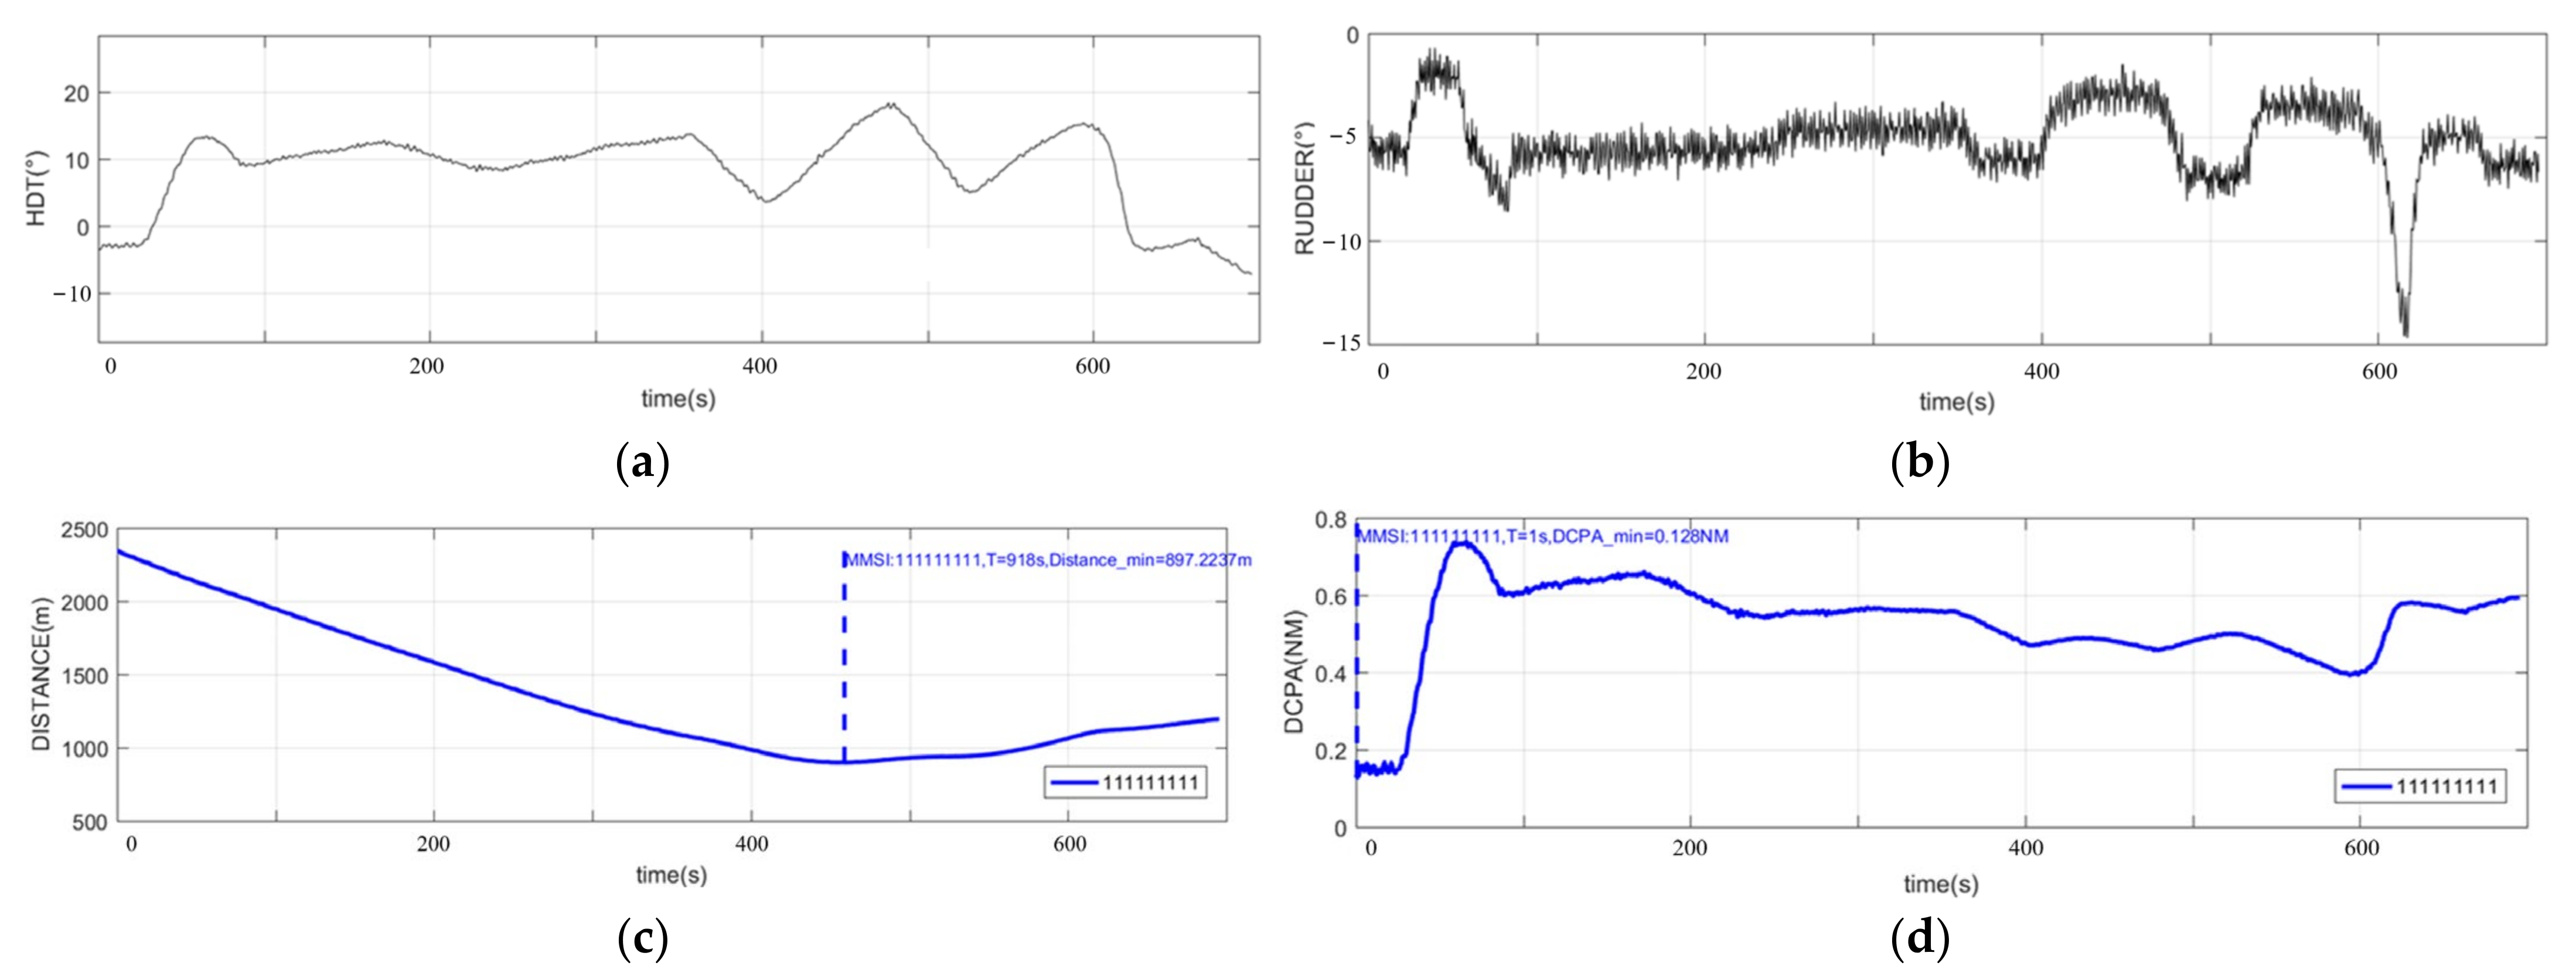
4.1. Actual Ship Experiment

The experiment is divided into two parts: actual ship experiment and simulation experiment. The actual ship experiment uses a built-in intelligent ship navigation test system to record the movement data during ship collision avoidance, and the test evaluation system evaluates the entire process of collision avoidance. This actual ship experiment was operated by an experienced captain. The simulation experiment uses the Matlab simulation platform to simulate ship collision avoidance using the improved VO algorithm and the traditional VO algorithm and record movement data during the collision avoidance process. Finally, the established evaluation system evaluates manual collision avoidance, traditional algorithm collision avoidance, and improved algorithm collision avoidance.
For the actual ship experiment, a sea-going fishing vessel was updated as the test platform, which is equipped with a course keeping autopilot, achieving the course keeping error between 1 and 2° during the test. To collect the vessel’s movement and turning data, a real time kinematic (RTK) module based on GPS and a gyrocompass. The test was conducted in Zhanjiang Bay area, as shown in Figure 9.
The specific parameters of the experimental platform are shown in Table 3.
To verify the S D A value in OV model, this paper conducted an actual ship turning test and obtained specific parameters as shown in Table 4.
The full rudder turning test of the test ship is shown in Figure 10:
The following is a brief introduction to the evaluation index system of the ship’s intelligent navigation test system: the collision avoidance process is evaluated from three aspects: safety, economy, and practicality. The safety evaluation index is mainly used to judge whether the collision avoidance process meets the regulatory requirements and ensures the safety of the ship, including whether it enters imminent danger, the minimum encounter distance, etc. The economic evaluation index is used to evaluate whether the collision avoidance process is economical, whether it can shorten the operation time, and shorten the distance, including deviation factor, maximum alteration of course, total collision avoidance time, and other indicators. Practicality evaluation indicators are used to judge whether it meets the requirements of simple operation and whether it is suitable for actual ship operations, including indicators such as steering frequency. The analytic hierarchy process (AHP) is used to study the weights of the above indicators to form a final complete evaluation system.
Actual ship experiment collision avoidance test method process: The test ship maintains a constant speed and travels in the designated test waters, coordinates are converted to the preset encounter situation according to the longitude, latitude, and course of the test ships, and ships’ courses are generated by the AIS simulator. The distance between the two ships is about 1–6 NM (nautical mile). The own ship is operated by the captain to avoid collisions. In order to improve the efficiency of the actual ship experiment, when there is no collision risk between these two test ships and the own ship returns ±2° to the original course, the collision avoidance is ended. During this process, the experiment evaluation system records the navigation data of the collision avoidance process and generates an evaluation report.

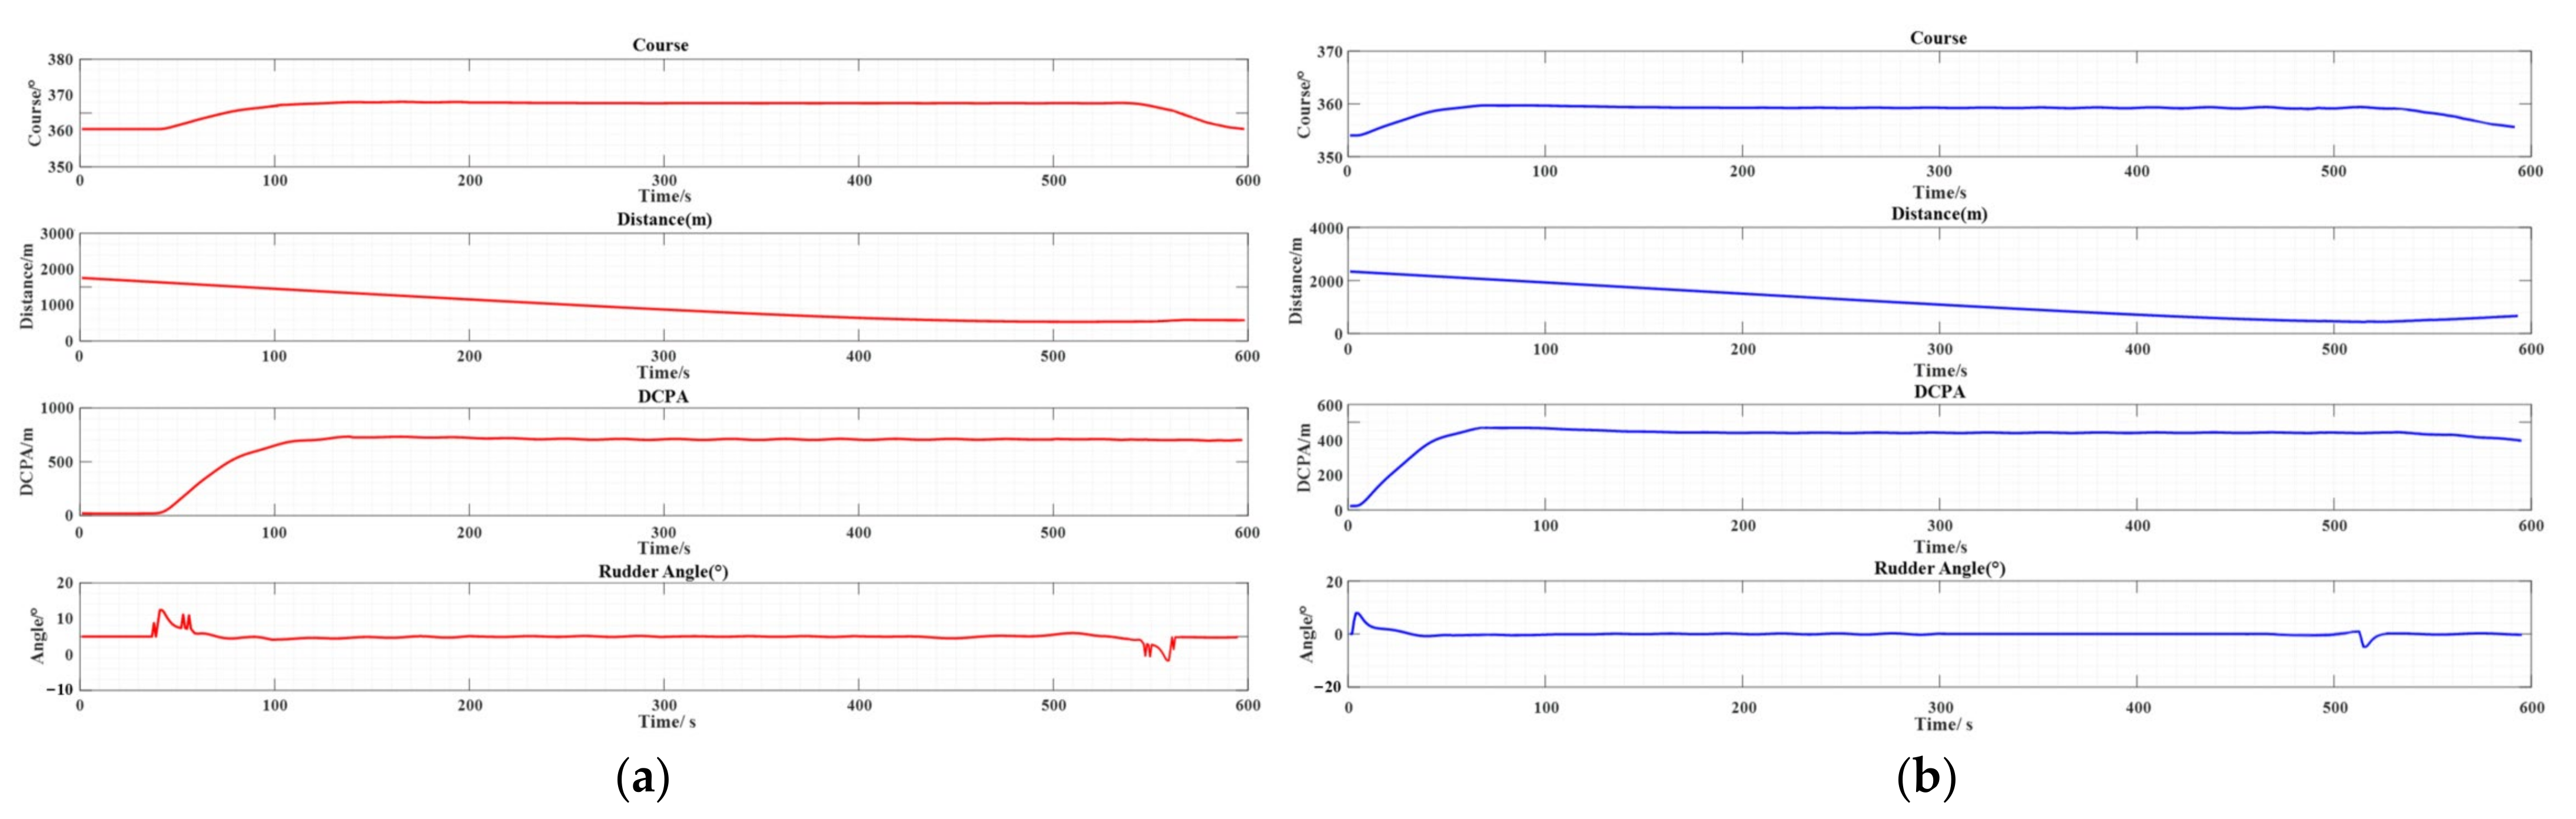
4.2. The Evaluation of Experimental Data

In accordance with the international rules for avoiding collisions at sea, this article simulates encounter situations in three situations: head-on, crossing, and overtaking, in which the ship has the duty to avoid. In order to make the experiment results of the improved VO algorithm, the traditional VO algorithm, and the actual ship experiment comparable in these three situations, it is necessary to maintain situation consistency between the actual ship experiment and the simulation experiment. The initial parameter settings of the actual ship experiment are shown in Table 5.
  • Head-on situation.
Figure 11, Figure 12 and Figure 13 are, respectively, the collision avoidance trajectories of the improved VO, the traditional VO, and the actual ship experiment in the head-on situation. In the improved VO, the red line is the navigation trajectory of the target ship, and the blue line is the navigation trajectory of the own ship. The closed graphics around the two ships represent the ship domain, with the long axis being 0.4 NM and the short axis being 0.16 NM. In the traditional VO, the red line is the navigation trajectory of the target ship, and the blue line is the navigation trajectory of the own ship, and the closed figure around the target ship represents the size of the collision circle of the traditional algorithm, with a radius of 0.25 NM. In the actual ship experiment, MMSI: 111111111 represents the navigation trajectory of the target ship (In order to facilitate the identification of AIS simulation ships, the MMSI is specially set to 111111111), MMSI: 412382898 represents the navigation trajectory of the own ship, and the green enclosed shape around the own ship represents the 1 NM marked circle, while the red enclosed shape represents the 0.25 NM marked circle. When collision avoidance begins, the improved algorithm calculates the ship collision risk in real time. When μ r > 0.72 , the ship starts to avoid collision. The collision avoidance timing for the traditional algorithm is when the distance between two ships ( D O T ) is less than 3600 m. The collision avoidance timing in the actual ship experiment is determined by the captain’s discretion. The ship will turn right to avoid the situation in accordance with the COLREGs rules and return to the original course after the danger is eliminated.
Figure 14a,b and Figure 15 show the parameter changes of the improved VO, the traditional VO, and the actual ship experiment in the head-on situation. The rudder angle, course, D O T and DCPA were analyzed under three experiments. In the improved VO, the own ship started to avoid collision at 207 s, 3900 m away from the target ship, turned right to the maximum course of 347.4°, and started returning to the original course at 426 s. The minimum of D O T was 622 m. In the traditional VO algorithm, the own ship started to avoid collision at 223 s, 3600 m away from the target ship, turned right to the maximum course of 341.8°, and started returning to the original course at 434 s. The minimum of D O T was 482 m. In the actual ship experiment, the own ship started to avoid collision at 179 s, 4200 m away from the target ship, turned right to the maximum course of 355°, and started returning to the original course at 398 s. The minimum of D O T was 905 m.
As shown in Table 6, it is the evaluation system’s ranking of each index score of the three collision avoidance methods.
  • Starboard side crossing situation.
Figure 16, Figure 17 and Figure 18 show the collision avoidance trajectories of the improved VO, traditional VO, and actual ship experiment in crossing situation. In the improved VO, the red line is the navigation trajectory of the target ship, and the blue line is the navigation trajectory of the own ship. The closed graphics around the two ships represent the ship domain, with the long axis being 0.35 NM and the short axis being 0.14 NM.
Figure 19a,b and Figure 20 show the parameter changes of the improved VO, the traditional VO, and the actual ship experiment in the crossing situation. The rudder angle, course, D O T and DCPA were analyzed under three experiments. In the improved VO, the own ship started to avoid collision at 44 s, 3600 m away from the target ship, turned right to the maximum course of 171.4°, and started returning to the original course at 213 s. The minimum of D O T was 762 m. In the traditional VO, the own ship started to avoid collision at 44 s, 3600 m away from the target ship, turned right to the maximum course of 163.6°, and started returning to the original course at 220 s. The minimum of D O T was 489 m. In the actual ship experiment, the own ship started to avoid collision at 39 s, 3800 m away from the target ship, turned right to the maximum course of 188°, and started returning to the original course at 208 s. The minimum of D O T was 987 m.
As shown in Table 7, it is the evaluation system’s ranking of each index score of the three collision avoidance methods.
  • Port side crossing situation.
Figure 21 shows the collision avoidance trajectories of the improved VO in the port side crossing situation. In the improved VO, the red line is the navigation trajectory of the target ship, and the blue line is the navigation trajectory of the own ship. The closed graphics around the two ships represent the ship domain, with the long axis being 0.35 NM and the short axis being 0.14 NM. When the target ship is on the port side of the own ship, this ship has no responsibility for avoidance. If the target ship does not take avoidance measures, this ship will start emergency collision avoidance and return to its original course after the collision danger is eliminated.
Figure 22 shows the parameter changes of the improved VO in the port side crossing situation. The rudder angle, course, D O T and DCPA were analyzed under the experiment. In the improved VO, the own ship started to avoid collision at 55 s, 1850 m away from the target ship, turned right to the minimum course of −64.4°, and started returning to the original course at 130 s. The minimum of D O T was 515 m.
  • Overtaking situation.
Figure 23, Figure 24 and Figure 25 show the collision avoidance trajectories of the improved VO, the traditional VO, and the actual ship collision avoidance experiment in the overtaking situation. Among them, the red line in the improved VO is the navigation trajectory of the target ship, and the blue line is the navigation trajectory of the own ship. The closed graphics around the two ships represent the ship domain, with the long axis being 0.4 NM and the short axis being 0.16 NM.
Figure 26a,b and Figure 27 show the parameter changes of the improved VO, the traditional VO, and the actual ship experiment in the overtaking situation. The rudder angle, course, D O T and DCPA were analyzed under three experiments. In the improved VO, the own ship started to avoid collision at 37 s, 2200 m away from the target ship, turned right to the maximum course of 3.6°, and started returning to the original course at 562 s. The minimum of D O T was 717 m. In the traditional VO, the own ship started to avoid collision at 1 s, 2343 m away from the target ship, turned right to the maximum course of 0.2°, and started returning to the original course at 514 s. The minimum of D O T was 480 m. In the actual ship experiment, the own ship started to avoid collision at 38 s, 2200 m away from the target ship, turned right to the maximum course of 18°, and started returning to the original course at 589 s. The minimum of D O T was 897 m.
As shown in Table 8, it is the evaluation system’s ranking of each index score of the three collision avoidance methods.
From the comparison of collision avoidance results in four encounter situations (head-on, starboard side crossing, port side crossing, and overtaking), it can be seen that the improved VO algorithm can strictly ensure that the ship domains of the own ship and target ship do not invade each other during collision avoidance. The minimum distance between the two ships is always greater than 0.25 NM, and the timing of starting and ending collision avoidance is relatively close to the actual ship experiment. This method can use a smaller deviation factor to complete collision avoidance at a safe distance, while taking into account safety, economy, and practicality. In the evaluation index system of collision avoidance behavior, it is significantly better than other collision avoidance methods.

5. Conclusions

This paper determines the ship domain by calculating the safe distance of approach in different encounter situations. It employs an approach of finding the tangent of ellipses to ensure non-intersection of the ship domains of the own ship and target ship. Additionally, it combines the COLREGs and the VO algorithm to further determine the desired course. Finally, it determines the appropriate initiation timing for collision avoidance based on the risk of ship collision. By comparing the simulation experiments of the improved VO algorithm with traditional algorithms and actual ship experimental results, it can be seen that the improved VO algorithm can strictly abide by COLREGs to achieve collision avoidance when facing head-on, crossing, and overtaking encounter situations, and ensure that the minimum distance between two ships during collision avoidance is always greater than the imminent danger distance (0.25 NM) defined in the actual ship experiment. At the same time, the improved algorithm fits well with the captain’s collision avoidance behavior in the actual ship experiment, which shows that this method can effectively deal with the collision situations of various encounter situations in open water environments. And it has certain feasibility and practical applicability in terms of collision avoidance behavior.

Author Contributions

Conceptualization, K.Z. and B.L.; methodology, M.Z., K.Z., B.H., B.L. and S.D.; software, K.Z., H.Z. and S.D.; formal analysis, M.Z., K.Z., B.H., B.L. and H.Z.; investigation, K.Z., H.Z., S.D., T.Z. and Y.Y.; resources, M.Z., B.H. and B.L.; data curation, K.Z., B.H., B.L., H.Z. and S.D.; writing—original draft preparation, K.Z.; writing—review and editing, M.Z., B.L. and T.Z.; visualization, M.Z. and B.H.; supervision, M.Z.; project administration, T.Z.; funding acquisition, M.Z. All authors have read and agreed to the published version of the manuscript.

Funding

This research was funded by the National Key R&D Program of China (2022YFB4301405), the National Natural Science Foundation of China (No. 52001243), the Fund of Guangxi Science and Technology Program (AB23026132).

Institutional Review Board Statement

Not applicable.

Informed Consent Statement

Not applicable.

Data Availability Statement

Data are contained within the article.

Conflicts of Interest

Author Yougui Yang was employed by the company Beibu Gulf Port Qinzhou Terminal Co., Ltd. The remaining authors declare that the research was conducted in the absence of any commercial or financial relationships that could be construed as a potential conflict of interest.

References

  1. Lin, B.; Zheng, M.; Chu, X.; Mao, W.; Zhang, D.; Zhang, M. An overview of scholarly literature on navigation hazards in Arctic shipping routes. Environ. Sci. Pollut. Res. 2023, 1–17. [Google Scholar] [CrossRef]
  2. Shi, X.; Zhuang, H.; Xu, D. Structured survey of human factor-related maritime accident research. Ocean Eng. 2021, 237, 109561. [Google Scholar] [CrossRef]
  3. Weng, J.; Liao, S.; Wu, B.; Yang, D. Exploring effects of ship traffic characteristics and environmental conditions on ship collision frequency. Marit. Policy Manag. 2020, 47, 523–543. [Google Scholar] [CrossRef]
  4. Toyoda, S.; Fujii, Y. Marine traffic engineering. J. Navig. 1971, 24, 24–34. [Google Scholar] [CrossRef]
  5. Goodwin, E.M. A statistical study of ship domains. J. Navig. 1975, 28, 328–344. [Google Scholar] [CrossRef]
  6. Smierzchalski, R.; Michalewicz, Z. Modelling of a ship trajectory in collision situations at sea by evolutionary algorithm. IEEE Trans. Evol. Comput. 2000, 4, 227–241. [Google Scholar] [CrossRef]
  7. Wang, N. An intelligent spatial collision risk based on the quaternion ship domain. J. Navig. 2010, 63, 733–749. [Google Scholar] [CrossRef]
  8. Davis, P.V.; Dove, M.J.; Stockel, C.T. A computer simulation of marine traffic using domains and arenas. J. Navig. 1980, 33, 215–222. [Google Scholar] [CrossRef]
  9. Bukhari, A.C.; Tusseyeva, I.; Kim, Y.G. An intelligent real-time multi-vessel collision risk assessment system from VTS view point based on fuzzy inference system. Expert Syst. Appl. 2013, 40, 1220–1230. [Google Scholar] [CrossRef]
  10. Ma, D.; Chen, X.; Ma, W.; Zheng, H.; Qu, F. Neural Network Model-Based Reinforcement Learning Control for AUV 3-D Path Following. IEEE Trans. Intell. Veh. 2023, 1–13. [Google Scholar] [CrossRef]
  11. Chen, J.; Chen, H.; Liu, K. A method of estimating ship collision risk based on fuzzy neural network. Ship Sci. Technol. 2008, 135–138. [Google Scholar]
  12. Zhao, G.; Wang, C.; Zhou, J.; Li, Y. Collision risk calculation of unmanned surface vehicle on improved fuzzy evaluation method. Syst. Eng. Electron. 2023, 1–9. [Google Scholar]
  13. Li, M.; Mou, J.; Chen, P.; Rong, H.; Chen, L.; van Gelder, P.H.A.J.M. Towards real-time ship collision risk analysis: An improved R-TCR model considering target ship motion uncertainty. Reliab. Eng. Syst. Saf. 2022, 226, 108650. [Google Scholar] [CrossRef]
  14. Abebe, M.; Noh, Y.; Seo, C.; Kim, D.; Lee, I. Developing a ship collision risk Index estimation model based on Dempster-Shafer theory. Appl. Ocean Res. 2021, 113, 102735. [Google Scholar] [CrossRef]
  15. Li, L.; Wu, D.; Huang, Y.; Yuan, Z.M. A path planning strategy unified with a COLREGS collision avoidance function based on deep reinforcement learning and artificial potential field. Appl. Ocean Res. 2021, 113, 102759. [Google Scholar] [CrossRef]
  16. He, Z.; Liu, C.; Chu, X.; Negenborn, R.R.; Wu, Q. Dynamic anti-collision A-star algorithm for multi-ship encounter situations. Appl. Ocean Res. 2022, 118, 102995. [Google Scholar] [CrossRef]
  17. Zheng, Y.; Zhang, X.; Shang, Z.; Guo, S.; Du, Y. A decision-making method for ship collision avoidance based on improved cultural particle swarm. J. Adv. Transp. 2021, 2021, 8898507. [Google Scholar] [CrossRef]
  18. Singh, Y.; Sharma, S.; Sutton, R.; Hatton, D.; Khan, A. A constrained A* approach towards optimal path planning for an unmanned surface vehicle in a maritime environment containing dynamic obstacles and ocean currents. Ocean Eng. 2018, 169, 187–201. [Google Scholar] [CrossRef]
  19. Hong, X.; Xu, Z.; Wei, X.; Zhu, K.; Chen, Y. Dynamic obstacle avoidance of unmanned surface vehicle based on improved speed obstacle method. Opt. Precis. Eng. 2021, 29, 2126–2139. [Google Scholar] [CrossRef]
  20. Zhang, Y.Y.; Qu, D.; Ke, J.; Li, X. Dynamic obstacle avoidance for USV based on velocity obstacle and dynamic window method. J. Shanghai Univ. Nat. Sci. Ed. 2017, 23, 1–16. [Google Scholar]
  21. Ma, J.; Su, Y.; Xiong, Y.; Zhang, Y.; Yang, X. Decision-making method for collision avoidance of ships in confined waters based on velocity obstacle and artificial potential field. Chin. J. Saf. Sci. 2020, 30, 60–66. [Google Scholar]
  22. Zhang, G.; Wang, Y.; Liu, J.; Cai, W.; Wang, H. Collision-avoidance decision system for inland ships based on velocity obstacle algorithms. J. Mar. Sci. Eng. 2022, 10, 814. [Google Scholar] [CrossRef]
  23. Wang, S.; Zhang, Y.; Li, L. A collision avoidance decision-making system for autonomous ship based on modified velocity obstacle method. Ocean Eng. 2020, 215, 107910. [Google Scholar]
  24. Kuwata, Y.; Wolf, M.T.; Zarzhitsky, D.; Huntsberger, T.L. Safe maritime autonomous navigation with COLREGS, using velocity obstacles. IEEE J. Ocean. Eng. 2013, 39, 110–119. [Google Scholar] [CrossRef]
  25. Zhao, L.; Fu, X. A novel index for real-time ship collision risk assessment based on velocity obstacle considering dimension data from AIS. Ocean Eng. 2021, 240, 109913. [Google Scholar] [CrossRef]
  26. Fiorini, P.; Shiller, Z. Motion planning in dynamic environments using velocity obstacles. Int. J. Robot. Res. 1998, 17, 760–772. [Google Scholar] [CrossRef]
  27. Du, P.; Ouahsine, A.; Tran, K.T.; Sergent, P. Simulation of the overtaking maneuver between two ships using the non-linear maneuvering model. J. Hydrodyn. 2018, 30, 791–802. [Google Scholar] [CrossRef]
  28. Sun, F.; Cai, Y.; Ma, J. A Study of Test Methods and Indicators for Marine Intelligent Anti-collision strategy. Traffic Inf. Saf. 2019, 37, 84–93. [Google Scholar]
  29. Zhang, L.; Wang, H.; Meng, Q. Big data–based estimation for ship safety distance distribution in port waters. Transp. Res. Rec. 2015, 2479, 16–24. [Google Scholar] [CrossRef]
  30. Li, L. Determination of elements such as the safe distances of approach in automatic collision avoidance studies of ships. J. Dalian Marit. Univ. 2002, 23–26. [Google Scholar] [CrossRef]
  31. Chen, C.; Li, G.; Li, F.; Li, L.; Chen, G. The Risk Threshold of Ship Collision in Different Waters. China Navig. 2020, 43, 27–32. [Google Scholar]
  32. Perera, L.P.; Soares, C.G. Ocean vessel trajectory estimation and prediction based on extended Kalman filter. In Proceedings of the Second International Conference on Adaptive and Self-Adaptive Systems and Applications, Lisbon, Portugal, 21–26 November 2010; pp. 14–20. [Google Scholar]
  33. Zhao, J. Principles of Ship Collision Avoidance; Dalian Maritime University Press: Dalian, China, 1998. [Google Scholar]
  34. Naeem, W.; Irwin, G.W.; Yang, A. COLREGs-based collision avoidance strategies for unmanned surface vehicles. Mechatronics 2012, 22, 669–678. [Google Scholar] [CrossRef]
  35. Zhong, J. Analysis of the risk of collision, close quarters situation and immediate Danger. J. Shanghai Marit. Univ. 1999, 20, 77–79. [Google Scholar]
  36. Hu, Y.; Zhang, A.; Tian, W.; Zhang, J.; Hou, Z. Multi-ship collision avoidance decision-making based on collision risk index. J. Mar. Sci. Eng. 2020, 8, 640. [Google Scholar] [CrossRef]
Figure 1. The flowchart of algorithm implementation.
Jmse 12 00402 g001
Figure 2. The geometric definition of the VO algorithm.
Jmse 12 00402 g002
Figure 3. Ship velocity obstacle model.
Jmse 12 00402 g003
Figure 4. The trajectory belt of ships.
Jmse 12 00402 g004
Figure 5. Diagram of ship turning test.
Jmse 12 00402 g005
Figure 6. The ship domain: (a) Fujii model enlarged by scaling factor; (b) The state where the distance between two ships is minimum.
Jmse 12 00402 g006
Figure 7. Collision avoidance analysis.
Jmse 12 00402 g007
Figure 8. The relative position of the encounter between own ship and target ship.
Jmse 12 00402 g008
Figure 9. The updating of own ship and the experimental area in Zhanjiang city of China.
Jmse 12 00402 g009
Figure 10. Turning test of 30°.
Jmse 12 00402 g010
Figure 11. Improved Velocity Obstacle in the head-on situation: (a) the trajectory of the two ships when they are at the closest distance; (b) the trajectory when collision avoidance is completed.
Jmse 12 00402 g011
Figure 12. Traditional Velocity Obstacle in the head-on situation.
Jmse 12 00402 g012
Figure 13. The actual ship experiment in the head-on situation.
Jmse 12 00402 g013
Figure 14. Parameter change diagram of the algorithm in the head-on situation: (a) Improved Velocity Obstacle; (b) Traditional Velocity Obstacle.
Jmse 12 00402 g014
Figure 15. Parameter change diagram of the actual ship experiment in the head-on situation: (a) course graph; (b) rudder angle graph; (c) distance graph; (d) DCPA graph.
Jmse 12 00402 g015
Figure 16. Improved Velocity Obstacle in the starboard side crossing situation: (a) the trajectory of the two ships when they are at the closest distance; (b) the trajectory when collision avoidance is completed.
Jmse 12 00402 g016
Figure 17. Traditional Velocity Obstacle in the starboard side crossing situation.
Jmse 12 00402 g017
Figure 18. The actual ship experiment in the starboard side crossing situation.
Jmse 12 00402 g018
Figure 19. Parameter change diagram of the algorithm in the starboard side crossing situation: (a) Improved Velocity Obstacle; (b) Traditional Velocity Obstacle.
Jmse 12 00402 g019
Figure 20. Parameter change diagram of the actual ship experiment in the starboard side crossing situation: (a) course graph; (b) rudder angle graph; (c) distance graph; (d) DCPA graph.
Jmse 12 00402 g020aJmse 12 00402 g020b
Figure 21. Improved Velocity Obstacle in the port side crossing situation: (a) the trajectory of the two ships when they are at the closest distance; (b) the trajectory when collision avoidance is completed.
Jmse 12 00402 g021
Figure 22. Parameter change diagram of the Improved Velocity Obstacle in the port side crossing situation.
Jmse 12 00402 g022
Figure 23. Improved Velocity Obstacle in the overtaking situation: (a) the trajectory of the two ships when they are at the closest distance; (b) the trajectory when collision avoidance is completed.
Jmse 12 00402 g023
Figure 24. Traditional Velocity Obstacle in the overtaking situation.
Jmse 12 00402 g024
Figure 25. The actual ship experiment in the overtaking situation.
Jmse 12 00402 g025
Figure 26. Parameter change diagram of the algorithm in the overtaking situation: (a) Improved Velocity Obstacle; (b) Traditional Velocity Obstacle.
Jmse 12 00402 g026
Figure 27. Parameter change diagram of the actual ship experiment in the overtaking situation: (a) course graph; (b) rudder angle graph; (c) distance graph; (d) DCPA graph.
Jmse 12 00402 g027
Table 1. Classification of ship encounter.
Types of
Encounter
The Area Where the Target Ship Is LocatedCourse DifferenceEncounter SituationSuitable Action for Own Ship
Head-onA, B175–185°Head-onTurning right
Starboard side crossingD270–360°Large course difference crossing form starboard sideTurning right
C180–270°Small course difference crossing form starboard sideTurning right
Port side crossingG0–90°port large angle crossingKeeping course and speed
H90–180°port large angle crossingKeeping course and speed
OvertakingA, H0–67.5°Own ship pass on the starboard side of the target shipTurning right
B, C292.5–360°Own ship pass on the port side of the target shipTurning left
Being overtakenE0–67.5°
292.5–360°
Target ship pass on the starboard side of own shipKeeping course and speed
FTarget ship pass on the port side of own shipKeeping course and speed
Table 2. Classification of ship situations.
TypeMinimum Distance (n Mile)Maximum Distance (n Mile)
Collision risk16
Close-quarters situation0.251
Imminent danger00.25
Table 3. Parameters of the ship.
Length (m)Width (m)Total Tonnage (t)Speed (kn)
43.97.33533–12
Table 4. The results of the turning test.
D T /(m) D O /(m) A d / (m) T r / (m) T 90 /(s)
Full rudder 30°148.1256146.4241109.348776.813644
where D T is Tactical diameter; D O is Steady diameter; A d is Advance; T r is Transfer; T 90 is the time for the ship’s course to turn 90°. The average speed during turning test is about 3 m/s, the length of own ship and target ship could be simply regarded as the same. The safe distance of approach ( S D A ) could be calculated as 0.251 NM.
Table 5. Initial parameters for collision avoidance experiments.
SituationOwn ShipTarget Ship
Initial Coordinates (N, E)Course (°)Speed (kn)Initial Coordinates (N, E)Course (°)Speed (kn)
Head-on(20.756941°, 110.625902°)324.49.1(20.812550°, 110.583753°)1478.6
Starboard side crossing(20.784380°, 110.616869°)117.27.9(20.747173°, 110.611780°)4412.5
Overtaking(20.689691°, 110.630284°)356.78.6(20.710497°, 110.626862°)3564.5
Table 6. Evaluation conclusion in the head-on situation.
Evaluation IndexImproved VOTraditional VOManual Ship Handling
Own ship is in imminent danger
Minimum encounter distance
Deviation factor
Maximum alteration of course
Collision avoidance time
Steering frequency
Total
where ① indicates the highest ranking in the score of this indicator; ② indicates the second highest ranking; ③ indicates the lowest ranking.
Table 7. Evaluation conclusion in the starboard side crossing situation.
Evaluation IndexImproved VOTraditional VOManual Ship Handling
Own ship is in imminent danger
Minimum encounter distance
Deviation factor
Maximum alteration of course
Collision avoidance time
Steering frequency
Total
where ① indicates the highest ranking in the score of this indicator; ② indicates the second highest ranking; ③ indicates the lowest ranking.
Table 8. Evaluation conclusion in the overtaking situation.
Evaluation IndexImproved VOTraditional VOManual Ship Handling
Own ship is in imminent danger
Minimum encounter distance
Deviation factor
Maximum alteration of course
Collision avoidance time
Steering frequency
Total
where ① indicates the highest ranking in the score of this indicator; ② indicates the second highest ranking; ③ indicates the lowest ranking.
Disclaimer/Publisher’s Note: The statements, opinions and data contained in all publications are solely those of the individual author(s) and contributor(s) and not of MDPI and/or the editor(s). MDPI and/or the editor(s) disclaim responsibility for any injury to people or property resulting from any ideas, methods, instructions or products referred to in the content.

