Article

Added Value of Water Column Spatiotemporal Monitoring to Assess Variability of Trace Metal Elements and Organotin Compounds in Mediterranean Harbours

1
HSM (HydroSciences Montpellier), University Montpellier, CNRS (Centre National de la Recherche Scientifique), IRD (Institut de Recherche pour le Développement), 34295 Montpellier, France
2
Aix Marseille University, Université de Toulon, CNRS, IRD, MIO (Mediterranean Institute of Oceanography), 13007 Marseille, France
3
OSU-OREME (Observatoire de Recherche Montpelliérain de l’Environnement), University Montpellier, 34090 Montpellier, France
*
Author to whom correspondence should be addressed.
J. Mar. Sci. Eng. 2024, 12(3), 399; https://doi.org/10.3390/jmse12030399
Submission received: 25 January 2024 / Revised: 15 February 2024 / Accepted: 21 February 2024 / Published: 26 February 2024
(This article belongs to the Section Marine Environmental Science)

Abstract

:
Marinas are semi-enclosed environments characterised by reduced hydrodynamic energy, high sedimentation rates, and reduced oxygen levels. The ongoing development of activities and infrastructure construction are leading to deterioration in the quality of coastal aquatic environments, creating environmental risks. Trace metal elements (TMEs) and organotins are significant contaminants, prompting this study to evaluate the added value of spatiotemporal monitoring compared to one-time sediment assessments. Two Mediterranean harbours, Port Camargue (PC) and Port Carnon (C), differing in morphology and size, were monitored for a year with regular water sampling, focusing on TMEs and organotins. Sediment contamination, notably in the technical zone, revealed concentrations of Cu (309 and 1210 mg kg−1 for C and PC, respectively), Zn (242 and 425 mg kg−1 for C and PC, respectively), and tributyltin (TBT) (198 and 4678 µg (Sn) kg−1 for C and PC, respectively) surpassing the effect range medium (ERM), while other marina stations generally stayed below this threshold. Spatiotemporal water monitoring highlighted concentrations above environmental quality standards (EQS) at all stations of the larger marina. This exceedance was systematic for Cu and Zn in all samples, ranging respectively between 2.54 and 37.56 µg (Sn) L−1 and 0.63 and 33.48 µg (Sn) L−1. A notable temporal dynamic for TBT and Cu was also observed. Conversely, the open marina, connected to the open sea, rarely exhibited concentrations above EQS in water, despite sediment concentrations occasionally exceeding ERM values. This underscores that risk assessment in these ecosystems cannot rely solely on sediment characterisation.

1. Introduction

The Mediterranean coastal zone represents an important socio-economic and ecological area subject to strong pressures [1,2]. With over 40% of the Mediterranean coastline urbanised, coastal waters are subject to considerable human pressure [3]. Marinas are semi-enclosed environments characterised by reduced hydrodynamic energy, high sedimentation rates, and reduced oxygen levels [4]. These environments lead to high population densities. The ongoing development of activities and the construction of infrastructures are leading to a deterioration in the quality of coastal aquatic environments, creating environmental risks. These port activities have an impact on both the quality and availability of natural resources [5]. These pressures include shipping activity (vessel density), port activity (port operations), dredging activity, and external activities (land uses, including urban, industrial, agricultural discharges, etc.) that can have an impact on water and sediment quality, leading to the alteration of the seabed or loss of habitat. One of the main types of contamination of particular concern is the input of trace metal elements (TMEs) [6,7]. More specifically, trace metals in the seas come from both natural processes (atmospheric inputs and wind processes) and anthropogenic activities [8]. Trace metals tend to accumulate in sediment, resulting in higher concentrations compared to the water column. This is due to the properties of trace metal ions that govern processes like adsorption, hydrolysis, and co-precipitation [9,10].
In addition to TMEs, organotins are also major contaminants in marine harbours [11,12]. Organotins have been widely used for decades in industrial activities such as oil refining and the manufacture of antifouling chemicals [13,14]. Tributyltin (TBT), a compound of butyltin (BuT), was developed in the 1950s as the most effective commercially available antifouling system for decades [15]. TBT is known to have serious ecotoxicological impacts like imposex (females developing male sex organs such as a penis and vas deferens) in the gastropod Nucella lapillus or severe calcification defects in the oyster Crassostrea gigas, resulting in a population decline [16,17,18]. Even at very low concentrations (a few ng(Sn) L−1), TBT is toxic to marine biota, so the International Maritime Organization banned TBT in boat antifouling paints in 2008. Unfortunately, in spite of the ban, TBT and butyltins continue to be used in continental settings (for agriculture, catalysts, and heat stabilisers in PVC) and are dispersed into coastal marine waters through sewage sludge [19,20]. TBT persists at high concentrations in marine harbours, reaching up to 8000 ng Sn g−1 in sediment, 179 ng Sn g−1 in biota (mussels), or 70 ng Sn L−1 in seawater [21,22,23]. Since its ban, TBT has been replaced by copper (Cu) in antifouling paints, leading to an increase in its use in industrial activities or as a biocide, resulting in the accumulation of Cu in sediments and surface waters [24,25]. The US Environmental Protection Agency (US EPA) has identified Cu as one of the greatest environmental concerns in ship discharges [26], with multiple potential negative impacts on marine organisms. For example, a wide range of pollutants are bioaccumulated by phytoplankton species, including Cu and butyltins, which are then transferred to higher trophic levels, with dramatic effects on many organisms [27,28].
The utilisation of sediments for evaluating the environmental state of aquatic ecosystems has gained popularity, primarily because they offer a historical record and the capability to integrate environmental events over time [29]. In this vein, to assess the level of contamination in harbour systems, trace metals and organotins are generally measured in sediments, with a spatial approach designed to characterise the state of contamination according to port activities [21,30,31]. Several researchers have suggested evaluating the water quality through an analysis of phytoplankton communities and their interactions with physicochemical parameters. This approach aims to offer insights into the impact of human activities, particularly those related to port operations, on coastal ecosystems [32].
However, the dynamics of TMEs and organotins in the water column are rarely measured in harbour areas, the focus being on sediments due to their integrative nature [33]. The European Water Framework Directive defines environmental quality standards (EQS) based on the level of contamination in the water column for certain TMEs and TBT. The aquatic environment can be affected by chemical pollution both in the short- and long-term, and therefore both acute and chronic effects data should be used as the basis for establishing the EQS. In order to ensure that the aquatic environment and human health are adequately protected, EQS expressed as an annual average value should be established at a level providing protection against long-term exposure, and maximum allowable concentrations should be established to protect against short-term exposure. Therefore, the aim of this study was to assess the added value of spatiotemporal monitoring of TMEs and organotin compounds for understanding seawater quality trends compared to one-off sedimentary assessments. For that purpose, two marinas located in the Mediterranean Sea with different morphologies and structures were monitored over one year with regular water sampling, with particular attention given to TMEs and organotins.

2. Materials and Methods
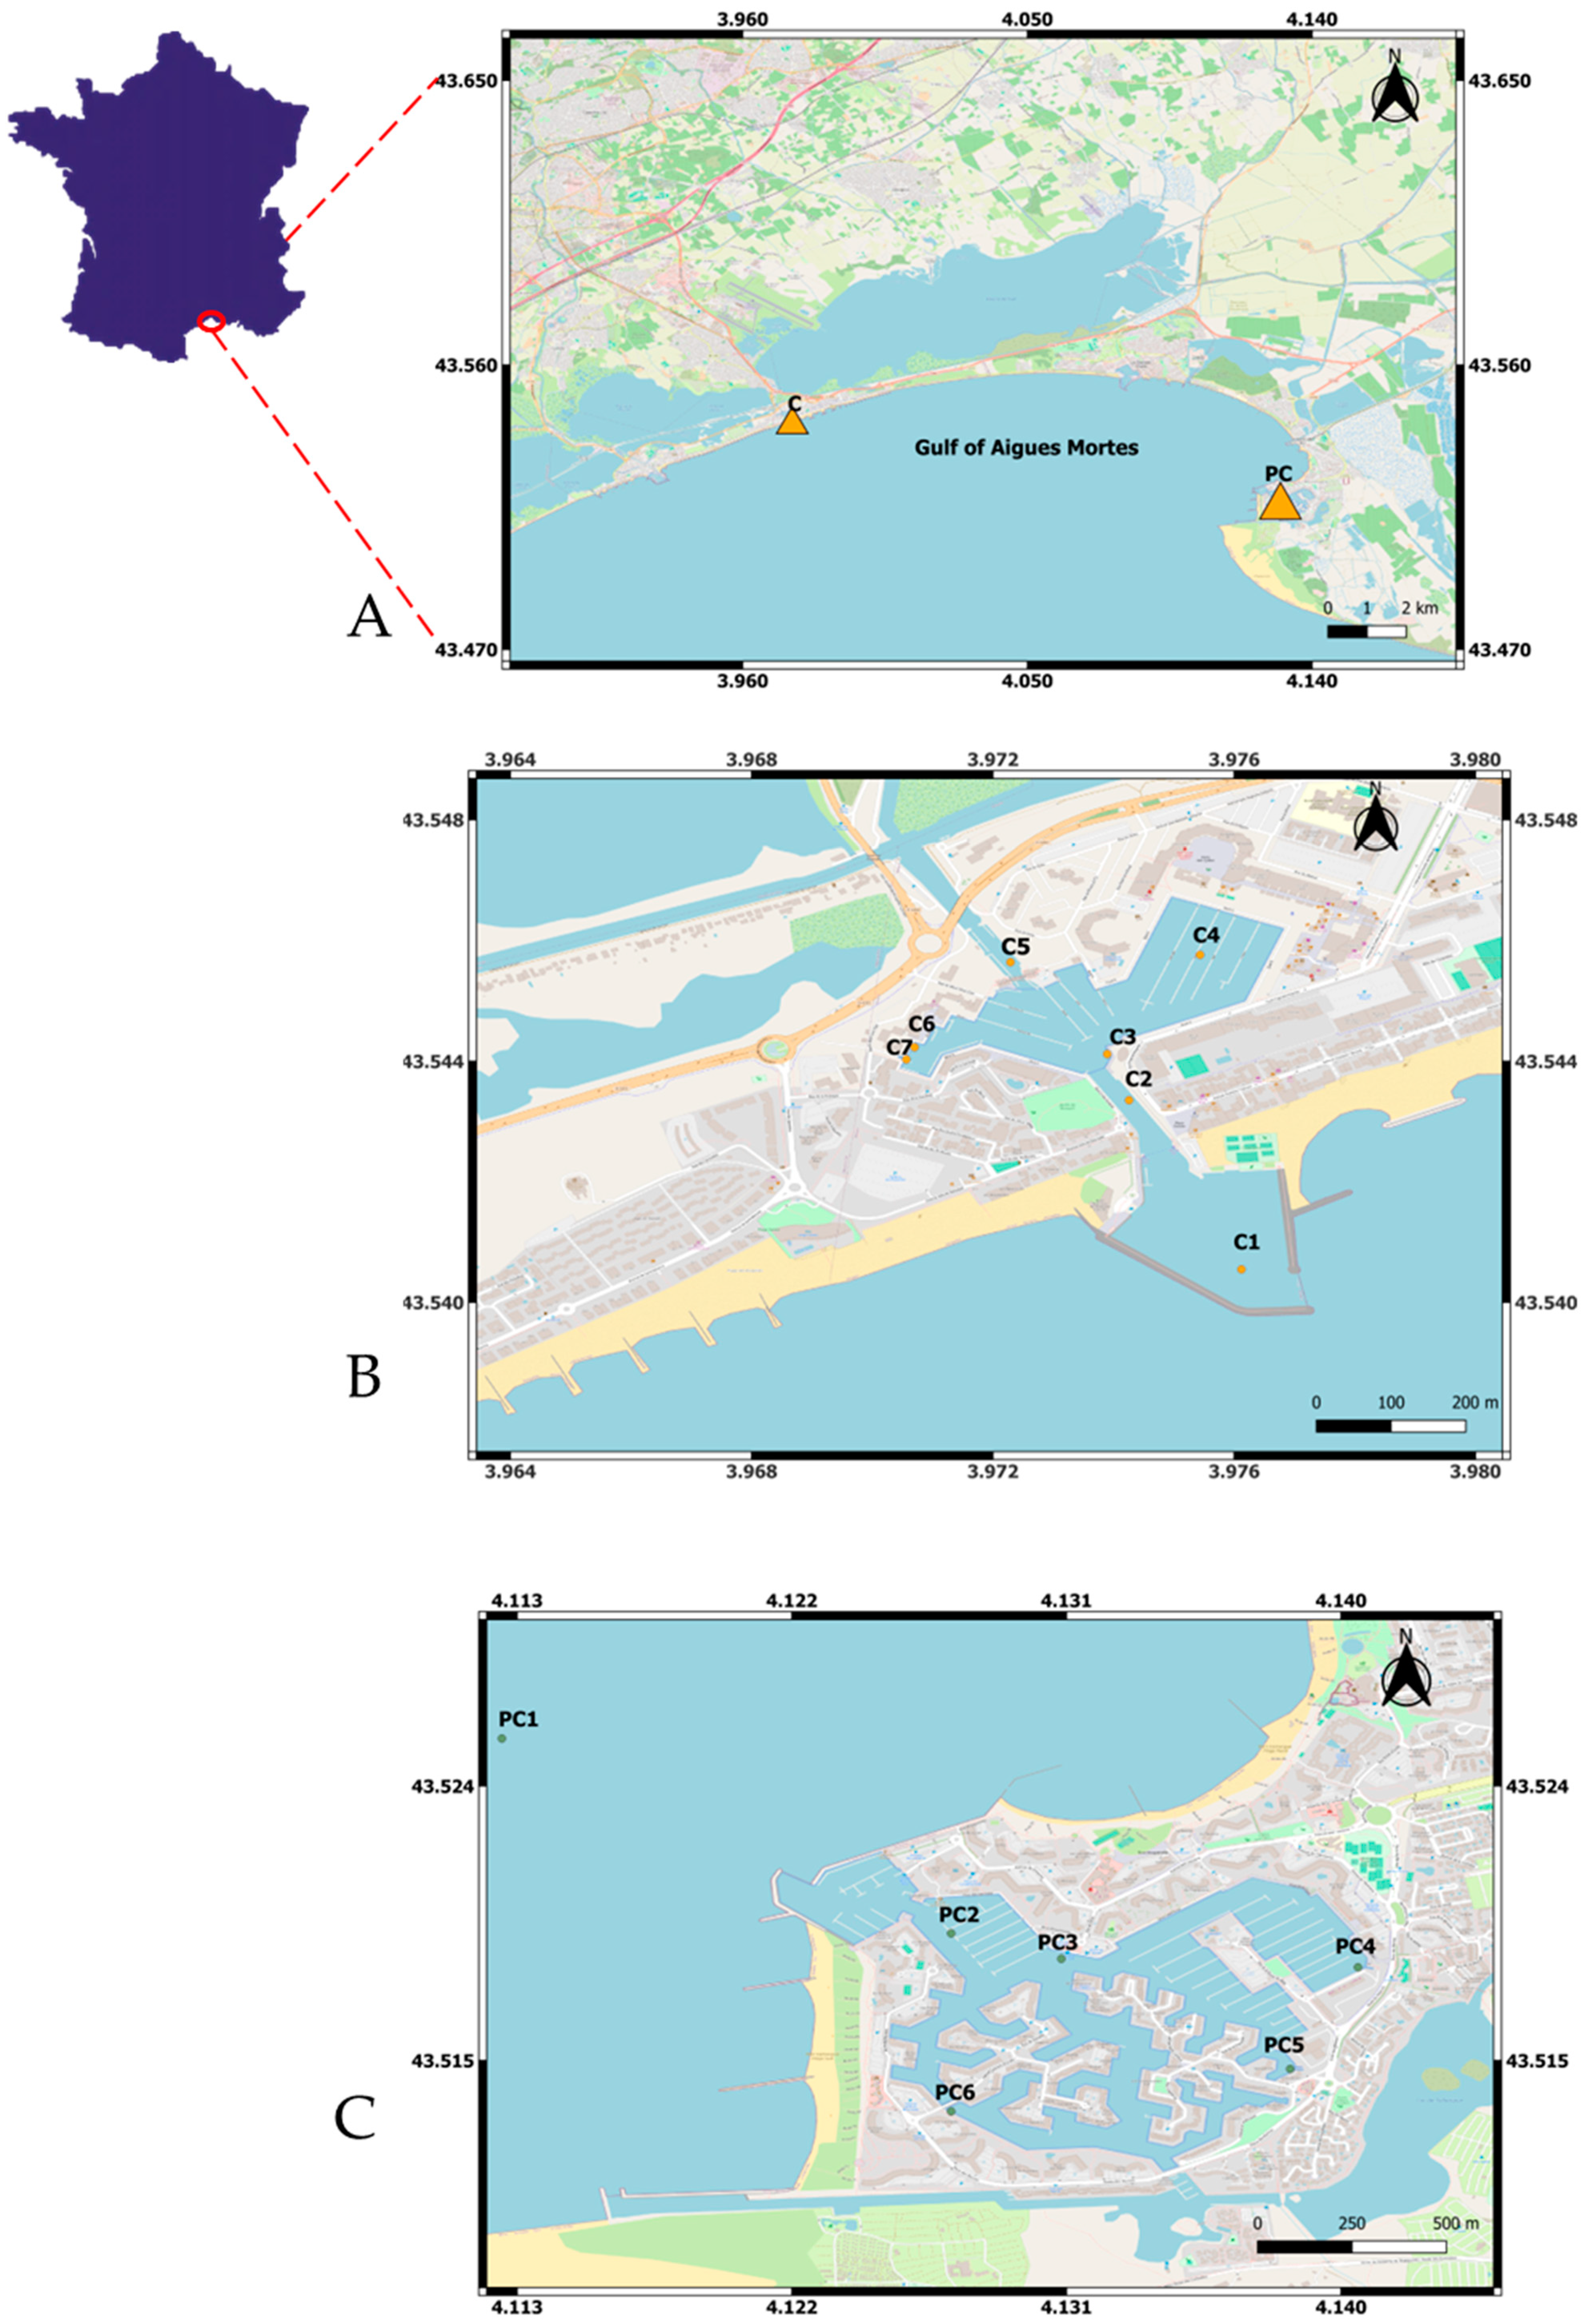
2.1. Study Areas

The Gulf of Aigues-Mortes (GAM) is located in the French Mediterranean region along the Languedoc coast (Figure 1). The particularity of the Languedoc coast lies in the lidos situated between vast lagoons with high heritage and ornithological values, salt marshes suitable for the reproduction of most limicoline birds, and rich fish-filled coastal waters. This coastline is one of the richest in Europe for these species [34]. The GAM is located in a Natura 2000 area, under the Gulf of Lion entity. The Natura 2000 network is at the heart of the European Union’s nature conservation policy to halt the erosion of biodiversity. The network aims to ensure the long-term survival of particularly endangered species and habitats with high conservation value in Europe. Tourist traffic and intense leisure activities, in particular motorised boating, generate considerable nuisance and are a major cause of fragility in the Natura 2000 areas identified. The GAM includes eight marinas, two of which were studied in this project: the Port Carnon (Carnon city) and Port Camargue (Grau-du-Roi city).

2.1.1. Port Carnon

Port Carnon (hereafter referred as C) is in the GAM, at the gateway to Little Camargue, in the heart of a lively year-round seaside resort. Located at a latitude of 43°32′32.09′’ N and a longitude of 3°58′29.94′’ E, on the shores of the Mediterranean, it is bordered by a channel (Rhone to Sète channel) and a pond (Etang de l’Or). It has 850 moorings afloat. Annual parking in ‘‘storage on land’’ on 3 levels for motorboats, and a dinghy park for light sailing, are also available. The onshore storage is designed to accommodate motorboats up to 5.90 m. The careening area is located on Carnon West (Station C7, Figure 1B). For large sail boats like catamarans, places on the outer harbour are dedicated to them (Station C4, Figure 1B).

2.1.2. Port Camargue

Port Camargue (hereafter referred as PC) is a district of the municipality of Grau-du-Roi in the GAM. It is located at 43°31′20.83′’ N longitude and 4°7′50.3′’ E latitude, between the point Espiguette and the port of Grau-du-Roi in the east of the Gulf of Lion. It is one of the biggest marinas in Europe, and has a capacity of 5000 moorings, including 2761 in public harbours and 2239 in marinas [19], Figure 1C. PC has a technical platform comprising three areas covering 4.5 hectares, including three careening areas, two quays (station PC5, Figure 1C) and one quay (station PC4, Figure 1C).

2.2. Sediment and Seawater Sampling Campaigns and Sample Pre-Treatment

2.2.1. Description of Sampling Campaigns

Samples were collected at seven stations in Port Carnon (C1 to C7) and six stations at Port Camargue (PC1 to PC6) (Figure 1, Table 1).
Spatial sediment sampling campaigns were conducted in both ports, with surface sediments collected in triplicate at stations C1 to C7 on 15 September 2021, in Port Carnon, and at stations PC1 to PC6 on 14 May 2018, for Port Camargue.
For the water column, spatiotemporal sampling campaigns were carried out over one year for each port. Sixteen water sampling campaigns occurred in both harbours from September 2021 to September 2022, covering the seven stations in Port Carnon (C1 to C7) and the six stations in Port Camargue (PC1 to PC6) (Figure 1). The samples were taken monthly from September to April, and then bi-weekly from May to August, aligning with the period marked by heightened internal port activities such as boat maintenance, dry docking, nautical events, and increased tourist traffic (Table 1).

2.2.2. Surface Sediment Sampling and Characterisation

Surface sediment samples were collected with a Van Veen grab (stainless steel) with a penetration of 30 cm and a collected volume of around 75 L.
For many environmental concerns and in response to regulatory programmes, guidelines or recommendations were established both at the national and international levels. They include determinations of sediment contaminants in the context of extraction of dredged materials, cleanup of industrial and municipal sites, ecological or human risk, fish tissue contamination, classification of problem sites, and beneficial use impairment [35]. Guidelines were developed by the US National Oceanic and Atmospheric Administration (NOAA) [36]. The potential toxicity of port sediment was evaluated based on the concentrations of trace metal elements and organotin, using sediment quality guidelines established by Long et al. [36] and Thompson and Wasserman [37]. Different levels were defined, including the effects range–low (ERL), which denotes the concentration below which adverse effects are rare, and the effects range–median (ERM), representing the concentration above which effects are expected to occur frequently.
Granulometry distribution of the sediments was measured with a Beckman Coulter® particle size analyser (LS 13 320) using the principle of diffraction and scattering of a laser beam striking a particle. The interactions between light (laser) and matter help to estimate the granulometric proportions.

2.2.3. Water Sampling

Surface water samples were filtered on site through 0.22 µm acetate cellulose filters and acidified with ultrapure nitric acid (Merck Chimie SAS, Fontenay sous Bois, France) in the field.
At each sampling site, physico-chemical parameters of water (temperature, pH, dissolved oxygen concentration, salinity, turbidity) were systematically measured within the first metre with multiparameter portable probes (HACH® (Hq40d) LDO101, pHC301, and CDC40101s).

2.3. Chemical Analyses

2.3.1. TME Analysis

Surface sediments were first freeze-dried in a Crios −50 °C bench-top apparatus (CRYOTEC®, Saint-Gély-du-Fesc, France) and then ground in a vibratory shredder (MM 400 Retsch®, Eragny, France) equipped with a zirconium oxide grinding bowl (25 mL) with a grinding ball (zirconium oxide—Ø 10 mm). Sediment samples were digested using a mixture of HF/HNO3 Suprapur® acids (Merck Chimie SAS, Fontenay sous Bois, France). Digestion was carried out in a microwave oven (Ultrawave, Milestone®, Sorisole, Italy) [29]. After evaporation, TME concentrations were measured using Inductively coupled plasma mass spectrometry quadrupole (ICP-MS-Q), iCAP-Q (Thermo FisherScientific®, Illkirch, France) equipped with high matrix interface.
Water samples were diluted with nitric acid (HNO3 20% v/v) in a clean room. The quantification of TMEs was carried out by inductively-coupled plasma mass spectrometry (ICP-MS) (iCAP-Q, Thermo FisherScientific®, Illkirch, France). TME analyses were carried out using the AETE-ISO platform (OSU-OREME—Observatory for the Sciences of the Universe-Observatoire de recherche méditerranéen de l’environnement, Montpellier, France), which houses a clean room for sample pre-treatment and preparation for ICP-MS analysis with controlled pressure, temperature, and humidity. This clean room satisfies all standard requirements [38].

2.3.2. Butyltin Measurements

As previously described in Briant et al. [30], sediments were gently extracted using glacial acetic acid under agitation for one night. The speciation analysis of organotin compounds (monobutyltin (MBT), dibutyltin (DBT), and tributyltin (TBT)) in acidic sediment extracts and water samples was performed by coupling a gas chromatograph (Focus TRACE 1300 GC Thermo Fisher Scientific®, Illkirch-Graffenstaden, France) to an inductively-coupled plasma mass spectrometer (ICP-MS X Series II-Thermo Fisher Scientific®).
The samples were derivatised (ethylation) and preconcentrated with solid-phase microextraction (SPME). For the butyltin species, the limit of detection was on the order of 0.012 ng(Sn) L−1 [21]. The accuracy and the precision of the methods were validated using two certified reference materials: CASS-6 Nearshore Seawater Certified Reference Material for Trace Metals and other Constituents and PACS-3 Marine Sediment Certified Reference Material for total and extractable metal content and organotin (National Research Council Canada). No reference material is available to validate speciation analyses of organotins in aqueous samples.
Numerous research investigations have employed the butyltin degradation index (BDI) as a proxy to assess the environmental fate and breakdown of TBT [19]. This index, defined as BDI = ([MBT] + [DBT])/[TBT], was used to interpret the data acquired in this study.

2.4. Statistical Analysis

Differences in the chemical environment between stations were estimated by principal component analysis (PCA) with R studio scripts (version R4.2.2). Two-way analysis of variance (ANOVA) was performed to test the null hypothesis that there was no significant difference between sites. A posteriori paired multiple comparisons were then performed using the Tukey honestly significant difference test (HSD). ANOVA tests and Tukey’s HSD tests were carried out with the level of significance set at p < 0.05.

3. Results and Discussion

3.1. Sediments

3.1.1. General Characteristics of Sediments

The granulometry distribution of sediments (Table S1) in the two ports showed that the predominant fraction in surface sediment was fine sand, silt, and clay fractions (grain size < 250 µm) for Port Carnon (C) harbour and fine silt and clay fraction (grain size < 63 µm) for Port Camargue (PC) harbour. The Al contents varied between 4.2% and 5.5%, but the highest levels (5.3–5.5%) were measured in C harbour (Table S1). The Fe contents ranged from 1.6% to 3.2% with the highest values measured in C harbour (Table S1). As measured for Fe and Al, terrigenous elements (Cs, Li, and Rb) were significantly (p < 0.05) greatest in C harbour. Both harbours exhibited distinct sediment characteristics, suggesting differences in hydrodynamic regimes and connections with their respective watersheds [39,40]. The dominance of fine fractions in C harbour might favour contaminant accumulation in the sediment [31,32], bearing in mind that sediment contamination is also controlled by the supply of contaminants from the water column.

3.1.2. Trace Metals and Organotins in the Sediments

TME concentration in sediment strongly varied between the two harbours and within each harbour (Table 2). The most contaminated sites were observed near the technical zones (PC4–PC5 and C7) while the reference sites (PC1 and C1), as a general rule, exhibited the lowest TME concentrations. In the technical zones of PC harbour, Ni concentrations were above the ERM levels, while Cu was above these thresholds in both technical zones. The occurrence of high concentrations of Cu in the technical zones can be explained by the use of antifouling paints with Cu used as biocide in replacement of the banned TBT [41]. Cu metal concentration was significantly (p < 0.05) higher in PC harbour, although the sediment granulometry observed in C harbour might favour metal accumulation (see above). These differences might be explained by the activity in both harbours, with five times more mooring capacity in PC harbour relative to C harbour. Ebeid et al. [40] also observed strong Cu contamination in Egyptian harbours, with concentrations above 1000 mg kg−1, similar to those measured in PC harbour in the technical zone. The copper concentrations measured in the two studied ports are higher than those measured in the marina at Monastir. This marina, which is home to 400 international pleasure craft and is characterised by medium-grade sand, has copper concentrations ranging from 34.10 to 63.8 µg/kg [42]. Interestingly, organotin concentrations exhibited the same patterns (Table 2) as those observed for Cu, with organotin concentrations (TBT, DBT, and MBT) in the technical zones (PC4–PC5) of PC being up to 20 times more than those measured in C (C7). It is worth noting that all stations exhibited the presence of organotins, even at the reference stations (C1 and PC1). This is a clear indication of the strong anthropogenic pressure exerted on these ecosystems, bearing in mind that butyltins are only of anthropogenic origin. The concentrations of TBT measured in the present study are on the same order of magnitude of those recently observed in Mediterranean harbours after the TBT ban in 2008 [43], while strong accumulation up to 18,000 ng g−1 were measured in the Barcelona harbour in the years 1995–2000 [19]. The strong contamination of Ni observed in PC harbour, especially at stations PC3 and PC6, confirms the high anthropic pressure exerted in this ecosystem. Indeed, while Ni in aquatic sediments occurs naturally, as suggested by Bibi et al. [44] high contamination in marine ecosystems can be attributed to anthropogenic sources and domestic wastes. Strong accumulation of Ni has also been observed in other Mediterranean harbours with concentrations up to 200 ppm, similar to those observed in PC harbour [4].
A BDI value exceeding 1 suggests ongoing processes of TBT transformation by debutylation with a potential gradual decrease in TBT concentration with time. In contrast, a BDI below 1 suggests either low kinetics of degradation leading to the persistence of TBT relative to its degradation products or a possible supply of TBT in the systems through its use as an antifouling paint despite its ban in 2008 [45]. Interestingly, the BDI of both technical zones was lower than 1, suggesting a slow gradual degradation of the accumulated TBT and a possible supply of TBT antifouling paint during careening operations. In contrast, at the other stations BDI, was always greater than 1, suggesting a gradual decrease in the accumulated TBT through MBT and DBT (Table 2).
The strong sediment contamination of the technical zones in PC harbour was confirmed by the PCA clustering (Figure 2). The first two axes explained more than 85% of the variance observed. Three distinct clusters can be distinguished. The first one along axis 1 grouped stations of C harbour (C3 to C7) with Ni and terrigenous TMEs (Al, Fe, Rb, and Cs) as positive structuring factors as well as very fine particles (2 µm and 63 µm). The second cluster grouped stations in PC harbour, except those in the technical zone, together with C1 and C2 of Port Carnon harbour. This cluster was negatively structured by As, Pb, Cd, and Cr. Lastly, the third cluster included the two stations of the technical zone in PC harbour, with TBT, DBT, MBT, and Cu as positive structuring factors.

3.2. General Quality Features of the Water Column

3.2.1. Physico-Chemical Parameters

The 16 sampling campaigns took place over one year, spanning from September 2021 to September 2022. Trends for pH, temperature in °C, salinity, and dissolved oxygen are summarised in Figure S1. Temperatures varied from 7.5 °C to 29.4 °C in PC harbour and from 6.2 °C to 28.2 °C in C harbour. No significant variations for T°C and pH between both harbours were observed. In contrast, for salinity and dissolved oxygen, PC harbour exhibited significantly (p < 0.05) higher values for both parameters, with values ranging from 27.8 psu to 41.6 psu and from 66.8% to 143% for salinity and oxygen, respectively. For C harbour, station C6 exhibited the most important temporal variations, while the reference station at the main entrance (C1) showed a lower variability. For PC harbour, the reference station also showed lower variability than stations located farther inland from the marina.
PCA performed with the environmental variables showed a clear separation of both harbours (Figure 3). The two first axes explained more than 65% of the variance observed. Two clusters can be identified: the first includes all the stations of PC harbour with oxygen as the positive structuring factor, and to a lesser extent, salinity. The second cluster contains the stations of C harbour, except for reference station C1 that is located in between the two clusters, with dissolved oxygen as a negative structuring factor. This clustering with environmental variables agrees with what can be observed with terrigenous TMEs measured in the sediment (see above), suggesting differences in the hydrodynamic regimes of the two harbours. Through its connection with the surrounding lagoons, C harbour exhibits greater environmental variation and higher terrigenous TME supplies.

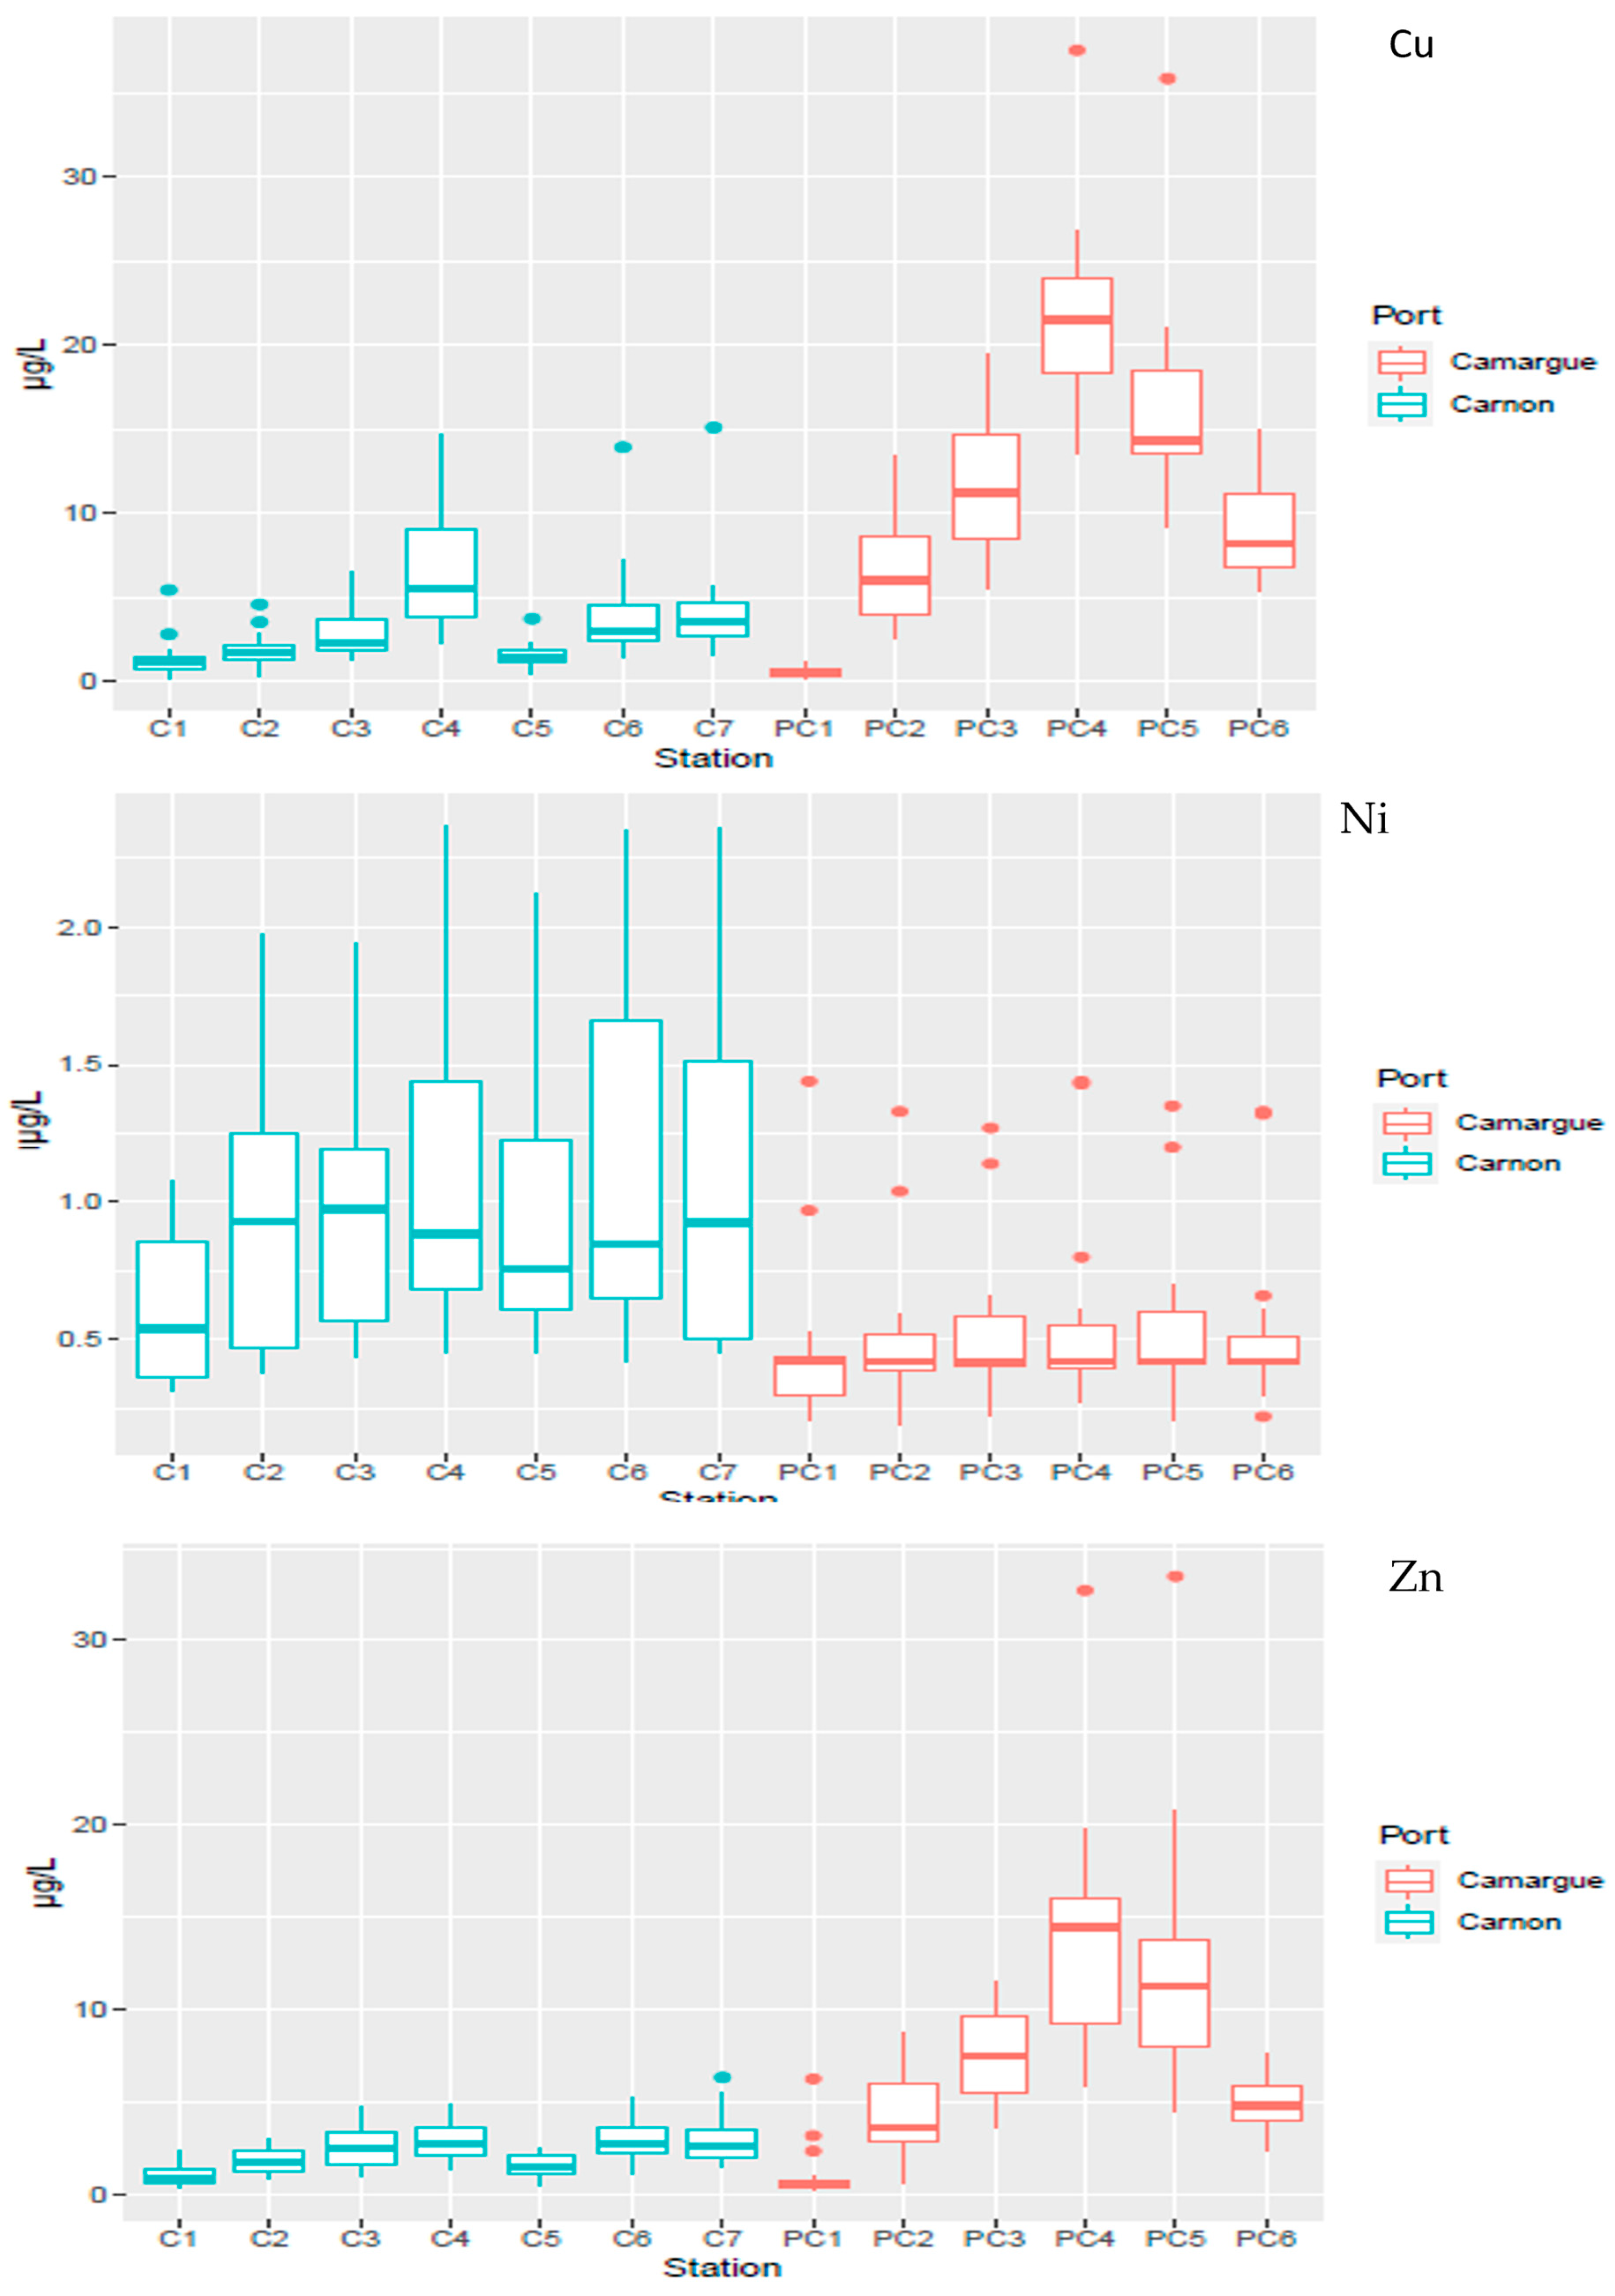
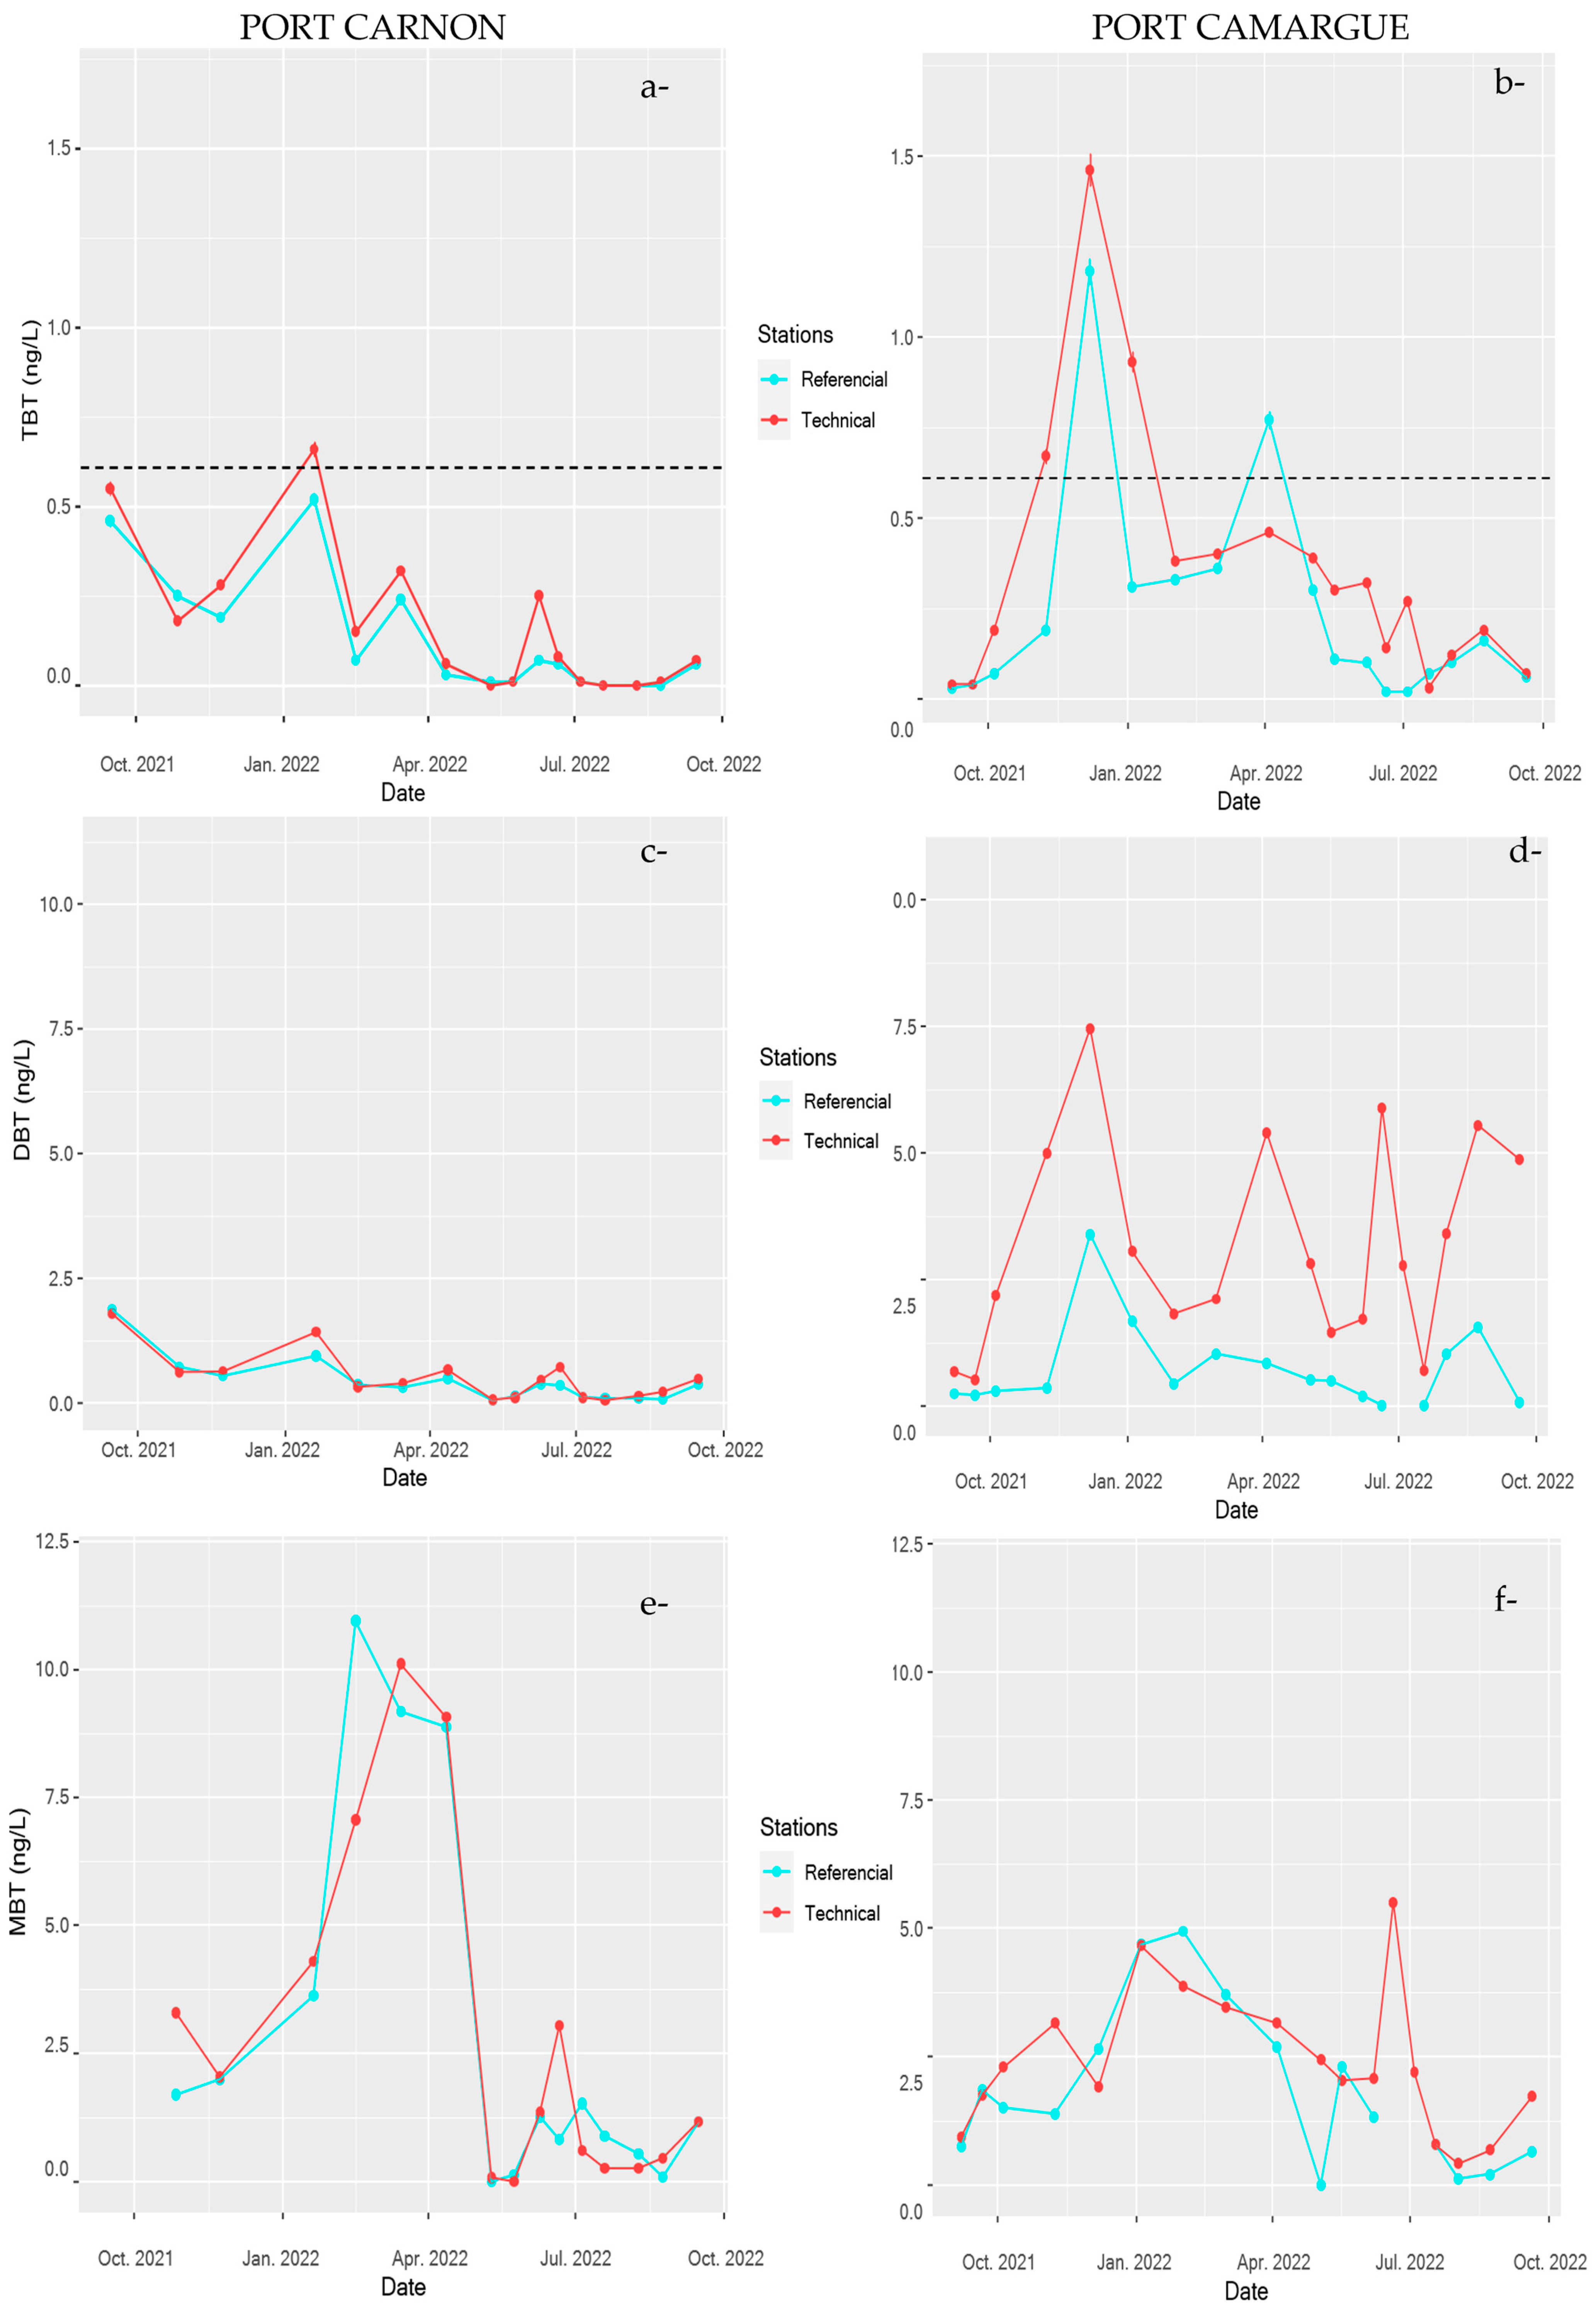
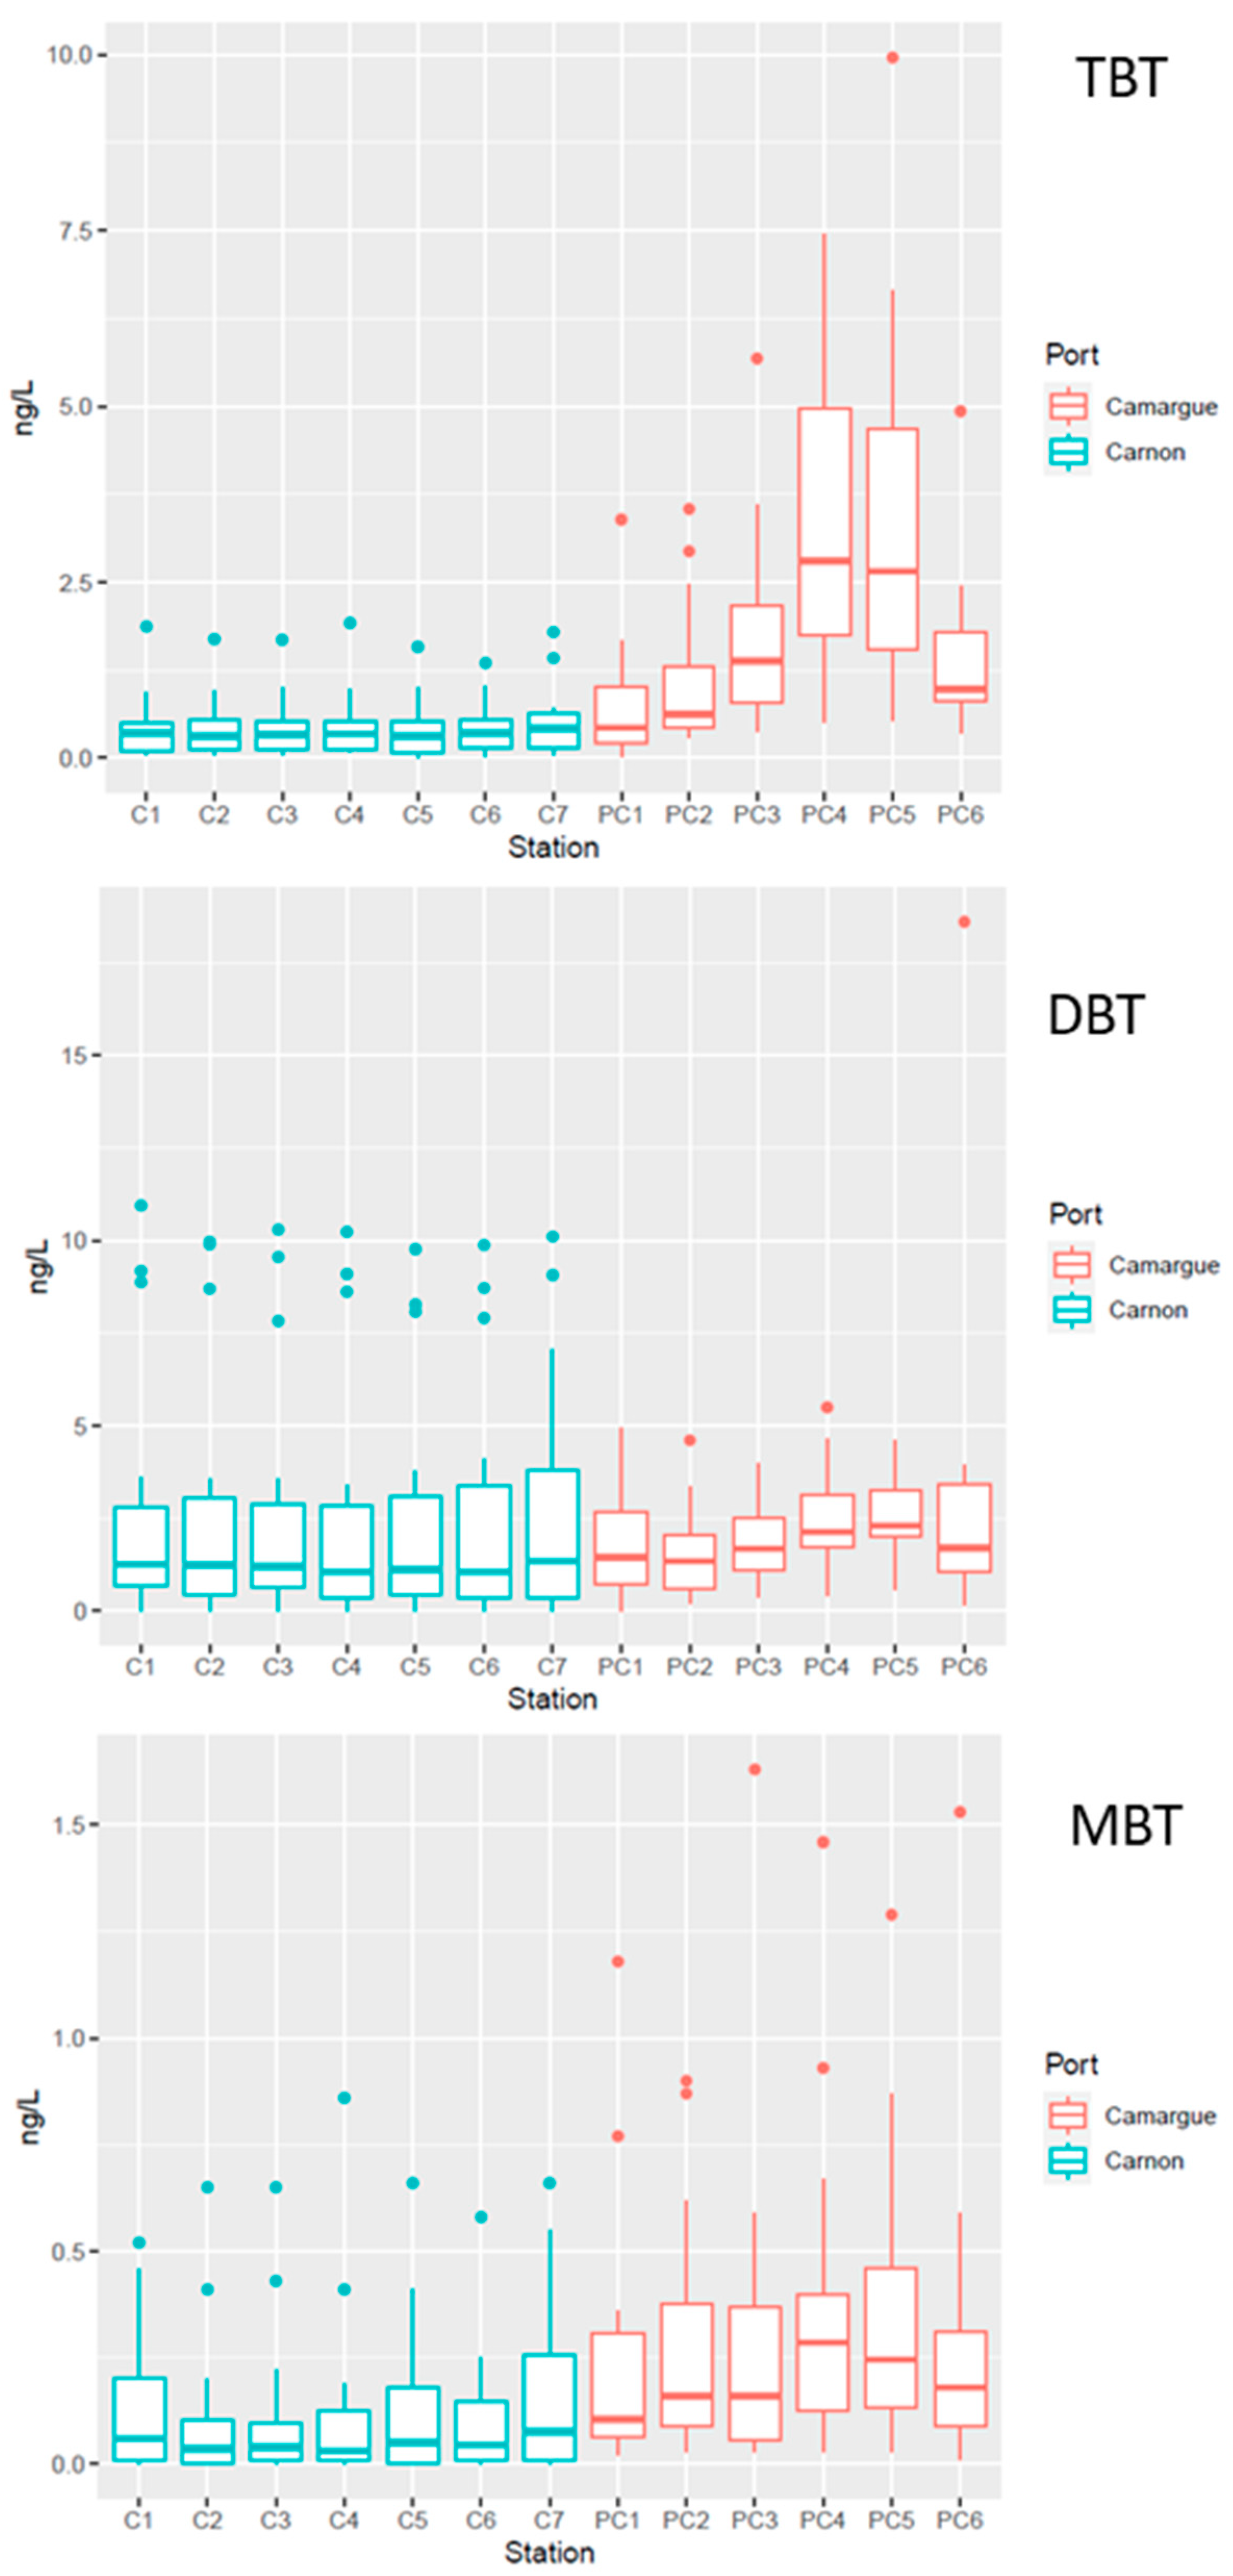
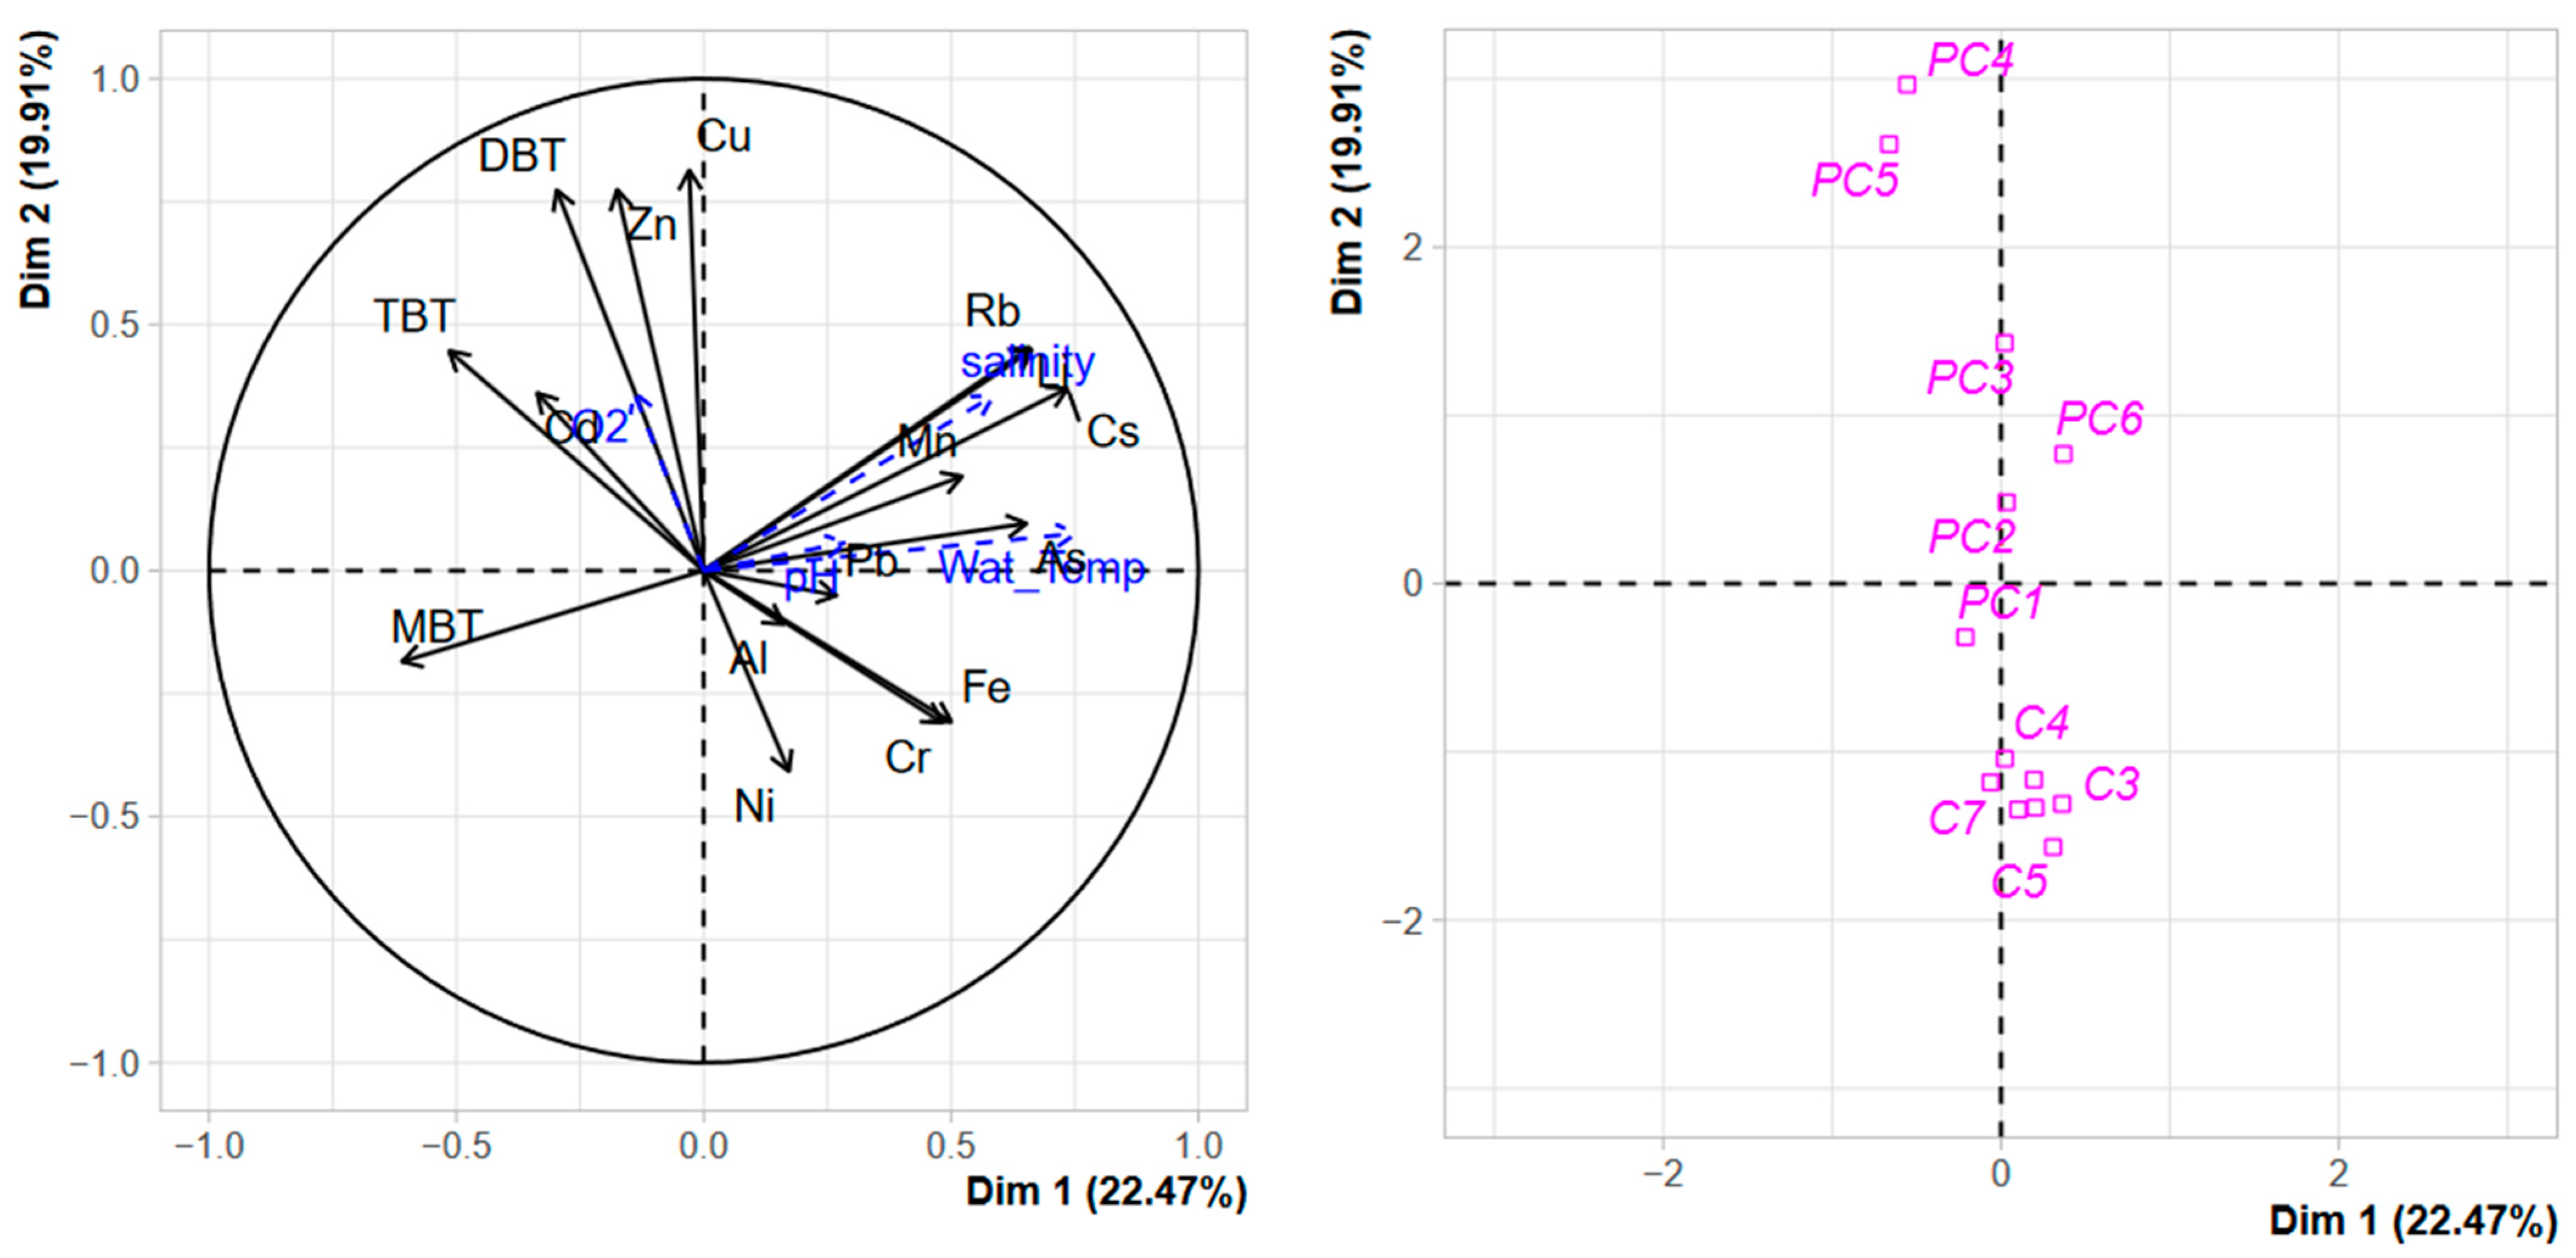
3.2.2. Temporal and Spatial Distribution of Contaminants in the Water Column

The temporal dispersion of TME concentrations as a function of the spatial distribution is presented in Figure 4 and Figure 5 for Cu, Ni, and Zn and in Figure S2 for the other TMEs (As, Cd, Cr and Pb). As observed for sediment, significantly (p < 0.05) higher dissolved concentrations for Cu and Zn were observed in PC harbour relative to C harbour. Within each harbour, the technical zone showed the highest concentrations of Cu and Zn, with values up to 37.6 µg L−1 and 33.5 µg L−1 in PC harbour, respectively.
The technical stations also exhibited the highest temporal variations (Figure 5) for Cu and Zn relative to the reference stations (C1 or PC1). Concentrations peaked during May 2022 for C harbour, at 15 µg L−1 and 6.2 µg L−1 for Cu and Zn, respectively, compared to 2.1 µg L−1 and 1.9 µg L−1 observed two weeks before for Cu and Zn, indicating a very dynamic system. In PC harbour, the dynamics were less pronounced, with concentrations that did not fluctuate strongly with time, except during October 2021 where a concomitant peak was detected for both TMEs with concentrations representing up to 2 to 3 times the average concentration observed during the one-year survey.
For the organotins, the temporal dispersion of TBT, DBT, and MBT concentrations as a function of the spatial distribution is presented in Figure 6 and Figure 7. As observed for Cu and Zn, concentrations of TBT were significantly higher in PC harbour. Nevertheless, in contrast to what was observed for Cu and Zn, TBT did not show a significant difference between stations in both harbours. Dissolved concentrations of TBT in the technical zone were not significantly different from those observed in the other parts of the harbour, while concentrations measured in the sediment clearly reflected spatial differences between stations for the organotins, with strong accumulation in technical zones (see Table 2). Moreover, in both systems, TBT temporal dynamics were strongly marked (Figure 7). Interestingly, the temporal dynamics observed in the reference station were similar to those observed in technical zones, suggesting that the dynamics are probably not related to the harbour marine activity itself but rather to transformation processes that affect TBT fate within the water column [48,49].
DBT dynamics were strongly pronounced in the technical zone of PC harbour where concentration peaked up to 10 ng L−1 in September 2022 (Figure 7). In contrast, for C harbour, DBT concentration did not exhibit important temporal variations even in the technical zone; moreover, concentrations were relatively similar irrespective of the station, with an average value around 0.5 ng L−1. The temporal dynamics of MBT were relatively comparable to what was observed for TBT in both harbours; however, no significance difference in TBT contamination between both systems was observed.
Environmental quality standards (EQS) were defined by the European Water Framework Directive (EWFD) in the 2008/105/EC Directive [46] and in the French decree of July 27, 2015 [47]. The European Water Framework Directive (EWFD) defines environmental quality standards (EQS) based on the level of contamination in the water column for certain TMEs and for TBT. For Cu, Zn, and TBT, the maximum concentration allowed by EWFD is 1.6 µg L−1, 3.1 µg L−1, and 0.61 ng L−1, respectively. When the contaminant concentration is above this threshold, acute toxic effects can be observed [50]. The one-year survey with 16 sampling campaigns allowed the identification of a number of cases where the contaminant concentration was above the EQS as a function of the sampling stations (Table 3).
Interestingly, concentrations of Cu and Zn were almost always (except for PC1) above the EQS in PC harbour, in particular, close to the technical zone, but also in the other stations in the marina. Nevertheless, Cu at the reference station (PC1) was always below EQS, and only 11% cases above EQS were observed for Zn, suggesting a low impact of this contaminated environment on the surrounding open sea. For TBT, the situation is less critical, with most cases (22.2%) observed in the technical zone, while at other stations, dissolved TBT concentrations were most often below the EQS. For Port Carnon harbour, the situation within the harbour itself is less critical for Zn and TBT, but Cu contamination showed recurring excesses even at the reference station. These differences can be explained by the hydrodynamics regime of both ecosystems. PC harbour is a semi-enclosed system, while C harbour is strongly connected to its watershed lagoons and to the open sea through a large canal (Figure 1B).
The water concentrations of TMEs, and more particularly for Ni, Cu, and Zn, observed in both harbours are in the same range as those observed in similar Mediterranean ecosystems. For instance, Guerra-García et al. [4] reported dissolved concentrations of up to 20 µg L−1 and 30 µg L−1 for Cu and Zn, respectively, in Spanish harbours. Similarly, Morsy et al. [51] observed roughly the same level of contamination for theses TEMs. Nevertheless, the added value of the present study compared to these previous works is the regular monitoring that allows identifying the temporal dynamics of these contaminants and the periods with potential acute toxicity, bearing in mind that TME water contamination in anthropic systems can be subjected to strong temporal variations [52].
For organotins, the literature documenting TBT contamination in water columns after its ban in 2008 is scarce, especially in Mediterranean ecosystems, with efforts being concentrated on sediment study. Concha-Graña et al. [45] reported concentrations of TBT, DBT, and MBT below 5 ng L−1 in Spanish harbours for the three organotins. As observed in the present study, a strong temporal variation of organotins was detected with higher concentrations in spring relative to autumn [45]. Furdek et al. [53] reported organotin contamination on the Croatian Adriatic coast, with concentrations ranging from 1 to 10.3 ng L−1 for TBT. Relatively high variations in BuT concentrations were found between the different marinas. However, these variations were not related to the marina size (defined by the number of berths) but rather to the location of the marina (the degree of sheltering from wind and wave action) and the efficiency of the water exchange [53]. Older studies (published before 2008) reported much higher concentrations of organotins in the water column, with concentrations up to 100 ng L−1 in a Spanish marina [54] or in the Alexandria harbours [55].
The PCA performed on dissolved TMEs and organotin concentrations in the water column (Figure 8) confirmed what was observed with sediment contamination, a clear separation of both harbours along the second axis confirmed that both systems were strongly different. Nevertheless, while for sediment contamination, the most contaminated sites of PC (the technical zones) were clearly separated from the other stations due to the strong accumulation of organotins (Figure 1). For the water column, this structuration is less evident, although a gradient of contamination could be observed along the second axis with DBT, Cu, and Zn as structuring factors. The role of dissolved TME concentration as structuring factors in anthropic coastal areas is largely documented [56,57], with the main structuring TMEs being dependent on the nature of the anthropic pressure in the surrounding watershed. The differences observed between the harbour structure assessed from sediment contamination and the harbour structure assessed from water contamination confirm the requirement of combining a one-off contamination sediment assessment with regular water monitoring in order to (i) better understand the functioning of these complex coastal environments and (ii) better appreciate the ecotoxicological risk associated with the contamination observed in harbour systems.

4. Conclusions

The aim of this study was to assess the added value of spatiotemporal monitoring of TMEs and organotin compounds for understanding seawater quality trends compared to one-off sediment assessments. For that purpose, two marinas located in the Mediterranean Sea with different morphologies and structures were monitored over one year with regular water sampling, with particular attention to TMEs and organotins. One-off sediment contamination assessment, as well as regular water monitoring, clearly showed that both harbours exhibited important differences in TMEs and organotin contamination. The biggest, but also the least open to the sea (Port Camargue), contained the most contaminated sediment, notably in the technical zone, revealing concentrations of Cu, Zn, and TBT surpassing the effects range-median (ERM), while other marina stations generally stayed below this threshold. Spatiotemporal water monitoring highlighted concentrations above environmental quality standards (EQS) in all stations of the larger marina, with a notable temporal dynamic for TBT and Cu. Conversely, the open marina, connected to the open sea, rarely exhibited concentrations above EQS in water, despite sediment concentrations occasionally exceeding ERM values. This underscores that risk assessment in these ecosystems cannot rely solely on sediment characterisation, and that regular monitoring of contaminants allows a complementary assessment.

Supplementary Materials

The following supporting information can be downloaded at: https://www.mdpi.com/article/10.3390/jmse12030399/s1, Table S1: Concentrations of major elements and terrigenous elements in sediments of Port Carnon and Port Camargue for the composition < 2 mm fraction. Figure S1: Boxplots of physicochemical parameters in Port Carnon (C blue color) and Port Camargue (PC red color). Figure S2: Box plots of TME concentrations As (a), Cd (b), Cr (c) and Pb (d) in samples of sea water of Port Carnon (C blue color) and Port Camargue (PC red color).

Author Contributions

Conceptualization, C.M., C.C. and O.P.; methodology, S.D.; validation, C.M., O.P. and C.C.; formal analysis, M.M., L.C. and R.F.; investigation, C.M. and O.P.; resources, C.M. and O.P.; data curation, M.M., C.C. and A.D.; writing—original draft preparation, C.C.; writing—review and editing, C.M. and O.P.; supervision, C.M. and O.P.; project administration, C.M.; funding acquisition, C.M. All authors have read and agreed to the published version of the manuscript.

Funding

This study was supported by the READYNOV Project, funded by the regional council of Occitania. This work was co-funded by the Labex DRIIHM, French programme “Investissements d’Avenir” (ANR-11-LABX-0010) which is managed by the French ANR.

Institutional Review Board Statement

Not applicable.

Informed Consent Statement

Not applicable.

Data Availability Statement

The data presented in this study are available upon reasonable request to the corresponding author.

Acknowledgments

English grammar and syntax of the manuscript were revised.

Conflicts of Interest

The authors declare no conflicts of interest. The funders had no role in the design of the study; in the collection, analyses, or interpretation of data; in the writing of the manuscript; or in the decision to publish the results.

References

  1. Labonne, M.; Ben Othman, D.; Luck, J.-M. Pb Isotopes in Mussels as Tracers of Metal Sources and Water Movements in a Lagoon (Thau Basin, S. France). Chem. Geol. 2001, 181, 181–191. [Google Scholar] [CrossRef]
  2. Choueri, R.B.; Cesar, A.; Abessa, D.M.S.; Torres, R.J.; Riba, I.; Pereira, C.D.S.; Nascimento, M.R.L.; Morais, R.D.; Mozeto, A.A.; DelValls, T.A. Harmonised Framework for Ecological Risk Assessment of Sediments from Ports and Estuarine Zones of North and South Atlantic. Ecotoxicol. Lond. Engl. 2010, 19, 678–696. [Google Scholar] [CrossRef]
  3. Briant, N.; Elbaz-Poulichet, F.; Freydier, R.; Bancon-Montigny, C.; Delpoux, S. Deciphering As and Cu Cycling in Sediment Pore Waters in a Large Marina (Port Camargue, Southern France) Using a Multi-Tracer (Fe, Mn, U, Mo) Approach. Appl. Geochem. 2016, 66, 242–249. [Google Scholar] [CrossRef]
  4. Guerra-García, J.M.; Navarro-Barranco, C.; Martínez-Laiz, G.; Moreira, J.; Giráldez, I.; Morales, E.; Fernández-Romero, A.; Florido, M.; Ros, M. Assessing Environmental Pollution Levels in Marinas. Sci. Total Environ. 2021, 762, 144169. [Google Scholar] [CrossRef] [PubMed]
  5. Gómez, A.G.; Valdor, P.F.; Ondiviela, B.; Díaz, J.L.; Juanes, J.A. Mapping the Environmental Risk Assessment of Marinas on Water Quality: The Atlas of the Spanish Coast. Mar. Pollut. Bull. 2019, 139, 355–365. [Google Scholar] [CrossRef] [PubMed]
  6. Naser, H.A. Assessment and Management of Heavy Metal Pollution in the Marine Environment of the Arabian Gulf: A Review. Mar. Pollut. Bull. 2013, 72, 6–13. [Google Scholar] [CrossRef] [PubMed]
  7. Couet, D.; Pringault, O.; Bancon-Montigny, C.; Briant, N.; Elbaz Poulichet, F.; Delpoux, S.; Kefi-Daly Yahia, O.; Hela, B.; Charaf, M.; Hervé, F.; et al. Effects of Copper and Butyltin Compounds on the Growth, Photosynthetic Activity and Toxin Production of Two HAB Dinoflagellates: The Planktonic Alexandrium Catenella and the Benthic Ostreopsis Cf. Ovata. Aquat. Toxicol. 2018, 196, 154–167. [Google Scholar] [CrossRef] [PubMed]
  8. Vithanage, M.; Bandara, P.C.; Novo, L.A.B.; Kumar, A.; Ambade, B.; Naveendrakumar, G.; Ranagalage, M.; Magana-Arachchi, D.N. Deposition of Trace Metals Associated with Atmospheric Particulate Matter: Environmental Fate and Health Risk Assessment. Chemosphere 2022, 303, 135051. [Google Scholar] [CrossRef]
  9. Bastami, K.D.; Afkhami, M.; Mohammadizadeh, M.; Ehsanpour, M.; Chambari, S.; Aghaei, S.; Esmaeilzadeh, M.; Neyestani, M.R.; Lagzaee, F.; Baniamam, M. Bioaccumulation and Ecological Risk Assessment of Heavy Metals in the Sediments and Mullet Liza Klunzingeri in the Northern Part of the Persian Gulf. Mar. Pollut. Bull. 2015, 94, 329–334. [Google Scholar] [CrossRef]
  10. LeMonte, J.J.; Stuckey, J.W.; Sanchez, J.Z.; Tappero, R.; Rinklebe, J.; Sparks, D.L. Sea Level Rise Induced Arsenic Release from Historically Contaminated Coastal Soils. Environ. Sci. Technol. 2017, 51, 5913–5922. [Google Scholar] [CrossRef]
  11. de Oliveira, C.R.; dos Santos, D.; dos Santos Madureira, L.A.; Rodrigues de Marchi, M.R. Speciation of Butyltin Derivatives in Surface Sediments of Three Southern Brazilian Harbors. J. Hazard. Mater. 2010, 181, 851–856. [Google Scholar] [CrossRef]
  12. Martinez-Llado, X.; Gibert, O.; Marti, V.; Diez, S.; Romo, J.; Bayona, J.M.; de Pablo, J. Distribution of Polycyclic Aromatic Hydrocarbons (PAHs) and Tributyltin (TBT) in Barcelona Harbour Sediments and Their Impact on Benthic Communities. Environ. Pollut. 2007, 149, 104–113. [Google Scholar] [CrossRef]
  13. Alzieu, C.; Michel, P.; Tolosa, I.; Bacci, E.; Mee, L.D.; Readman, J.W. Organotin Compounds in the Mediterranean: A Continuing Cause for Concern. Mar. Environ. Res. 1991, 32, 261–270. [Google Scholar] [CrossRef]
  14. Wake, H. Oil Refineries: A Review of Their Ecological Impacts on the Aquatic Environment. Estuar. Coast. Shelf Sci. 2005, 62, 131–140. [Google Scholar] [CrossRef]
  15. Omae, I. Chemistry and Fate of Organotin Antifouling Biocides in the Environment. In Antifouling Paint Biocides; Konstantinou, I.K., Ed.; The Handbook of Environmental Chemistry; Springer: Berlin/Heidelberg, Germany, 2006; pp. 17–50. ISBN 978-3-540-32844-5. [Google Scholar]
  16. Alzieu, C.L.; Sanjuan, J.; Deltreil, J.P.; Borel, M. Tin Contamination in Arcachon Bay: Effects on Oyster Shell Anomalies. Mar. Pollut. Bull. 1986, 17, 494–498. [Google Scholar] [CrossRef]
  17. Gibbs, P.E.; Bryan, G.W. Reproductive Failure in Populations of the Dog-Whelk, Nucella Lapillus, Caused by Imposex Induced by Tributyltin from Antifouling Paints. J. Mar. Biol. Assoc. U. K. 1986, 66, 767–777. [Google Scholar] [CrossRef]
  18. Bettin, C.; Oehlmann, J.; Stroben, E. TBT-Induced Imposex in Marine Neogastropods Is Mediated by an Increasing Androgen Level. Helgoländer Meeresunters. 1996, 50, 299–317. [Google Scholar] [CrossRef]
  19. Díez, S.; Ábalos, M.; Bayona, J.M. Organotin Contamination in Sediments from the Western Mediterranean Enclosures Following 10 Years of TBT Regulation. Water Res. 2002, 36, 905–918. [Google Scholar] [CrossRef] [PubMed]
  20. Sabah, A.; Bancon-Montigny, C.; Rodier, C.; Marchand, P.; Delpoux, S.; Ijjaali, M.; Tournoud, M.-G. Occurrence and Removal of Butyltin Compounds in a Waste Stabilisation Pond of a Domestic Waste Water Treatment Plant of a Rural French Town. Chemosphere 2016, 144, 2497–2506. [Google Scholar] [CrossRef] [PubMed]
  21. Briant, N.; Bancon-Montigny, C.; Freydier, R.; Delpoux, S.; Elbaz-Poulichet, F. Behaviour of Butyltin Compounds in the Sediment Pore Waters of a Contaminated Marina (Port Camargue, South of France). Chemosphere 2016, 150, 123–129. [Google Scholar] [CrossRef] [PubMed]
  22. Hartwell, S.I.; Apeti, D.A.; Mason, A.L.; Pait, A.S. An Assessment of Butyltins and Metals in Sediment Cores from the St. Thomas East End Reserves, USVI. Environ. Monit. Assess. 2016, 188, 642. [Google Scholar] [CrossRef]
  23. Mikac, N.; Furdek Turk, M.; Petrović, D.; Bigović, M.; Krivokapić, S. First Assessment of Butyltins (BuTs) Contamination of the Montenegrin Coast (Southeast Adriatic): Tributyltin (TBT) Poses a Threat to the Marine Ecosystem. Mar. Pollut. Bull. 2022, 185, 114270. [Google Scholar] [CrossRef]
  24. Cossa, D.; Durrieu de Madron, X.; Schäfer, J.; Guédron, S.; Marusczak, N.; Castelle, S.; Naudin, J.-J. Sources and Exchanges of Mercury in the Waters of the Northwestern Mediterranean Margin. Prog. Oceanogr. 2018, 163, 172–183. [Google Scholar] [CrossRef]
  25. Zohra, B.S.; Habib, A. Assessment of Heavy Metal Contamination Levels and Toxicity in Sediments and Fishes from the Mediterranean Sea (Southern Coast of Sfax, Tunisia). Environ. Sci. Pollut. Res. 2016, 23, 13954–13963. [Google Scholar] [CrossRef]
  26. Tornero, V.; Hanke, G. Chemical Contaminants Entering the Marine Environment from Sea-Based Sources: A Review with a Focus on European Seas. Mar. Pollut. Bull. 2016, 112, 17–38. [Google Scholar] [CrossRef]
  27. Flouty, R.; Estephane, G. Bioaccumulation and Biosorption of Copper and Lead by a Unicellular Algae Chlamydomonas Reinhardtii in Single and Binary Metal Systems: A Comparative Study. J. Environ. Manage. 2012, 111, 106–114. [Google Scholar] [CrossRef]
  28. Fortibuoni, T.; Noventa, S.; Rampazzo, F.; Gion, C.; Formalewicz, M.; Berto, D.; Raicevich, S. Evidence of Butyltin Biomagnification along the Northern Adriatic Food-Web (Mediterranean Sea) Elucidated by Stable Isotope Ratios. Environ. Sci. Technol. 2013, 47, 3370–3377. [Google Scholar] [CrossRef]
  29. Pachés, M.; Martínez-Guijarro, R.; Romero, I.; Aguado, D. Assessment of Metal Pollution and Its Environmental Impact on Spanish Mediterranean Coastal Ecosystems. J. Mar. Sci. Eng. 2023, 11, 89. [Google Scholar] [CrossRef]
  30. Briant, N.; Bancon-Montigny, C.; Elbaz-Poulichet, F.; Freydier, R.; Delpoux, S.; Cossa, D. Trace Elements in the Sediments of a Large Mediterranean Marina (Port Camargue, France): Levels and Contamination History. Mar. Pollut. Bull. 2013, 73, 78–85. [Google Scholar] [CrossRef] [PubMed]
  31. Mehlhorn, P.; Viehberg, F.; Kirsten, K.; Newman, B.; Frenzel, P.; Gildeeva, O.; Green, A.; Hahn, A.; Haberzettl, T. Spatial Distribution and Consequences of Contaminants in Harbour Sediments—A Case Study from Richards Bay Harbour, South Africa. Mar. Pollut. Bull. 2021, 172, 112764. [Google Scholar] [CrossRef] [PubMed]
  32. Alprol, A.E.; Ashour, M.; Mansour, A.T.; Alzahrani, O.M.; Mahmoud, S.F.; Gharib, S.M. Assessment of Water Quality and Phytoplankton Structure of Eight Alexandria Beaches, Southeastern Mediterranean Sea, Egypt. J. Mar. Sci. Eng. 2021, 9, 1328. [Google Scholar] [CrossRef]
  33. Layglon, N.; Abdou, M.; Massa, F.; Castellano, M.; Bakker, E.; Povero, P.; Tercier-Waeber, M.-L. Speciation of Cu, Cd, Pb and Zn in a Contaminated Harbor and Comparison to Environmental Quality Standards. J. Environ. Manage. 2022, 317, 115375. [Google Scholar] [CrossRef]
  34. Leredde, Y.; Denamiel, C.; Brambilla, E.; Lauer-Leredde, C.; Bouchette, F.; Marsaleix, P. Hydrodynamics in the Gulf of Aigues-Mortes, NW Mediterranean Sea: In Situ and Modelling Data. Cont. Shelf Res. 2007, 27, 2389–2406. [Google Scholar] [CrossRef]
  35. Burton, G., Jr. Allen Sediment Quality Criteria in Use around the World. Limnology 2002, 3, 65–76. [Google Scholar] [CrossRef]
  36. Long, E.; Macdonald, D.; Smith, S.; Calder, F. Incidence of Adverse Biological Effects Within Ranges of Chemical Concentration in Marine and Estuarine Sediments. Environ. Manage. 1995, 19, 81–97. [Google Scholar] [CrossRef]
  37. Thompson, R.; Wasserman, H. Sediment Quality Guidelines (SQGs): A Review and Their Use in Practice. Available online: https://www.geoengineer.org/education/web-class-projects/cee-549-geoenvironmental-engineering-fall-2015/assignments/sediment-quality-guidelines-sqgs-a-review-and-their-use-in-practice#references (accessed on 23 January 2024).
  38. Telloli, C.; Tagliavini, S.; Passarini, F.; Salvi, S.; Rizzo, A. ICP-MS Triple Quadrupole as Analytical Technique to Define Trace and Ultra-Trace Fingerprint of Extra Virgin Olive Oil. Food Chem. 2023, 402, 134247. [Google Scholar] [CrossRef]
  39. Renzi, M.; Perra, G.; Guerranti, C.; Mariottini, M.; Baroni, D.; Volterrani, M.; Graziosi, M.; Specchiulli, A.; Focardi, S. Assessment of Environmental Pollutants in Ten Southern Italy Harbor Sediments. Toxicol. Ind. Health 2009, 25, 351–363. [Google Scholar] [CrossRef] [PubMed]
  40. Ebeid, M.H.; Ibrahim, M.I.A.; Abo Elkhair, E.M.; Mohamed, L.A.; Halim, A.A.; Shaban, K.S.; Fahmy, M. The Modified Canadian Water Index with Other Sediment Models for Assessment of Sediments from Two Harbours on the Egyptian Mediterranean Coast. J. Hazard. Mater. Adv. 2022, 8, 100180. [Google Scholar] [CrossRef]
  41. Briant, N.; Freydier, R.; Araújo, D.F.; Delpoux, S.; Elbaz-Poulichet, F. Cu Isotope Records of Cu-Based Antifouling Paints in Sediment Core Profiles from the Largest European Marina, The Port Camargue. Sci. Total Environ. 2022, 849, 157885. [Google Scholar] [CrossRef] [PubMed]
  42. Rebai, N.; Mosbahi, N.; Dauvin, J.-C.; Neifar, L. Ecological Risk Assessment of Heavy Metals and Environmental Quality of Tunisian Harbours. J. Mar. Sci. Eng. 2022, 10, 1625. [Google Scholar] [CrossRef]
  43. Pougnet, F.; Schäfer, J.; Dutruch, L.; Garnier, C.; Tessier, E.; Dang, D.H.; Lanceleur, L.; Mullot, J.-U.; Lenoble, V.; Blanc, G. Sources and Historical Record of Tin and Butyl-Tin Species in a Mediterranean Bay (Toulon Bay, France). Environ. Sci. Pollut. Res. 2014, 21, 6640–6651. [Google Scholar] [CrossRef]
  44. Bibi, M.H.; Ahmed, F.; Ishiga, H. Assessment of Metal Concentrations in Lake Sediments of Southwest Japan Based on Sediment Quality Guidelines. Environ. Geol. 2007, 52, 625–639. [Google Scholar] [CrossRef]
  45. Concha-Graña, E.; Moscoso-Pérez, C.; Fernández-González, V.; López-Mahía, P.; Gago, J.; León, V.M.; Muniategui-Lorenzo, S. Phthalates, Organotin Compounds and per-Polyfluoroalkyl Substances in Semiconfined Areas of the Spanish Coast: Occurrence, Sources and Risk Assessment. Sci. Total Environ. 2021, 780, 146450. [Google Scholar] [CrossRef]
  46. Directive 2008/105/EC of the European Parliament and of the Council (16 December 2008) on Environmental Quality Standards in the Field of Water Policy. Off. J. Eur. Union 2008, L 348, 84–97. Available online: https://Eur-Lex.Europa.Eu/Eli/Dir/2008/105/Oj (accessed on 25 January 2024).
  47. Légifrance—Publications Officielles—Journal Officiel—JORF N° 0198 Du 28/08/2015. Available online: https://www.legifrance.gouv.fr/download/pdf?id=CzMk9C9TuiNiDv8adNATce6yplGEb0Xgie4-T-nS53g= (accessed on 25 January 2024).
  48. Seligman, P.F.; Valkirs, A.O.; Stang, P.M.; Lee, R.F. Evidence for Rapid Degradation of Tributyltin in a Marina. Mar. Pollut. Bull. 1988, 19, 531–534. [Google Scholar] [CrossRef]
  49. Brosillon, S.; Bancon-Montigny, C.; Mendret, J. Study of Photocatalytic Degradation of Tributyltin, Dibutylin and Monobutyltin in Water and Marine Sediments. Chemosphere 2014, 109, 173–179. [Google Scholar] [CrossRef]
  50. Tueros, I.; Rodriguez, J.G.; Borja, A.; Solaun, O.; Valencia, V.; Millan, E. Dissolved Metal Background Levels in Marine Waters, for the Assessment of the Physico-Chemical Status, within the European Water Framework Directive. Sci. Total Environ. 2008, 407, 40–52. [Google Scholar] [CrossRef] [PubMed]
  51. Morsy, A.; Ebeid, M.; Soliman, A.; Halim, A.A.; Ali, A.E.; Fahmy, M. Evaluation of the Water Quality and the Eutrophication Risk in Mediterranean Sea Area: A Case Study of the Port Said Harbour, Egypt. Environ. Chall. 2022, 7, 100484. [Google Scholar] [CrossRef]
  52. Layglon, N.; Misson, B.; Durieu, G.; Coclet, C.; D’Onofrio, S.; Dang, D.H.; François, D.; Mullot, J.-U.; Mounier, S.; Lenoble, V.; et al. Long-Term Monitoring Emphasizes Impacts of the Dredging on Dissolved Cu and Pb Contamination along with Ultraplankton Distribution and Structure in Toulon Bay (NW Mediterranean Sea, France). Mar. Pollut. Bull. 2020, 156, 111196. [Google Scholar] [CrossRef] [PubMed]
  53. Furdek, M.; Vahčič, M.; Ščančar, J.; Milačič, R.; Kniewald, G.; Mikac, N. Organotin Compounds in Seawater and Mytilus Galloprovincialis Mussels along the Croatian Adriatic Coast. Mar. Pollut. Bull. 2012, 64, 189–199. [Google Scholar] [CrossRef] [PubMed]
  54. Centineo, G.; Blanco González, E.; Sanz-Medel, A. Multielemental Speciation Analysis of Organometallic Compounds of Mercury, Lead and Tin in Natural Water Samples by Headspace-Solid Phase Microextraction Followed by Gas Chromatography–Mass Spectrometry. J. Chromatogr. A 2004, 1034, 191–197. [Google Scholar] [CrossRef] [PubMed]
  55. Abd-Allah, A.M.A. Occurrence of Organotin Compounds in Water and Biota from Alexandria Harbours. Chemosphere 1995, 30, 707–715. [Google Scholar] [CrossRef]
  56. Krishna, A.K.; Satyanarayanan, M.; Govil, P.K. Assessment of Heavy Metal Pollution in Water Using Multivariate Statistical Techniques in an Industrial Area: A Case Study from Patancheru, Medak District, Andhra Pradesh, India. J. Hazard. Mater. 2009, 167, 366–373. [Google Scholar] [CrossRef] [PubMed]
  57. Lin, Y.-C.; Chang-Chien, G.-P.; Chiang, P.-C.; Chen, W.-H.; Lin, Y.-C. Multivariate Analysis of Heavy Metal Contaminations in Seawater and Sediments from a Heavily Industrialized Harbor in Southern Taiwan. Mar. Pollut. Bull. 2013, 76, 266–275. [Google Scholar] [CrossRef]
Figure 1. Map of the sampling sites in the two harbours of the Gulf of Aigues Mortes, France (A): Port Carnon (B) and Port Camargue (C). (free Geographic Information System (GIS) QGIS 3.12 https://www.qgis.org/fr/site/forusers/index.html#download accessed on 23 January 2024).
Jmse 12 00399 g001
Figure 2. PCA with TMEs, organotins, and terrigenous elements in the sediments of Port Carnon (C) and Port Camargue (PC). Granulometry data were used as additional explaining variables.
Jmse 12 00399 g002
Figure 3. PCA with environmental variables measured in the water column of Port Carnon (C) and Port Camargue (PC).
Jmse 12 00399 g003
Figure 4. Spatial distribution of contaminants (Cu, Ni, Zn) in the water column in Port Carnon (C) in blue and Port Camargue (PC) in red.
Jmse 12 00399 g004
Figure 5. Temporal monitoring of contaminant concentrations of Cu (a) and (b), Ni (c) and (d), and Zn (e) and (f) in Port Carnon (C) and Port Camargue (PC) for the reference stations (C1 and PC1) and technical stations (C7 and PC4). Dotted lines represent the allowable maximum concentration imposed by the European Water Framework Directive (EWFD) and French regulations [46,47].
Jmse 12 00399 g005
Figure 6. Boxplots of butyltin concentrations TBT, DBT, and MBT in the water column in Port Carnon (C) in blue and Port Camargue (PC) in red. Box plot illustrating the data distribution. The box represents the first quartile (Q1) to the third quartile (Q3), the median is indicated by the central line, and the whiskers extend to the extreme values not considered as outliers. Points beyond the whiskers are potentially outliers.
Jmse 12 00399 g006
Figure 7. Temporal monitoring of butyltin concentrations TBT (a) and (b), DBT (c) and (d), and MBT (e) and (f) in Port Carnon (C) and Port Camargue (PC) for the reference stations (C1 and PC1) and technical stations (C7 and PC4). Dotted lines represent the allowable maximum concentration imposed by the European Water Framework Directive (EWFD) and French regulations [46,47].
Jmse 12 00399 g007
Figure 8. PCA of the distribution of TMEs, organotins, and terrigenous elements in the water column of Port Carnon (C) and Port Camargue (PC). Environmental parameters were used as additional variables.
Jmse 12 00399 g008
Table 1. Description of sampling sites and dates of water sampling campaigns in Port Carnon and Port Camargue harbours.
Location of Sampling StationsSampling StationsDate of Water Sampling Campaigns
Sept.-21Oct.-21Nov.-21Dec.-21Jan.-22Feb.-22Mar-22Apr.-22May-22Jun-22Jul.-22Aug-22Sept.-22
PORT CARNONReference: Port entranceC1XXXXXXXXXXXXXXXXX
Channel entranceC2XXXXXXXXXXXXXXXXX
Harbour master’s officeC3XXXXXXXXXXXXXXXXX
Eastern BasinC4XXXXXXXXXXXXXXXXX
Contact Channel (lagoon to sea)C5XXXXXXXXXXXXXXXXX
Western Basin C6XXXXXXXXXXXXXXXXX
Western Basin (Dock)C7XXXXXXXXXXXXXXXXX
PORT CAMARGUEReference: Outside the PortPC1XXXXXXXXXXXXXXXXX
Harbour master’s officePC2XXXXXXXXXXXXXXXXX
Fuel stationPC3XXXXXXXXXXXXXXXXX
Technical station (Dock)PC4XXXXXXXXXXXXXXXXX
Technical station (Dock)PC5XXXXXXXXXXXXXXXXX
Marina AreaPC6XXXXXXXXXXXXXXXXX
X: Sampling once a month. XX: Sampling twice a month.
Table 2. Concentrations of trace metal elements and butyltins in the sediments of Port Carnon (C) and Port Camargue (PC) (n = 3). Concentrations above ERM are in bold format.
PORT CARNONPORT CAMARGUE
C1C2C3C4C5C6C7PC1PC2PC3PC4PC5PC6
Trace elements ERL 1ERM 2
Asmg kg−11612.213.41611.912.614.112.011.912.015.615.48.48.270
Cd0.10.20.40.40.30.40.40.10.10.10.20.20.11.29.6
Cr32.25177.588.667.175.184.861.753.553.966.452.239.281370
Cu4.246.273.7169111.5111.730982.726.794.2121071329234270
Ni1822.533.337.82933.936.41.313.33960.32.913320.951.6
Pb13.228.748.55743.248.355.424.820.320.281.358.627.946.7218
Zn43.279.9126199127.614424210676.289.2425270174150410
Organotin compounds
TBTµg (Sn) kg−10.6391911519854134678280329
DBT0.9359076966211532151938
MBT5.32917157133520175456885695
Σbutyltins6.835314383530231278867785178163
BDI 10.3122.31.25.11.40.55.75.35.60.40.84.5
1 ERL: effects range-low; 2 ERM: effects range-median); BDI: BioDegradration Index = ([MBT] + [DBT])/[TBT].
Table 3. Percentage of samples where the dissolved contaminant concentration was above the EQS maximum allowable concentration.
Port Carnon HarbourPort Camargue Harbour
C1C2C3C4C5C6C7PC1PC2PC3PC4PC5PC6
Cu18.862.593.8100.043.893.893.80.0100100100100100
Zn0.00.037.537.50.031.337.511.161.1100.0100.0100.094.4
TBT0.06.36.36.36.30.06.311.116.75.616.722.25.6
Disclaimer/Publisher’s Note: The statements, opinions and data contained in all publications are solely those of the individual author(s) and contributor(s) and not of MDPI and/or the editor(s). MDPI and/or the editor(s) disclaim responsibility for any injury to people or property resulting from any ideas, methods, instructions or products referred to in the content.

