
Probabilistic Analysis of Basic Causes of Vessel–Platform Allision Accidents


Abstract
1. Introduction
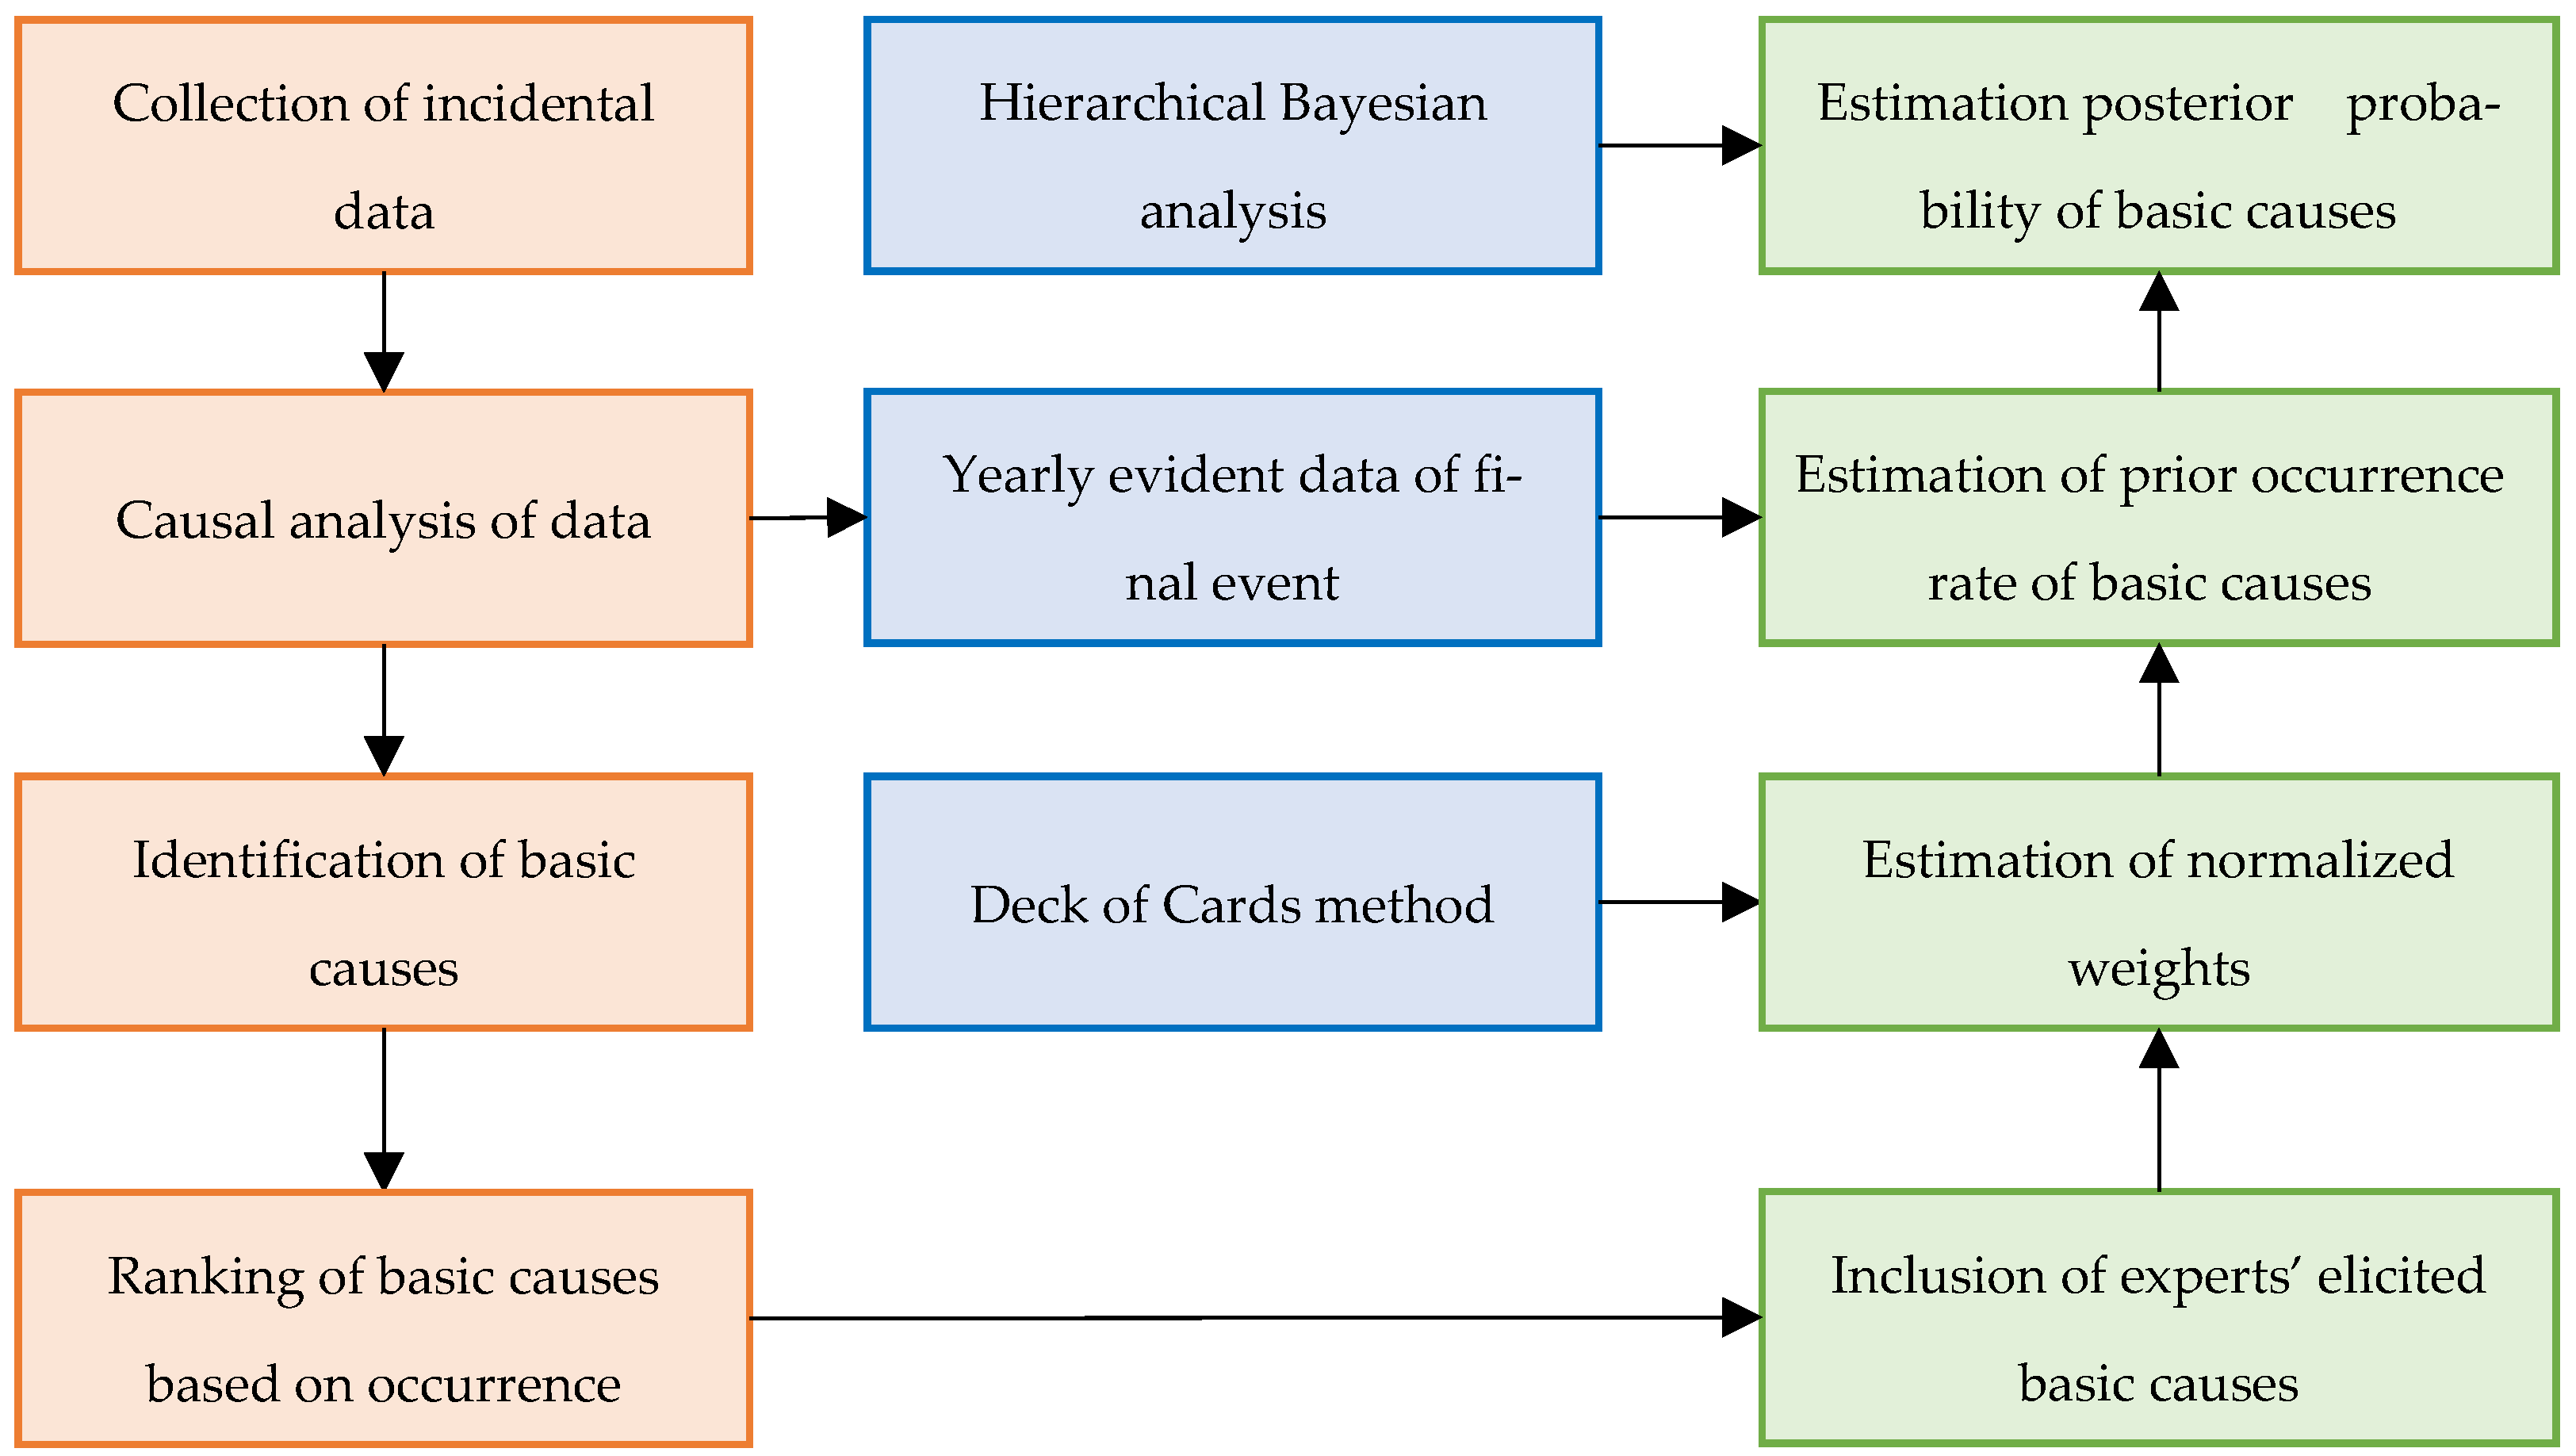
2. Methodology
2.1. Deck of Cards Method
2.2. Hierarchical Bayesian Analysis (HBA)
3. Results and Discussion
3.1. Data Collection
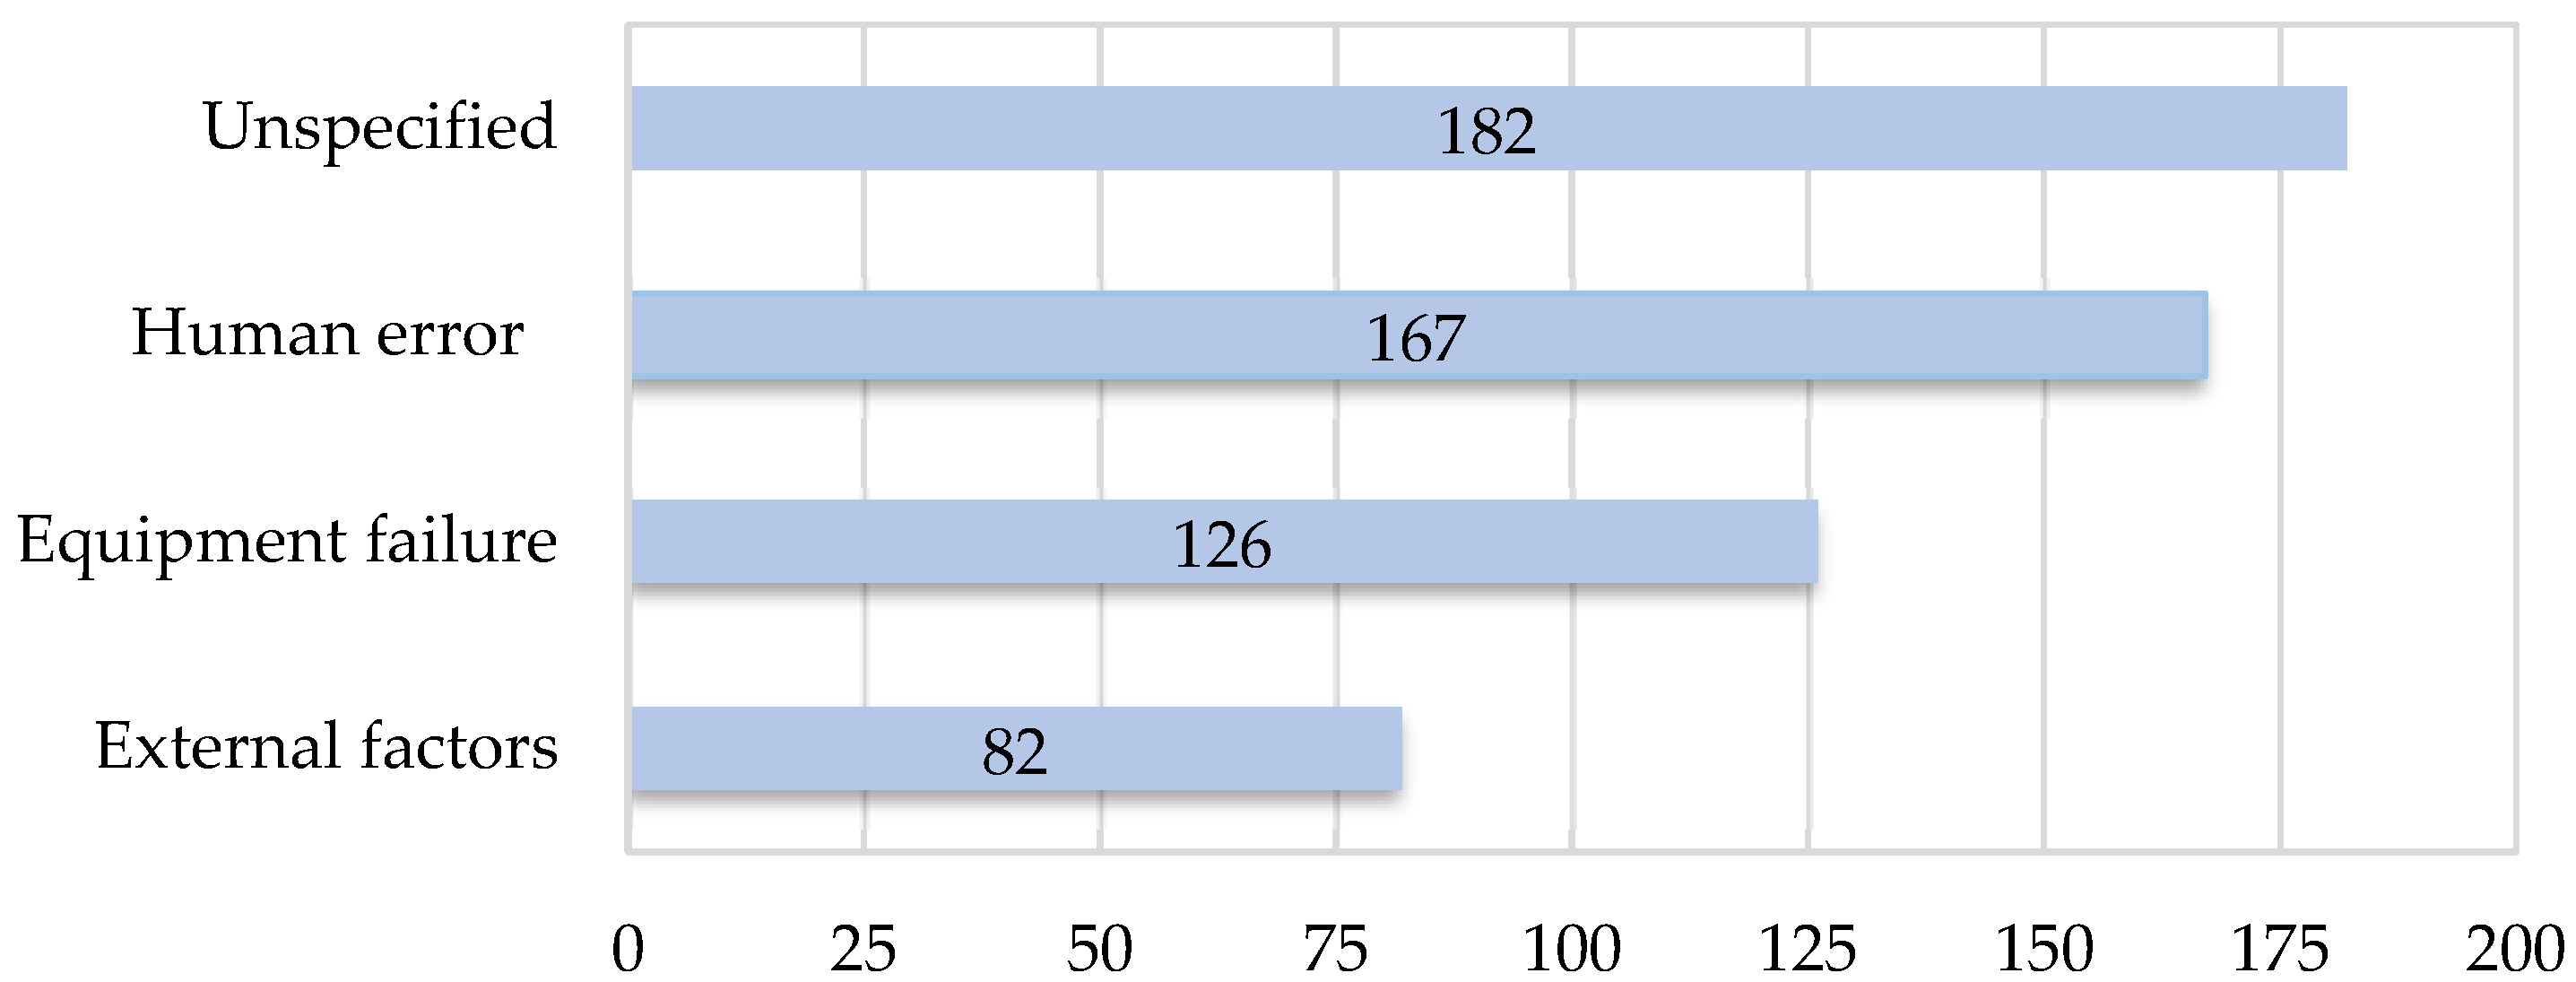
3.1.1. Causal Factors
3.1.2. Identification of Basic Causes
3.2. Application of the DCM
3.3. Estimation of the Occurrence Rate of Basic Causes
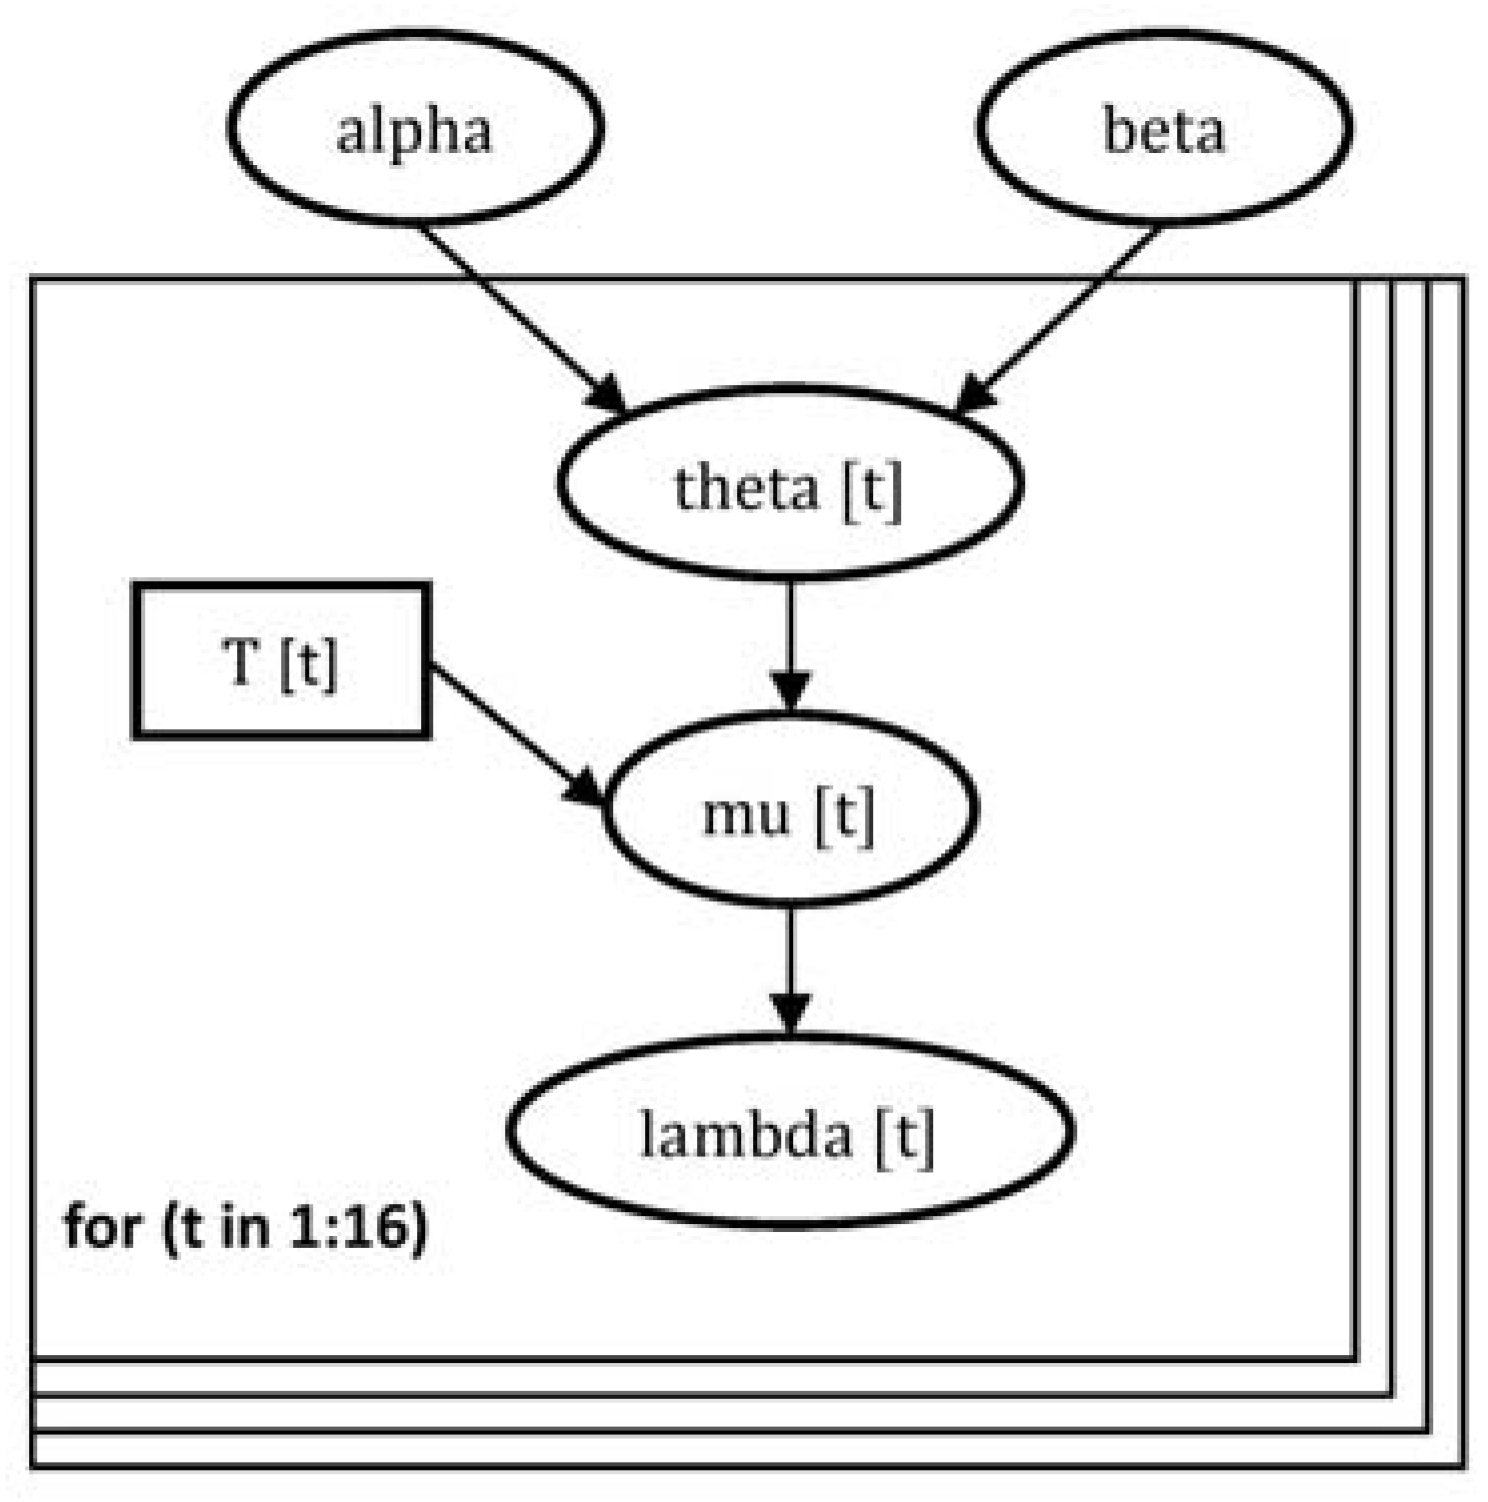
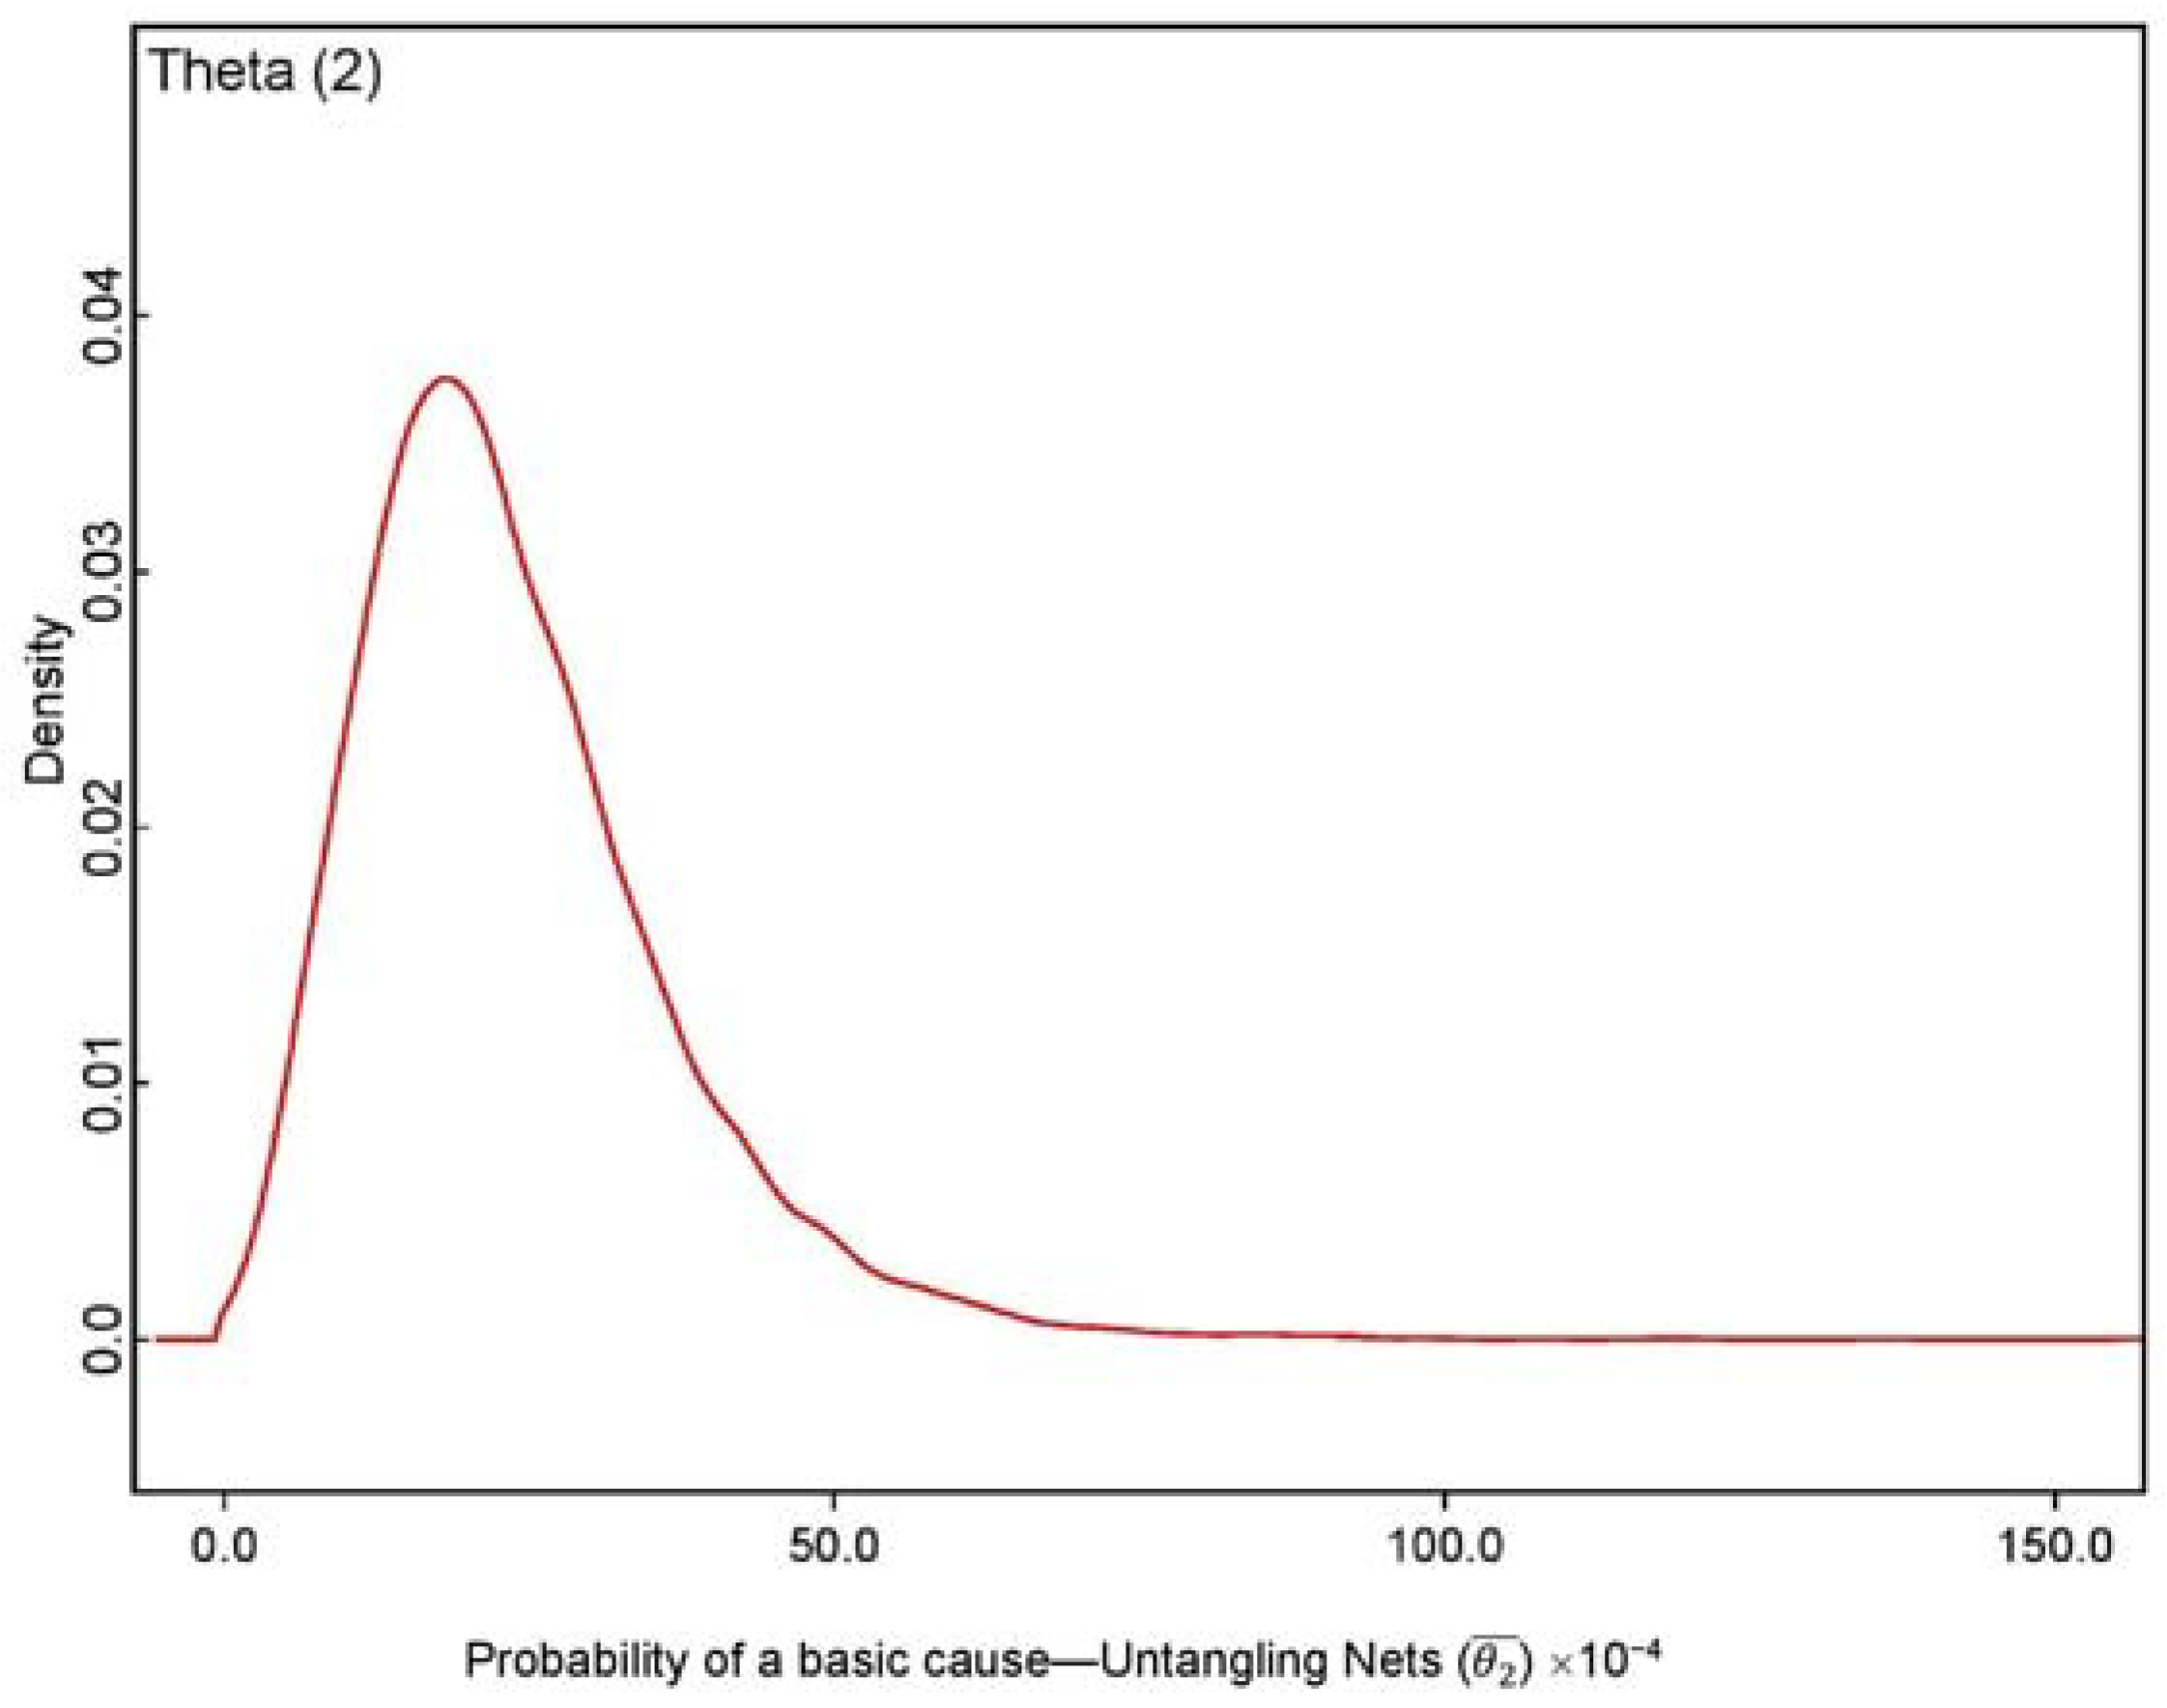
3.4. Estimation of the Probability of Occurrence Using HBA
| model | ||
| { | ||
| for(t in 1:16 ) { | ||
| mu [t] < −theta [t] * T [t] | ||
| theta [t] ~ dgamma (alpha, beta) | ||
| lambda [t] ~ dpois (mu [t]) | ||
| } | ||
| alpha ~ dgamma (0.0001, 0.0001) | ||
| beta ~ dgamma (0.0001, 0.0001) | ||
| theta.avg ~ dgamma(alpha, beta) | ||
| } | ||
4. Conclusions
Author Contributions
Funding
Institutional Review Board Statement
Informed Consent Statement
Data Availability Statement
Conflicts of Interest
Appendix A

| Basic Causes | × 10−4 | |||
|---|---|---|---|---|
| D.P. Operator Error | l1 | 1.00 | 0.0097 | 2.27 |
| Untangling Nets | l2 | 1.06 | 0.0103 | 2.40 |
| Anchor Chain Broke | l3 | 1.16 | 0.0112 | 2.61 |
| Clutch Failure | l4 | 1.25 | 0.0121 | 2.83 |
| Crane Failure | l5 | 1.31 | 0.0127 | 2.98 |
| D.P. Remote Control Failure | l6 | 1.34 | 0.0131 | 3.07 |
| Propeller Failure | l7 | 1.40 | 0.0137 | 3.19 |
| Rudder Misaligned | l8 | 1.50 | 0.0146 | 3.40 |
| Steering Control Failure | l9 | 1.56 | 0.0152 | 3.54 |
| Thruster Electrical Failure | l10 | 1.62 | 0.0158 | 3.68 |
| Obscured Vision | l11 | 1.65 | 0.0161 | 3.77 |
| Error in Mooring Procedure | l12 | 1.71 | 0.0167 | 3.91 |
| Autopilot Failure | l13 | 1.81 | 0.0176 | 4.11 |
| Bow Thruster Failure | l14 | 1.84 | 0.0179 | 4.17 |
| D.P. Computer Failure | l15 | 1.90 | 0.0185 | 4.32 |
| Maneuvering Error | l16 | 1.96 | 0.0191 | 4.47 |
| Poor Visibility | l17 | 2.06 | 0.0200 | 4.67 |
| D.P. Electrical Failure | l18 | 2.12 | 0.0206 | 4.80 |
| Engine Failure | l19 | 2.21 | 0.0215 | 4.99 |
| Thruster Control Failure | l20 | 2.34 | 0.0227 | 5.29 |
| D.P. Thruster Failure | l21 | 2.40 | 0.0233 | 5.42 |
| Electrical Faults | l22 | 2.43 | 0.0236 | 5.51 |
| Power Failure | l23 | 2.52 | 0.0245 | 5.71 |
| Steering Failure | l24 | 2.62 | 0.0254 | 5.92 |
| Total Power Loss | l25 | 2.65 | 0.0257 | 5.99 |
| D.P. Control Failure | l26 | 2.74 | 0.0267 | 6.21 |
| Heavy Rain | l27 | 2.80 | 0.0273 | 6.33 |
| Mooring Failure | l28 | 2.93 | 0.0285 | 6.62 |
| Thruster Failure | l29 | 2.99 | 0.0291 | 6.76 |
| Thick Fog | l30 | 3.08 | 0.0300 | 6.96 |
| Anchor Dragged | l31 | 3.21 | 0.0312 | 7.25 |
| Engine Power Failure | l32 | 3.24 | 0.0315 | 7.32 |
| Lack of Awareness | l33 | 3.30 | 0.0321 | 7.47 |
| Watch-Keeping Failure | l34 | 3.36 | 0.0327 | 7.61 |
| Lack of Knowledge | l35 | 3.39 | 0.0330 | 7.67 |
| Extreme Waves | l36 | 3.49 | 0.0339 | 7.88 |
| Other DP Failure | l37 | 3.55 | 0.0345 | 7.99 |
| Operator Error | l38 | 3.61 | 0.0351 | 8.16 |
| Engine Control Failure | l39 | 3.70 | 0.0360 | 8.38 |
| Wind Conditions | l40 | 3.83 | 0.0372 | 8.67 |
| Miscalculation | l41 | 3.98 | 0.0387 | 8.99 |
| Improper Communication | l42 | 4.20 | 0.0409 | 9.47 |
References
- Norwegian Ocean Industry Authority (Havtil). Investigation Reports. Available online: https://www.ptil.no/en/supervision/investigation-reports/ (accessed on 20 December 2023).
- HSE (Health and Safety Executive). Offshore Statistics & Regulatory Activity Report 2022; HSE: Bootle, UK, 2023. [Google Scholar]
- USCG (United States Coast Guard). Marine Casualty Reports. Available online: https://www.dco.uscg.mil/Our-Organization/Assistant-Commandant-for-Prevention-Policy-CG-5P/Inspections-Compliance-CG-5PC-/Office-of-Investigations-Casualty-Analysis/Marine-Casualty-Reports/ (accessed on 12 December 2023).
- EMSA (European Maritime Safety Agency). European Marine Casualty Information Platform–EMCIP. Available online: https://portal.emsa.europa.eu/emcip-public/#/public-occurrences (accessed on 12 December 2023).
- Bhardwaj, U.; Teixeira, A.P.; Guedes Soares, C.; Ariffin, A.K.; Singh, S.S. Evidence Based Risk Analysis of Fire and Explosion Accident Scenarios in FPSOs. Reliab. Eng. Syst. Saf. 2021, 215, 107904. [Google Scholar] [CrossRef]
- Norazahar, N.; Khan, F.; Veitch, B.; MacKinnon, S. Human and Organizational Factors Assessment of the Evacuation Operation of BP Deepwater Horizon Accident. Saf. Sci. 2014, 70, 41–49. [Google Scholar] [CrossRef]
- UK Oil & Gas. Guidelines for Ship/Installation Collision Avoidance; United Kingdom Offshore Oil and Gas Industry Association Limited: London, UK, 2010. [Google Scholar]
- Bhardwaj, U.; Teixeira, A.P.; Guedes Soares, C. Casualty Analysis Methodology and Taxonomy for FPSO Accident Analysis. Reliab. Eng. Syst. Saf. 2022, 218, 108169. [Google Scholar] [CrossRef]
- Bhardwaj, U.; Teixeira, A.P.; Guedes Soares, C. Analysis of FPSO Accident and Incident Data. In Progress in the Analysis and Design of Marine Structures; Guedes Soares, C., Garbatov, Y., Eds.; Taylor & Francis Group: London, UK, 2017; pp. 773–782. ISBN 9781138069077. [Google Scholar]
- Yin, B.; Li, B.; Liu, G.; Wang, Z.; Sun, B. Quantitative Risk Analysis of Offshore Well Blowout Using Bayesian Network. Saf. Sci. 2021, 135, 105080. [Google Scholar] [CrossRef]
- HSE Books. Offshore Accident and Failure Frequency Data Sources-Review and Recommendations RR1114; Health and Safety Executive: London, UK, 2017. [Google Scholar]
- Zhen, X.; Ning, Y.; Du, W.; Huang, Y.; Vinnem, J.E. An Interpretable and Augmented Machine-Learning Approach for Causation Analysis of Major Accident Risk Indicators in the Offshore Petroleum Industry. Process Saf. Environ. Prot. 2023, 173, 922–933. [Google Scholar] [CrossRef]
- Song, G.; Khan, F.; Wang, H.; Leighton, S.; Yuan, Z.; Liu, H. Dynamic Occupational Risk Model for Offshore Operations in Harsh Environments. Reliab. Eng. Syst. Saf. 2016, 150, 58–64. [Google Scholar] [CrossRef]
- de Almeida, A.G.; Vinnem, J.E. Major Accident Prevention Illustrated by Hydrocarbon Leak Case Studies: A Comparison between Brazilian and Norwegian Offshore Functional Petroleum Safety Regulatory Approaches. Saf. Sci. 2020, 121, 652–665. [Google Scholar] [CrossRef]
- Bhardwaj, U.; Teixeira, A.P.; Guedes Soares, C. Bayesian Framework for Reliability Prediction of Subsea Processing Systems Accounting for Influencing Factors Uncertainty. Reliab. Eng. Syst. Saf. 2022, 218, 108143. [Google Scholar] [CrossRef]
- Bhardwaj, U.; Teixeira, A.P.; Guedes Soares, C. Availability Assessment of a Power Plant Working on the Allam Cycle. In Progress in Maritime Technology and Engineering; Guedes Soares, C., Santos, T.A., Eds.; CRC Press: Boca Raton, FL, USA, 2018; pp. 525–536. ISBN 9781138585393. [Google Scholar]
- Khakzad, N.; Reniers, G. Safety of Offshore Topside Processing Facilities: The Era of FPSOs and FLNGs. In Offshore Process Safety; Elsevier Inc.: Amsterdam, The Netherlands, 2018; Volume 2, pp. 269–287. [Google Scholar]
- Spouge, J.; Consultant, P.; Gl, D.N.V.; Building, V.; Street, S.; Se, L. Storage Tank Explosion Frequencies on FPSOs. In Proceedings of the Hazards, Birmingham, UK, 10–12 May 2017; pp. 1–5. [Google Scholar]
- Wang, B.; Zhu, S.; Hao, P.; Bi, X.; Du, K.; Chen, B.; Ma, X.; Chao, Y.J. Buckling of Quasi-Perfect Cylindrical Shell under Axial Compression: A Combined Experimental and Numerical Investigation. Int. J. Solids Struct. 2018, 130–131, 232–247. [Google Scholar] [CrossRef]
- van der Tak, C.; Glansdorp, C.C. Ship Offshore Platform Collision Risk Assessment (SOCRA). In Proceedings of the 5th International Conference on Loss Prevention in the Oil and Gas Industry, Aberdeen, Scotland, 11–13 September 1995. [Google Scholar]
- eMARS Major Accident Reporting System. Available online: https://emars.jrc.ec.europa.eu/en/emars/content (accessed on 10 October 2023).
- BSEE (Bureau of Safety and Environmental Enforcement). Offshore Incident Statistics. Available online: https://www.bsee.gov/stats-facts/offshore-incident-statistics (accessed on 12 July 2023).
- Zhao, J.; Price, W.G.; Wilson, P.A. Risk Assessment of Ship/Platform Collision. In Marine, Offshore and Ice Technology; Murthy, T.K.S., Ed.; Computational Mechanics; Springer: Berlin/Heidelberg, Germany, 1994; Volume 5, pp. 187–194. [Google Scholar]
- Graziano, A.; Teixeira, A.P.; Guedes Soares, C. Classification of Human Errors in Grounding and Collision Accidents Using the TRACEr Taxonomy. Saf. Sci. 2016, 86, 245–257. [Google Scholar] [CrossRef]
- Silveira, P.A.M.; Soares, C.G.; Teixeira, A.P. Use of AIS Data to Characterise Marine Traffic Patterns and Ship Collision Risk off the Coast of Portugal. J. Navig. 2013, 66, 879–898. [Google Scholar] [CrossRef]
- Čorić, M.; Mandžuka, S.; Gudelj, A.; Lušić, Z. Quantitative Ship Collision Frequency Estimation Models: A Review. J. Mar. Sci. Eng. 2021, 9, 533. [Google Scholar] [CrossRef]
- MAIB (Marine Accident Investigation Branch). Marine Accident Investigation Reports. Available online: https://www.gov.uk/maib-reports (accessed on 12 September 2023).
- Xiao, F.; Ma, Y.; Wu, B. Review of Probabilistic Risk Assessment Models for Ship Collisions with Structures. Appl. Sci. 2022, 12, 3441. [Google Scholar] [CrossRef]
- Haugen, S.; Katteland, L.H.; Vollen, F. COLLIDE—Collision Design Criteria, Phase II—Reference Manual; Dovre Safetec: Trondheim, Norway, 1994. [Google Scholar]
- af Geijerstam, K.; Svensson, H. Ship Collision Risk-An Identification and Evaluation of Important Factors in Collisions with Offshore Installations; Lund University: Lund, Sweden, 2008. [Google Scholar]
- Hassel, M.; Utne, I.B.; Vinnem, J.E. An Allision Risk Model for Passing Vessels and Offshore Oil and Gas Installations on the Norwegian Continental Shelf. Proc. Inst. Mech. Eng. Part O J. Risk Reliab. 2021, 235, 17–32. [Google Scholar] [CrossRef]
- Mujeeb-Ahmed, M.P.; Seo, J.K.; Paik, J.K. Probabilistic Approach for Collision Risk Analysis of Powered Vessel with Offshore Platforms. Ocean Eng. 2018, 151, 206–221. [Google Scholar] [CrossRef]
- Hörteborn, A.; Ringsberg, J.W. A Method for Risk Analysis of Ship Collisions with Stationary Infrastructure Using AIS Data and a Ship Manoeuvring Simulator. Ocean Eng. 2021, 235, 109396. [Google Scholar] [CrossRef]
- Chen, H.; Moan, T. Probabilistic Modeling and Evaluation of Collision between Shuttle Tanker and FPSO in Tandem Offloading. Reliab. Eng. Syst. Saf. 2004, 84, 169–186. [Google Scholar] [CrossRef]
- Haugen, S.; Moan, T. Frequency of Collision between Ships and Platforms. In Proceedings of the OMAE, 11th International Conference on Offshore Mechanics & Arctic Engineering, Calgary, AB, Canada, 7–12 June 1992; ASME: New York, NY, USA, 1992; p. 359. [Google Scholar]
- Haugen, S. Probabilistic Evaluation of Frequency of Collision between Ships and Offshore Platforms; Norwegian University of Science and Technology: Trondheim, Norway, 1991. [Google Scholar]
- Pedersen, P.T. Collision Risk for Fixed Offshore Structures Close to High-Density Shipping Lanes. Proc. Inst. Mech. Eng. Part M J. Eng. Marit. Environ. 2002, 216, 29–44. [Google Scholar] [CrossRef]
- Kvitrud, A. Collisions between Platforms and Ships in Norway in the Period 2001–2010. In Proceedings of the 30th International Conference on Ocean, Offshore and Arctic Engineering, Rotterdam, the Netherlands, 19–24 June 2011; pp. 1–5. [Google Scholar]
- Flohberger, M. No for Ship-Installation Collision Risk Models to Reflect Current Collision Avoidance; University of Stavenger: Stavanger, Norway, 2010. [Google Scholar]
- Oltedal, H.A. Ship-Platform Collisions in the North Sea. In Proceedings of the European Safety and Reliability Conference, Helsinki, Finland, 25–29 June 2012; Volume 8, pp. 6470–6479. [Google Scholar]
- Wallsten, T.S.; Diederich, A. Understanding Pooled Subjective Probability Estimates. Math. Soc. Sci. 2001, 41, 1–18. [Google Scholar] [CrossRef]
- Ariely, D.; Au, W.T.; Bender, R.H.; Budescu, D.V.; Dietz, C.B.; Gu, H.; Wallsten, T.S.; Zauberman, G. The Effects of Averaging Subjective Probability Estimates between and within Judges. J. Exp. Psychol. Appl. 2000, 6, 130–147. [Google Scholar] [CrossRef]
- Woudenberg, F. An Evaluation of Delphi. Technol. Forecast. Soc. Change 1991, 40, 131–150. [Google Scholar] [CrossRef]
- Loughney, S.; Wang, J.; Wall, A. Ship/Platform Collision Incident Database (2015) for Offshore Oil and Gas Installations, RR1154 ed.; Health and Safety Executive: Buxton, UK, 2019. [Google Scholar]
- Assurance, S. Ship/Platform Collision Incident Database (2001); RR 053; Health and Safety Executive: Buxton, UK, 2003; ISBN 0717626792. [Google Scholar]
- European Maritime Safety Agency. Annual Overview of Marine Casualties and Incidents 2023; European Maritime Safety Agency: Lisbon, Portugal, 2023.
- Silveira, P.; Teixeira, A.P.; Figueira, J.R.; Guedes Soares, C. A Multicriteria Outranking Approach for Ship Collision Risk Assessment. Reliab. Eng. Syst. Saf. 2021, 214, 107789. [Google Scholar] [CrossRef]
- Yu, L.; Deyi, L. Statistics on Atomized Feature of Normal Cloud Model. J. Beijing Univ. Aeronaut. Astronaut. 2010, 36, 1320. [Google Scholar]
- Saaty, T.L. Risk—Its Priority and Probability: The Analytic Hierarchy Process. Risk Anal. 1987, 2, 159–172. [Google Scholar] [CrossRef]
- Mazzuchi, T.A.; Linzey, W.G.; Bruning, A. A Paired Comparison Experiment for Gathering Expert Judgment for an Aircraft Wiring Risk Assessment. Reliab. Eng. Syst. Saf. 2008, 93, 722–731. [Google Scholar] [CrossRef]
- Ben-Arieh, D.; Easton, T.; Evans, B. Minimum Cost Consensus with Quadratic Cost Functions. IEEE Trans. Syst. Man, Cybern. Part A Syst. Humans 2009, 39, 210–217. [Google Scholar] [CrossRef]
- Yang, Z.; Wan, C.; Yang, Z.; Yu, Q. Using Bayesian Network-Based TOPSIS to Aid Dynamic Port State Control Detention Risk Control Decision. Reliab. Eng. Syst. Saf. 2021, 213, 107784. [Google Scholar] [CrossRef]
- Dempster, A.P. Upper and Lower Probabilities Induced by a Multivalued Mapping. Ann. Math. Stat. 1967, 38, 325–339. [Google Scholar] [CrossRef]
- Gosling, J.P. SHELF: The Sheffield Elicitation Framework. In International Series in Operations Research & Management Science; Dias, L.C., Morton, A., Quigley, J., Eds.; Springer International Publishing: Cham, Switzerland, 2018; pp. 61–93. ISBN 978-3-319-65052-4. [Google Scholar]
- Corrente, S.; Figueira, J.R.; Greco, S. Pairwise Comparison Tables within the Deck of Cards Method in Multiple Criteria Decision Aiding. Eur. J. Oper. Res. 2021, 291, 738–756. [Google Scholar] [CrossRef]
- Figueira, J.; Roy, B. Determining the Weights of Criteria in the ELECTRE Type Methods with a Revised Simos’ Procedure. Eur. J. Oper. Res. 2002, 139, 317–326. [Google Scholar] [CrossRef]
- Antão, P.; Sun, S.; Teixeira, A.P.; Guedes Soares, C. Quantitative Assessment of Ship Collision Risk Influencing Factors from Worldwide Accident and Fleet Data. Reliab. Eng. Syst. Saf. 2023, 234, 109166. [Google Scholar] [CrossRef]
- Khakzad, N.; Khan, F.; Amyotte, P. Dynamic Safety Analysis of Process Systems by Mapping Bow-Tie into Bayesian Network. Process Saf. Environ. Prot. 2013, 91, 46–53. [Google Scholar] [CrossRef]
- Jin, R.; Wang, F.; Liu, D. Dynamic Probabilistic Analysis of Accidents in Construction Projects by Combining Precursor Data and Expert Judgments. Adv. Eng. Inform. 2020, 44, 101062. [Google Scholar] [CrossRef]
- Kelly, D.L.; Smith, C.L. Bayesian Inference in Probabilistic Risk Assessment—The Current State of the Art. Reliab. Eng. Syst. Saf. 2009, 94, 628–643. [Google Scholar] [CrossRef]
- Vinnem, J.E. Offshore Risk Assessment Vol 2: Principles, Modelling and Applications of QRA Studies, 3rd ed.; Springer: London, UK, 2014; ISBN 978-1-4471-5212-5. [Google Scholar]
- IMO. IMO Guidelines for Formal Safety Assessment (FSA) for Use in the IMO Rule-Making Process; IMO: London, UK, 2018. [Google Scholar]
- Lunn, D.; Jackson, C.; Best, N.; Spiegelhalter, D.; Thomas, A. The BUGS Book: A Practical Introduction to Bayesian Analysis; CRC Press: Boca Raton, FL, USA, 2012. [Google Scholar]
- Bozorgzadeh, N.; Bathurst, R.J. Hierarchical Bayesian Approaches to Statistical Modelling of Geotechnical Data. Georisk Assess. Manag. Risk Eng. Syst. Geohazards 2020, 16, 452–469. [Google Scholar] [CrossRef]
- Bozorgzadeh, N.; Bathurst, R.J. A Bayesian Approach to Reliability of MSE Walls. Georisk Assess. Manag. Risk Eng. Syst. Geohazards 2021, 15, 1–11. [Google Scholar] [CrossRef]
- El-Gheriani, M.; Khan, F.; Chen, D.; Abbassi, R. Major Accident Modelling Using Spare Data. Process Saf. Environ. Prot. 2017, 106, 52–59. [Google Scholar] [CrossRef]
- Yang, M.; Khan, F.I.; Lye, L. Precursor-Based Hierarchical Bayesian Approach for Rare Event Frequency Estimation: A Case of Oil Spill Accidents. Process Saf. Environ. Prot. 2013, 91, 333–342. [Google Scholar] [CrossRef]
- Bozorgzadeh, N.; Liu, Z.; Nadim, F.; Lacasse, S. Model Calibration: A Hierarchical Bayesian Approach. Probabilistic Eng. Mech. 2023, 71, 103379. [Google Scholar] [CrossRef]


| (a) Table with inserted cards | |||||||
| l1 | l2 | l3 | l4 | . | l42 | ||
| l1 | 1 | ||||||
| l2 | 2 | ||||||
| l3 | 2 | ||||||
| . | . | ||||||
| . | . | ||||||
| l41 | 6 | ||||||
| l42 | |||||||
| (b) Table filled using the consistency condition | |||||||
| l1 | l2 | l3 | l4 | . | . | l42 | |
| l1 | 1 | 4 | 7 | 102 | |||
| l2 | 2 | 5 | 100 | ||||
| l3 | 2 | 97 | |||||
| . | . | ||||||
| . | . | ||||||
| l41 | 6 | ||||||
| l42 | |||||||
| t | Year | Number of Allision Incidents (At) | Number of Installations (It) | Annual Occurrence Rate (Nt) |
|---|---|---|---|---|
| 1 | 2000 | 18 | 300 | 0.060 |
| 2 | 2001 | 12 | 307 | 0.039 |
| 3 | 2002 | 10 | 308 | 0.032 |
| 4 | 2003 | 6 | 311 | 0.019 |
| 5 | 2004 | 4 | 313 | 0.013 |
| 6 | 2005 | 7 | 314 | 0.022 |
| 7 | 2006 | 8 | 315 | 0.025 |
| 8 | 2007 | 12 | 331 | 0.036 |
| 9 | 2008 | 8 | 337 | 0.024 |
| 10 | 2009 | 4 | 338 | 0.012 |
| 11 | 2010 | 5 | 332 | 0.015 |
| 12 | 2011 | 7 | 332 | 0.021 |
| 13 | 2012 | 4 | 335 | 0.012 |
| 14 | 2013 | 6 | 337 | 0.018 |
| 15 | 2014 | 4 | 340 | 0.012 |
| 16 | 2015 | 3 | 331 | 0.009 |
| t | Year | … | ||||
|---|---|---|---|---|---|---|
| 1 | 2000 | 5.84 × 10⁻⁴ | 6.20 × 10⁻⁴ | 6.74 × 10⁻⁴ | 2.45 × 10⁻³ | |
| 2 | 2001 | 3.80 × 10⁻⁴ | 4.04 × 10⁻⁴ | 4.39 × 10⁻⁴ | 1.60 × 10⁻³ | |
| 3 | 2002 | 3.16 × 10⁻⁴ | 3.35 × 10⁻⁴ | 3.65 × 10⁻⁴ | 1.33 × 10⁻³ | |
| 4 | 2003 | 1.88 × 10⁻⁴ | 1.99 × 10⁻⁴ | 2.17 × 10⁻⁴ | 7.88 × 10⁻⁴ | |
| 5 | 2004 | 1.24 × 10⁻⁴ | 1.32 × 10⁻⁴ | 1.44 × 10⁻⁴ | 5.22 × 10⁻⁴ | |
| 6 | 2005 | 2.17 × 10⁻⁴ | 2.30 × 10⁻⁴ | 2.51 × 10⁻⁴ | 9.11 × 10⁻⁴ | |
| 7 | 2006 | 2.47 × 10⁻⁴ | 2.62 × 10⁻⁴ | 2.85 × 10⁻⁴ | 1.04 × 10⁻³ | |
| 8 | 2007 | 3.53 × 10⁻⁴ | 3.75 × 10⁻⁴ | 4.07 × 10⁻⁴ | 1.48 × 10⁻³ | |
| 9 | 2008 | 2.31 × 10⁻⁴ | 2.45 × 10⁻⁴ | 2.67 × 10⁻⁴ | 9.70 × 10⁻⁴ | |
| 10 | 2009 | 1.15 × 10⁻⁴ | 1.22 × 10⁻⁴ | 1.33 × 10⁻⁴ | 4.84 × 10⁻⁴ | |
| 11 | 2010 | 1.47 × 10⁻⁴ | 1.56 × 10⁻⁴ | 1.69 × 10⁻⁴ | 6.15 × 10⁻⁴ | |
| 12 | 2011 | 2.05 × 10⁻⁴ | 2.18 × 10⁻⁴ | 2.37 × 10⁻⁴ | 8.61 × 10⁻⁴ | |
| 13 | 2012 | 1.16 × 10⁻⁴ | 1.23 × 10⁻⁴ | 1.34 × 10⁻⁴ | 4.88 × 10⁻⁴ | |
| 14 | 2013 | 1.73 × 10⁻⁴ | 1.84 × 10⁻⁴ | 2.00 × 10⁻⁴ | 7.27 × 10⁻⁴ | |
| 15 | 2014 | 1.14 × 10⁻⁴ | 1.22 × 10⁻⁴ | 1.32 × 10⁻⁴ | 4.81 × 10⁻⁴ | |
| 16 | 2015 | 8.82 × 10⁻⁵ | 9.36 × 10⁻⁵ | 1.02 × 10⁻⁴ | 3.70 × 10⁻⁴ |
Disclaimer/Publisher’s Note: The statements, opinions and data contained in all publications are solely those of the individual author(s) and contributor(s) and not of MDPI and/or the editor(s). MDPI and/or the editor(s) disclaim responsibility for any injury to people or property resulting from any ideas, methods, instructions or products referred to in the content. |
© 2024 by the authors. Licensee MDPI, Basel, Switzerland. This article is an open access article distributed under the terms and conditions of the Creative Commons Attribution (CC BY) license (https://creativecommons.org/licenses/by/4.0/).
Share and Cite
Bhardwaj, U.; Teixeira, A.P.; Guedes Soares, C. Probabilistic Analysis of Basic Causes of Vessel–Platform Allision Accidents. J. Mar. Sci. Eng. 2024, 12, 390. https://doi.org/10.3390/jmse12030390
Bhardwaj U, Teixeira AP, Guedes Soares C. Probabilistic Analysis of Basic Causes of Vessel–Platform Allision Accidents. Journal of Marine Science and Engineering. 2024; 12(3):390. https://doi.org/10.3390/jmse12030390
Chicago/Turabian StyleBhardwaj, Utkarsh, Angelo Palos Teixeira, and C. Guedes Soares. 2024. "Probabilistic Analysis of Basic Causes of Vessel–Platform Allision Accidents" Journal of Marine Science and Engineering 12, no. 3: 390. https://doi.org/10.3390/jmse12030390
APA StyleBhardwaj, U., Teixeira, A. P., & Guedes Soares, C. (2024). Probabilistic Analysis of Basic Causes of Vessel–Platform Allision Accidents. Journal of Marine Science and Engineering, 12(3), 390. https://doi.org/10.3390/jmse12030390