1. Introduction
Subsea pipelines (SPs) are vital arteries, transporting oil, gas, and water over long distances and playing a critical role in the global resource supply chain. However, they are the most vulnerable to damage from both human-made and natural causes [
1,
2,
3]. Critical issues arise early during the manufacturing stage: in the case of metallic pipes, for example, welding is a complicated process. After the laying process, when bending stresses can cause fractures, SPs are subjected to the external hydrostatic pressure, which can crush the pipe, especially if it is not yet under pressure. Successively, the corrosive environment significantly reduces fatigue strength in dry air conditions [
4,
5]. Moreover, the low temperature of the seabed and the heat of the transported fluid exert opposing stresses on the pipe material: global contraction and local expansion, respectively. In addition, debris from the topside, ship anchors, and fishing gear—the latter especially in shallow water—can endanger the SPs. In the case of SPs, the problem of the inaccessibility of ground transmission mains is exacerbated. As a result, reliable routine inspection and monitoring technologies are needed to ensure a long service life [
6]. Recently, to realize efficient remote control and monitoring, downtime prediction, and risk reduction, the digital twin has been discussed as a powerful technology [
7].
Smart pigging, acoustic monitoring, remotely operated vehicles, and diving are the current cornerstones of SP inspection, all of which are characterized by high costs and some limitations [
8]. In [
9], a comprehensive review of in-pipe robots from different perspectives is provided. In particular, attention is focused on their ability in terms of self-localizing, mapping the pipelines, moving into them, and assessingth pipe conditions. Smart pigging uses intelligent devices called pressure inspection gauges (pigs) that travel through the pipeline, collecting data on wall thickness, corrosion, and other potential anomalies (e.g., [
10]). This in-line inspection method is highly regarded for its accuracy and ability to provide comprehensive health assessments without disrupting pipeline operations (e.g., [
11,
12,
13,
14,
15,
16]). However, it can be limited by its reduced maneuverability and the types of anomalies that are not always detectable from inside the pipe, such as external wall deterioration. Acoustic monitoring is based on the propagation of sound waves through the pipeline material to detect leaks or structural weaknesses. The acoustic signatures are analyzed to determine the location and severity of any irregularities detected, allowing timely intervention. However, it can fail to pinpoint the exact location of a leak or distinguish between different types of acoustic signatures in noisy subsea environments (e.g., [
17,
18]). Remotely operated vehicles equipped with cameras and sensors provide versatile platforms for visual inspection and intervention in deep water environments, but their effectiveness is often hampered by underwater currents and visibility issues. Diving operations offer unique human judgement but are constrained by depth limitations, potential health risks to divers, underwater currents, and visibility issues.
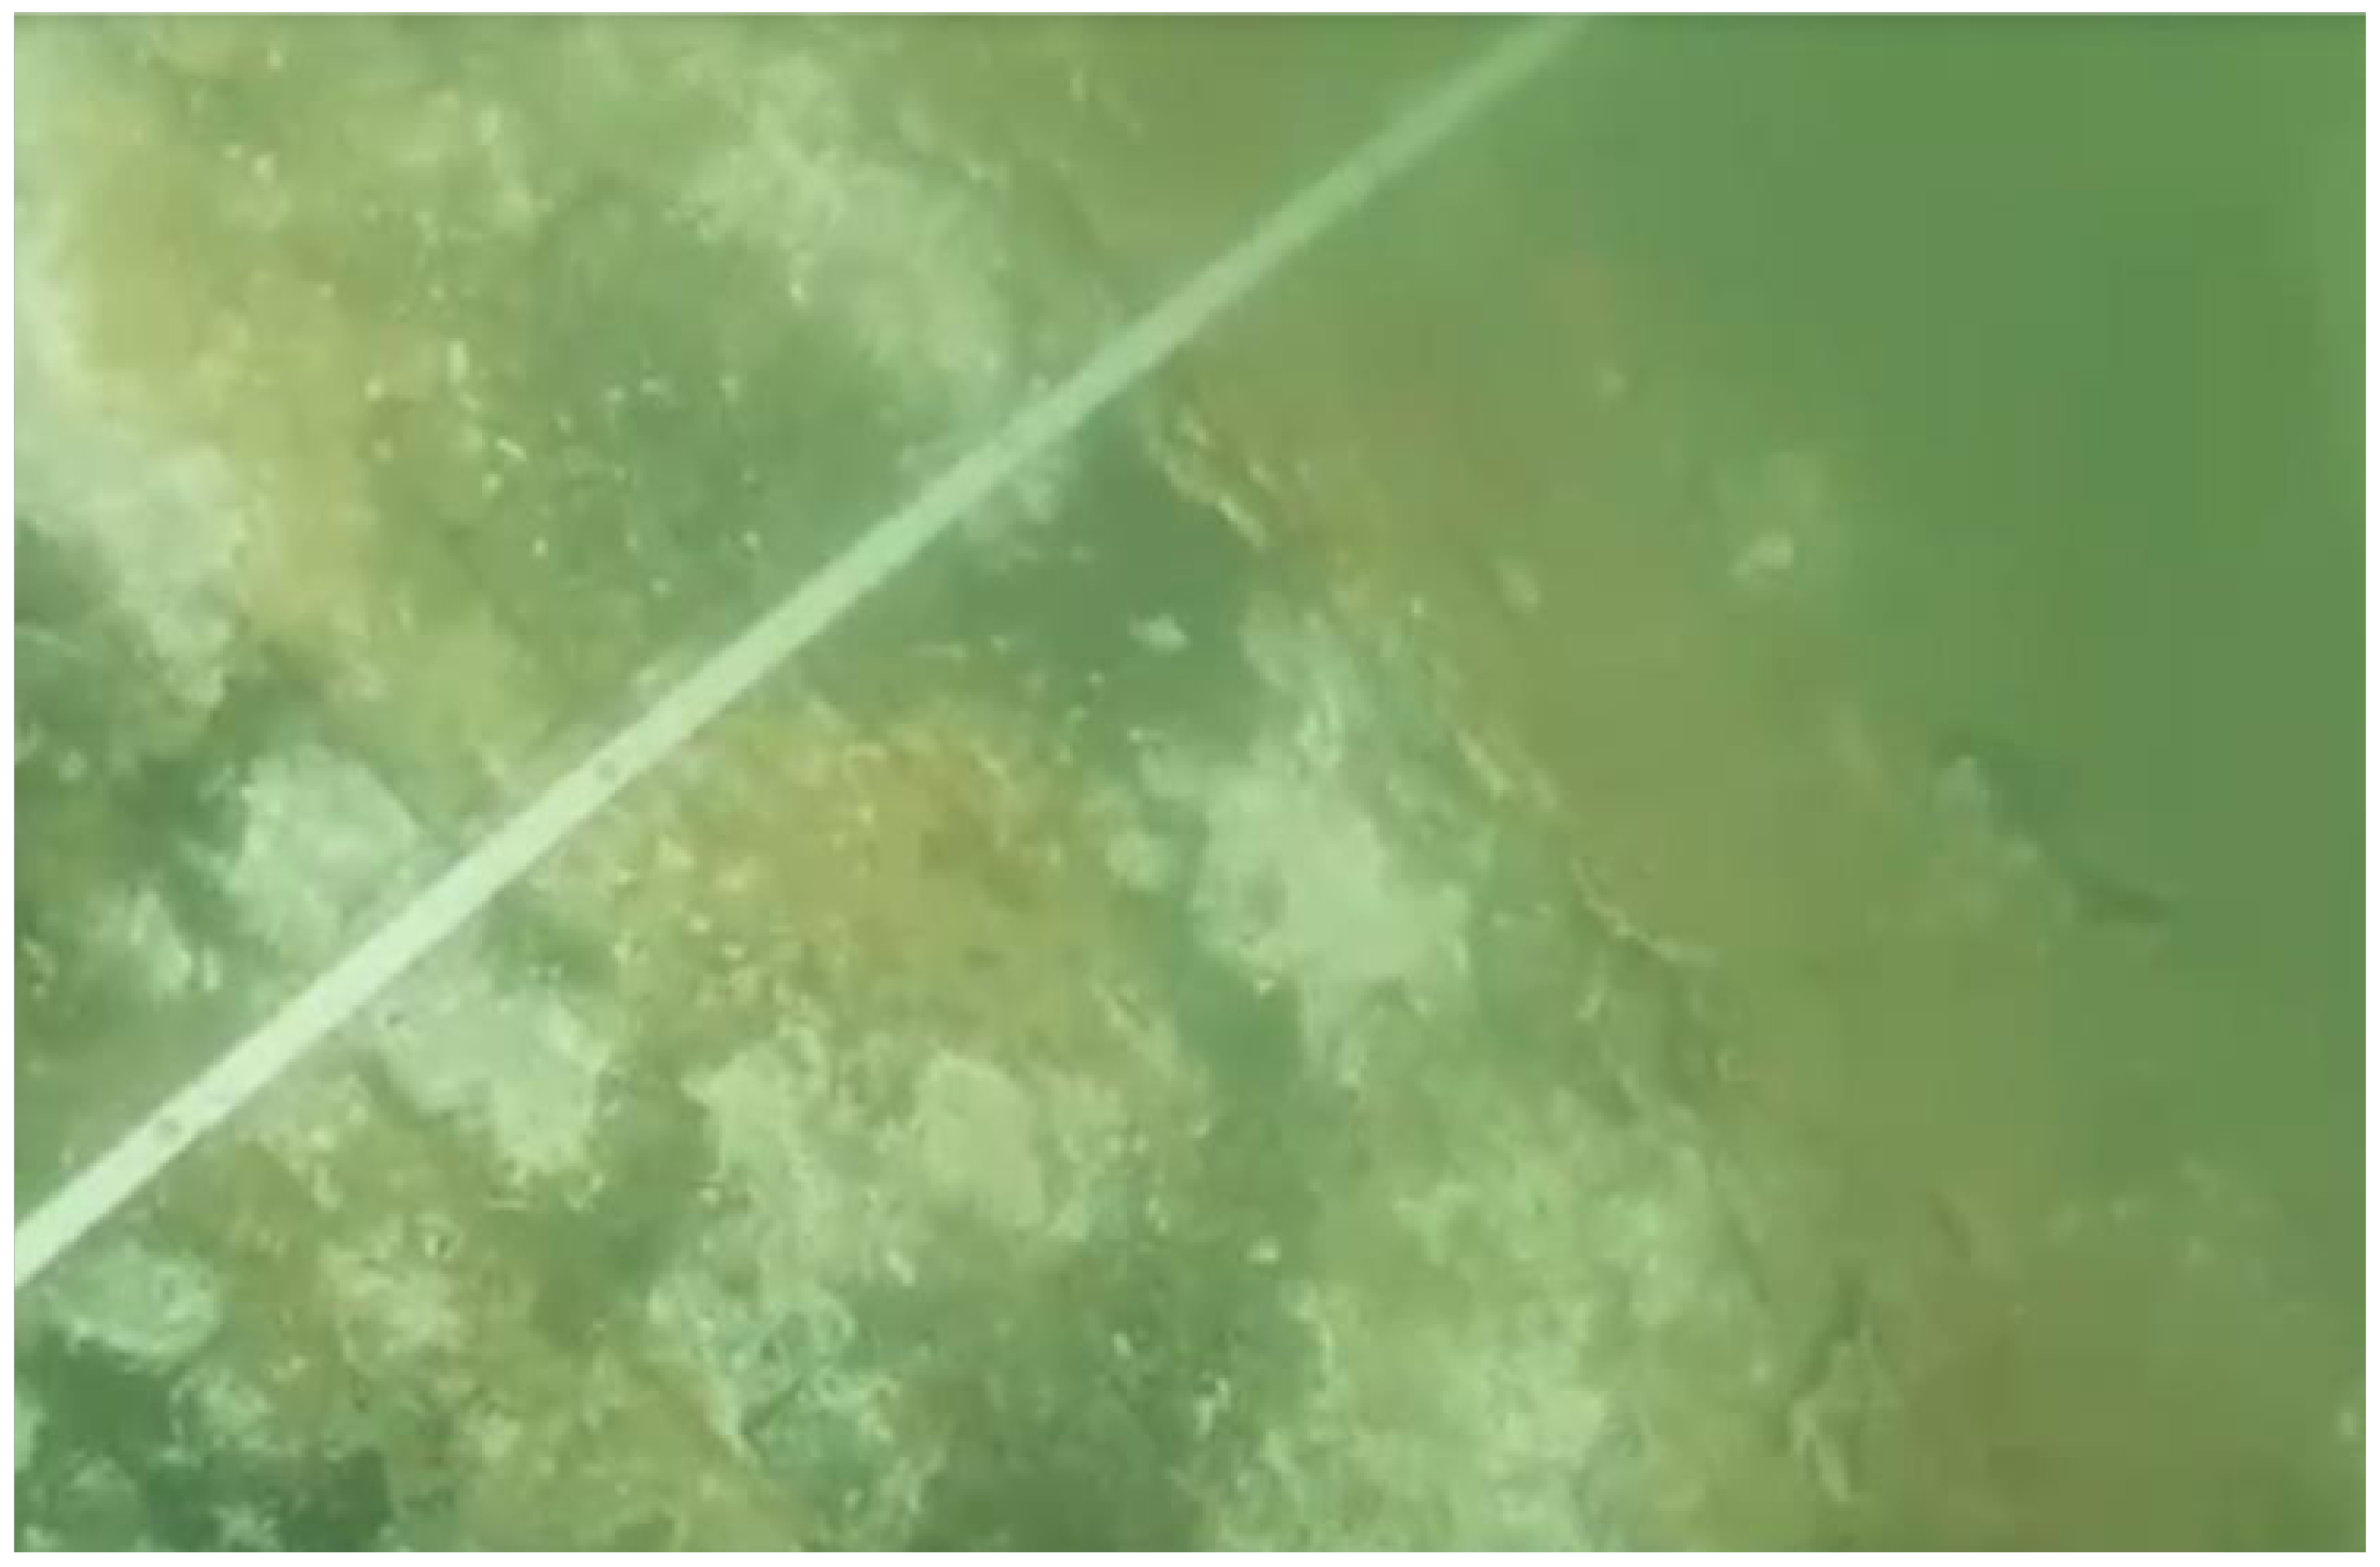
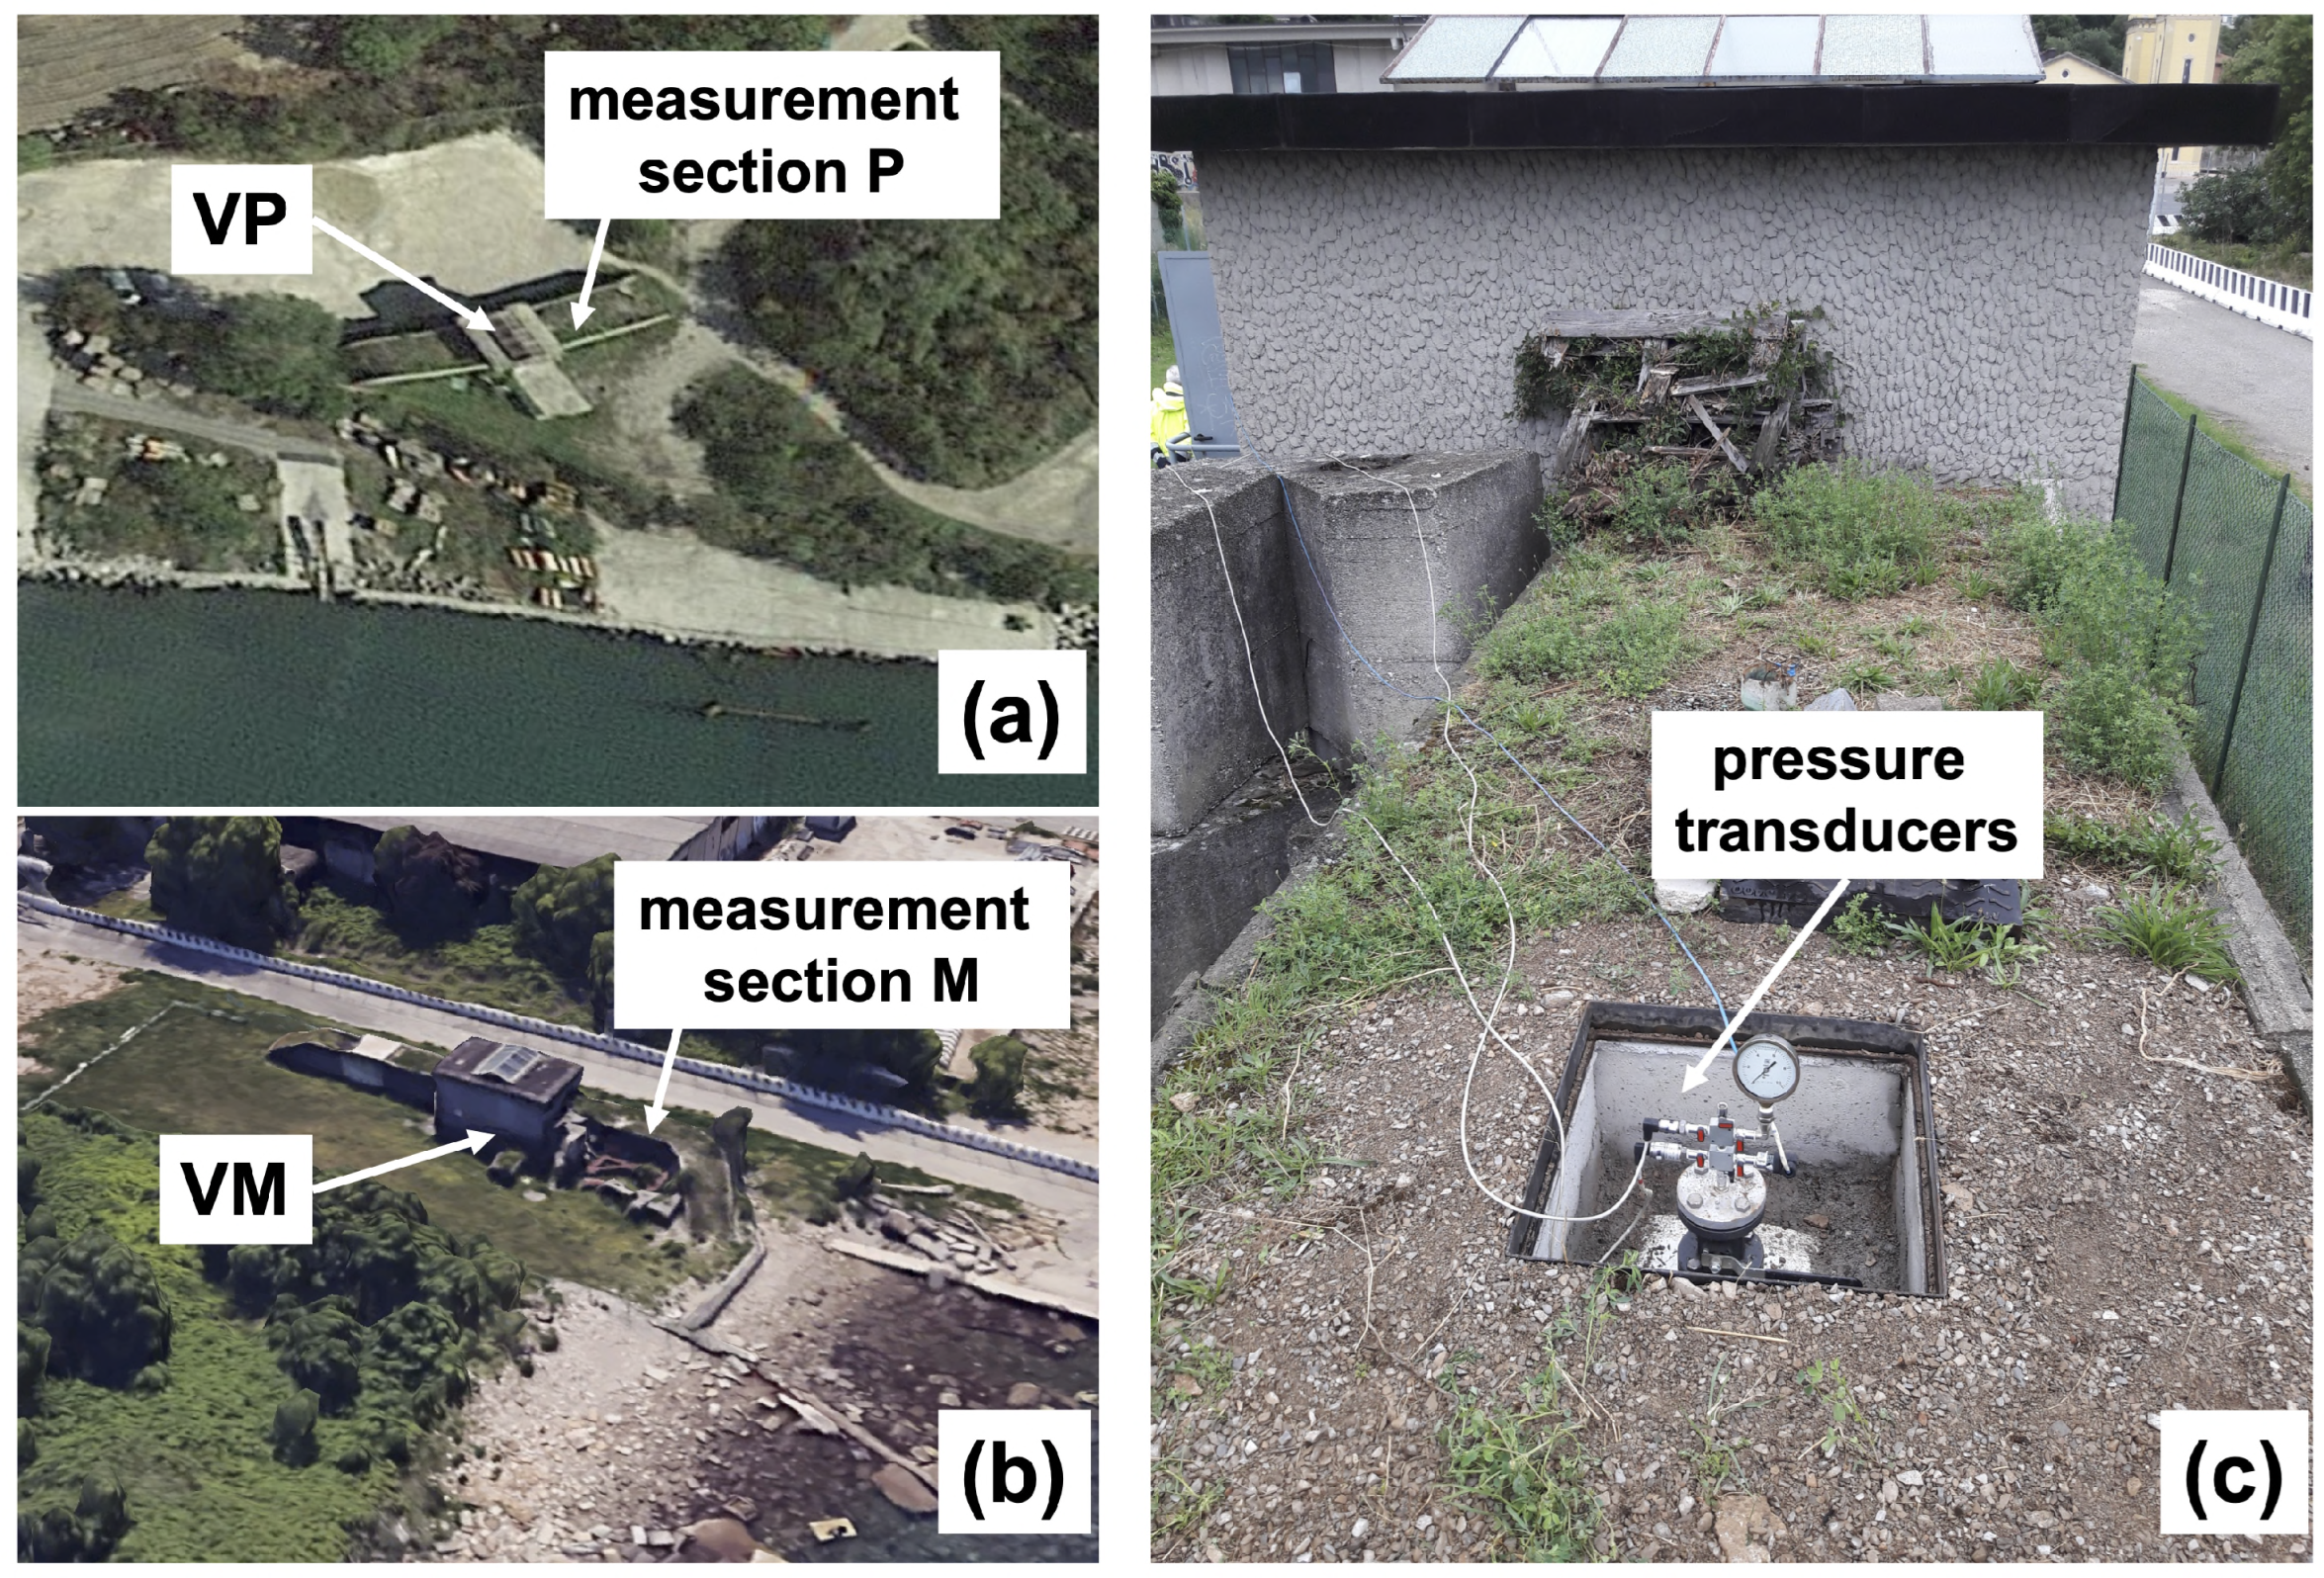
Figure 1 shows a typical example of the environment around an SP and the external condition of its outer surface; it gives an idea of the difficulty experienced by divers in investigating the condition of SPs.
The limitations of the above technologies, which affect their performance and applicability, as well as their high cost, underscore the need for continued innovation in SP diagnostics to provide a more comprehensive, cost-effective, and safer solution for the industry. It is clear that any new technology must first be demonstrated on a simple pipe in a controlled laboratory environment, possibly after preliminary numerical simulations, and then applied to real SPs. This is the case for transient-test-based techniques, (TTBTs) which, after numerical experiments, have been tested in the laboratory (e.g., [
19,
20,
21,
22,
23,
24,
25,
26,
27]), and then refined in real pipe systems (e.g., [
28,
29,
30,
31,
32]). These techniques require the generation of sharp but small-amplitude pressure waves. The basic concept of the TTBTs depends on the dynamics of transient phenomena in pressurized flows. In particular, the inserted pressure waves propagate along the pipeline and interact with any existing anomalies such as leaks, extended blockages, and wall deteriorations. This interaction results in a distinct feature in the pressure signal (the pressure time history): a leak reflects a negative pressure wave; a discrete blockage (e.g., a partially closed in-line valve) reflects a positive pressure wave; an extended partial blockage and wall deterioration give rise to “positive bell” and “negative bell” shape features, respectively (e.g., [
20,
21,
24,
33,
34,
35,
36,
37,
38,
39,
40,
41,
42,
43,
44]). However, the application of these techniques to long SPs represents an uncharted area of research. The Trieste SP offers an ideal scenario to fill this gap. In fact, the effectiveness of TTBTs in pipeline fault detection can be compromised by the presence of branches and junctions, which attenuate pressure wave propagation—a critical component for the detection mechanism. The Trieste SP, which will be described in the following in more detail, characterized by a considerable length, large diameter, and the absence of branches, enables a more direct and uninterrupted propagation of pressure waves, making it an exemplary model for assessing the feasibility and reliability of TTBTs in similar large-scale applications.
To successfully implement TTBTs for the diagnosis of real SPs, it is essential to address two issues. The first involves selecting the most appropriate maneuver to generate pressure waves. The second issue involves establishing a preparatory procedure tailored to the investigated system and the operational constraints. This preparation phase must take into account the specific characteristics of the pipeline under investigation, its boundary conditions, and any restrictions imposed by the water company to minimiae service interruptions. Factors such as the layout of the system, the positioning of valves and sensors, and the operational conditions of the pipeline must be taken into account to generate meaningful diagnostic data. In addition, the correct application of TTBTs requires a precise setup to ensure that the transient phenomena can be accurately induced and measured. From this perspective, the transient test must be preceded by a stabilization phase to ensure that the system reaches a reliable steady state. This step is essential to prevent the superposition of “ad hoc” generated pressure waves on pre-existing pressure fluctuations, which could compromise the reliability of subsequent pressure signal analyses [
45]. Establishing such baseline conditions is essential for accurately interpreting wave reflections and distinguishing between the transient response of a fault-free system and further pressure waves due to faults. In other words, as with many operations, the preparation phase greatly influences the successive analysis of the pressure signals and then the outcome of the fault detection procedure.
To illustrate in detail the results of the executed field tests and the crucial preparatory phase of the tailored approach followed, a set of two companion papers has been prepared. This first paper focuses on the operations performed before the transient tests, while the second presents and discusses the results of the fault detection procedure. Accordingly, in this paper, a brief overview of the SP investigated is given first. Then, the choice of the maneuver type is explained, and the experimental procedure breakdown is described, indicating all of its steps. Finally, some considerations about the preparatory phase are offered from the management point of view.
2. Materials and Methods
In the first subsection, the characteristics of the Trieste SP are presented; in the second subsection, the preliminary survey is described; in the third subsection, the hydraulic characterization of the device used for generating the pressure waves is provided; finally, in the fourth subsection, the field procedure breakdown—i.e., all the maneuvers to be carried out—is described.
2.1. An Overview of the Trieste Water Supply System
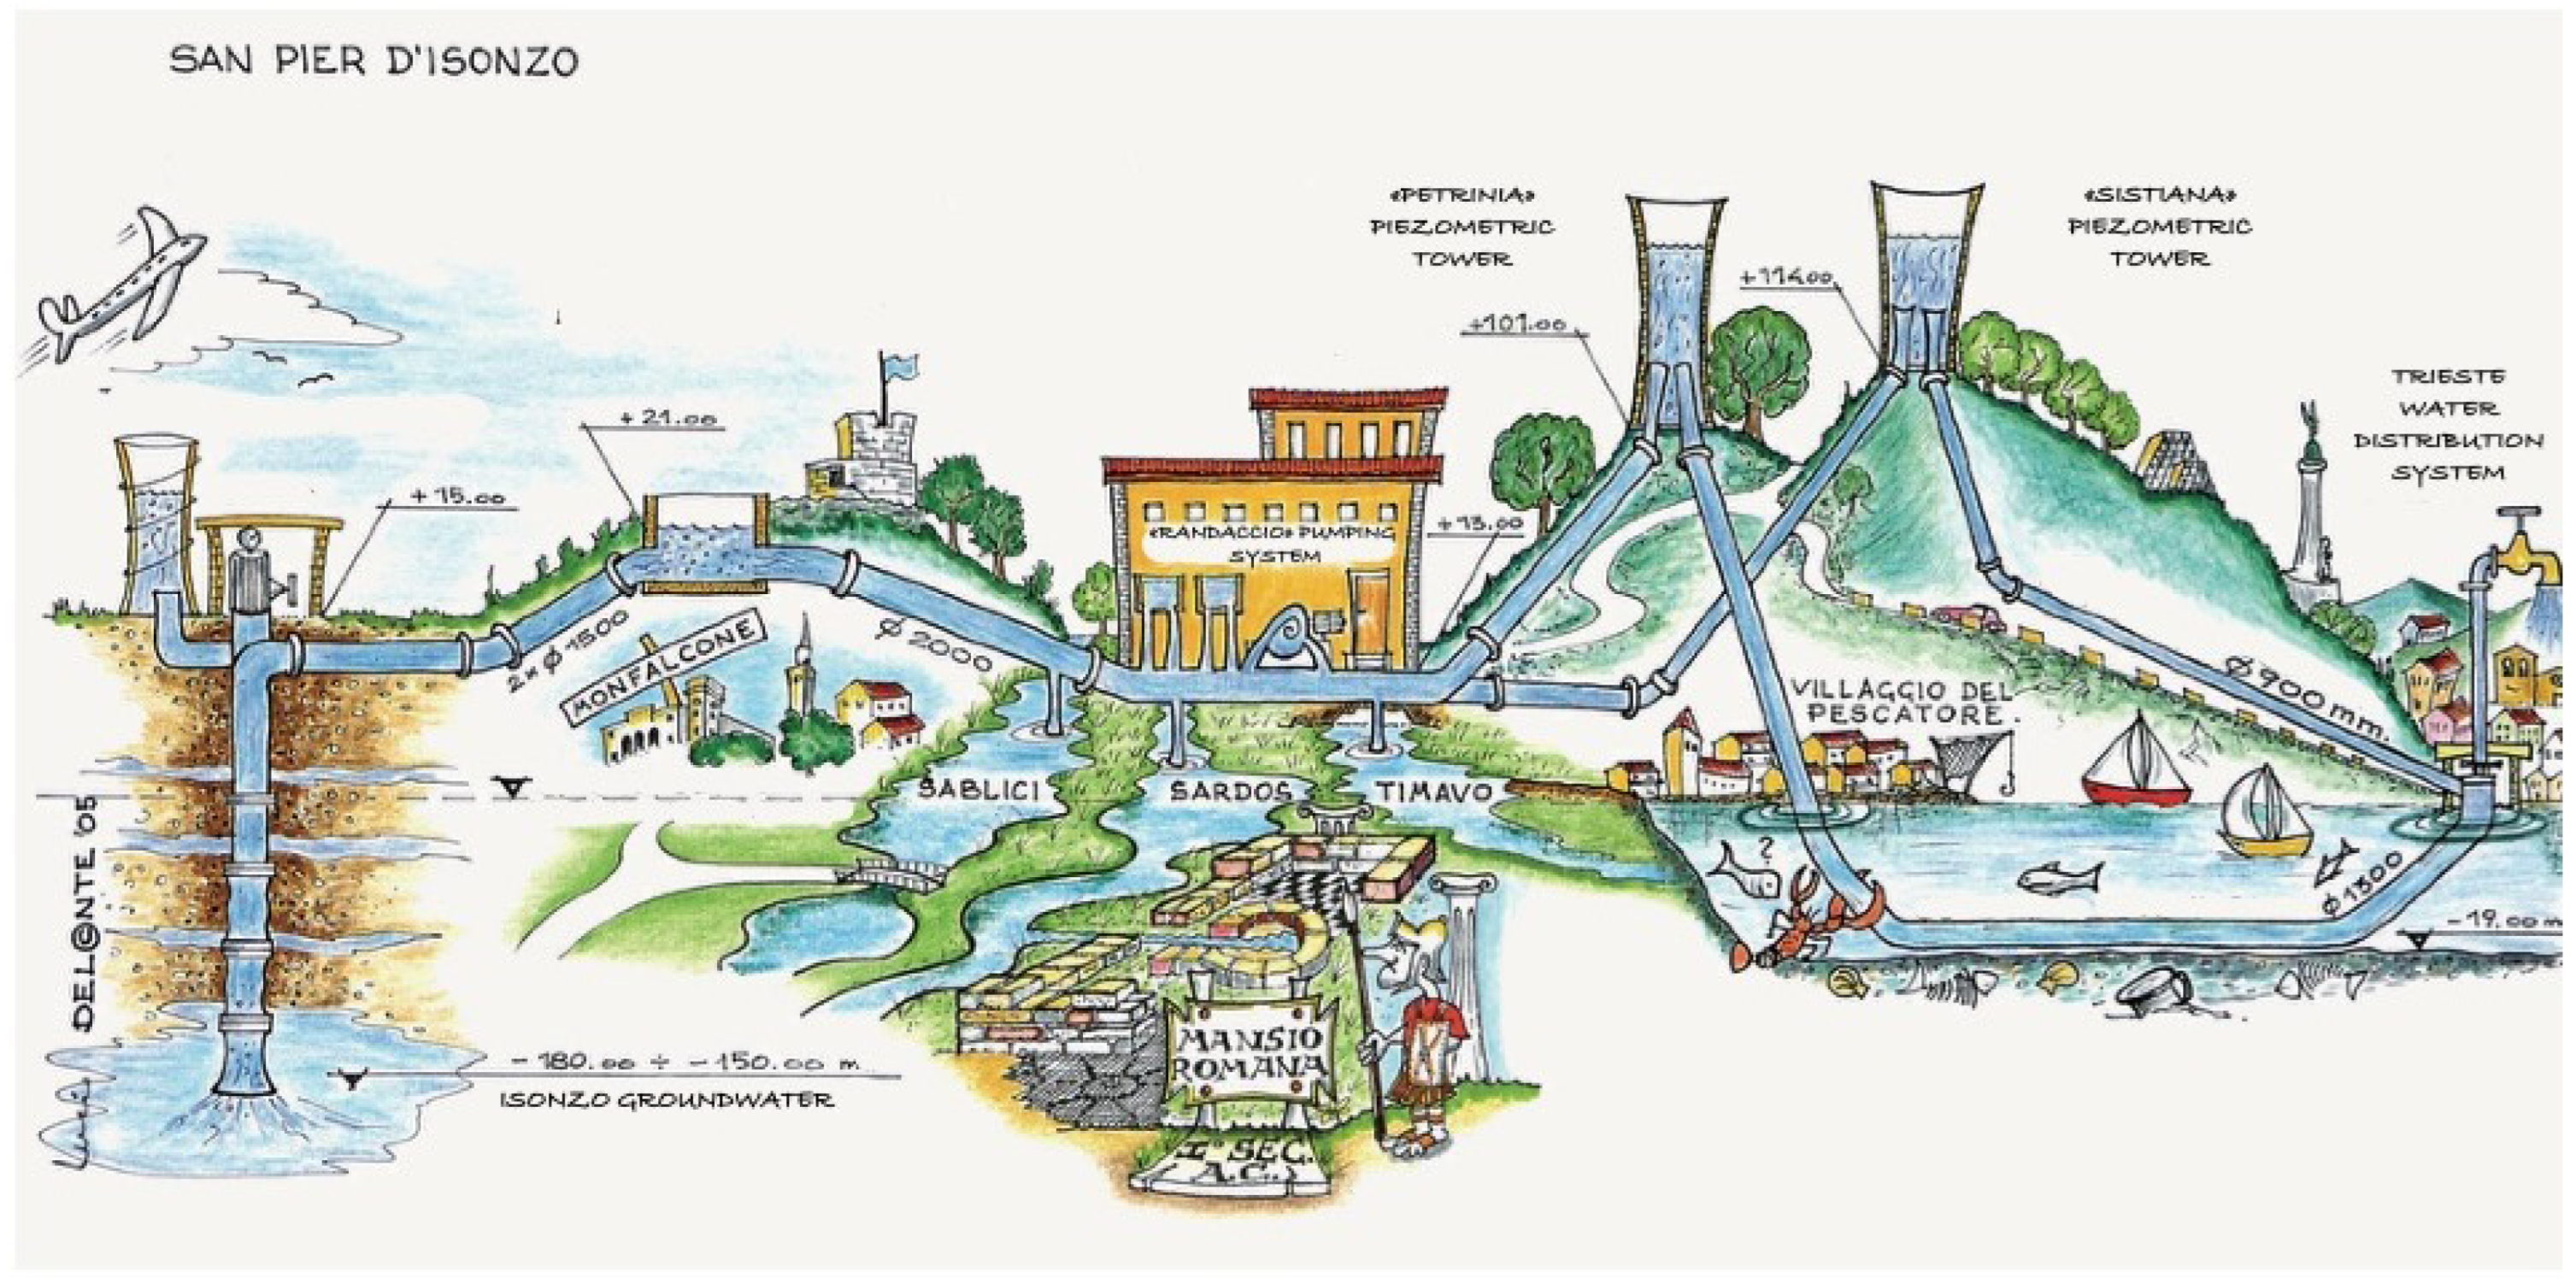
Trieste, a city on the border between Italy and Slovenia, draws its water from 13 wells in San Pier D’Isonzo (
Figure 2). Once extracted from the deep karst strata, the water is conveyed through a main pipeline to the Randaccio pumping station—the heart of Trieste’s water supply system—where it also undergoes treatment processes.
From the Randaccio pumping station, the treated water is conveyed to the city of Trieste via a dual-pipe system managed by AcegasApsAmga SpA (Hera Group). This dual system ensures a continuous water supply and provides a backup in the event of a problem with one of the pipelines. In particular, there is a 900 mm diameter steel pipeline, almost a century old, that runs under the coastal road to Trieste. The Sistiana piezometric tower along this pipeline ensures constant pressure, facilitating efficient water delivery. Two needle valves have recently been installed on this pipeline to optimize the water supply system through automatic pressure adjustment. Successively, in response to the increased water demand in Trieste, an SP was built in 1970, designed by G. Pistilli, one of the most talented Italian SP designers of the second half of the twentieth century (
Figure 3). It was constructed of layered steel, bituminous cast, and concrete, reinforced with two electro-welded meshes; the internal diameter,
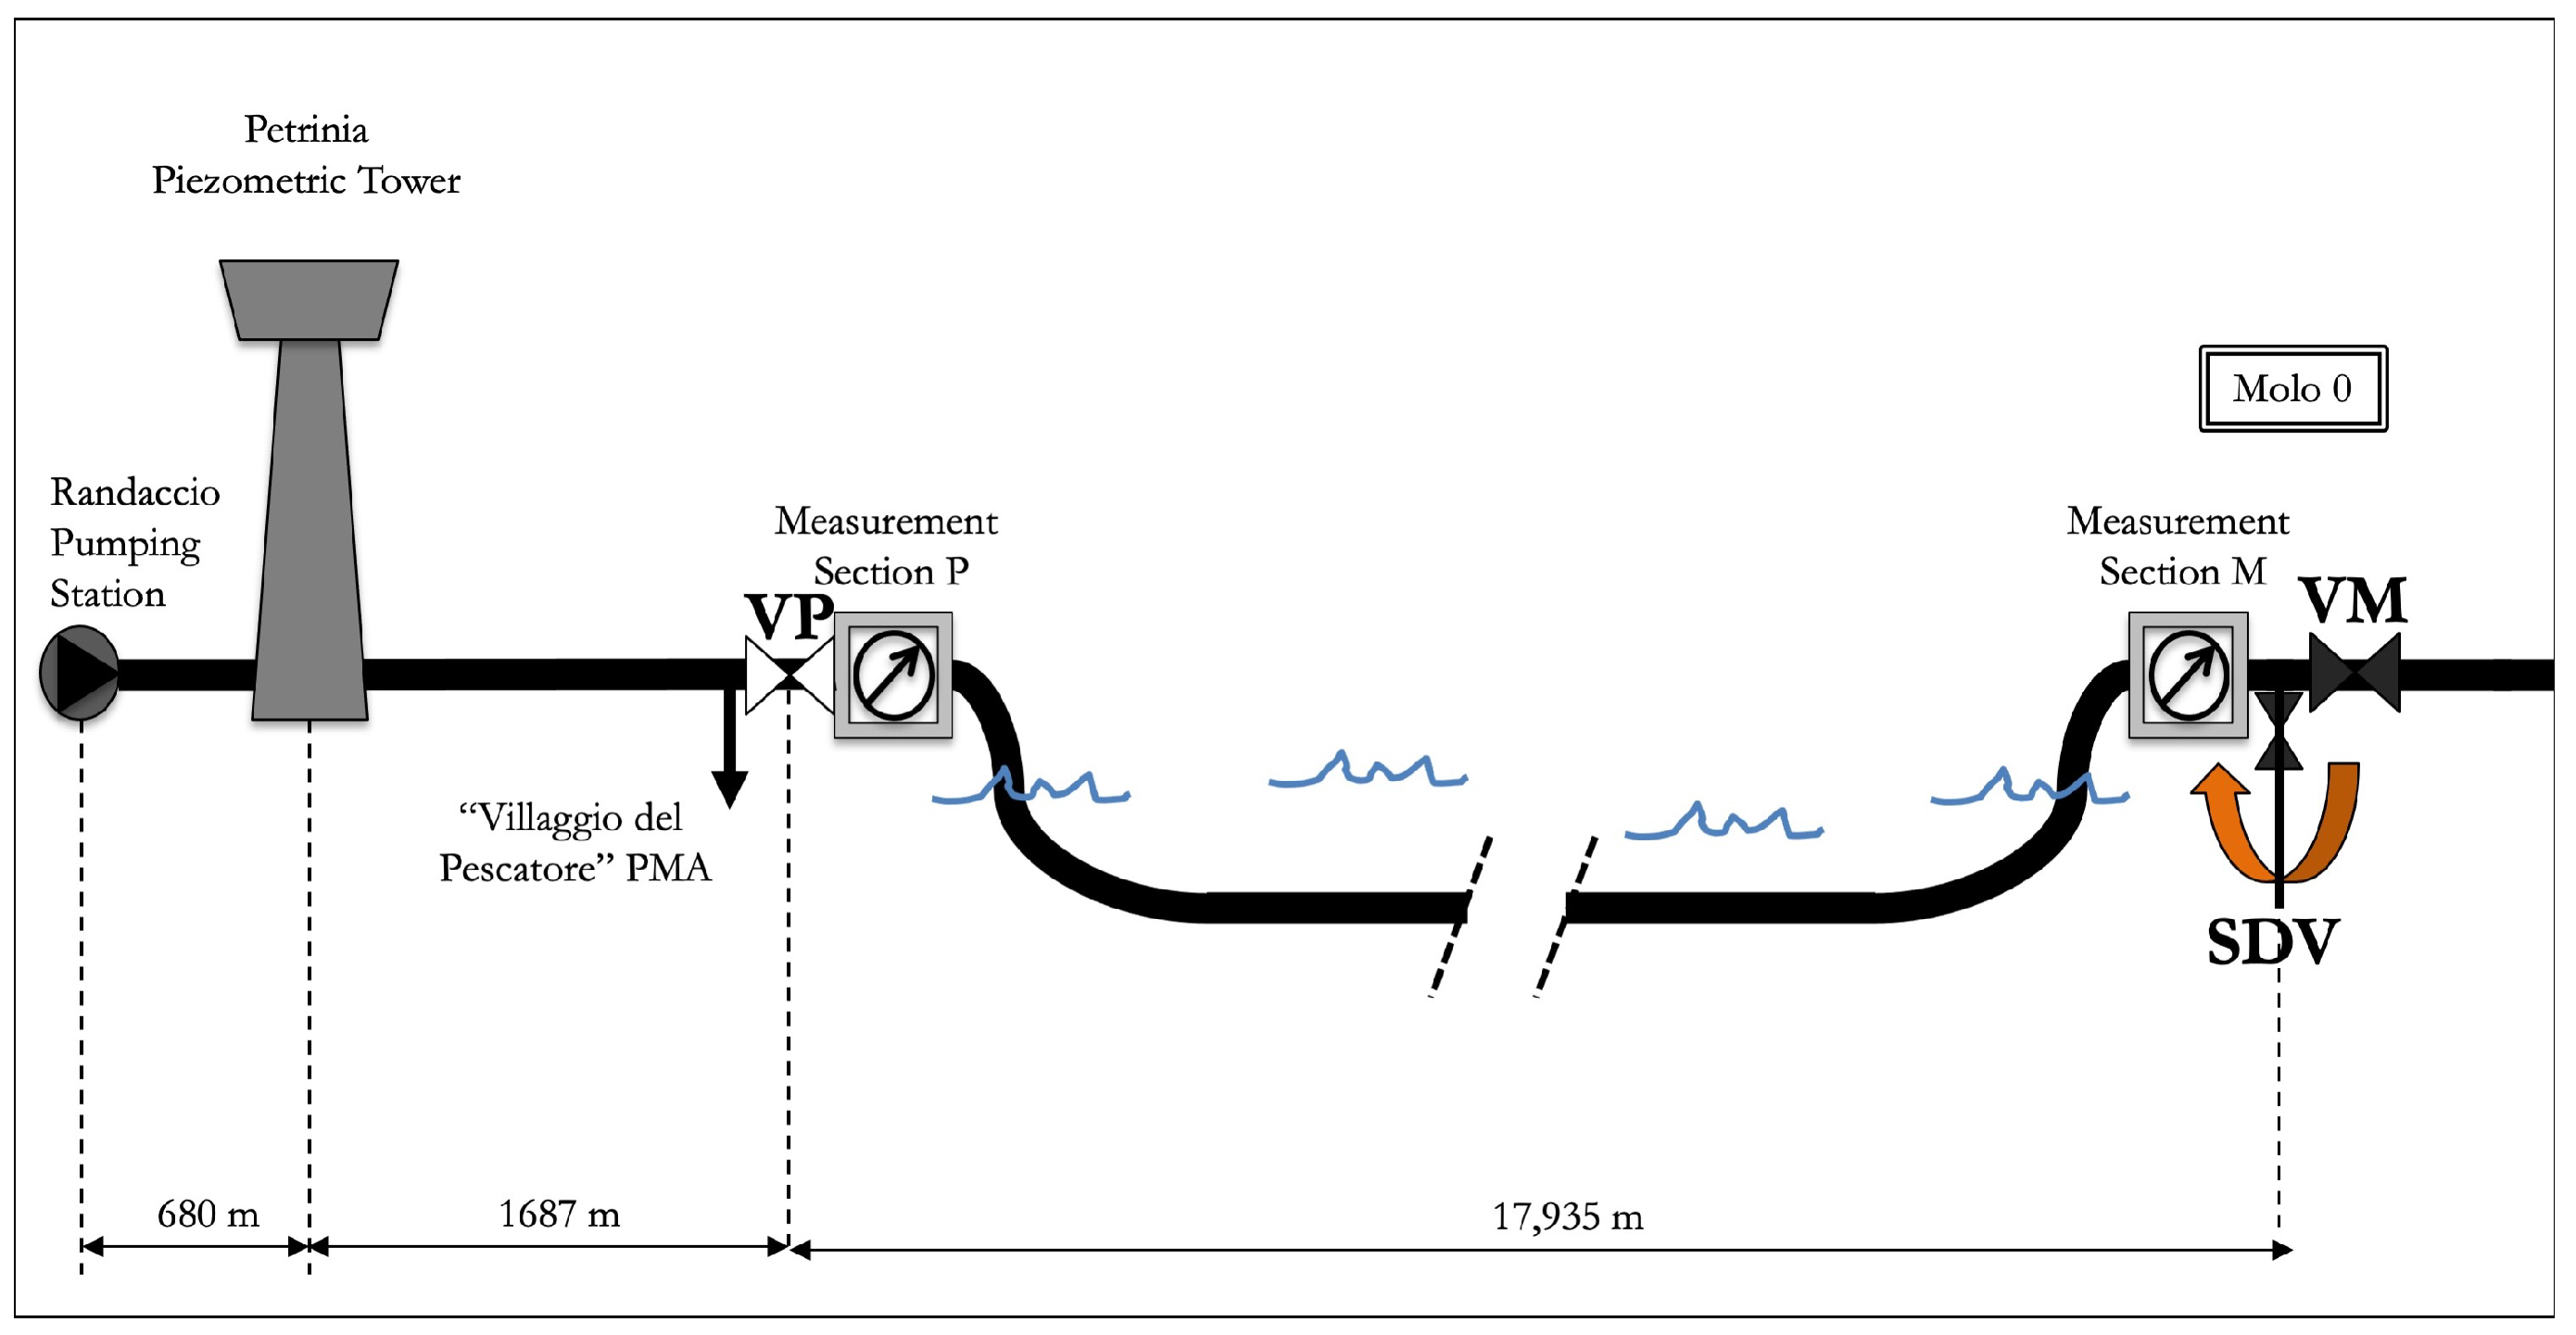
D, is equal to 1297 mm. The SP operates at about 7–8 bar pressure under typical functioning conditions. The overland section of the SP extends a total of 680 m, connecting the Randaccio pumping station to the Petrinia piezometric tower. In addition, the pipeline extends for a further 1687 m, connecting the Petrinia piezometric tower to the VP in-line valve near the quarry in Villaggio del Pescatore, a very small settlement. In the immediate vicinity of Villaggio del Pescatore, several connections are active: (i) a branch to the Villaggio del Pescatore District Metered Area (DMA) via a DN100 iron pipe, (ii) a DN100 HDPE service line supplying a hotel, and (iii) two DN350 and DN150 iron pipe branches. Downstream of VP, the pipeline submerges for 17,935 m and connects VP to the in-line valve VM at Molo 0 of Porto Franco Vecchio. Just upstream of the VM, the device used for generating the transients is installed, as discussed in the third subsection. The pipeline emerges briefly before joining the existing supply lines near Viale Miramare.
2.2. A Preliminary First Survey Evaluating the System Response to Maneuvers
The initial phase of the field procedure involves executing a preliminary survey to evaluate the system’s response to maneuvers performed, for example, by existing devices, such as valves and pumps, in exploratory tests. Despite the potentially time-intensive nature of this preliminary phase, it is fundamentally crucial for two main reasons: it allows the exploration of the possibility of executing reliable transient tests with the existing devices, and it facilitates the comprehension of the system’s transient response, enabling the design of optimally tailored tests. As demonstrated in previous research [
46], certain transients have been identified as unsuitable for fault detection due to the nature of the resulting pressure waves. Specifically, two maneuvers were conducted using existing infrastructure: pump switching off and closure of the VM valve. The pump switching off led to a gradual decrease in pressure. The effectiveness of these transients for fault detection was compromised by several factors. Firstly, the location of the Petrinia piezometric tower, positioned between the point of pressure wave insertion and the system, acted as a filter. The mass of water in the tower introduced significant inertia, affecting the transmission of pressure waves. Secondly, the slow nature of the pump deactivation, due to its inertia, resulted in pressure waves that were too gradual for effective fault detection. Additionally, the VM valve’s large diameter prevented rapid closure. Despite an initial partial closure to reduce flow, the final manual closure of the valve was too slow to produce detectable reflected pressure waves in the signal, rendering the transient ineffective for identifying faults.
Even if alternative methods for generating pressure waves must be sought, this phase is pivotal in allowing the real-time observation of the system’s response to transients, surpassing the predictive capabilities of numerical modeling. It is important to note that relying solely on numerical modeling for analyzing transient responses may be inadequate due to the complexity of modeling certain factors accurately, such as unsteady friction and particularly the authentic behavior of boundary conditions. The latter factor is critical for understanding the transient response and is difficult to predict without empirical evidence. Therefore, such a preliminary survey is instrumental in monitoring and understanding the behavior of these complex factors. Accordingly, a second survey, as discussed below, was designed.
2.3. Hydraulic Characterization of the Maneuver Valve
In order to insert small, sharp pressure wave into the system (a prerequisite for the safe and successful implementation of TTBTs for anomaly detection), a special device must be used, as discussed in the previous subsection. For this, among the proposed devices, the portable pressure wave maker (PPWM) [
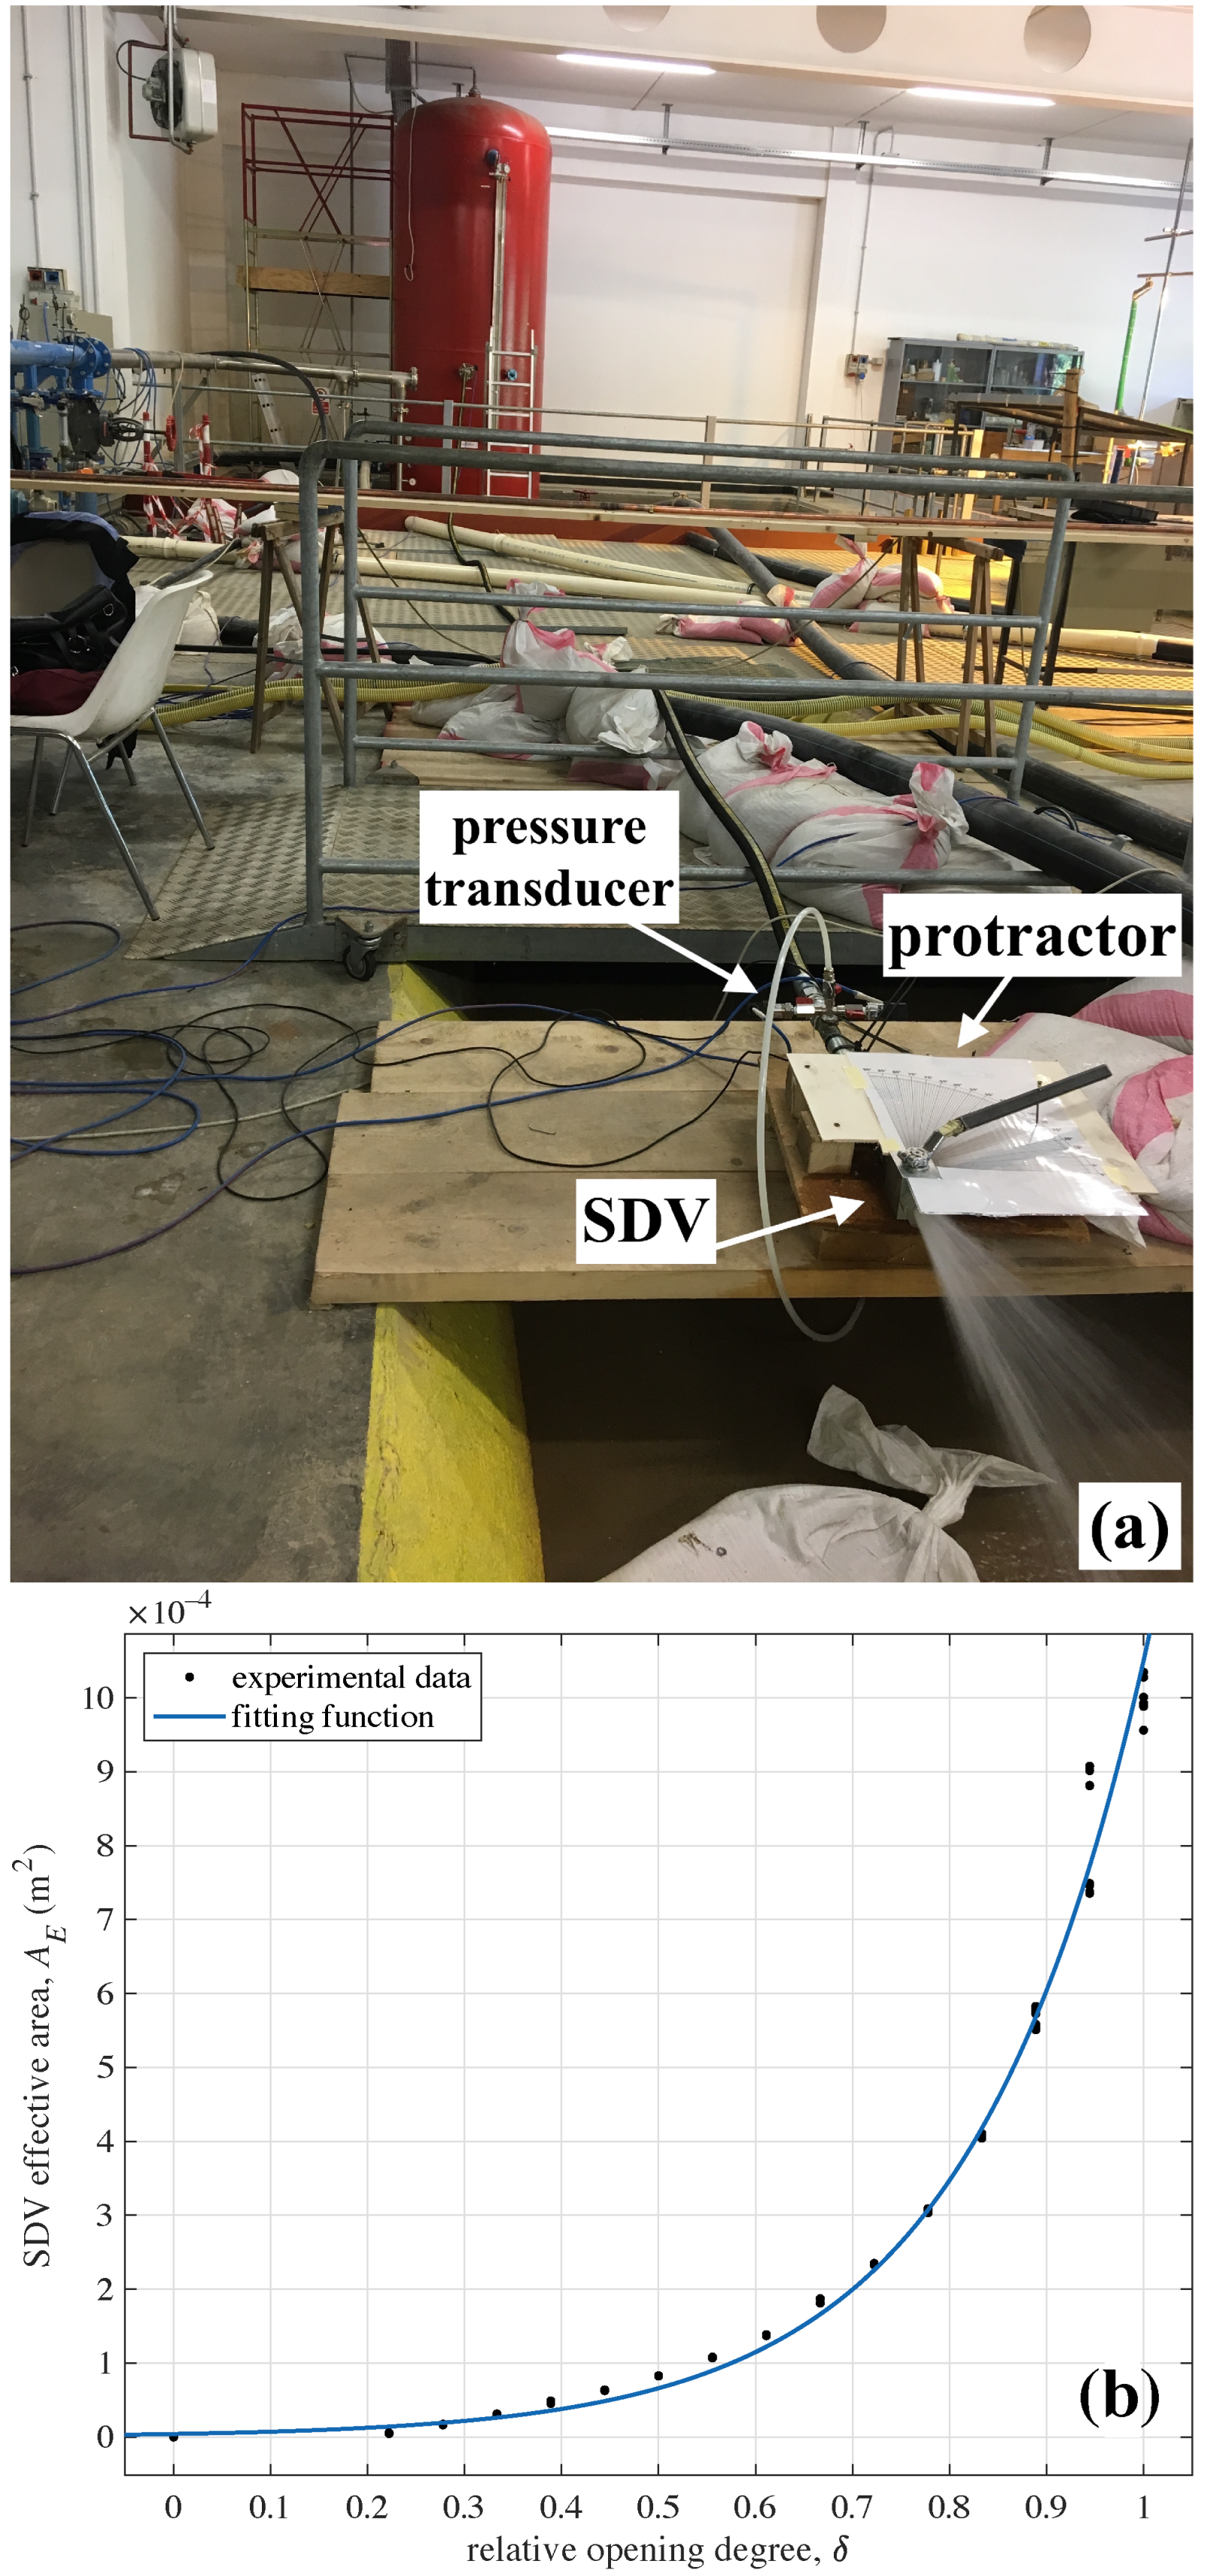
45] and a small-diameter side discharge valve (SDV), which have been extensively tested in real pipe systems, are suitable. For the sake of brevity, an SDV with a nominal diameter of DN32 was installed immediately upstream of the VM valve. A first action in the second survey design was the hydraulic characterization of such a valve. Specifically, steady-state tests were carried out at the Water Engineering Laboratory (WEL) of the University of Perugia, Italy (
Figure 4a). Specifically, the valve was equipped with a protractor, used to measure the opening degree, and a pressure transducer was installed immediately upstream of the SDV to measure the head loss across it (MATLAB R2022b codes were used to process the acquired data and generate plots.). In fact, as the valve discharges into the atmosphere, the measure of the upstream pressure directly allows the determination of the local head loss.
Tests have been executed by varying the opening degree and then the discharge, so that the SDV flow-rate curve was obtained using the orifice (Torricelli’s) equation:
in which
(m
2) is the valve effective area,
Q (m
3/s) is the discharge;
is the relative opening degree (with
= 1 (0) if the SDV is fully open (closed)),
(m) is the local head loss across the valve, and
g is the acceleration due to gravity (9.806 m/s
2). Experimental data are shown in
Figure 4b, and, given their trend, the following fitting function was obtained:
Equations (
1) and (
2) are essential for evaluating the pressure wave generated by maneuvering the SDV. Precisely, by assuming frictionless transients and an instantaneous total closure maneuver, the inserted pressure wave,
, can be evaluated through the Allievi–Joukowski formula, combined with the previously mentioned orifice equation [
47]:
where
H is the piezometric head,
a is the pressure wave speed (m/s),
z is the elevation, and the subscripts M and 0 indicate the measurement section and steady-state conditions preceding the transient event, respectively.
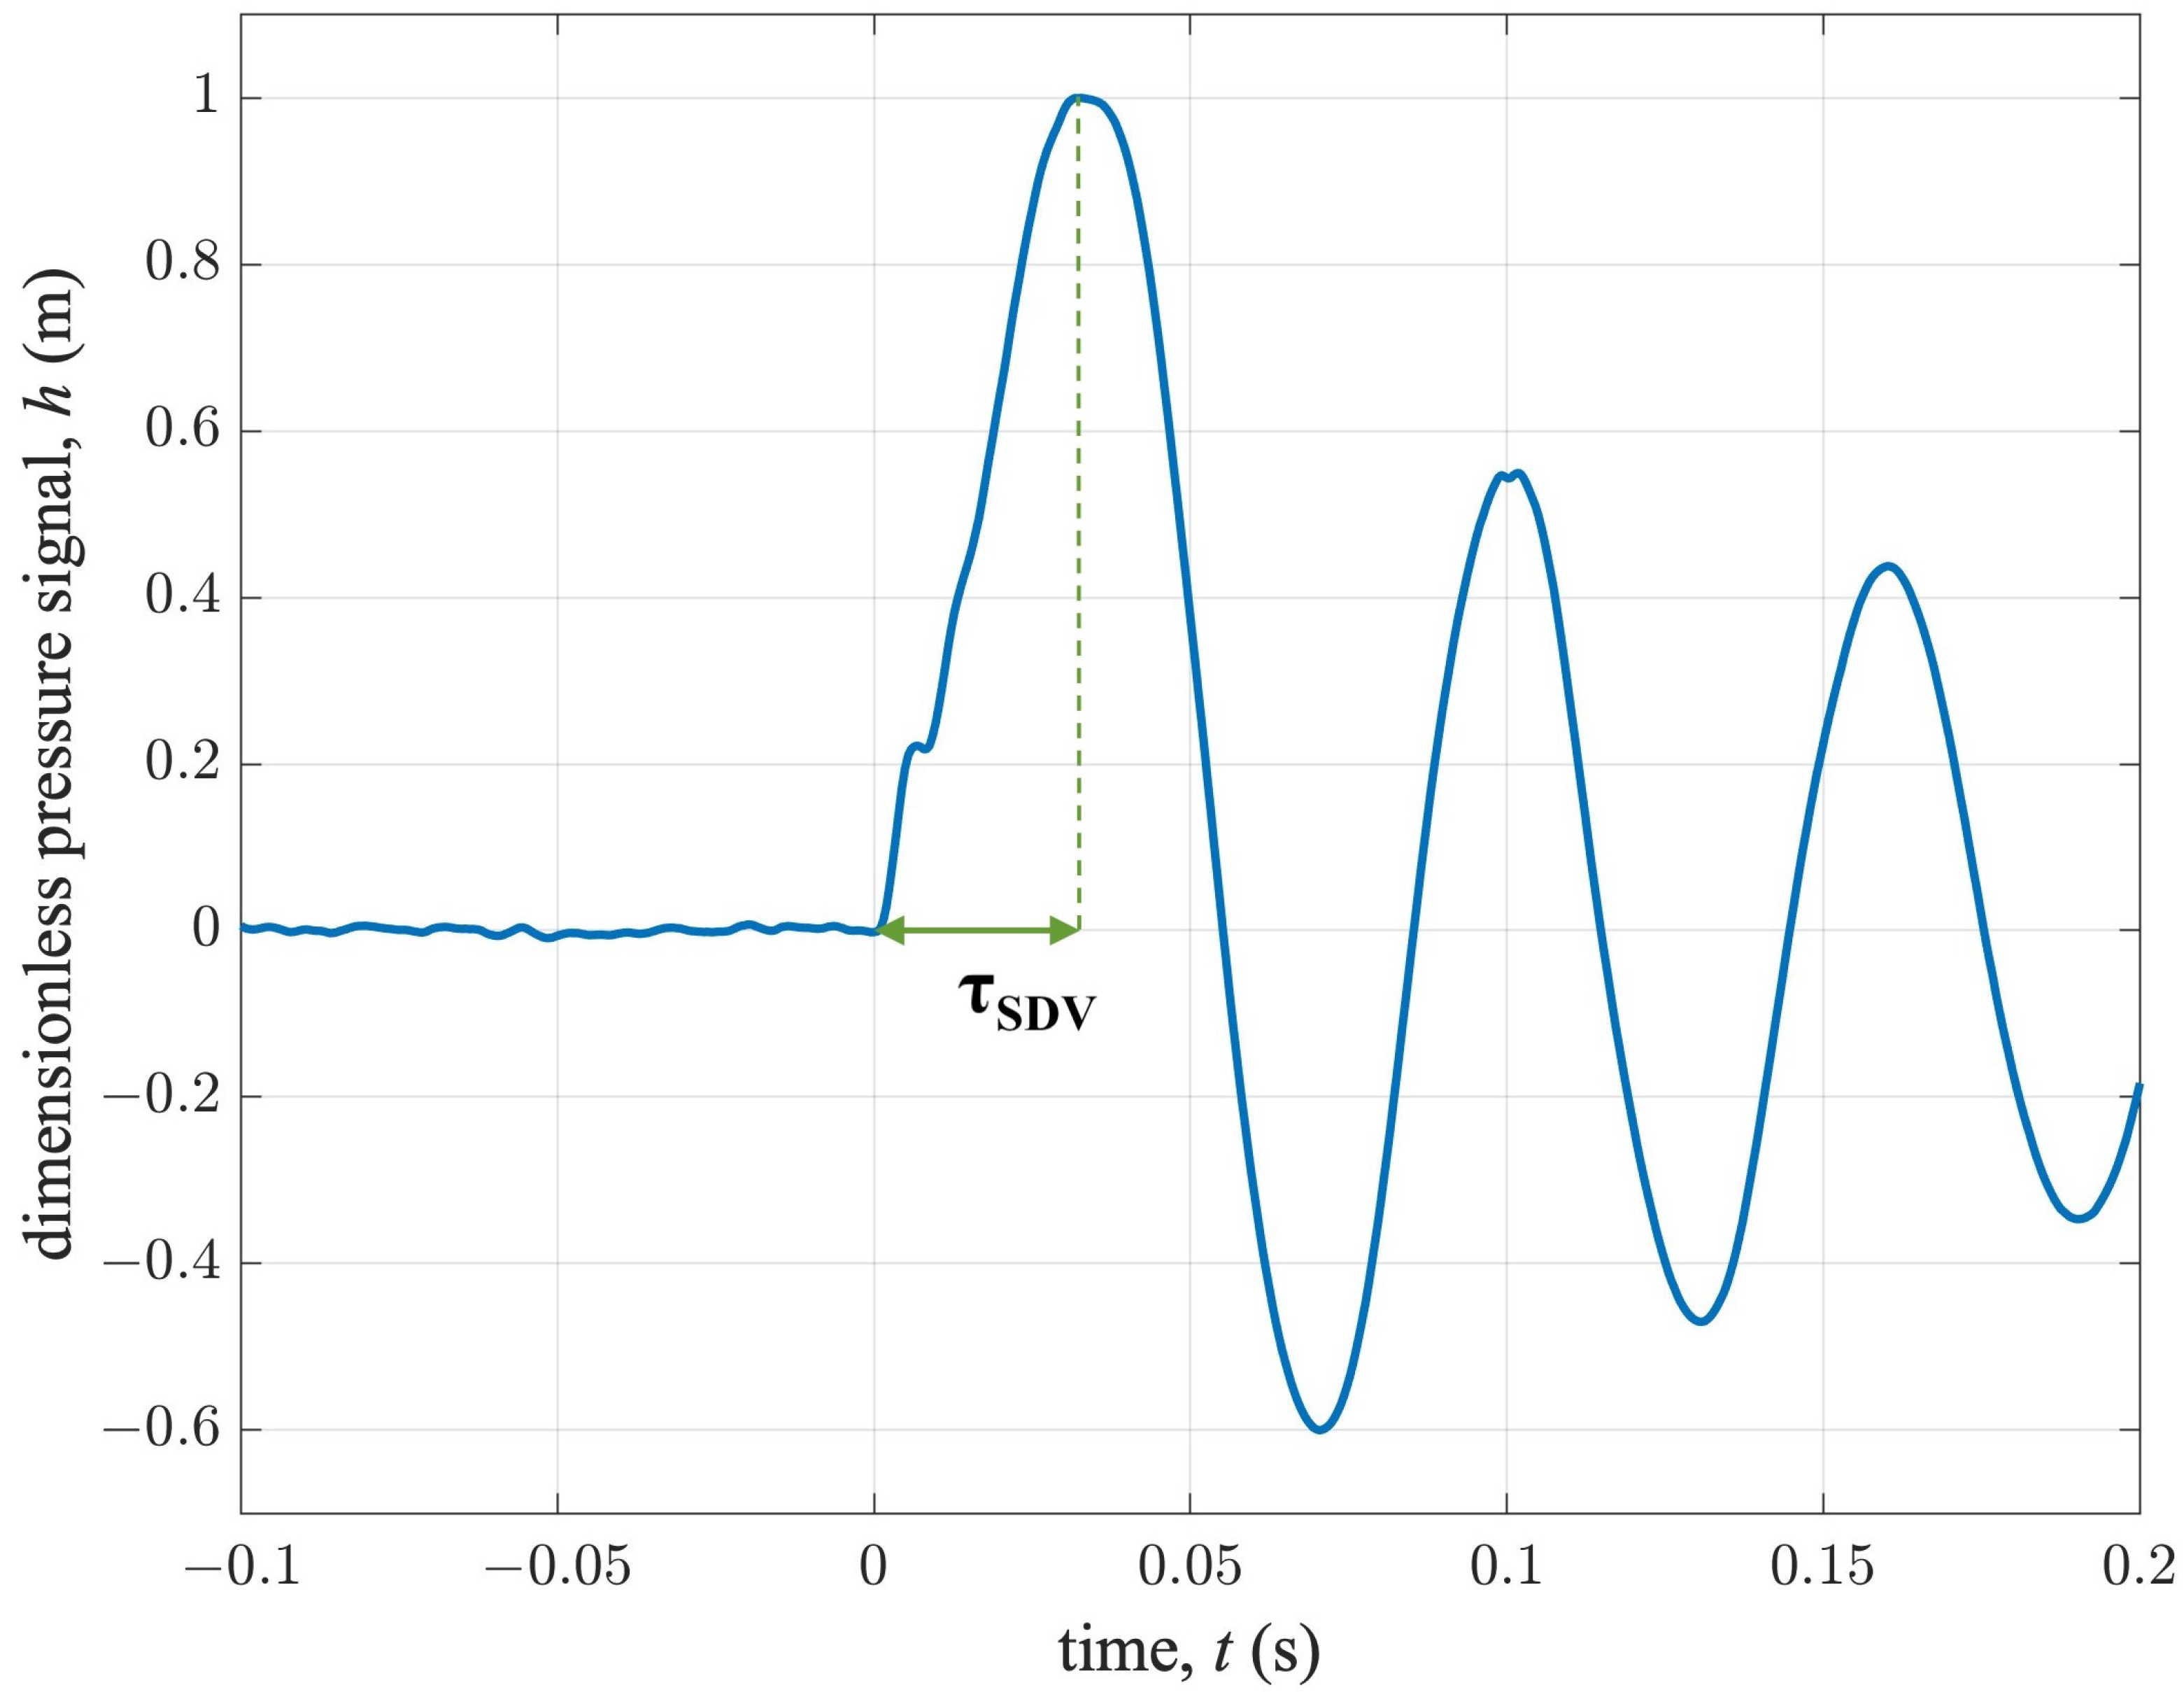
To accurately characterize the behavior of the SDV in unsteady-state conditions, transient tests were conducted by quickly closing the SDV.
Figure 5 shows the dimensionless pressure signal,
, acquired immediately upstream of the SDV, during a transient test. From such a pressure signal, the maneuver duration,
, is assumed as the time interval between the instant when the pressure signal deviates from steady-state conditions (i.e., the transient starts) and the instant when the overpressure is fully accomplished. Specifically, it is equal to about 0.03 s, indicating that the maneuver is fast. It is worth noting that the SDV’s relative opening degree in such a test was equal to about 0.22. Values larger than this were not tested to avoid the generation of large overpressures in the laboratory setup. Instead, in the field tests, larger values of
, and then of
, are expected, since the SDV is to be connected to a large-diameter pipe and then not-too-large overpressures are a concern. Nevertheless, the small value of
obtained in the laboratory transient test in
Figure 5 ensures that the maneuver performed with this valve in the SP will be sufficiently fast.
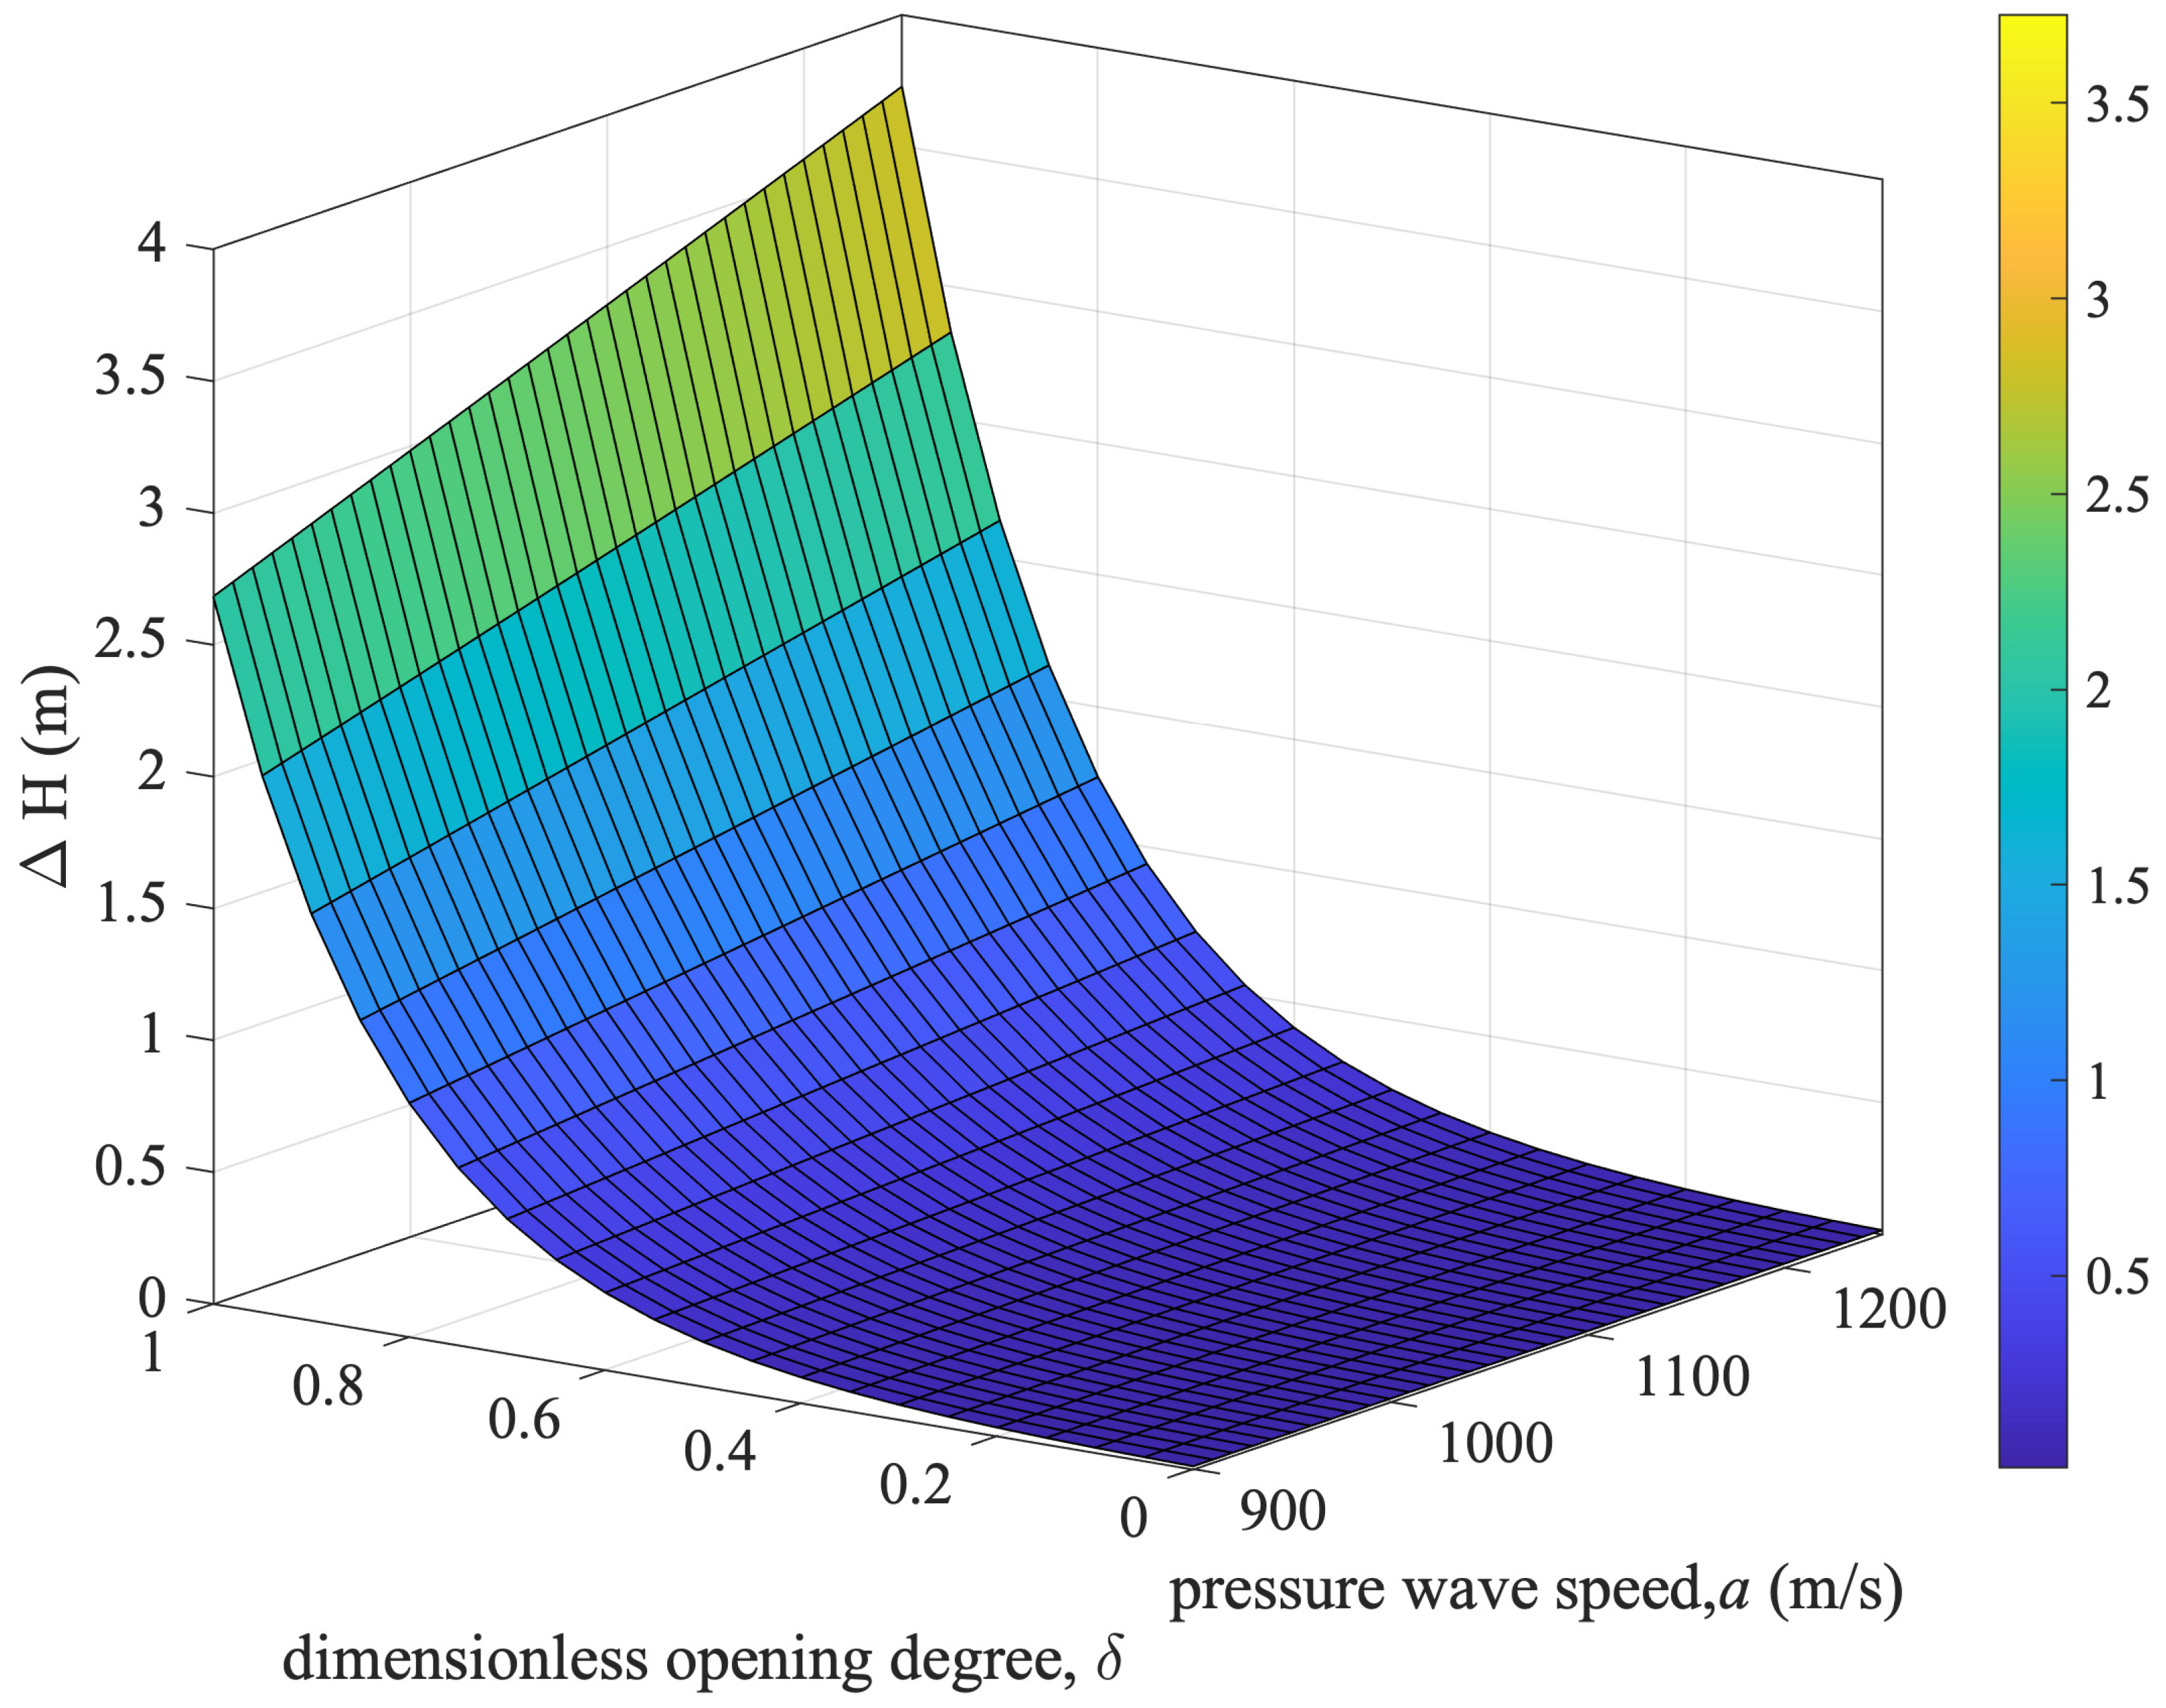
For the Trieste SP, consistent with the water supply monitoring, the value of
can be set at 70 m. Accordingly, in
Figure 6, the values of
for different
and
a values are reported. The selection of the
a values, ranging from 900 to 1300 m/s, is based on the mechanical and geometrical characteristics of the SP.
Figure 6 confirms that
does not exceed 3.73 m, which is well within the maximum overpressure threshold of the examined SP. Accordingly, the transients generated for fault detection by closing the SDV are safe for the SP.
2.4. Field Procedure Breakdown
To diagnose the considered SP as part of an articulated pipe system, a sophisticated procedure is implemented for the effective use of TTBTs. Pressure signals,
H, are acquired by piezoresistive transducers (
Figure 7c). These transducers operate at a frequency of 1000 Hz and are located at two measurement sections: section P, immediately downstream of the VP valve (
Figure 7a), and section M (
Figure 7b), immediately upstream of the VM valve. Importantly, within the TTBTs, there is no need to measure the discharge during the tests. The selected measurement sections are close to the submerged part of the SP and are easily accessible. It should be noted that there are no accessible sections in the approximately 18 km submerged section of the SP. Furthermore, the water utility company carries out daily operations of turning on and off pumps at the Randaccio pumping station in response to water demand. In particular, these operations are not considered dangerous for the SP due to the presence of two piezometric towers that mitigate the water hammer effects. Accordingly, the planned operations are as follows:
- 0.
At : initiate pressure monitoring at sections P and M;
- 1.
At : pump 8 switching off at the Randaccio pumping station;
- 2.
At : pump 9 switching off at the Randaccio pumping station;
- 3.
At : closure of the VM, with a maneuver duration, ;
- 4.
At : opening of the SDV;
- 5.
At : closure of the SDV (the transient test), with a maneuver duration, ;
- 6.
At : opening of the VM;
- 7.
At : pump 9 switching on at the Randaccio pumping station;
- 8.
At : pump 8 switching on at the Randaccio pumping station;
- 9.
At : end of the pressure monitoring and field procedure.
The actions in steps #1 and #2 are essential to reduce both pressure and discharge, thereby increasing the safety of subsequent transients. It is important to emphasize that the water needs, including the potential leakage and demand of the Villaggio del Pescatore DMA, are provided by the Petrinia piezometric tower. For the same reasons, it was decided not to close the VP valve. In addition, steps #1 and #2 were carried out independently to avoid unnecessary and excessive excitation of the SP.
Closing the VM (step #3) is an infrequent practice for the Trieste water company’s technicians, usually reserved for addressing maintenance issues (e.g., repairing leaks). For example, in the last eight years, this valve has only been operated once to repair a leak between the VM and the city of Trieste. Throughout this procedure, the maneuver was performed manually, with great care and a large value of the closure duration, (≃18 min), ensuring minimal pressure variations to prioritize the safety of the SP.
In step #4, the SDV is opened gradually until the desired opening degree is achieved. Once steady-state conditions are established, it is quickly (
≃ 0.3 s) and fully closed in step #5. As discussed in detail in the companion paper [
48], this maneuver ensures the generation of a small and then absolutely safe pressure wave.
Steps #6 to #9 are critical to returning the SP to its original operating conditions prior to the start of the survey. Specifically, in step #6, the VM valve is slowly reopened, re-establishing the original connection to the Trieste distribution system without placing undue stress on the infrastructure. During steps #7 and #8, the two pumps at the Randaccio pumping station are activated to smoothly return the SP to its normal operating state.
Pressure monitoring is then completed (step #9), confirming that the SP has returned to its pretest operating condition.
3. Transient Response of the Subsea Pipeline (SP) to the Field Procedure (Second Survey)
In this section, the Trieste SP response to transients generated during the second survey is described, and some remarks on the field test procedure are highlighted.
3.1. Transient Response of Maneuvers Indicated in Section 2.4
In
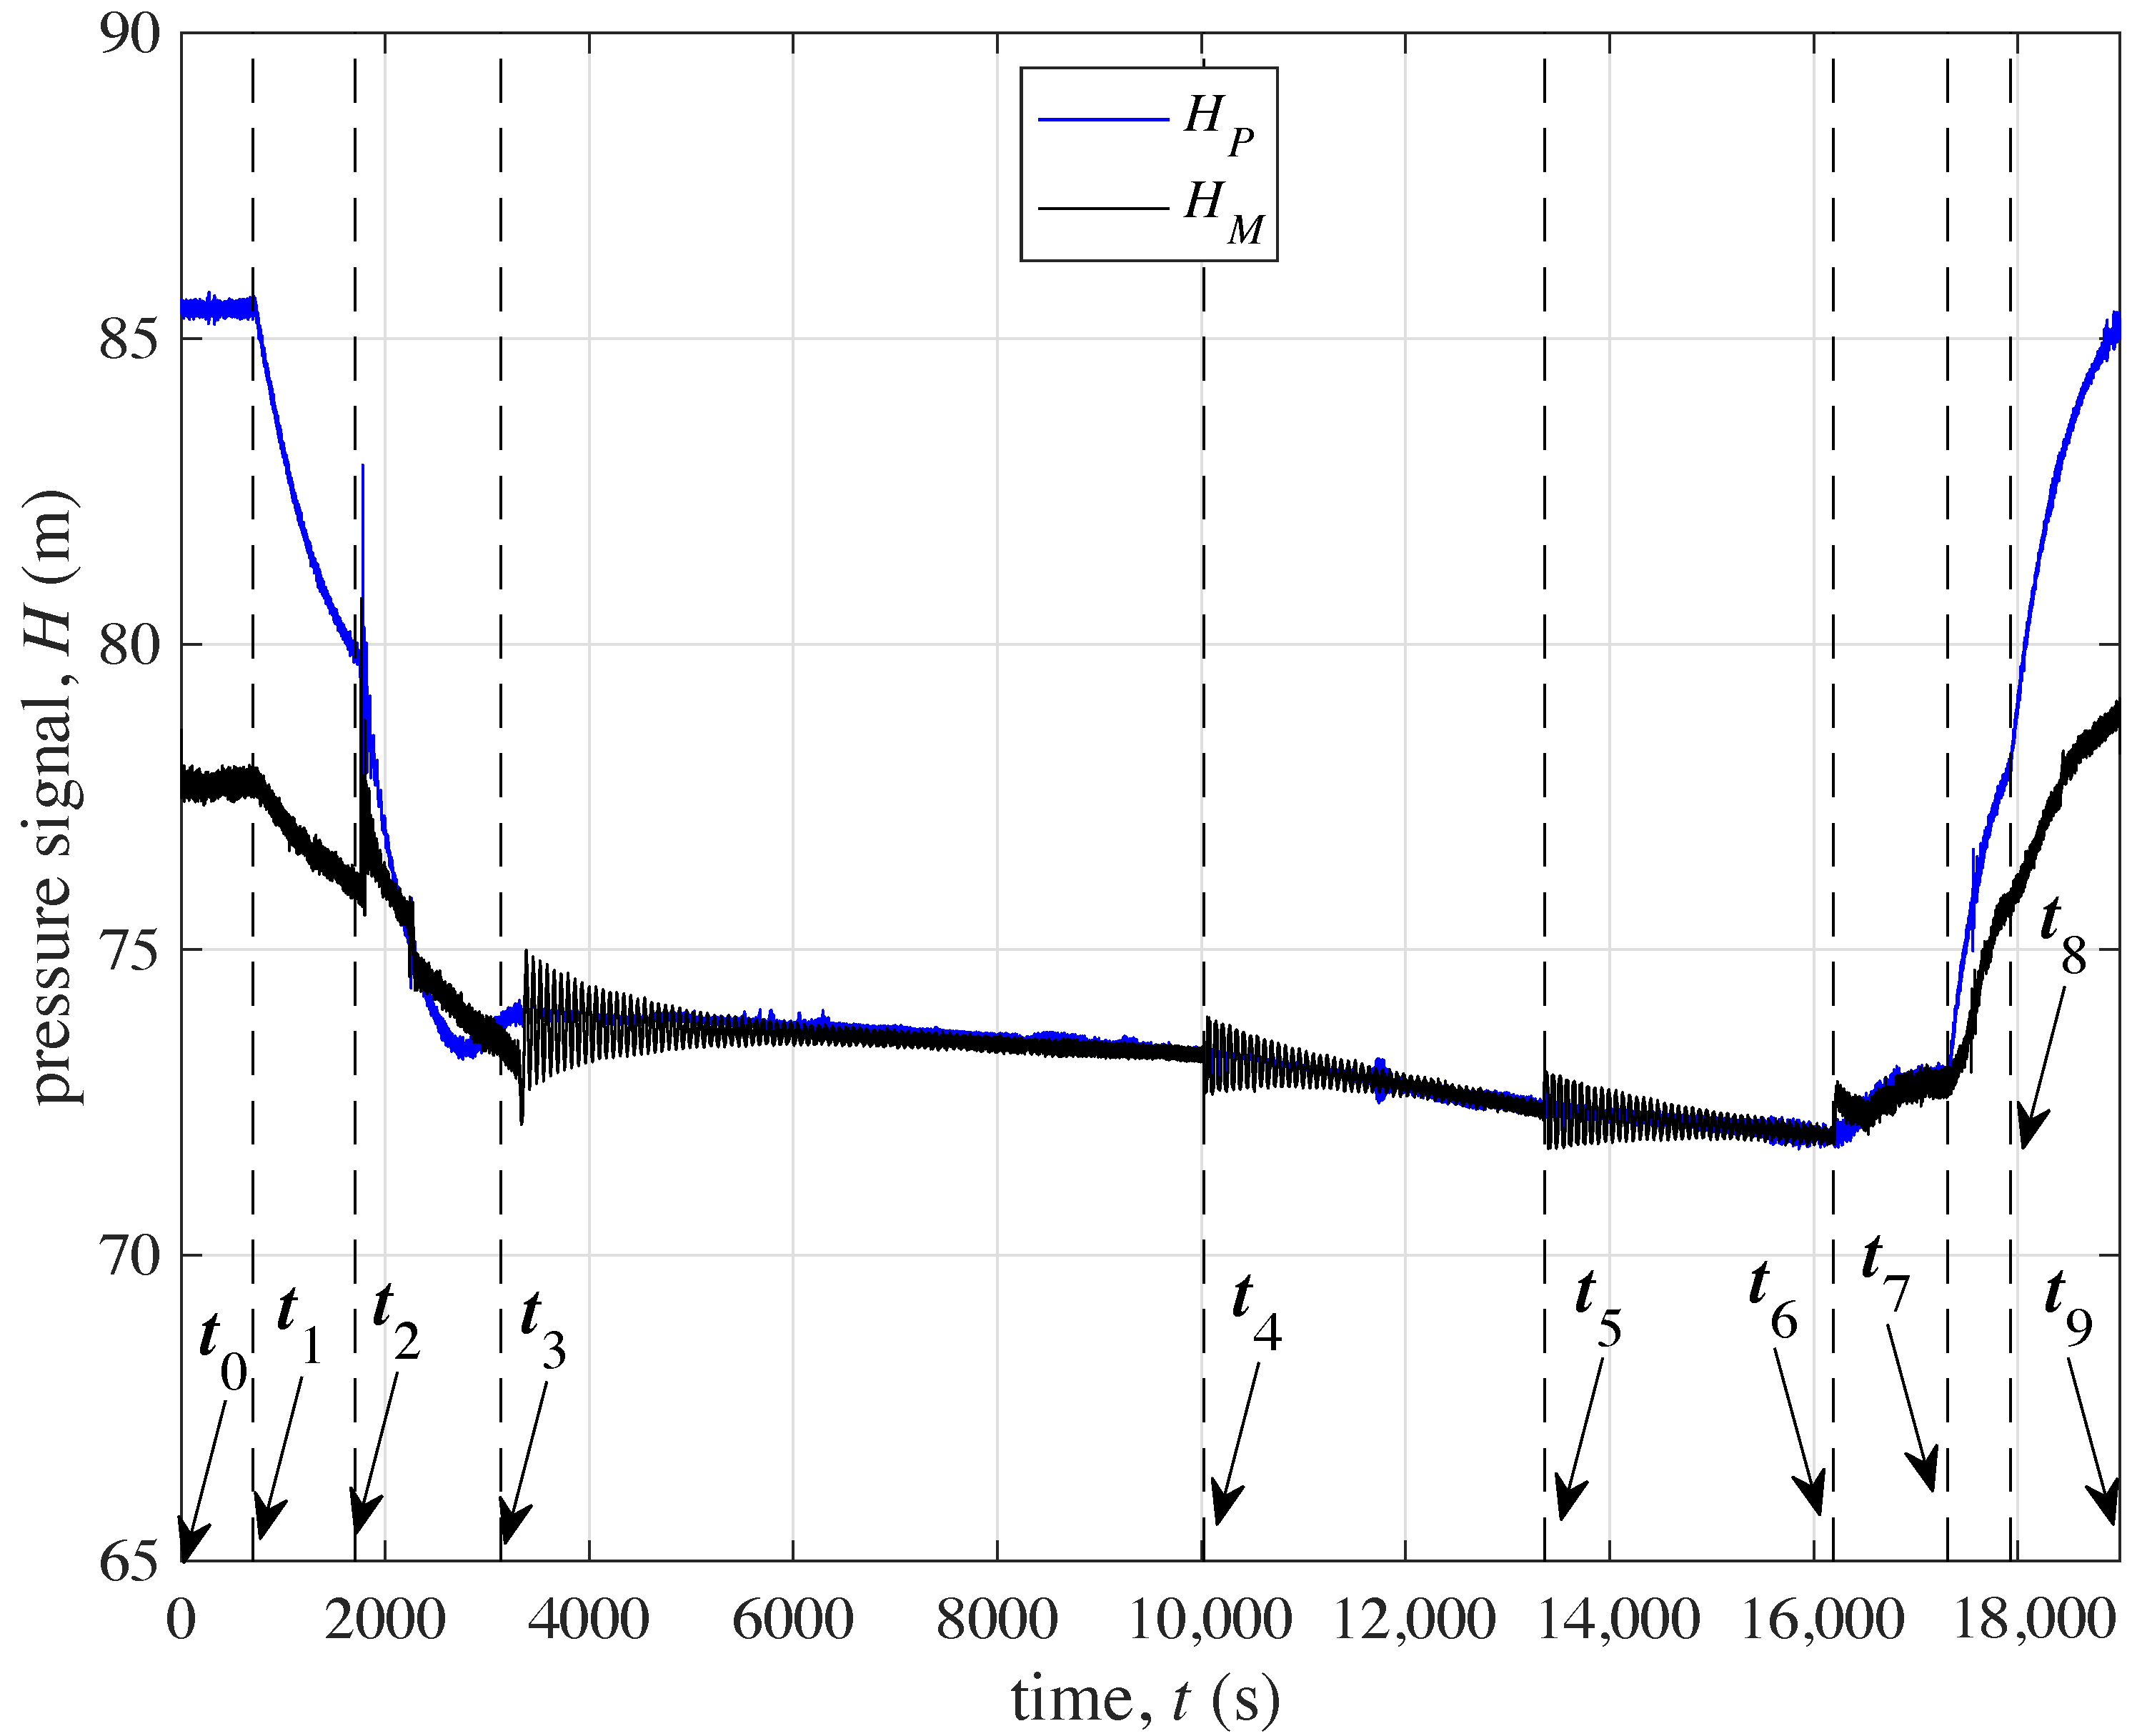
Figure 8, the pressure signals recorded at sections P and M are presented. The figure highlights the mentioned instances of time when the operational steps were implemented. To enhance clarity, these instances are also listed in
Table 1. Specifically, the acquisition started at
= 0. Step #1, occurring at
= 702 s, which caused a pressure drop in section P, which was then observed in section M. Step #2, occurring at
= 1704 s, triggered a pressure increase in both sections, which was then followed by a gradual decrease. Step #3 was initiated at
= 3130 s, when the effects of step #2 had not fully dissipated. This strategic timing was chosen to address the shift in the flow direction, aiming to counteract and mitigate the consequences of this change effectively.
Just because of this flow direction change, the VM closure in step #3 resulted in a pressure drop in section M, accompanied by a prolonged period of oscillations, which finally dampened after about 40 min due to the local flow reversal. Step #3 had a less pronounced effect on section P, with its pressure damping out more quickly.
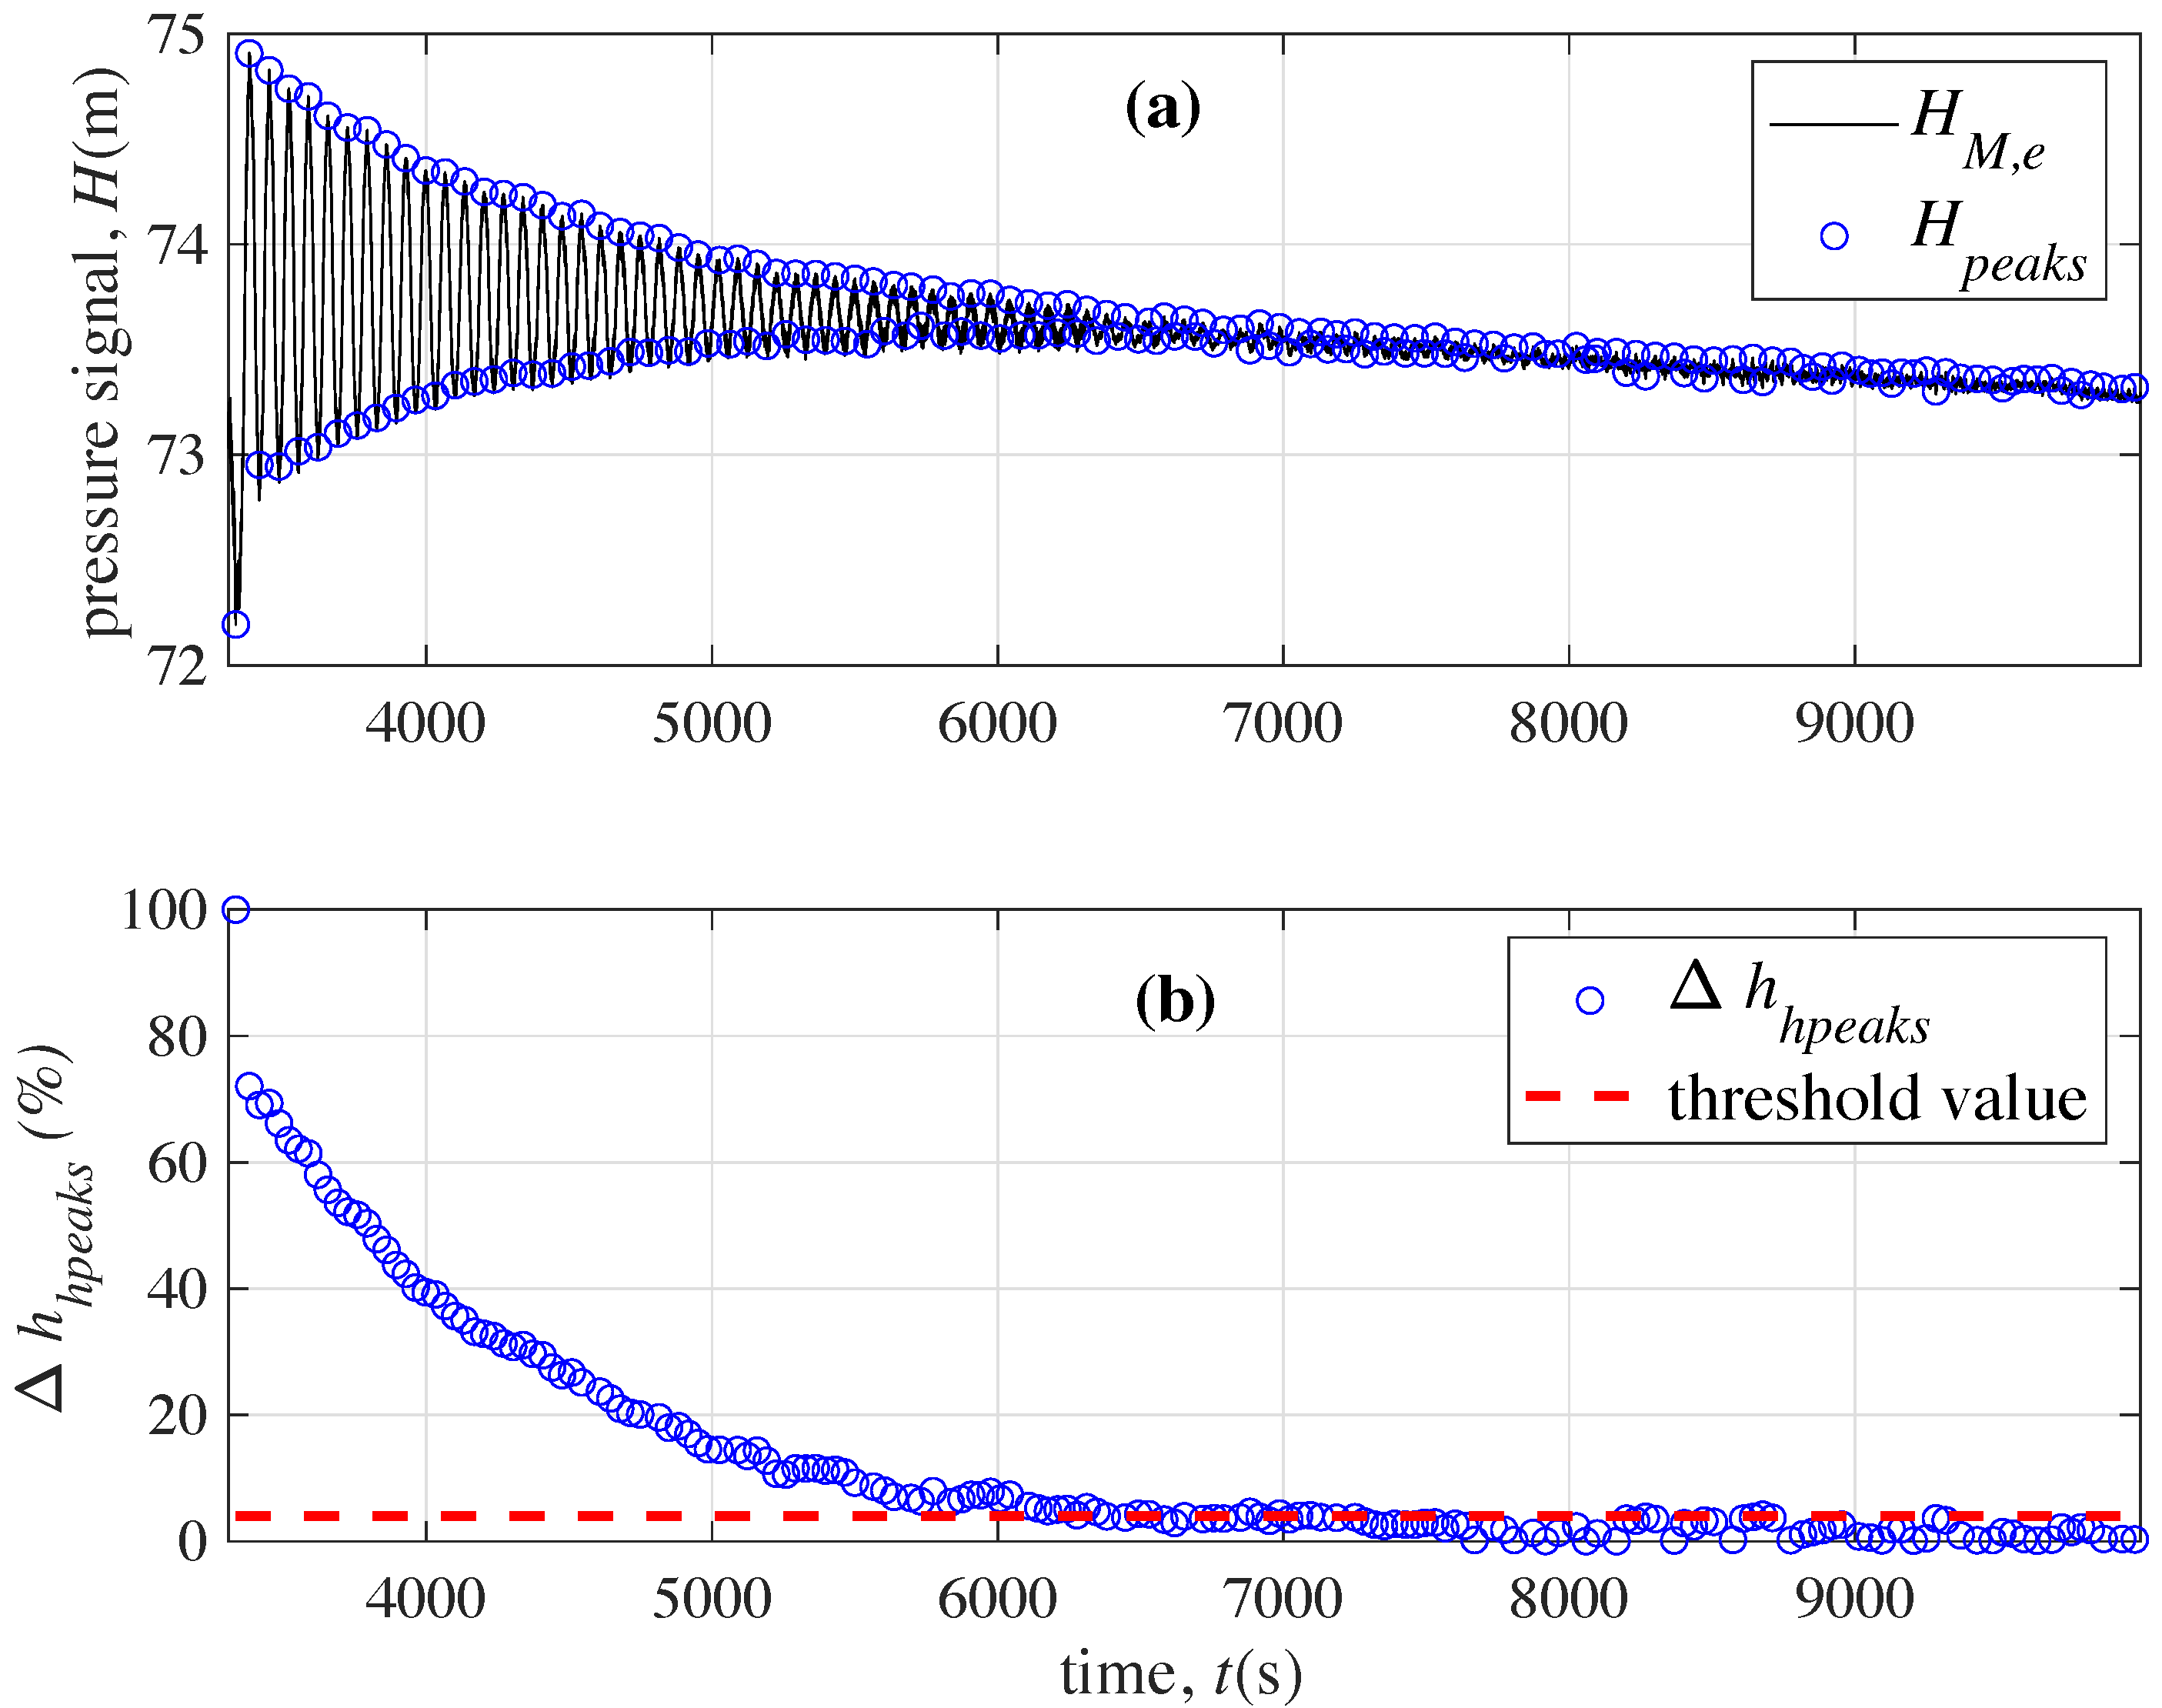
The scheduling of successive timings adhered to a specific guideline. Precisely, for the considered transient, the attenuation of pressure peaks had to be managed to ensure they were reduced to less than 4% of the initial pressure variation [
49]. This approach guarantees that the effects of the previous transient have adequately dissipated, thereby preventing the overlap of distinct transient phenomena and their associated impacts. To elucidate this strategy and visually support the decision-making process for proceeding with the next phase of the operation,
Figure 9a presents a detailed view of the pressure signal acquired at section M, as shown in
Figure 8, during the closure of the VM, considered as an example. The peaks of this pressure signal,
, is evaluated and then normalized with respect to the maximum difference observed between any two successive peaks,
:
The time history of the resulting dimensionless peak variation is illustrated in
Figure 9b. In this figure, a threshold is set where, if
falls below 4%—indicated by a red dashed line—it signals the readiness for initiating the subsequent step.
At =10,021 s, step #4 was executed, producing effects similar to those of step #3 in both measurement sections. This is because the maneuver in step #4 was an SDV opening with almost hydro-static conditions as a pre-transient regime. Specifically, in section M, this SDV opening caused a maximum pressure variation of about 0.94 m, whereas in section P, the variation was only about 0.52 m.
During step #5, performed at = 13,360 s, which, as mentioned above, is relevant within TTBTs, a small initial pressure rise of 0.58 m in section M and 0.40 m in section P was observed, followed by the damping of pressure oscillations.
At step #6 ( = 16,189 s), the VM was gradually reopened, resulting in a pressure increase throughout the pipeline. Similarly, in steps #7 and #8, corresponding to = 17,313 s and = 17,931 s, respectively, the two pumps at the Randaccio pumping station were switched on, both maneuvers resulting in a pressure increase.
As the pressure in both sections M and P returned to values comparable to those at , the acquisition was terminated at step #9 ( = 18,996 s).
3.2. Effect of Not Ideal Timing
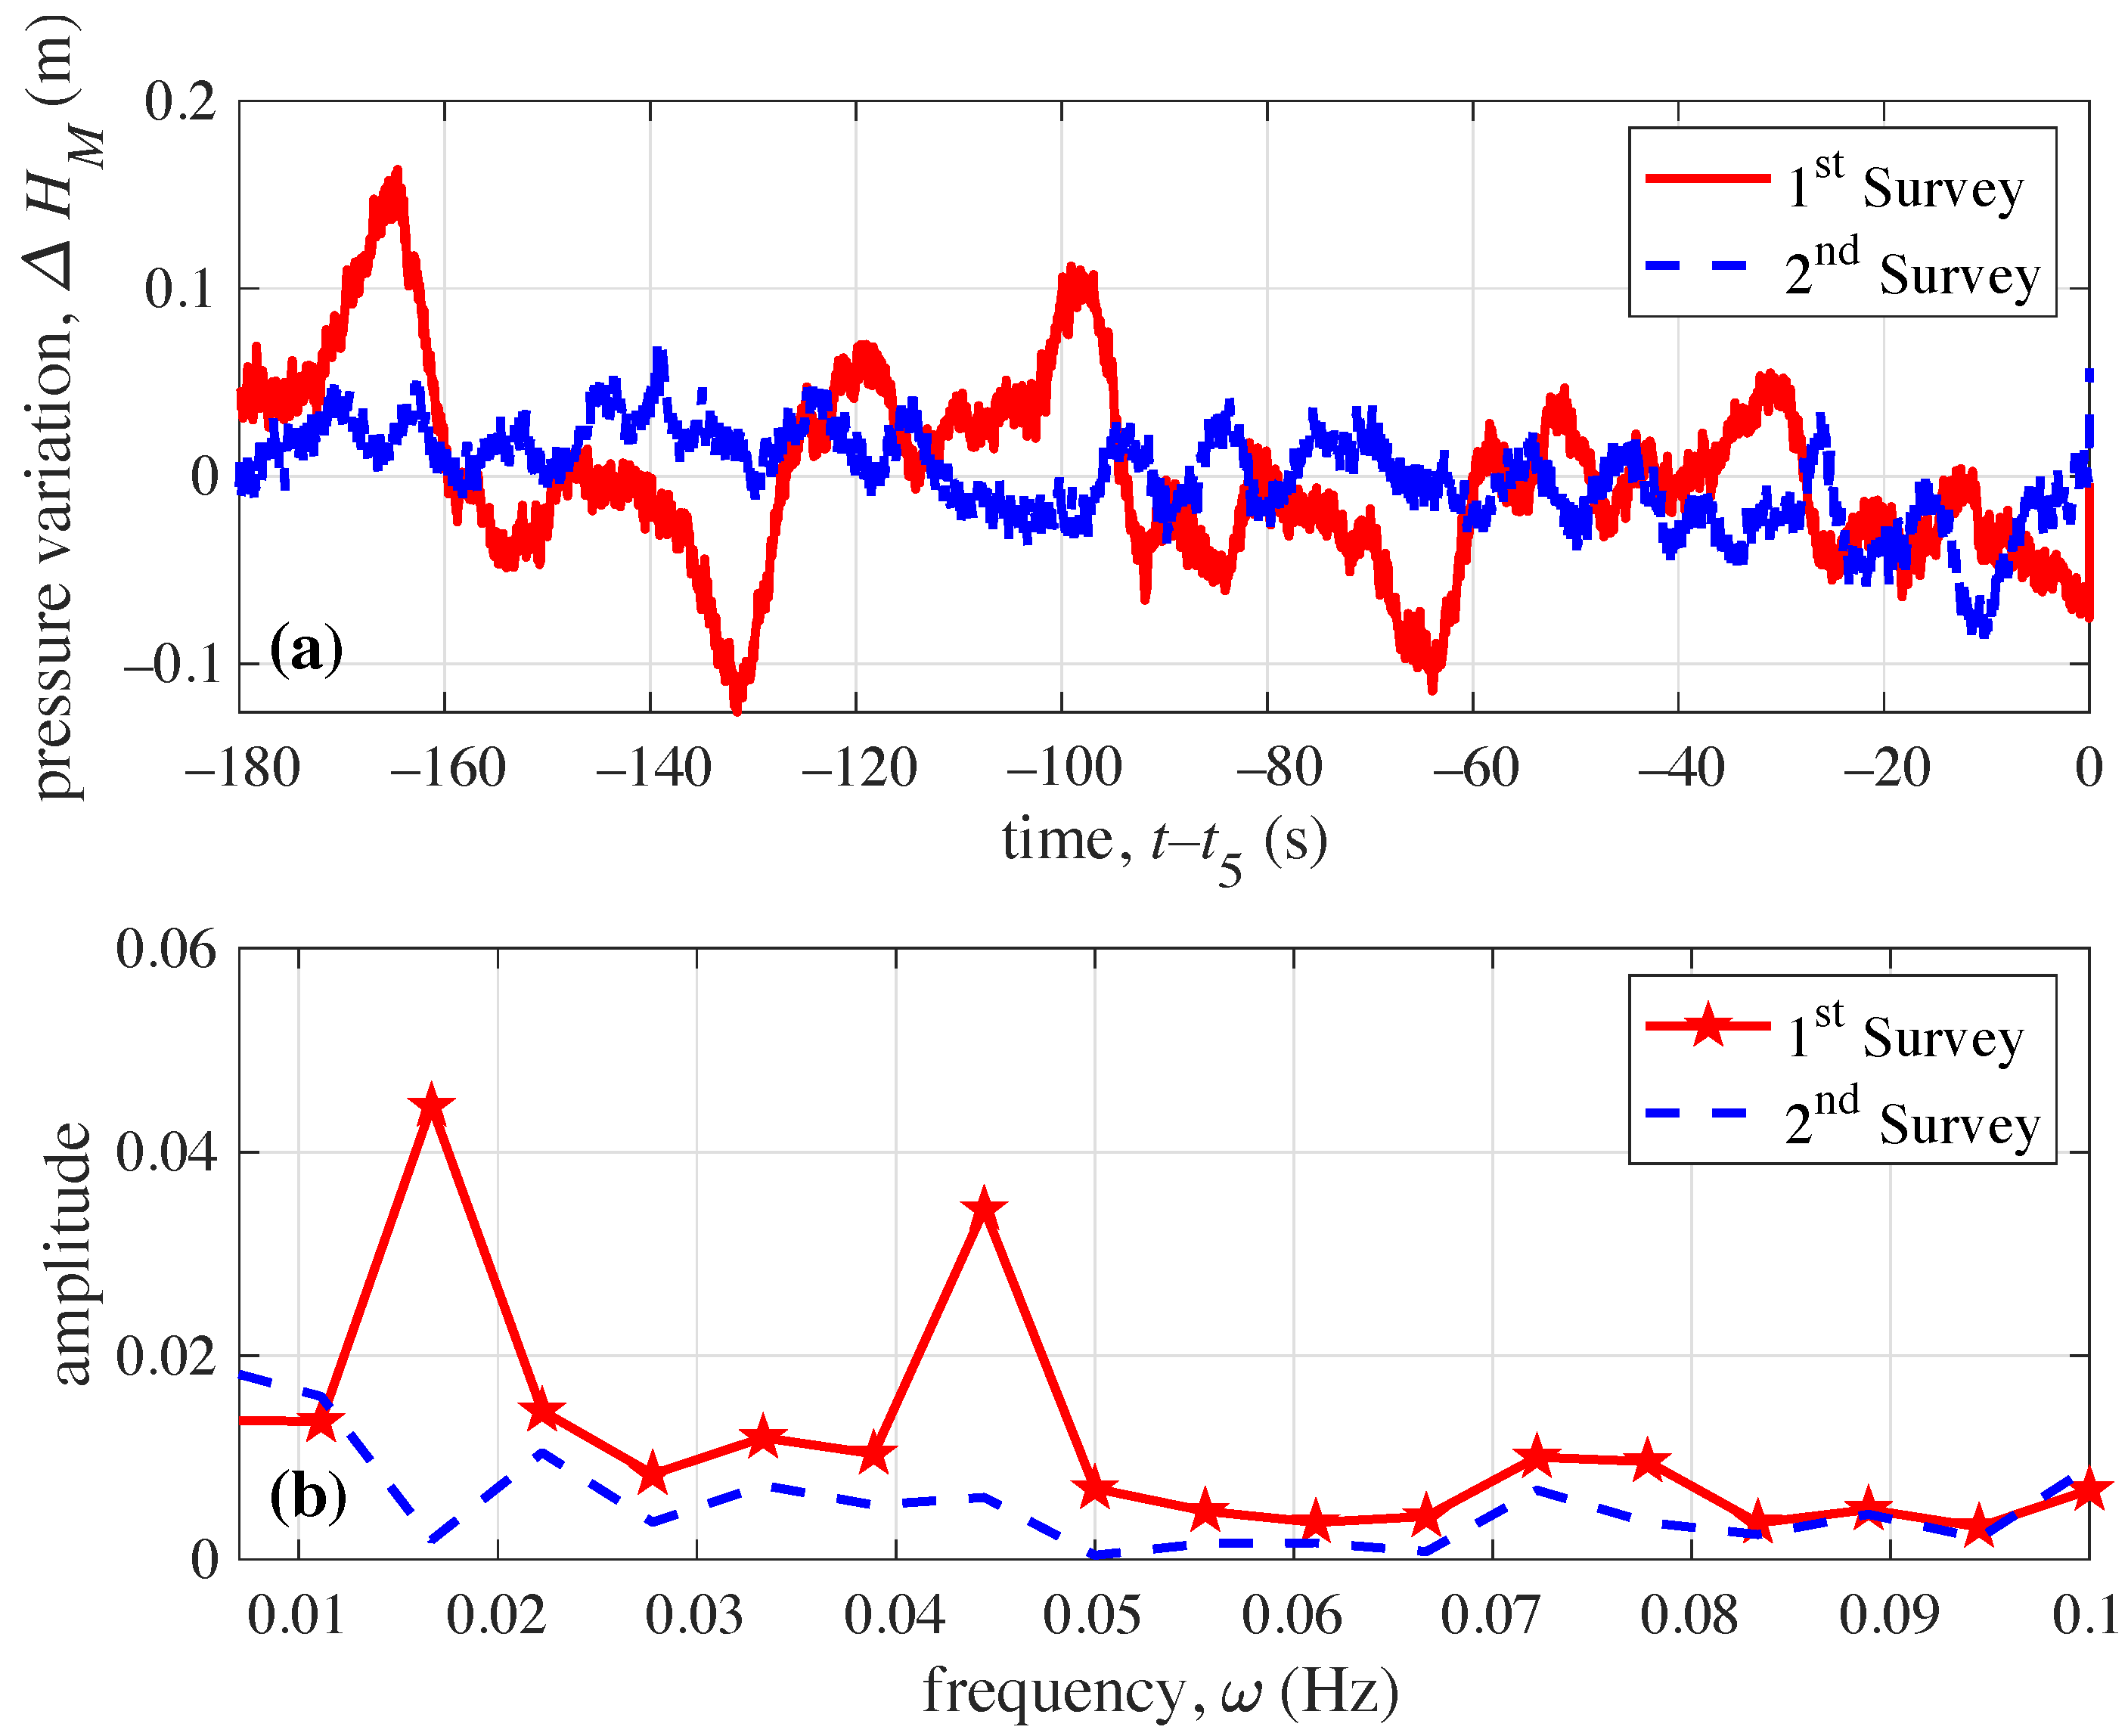
To verify the establishment of “quasi” steady-state conditions, the pressure signal acquired at section M 180 s prior to
is depicted in
Figure 10a. This visualization is pivotal in demonstrating the achievement of a pressure peak variation of less than the critical threshold of 4% of the maximum variation. In fact, the corresponding frequency response function shown in
Figure 10b (blue line) clearly indicates the absence of significant pressure fluctuations. On the contrary, if a time sequence and maneuvers other than the scheduled ones are performed, the quality of the pre-transient conditions is much worse. For example, the closure of the VP after step
leads to much worse pre-transient conditions in the first survey. In fact, these are characterized by more pronounced pressure fluctuations (red line in
Figure 10) in the frequency spectrum. In particular, there is a notable peak at a frequency
= 0.0167, which corresponds to the natural period of the system, given a pressure wave speed of about 1100 m/s, a typical value for metallic pipes. In other words, isolating the SP before performing the transient tests does not improve the quality of the pre-transient pressure regime. The results of the two different pre-transient procedures, summarized in
Figure 10, clearly show that the determination of the precise timing of the operational steps, as well as the sequence and type of maneuvers, are crucial, as they allow the avoidance of the potential amplification of the pressure oscillations. In other words, the choice of inappropriate intervals and/or maneuvers could result in the amplification–or failure to damp–of pressure waves. This means that the pre-transient conditions in the first survey are far from the desired steady state.


 ,
, 


