Abstract
In seaports, the automatic Grab-Type Ship Unloader (GTSU) stands out for its ability to automatically load and unload materials, offering the potential for substantial productivity improvement and cost reduction. Developing a fully automatic GTSU, however, presents a unique challenge: the system must autonomously determine the position of the cargo hold and the coordinates of the working point and identify potential hazards during material loading and unloading. This paper proposes AI models designed to detect cargo holds, extract working points, and support collision risk warnings, utilizing both the LiDAR sensor and the camera in the GTSU system. The model for cargo hold detection and collision warning was developed using image data of the cargo hold and grab, employing the You Only Look Once model. Concurrently, the model responsible for extracting the coordinates of working points for the GTSU system was designed by integrating the cargo hold detection and point cloud processing models. After testing the AI models for the lab-scale GTSU, the results show that the cargo hold detection and collision warning models achieve an accuracy of approximately 96% and 90%, respectively. Additionally, the working point coordinates extracted from the sensor system show a deviation of 5–10% compared to traditional measurements.
1. Introduction
Automation uses technology, specifically computers and software, to oversee and execute operations, frequently diminishing or substituting human involvement. The adoption of automation has significantly increased in recent times, mostly due to advancements in artificial intelligence (AI), robots, and data analytics. However, primitive types of automation can be traced back to the early 20th century, such as manufacturing assembly lines [1]. Automation in factories leads to increased production levels, generating consistent, dependable, and high-quality products while reducing energy consumption. This, in turn, leads to cost savings and improved productivity [2]. Consequently, the automation trend is rapidly growing, establishing itself as a crucial factor in the worldwide economic environment. The industrial automation industry has had significant expansion throughout the years, and it is projected to reach a worth of USD 459.51 billion by 2032 [3]. The advancement of technology has accelerated numerous transformations in several sectors, introducing a period where automation, effectiveness, and environmental friendliness serve as the basis for expansion. The marine sector, particularly port operations, is significantly affected by this revolutionary wave.
Seaports are crucial nodes in the maritime transportation network, playing a vital role in the reception, unloading, and transshipment of commodities and minerals. Statistically, almost 80% of the total volume of worldwide commerce trade is conducted via maritime transportation [4]. The process of transferring raw materials from seaports to industries is performed through mechanical systems such as the Grab-Type Ship Unloader (GTSU) system, stackers, and reclaimers. This involves the loading and unloading of the commodities. Specifically, the GTSU system is crucial in seaport operations. The GTSU system exemplifies specialized mechanical innovation designed specifically for the maritime sector. Its purpose is to efficiently offload dry bulk cargo from vessels, a procedure that previously required significant manual labor and consumed a considerable amount of time. The main mechanism relies on a sturdy grasping apparatus, as implied by its name. Depending on its design and size, this grab penetrates the cargo hold of the ship, securely collects a significant quantity of bulk material, and efficiently delivers it to the subsequent stage of the logistical chain, such as hoppers, conveyors, trucks, or rail wagons. Crane operators, winches, and cables are essential elements in the picking process, alongside bucket design [5]. The GTSU system offers numerous advantages. First and foremost, it provides unmatched efficiency. The conventional techniques for offloading cargo were not only physically demanding but also lacked accuracy. This system also exemplifies adaptability. The versatility of ports in handling several cargo types, such as grains, coal, and ore, makes flexibility in terms of modifying the grab size or unloading speed extremely significant. The GTSU system’s versatility allows it to accommodate various sorts of freight while maintaining efficiency. Nevertheless, GTSU systems were operated through manual means or with limited technical involvement. A proficient workforce would oversee the operation of the machinery, guaranteeing the efficient transfer of bulk cargo such as coal, grains, or minerals from ships to the port. Although manual operation can be effective, it frequently presents difficulties such as longer processing times, higher labor expenses, and occasional mistakes that could lead to material loss or, in more severe cases, accidents.
Yang et al. presented several technologies and obstacles involved in the automation of equipment at seaports in the context of creating intelligent ports [6]. For example, positioning and obstacle avoidance algorithms for automatic guided vehicles (AGV) were proposed by Pratama et al. [7], and analysis and evaluation of the motion of steel container cranes based on structural health monitoring was presented by Kaloop et al. [8]. To complete the process of building smart seaports, proposals for designing automatic GTSU systems for the transportation of raw commodities like coal or iron ore at seaports need to be researched and developed. The automated GTSU system provides secure functioning, providing financial advantages and diminishing carbon emissions as a result of their energy-efficient characteristics in contrast to conventional systems. This system should leverage cutting-edge sensor technologies, artificial intelligence, big data, and the Internet of Things. This integration aims to substitute human tasks with a sophisticated network of sensors and control systems. These automated components will meticulously monitor and manage the trolley’s movements and the grab’s functionality within the port environment. However, in order to build an effective automatic GTSU system, problems such as self-identification of the cargo hold, determination of the coordinates of the operating point, and provision of collision risk warning during operation must be solved.
This paper has developed AI models that utilize a LiDAR sensor and camera to accurately detect the cargo hold, calculate work point coordinates, and develop collision warnings for the lab-scale GTSU system. The cargo hold detection model is developed by evaluating, filtering, and annotating cargo hold image data obtained from a camera system in a lab-scale GTSU system. The You Only Look Once (YOLO) v3 algorithm was selected for the development of the cargo hold detection model. During the model training phase, design factors such as learning rate and iteration were adjusted to find the most effective settings to improve model performance. The work point extraction model was developed by combining LiDAR sensors and cameras to help determine the coordinates of materials in the ship’s compartment, thereby sending this information to the control system to perform the loading and unloading material process. This algorithm is designed to prioritize the selection of places with abundant reserves to exploit materials. The camera is used to determine the position of the ship’s compartment in combination with LiDAR sensors to measure depth and provide information about the distribution of materials in the ship’s compartment. This helps evaluate the condition of the material and extract the coordinates of the work point at the location containing the most material. The anti-collision model is designed to warn of potential collisions between the grab and the cargo hold, serving as a measure to protect the GTSU system. To minimize the potential risk of collision during the operation of the GTSU system, this model has been applied with camera technology and the YOLO algorithm to continuously monitor the position of the grab and the cargo hold. Warning conditions for collision risk in the GTSU system are then set into the model to recognize and issue warnings according to the position between the grab and the cargo hold.
As a result, the cargo hold detection model is capable of accurately detecting the cargo hold in real time, achieving a 96% accuracy rate during testing on a lab-scale GTSU system. In the same way, the working point extraction model shows the capability to accurately extract real-time working points, with a minimal error range of 5–10% when compared to hand measurements. Ultimately, the anti-collision model has been proven to effectively deliver real-time crash alerts with a success rate of about 90%. The findings of this study will be utilized to create a completely automated GTSU system.
2. Design of a Cargo Hold Detection Model for the Lab-Scale GTSU System
2.1. Design of the Lab-Scale GTSU System
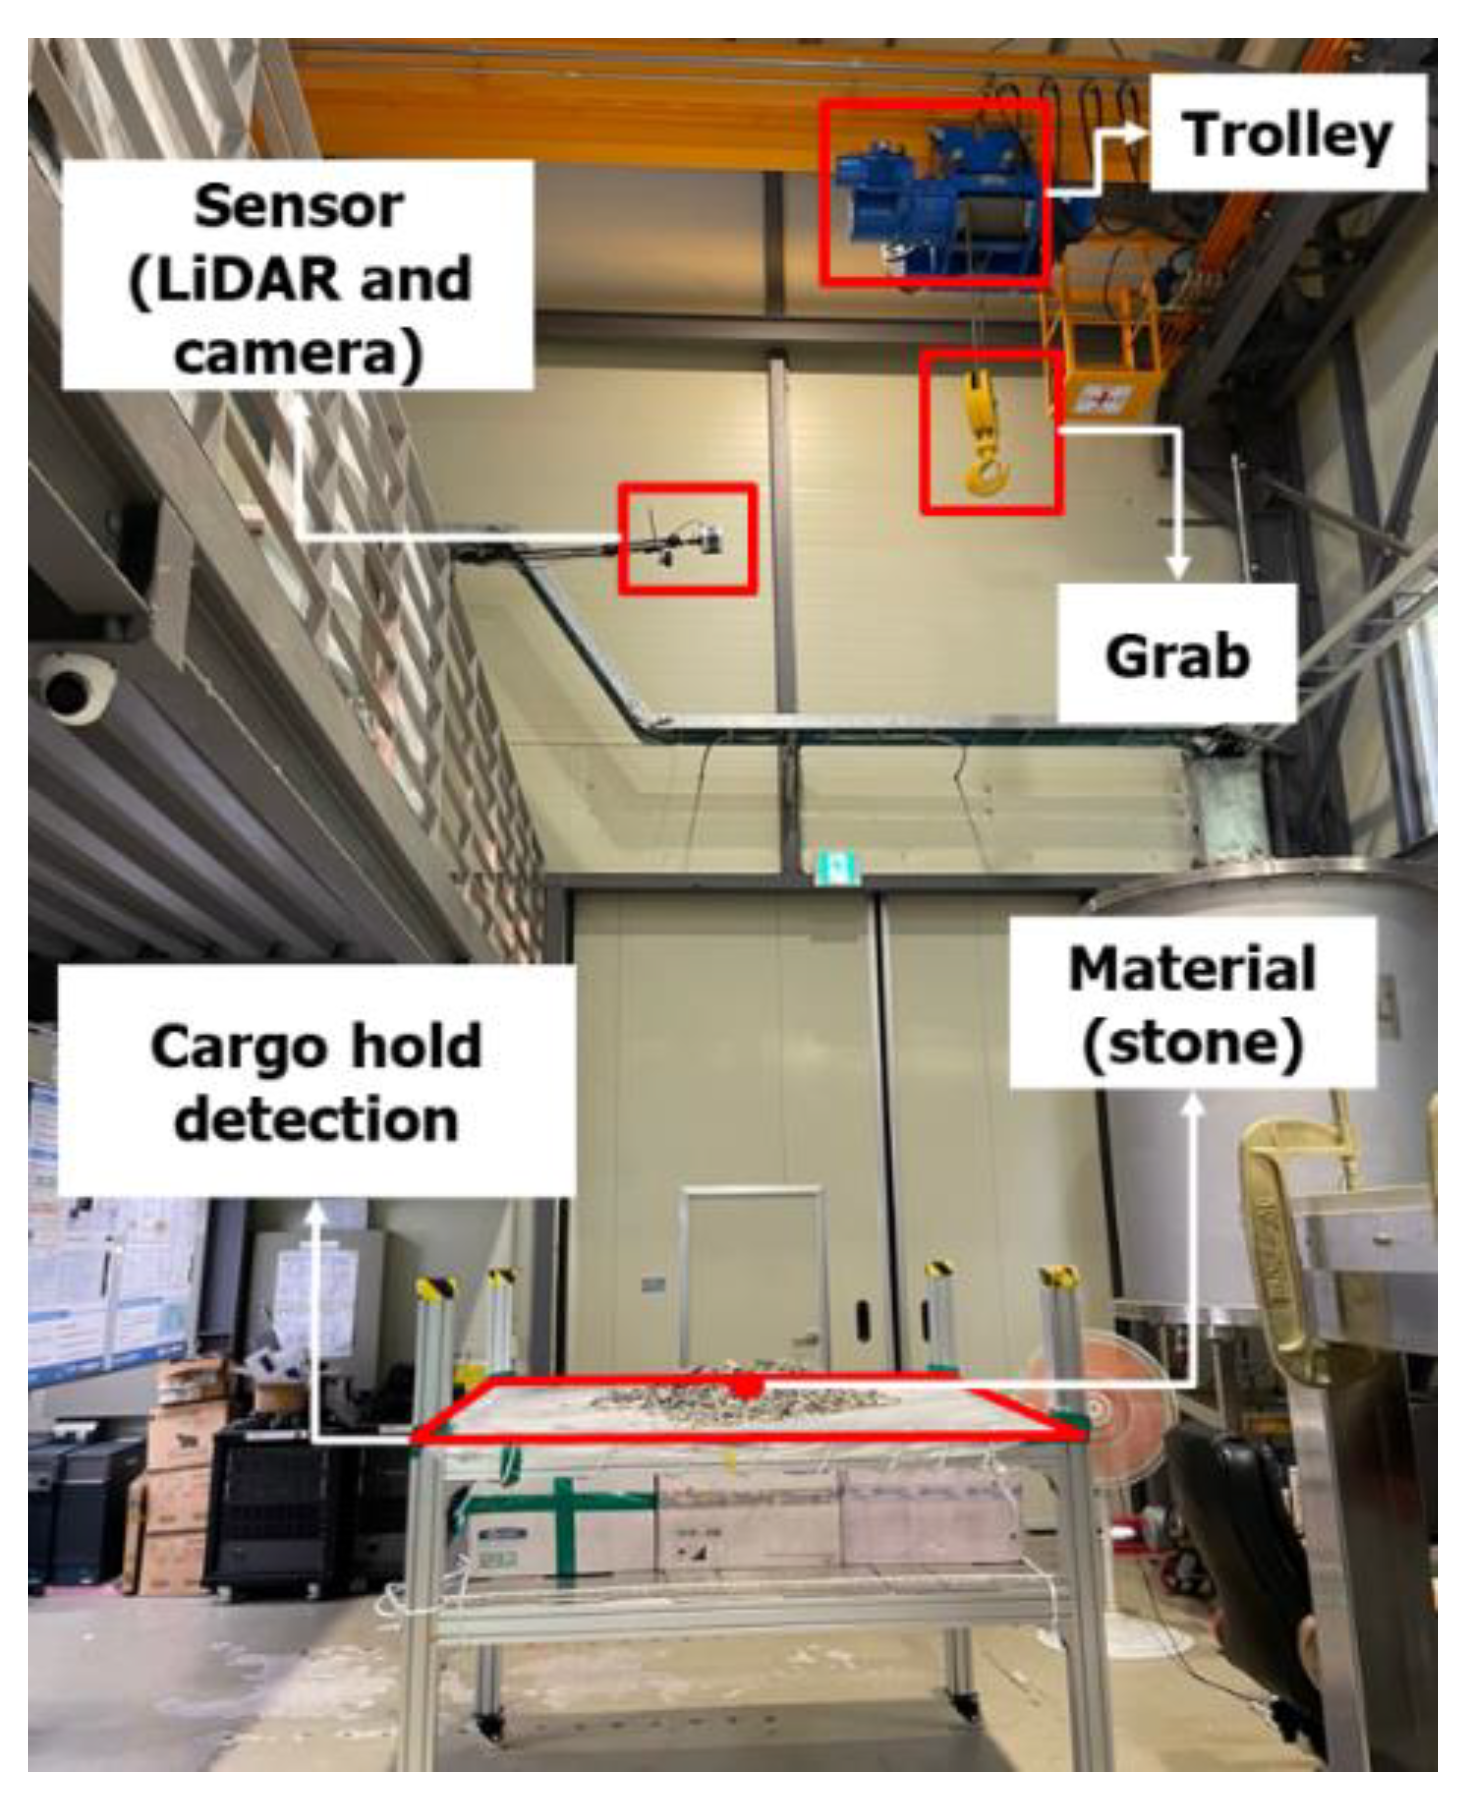
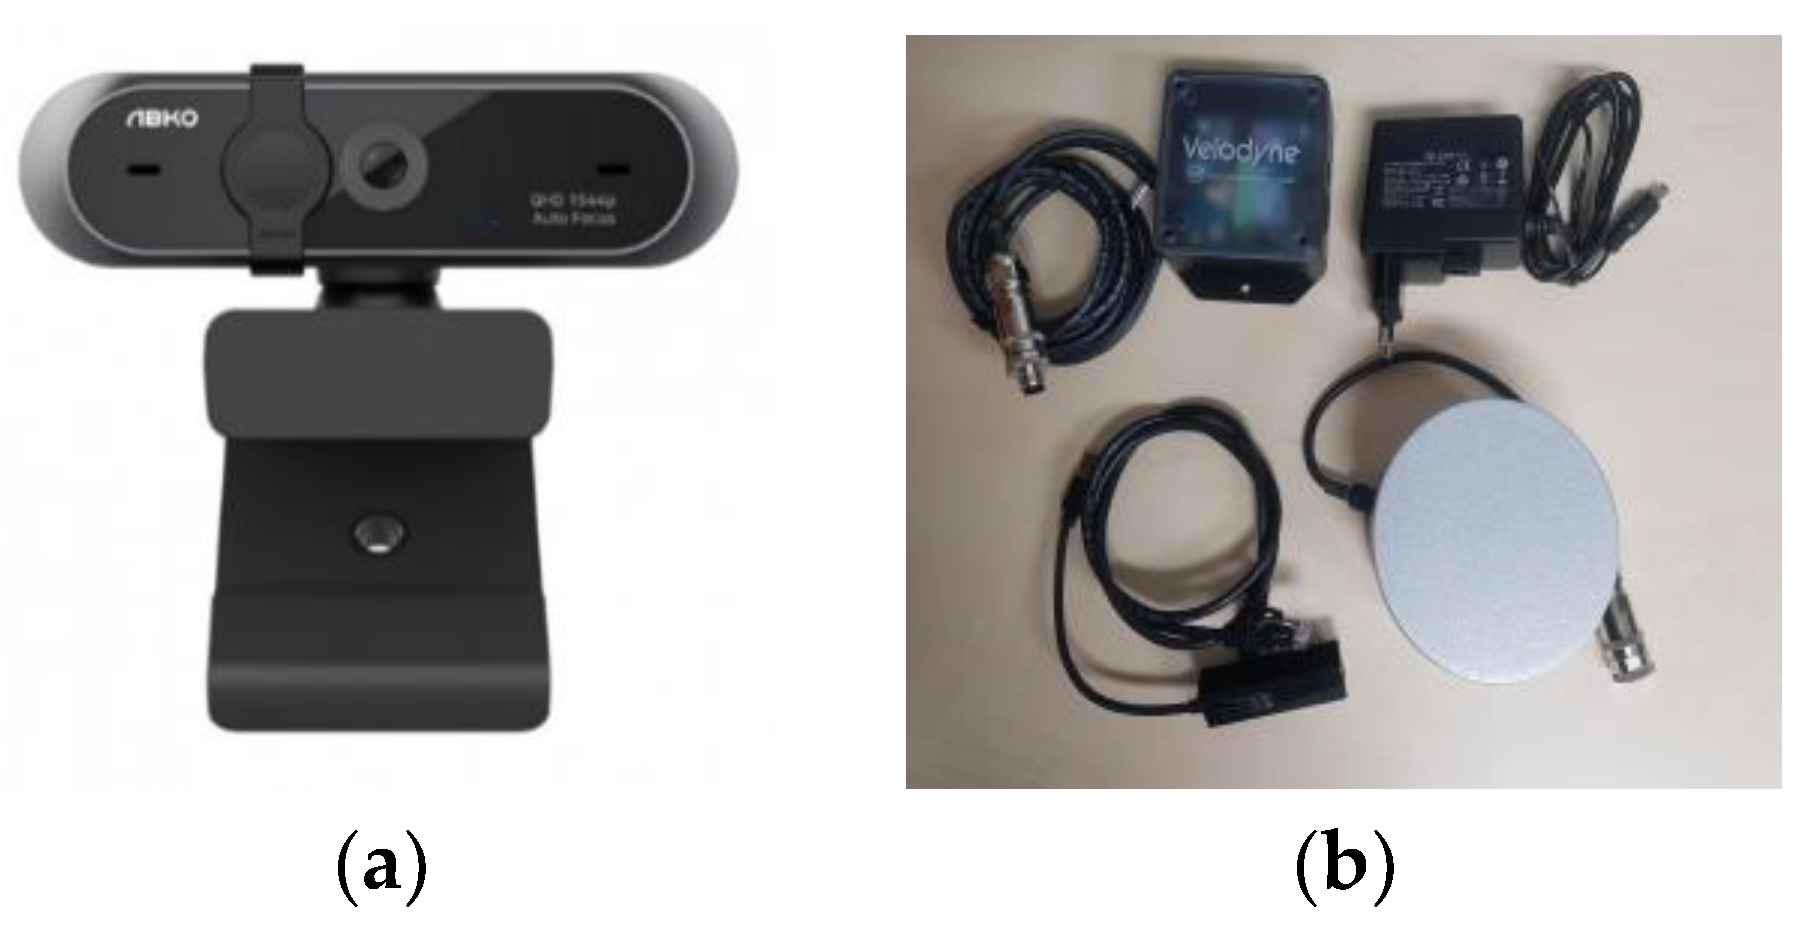
The lab-scale GTSU system consists of a 146 cm × 146 cm cargo hold mostly filled with stones used to develop AI models, as shown in Figure 1. The grab and trolley mechanism of the GTSU is both adaptable and moveable, accurately mirroring its true functionality. In this configuration, the sensor system, consisting of cameras and LiDAR sensors, is installed in a lab-scale system. Figure 2a and Table 1 present specific information regarding the camera’s technological attributes, including an impressive 80-degree field of view and a QHD resolution of 2592 × 1944 pixels. LiDAR, an acronym for ‘Light Detection and Ranging’, is an advanced remote sensing technique that uses pulsed laser light to measure distances. A LiDAR sensor can accumulate extensive amounts of precise data about the Earth’s surface by emitting many laser pulses each second. The high-resolution observations are transformed into 3D models, resulting in detailed topography maps [9]. Initially employed primarily in the fields of geology and forestry, LiDAR has recently expanded its range of applications to include fields such as the development of autonomous vehicles, urban planning, and environmental monitoring. LiDAR continuously transforms the methods of gathering and analyzing data through constant technical progress, providing an unmatched blend of accuracy and detail. The study employs the VLP-16 LiDAR sensor, as shown in Figure 2b, which possesses a scanning angle of 360 degrees. The device is outfitted with 16 lasers, each offering a vertical range of vision spanning from −15 degrees to 15 degrees [10]. Table 1 provides detailed information on the specifications of the Velodyne LiDAR VLP-16 sensor.

Figure 1.
Configuration of the lab-scale GTSU system.

Figure 2.
A sensor system in the lab-scale GTSU system: (a) APC930 QHD webcam; (b) Velodyne LiDAR VLP-16 sensor.

Table 1.
Specifications of the sensor system in the lab-scale GTSU system.
2.2. Collection and Data Processing of the Cargo Hold Image
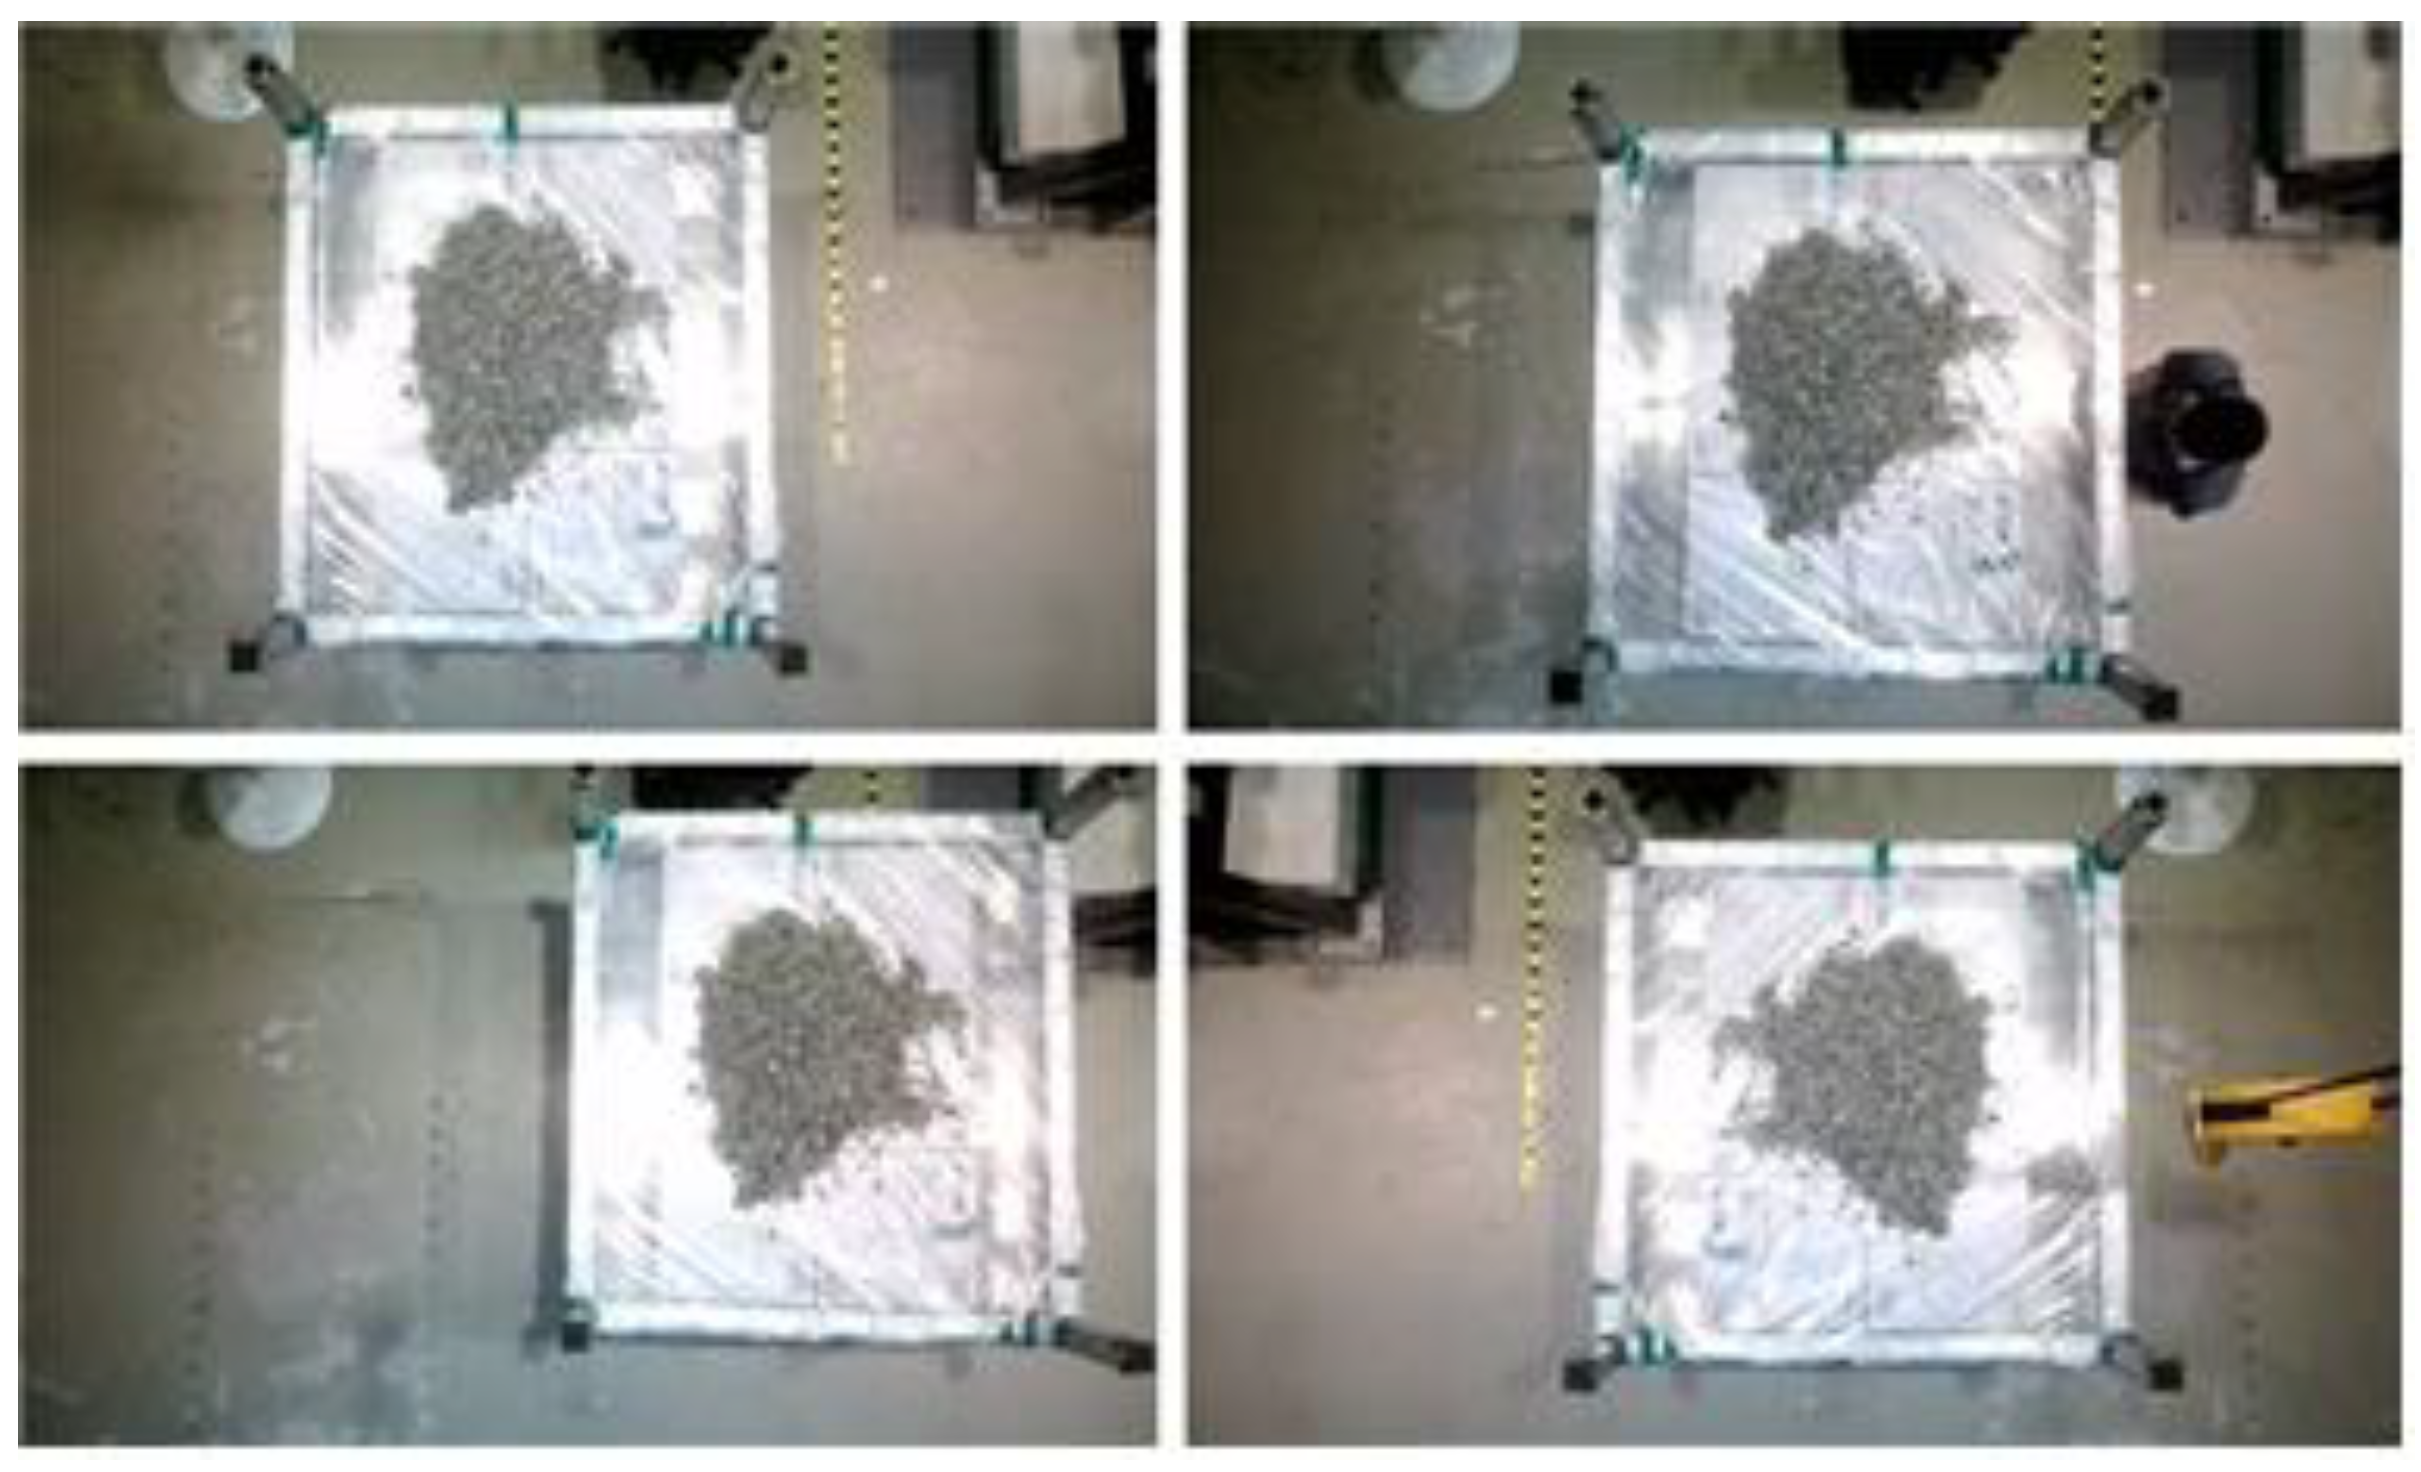
The grab operation of the GTSU system undergoes distinct stages, and the transition toward automation and intelligence involves overcoming various challenges. Initially, accurately detecting and locating materials is challenging due to variations in forms and sizes and the presence of obstructions. Transitioning to the gripping planning stage, challenges encompass securely holding objects with irregular shapes, preventing harm, and ensuring a dependable grip. Implementing sophisticated algorithms and adaptive grasping mechanisms is crucial. The lifting and transporting materials stage introduces challenges related to payload weight, stability, and safe lifting practices. Safe and effective navigation requires that obstacle avoidance be paid the utmost importance. Challenges encompass detecting planning paths and implementing procedures to avoid collisions in real time. The drop-off or placement stage entails meticulous positioning, ensuring avoidance of collisions during release, and responding to alterations in the destination environment. To design an automatic GTSU system, the initial step is to determine the specific cargo hold where supplies are housed for loading and unloading. Hence, the cargo hold detection model was developed by employing vision AI technologies, object identification models, and image processing. To create and train the cargo hold detection model, a dataset comprising sample images of cargo holds and their corresponding labels was required. The provided images were obtained by a camera system that captured the cargo compartment of the lab-scale GTSU system. Figure 3 displays a subset of these photographs, whereas the complete dataset consists of approximately 570 images captured by the laboratory’s camera system.
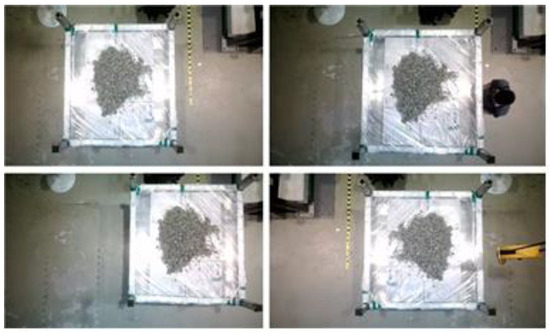
Figure 3.
Sample image of the cargo hold.
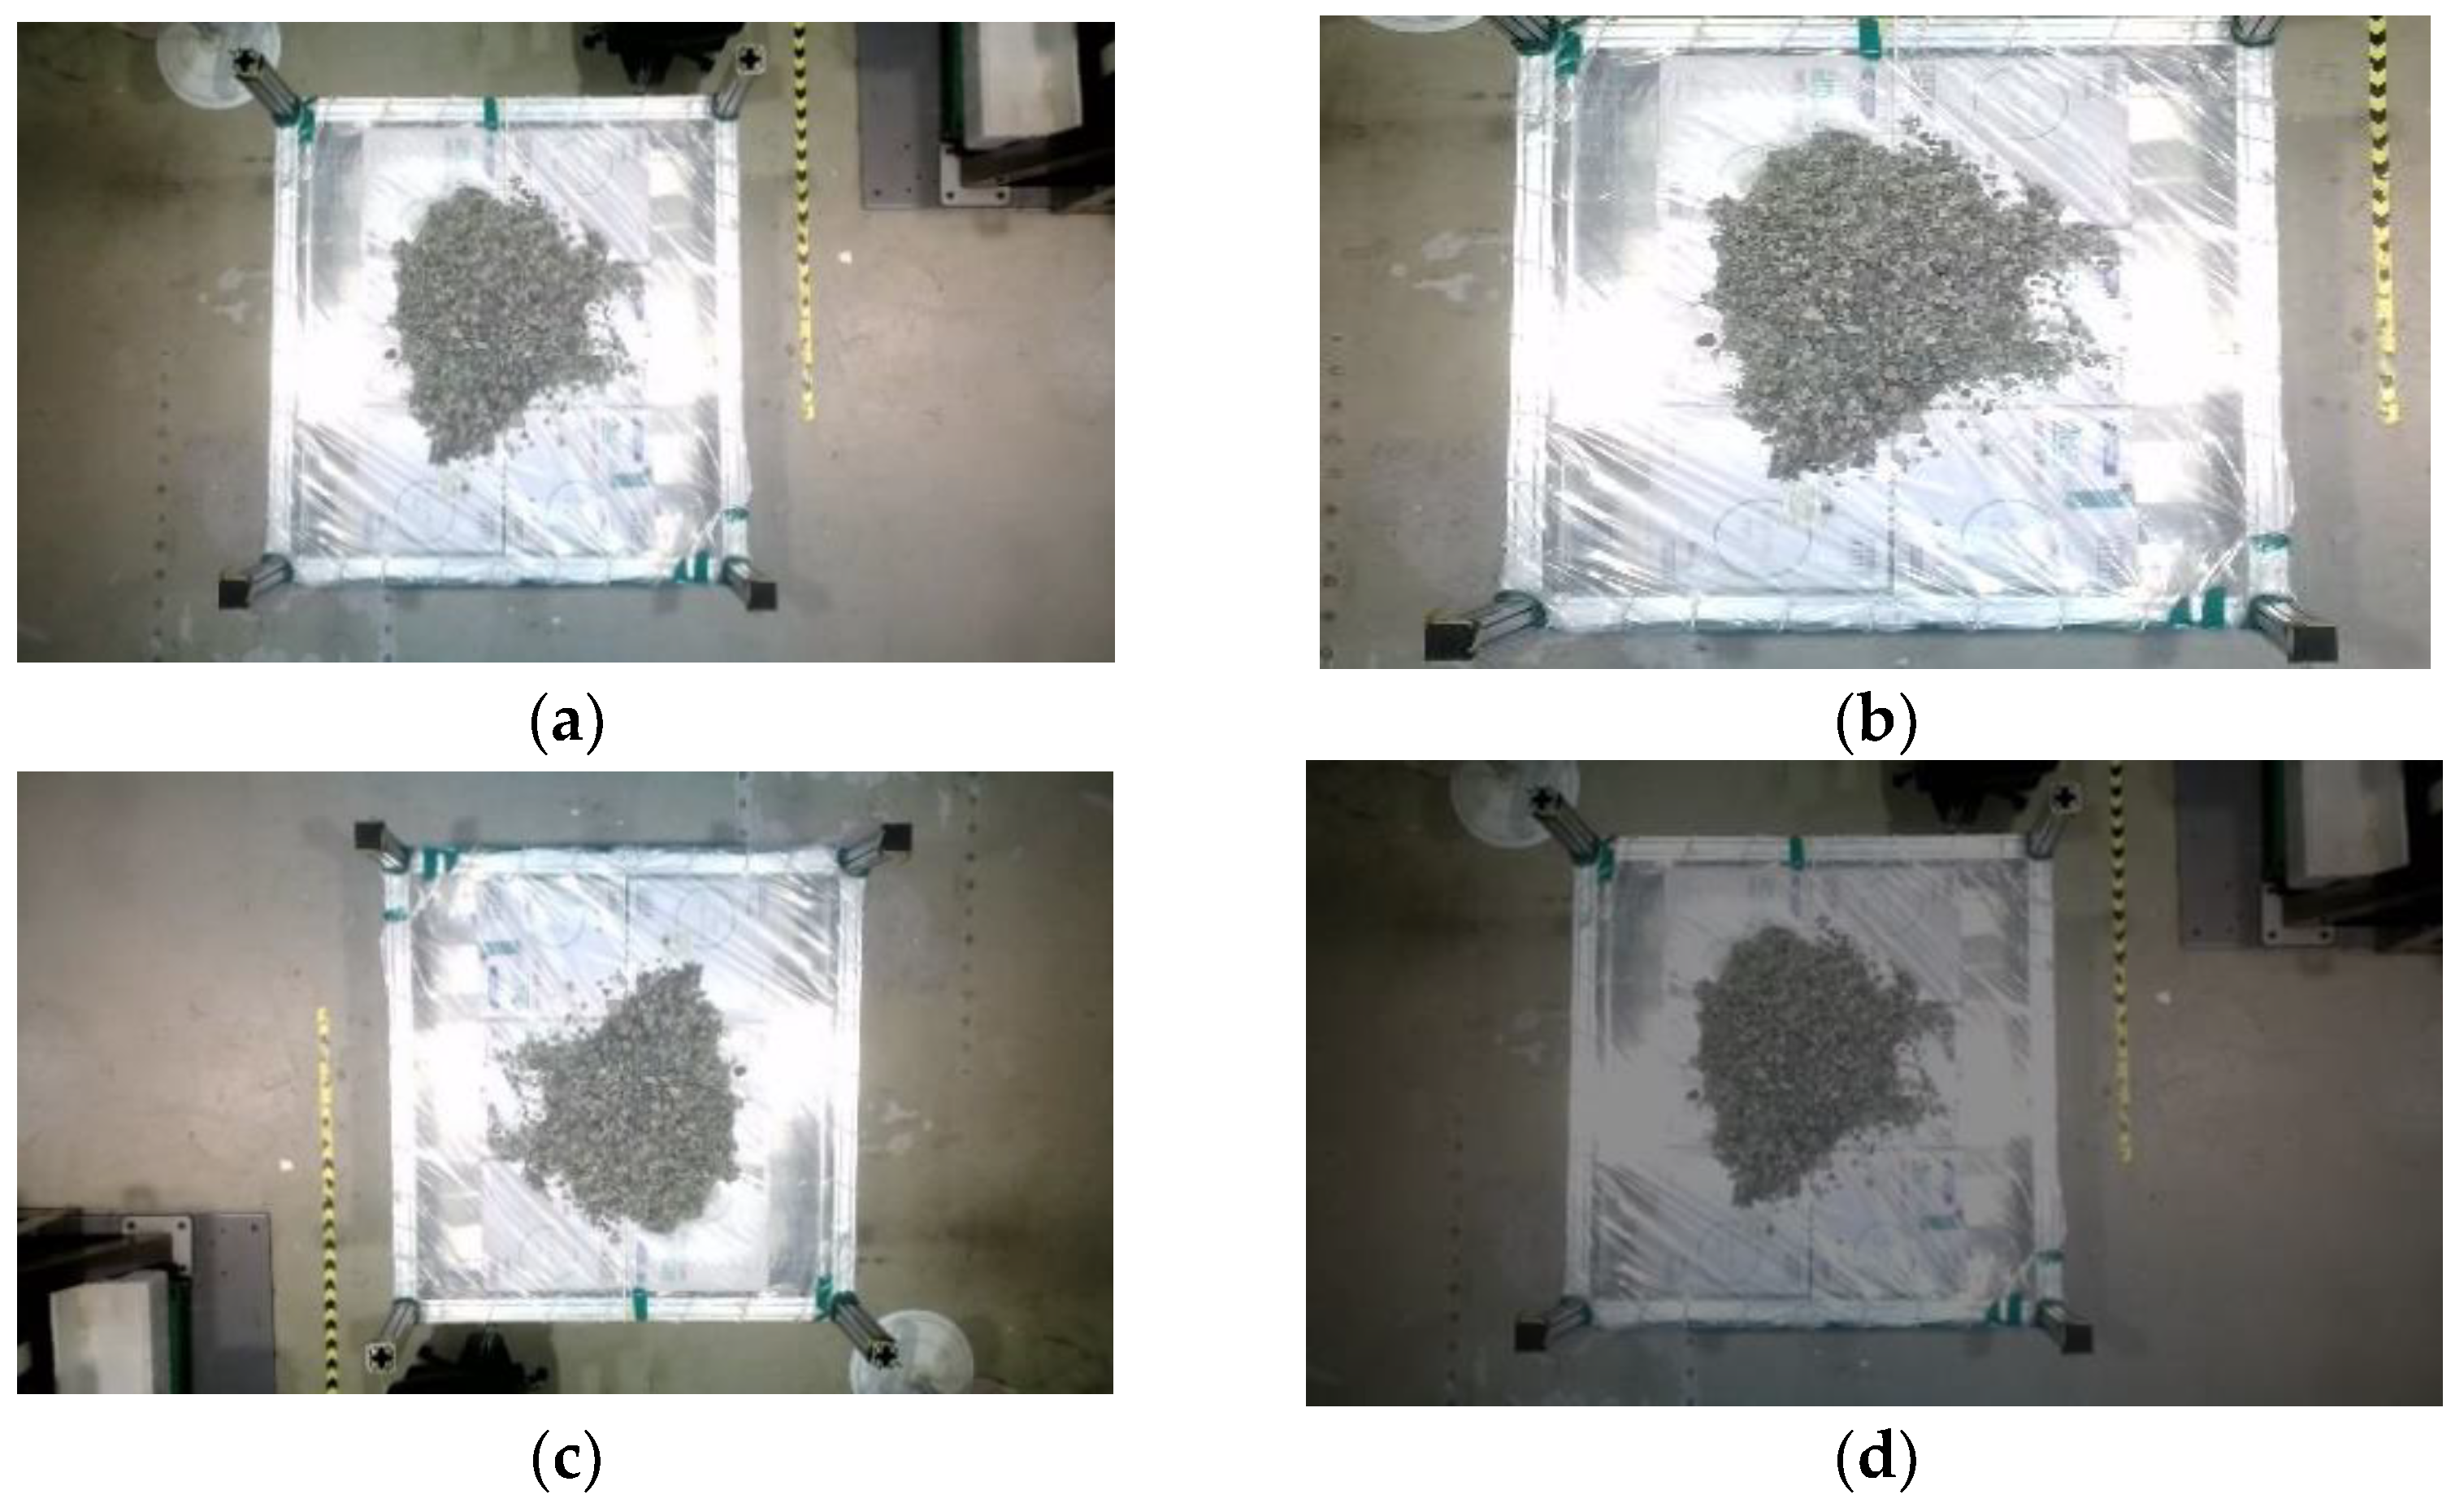
The provided photos underwent analysis and filtration, employing various approaches to produce additional image data about the cargo hold. Data augmentation is a widely used technique in computer vision to prevent deep learning models from overfitting [11]. Figure 4b–d showcase various data augmentation techniques employed in computer vision, including flipping, color manipulation, and cropping. Following the completion of data augmentation processing, it is necessary to assign labels to these data. The authors employed labelImg, a tool for image annotation, to assign labels to data [12]. Afterward, the dataset was divided into training and testing sets for the cargo hold recognition model.
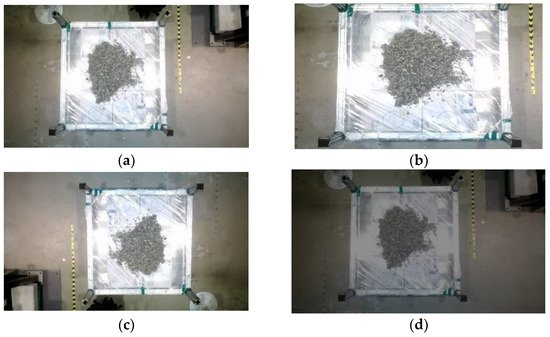
Figure 4.
Data augmentation processing: (a) original image; (b) cropped image; (c) flipped image; (d) color manipulation of the image.
2.3. Design of a Cargo Hold Detection Process
The construction of the cargo hold recognition model involved the utilization of example photos from the cargo hold dataset and a specialized detection technique. The advancement of computer hardware, particularly GPUs, has expedited the computational advancements of deep learning models. This has played a crucial role in the development of object detection algorithms in the domain of computer vision [13]. Deep learning employs two primary approaches for target detection: the two-stage detection method and the one-stage detection method. The two-stage approach, sometimes referred to as the area-based method, comprises two primary stages. In the initial phase, region suggestions are generated using algorithms such as Selective Search or Region Proposal Networks (RPN). In the subsequent phase, the features of the area proposals from the first stage are extracted for classification and regression [14]. The accuracy of this method in object detection tasks is often higher compared to the single-stage method. Nevertheless, the process of identifying objects is time consuming due to the method’s requirement of calculating and processing additional information.
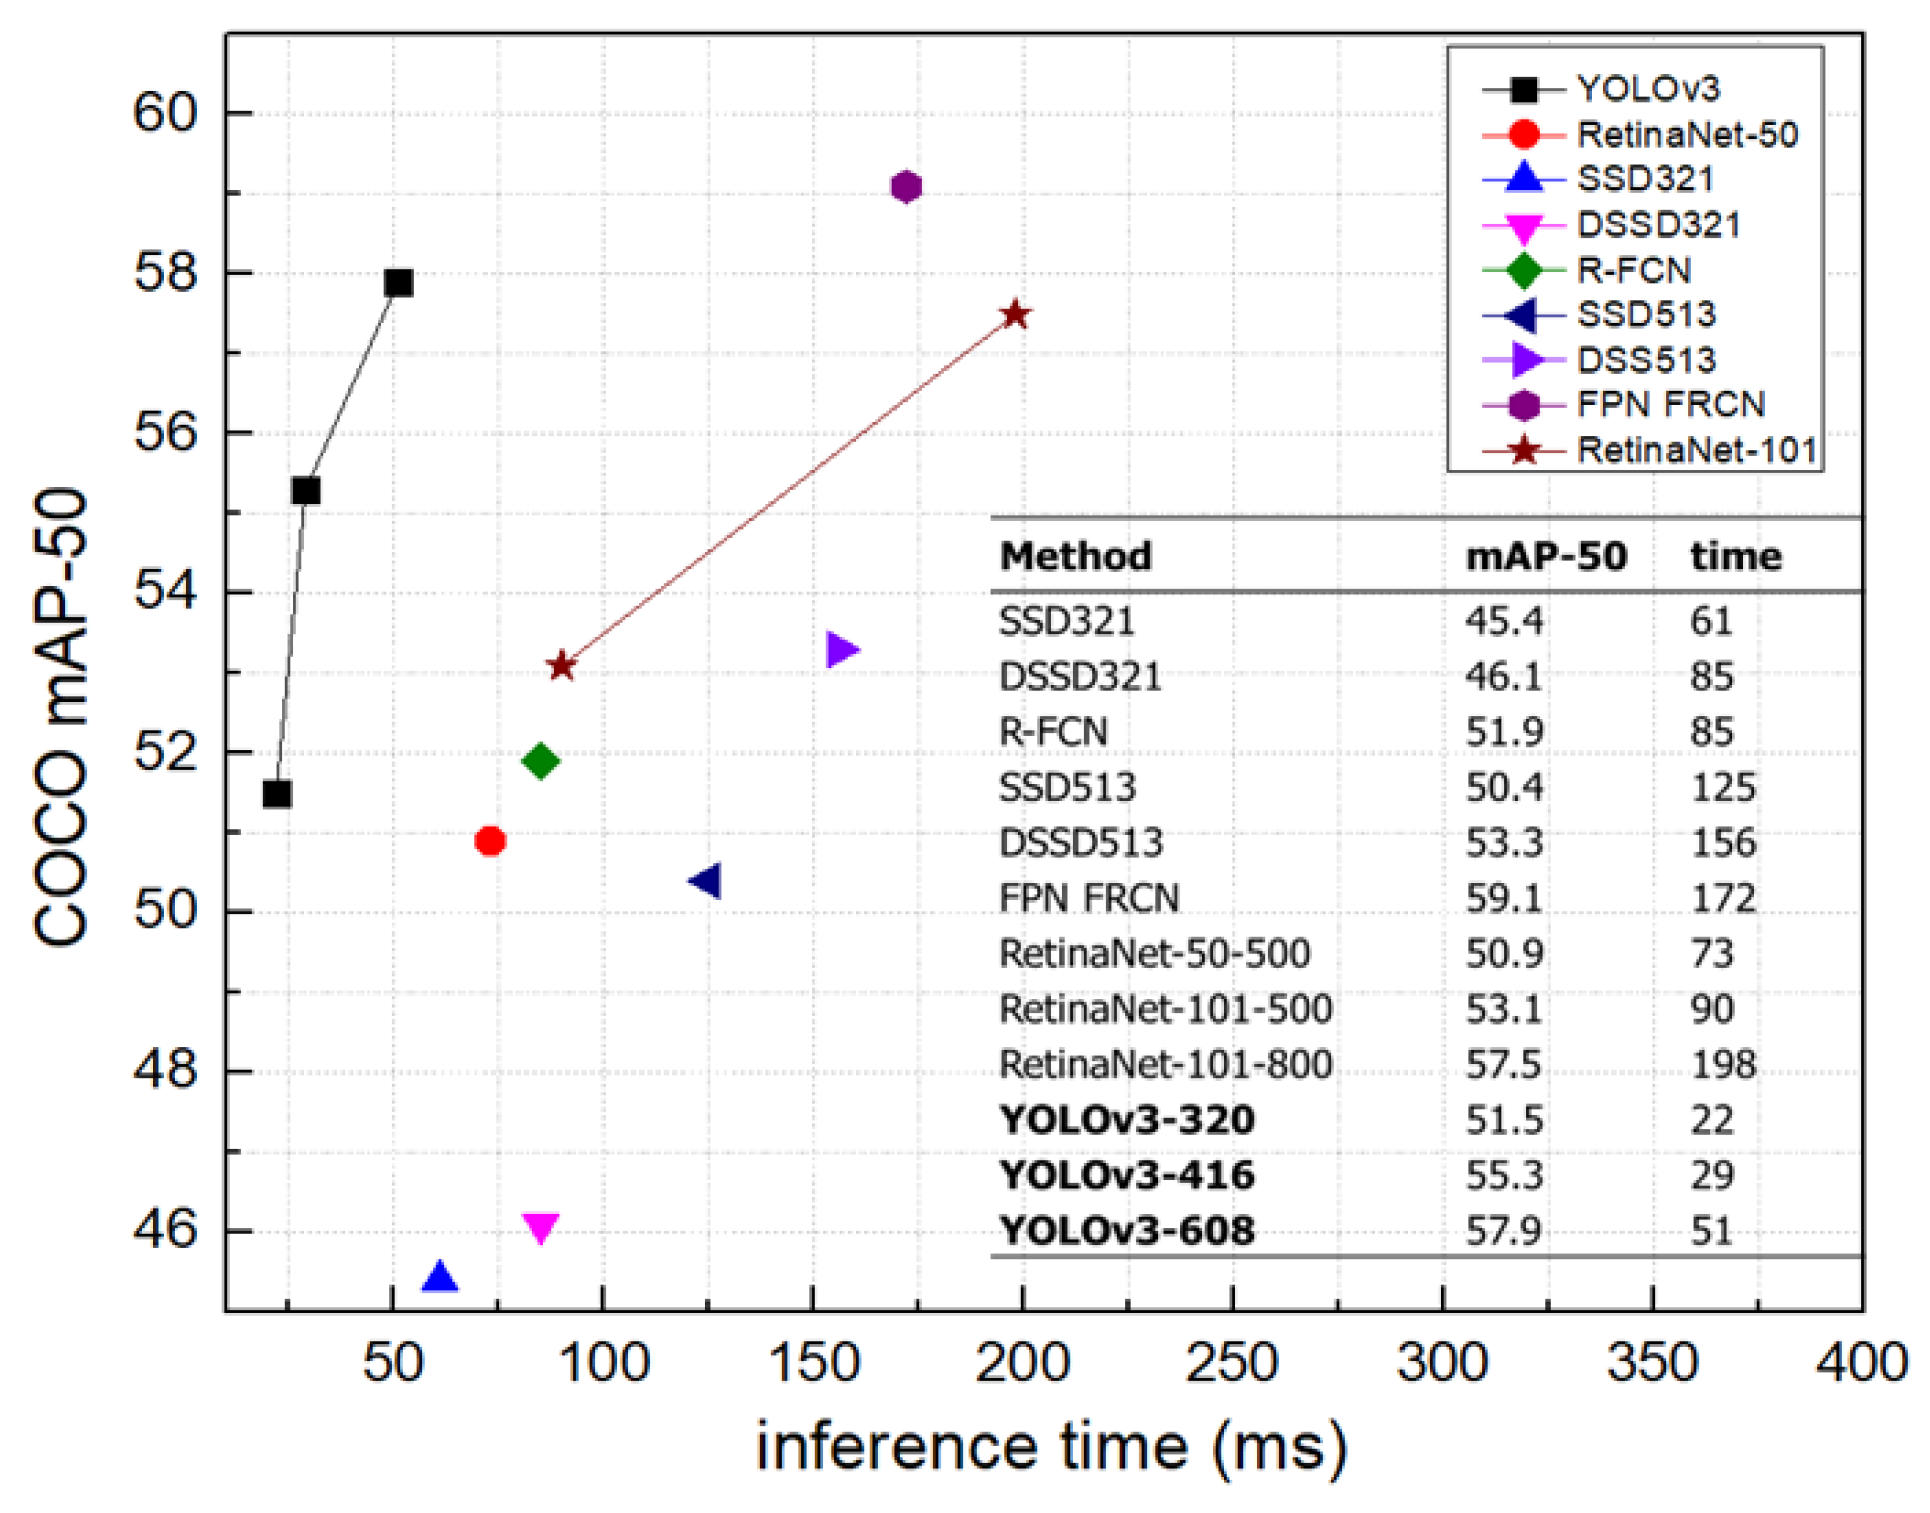
The second method is referred to as the one-stage detection approach. The popularity of this computer vision technique has increased since it prioritizes real-time efficiency while maintaining a high level of accuracy. One-stage detectors differ from two-stage approaches in that they immediately and concurrently anticipate the object class and bounding box coordinates without the need for region proposal and subsequent classification. This eliminates the intermediate stage of region suggestion, hence accelerating the detection procedure. This technique is shown by notable algorithms such as You Only Look Once (YOLO) and the Single Shot MultiBox Detector (SSD). The methods in question efficiently and comprehensively gather a large number of candidate bounding boxes from feature maps, covering a wide range of sizes and aspect ratios [15]. By doing this, they effectively manage objects of various sizes within photos. Although one-stage detectors may have slightly lower accuracy compared to certain two-stage detectors, they are preferred in situations where real-time processing is crucial, such as autonomous driving and video surveillance, because of their fast inference capabilities. One-stage detection algorithms provide a favorable trade-off between speed and accuracy in object detection tasks. Figure 5 displays the relationship between the speed (measured in milliseconds) and accuracy (measured by average precision) of the object detection method on the Common Objects in Context (COCO) dataset [16]. The YOLOv3 method showcases exceptional accuracy and remarkably swift real-time object identification speed, surpassing existing object detection algorithms.
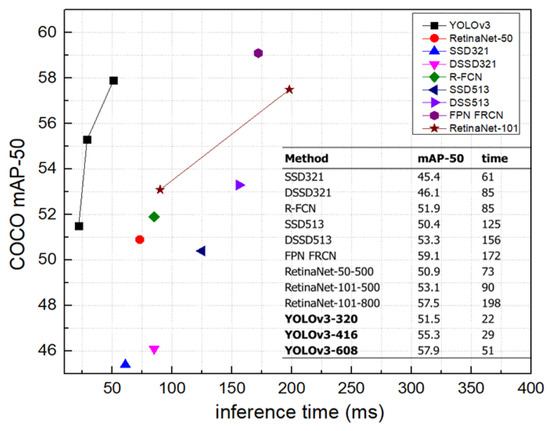
Figure 5.
Speed (ms) versus accuracy (AP) on the COCO dataset.
The YOLOv3 algorithm, a third version of the initial YOLO algorithm, introduced numerous improvements. Initially, it utilized the Darknet-53 architecture, which is a more complex neural network that led to enhanced feature extraction, thus enhancing accuracy [17]. Furthermore, YOLOv3 implemented three distinct detection scales, thereby mitigating one of the initial model’s limitations in recognizing smaller objects. The model accomplished this by employing three different sizes of anchor boxes at each detection scale, enhancing its ability to identify objects with different dimensions. In addition, YOLOv3 enhanced the class prediction method by utilizing separate logistic classifiers instead of relying on Softmax. This allows for the identification of several object categories within a single bounding box. The YOLOv3 algorithm has improved upon its predecessor by not only maintaining real-time detection capabilities, but also greatly increasing accuracy. As a result, it is now considered one of the most efficient object detection algorithms in the current AI field.
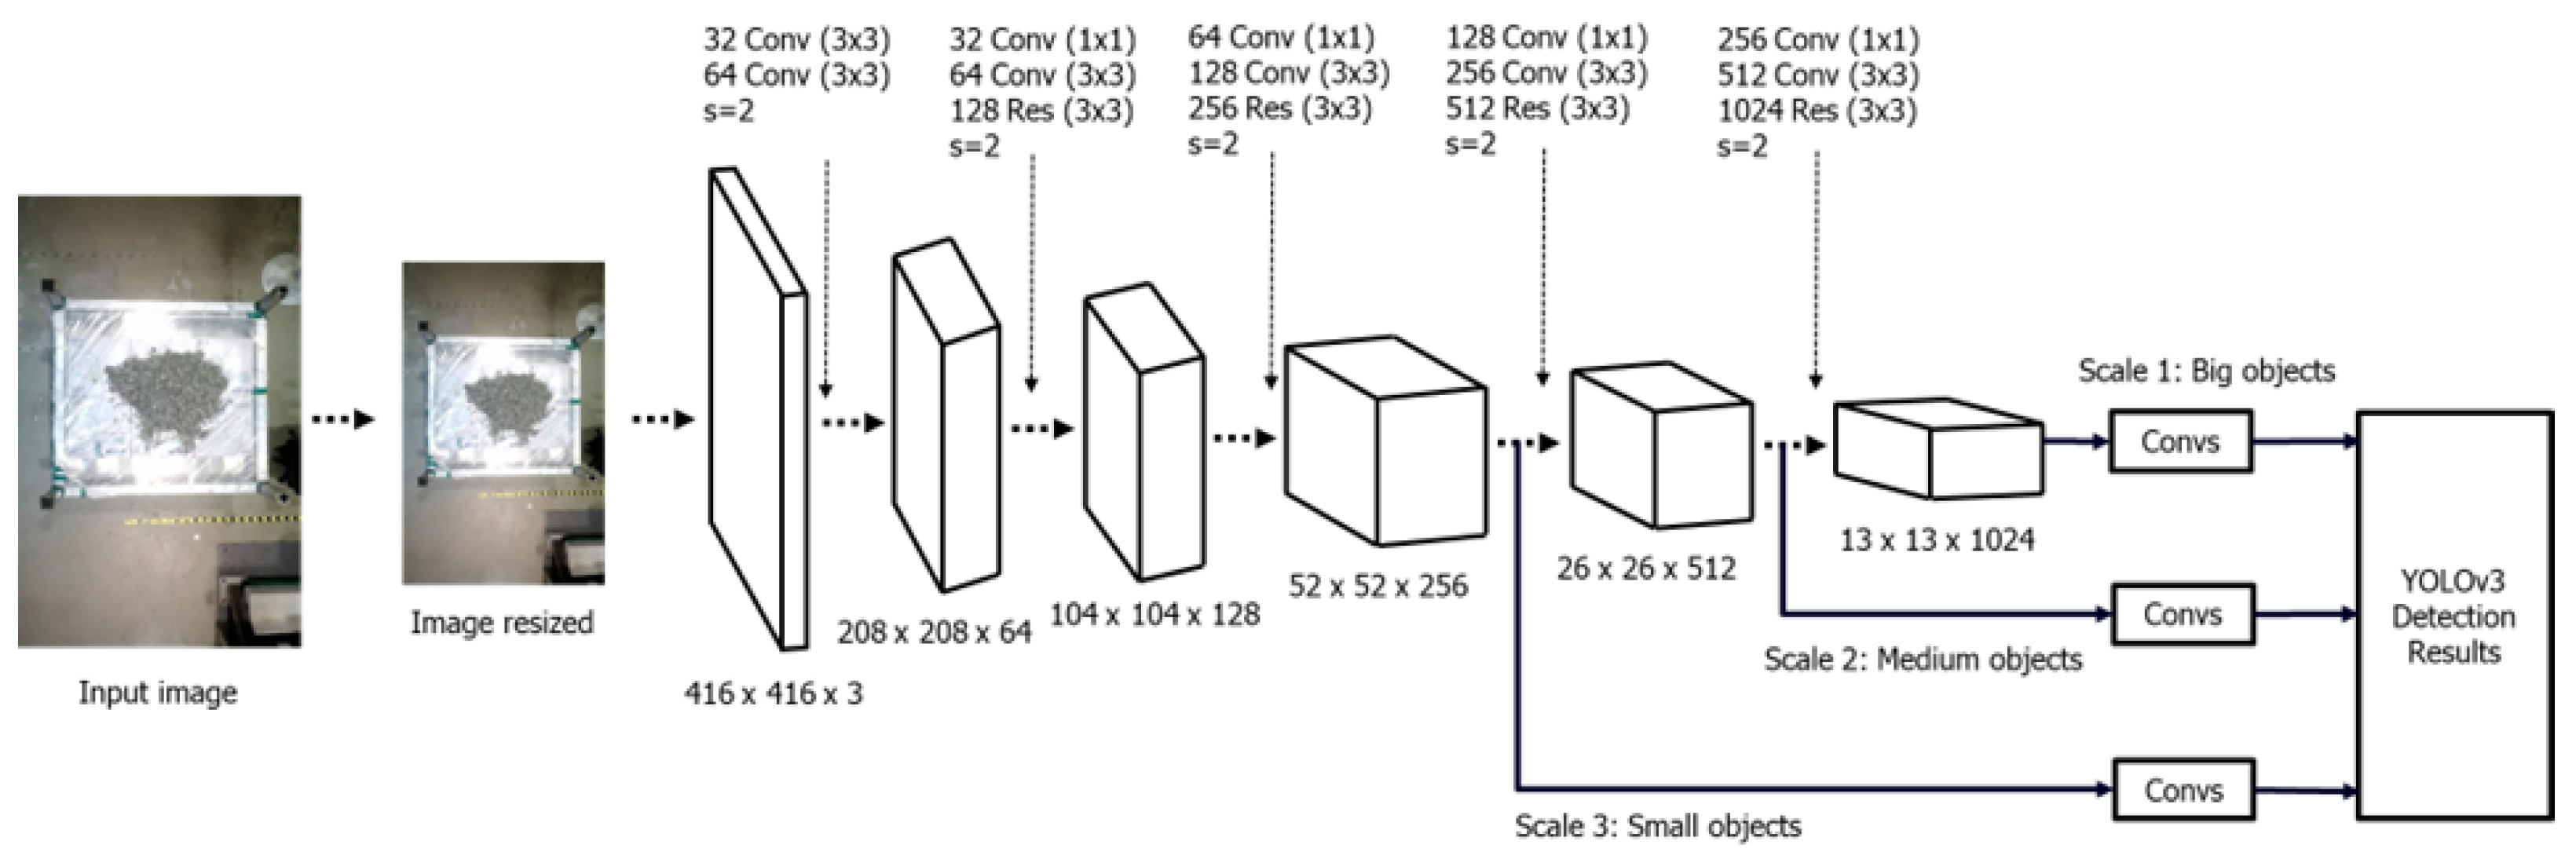
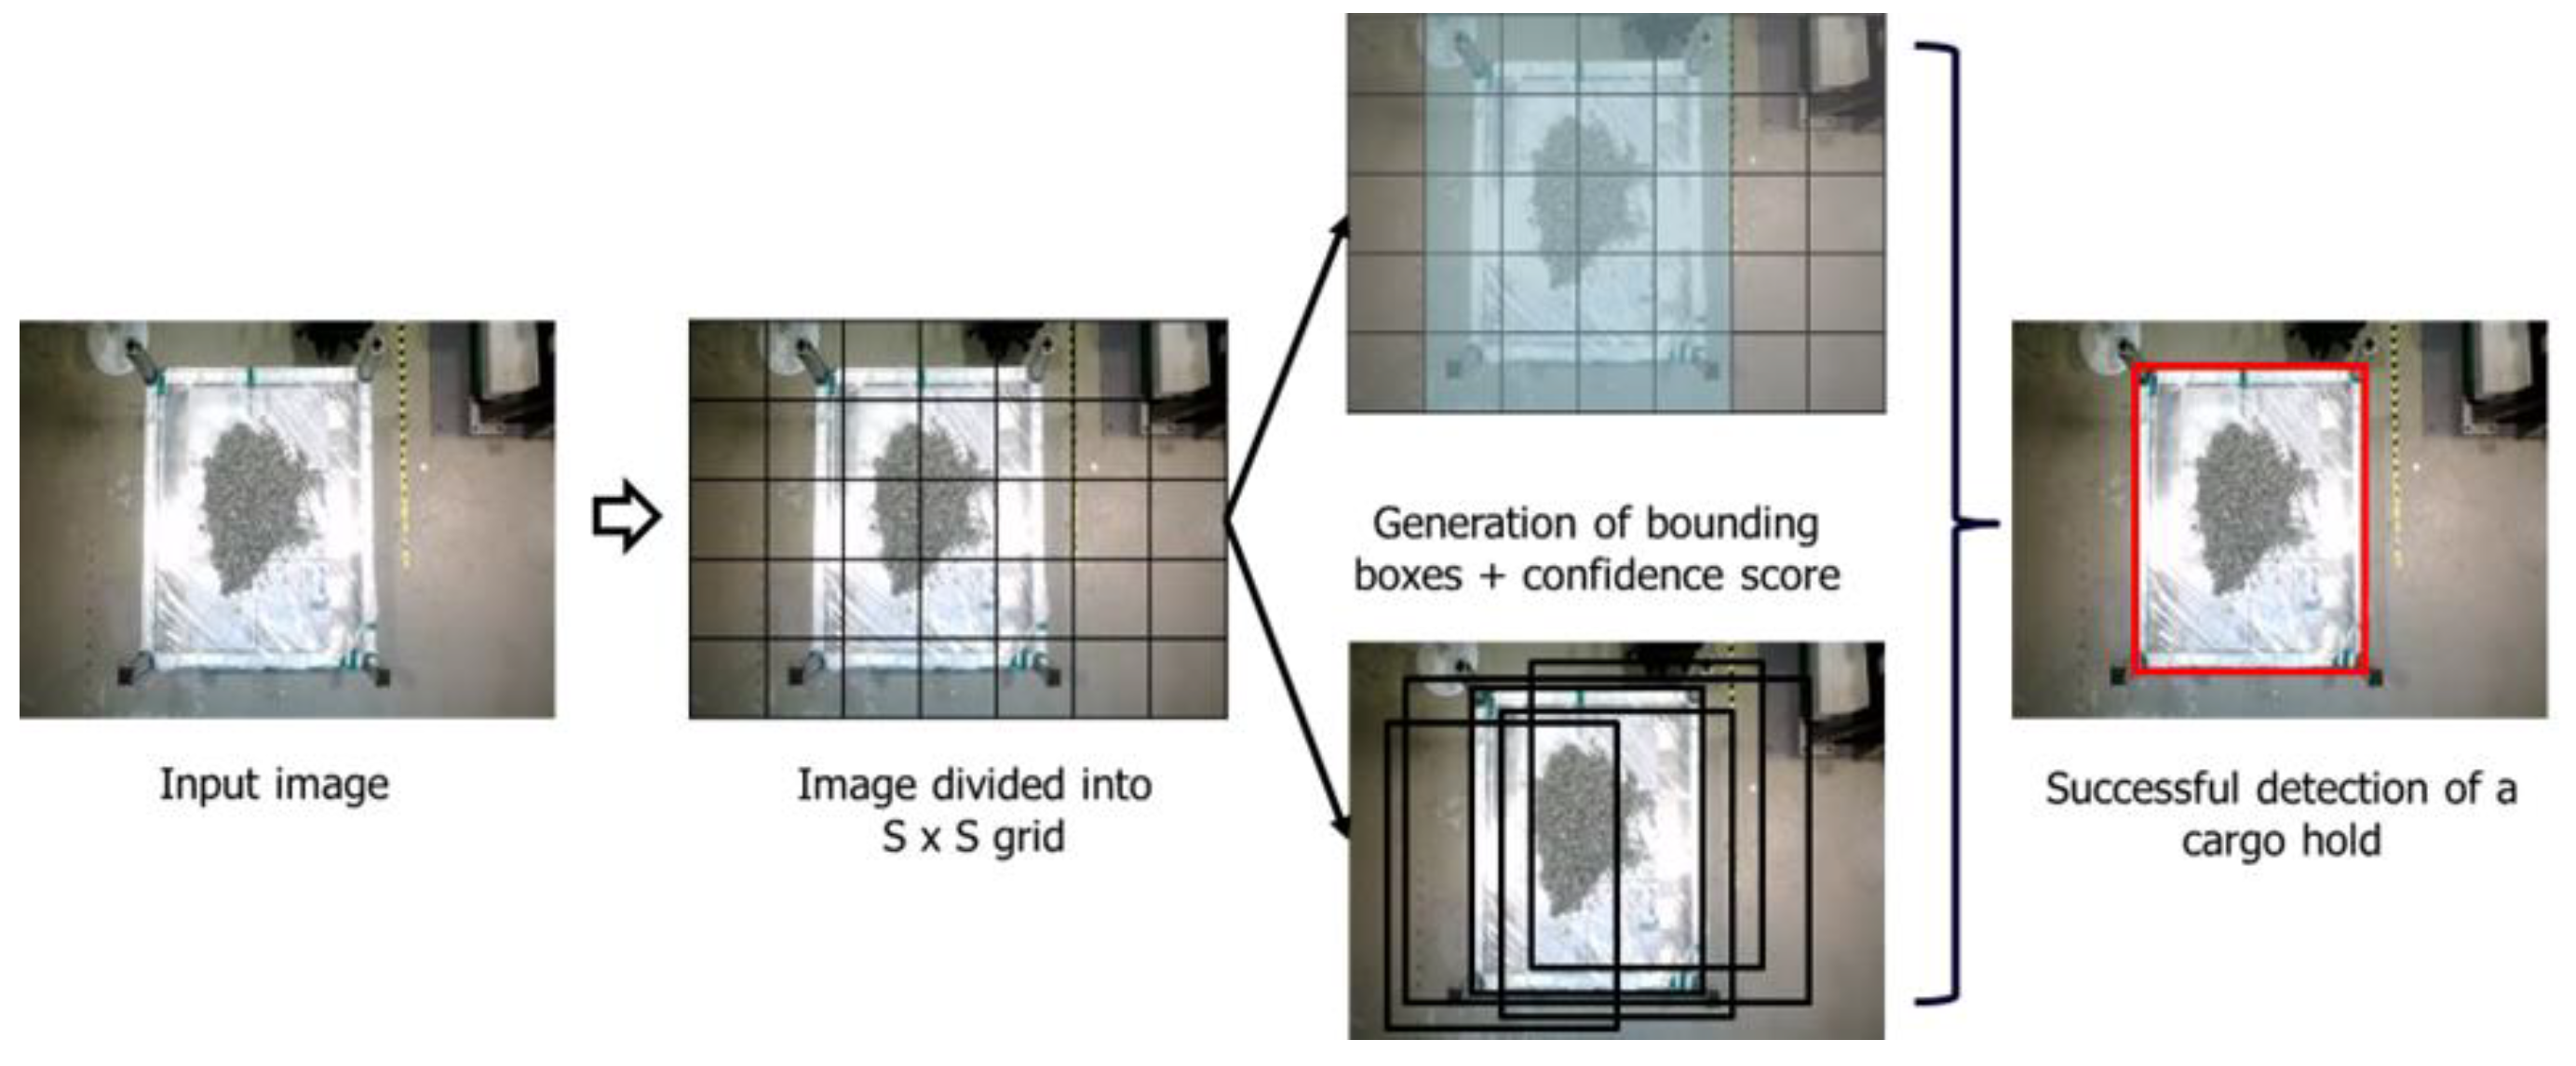
The YOLOv3 model’s architecture is illustrated in Figure 6, employing the Darknet-53 framework. The design comprises 53 convolutional layers, which enable enhanced feature extraction by using the integration of YOLOv2, Darknet-19, and ResNet. The primary elements of YOLOv3’s architecture consist of 1 × 1 and 3 × 3 convolution kernels accompanied by ResNet-inspired skip connections [18]. Figure 7 illustrates the primary steps of the YOLOv3 algorithm as it is used to detect cargo holds. The algorithm will partition the image into SxS grids. Every grid will forecast the positions of bounding boxes and the likelihood of different categories. Ultimately, the system generates a conclusive prediction to ascertain the cargo hold [19].

Figure 6.
YOLOv3 architecture.
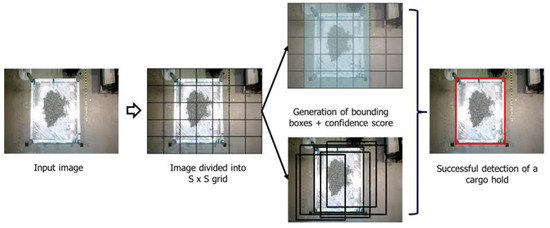
Figure 7.
Detection model of YOLOv3.
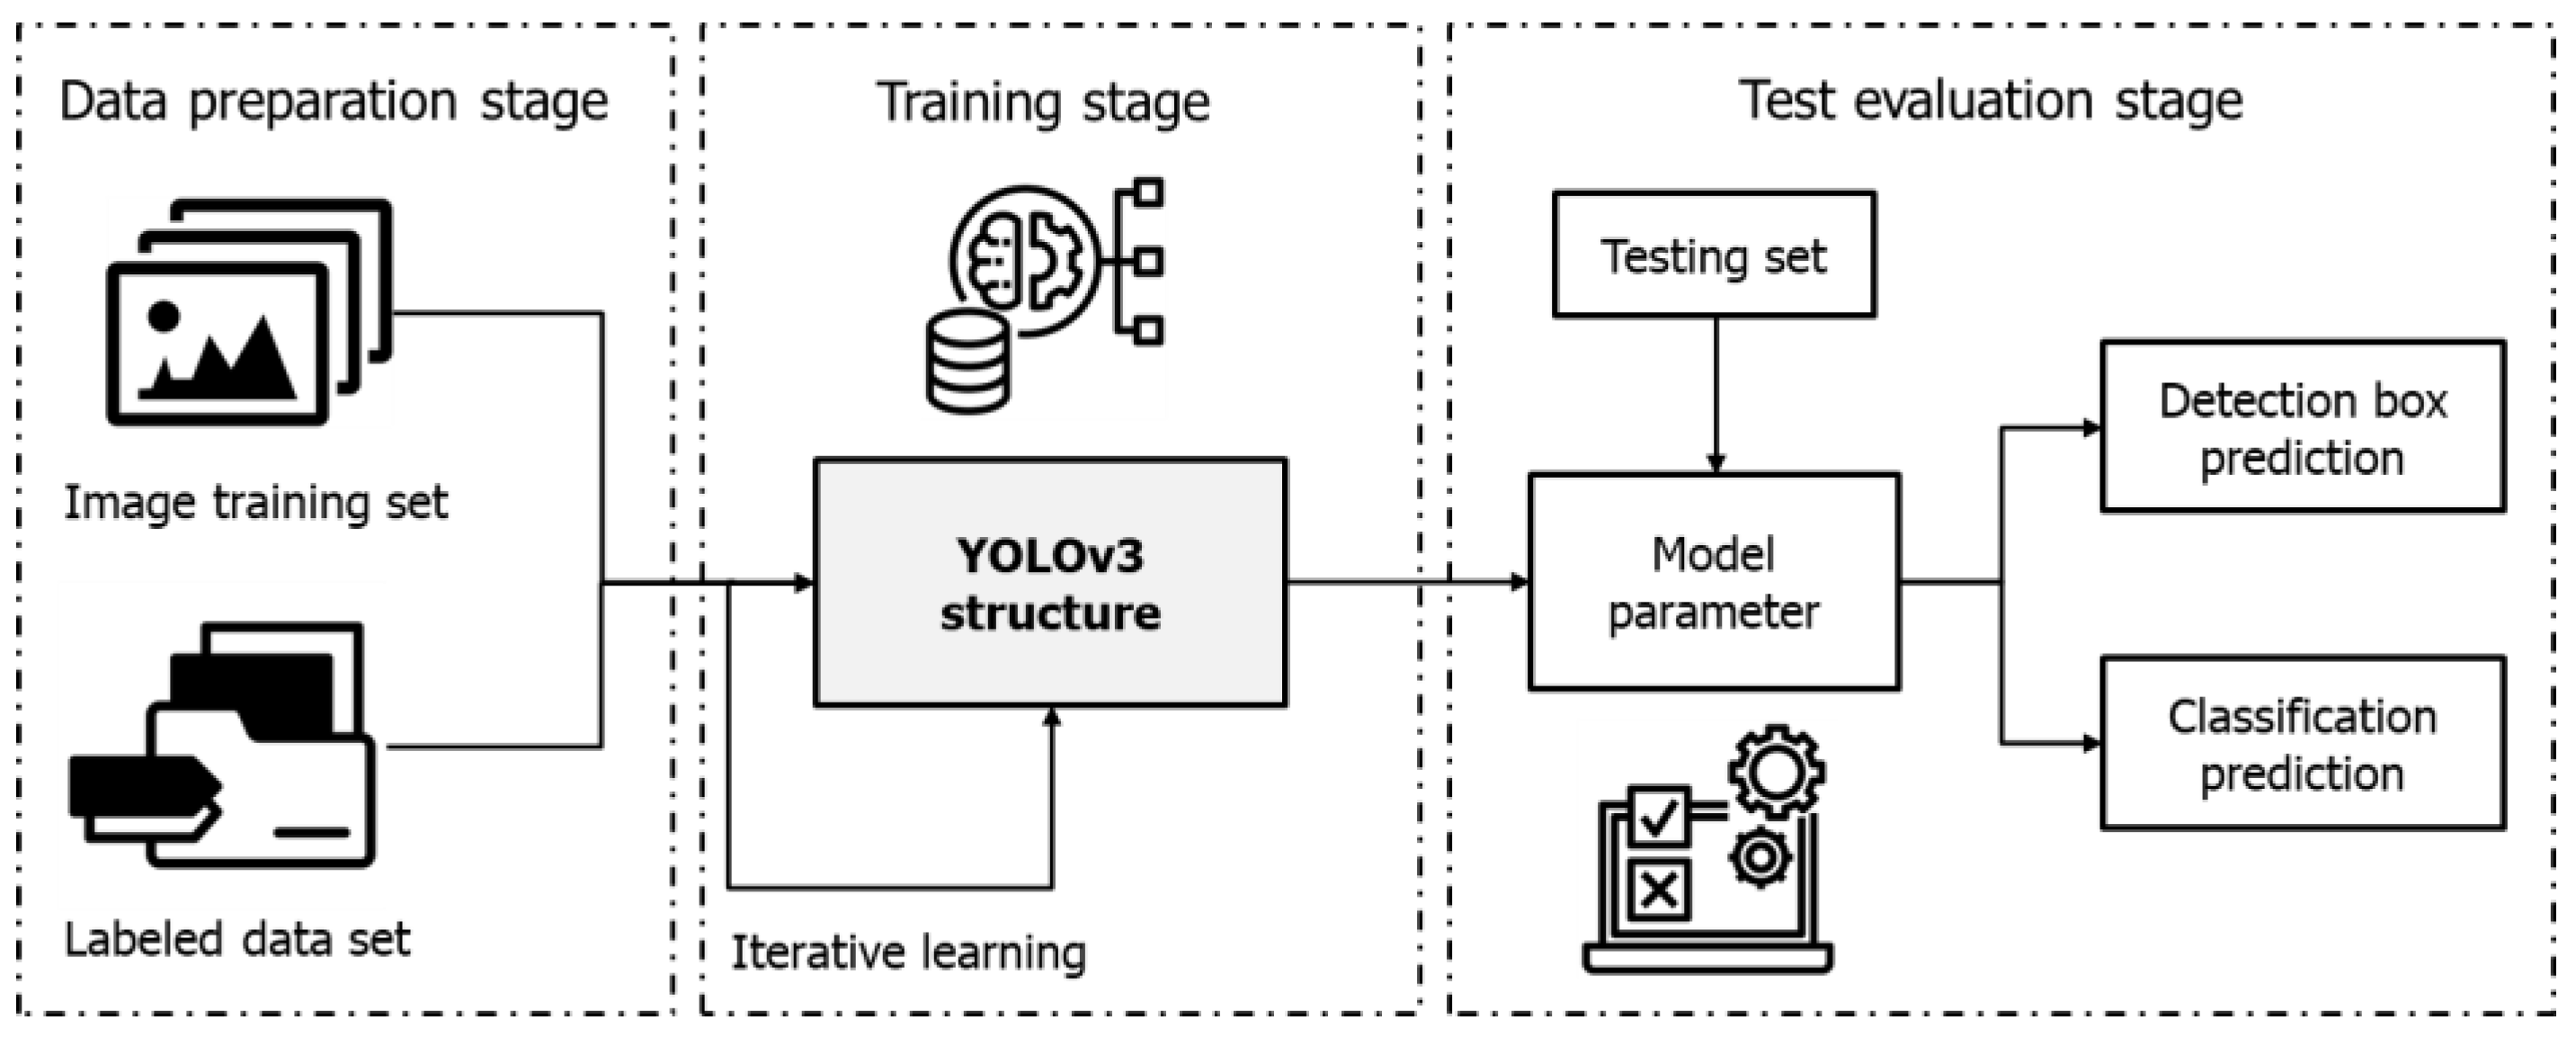
Therefore, in order to meet the requirement for quick and accurate identification of ship compartments in real time, the authors chose to employ the YOLOv3 algorithm for this research. Figure 8 depicts the main stages of the YOLOv3 model development process for object detection. The YOLOv3 method utilizes both the cargo hold image and its corresponding labeling data as inputs for the detection procedure. The input data for this algorithm were generated by the collection and analysis of sample image data from the cargo hold. Table 2 provides a detailed overview of the specific parameters and the corresponding values that were used to configure the environment of the cargo hold detection model. The YOLOv3 model was trained using Google Colab.

Figure 8.
Process of designing the YOLOv3 detection model.
Table 2.
Configurations of the cargo hold detection model environment.
2.4. Accuracy Evaluation of a Cargo Hold Detection Model
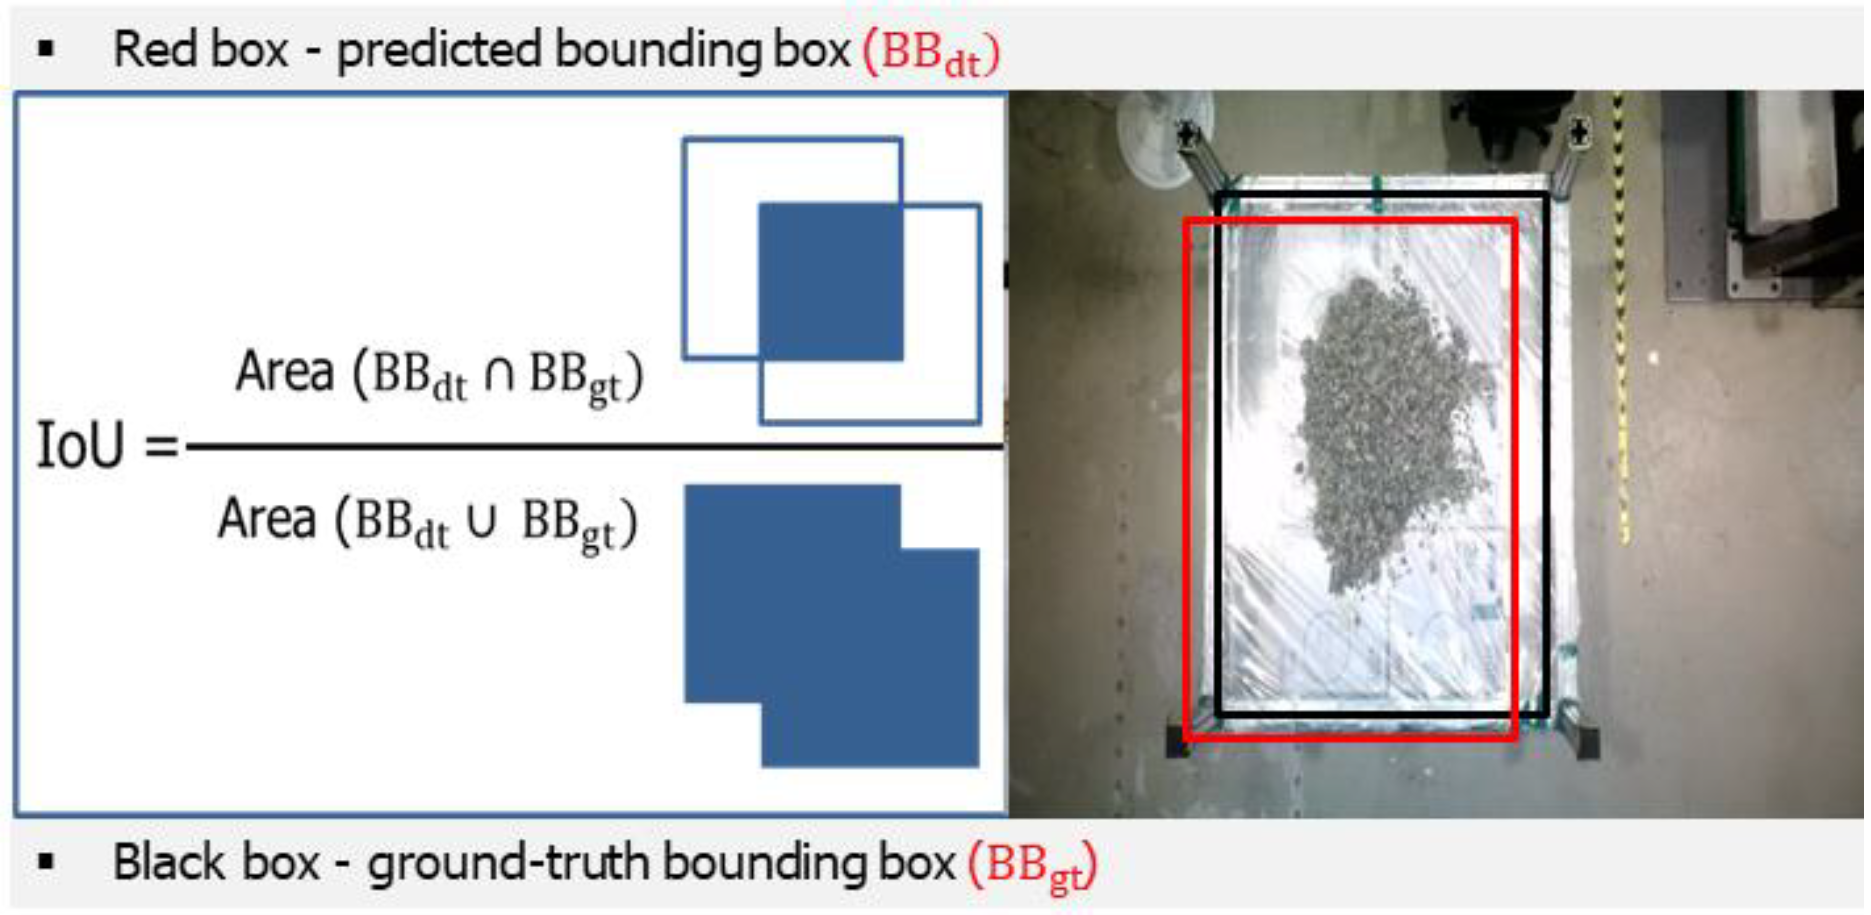
Intersection over Union (IOU) is a crucial metric in computer vision, specifically in object detection tasks, that is used to assess the accuracy of predictions. The Intersection over Union (IOU) metric measures the degree of overlap between the predicted bounding box and the ground truth bounding box. It provides valuable information on the accuracy of a model’s object detection by assessing how well the anticipated location coincides with the actual location of the object [19]. To calculate the IOU, the initial step involves determining the intersection area between the two bounding boxes. This value is then divided by the size of their union. The IOU value is mathematically derived using Equation (1).
Figure 9 provides a more comprehensive explanation of the process for calculating the IOU value. The resulting value falls within the range of 0 to 1. A score of 1 signifies a complete overlap or correspondence, indicating that the predicted bounding box and the ground truth bounding box are exactly the same. On the other hand, a score of 0 signifies that there is no overlap.

Figure 9.
Calculation of the Intersection over Union (IOU).
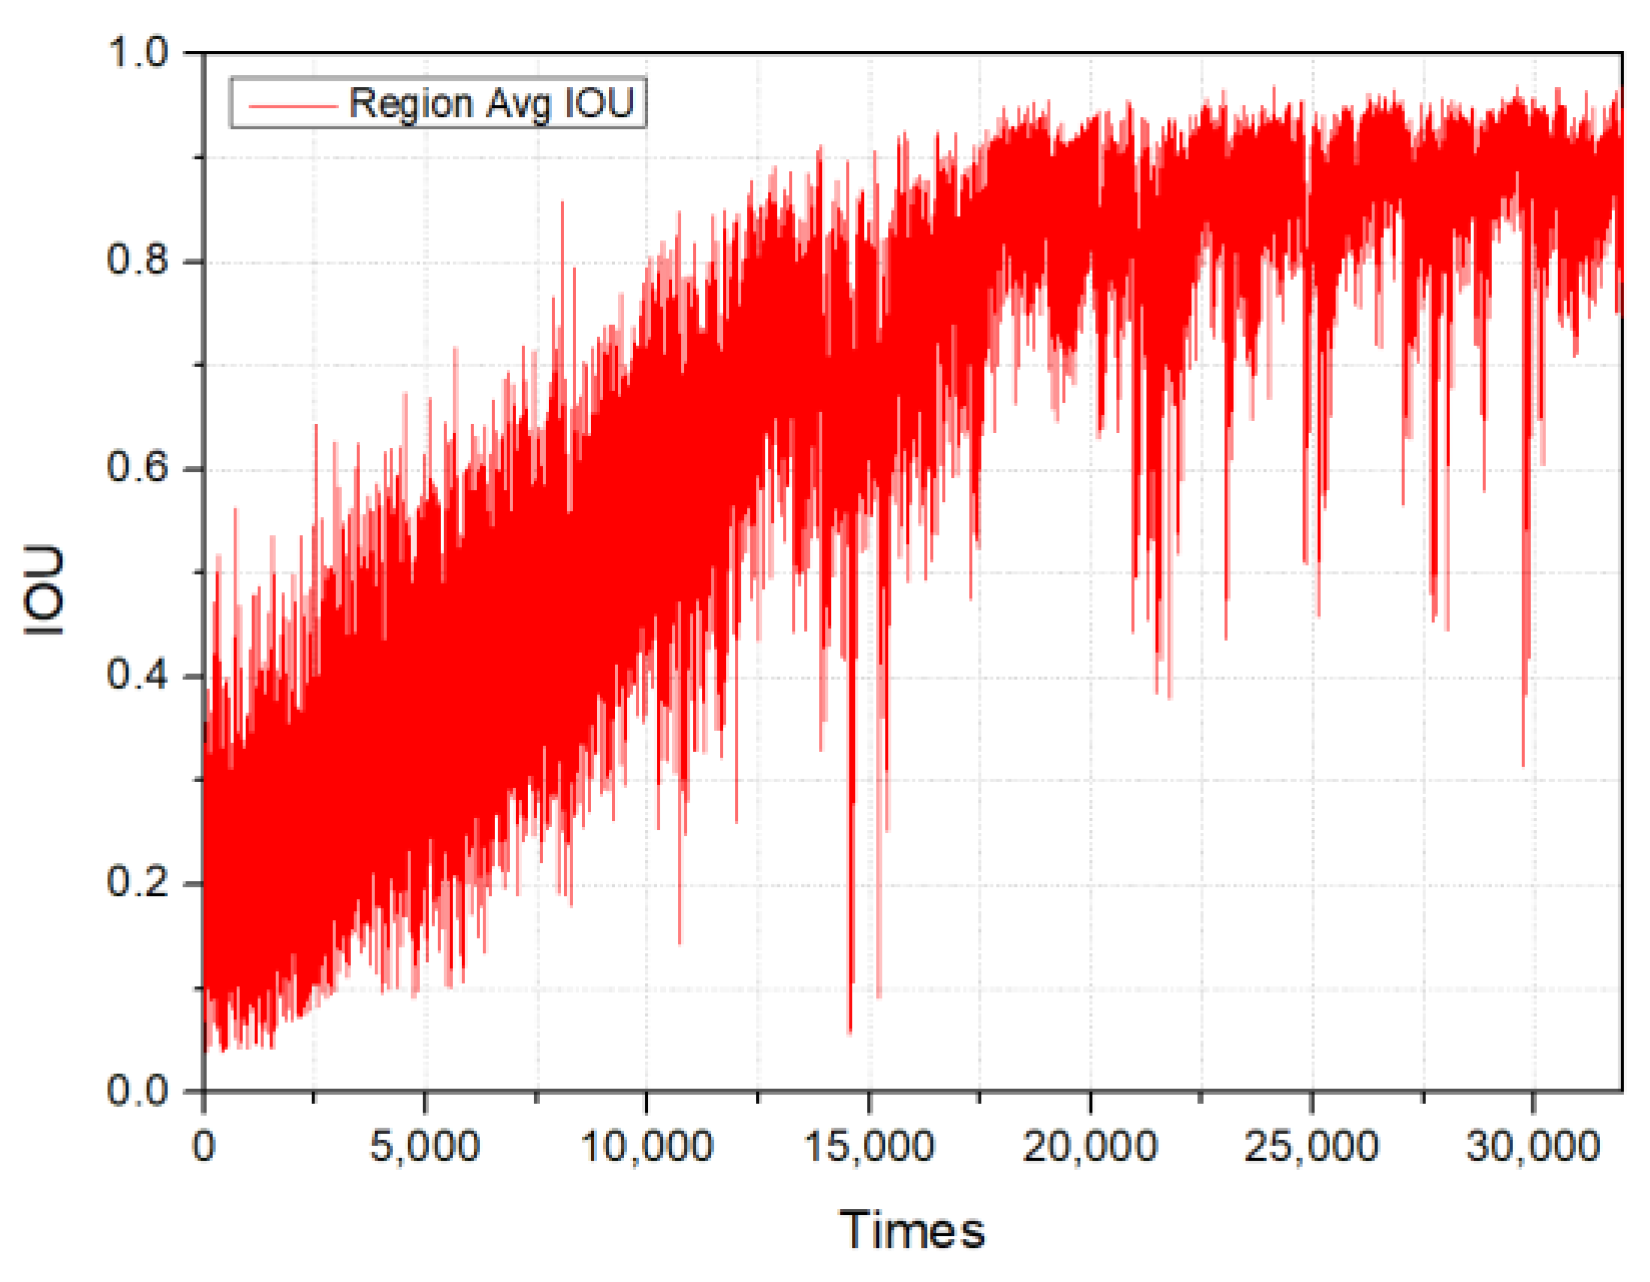
Within several object detection frameworks and challenges, such as the PASCAL VOC or MS COCO, it is common to establish the IOU threshold at 0.5 [20]. If the IOU value between a predicted bounding box and the ground truth is 0.5 or higher, the forecast is generally deemed accurate. However, in more rigorous applications or benchmarks, elevated thresholds may be employed. Hence, the target of the IOU threshold score in this study is 0.75. Figure 10 illustrates the progression of IOU over the training period of the cargo hold identification model.
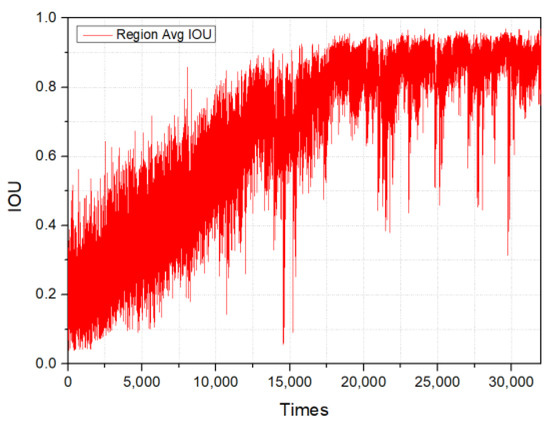
Figure 10.
Intersection over Union curve.
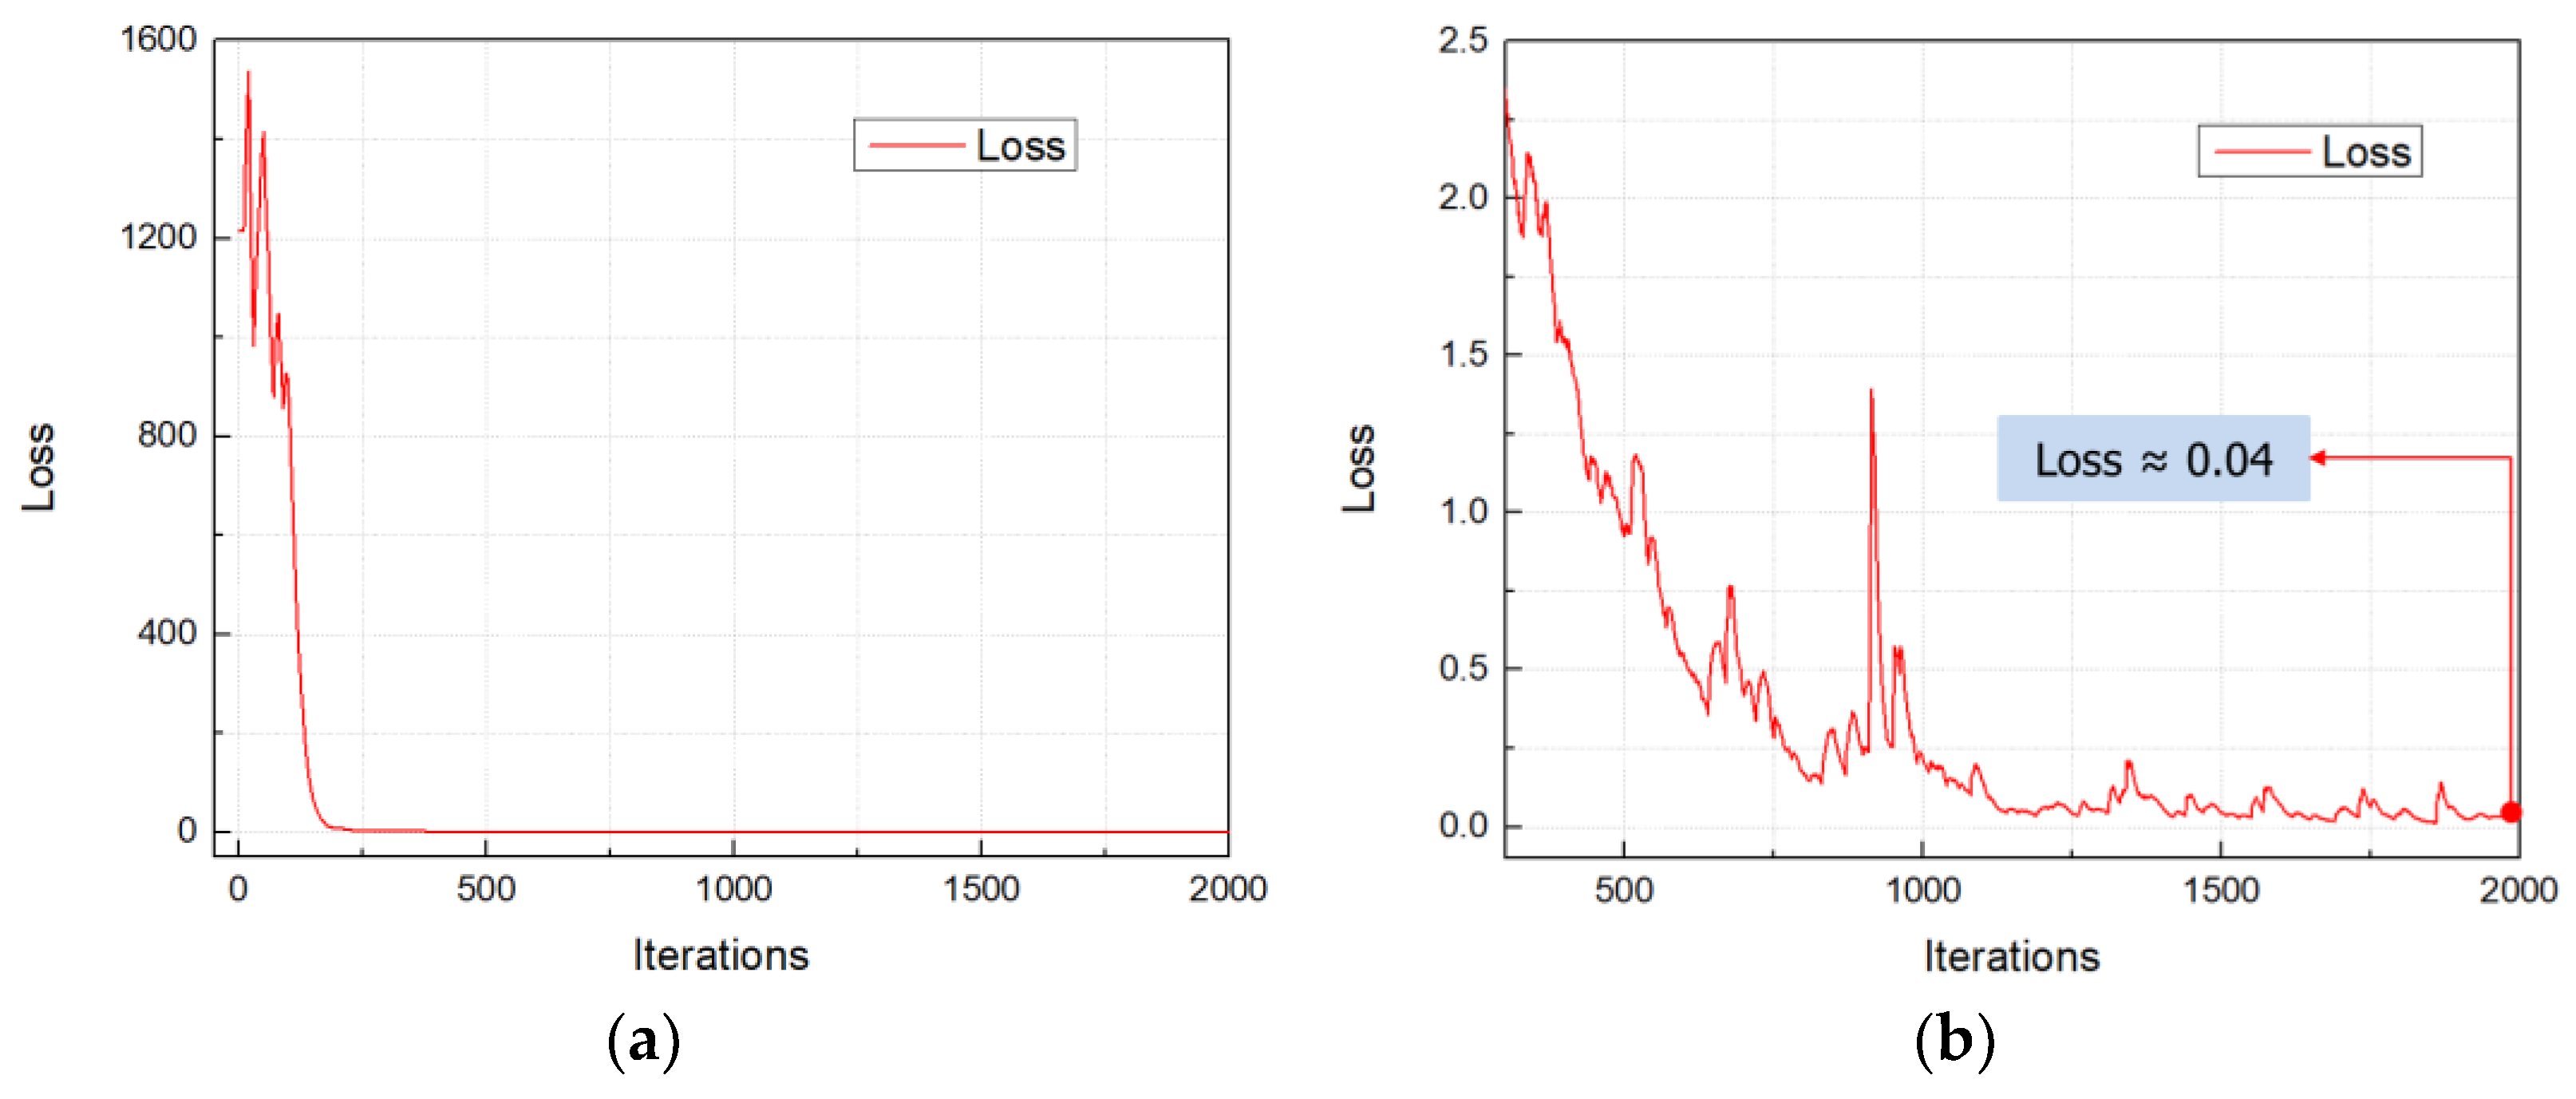
In addition, the loss function quantifies the discrepancy between the anticipated value generated by the network and the true value of the output. It is employed to evaluate the accuracy of the model’s predictions. YOLOv3 implements a change in its methodology for classification, deviating from previous iterations that utilized mutually exclusive labels. Instead, it employs the approach of multi-label classification. Within this framework, a logistic classifier is utilized to calculate feature scores for every bounding box. YOLOv3 differs from previous versions by utilizing binary cross-entropy loss for classification during training, instead of the mean square error commonly used in earlier iterations [19]. The loss function utilized in the parameter optimization of YOLOv3 is mathematically represented as Equation (2) [19].
where n is the sample index, is the objectness score predicted by the network, and is the ground truth.
Figure 11 displays the loss function value of the training model after 2000 iterations in total. In the initial iterations, the loss value is significantly high, as depicted in Figure 11a. This is attributed to the early stages of the training model, where it is just beginning to learn and identify objects from the dataset. From iteration 300 onwards, there was a substantial improvement in the model’s performance. After approximately 2000 iterations, the loss value of the trained model was around 0.04, as illustrated in Figure 11b.
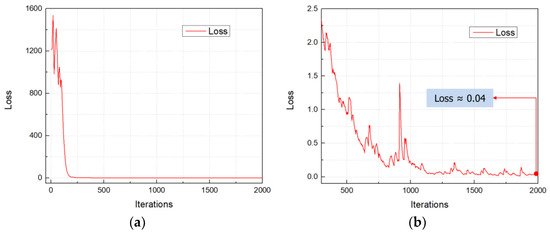
Figure 11.
Loss functions: (a) loss curve after 2000 iterations; (b) loss curve from 300 iterations to 2000 iterations.
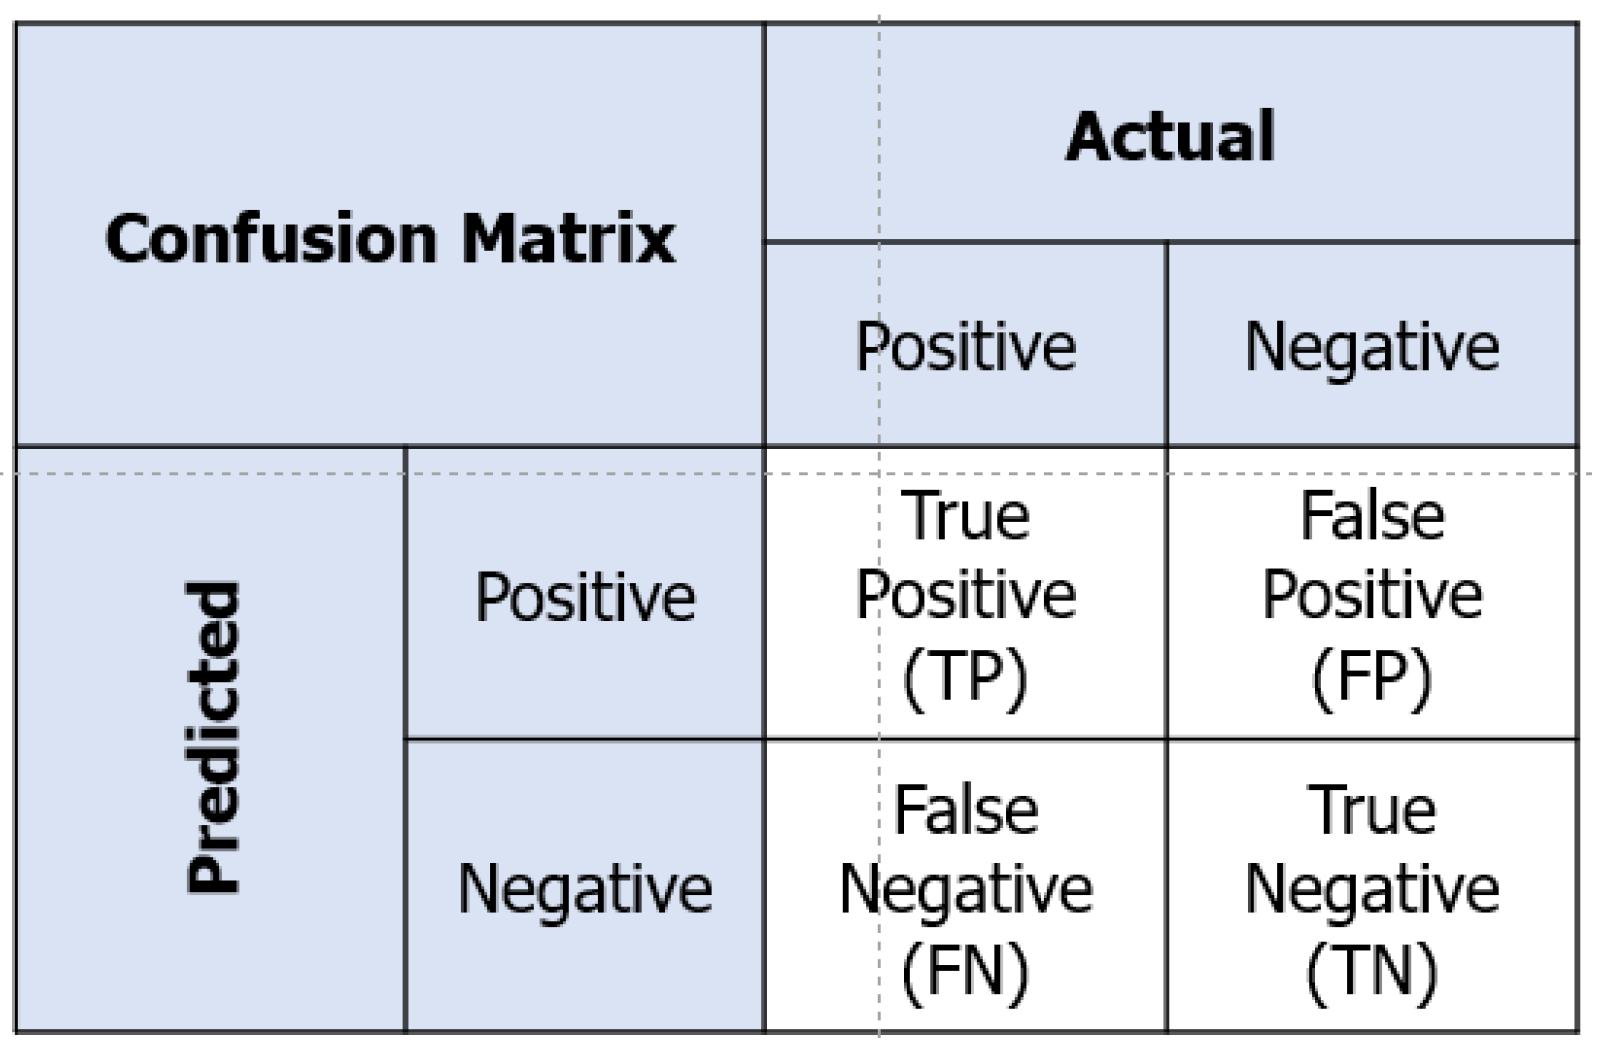
Furthermore, the confusion matrix is an essential evaluation tool that clarifies the performance of image classification algorithms in the field of vision AI. The matrix presents the anticipated and real categorizations of datasets in a tabular format, facilitating a distinct comparison between them [21]. It not only offers an understanding of accurate predictions, but also emphasizes cases where the algorithm may mistake one category for another. A confusion matrix assists developers in enhancing and upgrading their vision AI models for improved accuracy and effectiveness by visually representing both misclassifications and successful detections. The structure of the confusion matrix is shown in Figure 12. This matrix contains four parameters. A True Positive (TP) result occurs when the model correctly predicts an image as a cargo hold when it is indeed a cargo hold. If the model incorrectly predicts that a picture is a cargo hold when it is not, this is known as a False Positive (FP) result. A False Negative (FN) result occurs when the model predicts a different class than the cargo hold for this category. A True Negative (TN) result refers to correct predictions by the model that something is not a cargo hold.
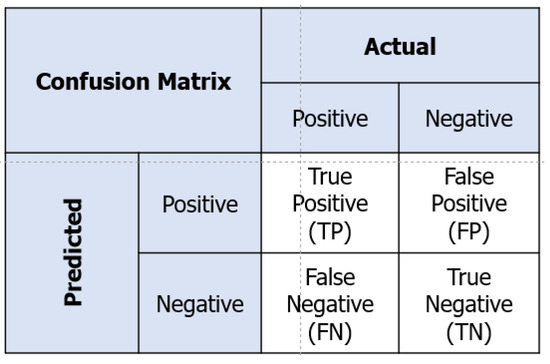
Figure 12.
Confusion matrix.
The matrix provides a direct means of deriving key metrics, such as precision and recall. Precision is a quantitative measure of the accuracy of cargo hold predictions, namely the proportion of predictions that are genuinely true. This value is calculated as shown Equation (3) [22].
The recall value, calculated using Equation (4), measures the proportion that indicates the probability of the model accurately categorizing a picture as a cargo hold when it is actually a cargo hold. The Average Precision (AP) value is calculated by the area under the precision–recall curve that is followed by Equation (5) [22]. The Mean Average Precision (mAP) value is commonly used to quantify the outcomes of multi-category detection [23]. It is calculated as the average of the AP scores identified in Equation (6).
Table 3 presents comprehensive performance outcomes of cargo hold detection when evaluating the model using 90 photos. The results demonstrate that the trained model has effective performance, with an accuracy rate of around 96% for the detection of cargo holds.
Table 3.
Performance of the cargo hold detection model.
2.5. Result and Discussion of a Cargo Hold Detection Model
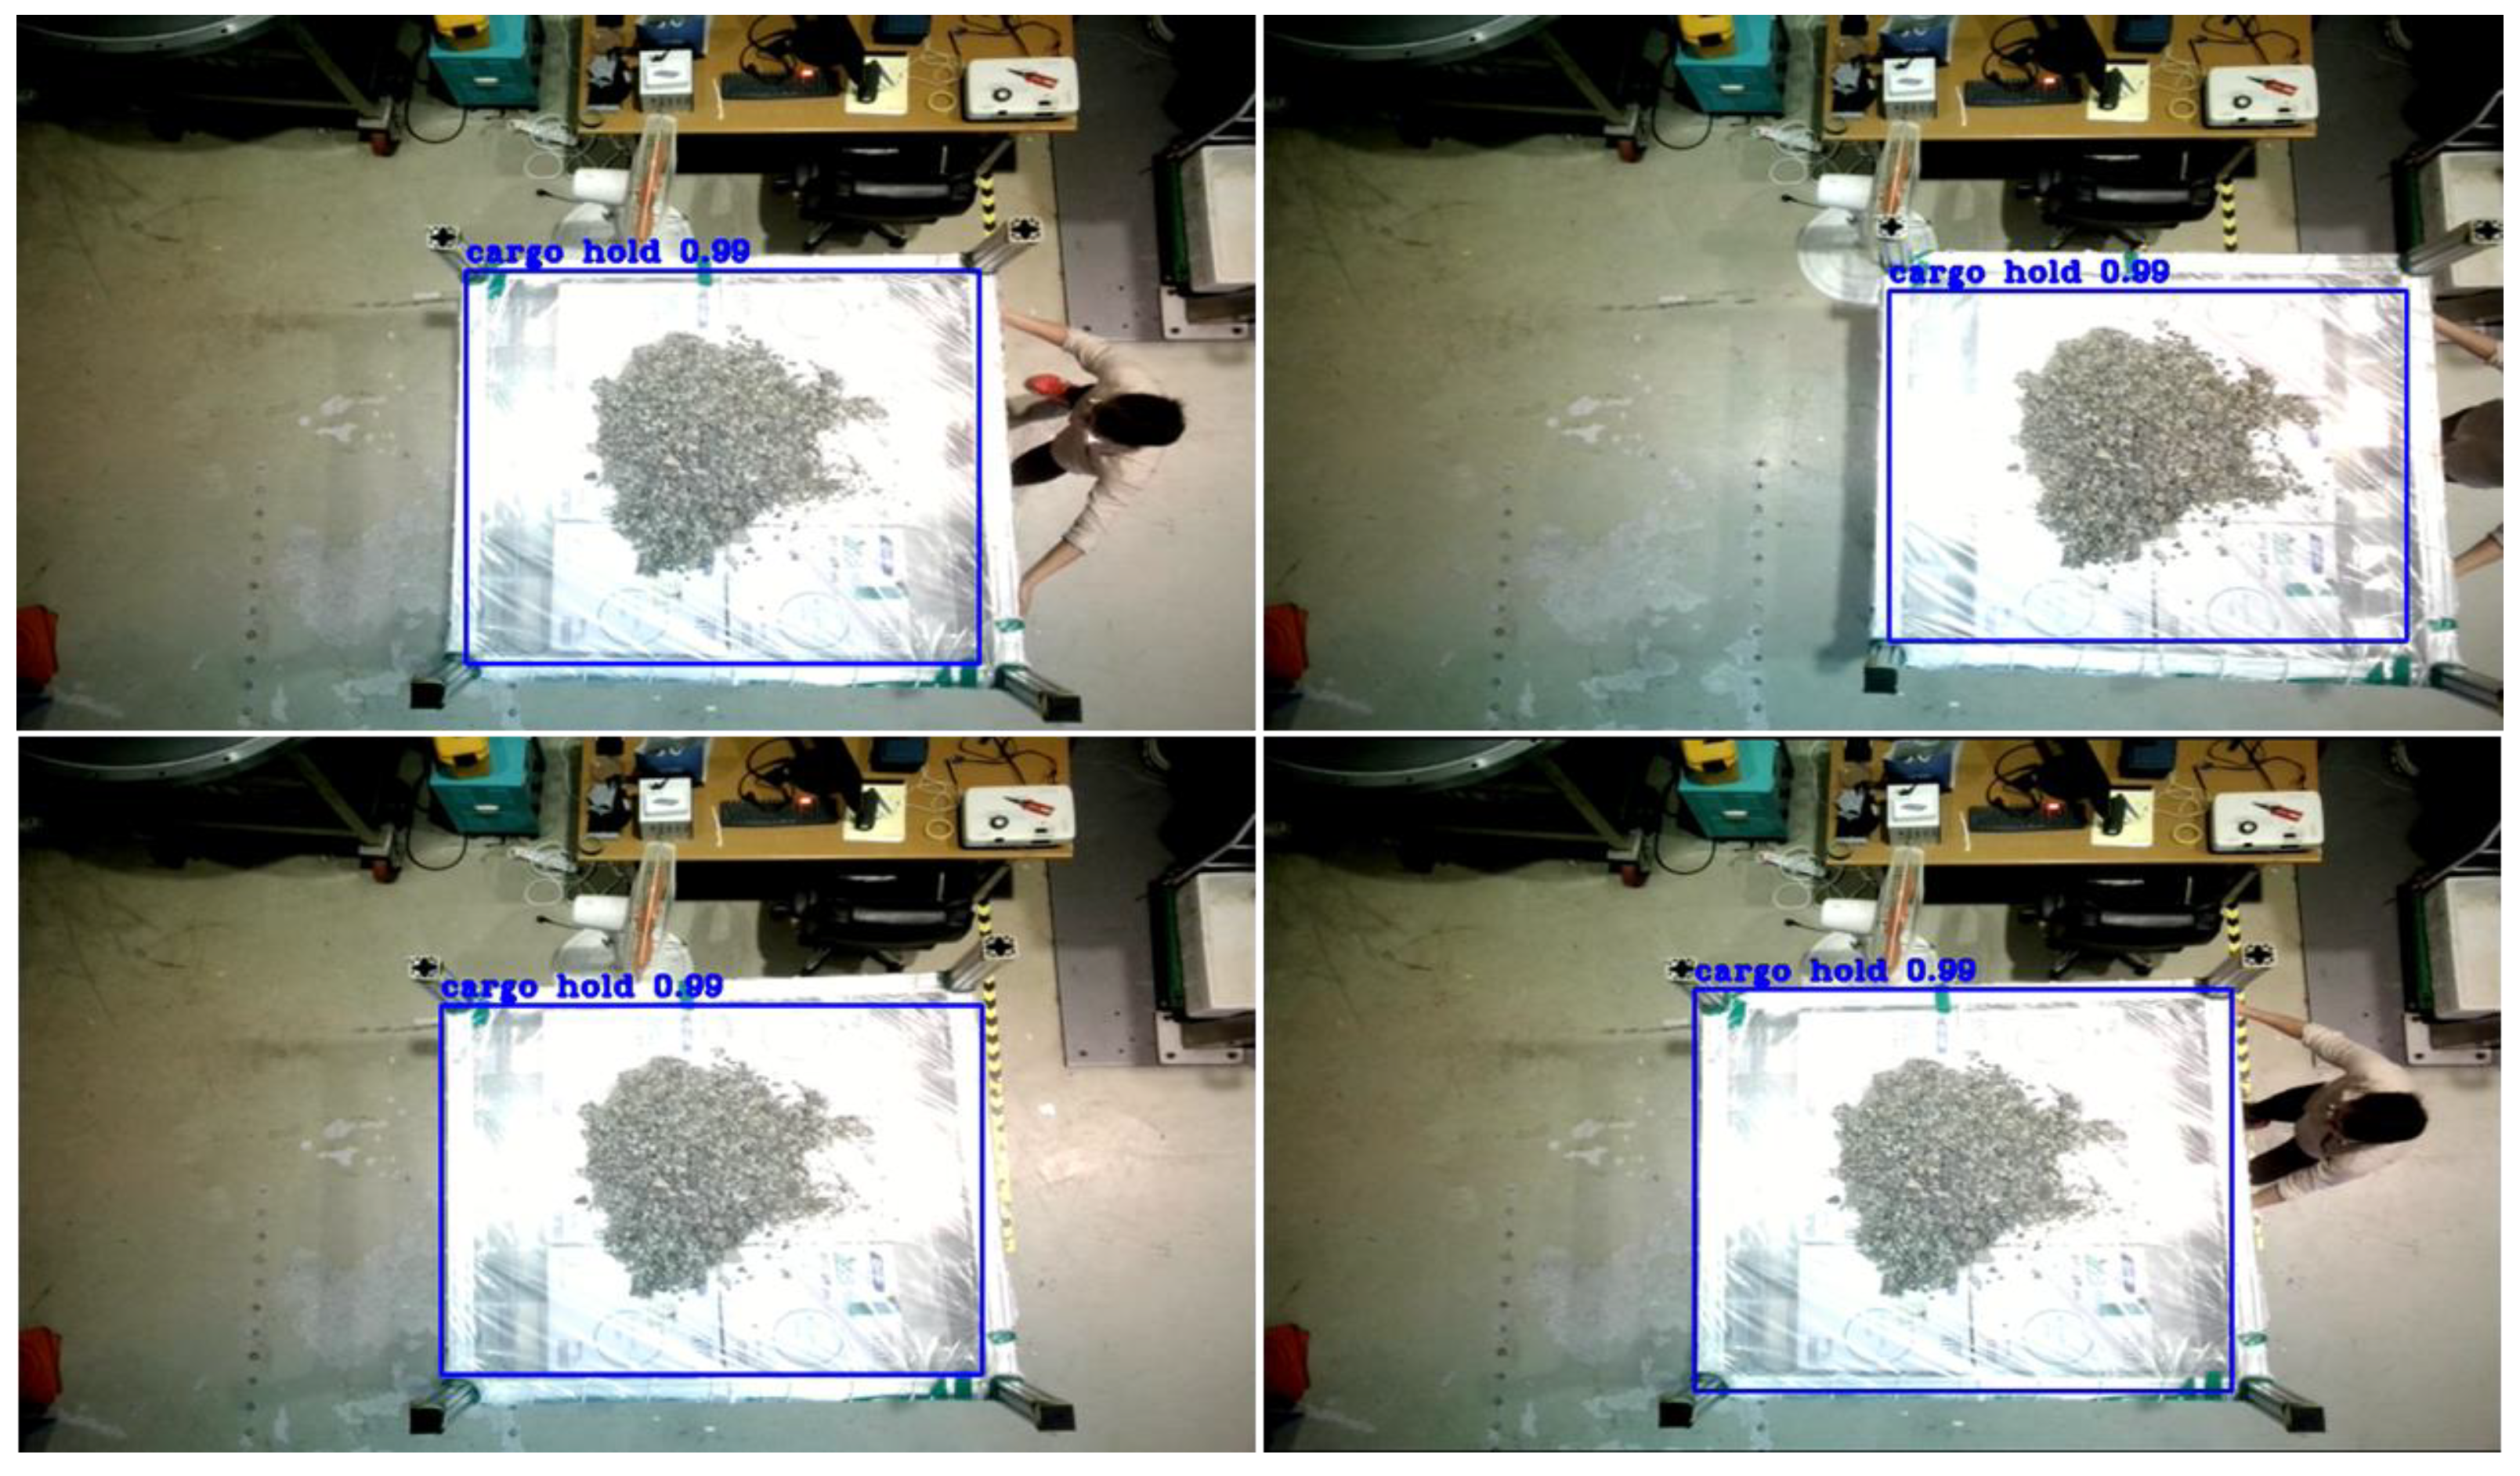
Following the training of the YOLOv3 model, the authors proceeded to utilize the cargo hold picture data for testing purposes. Ultimately, the model was utilized to identify cargo compartments in the laboratory prototype of the vessel. The findings depicted in Figure 13 illustrate the exceptional efficacy of the YOLOv3 model, specifically its capacity to precisely identify cargo holds in real time.
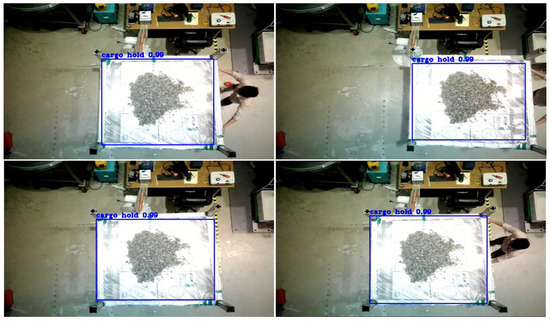
Figure 13.
Results of cargo hold detection for the lab-scale GTSU system.
The authors present a framework for identifying cargo compartments, which is essential for developing a fully automated GTSU system in seaports. After undergoing training and evaluation, the YOLOv3 technique has demonstrated its exceptional ability and superiority in accurately detecting cargo holds in real time. The utilization of the YOLOv3 model assists the authors in precisely determining the location of cargo holds, which facilitates the development of a recognition system for a fully automated GTSU configuration.
3. Design of a Working Point Extraction Model for the Lab-Scale GTSU System
3.1. Analysis and Data Processing of Point Cloud Data
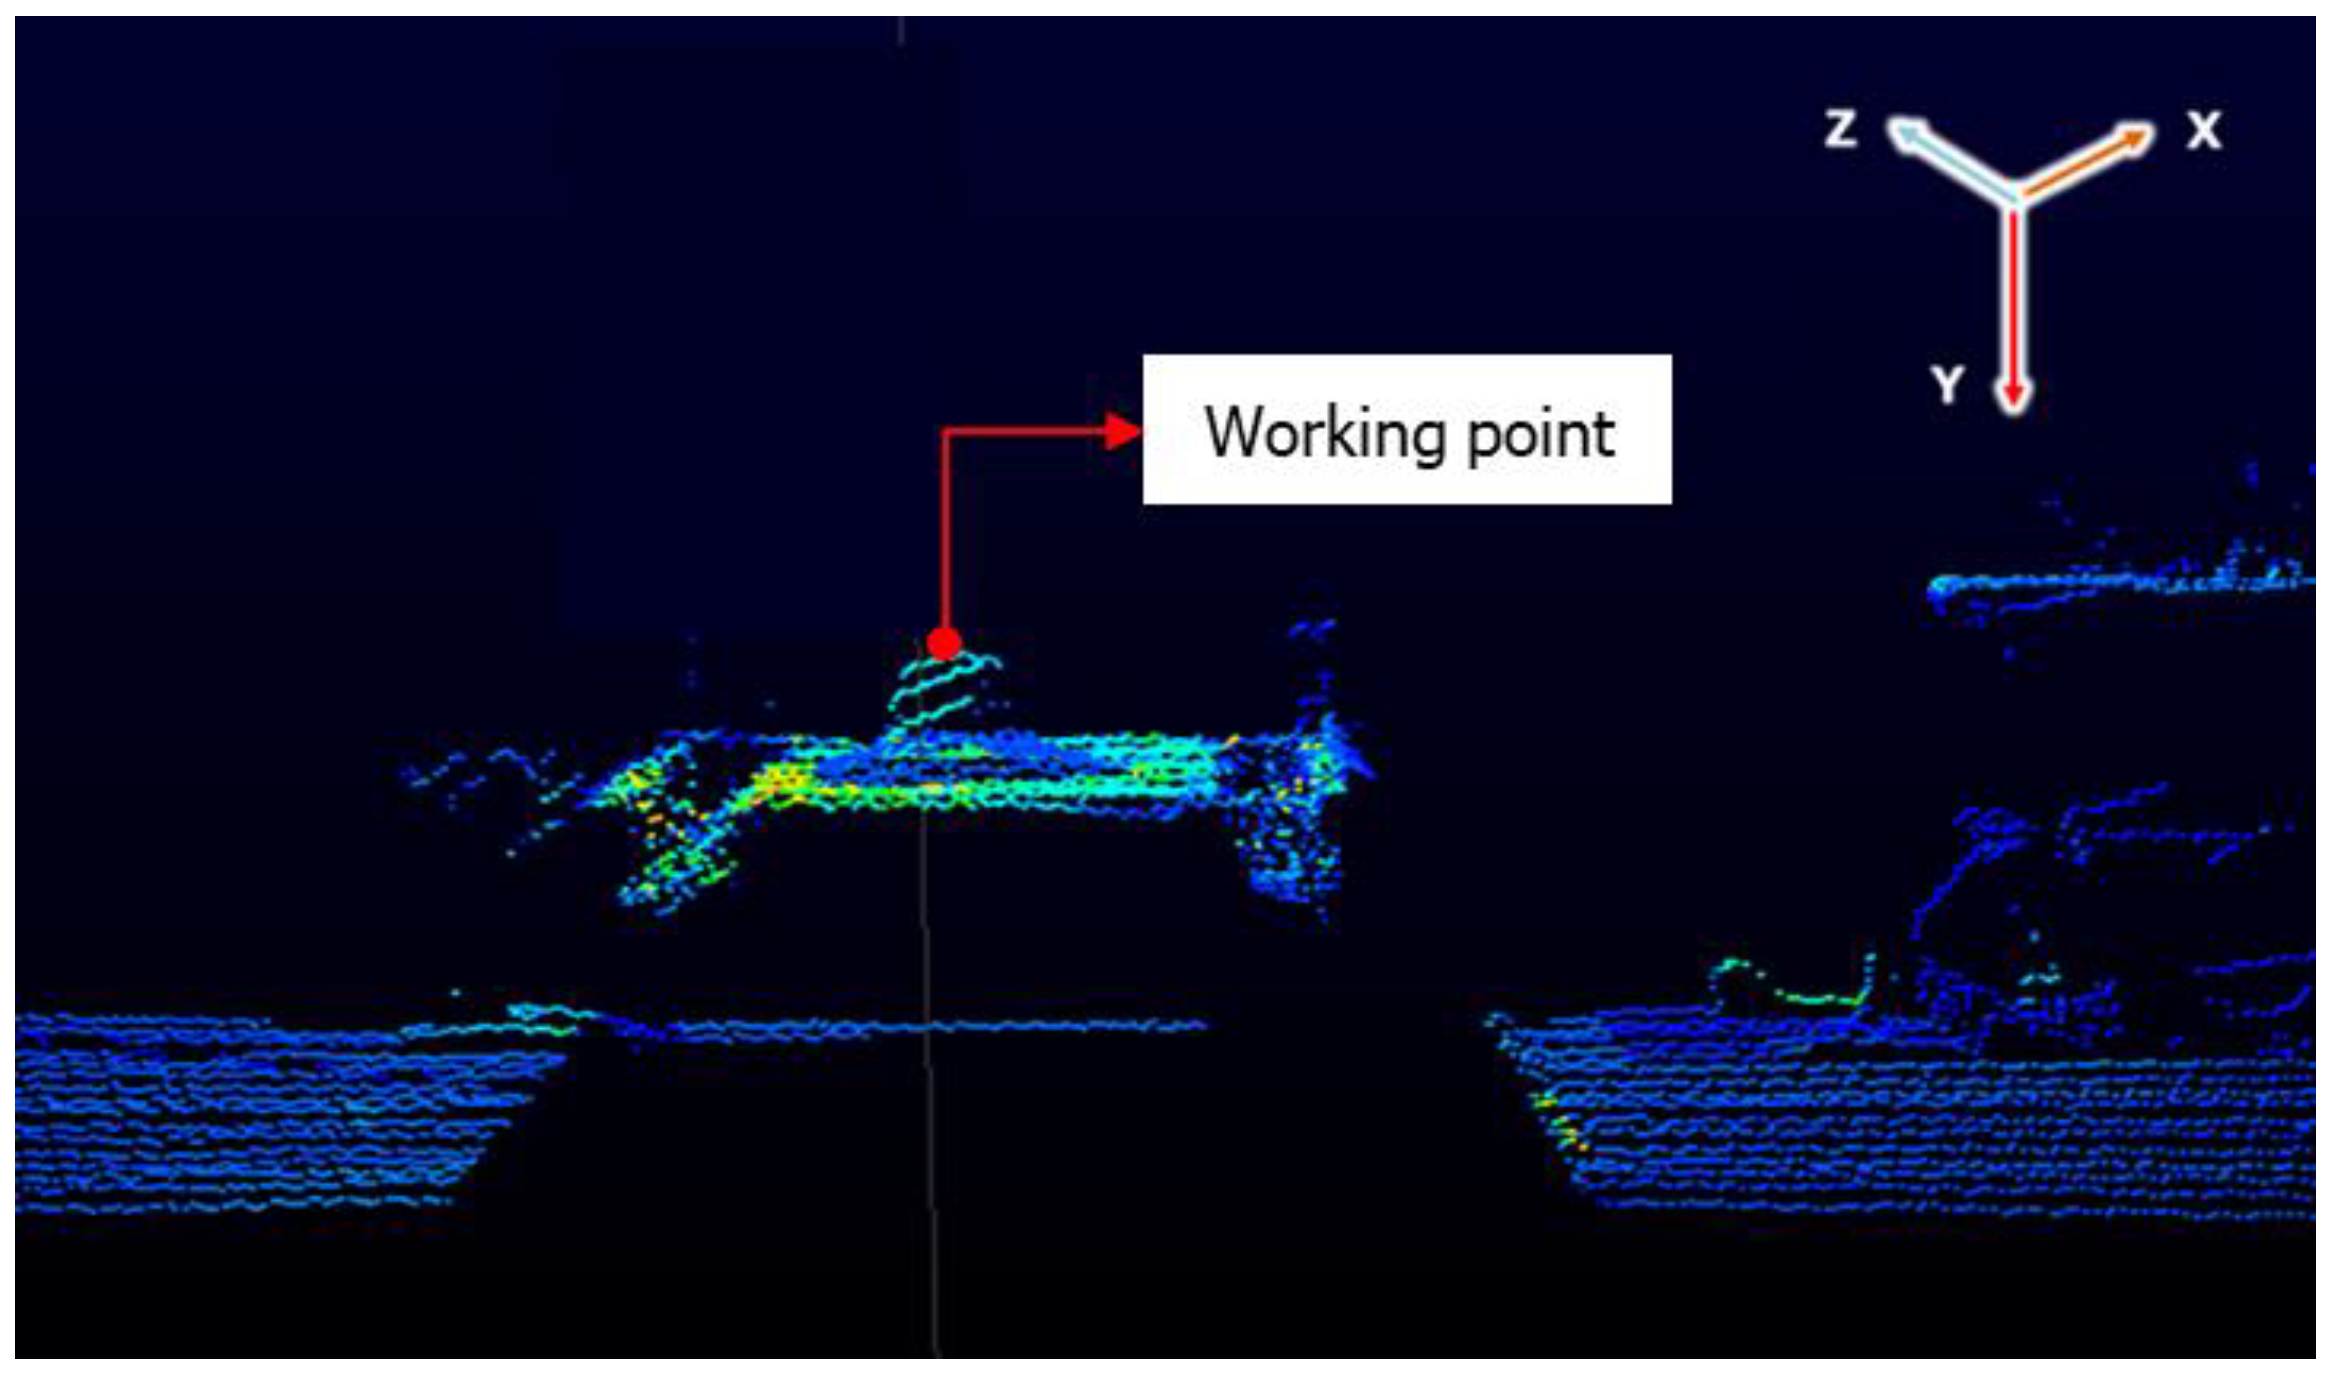
In addition to a cargo hold detection system, the creation of an operational point determination system for an automatic GTSU is a crucial undertaking in contemporary seaport operations. The Programmable Logic Controller (PLC) system calculates and manages the position of the trolley and grab for material loading and unloading. This ensures that the GTSU runs with maximum efficiency and accuracy. The system optimizes efficiency by automating the identification of the working location, reducing human error, accelerating the cargo transfer procedure, and improving overall production. By integrating cutting-edge technology like sensors and AI algorithms, this system can evaluate situations in real time and adapt the operations of the GTSU in dynamic contexts. A well-calibrated working point determination system is crucial for the smooth automation of the complete GTSU operation. Thus, in order to develop a functional point extraction model, the authors employed a LiDAR sensor to perform a scan of the material area. The data obtained from the LiDAR sensor consisted of point clouds, as depicted in Figure 14. A point cloud refers to a set of data points that exist in space. Point clouds are commonly utilized in computer graphics, computer vision, and geospatial sciences [24]. These points generally depict the outer surfaces of things, offering a three-dimensional representation. Point clouds, which are essential for creating digital 3D models of real-world settings or objects, are produced through the use of 3D scanners or photogrammetry tools that analyze aerial photos. Consequently, this can facilitate the provision of information regarding the state of materials in the ship’s hold.

Figure 14.
Point cloud data.
Point cloud processing employs algorithms and software tools to analyze, enhance, and modify these extensive datasets. This processing encompasses various activities, including noise filtration, point cloud alignment, segmentation into distinct categories, and conversion into alternative formats. With the advancement of technology, the processing of point clouds is becoming increasingly efficient, allowing professionals in various industries to utilize detailed geographical data in creative ways. This study involves the collection of point cloud data and their conversion to identify the status of the raw material area. This process aids in the development of a workable point extraction mode for building purposes.
3.2. Design of a Working Point Extraction Model Using the Camera and LiDAR Sensor
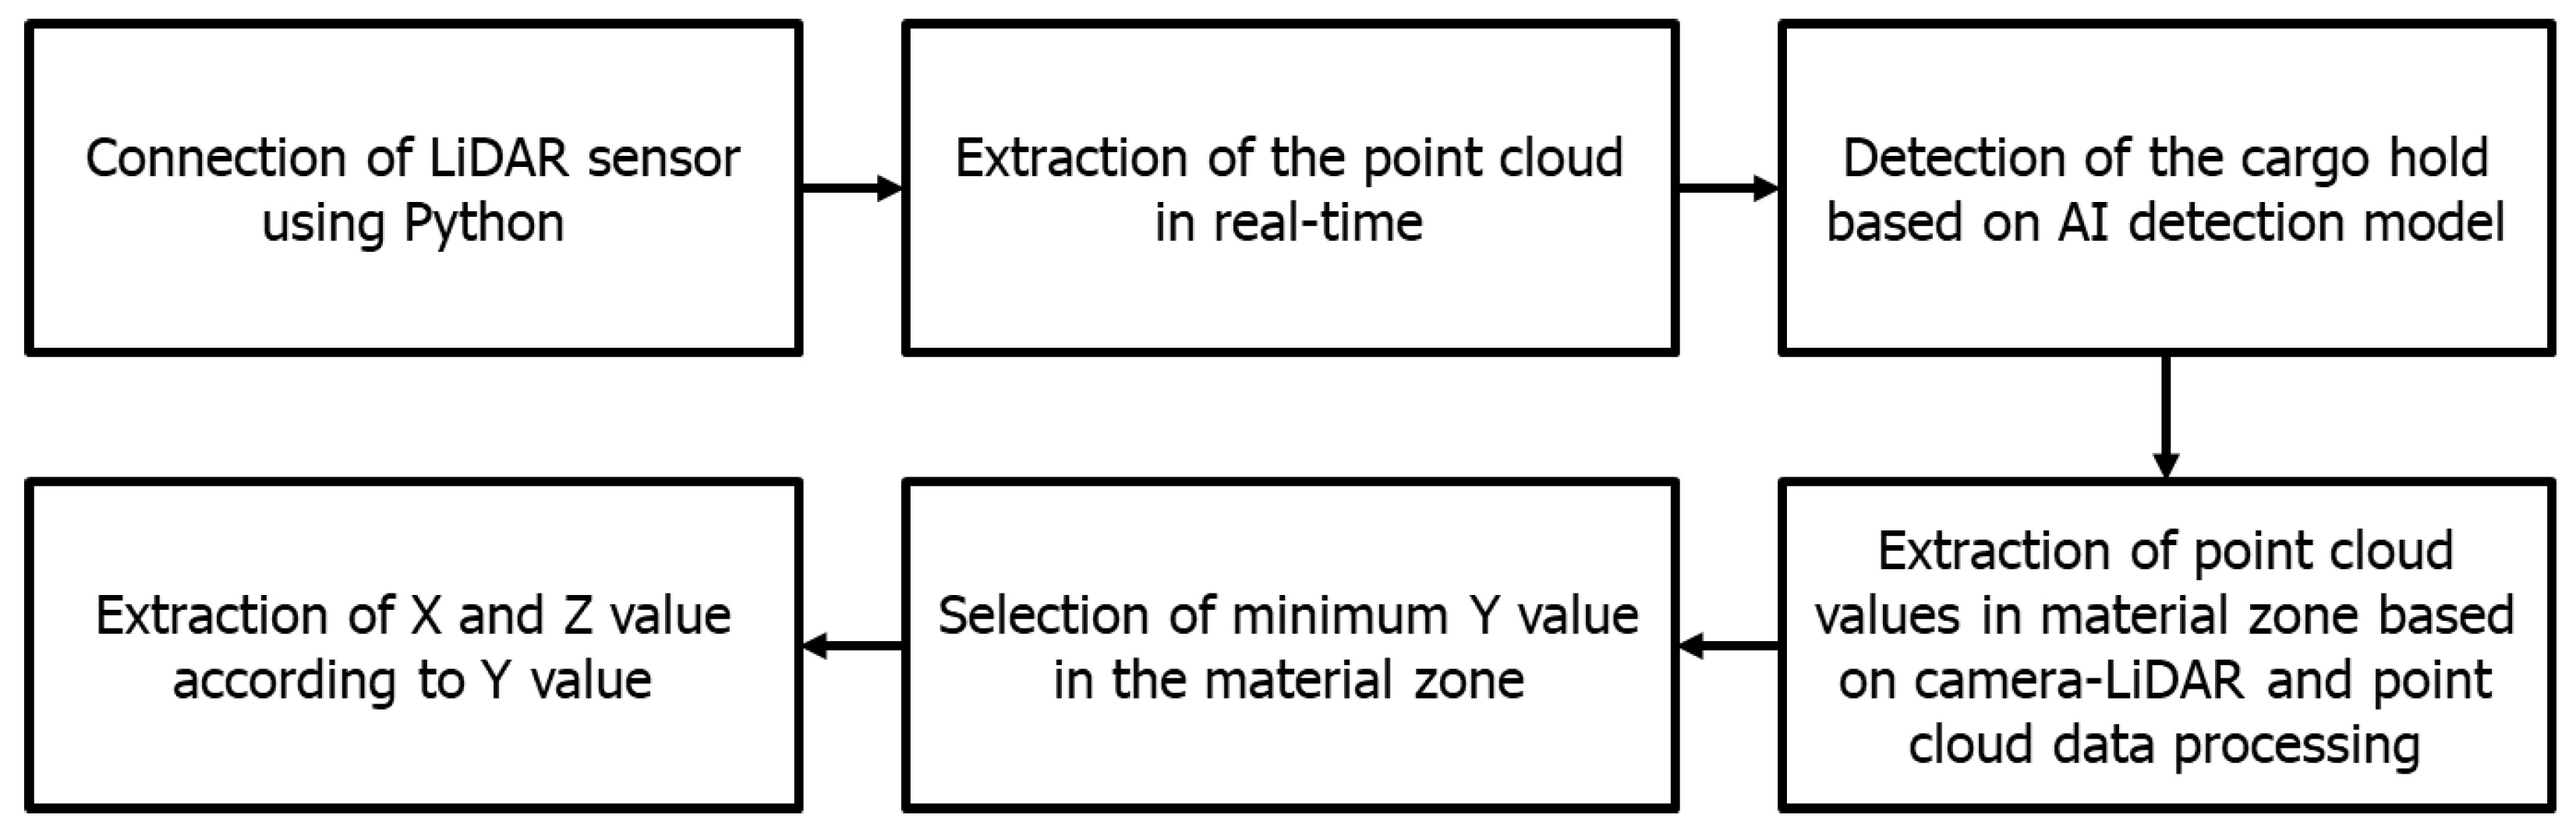
The working point extraction model was created by utilizing the cargo hold detection model, which relies on cameras and point cloud data obtained from LiDAR sensors. Initially, the authors employed Python to decipher the LiDAR sensor, enabling the extraction of point cloud data. By decoding the data, it becomes possible to provide ongoing updates on the condition of materials within the ship’s compartment using real-time point cloud data. After extracting the point cloud data, it is crucial to convert these point picture values into numerical values. Simultaneously, the authors utilized the cargo hold detection model to identify specific regions where materials were located, establishing criteria to isolate point cloud data that contain information about the material zone. The alignment of the LiDAR sensor and the camera is then calibrated. Using this calibration, the authors determine the condition of the material. The working point refers to the nearest point of proximity between the LiDAR sensor and the substance. Figure 15 illustrates the procedure for determining the operating point of the GTSU system.
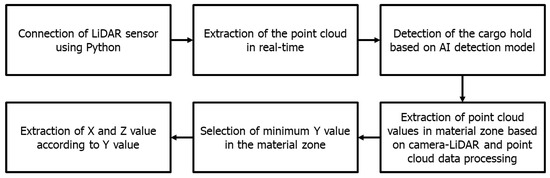
Figure 15.
Process of designing the working point extraction model.
3.3. Results and Discussion of a Working Point Extraction Model
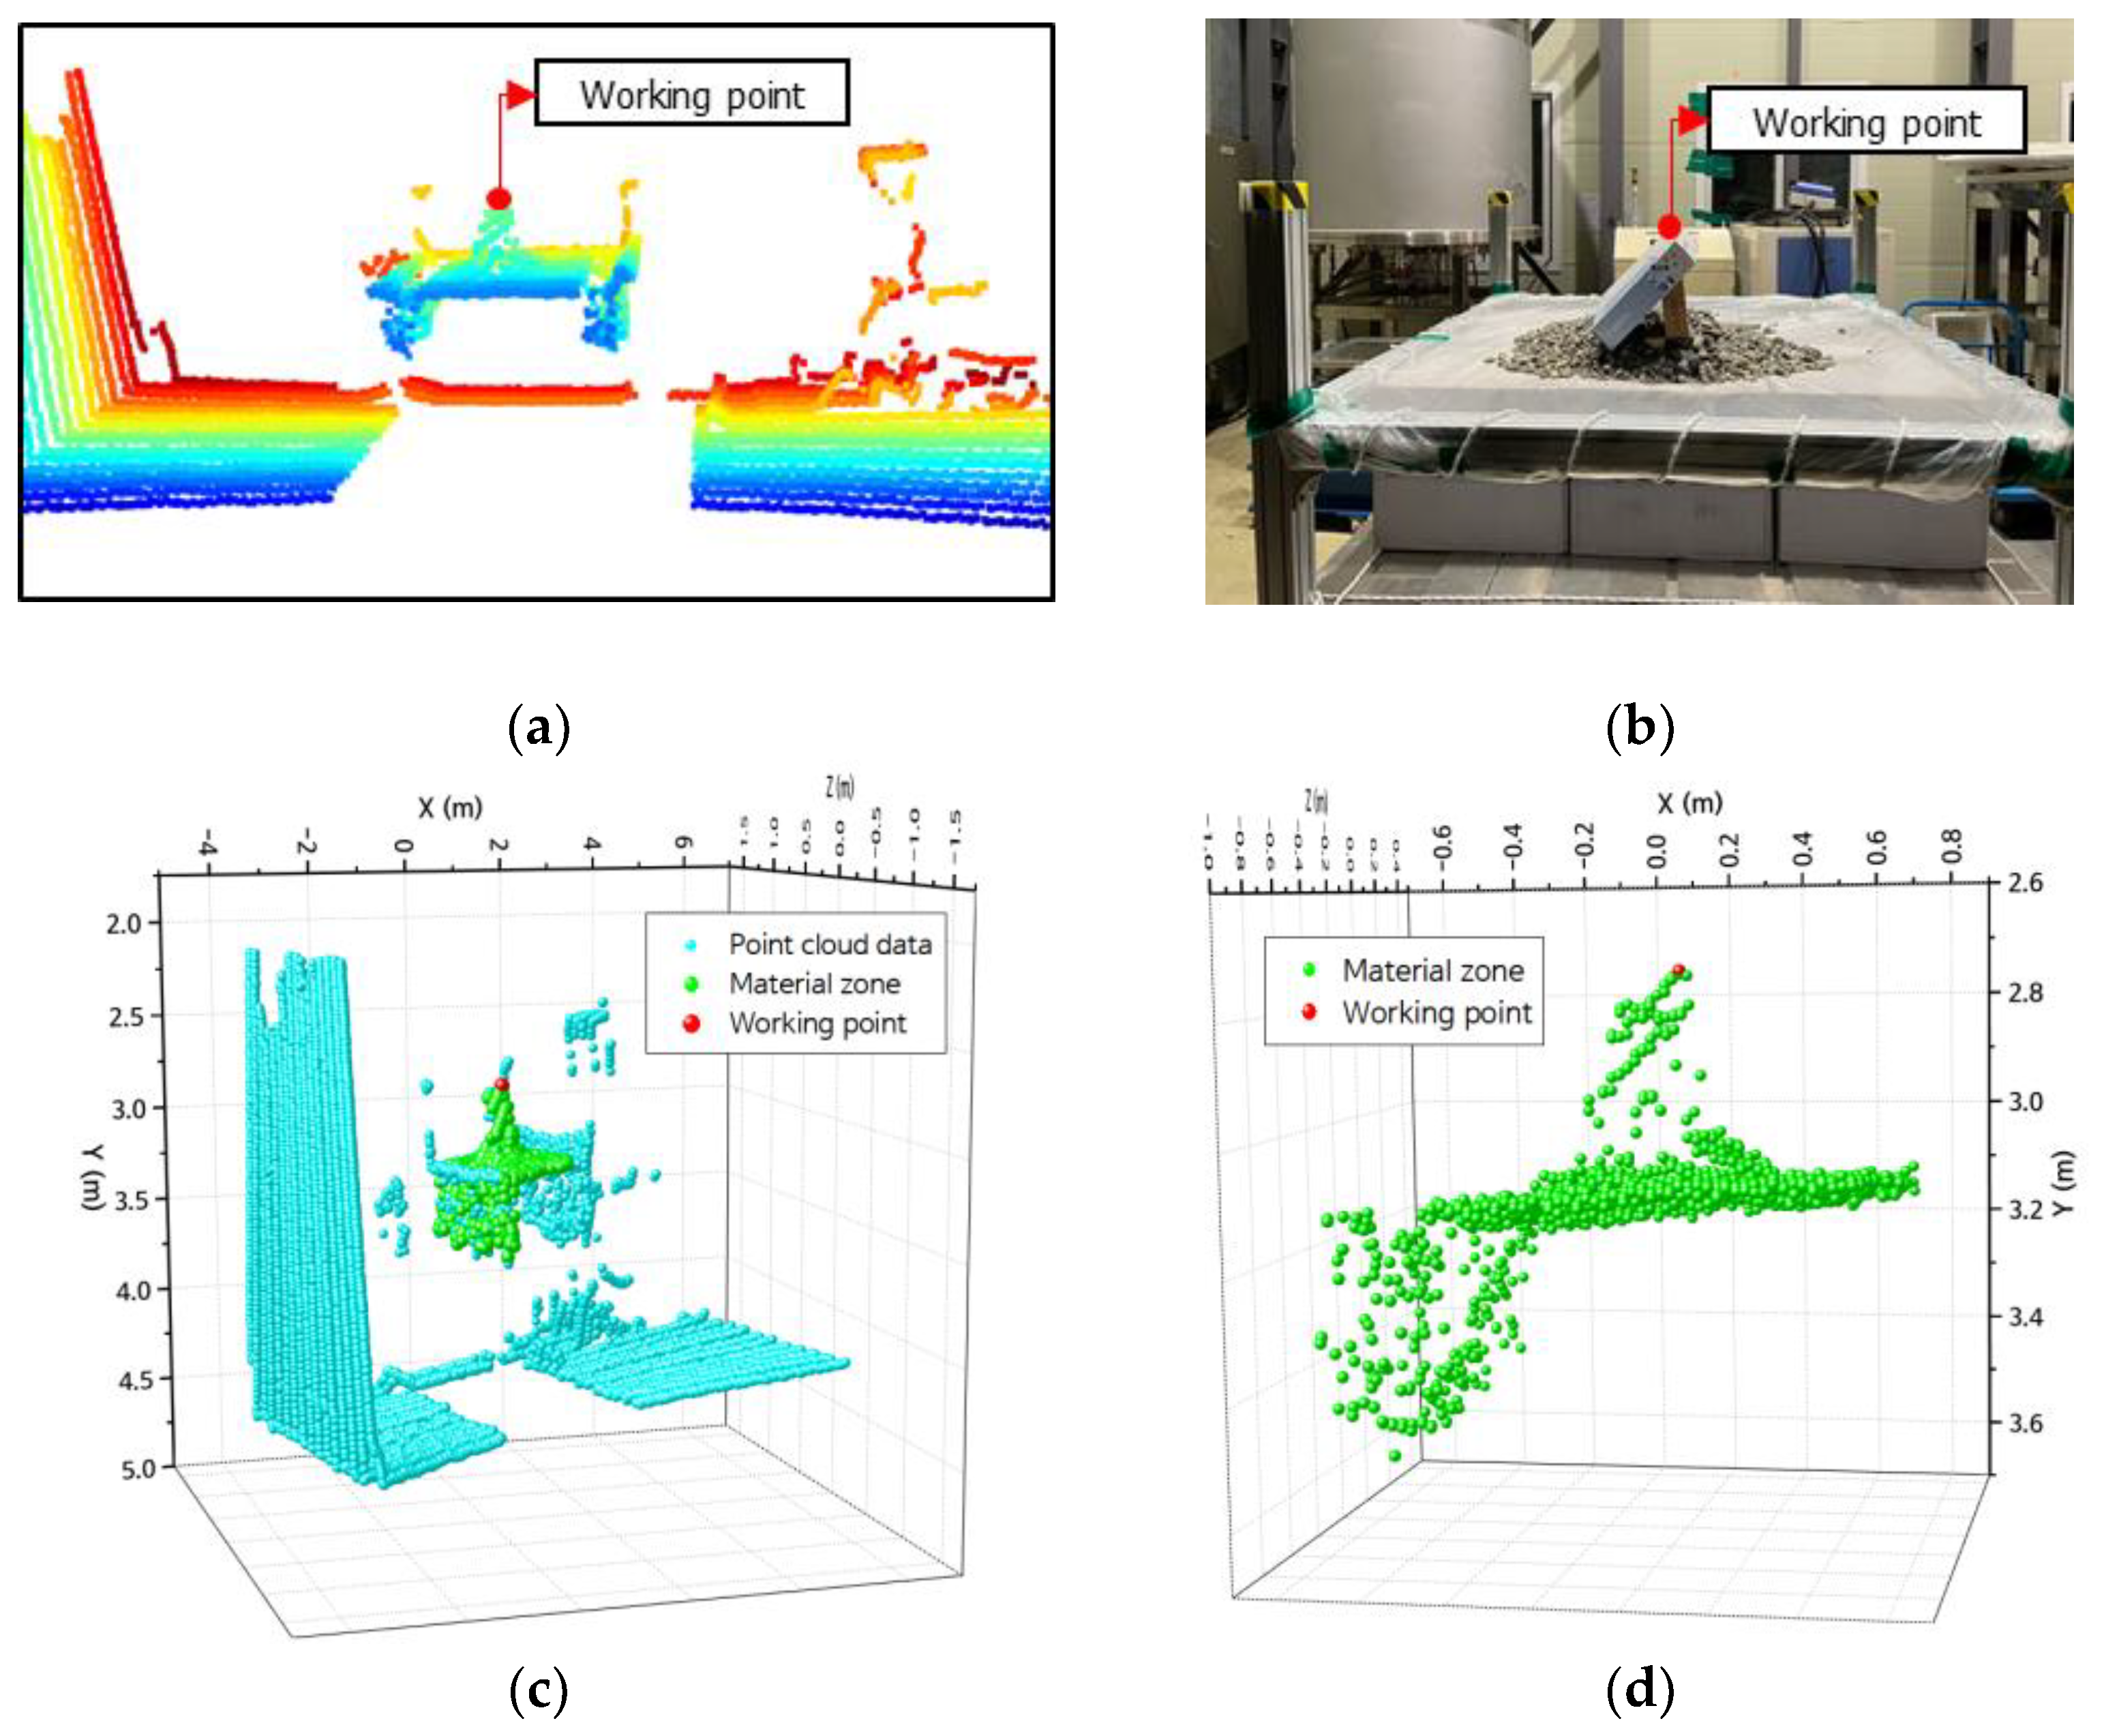
The authors evaluated the working point extraction model on the lab-scale GTSU system. The outcomes indicate that the model adeptly identifies the material area’s coordinate position and the working point, as shown in Figure 16. The LiDAR sensor was used to capture point cloud data, as depicted in Figure 16a. The goal was to ascertain the coordinates of the operational location inside the designated raw material region. Figure 16b presents a two-dimensional graphic that visually represents the material zone in a storage compartment. The image consists of paper boxes and stones placed in a way that simulates the distribution of materials. The designated operational location for the GTSU system is positioned at the highest point of a paper box. After applying the point extraction model, the coordinates of point clouds, material areas, and working points are separated and retrieved, as shown in Figure 16c. Figure 16d presents the coordinate data for the raw material region and working coordinates, which are obtained from the point cloud. The working point coordinate is the red point. Table 4 displays the coordinates of the working point obtained from the model, which were compared with measurements taken using a ruler. The error of this model is about 5–10% when compared with manual measurements.

Figure 16.
Results of extracting the coordinates of working points: (a) point cloud data; (b) image of the cargo hold and material; (c) coordinates of point cloud data, material zones, and the working point; (d) coordinates of the material zones and working point.
Table 4.
The coordinate of the working point.
In addition, experiments were conducted to assess the model’s effectiveness in determining operational conditions for the GTSU system when the cargo hold shifts due to underwater currents, changes in cargo load, or other external variables, as depicted in Figure 17. The results indicate that the model is capable of accurately determining the working point, even in cases where the cargo compartment is displaced from its original position.
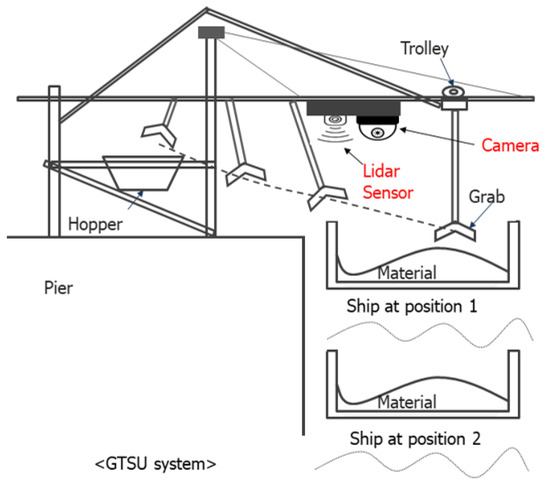
Figure 17.
Configuration of the automatic GTSU system.
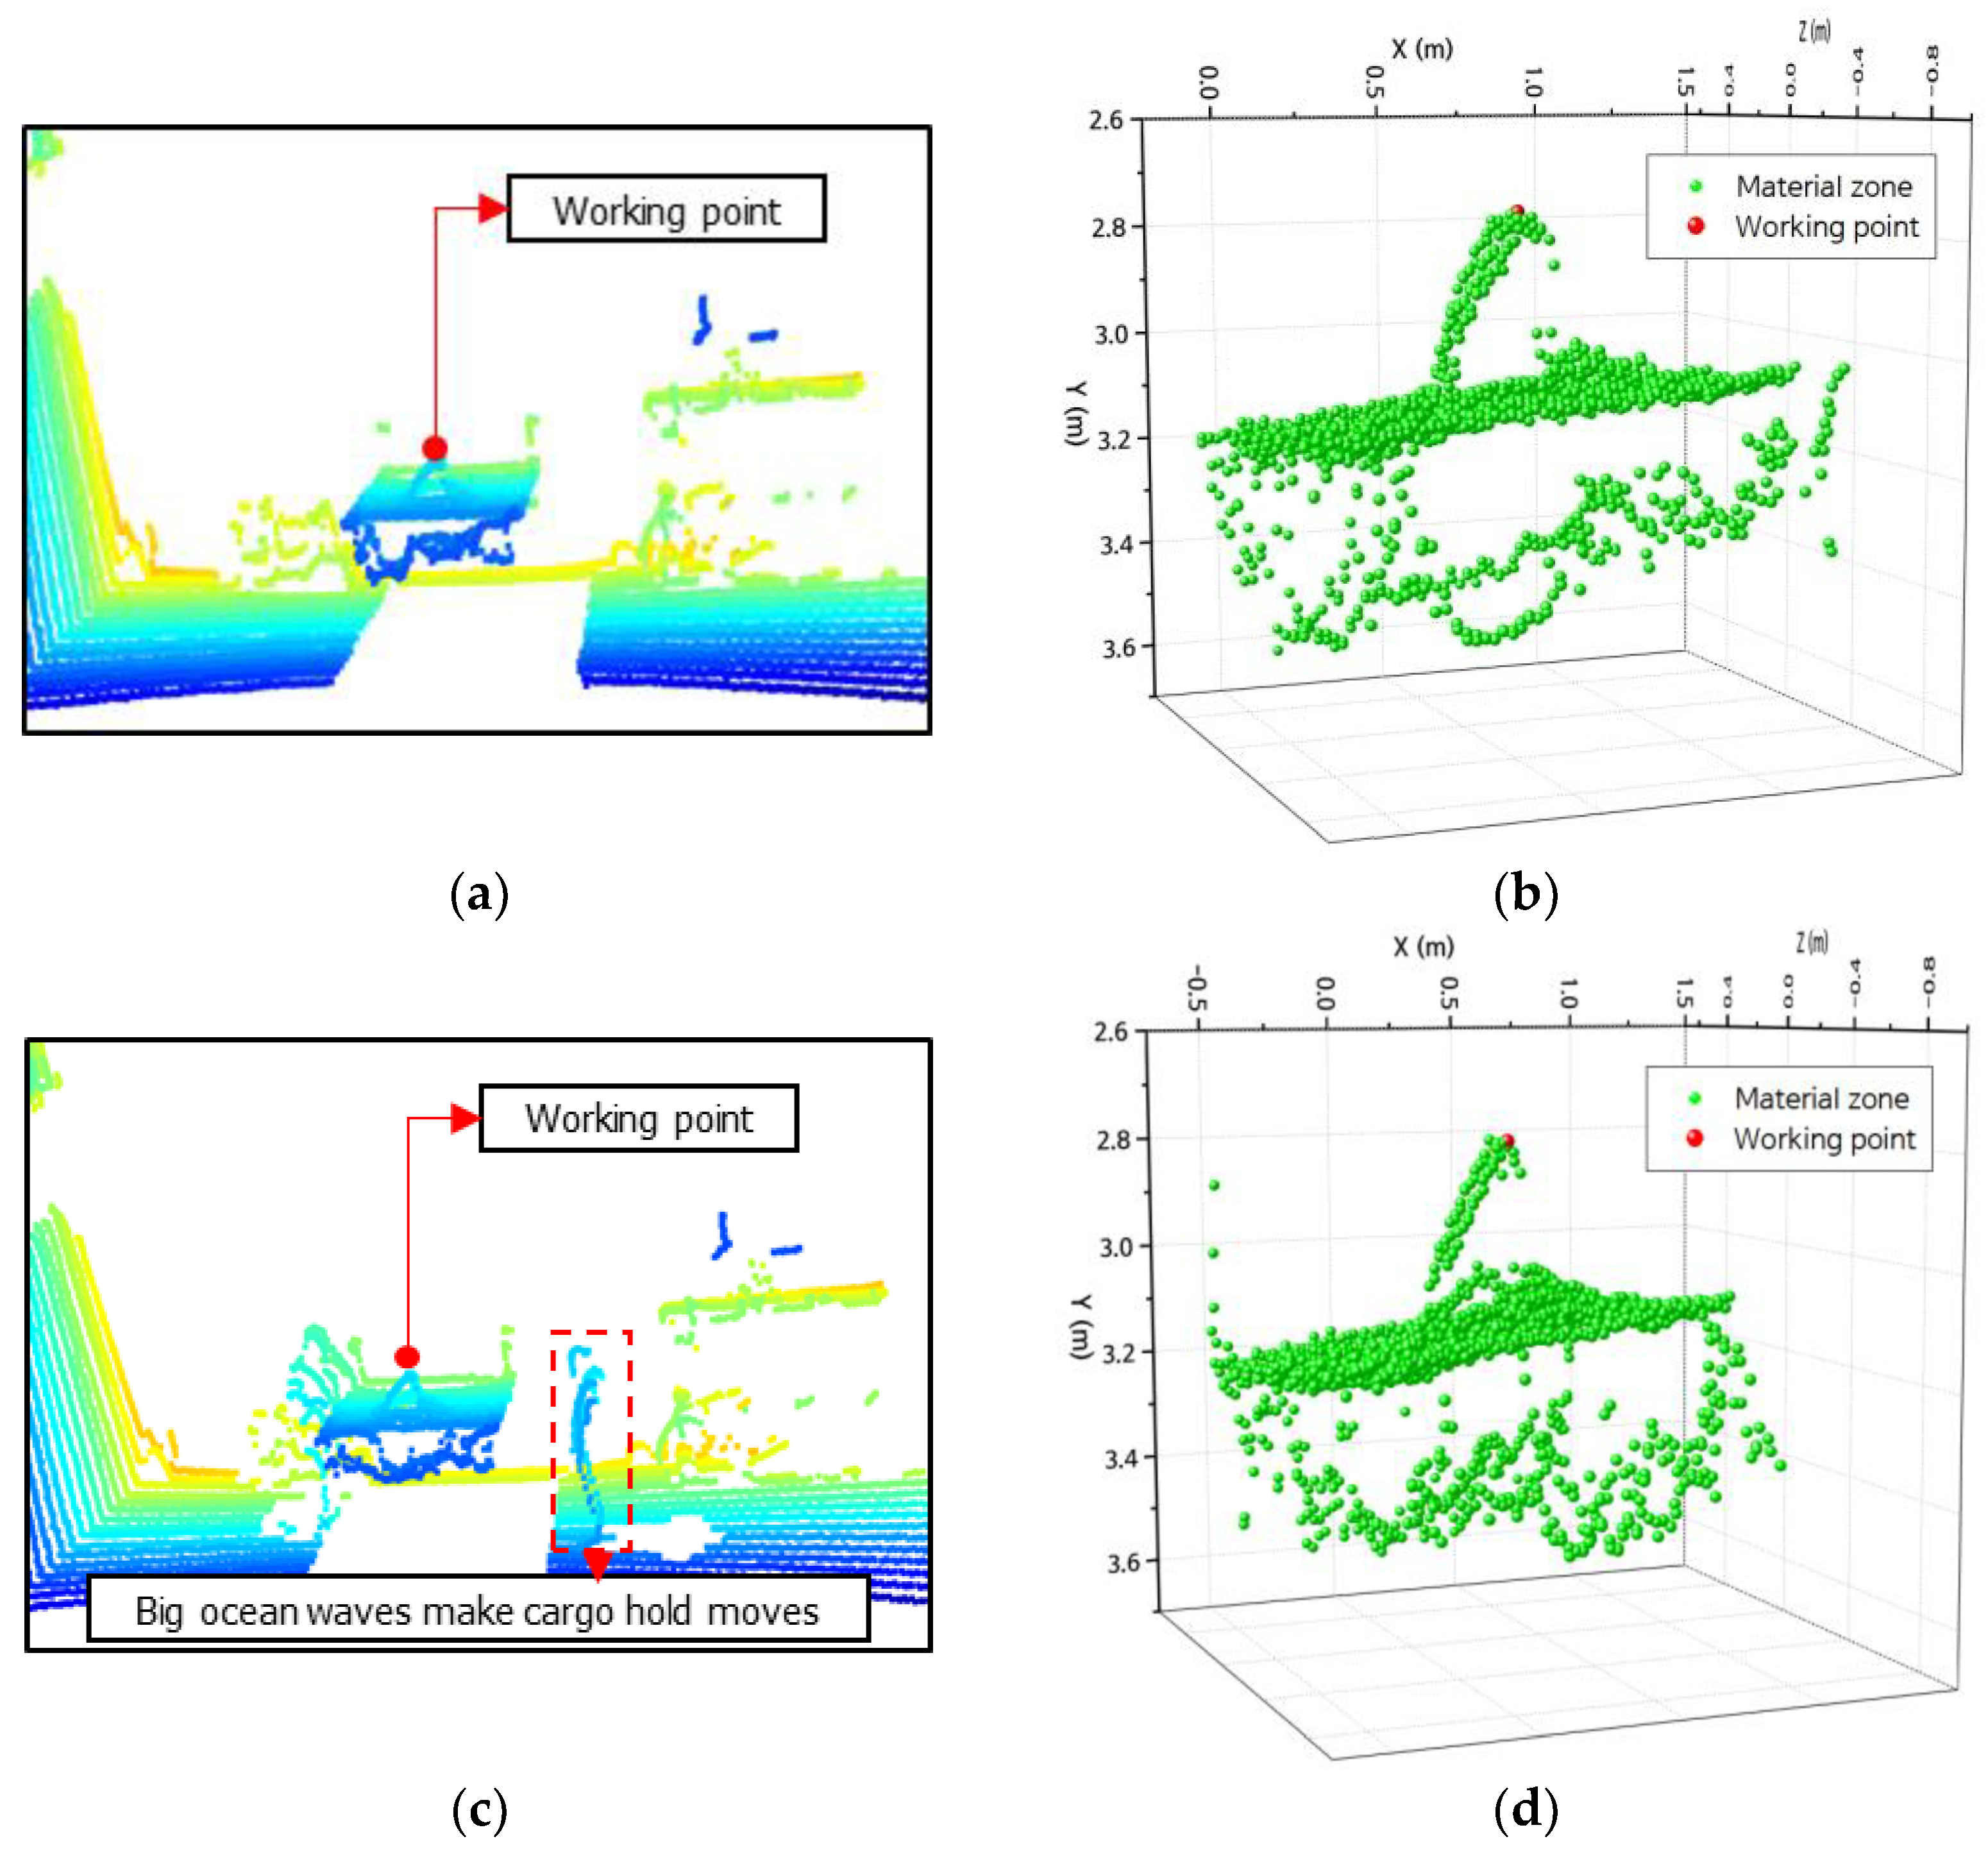
Figure 18 displays the extracted working point coordinates after shifting the lab-scale cargo hold from its initial position. Figure 18a,b present the point cloud data of the cargo hold at the starting position and the coordinates of the working point and material area, respectively. Nevertheless, in practical scenarios, the location of the cargo hold can be altered by substantial oceanic waves. The authors relocated the lab-scale cargo hold model to a different position, as shown by the data point cloud in Figure 18c. Once the products have been relocated, the point extraction model may still accurately determine the coordinates of the working point and the material area, as depicted in Figure 18d. The information about the x, y, and z coordinate values of the working point was extracted at the old position of the cargo hold and the new position of the cargo hold due to the impact of environmental factors, as described in Table 5.
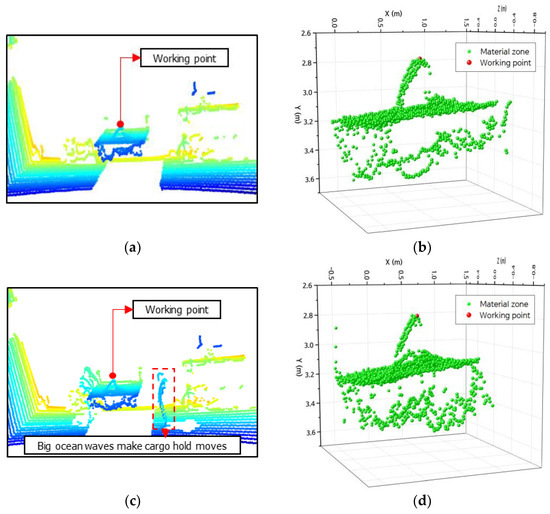
Figure 18.
Results of extracting the coordinate of the working point: (a) point cloud data at the old position; (b) the coordinates of materials and the working point at the old position; (c) point cloud data for the new position; (d) coordinates of material zones and the working point for the new position.
Table 5.
The coordinate of the working point when the cargo hold moves.
Compared to iSAM’s system [25], our system leverages AI and combines the camera and LiDAR sensor to determine the operating area. This enables an automated operational solution through intelligent learning. Similarly, Tessa V van Kol et al. provide information about an intelligent grabbing system that refers to the system of Bewley et al. [26,27]. Their system is used to calculate the load volume in the bucket using point cloud data and the iterative closest point algorithm. It is important to note that this system is designed for open shell buckets, catering to mining operations at mines. The design of open shell buckets differs from that of grabs with a closed opening and closing mechanism in the GTSU system. Therefore, the effectiveness of their method has not been confirmed for the GTSU system. In another piece of research, M. Javad Mohajeri et al. proposed a study titled ‘A Validated Co-simulation of Grab and Moist Iron Ore Cargo: Replicating the Cohesive and Stress-history Dependent Behavior of Bulk Solids’ [28]. In their study, the researchers utilized point cloud data to capture the surface of bulk material, employing the Screened Poisson Surface Reconstruction method developed by Michael Kazhdan et al. [29]. However, their method faces challenges in choosing the optimal screening threshold, which involves a trade-off between fidelity and noise reduction. It is also sensitive to the quality of input, necessitating preprocessing, and involves expensive computations, especially when dealing with large point cloud datasets.
In the authors’ system, the AI solution self-identifies and provides information about working coordinates for grabs equipped with opening and closing mechanisms to load and unload goods based on material density in ship compartments. Additionally, the system continuously monitors the ship’s compartment position, offering information about material coordinates even if the ship’s compartment is moved from its original position. Therefore, the working point extraction model was implemented to automate the determination of working point coordinates within the cargo hold, streamlining the material loading and unloading processes for the automatic GTSU system.
4. Design of an Anti-Collision Notification Model for the Lab-Scale GTSU System
4.1. Collection and Data Processing of the Cargo Hold and the Grab Image
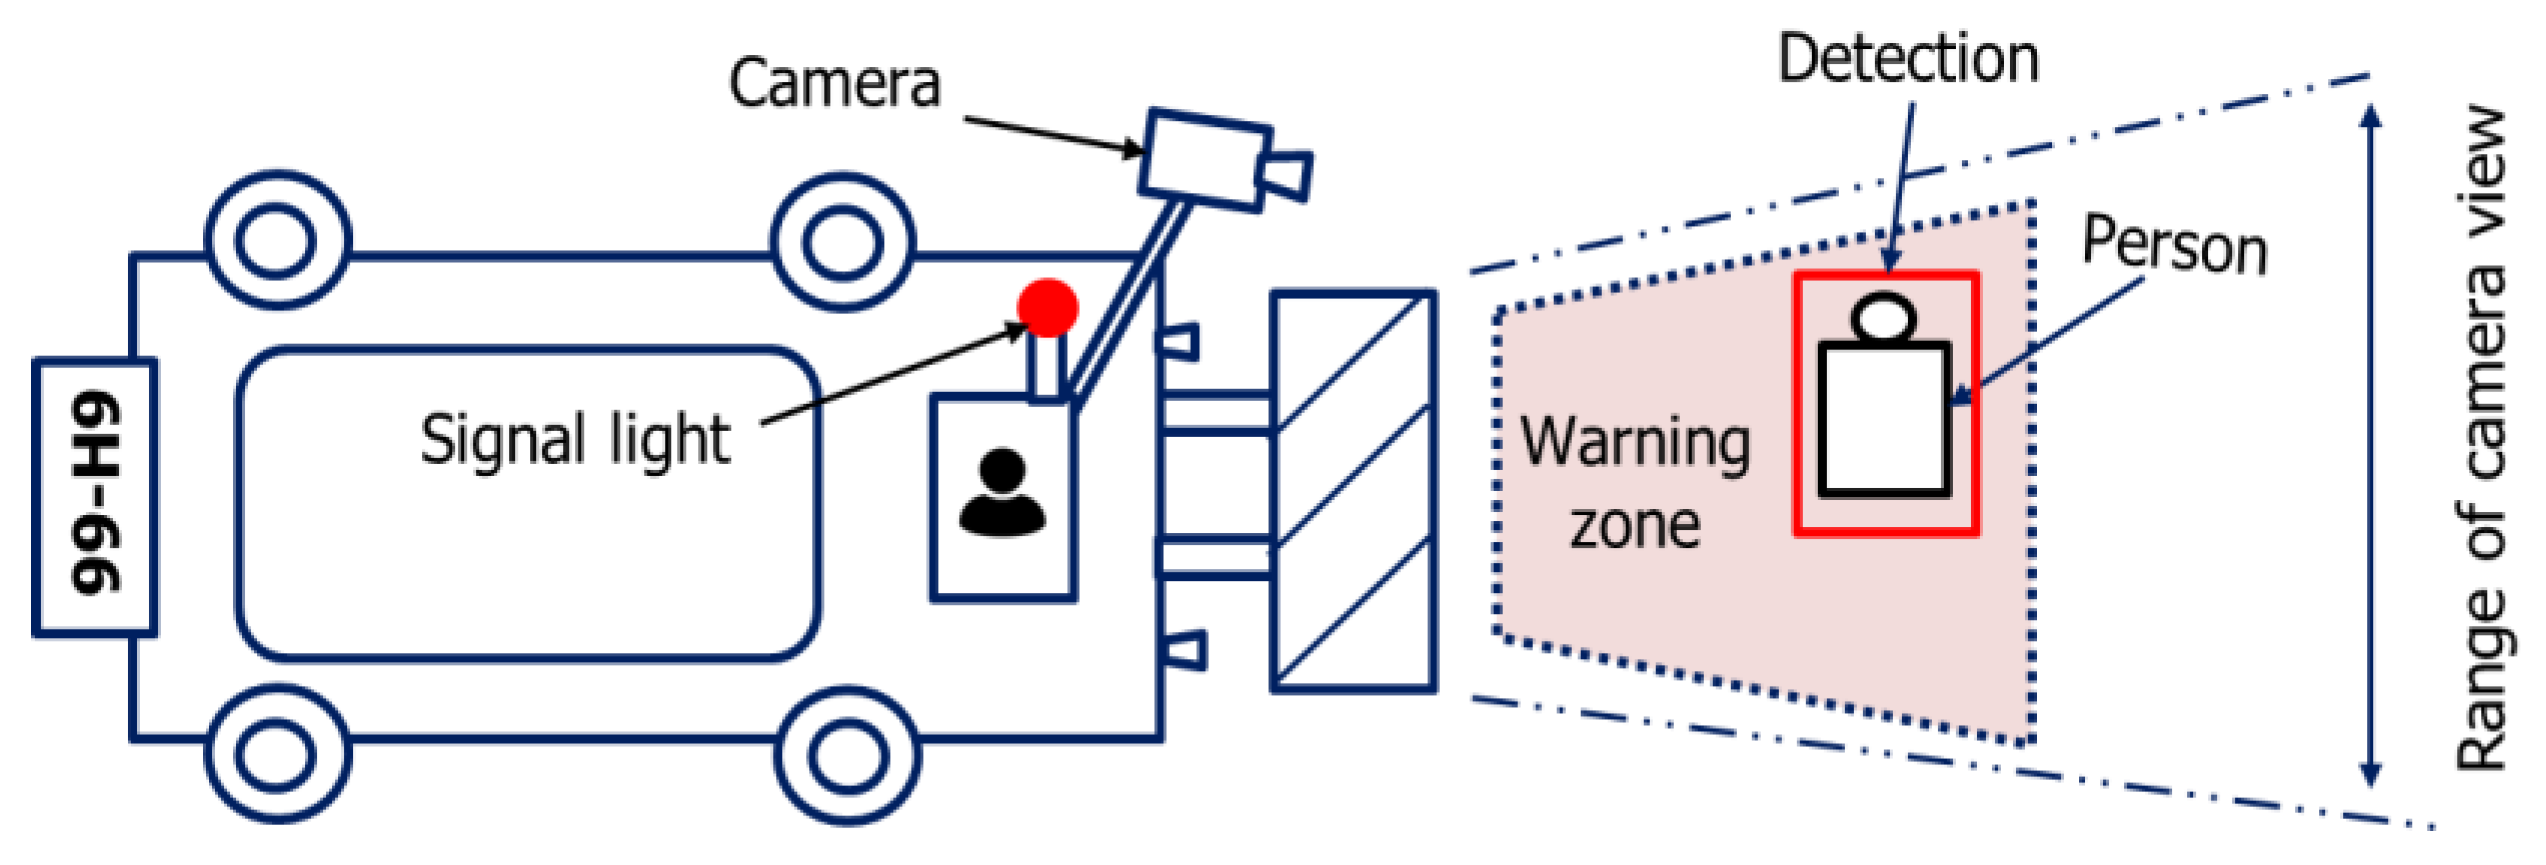
Camera-based anti-collision systems represent a notable advancement in enhancing safety and operational effectiveness in several industries. The technology employs sophisticated image processing algorithms to promptly identify potential obstructions or risks, enabling fast actions to avert accidents. Especially in the automotive and industrial fields, these camera-based systems are included to continuously observe the environment and offer immediate input to operators or autonomous systems. By utilizing sophisticated analytics, the system can differentiate between stationary and moving objects and adapt its response accordingly. The ongoing technological advancements are anticipated to significantly improve the accuracy, velocity, and dependability of camera-based anti-collision systems. This will result in a safer environment in various settings, including industrial and everyday situations. Figure 19 illustrates a forklift anti-collision system that utilizes camera technology. The system will provide a warning if it detects a potential collision between the forklift and an object by creating a designated warning zone and utilizing camera technology to identify objects.
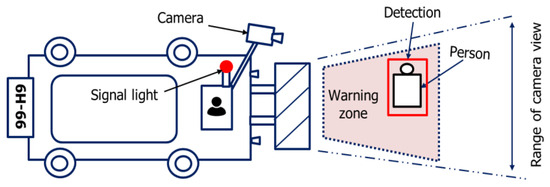
Figure 19.
Anti-collision system of a forklift based on a camera.
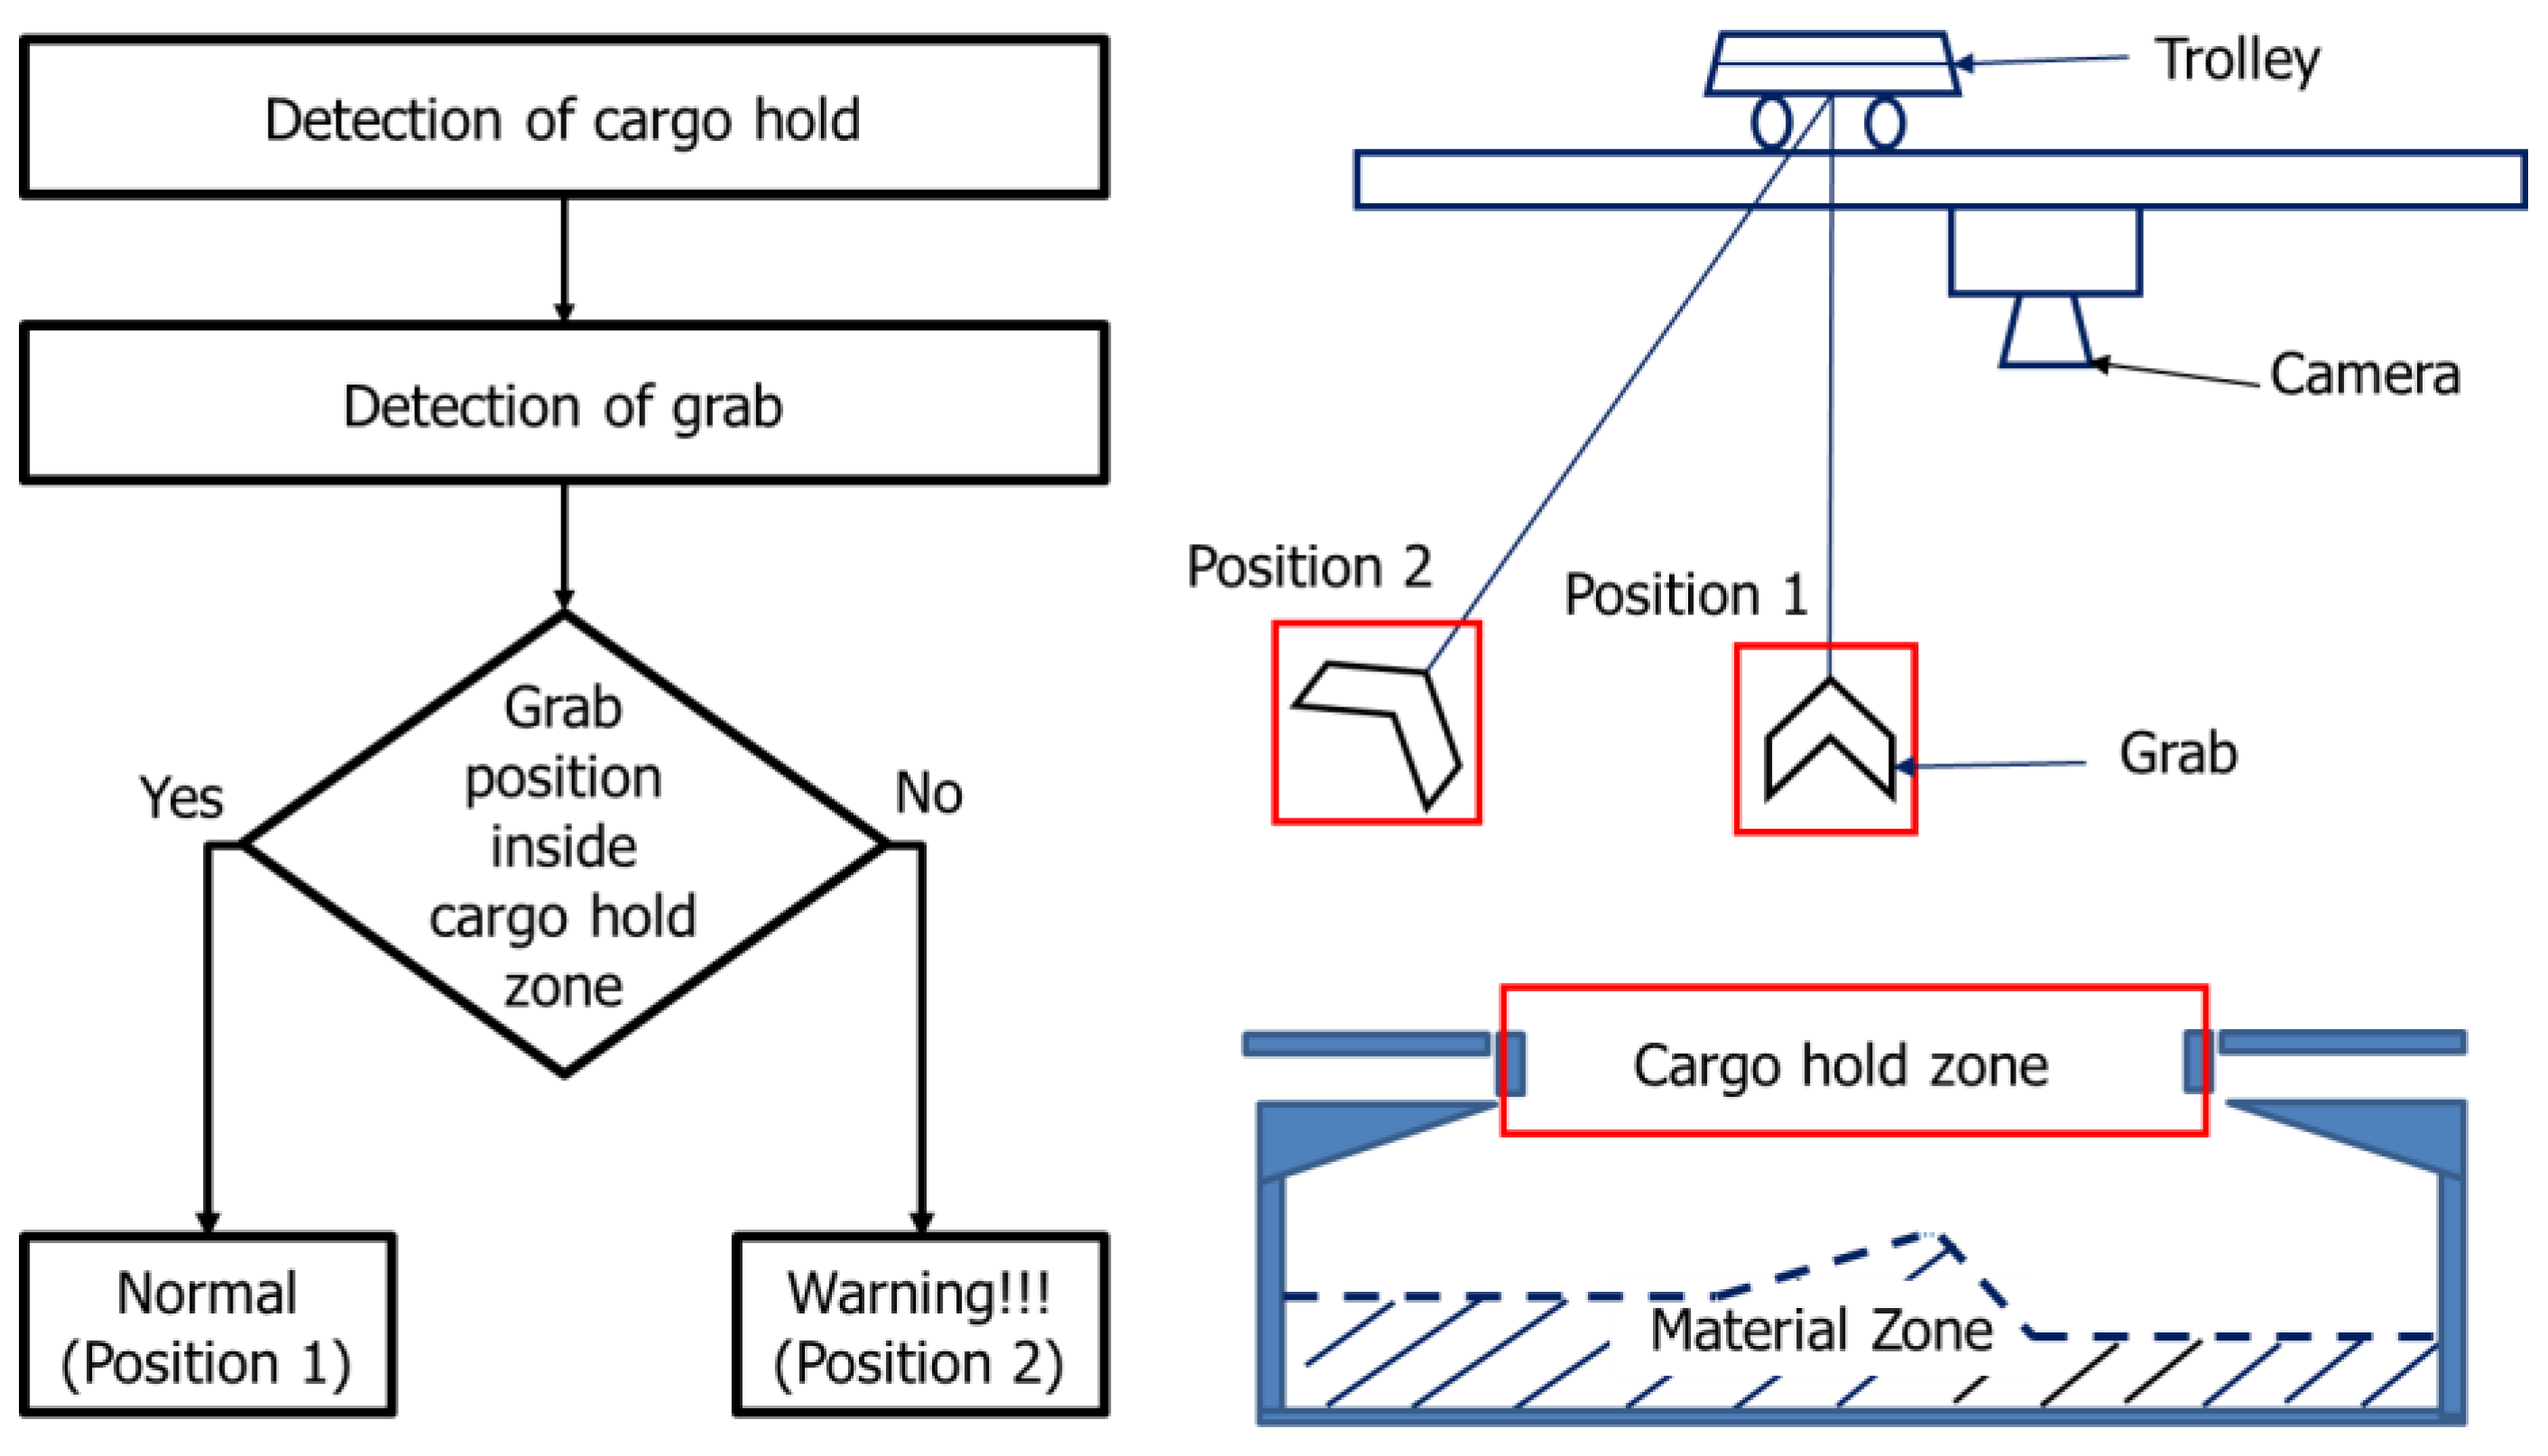
As seaports witness a rise in cargo activity, it becomes crucial to prioritize the safety of equipment, cargo, and workers. The GTSU system, which is accountable for the effective transportation of materials, needs to function flawlessly in the face of numerous potential hindrances and difficulties. A reliable collision avoidance system guarantees that the GTSU can carry out its duties without any harm or interruptions. The GTSU is equipped with real-time spatial awareness technology, which allows it to navigate complicated surroundings. This technology reduces downtime and greatly minimizes the chance of costly equipment damage or safety accidents. This proactive strategy not only protects assets, but also enhances operational efficiency and dependability. Hence, the incorporation of an anti-collision system is crucial in the advancement of an automated GTSU system. Figure 20 depicts the design idea of a collision avoidance system for the GTSU system, which is designed to prevent collisions between the grab and the cargo hold by utilizing camera technology. This concept proposes the utilization of cameras to detect both the grab location and the storage area for goods. Upon detecting a certain situation, conditions and warning zones are formed to proactively anticipate probable crashes.
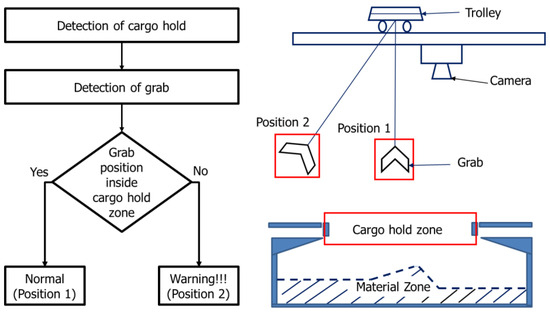
Figure 20.
Idea of designing an anti-collision system for the GTSU system.
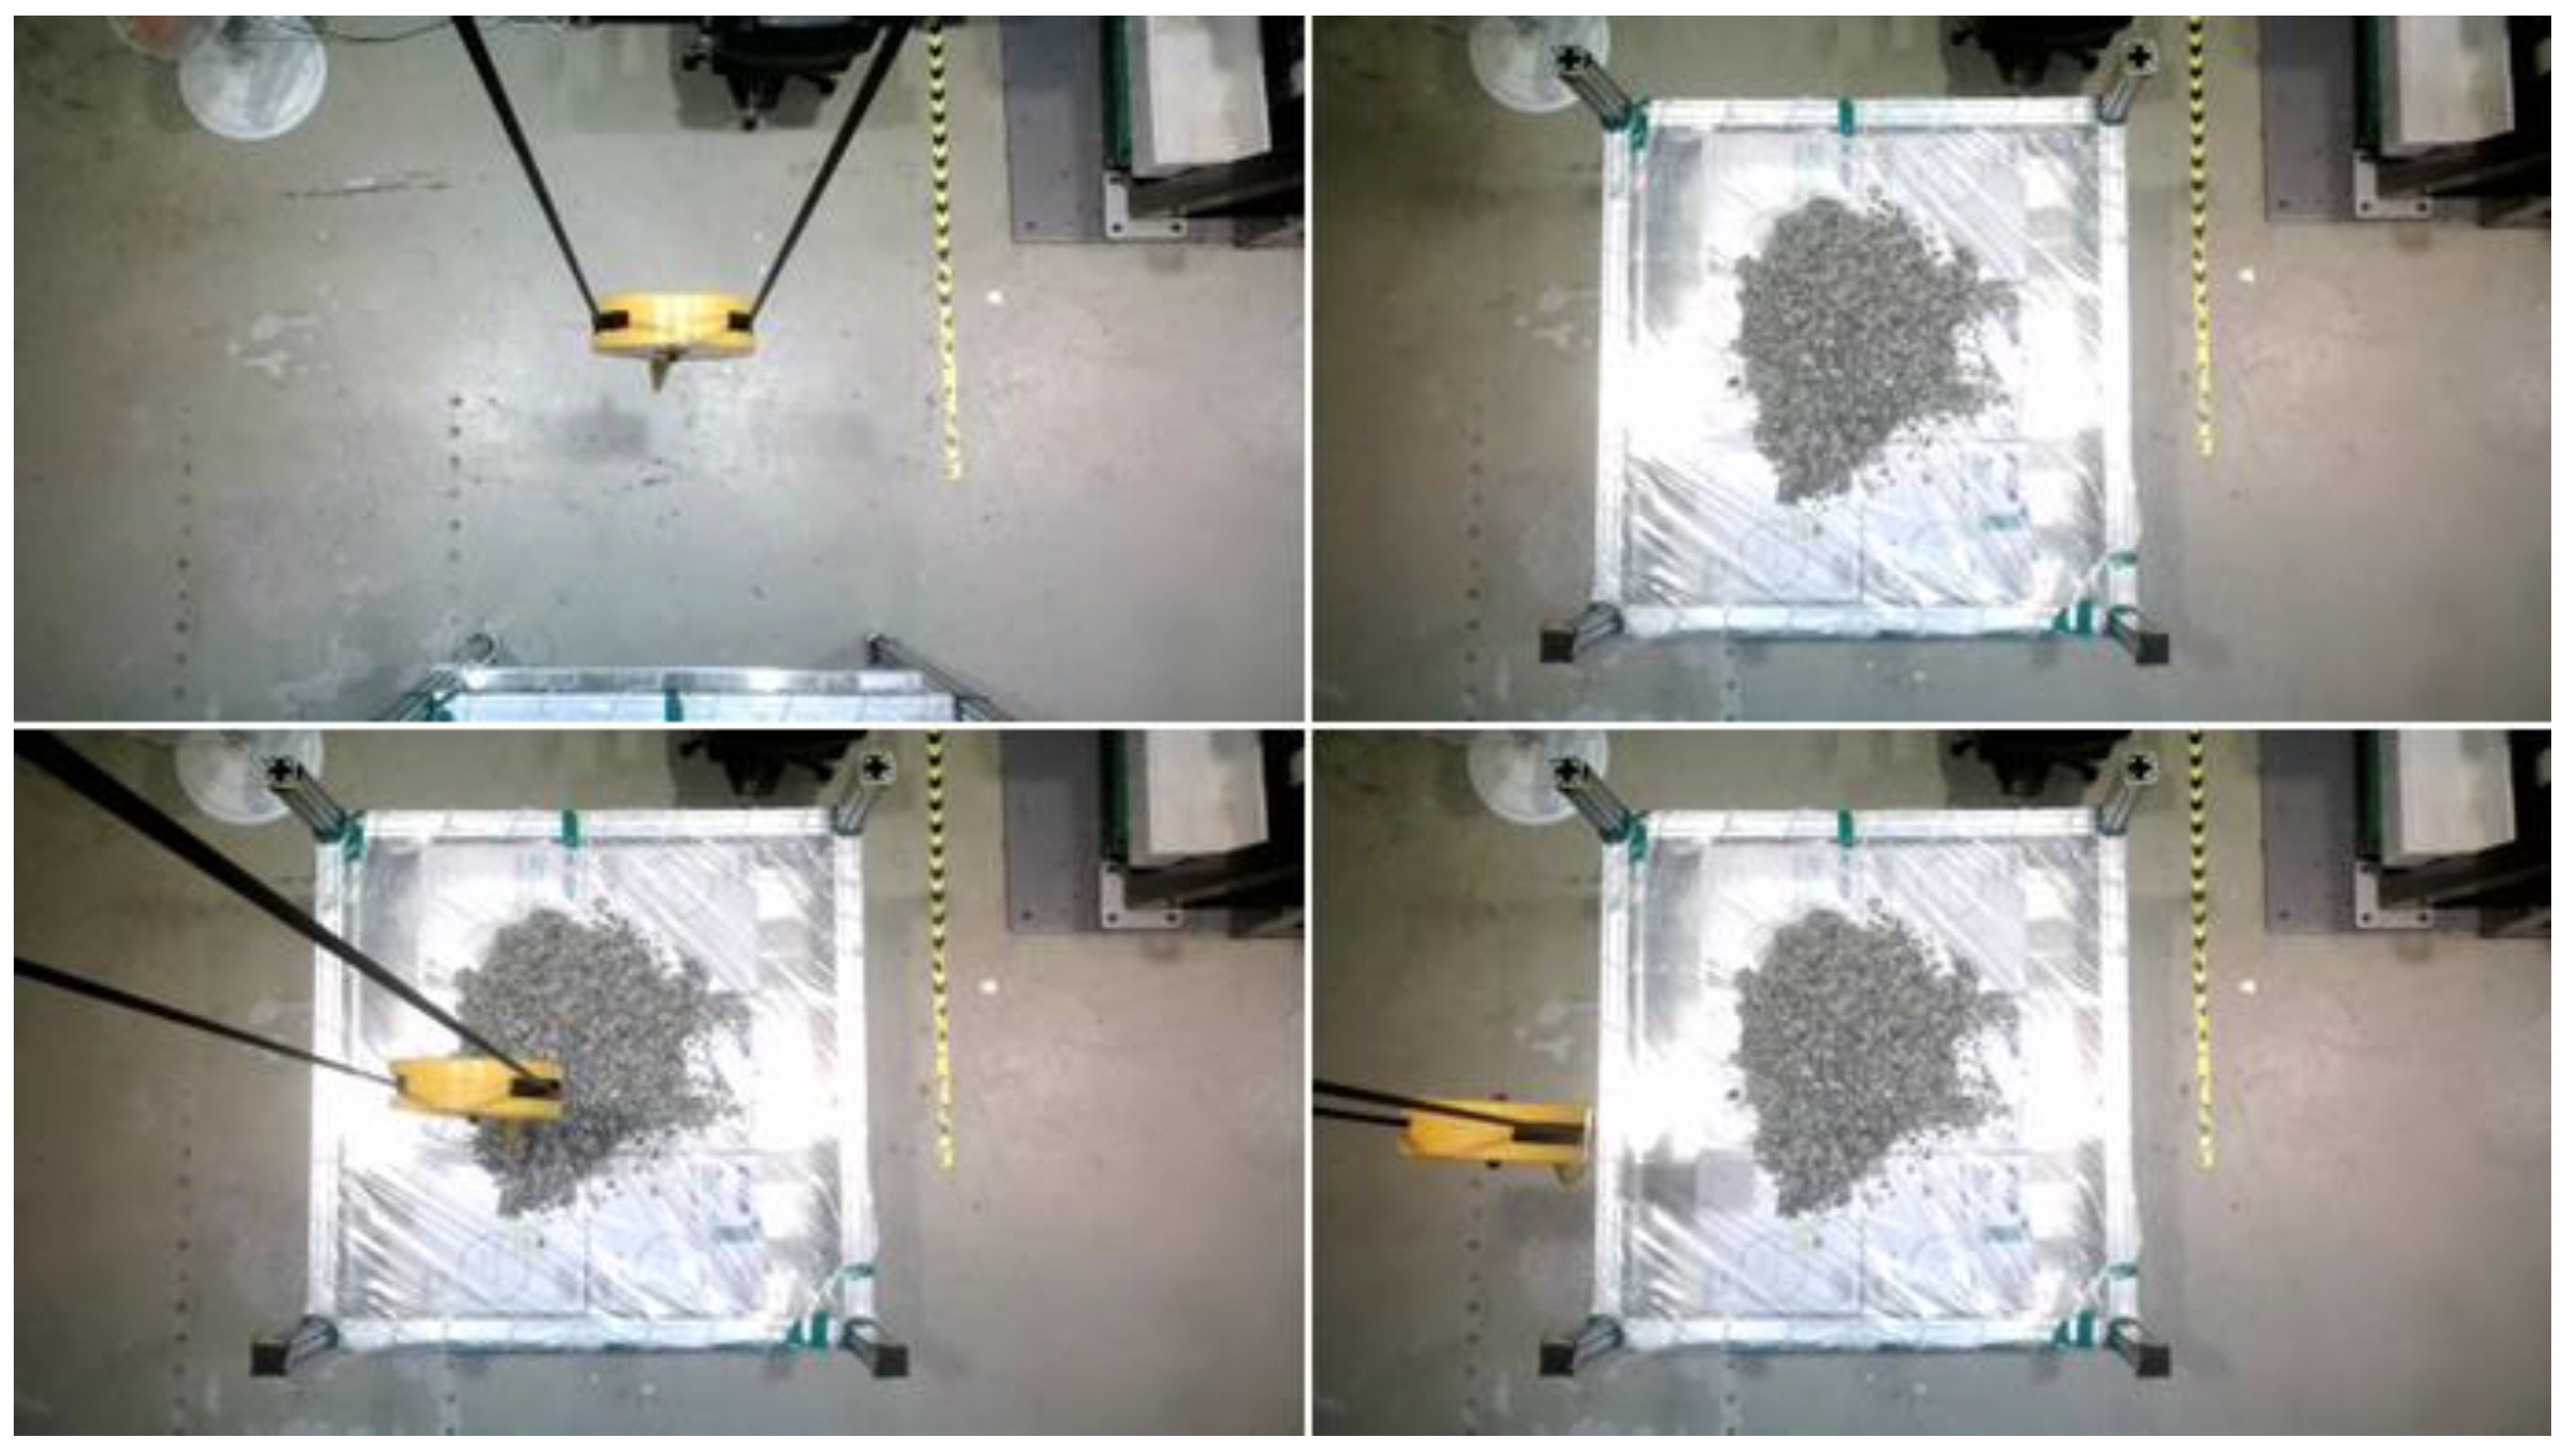
This study utilizes a dataset including example photographs of both the grab and the cargo hold. These photographs were captured utilizing a camera system that records images from a lab-scale GTSU system. Figure 21 displays a sample of picture data depicting the grab and cargo hold. The labelImg tool was utilized to process, filter, and label these photos.
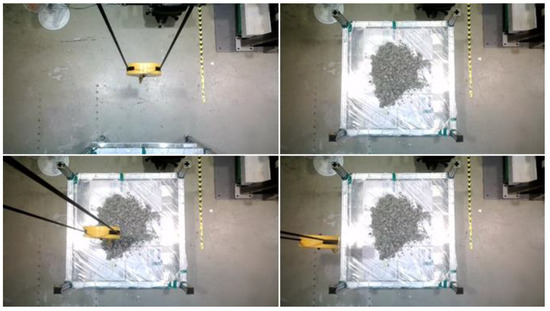
Figure 21.
Sample images of the cargo hold and the grab.
4.2. Design of an Anti-Collision Notification Model Process
Similar to the process of designing a cargo hold detection model, the anti-collision alert system was created by utilizing sample images of the cargo hold and grab together with the YOLOv3 methodology. The photos were collected and labeled using an annotation tool. Table 6 displays the parameters and settings employed in the environment of the YOLOv3 model. The training of this model took place on Google Colab. Ultimately, preventative measures were installed to detect possible conflicts between the cargo hold and the grab in the lab-scale GTSU system.
Table 6.
Parameters of the anti-collision model environment.
The YOLOv3 model underwent training for a total of 4000 iterations. In this step, the IOU value was utilized to quantify the degree of overlap between the actual and predicted bounding boxes. A higher IOU value indicates improved accuracy in model detection. The progression of IOU throughout the training is illustrated in Figure 22. Furthermore, in order to assess the efficiency of the cargo hold detecting model, the loss function was computed. The loss was roughly 0.07, as depicted in Figure 23. Additionally, the performance of the trained model in identifying the grab and cargo hold was evaluated using an image dataset, achieving an accuracy of 90%, as shown in Table 7.
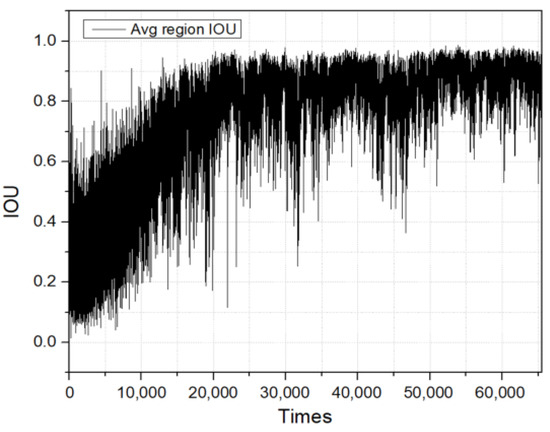
Figure 22.
Intersection over Union curve.
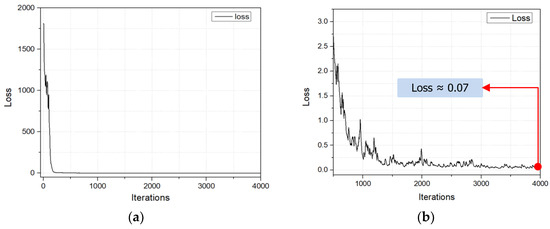
Figure 23.
Loss functions: (a) loss curve after 4000 iterations; (b) loss curve from 500 iterations to 4000 iterations.
Table 7.
Performance of the anti-collision notification model.
4.3. Results and Discussion of an Anti-Collision Notification Model
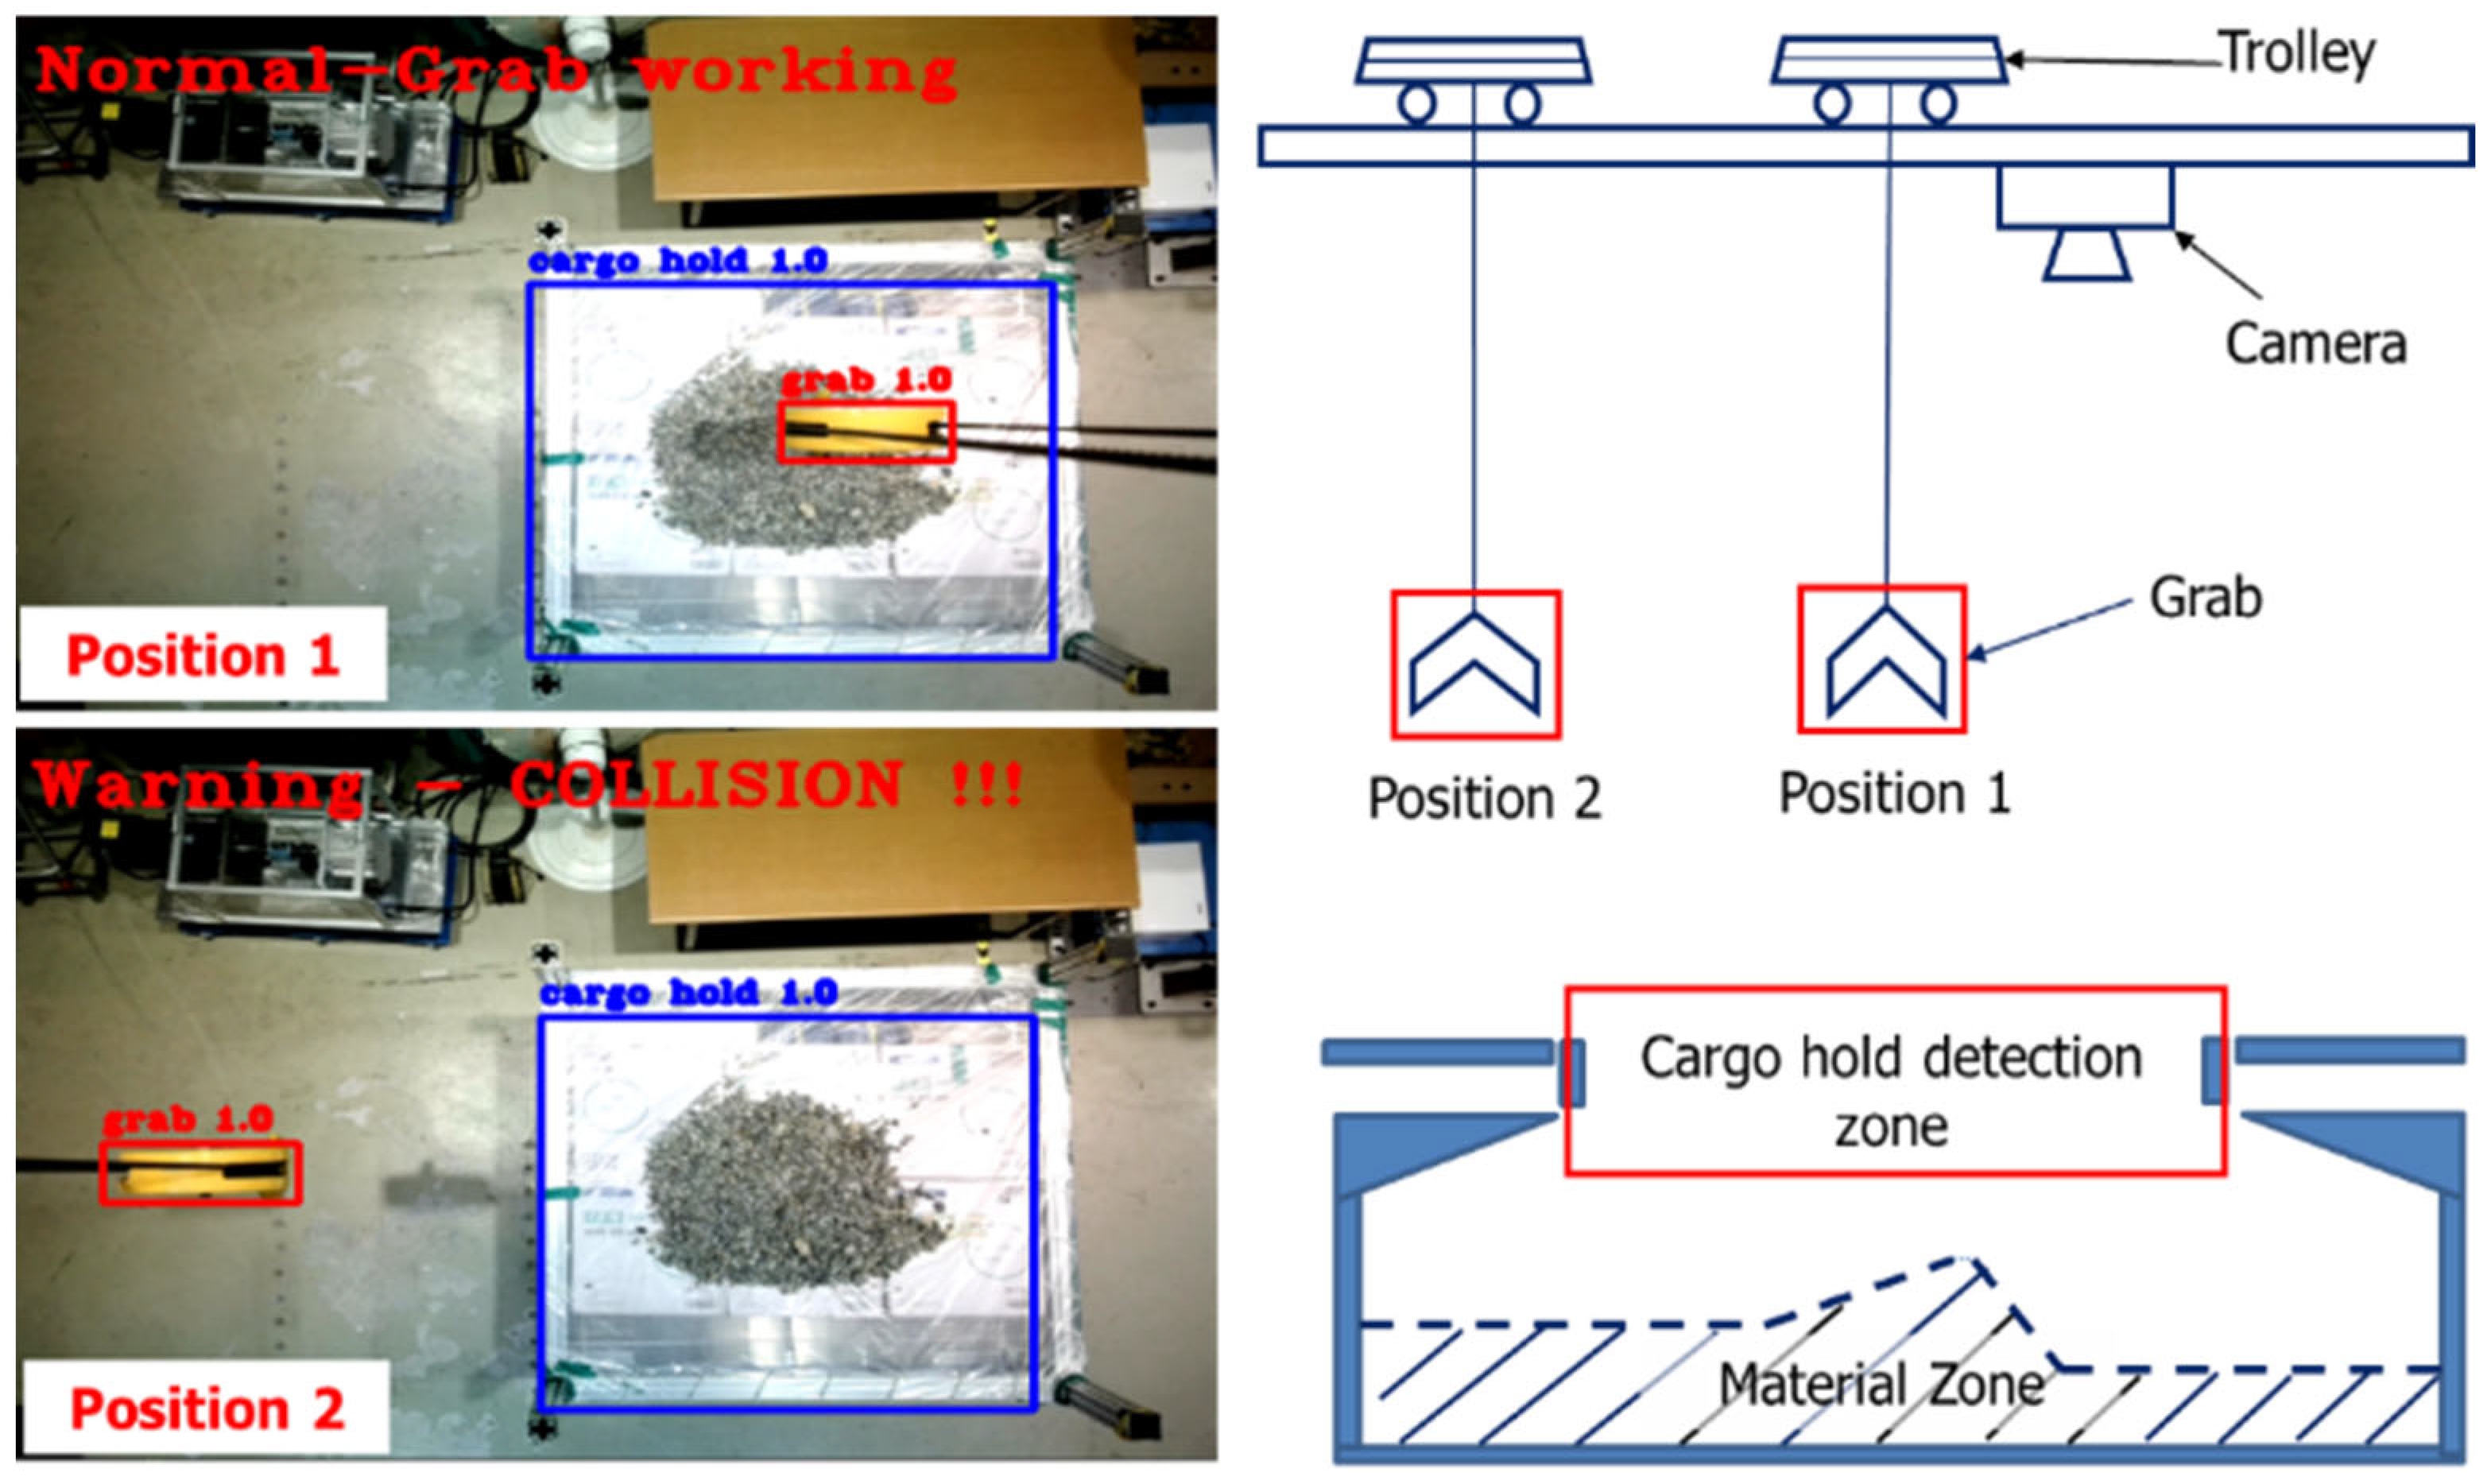
The anti-collision notification mechanism was utilized to identify collisions between the grab and the cargo hold in the lab-scale GTSU system. Real-time data generated by the camera were then processed by a central control unit. This unit employed algorithms to analyze incoming data, identifying potential collision risks and assessing spatial relationships between the cargo hold and grab. The efficiency of this processing is critical, directly impacting the system’s ability to provide timely warnings or take preventive actions. When a potential collision threat is detected, the anti-collision system engages in a series of actions aimed at avoiding or mitigating the impact. Figure 24 illustrates the model’s ability to accurately identify the location of both the grab and the cargo hold, detecting potential collision risks. The model monitors the location of the cargo hold and grab and then issues warnings based on predetermined criteria. If the grab position is located outside the working area during GTSU operation, the system triggers visual and auditory alerts to GTSU operators, providing crucial information for corrective actions. Alternatively, it can send signals to the control system to verify information and regulate the grab to a secure operational location. The goal is to ensure that equipment operates harmoniously, avoiding collisions that could result in damage to cargo and equipment or pose risks to personnel. Therefore, the significance of the anti-collision system in seaport cargo handling operations is paramount. Beyond preventing accidents, it enhances operational efficiency by facilitating the seamless flow of cargo. The system minimizes downtime due to collisions, reducing the risk of delays and ensuring goods are handled in a timely and secure manner. This efficiency leads to reduced costs and a general enhancement in the productivity of the port. Hence, this model will play a crucial role in advancing automated GTSU systems in the future.

Figure 24.
Result of the anti-collision model for the lab-scale GTSU system.
5. Conclusions
The authors of this study designed three AI models to design an automated lab-scale GTSU system. These models include the identification of cargo holds, the extraction of working points, and the anti-collision model. The cargo hold detection model excels at promptly identifying and pinpointing the location of cargo holds in real time. The image data of cargo holds, obtained from the lab-scale GTSU system using a camera system, are subjected to analysis, filtration, and annotation. The YOLOv3 method is crucial in determining the structure of the cargo hold identification model. During the training phase of the model, different parameters that affect performance, such as learning rate and iterations, were adjusted to determine the best values. After 2000 iterations, the trained model had a loss function value of about 0.04. By employing a careful methodology, the precision, recall, and F1 score values all reached 98%, demonstrating the excellent performance of the training model. The model also achieved an accuracy rate of 96%, thereby facilitating the instantaneous identification of cargo holds.
The working point extraction model, which combines camera and LiDAR sensor technologies, is highly effective in accurately identifying material locations and relaying these data to the central control system. The algorithm of the system thereafter assigns priority to regions with ample reserves to extract materials. By using camera data to initially locate materials, the LiDAR sensor then measures the depth of the materials, allowing for an evaluation of their states and the development of accurate coordinates for working points. When tested on the lab-scale GTSU system, this model exhibited its effectiveness in extracting real-time working points, with a marginal error range of 5 to 10% compared to ruler measurements.
The third type focuses on anti-collision notifications between the grab and cargo hold, serving as a protective barrier for the GTSU system. This device utilizes camera technology and the YOLO algorithm to continuously monitor the positions of the grab and cargo hold to mitigate the inherent danger of collisions during GTSU operations. Embedded inside are pre-established conditions that indicate probable collisions, enabling prompt identification and alerting of collision hazards. Through 4000 iterations, the trained model had a loss function value of about 0.07. The performance evaluation values of the anti-collision notification model, namely precision, recall, and F1 score, were 94%, 93%, and 93.5%, respectively. Empirical experiments conducted on the lab-scale GTSU system have confirmed its potential to deliver real-time collision alerts with a success rate of 90%.
Overall, the experimental results obtained from the lab-scale GTSU system provide strong evidence of the impressive effectiveness and accuracy of the three proposed models. These groundbreaking ideas show potential for future incorporation into GTSU systems, potentially leading the advancement of automated control systems in maritime logistics.
Author Contributions
Conceptualization, C.-H.N. and S.-J.L.; Methodology, C.-H.N. and C.K.; Validation, S.-J.L.; Resources, M.P.; Data curation, C.-H.N. and C.K.; Writing—original draft, C.-H.N.; Writing—review & editing, S.-J.L.; Visualization, M.-C.D.; Supervision, S.-J.L., C.K., M.-C.D. and M.P.; Project administration, M.P.; Funding acquisition, M.P. All authors have read and agreed to the published version of the manuscript.
Funding
This work was supported by the Technology Development Program (00140859) funded by the Ministry of SMEs and Startups (MSS, Korea).
Institutional Review Board Statement
Not applicable.
Informed Consent Statement
Not applicable.
Data Availability Statement
Data are contained within the article.
Conflicts of Interest
The authors declare no conflict of interest.
Abbreviations
| GTSU | Grab-Type Ship Unloader |
| AI | Artificial Intelligence |
| YOLO | You Only Look Once |
| LiDAR | Light Detection and Ranging |
References
- Åström, K.J. Adaptive Control—A Perspective. IFAC Proc. 1990, 23, 1–6. [Google Scholar]
- Jämsä-Jounela, S.-L. Future trends in process automation. Annu. Rev. Control 2007, 31, 211–220. [Google Scholar] [CrossRef]
- Industrial Automation Market in Precedence Research. Available online: https://www.precedenceresearch.com/industrial-automation-market (accessed on 1 December 2023).
- Ayesu, E.K.; Sakyi, D.; Arthur, E.; Osei-Fosu, A.K. The impact of trade on African welfare: Does seaport efficiency channel matter? Res. Glob. 2022, 5, 100098. [Google Scholar]
- Mohajeri, M.J.; van den Bergh, A.J.; Jovanova, J.; Schott, D.L. Systematic design optimization of grabs considering bulk cargo variability. Adv. Powder Technol. 2021, 32, 1723–1734. [Google Scholar] [CrossRef]
- Yang, Y.; Zhong, M.; Yao, H.; Yu, F.; Fu, X. Octavian Postolache. Internet of things for smart ports: Technologies and challenges. IEEE Instrum. Meas. Mag. 2018, 21, 34–43. [Google Scholar] [CrossRef]
- Pratama, P.S.; Nguyen, T.H.; Kim, H.K.; Kim, D.H.; Kim, S.B. Positioning and obstacle avoidance of automatic guided vehicle in partially known environment. Inter. J. Control Autom. Syst. 2016, 14, 1572–1581. [Google Scholar] [CrossRef]
- Kaloop, M.; Saye, M.; Kim, D.; Kim, E. Movement identification model of port container crane based on structural health monitoring system. Struct. Eng. Mech. 2014, 50, 105–119. [Google Scholar] [CrossRef]
- Gomes, T.; Matias, D.; Campos, A.; Cunha, L.; Roriz, R. A Survey on Ground Segmentation Methods for Automotive LiDAR Sensors. Sensors 2023, 23, 601. [Google Scholar] [CrossRef]
- Yang, L.; Xu, Y.; Li, Y.; Chang, M.; Chen, Z.; Lan, Y.; Wu, C. Real-Time field road freespace extraction for agricultural machinery autonomous driving based on LiDAR. Comput. Electron. Agric. 2023, 211, 108028. [Google Scholar] [CrossRef]
- Chao, G.; Liu, J.; Wang, M.; Chu, D. Data augmentation for sentiment classification with semantic preservation and diversity. Knowl. Based Syst. 2023, 280, 111038. [Google Scholar] [CrossRef]
- Kaufmane, E.; Sudars, K.; Namatēvs, I.; Kalniņa, I.; Judvaitis, J.; Balašs, R.; Strautiņa, S. QuinceSet: Dataset of annotated Japanese quince images for object detection. Data Brief 2022, 42, 108332. [Google Scholar] [CrossRef]
- Chang, L.; Chen, Y.-T.; Hung, M.-H.; Wang, J.-H.; Chang, Y.-L. YOLOV3 Based Ship Detection in Visible and Infrared Images. In Proceedings of the 2021 IEEE International Geoscience and Remote Sensing Symposium IGARSS, Virtual, 11–16 July 2021. [Google Scholar]
- Wu, J.; Sun, Y.; Tang, G.; Xu, X. Analyses of Time Efficiency and Speed-ups in Inference Process of Two-Stage Object Detection Algorithms. In Proceedings of the 2018 IEEE 4th International Conference on Computer and Communications (ICCC), Chengdu, China, 7–10 December 2018. [Google Scholar]
- Letavay, M.; Bažant, M.; Tuček, P. Object Detection Algorithms—A Review. In Proceedings of the 2023 International Conference on Control, Artificial Intelligence, Robotics & Optimization (ICCAIRO), Crete, Greece, 11–13 April 2023. [Google Scholar]
- Meel, V. YOLOv3: Real-Time Object Detection Algorithm (Guide). Available online: https://viso.ai/deep-learning/yolov3-overview (accessed on 15 July 2022).
- Li, L.Y.; Guo, J.; Guo, X.; Zhao, J.; Yang, Y.; Hu, Z.; Jin, W.; Tian, Y. Toward in situ zooplankton detection with a densely connected YOLOV3 model. Appl. Ocean. Res. 2021, 114, 102783. [Google Scholar] [CrossRef]
- Ammar, A.; Koubaa, A.; Ahmed, M.; Saad, A.; Benjdira, B. Vehicle Detection from Aerial Images Using Deep Learning: A Comparative Study. Electronics 2021, 10, 820. [Google Scholar] [CrossRef]
- Chen, H.; He, Z.; Shi, B.; Zhong, T. Research on Recognition Method of Electrical Components Based on YOLO V3. IEEE Access 2019, 7, 157818–157829. [Google Scholar] [CrossRef]
- Wu, X.; Sahoo, D.; Zhang, D.; Zhu, J.; Hoi, S.C.H. Single-shot bidirectional pyramid networks for high-quality object detection. Neurocomputing 2020, 401, 1–9. [Google Scholar] [CrossRef]
- Islam, R.B.; Akhter, S.; Iqbal, F.; Rahman, M.S.U.; Khan, R. Deep learning based object detection and surrounding environment description for visually impaired people. Heliyon 2023, 9, e16924. [Google Scholar] [CrossRef] [PubMed]
- Liu, J.; Liu, C.; Wu, Y.; Xu, H.; Sun, Z. An Improved Method Based on Deep Learning for Insulator Fault Detection in Diverse Aerial Images. Energies 2021, 14, 4365. [Google Scholar] [CrossRef]
- Jiang, X.; Gao, T.; Zhu, Z.; Zhao, Y. Real-Time Face Mask Detection Method Based on YOLOv3. Electronics 2021, 10, 837. [Google Scholar] [CrossRef]
- Tian, H.; Wang, T.; Liu, Y.; Qiao, X.; Li, Y. Computer vision technology in agricultural automation—A review. Inf. Process. Agric. 2020, 7, 1–19. [Google Scholar] [CrossRef]
- iSAM. Autonomous Grab Ship Unloaders for Bulk Materials. Available online: https://www.isam-ag.com/our-solutions/automation-of-grab-ship-unloaders-for-bulk-materials (accessed on 17 November 2022).
- van Kol, T.V.; Jovanova, J.; Mohajeri, M.J.; Schott, D.L. Introducing adaptive mechatronic designs in bulk handling industry. In Proceedings of the IEEE/ASME (AIM) International Conference on Advanced Intelligent Mechatronics, Virtual, 12–16 July 2021. [Google Scholar]
- Bewley, A.; Upcroft, B.; Lever, P.; Leonard, S. Automatic in-bucket volume estimation for dragline operations. In Proceedings of the Australian Mining Technology Conference, St. Lucia, Australia, 27–28 October 2009. [Google Scholar]
- Mohajeri, M.J.; de Kluijver, W.; Helmons, R.L.J.; van Rhee, C.; Schott, D.L. A validated co-simulation of grab and moist iron ore cargo: Replicating the cohesive and stress-history dependent behaviour of bulk solids. Adv. Powder Technol. 2021, 32, 1157–1169. [Google Scholar] [CrossRef]
- Kazhdan, M.; Hoppe, H. Screened poisson surface reconstruction. ACM Trans. Graph. (ToG) 2013, 32, 1–13. [Google Scholar] [CrossRef]


Disclaimer/Publisher’s Note: The statements, opinions and data contained in all publications are solely those of the individual author(s) and contributor(s) and not of MDPI and/or the editor(s). MDPI and/or the editor(s) disclaim responsibility for any injury to people or property resulting from any ideas, methods, instructions or products referred to in the content. |
© 2024 by the authors. Licensee MDPI, Basel, Switzerland. This article is an open access article distributed under the terms and conditions of the Creative Commons Attribution (CC BY) license (https://creativecommons.org/licenses/by/4.0/).