
Optimization Model for Selection of the Offshore Fleet Structure


Abstract
1. Introduction
2. Literature Review
3. Offshore Supply Vessels
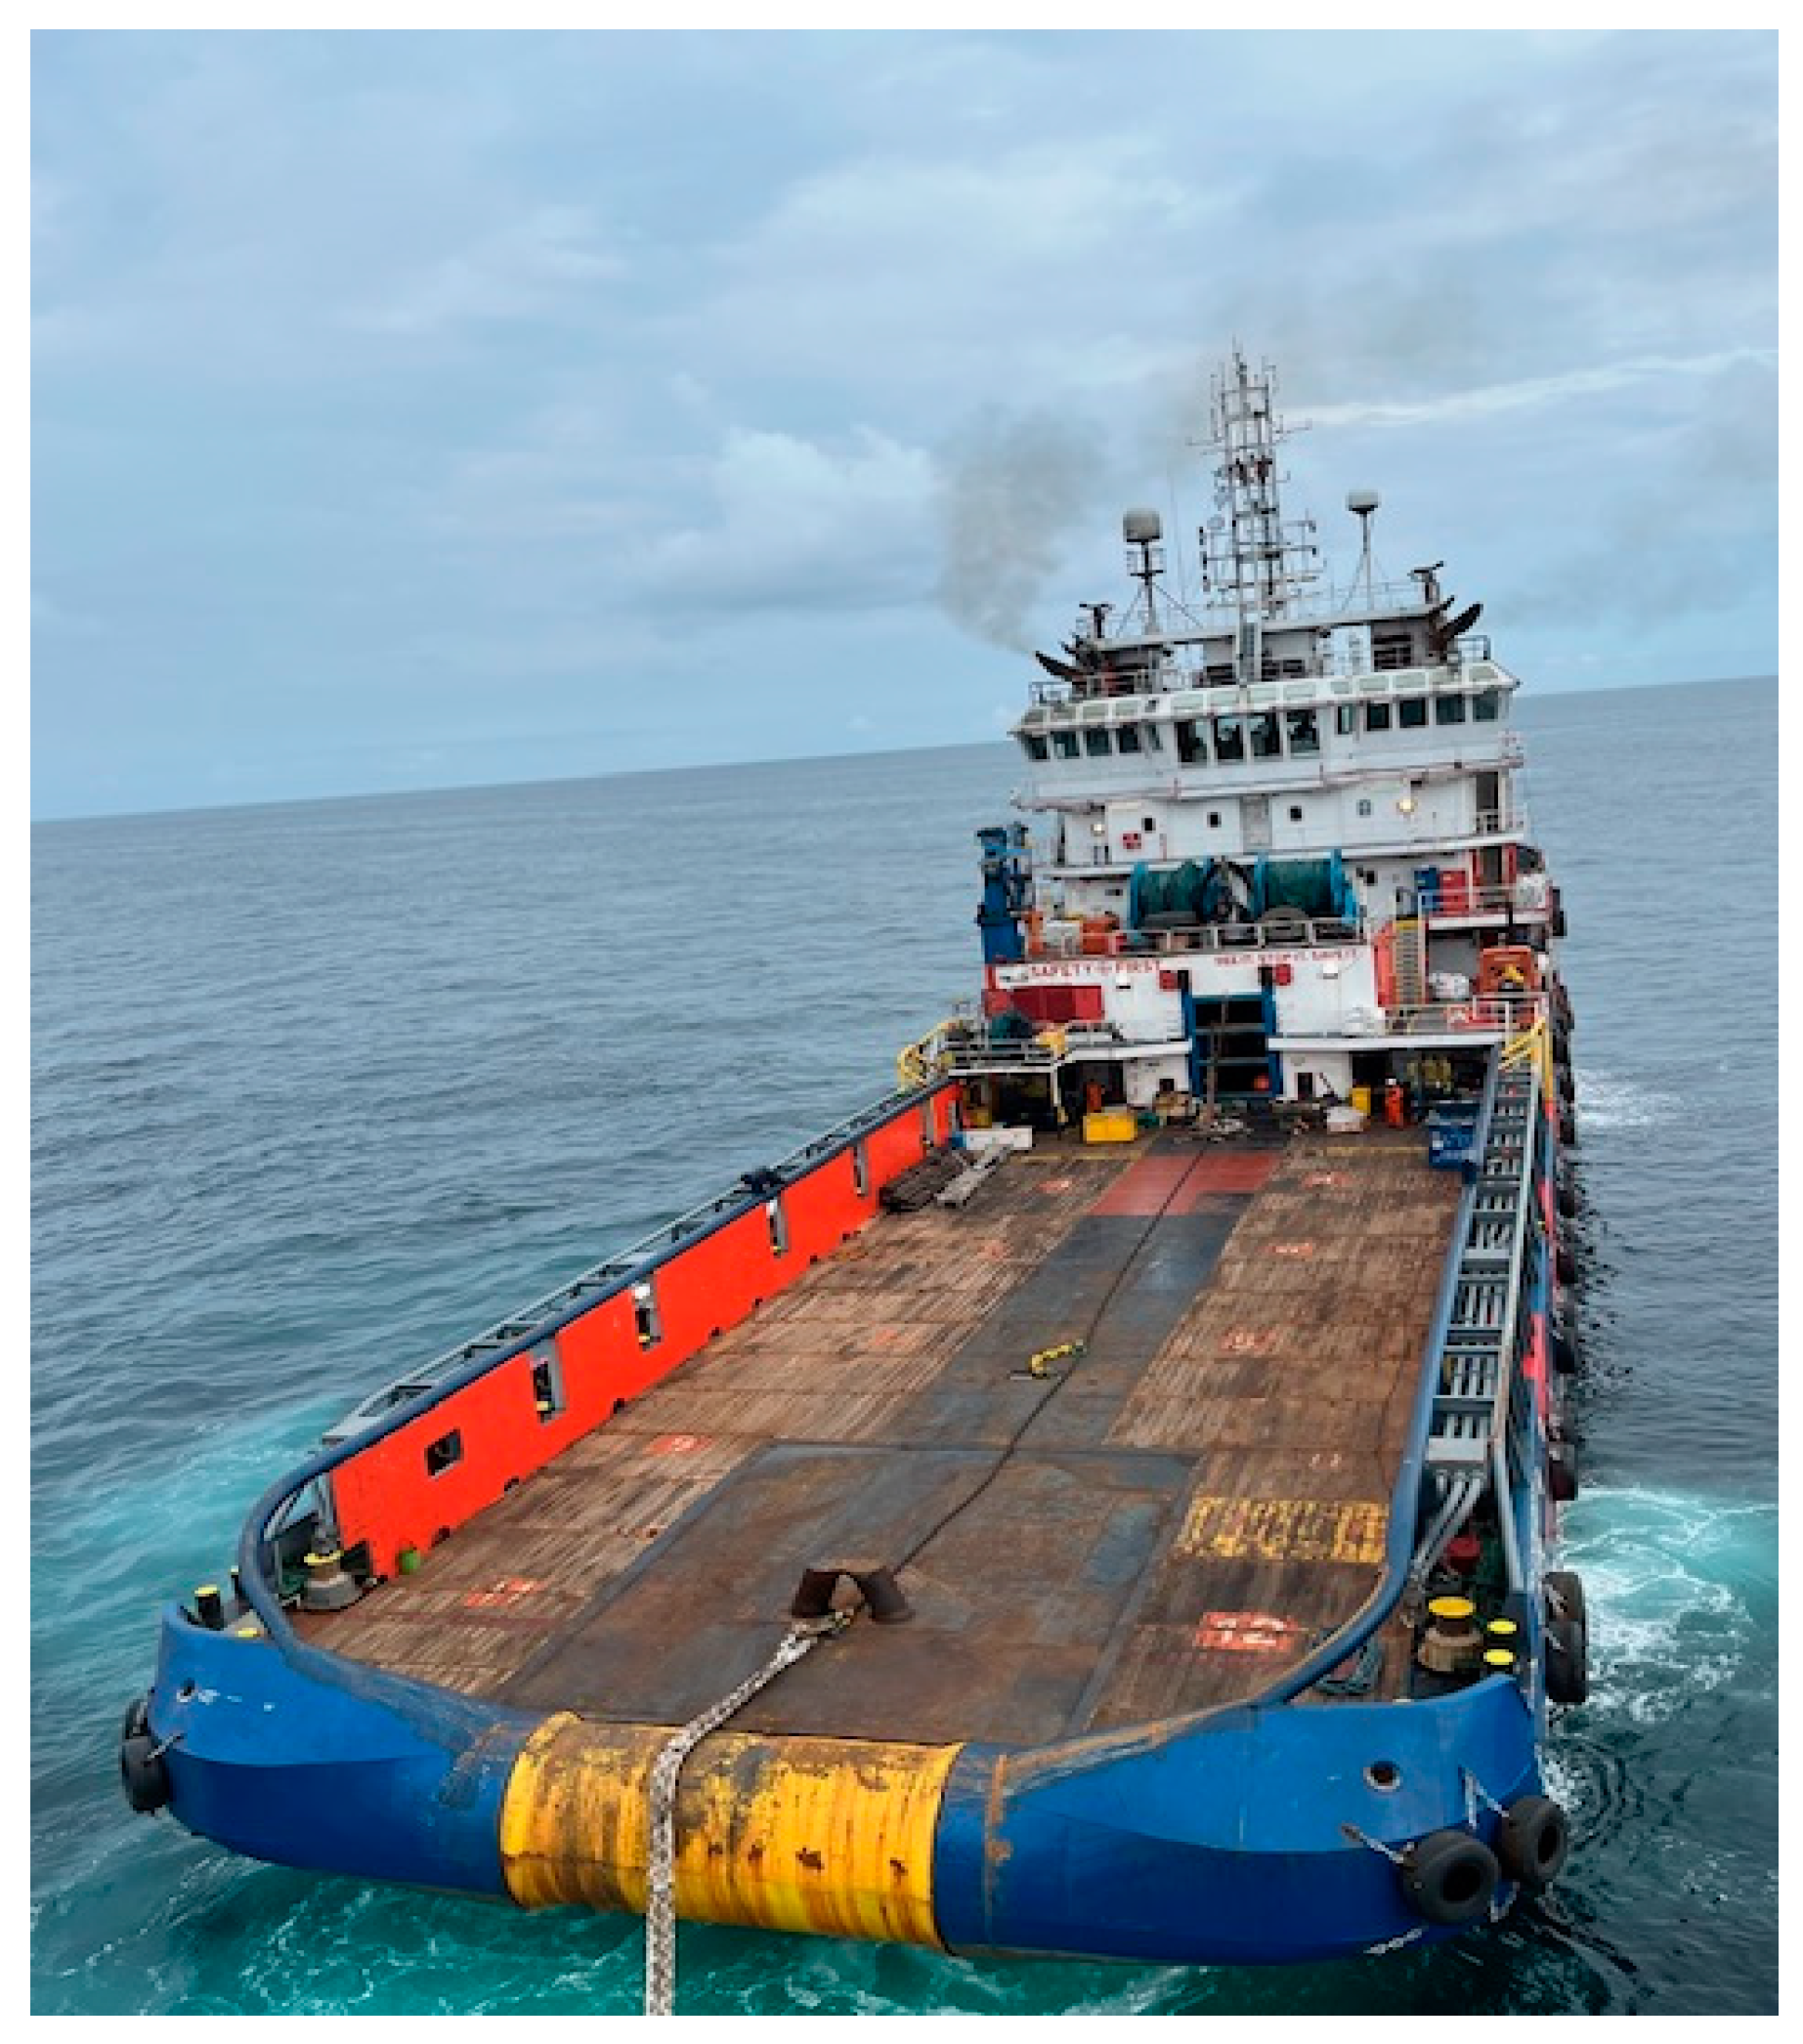
Anchor Handling Tug Supply Vessel
4. Problem Description and Mathematical Model
4.1. Problem Description and Methodology
4.2. Data Used
4.3. Mathematical Model Formulation
- Each offshore vessel departs the port loaded with cargo, sails to the oil field, unloads/loads the cargo, and then returns to the port where it unloads/loads the cargo, and returns to the oil field again where it touches several oil platforms that it supplies (loads/unloads) necessary materials, spare parts, cargo, etc.;
- The needs of the platform are shown as the sum of the requirements of the total amount of cargo;
- The economic speed of an offshore PSV is 10 knots, while that of an AHTS vessel is 11 knots;
- Total vessel expenses include vessel hire, port fee, and fuel for individual types of activities (boarding/disembarkation, waiting, sailing and maritime activities).
- (a)
- —continuous variable of the time consumption of the k vessel in performing the i activity;
- (b)
- αk—an integer variable that represents the number of hire days of the k vessel (k = 1 is PSV, k = 2 AHTS vessel);
- (c)
- βk—an integer variable that represents the number of days of use of port services for the k vessel (k = 1 is PSV, k = 2 AHTS vessel).
- (a)
- Set m includes all the maritime activities of the k vessel, which are indexed by i in the formulation of the problem;
- (b)
- Set K includes all available vessels and is indexed by k;
- (c)
- D maximum number of days in a month of engagement of a certain vessel (up to 30);
- (d)
- Set T includes the smallest average amount of cargo that is loaded/unloaded in the port or loaded/unloaded on platforms on a monthly basis;
- (e)
- Set W includes the minimum average amount of cargo loaded/unloaded, whether it is loaded/unloaded in the port or loaded/unloaded on the platforms, while the minimum average amount of cargo loaded/unloaded in the port and on the platform is marked with T. As it is known based on the log record that the minimum average amount of cargo handled in the port is greater than the minimum average amount of cargo handled on the platform, the larger of these two average values was taken in the mathematical model. This means that neither in the port nor on the platform can the minimum amount of handled cargo be less than this value.
- Dk—the maximum number of hire days of k—vessel in the performance of all i—activities, maximum 30.
- —average speed of cargo loading/unloading in the port k—vessel per day (t/day);
- i—activity of cargo loading/unloading in the port;
- T—average minimum amount of cargo loaded/unloaded in the port (t).
- —average speed of cargo loading/unloading on the platform for k—vessel per day (t/day);
- i—activity of cargo loading/unloading on the platform;
- T—average minimum amount of cargo loaded/unloaded on the platform (t).
- —average speed of cargo loading/unloading in the port per day;
- —average speed of cargo loading/unloading on the platform per day;
- i—activity of cargo loading in the port;
- j—activity of cargo unloading on the platform;
- W—the smallest average amount of cargo loaded/unloaded in the port + the amount of cargo loaded/unloaded on the platforms.
- —distance with economic sailing speed for k—vessel per day (NMs/day);
- i—sailing activity for k—vessel;
- S—the total distance at sea that the vessels have to sail (NMs).
- xk,i—time (days) of the k—vessel in all the activities it performs.
- xk,i—the time of the k—vessel in the port must be less than or equal to the number of days for which port dues have been paid.
- the number of hire days (α) and the number of port dues payment days (β) for the k—vessel are whole numbers (days). Hire is paid daily.
- i—activity waiting at the port of the k vessel.
- xk,i—the waiting time (except waiting in port) for both vessels is defined by a lower and an upper limit. Thus, the mathematical model defined that the minimum sum of all waiting times, except for waiting in the port, for PSV and AHTS together cannot be less than 2.4, nor more than 5 days.
- x2,i—the time of carrying out maritime activities for an AHTS can be defined by lower and upper limits. M1 represents the lower limit in days, while M2 represents the upper limit in days of AHTS hire.
- —the minimum number of days a vessel can use port services is 8 for a PSV, while it is 7 days for an AHTS.
5. Data Analysis and Results
6. Conclusions
Author Contributions
Funding
Institutional Review Board Statement
Informed Consent Statement
Data Availability Statement
Conflicts of Interest
References
- The Ministry of Energy of the Republic of Azerbaijan. Available online: https://minenergy.gov.az/az/neft/neft-senayesinin-inkisaf-tarixi (accessed on 21 December 2023).
- Sarthy, A.; Ham, J.L. Modern Offshore Support Vessels Class and Statutory Perspectives. In Proceedings of the International Conference on Technology & Operation of Offshore Support Vessels, Singapore, 20–21 September 2005. [Google Scholar]
- Sallan, J.M.; Lordan, O.; Fernandez, V. Modeling and Solving Programming with R; OmniaScience: Terrassa, Spain, 2015; ISBN 978-84-944229-3-5. [Google Scholar] [CrossRef]
- Fagerholt, K.; Lindstad, H. Optimal policies for maintaining a supply service in the Norwegian Sea. Omega 2000, 28, 269–275. [Google Scholar] [CrossRef]
- Aas, B.; Halskau, Ø.; Wallace, S.W. The role of supply vessels in offshore logistics. Marit. Econ. Logist 2009, 11, 302–325. [Google Scholar] [CrossRef]
- Shyshou, A.; Gribkovskaia, I.; Barcelo, J. A simulation study of the fleet sizing problem arising in offshore anchor handling operations. Eur. J. Oper. Res. 2010, 203, 230–240. [Google Scholar] [CrossRef]
- Rose, R.S.K. Future Characteristics of Offshore Support Vessels. Master’s Thesis, Massachusetts Institute of Technology, Cambridge, MA, USA, 2011. [Google Scholar]
- Maisiuk, Y.; Gribkovskaia, I. Fleet Sizing for Offshore Supply Vessels with Stochastic Sailing and Service Time. In Proceedings of the 2nd International Conference on Information Technology and Quantitative Management, ITQM 2014, Moscow, Russia, 3–5 June 2014. [Google Scholar] [CrossRef]
- Pantuso, G.; Fagerholt, K.; Hvattum, L.M. A survey on maritime fleet size and mix problems. Eur. J. Oper. Res. 2014, 235, 341–349. [Google Scholar] [CrossRef]
- Halvorsen-Weare, E.E.; Fagerholt, K. Optimization in Offshore Supply Vessel Planning; Springer Science+Business Media: New York, NY, USA, 2016. [Google Scholar]
- Skoko, I.; Lusic, Z.; Pusic, D. Commercial and strategic aspects of the offshore vessels market. Sci. J. Marit. Univ. Szczec. 2020, 62, 18–25. [Google Scholar]
- Boko, Z.; Sanchez-Varela, Z.; Skoko, I.; Boullosa-Falces, D. General classification of Anchor Handling Tug Supply Vessels by Gross tonnage and Bollard pull. In Proceedings of the 20th International Conference on Transport Science—ICTS 2022, Portorož, Slovenia, 23–24 May 2022. [Google Scholar]
- Sopot, E.; Gribkovskaia, I. Routing of supply vessels to with deliveries and pickups of multiple commodities, 2nd International Conference on Information Technology and Quantitative Management. Procedia Comput. Sci. 2014, 31, 910–917. [Google Scholar] [CrossRef]
- Skoko, I.; Zujic, M.; Boko, Z. Analysis of operational time and costs of offshore vessels and correlation with the crude oil price. In Proceeding of the 10th International Maritime Science Conference IMSC, Solin, Croatia, 8–9 May 2023. [Google Scholar]
- Bolstad, K.H.; Joshi, M.; Hvattum, L.M.; Stalhane, M. Composing Vessel Fleets for Maintenance at Offshore Wind Farms by Solving a Dual-Level Stochastic Programming Problem Using GRASP. Logistics 2022, 6, 6. [Google Scholar] [CrossRef]
- Shyshou, A. A multi-base supply vessel planning problem arising in offshore oil and gas operations. In Proceedings of the Alio Informs Joint International Meeting 2010, Buenos Aires, Argentina, 6–9 June 2010. [Google Scholar]
- Guzman, J.M.P. Offshore Support Vessels Market: Sales & Purchase, and Chartering Strategies for PSV and AHTS: An Evaluation of the Influential Factors; World Maritime University: Malmo, Sweden, 2019. [Google Scholar]
- Dev, A. Various Aspects of Bollard Pull Test and Analysis of Test Result. J. Ship Prod. Des. 2018, 34, 249–268. [Google Scholar] [CrossRef]


| PSV | Port | Sailing | St/by Facility | St/by Anchor | St/by Port | Offshore Supply |
|---|---|---|---|---|---|---|
| Fuel consumption t/h | 0.03 | 0.5 | 0.03 | 0.03 | 0.03 | 0.5 |
| Daily fuel expenses | USD 626.4 | USD 10,440.00 | USD 626.4 | USD 626.4 | USD 626.4 | USD 10,440.00 |
| An average monthly activity time (day) | 4.39 | 7.28 | 0.36 | 6.63 | 4.79 | 3.66 |
| Total fuel expenses per activity (USD) | USD 2751.03 | USD 76,018.00 | USD 849.20 | USD 4151.01 | USD 2998.72 | USD 38,213.72 |
| Total fuel expenses all activities (USD) | USD 124,981.68 | |||||
| Daily port fee: 73.6 m × USD 7.5 | Length over all = 73.6 m port fee per meter of the lengths = USD 7.5 the number of paid port fees (frequency of entry per month) = 8 73.6 × USD 7.5 × 8 = USD 4416.00 | |||||
| Daily hire: USD 27.500 | 29 × USD 27,500 = USD 797,500.00 | |||||
| Total expenses | USD 124,981.68 + 4416.00 + 797,500.00 = USD 926,897.68 | |||||
| AHTS | Marine Activities | Port | Sailing | St/by Facility | St/by Anchor | St/by Port | Offshore Supply |
|---|---|---|---|---|---|---|---|
| Fuel consumption t/h | 0.5 | 0.03 | 0.5 | 0.03 | 0.03 | 0.03 | 0.5 |
| Daily fuel expenses | USD 10,440.00 | USD 626.4 | USD 10,440.00 | USD 626.4 | USD 626.4 | USD 626.4 | USD 10,440.00 |
| An average monthly activity time (day) | 5.29 | 2.11 | 5.96 | 2.94 | 7.73 | 2.36 | 2.58 |
| Total fuel cost per activity (USD) | USD 55,211.77 | USD 1322.76 | USD 62,243.06 | USD 1840.23 | USD 4841.33 | USD 1480.52 | USD 26,929.52 |
| Total fuel expenses all activities (USD) | USD 153,869.20 | ||||||
| Daily port fee: 68.95 m × USD 7.5 | Length over all = 68.95 m port fee per meter of the lengths = USD 7.5 the number of paid port fees (frequency of entry per month) = 8 68.95 m × USD 7.5 × 8 = USD 4137.00 | ||||||
| Daily hire: USD 32.000 | 29 × USD 32,000 = USD 928,000.00 | ||||||
| Total expenses | USD 153,869.20 + 4137.00 + 928,000.00 = USD 1,086,006.20 | ||||||
| Cost/Vessel | Fuel | Port Fee | Monthly Hire | Total |
|---|---|---|---|---|
| PSV | USD 124,981.68 | USD 4416.00 | USD 797,500.00 | USD 926,897.68 |
| AHTS | USD 153,869.20 | USD 4137.00 | USD 928,000.00 | USD 1,086,006.20 |
| USD 2,012,903.88 |
| Input Data | PSV | AHTS |
|---|---|---|
| Average economic speed (knot) | 10 | 11 |
| Average vessel capacity (t) Usable carrying capacity 85% of the average capacity of the vessel (t) | 1600 1360 cargo + bulk + mud | 800 680 cargo + bulk + mud |
| Average vessel length (m) | 73.6 | 68.95 |
| Average daily port fee (USD/day) | 552 | 517.13 |
| Average hourly/daily fuel consumption—in the performance of maritime activities (t/h/t/day) | 0.5/12 | |
| Average hourly/daily fuel consumption—loading/unloading cargo in the port (t/h/t/day) | 0.03/0.072 | 0.03/0.072 |
| Average hourly/daily fuel consumption—in navigation (t/h/t/day) | 0.5/12 | 0.5/12 |
| Average hourly/daily fuel consumption—in supply operations (t/h/t/day) | 0.5/12 | 0.5/12 |
| Average hourly/daily fuel consumption—waiting—platform (t/h/t/day) | 0.03/0.072 | 0.03/0.072 |
| Average hourly/daily fuel consumption—waiting—port (t/h/t/day) | 0.03/0.072 | 0.03/0.072 |
| Average fuel consumption per hour—waiting—anchor (t/h/t/day) | 0.03/0.072 | 0.03/0.072 |
| Average fuel price (USD/t) | 870 | 870 |
| Average number of days per month (day) | 30 | 30 |
| Average daily loading/unloading of cargo in the port (t/day)—obtained from data from the vessel’s logbooks (cargo manifest) | 2478 | 680 |
| Average daily loading/unloading of cargo on the platform (t/day)—obtained from data from the vessel’s logbooks (cargo manifest) | 2972 | 557 |
| Average daily hire (USD/day) | 27,500 | 32,000 |
| Total average (monthly) distance in nautical miles sailed by vessels (NMs) | 3322 | |
| Minimum average (monthly) amount of cargo that (PSV and AHTS) vessels unload when supplying platforms (t/month) | 12,316 | |
| Minimum average (monthly) amount of cargo that (PSV and AHTS) vessels unload when supplying platforms (t/month) | 12,316 | |
| Minimum average (monthly) amount of cargo loaded/unloaded in the port and loaded/unloaded on the platform (t/month) | 21,760 | |
| Average fuel price (USD/t) | 870 | |
| Optimum Time (Day) | Maritime Activities | Port | Navigation | St/by Platform | St/by Anchor | St/by Port | Supply |
|---|---|---|---|---|---|---|---|
| PSV | 0.00 | 3.81 | 13.18 | 2.40 | 0.00 | 2.40 | 4.14 |
| AHTS | 7.00 | 0.00 | 0.60 | 0.00 | 0.00 | 2.40 | 0.00 |
| Vessel | Daily Hire (USD) | Hire (Days) | Port (Days) | Daily Port Fee (USD) |
|---|---|---|---|---|
| PSV | USD 27,500.00 | 26 | 8 | USD 552.00 |
| AHTS | USD 32,000.00 | 10 | 7 | USD 517.13 |
| Optimal Expenses | Optimal Fuel Consumption (USD) | Optimal Port Fee (USD) | Optimal Hire (USD) | Total Optimal Expenses (USD) |
|---|---|---|---|---|
| PSV | USD 186,274.10 | USD 4416.00 | USD 715,000.00 | USD 905,690.10 |
| AHTS | USD 80,847.36 | USD 3619.88 | USD 320,000.00 | USD 404,467.24 |
| Expenses | Optimal/Minimum Expenses (USD) | Actual Expenses |
|---|---|---|
| PSV | USD 905,690.10 | USD 926,897.68 |
| AHTS | USD 404,467.24 | USD 1,086,006.20 |
Disclaimer/Publisher’s Note: The statements, opinions and data contained in all publications are solely those of the individual author(s) and contributor(s) and not of MDPI and/or the editor(s). MDPI and/or the editor(s) disclaim responsibility for any injury to people or property resulting from any ideas, methods, instructions or products referred to in the content. |
© 2024 by the authors. Licensee MDPI, Basel, Switzerland. This article is an open access article distributed under the terms and conditions of the Creative Commons Attribution (CC BY) license (https://creativecommons.org/licenses/by/4.0/).
Share and Cite
Skoko, I.; Lušić, Z.; Sanchez-Varela, Z.; Boko, Z. Optimization Model for Selection of the Offshore Fleet Structure. J. Mar. Sci. Eng. 2024, 12, 263. https://doi.org/10.3390/jmse12020263
Skoko I, Lušić Z, Sanchez-Varela Z, Boko Z. Optimization Model for Selection of the Offshore Fleet Structure. Journal of Marine Science and Engineering. 2024; 12(2):263. https://doi.org/10.3390/jmse12020263
Chicago/Turabian StyleSkoko, Ivica, Zvonimir Lušić, Zaloa Sanchez-Varela, and Zlatko Boko. 2024. "Optimization Model for Selection of the Offshore Fleet Structure" Journal of Marine Science and Engineering 12, no. 2: 263. https://doi.org/10.3390/jmse12020263
APA StyleSkoko, I., Lušić, Z., Sanchez-Varela, Z., & Boko, Z. (2024). Optimization Model for Selection of the Offshore Fleet Structure. Journal of Marine Science and Engineering, 12(2), 263. https://doi.org/10.3390/jmse12020263