Abstract
Ice-strengthened ships inevitably suffer from ice floe impacts during navigation in icy regions. Under some extreme-ice-impact loadings, the ship structure will experience plastic deformations. The magnitude of plastic deformation is highly correlated with the ice floe-impact energy level. During most ice impacts, only the ship’s plate undergoes minor plastic deformation. Considering that the structure still has a high structural strength with a minor permanent deformation, developing a structural plastic design method for polar ships has become a hot research issue in current studies. Therefore, in this paper, based on the rigid-plastic theory and the ice-crushing-energy approach, an experimentally verified theoretical model for predicting plastic deformations of the vertical-side plate of polar ship subjected to ice floe impacts was established. According to the analytical solutions of the plastic deformation, the plastic design formula to determine the plating thickness of ice-strengthened ships subjected to ice floe impacts was further derived based on the plastic design criteria. In addition, the parameter analysis of ice strength described by the ice pressure–area relationship, allowable-permanent-set parameter, impact energy and ice shape were conducted, and plating-thickness design curves with different design parameters were given. The design of plating thickness is very sensitive to the determinations of the allowable-permanent set and ice pressure–area curves. The designed plating thickness decreased with the increase of the allowable-permanent set. Moreover, a comparative analysis of the designed plating thickness for ice floe impact and rigid-mass impact was also carried out. Under the same impact conditions, due to energy absorption caused by ice damage, the designed thickness of the plate for rigid-mass impact was much larger than that for the ice impact. It is necessary to consider the impact-induced ice damage and energy dissipation in a structural design, instead of using rigid impact loads for conservative design. The research in this paper can provide some useful references for the structural design of ice-strengthened ships subject to ice floe impacts.
1. Introduction
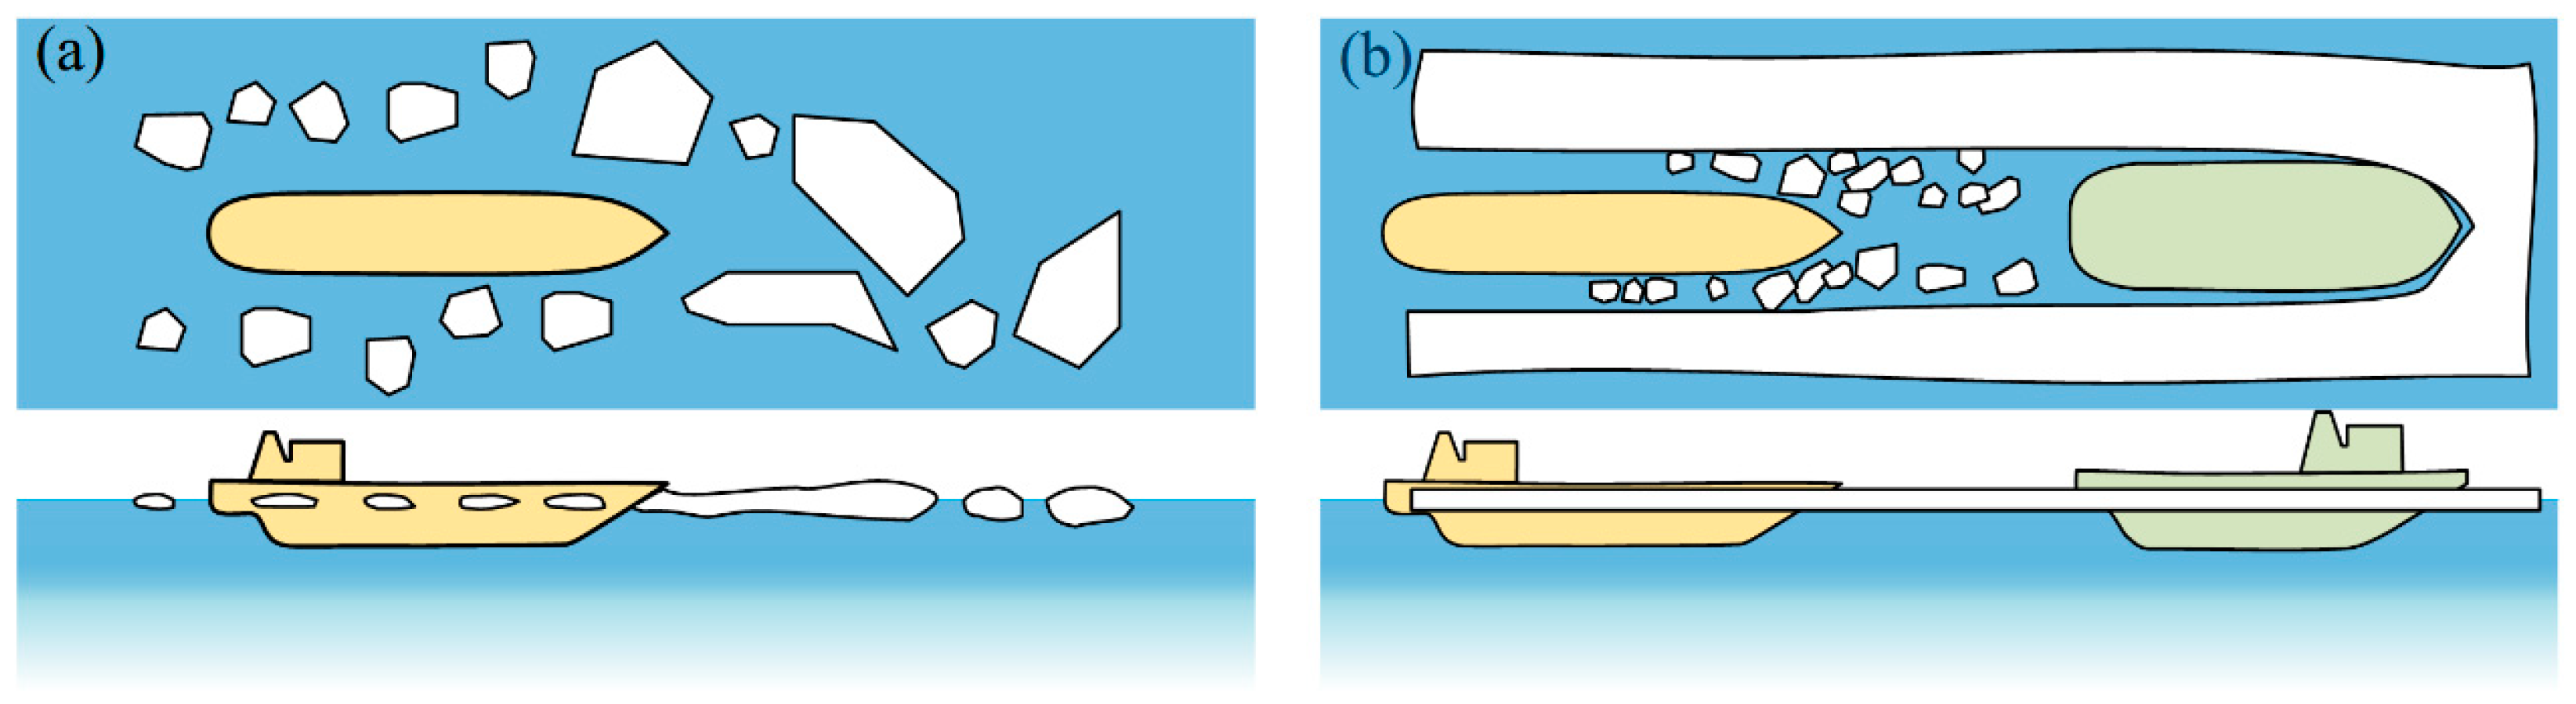
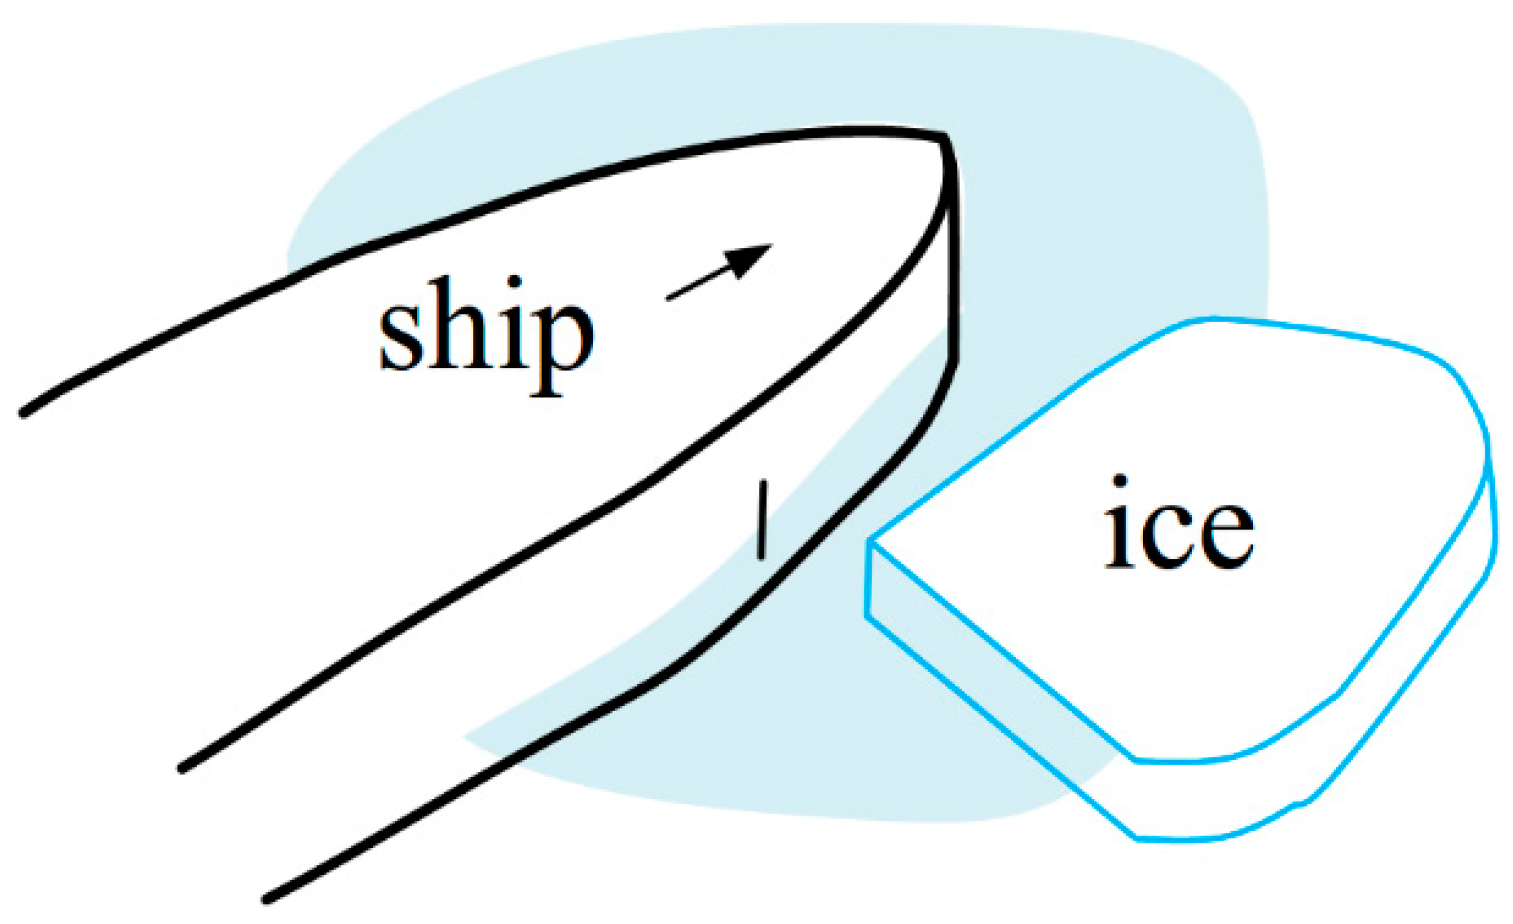
The Arctic region is rich in oil, gas and mineral resources. The opening of the Arctic route and the increases in polar expedition and tourism activities year by year have made the Arctic polar region a hotspot of concern in the world. With the melting of the Arctic glaciers accelerating due to global warming, the number of ice floes has gradually increased, and their thickness has gradually decreased. Due to the changes in this polar-navigation environment, more and more low-ice-class ships can enter the polar regions, and the decrease of ice thickness reduce design requirements of ship structure. The demand for low-ice-class ships such as polar transport ships, polar cruise liners, fishing vessels, naval ships and some other ice-strengthened ships, has been gradually increasing. The definitions of low-ice class in different design rules are summarized in Table 1. Figure 1 illustrates two navigation scenarios of ice-strengthened ships of a low-ice class (PC6 and PC7) in icy regions, where one is that the ship navigates in free-broken-ice regions as shown in Figure 1a, and another one is that the ship navigates the broken-ice region induced by the guidance of an icebreaker as shown in Figure 1b. Under some extreme ice loads, the ship structure will be prone to experiencing small plastic deformations, and the ship structure will still have a high residual strength with these small plastic deformations. Therefore, a plastic-design method for a structure allowing for small permanent deformations is widely applied to the structural design of ice-strengthened ships. The structural size and design requirements can be diminished under the premise of ensuring the safety of the ship structure, such as reducing the plating thickness. Therefore, it is particularly important to carry out research on the plastic design of ship structures based on the plastic design criteria.

Table 1.
Ice-class categories within different design rules.

Figure 1.
Ship navigation scenarios in an icy region: (a) Navigation in an ice floe region; (b) Navigation in a broken-ice region when guided by an icebreaker.
For impact-response analysis incorporating ship structure and ice floes, experimental and numerical methods have been widely used to estimate the impact force and the plastic deformation and energy absorption of the structure. Ritch et al. [7] and Gagnon et al. [8] carried out some tests on impacts between the CCGS Terry Fox icebreaker and small iceberg bits to study the ice-impact loading. Gagnon et al. [9] carried out ice-impact tests between cone-shaped ice samples and a steel plate by using a large double-pendulum apparatus to study the impact load. Ince et al. [10] conducted an ice-drop test between the cone-shaped ice and a steel plate to study the plastic deformation of the plate and the impact force–time relationship. Kim et al. [11] carried out quasi-static loading tests on the laboratory-grown cone-shaped ice and the grillage structure under different loading and different loading positions and analyzed the deflection of the grillage and the maximum load. Zhu et al. [12] and Cai et al. [13] carried out impact tests between the steel plates and freshwater ice wedges. The plastic deformation and energy absorption of a plate and the collision forces during the impact process were studied. Jang et al. [14] designed an experimental set-up, including a double-pendulum system situated within a cold chamber, which can predict the collision forces under ice impacts by varying both the collision energy and velocity. Considering the influence of fluid motion on ship–ice impact, Kim et al. [15] carried out a series of laboratory-scale tests of freshwater granular ice blocks against stiffened steel panels in the ice tank and analyzed the impact force and the permanent plate deformations of the structure.
In general, the finite-element method is commonly used as a structural design tool to evaluate structure strength under ice-impact loads. Liu et al. [16] carried out simulations of a head-on collision between a ship bow and icebergs by using LS-DYNA 971, and the energy absorption and plastic deformation of the bow and iceberg were analyzed. Shi et al. [17] proposed a temperature-gradient dependent elastic-plastic material model of ice and carried out numerical simulations of iceberg–ship plate collision. By analyzing the contact area–pressure curve, the influence of a temperature gradient on the impact force was studied. Yu et al. [18] established an ice-material model considering temperature, and a drop-hammer-impact model between ice and stiffened plates was established by LS-DYNA software. The ice load and the structural deformation were studied. Mokhtari et al. [19] used the VUMAT model developed by Liu and the crushable-foam model to simulate the ice, and they used ABAQUS 2019 to establish a 1/4 model of cone-shaped ice compression. The failure strain, hydrostatic pressure and equivalent plastic strain of the ice model were studied. Yu et al. [20] used ABAQUS software to carry out the finite-element model of the impact of a wedge-shaped ice block and stiffened panels, and also studied the impact force and permanent deformation of stiffened plate. Cai et al. [21] proposed an ice-material model similar to soil/concrete. The numerical simulation of wedge-shape-ice–plate impact was conducted, and the impact force and plastic deformation of the plate were studied. Based on Liu’s model, Yu et al. [22] studied the impact force and energy absorption of the impact between the semi-submersible offshore platform column and the iceberg. Chen et al. [23] used LS-DYNA software to establish the interaction model between ice floe and submarine and studied the plastic deformation of the structure. Zhou et al. [24] carried out a numerical simulation model of ice-propeller collision and studied the impact force.
Some researchers have also carried out theoretical analysis on the dynamic responses of ship–ice collision. Zhu et al. [25] proposed a rigid-plastic analytical model of the ship plate under repeated rigid-mass impact loadings and considered the strain-rate-sensitivity factor of the ship plate. The variation of the cumulative increase of the plastic deformation of the ship plate and the variation of the structural stiffness during loading and unloading were analyzed. Based on the previous work, Zhu et al. [26] extended the study of repeated rigid mass impacts of plates to stiffened plates. Based on the rigid-perfectly-plastic method, accounting for the influence of the strain rate, strain hardening and material elasticity, the theoretical formulas of plastic deformation of rectangular stiffened plates under rigid-mass impact were proposed. Based on the rigid-plastic assumption, Guo et al. [27] established a theoretical model to analyze the plastic mechanical behavior of metal-foam-sandwich beams suffering from repeated impacts by applying the membrane factor method, and they analyzed the effects of the core strength and the face thickness on the deflection response of sandwich beams. Different from the rigid-mass impact in the above research, Cai et al. [28] considered the energy dissipation caused by ice failure and derived the formulas of plastic deformation and maximum collision force for ship plates impacted by ice floe by combining the rigid-plastic theory and the energy approach of ice crushing.
The above literature analyzes the evaluation method of plastic deformations of ship structures subjected to ice floe impacts. In structural design, blindly increasing the structural size to avoid the occurrence of plastic deformations will greatly increase the weight of the ship, the cost of ship construction, and also encroach on the internal space of the ship. It is noteworthy that the structure still has high structural strength with small plastic deformations. Therefore, it is urgent to propose a structural-plastic-design method based on plastic design criteria under ice floe impact to determine reasonable structural dimensions. Some researchers have performed research on the plastic design of ship structures under the impact of ice floe. The design method based on plastic design criteria was first applied to the design of ship-plate thickness under wheel load [29,30,31]. Daley [32,33] derived the plastic design formula of polar ship frame using work-energy principles based on the specification design requirements, finite-element analysis and analytical solutions of plastic-collapse mechanisms. In addition, based on the non-linear-finite-element analysis and IACS polar rules, Daley et al. [34] developed the plastic buckling deformation analysis of flatbar frames to ice-like loads under overload conditions. Based on the rigid-plastic theory, Hong and Amdahl [35] proposed the “double-diamond” patch-loading mechanism, which was used to derive the plate-thickness formula under patch-loading that accounted for membrane effects under finite deformation. Zhu et al. [36] assumed the ice-impact loading as an idealized rigid-mass loading. Based on the ideal rigid-plastic theory, the plastic deformation of the ship plate under ice floe impact was analyzed. The plastic design formula to determine the plating thickness under ice floe impact was proposed, and the plating-thickness design curves were given. Zhu et al. [37] applied the elasto-plastic method of deck plates under quasi-static patch loads to determine a simple design formula of plating thickness based on an acceptable level of permanent set.
Within the current polar-ship-structural design rules, the method based on plastic design criteria is also used to design the ship plate and grillages. The IACS polar rules [1] introduce the plastic-design concept for the local structure under ice loading. The design’s load form is local uniform pressure. The plastic-collapse failure mechanism is considered when determining the design loads, and the crushing-failure-class factor and flexural-failure-class factor are used. In general, ice loads applied to the ships may be categorized as ‘stationary’ or ‘moving’. Kim et al. [38] conducted the experiment of moving-ice loads acting on an elastic plate to determine the force-displacement curve, which was compared with the similar stationary-ice-load-experiment results. The results show that when the structure remains elastic during the interaction the difference in magnitude of ice load between stationary and moving loading conditions can be negligible. However, in the context of when the structure begins to undergo plastic deformation, Quinton et al. [39] compared the magnitude of an IACS design load with the actual ice loads, and they applied an Mpp-Dyna code to establish the numerical model for full-scale grillages subjected to actual ice loads and analyzed the plastic strain and deformation of the structure. The results show that when the structure undergoes yield the structural responses under moving-ice loads are significantly different from those under stationary-ice loads.
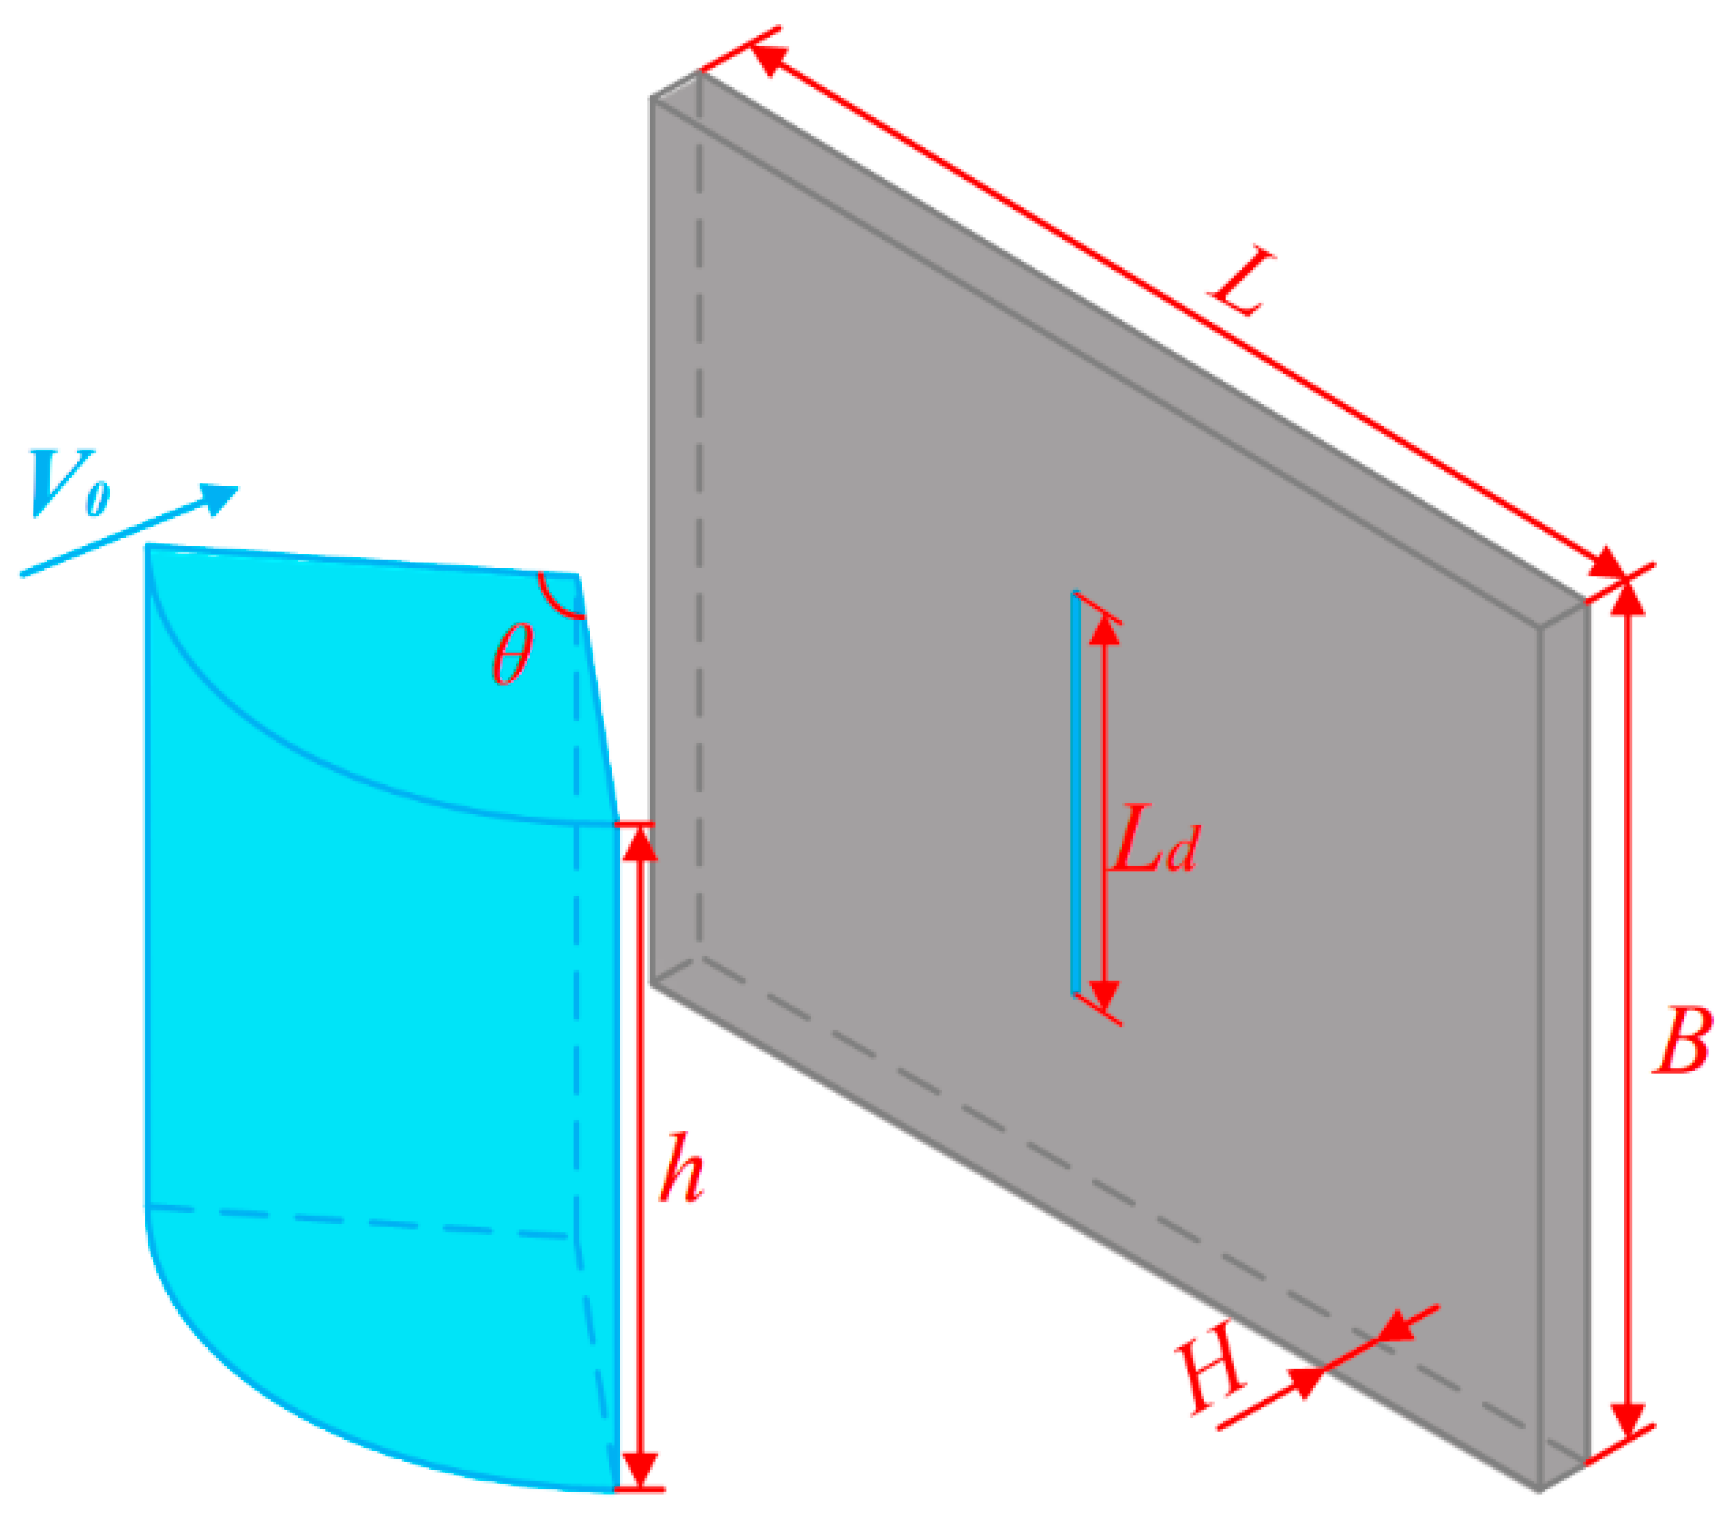
According to the above-mentioned literature review, some plastic-design methods have been developed for ship structures under local-static-uniformly distributed loads, which can be used to determine the plating thickness of the structure under ice-patch loading or wheel-patch loading. However, the ice-impact load is a dynamic response load, which is difficult to directly simplify or make equivalent to uniformly distributed loads. Moreover, it is unreasonable to assume the ice-impact load as a rigid-body-impact loading due to the influence of the ice damage. In view of the above problems, this paper establishes an analytical model for the dynamic responses of the vertical-side plates subjected to ice floe impacts. The impact scenario is shown in Figure 2, and the ice floe-impact position is in the mid-ice-belt area of the ship, as shown in Figure 3. On this basis, the design formula for the plating thickness based on the plastic design criteria has been further derived. Some design examples have been carried out to illustrate the proposed plastic-design method and some design curves created using some given parameters to determine suitable plating thickness for an ice-strengthened ship with an ice class of PC6 and PC7, and these are given in this paper according to different ice parameters.
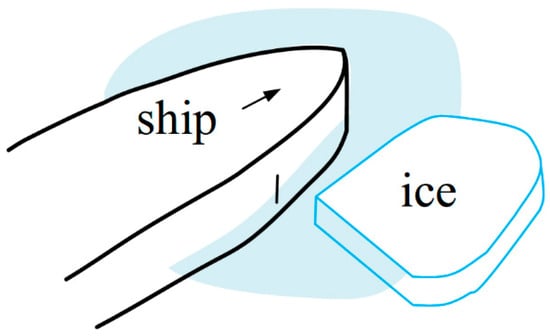
Figure 2.
Impact scenario between an ice floe and vertical-side structure.
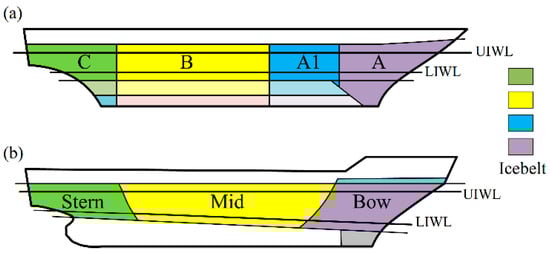
Figure 3.
Ice belt division in design rules: (a) RMRS rules; (b) DNV rules.
2. Theoretical Analysis Model for the Dynamic Response of a Ship Plate under Ice Floe Impact
2.1. Introduction to the Proposed Theoretical Model
When the ship plate is impacted by an ice floe, both the ship plate and the ice floe will deform or receive damage to absorb impact energy. An elastic-plastic deformation of the ship plate occurs. After the impact, the elastic energy absorbed by the ship plate will be released, which will produce a rebound phenomenon. Therefore, according to the energy conservation law, the energy-dissipation equation of the impact between the ice floe and ship plate [28] can be expressed as
where is the initial total impact energy, m0 is the initial ice mass and V0 is the initial relative velocity of the ice floe and structure; EI is the dissipated energy of the ice damage; Ep is the plastic-strain energy or absorbed energy of the ship plate; is the rebound-kinetic energy in the rebound process, where mr is the residual mass after ice impact, and Vr is the rebound velocity in the rebound process. In the impact process, the mass of ice floe-damage loss (m0 − mr) is a small amount for the initial ice mass m0. In the subsequent calculation, the residual mass mr after ice impact can be approximated as the initial mass m0.
For the ice-impact load, many scholars [40,41,42,43] use the pressure-contact area relationship (P–A relationship) to describe the local contact pressure between the ice floe and the structure. In this paper, the impact force-displacement expression is derived according to the P–A relationship, and then the impact force is integrated to obtain the energy absorbed by the ice crushing. Assuming the P–A relationship (), based on the impact scenario as shown in Figure 4, the impact force and ice dissipation energy can be calculated, respectively, as follows

Figure 4.
Geometrical parameters of wedge-shaped ice and ship plate.
In the formula: P is the average pressure of ice in the process of impact extrusion; P0 is the pressure with a contact area of 1 m2; An is the contact area; ex represents a constant; θ is the front-end angle of the wedge-shaped ice, δ is the ice-crushing length, and h is the ice thickness, as shown in Figure 4. In order to facilitate the analysis, the loss velocity parameter Vi caused by ice damage is defined. It is assumed that the relationship between the energy absorbed by ice and the kinetic energy lost due to ice damage is
In the impact process, the ice has a certain rebound velocity Vr after impact. The rebound-kinetic energy is smaller than the initial impact energy. Vr can be taken as αV0, α is the coefficient of restitution and the range of α is 0~0.3. The rebound-kinetic energy can be expressed as follows
According to the above analysis, considering the dissipated energy of the ice damage and the elastic effect of the ship plate, by combining Equation (1) we can determine that the net impact energy fully transformed into the plastic-strain energy of the ship plate is
where is the initial net impact velocity, .
Generally, in the elastic-plastic-response analysis of the ship’s structure under ice-impact loading, the stiffeners in the side of the panel are a strong boundary relative to the plate. In addition, the stiffeners need to be kept in an elastic range in the structural design to maintain their high load-bearing capacity during ice impact, so the stiffened structure model can be simplified as a single panel with a fixed-support boundary. Based on the rigid-plastic theory, which considers the influence of ice damage and the elastic effect of material, the theoretical method of dynamic response of the ship plate under ice floe impact is developed. The deformation mode of the ship plate under ice impact refers to the experimentally obtained deformation mode of the plate under wedge-shaped-ice impact [28]. The plastic-dynamic-response equation for the ship plate is expressed as
where w is the plastic deformation of the plate; μ = ρH is the unit-area density of the plate, where ρ is the density and H is the plating thickness. A is the integral of the ship-plate-deformation area; Mp and Np are the bending moment and membrane force of the plastic hinge line per unit length, respectively. is the relative angular velocity between adjacent rigid plates; lm is the length of the plastic hinge line and s is the number of plastic hinge lines. In Equation (7), the first term on the left is the work power of the external impact force, and the second term represents the inertial dissipation power of the plate. The right side of the equal sign represents the internal energy-dissipation rate caused by the bending moment and the membrane force of the plastic hinge lines. For the bending moment Mp and the membrane force Np, Mp = ζM0, Np = ζN0, where is the ultimate plastic-bending moment per unit length; is the ultimate plastic-membrane force per unit length, and σs is the yield strength of the material. ζ is determined by the square yield surface. According to [28], the theoretical upper bound of plastic deformation based on the inscribing-square-yield condition is closer to the experimental value. Therefore, the inscribed yield line is used in this paper, and ζ = 0.618.
According to the deformation mode of the ship plate, each parameter is substituted into Equation (7) to obtain
where
In Equations (8)–(10), wc is the plastic deformation at the center of the plate and Ld is the length of the middle plastic hinge line. For the wedge-shaped-rigid-mass impact, the hinge line length Ld is equal to the impactor height h. However, for the ice floe impact, the ice body will experience deformation and damage during the impact process. The length of the middle plastic hinge line is smaller than the ice thickness h, since the top and bottom tips of the wedge-shaped ice body are prone to breaking during impact. Therefore, a damage coefficient ω is defined to consider the influence of ice damage along the height direction, and Ld = ωh. The value range of ω is 0.6~0.75. η2 and γ are the intermediate values in the calculation process.
Equation (8) is a second-order nonhomogeneous linear differential equation, and its initial conditions are as follows
then, we can obtain the analytical expression wc(t) of the plastic deformation at the center with respect to time of the ship plate, so that the maximum plastic deformation wm and the maximum impact force Fm of the plate under ice impact can be derived as follows
where V0′ is the initial net impact velocity, .
When the loss velocity parameter Vi due to ice damage is zero, Equations (13) and (14) can be used to obtain the maximum plastic deformation wm and the maximum impact force Fm of the plate under rigid-mass impact.
However, for ice impact, it is necessary to give the force balance equation. According to Newton’s third law, the maximum impact force should also be equal to the force obtained by the P–A relationship, so we obtain
where δm is final crushing length of ice.
In summary, combining Equations (4), (13) and (15), the parameters wm, δm, Fm, Ei and EP can be obtained. Figure 5 is a diagram to introduce the theoretical model of the dynamic response of ice floe–plate impact.
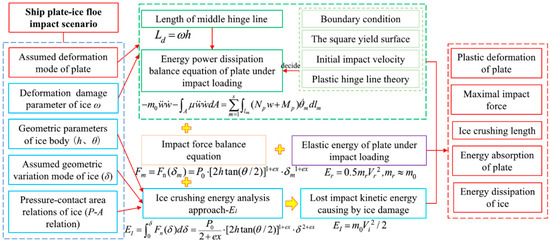
Figure 5.
A diagram to introduce the theoretical model of the dynamic response of ice floe–plate impact.
Moreover, based on the simplified ice–structure impact scenario in Figure 4, the used range of the proposed analytical model is summarized as follows:
- -
- Head-on impacts of an ice floe with a vertical plate structure;
- -
- Ignoring the effects of ship motion and ice rotation during impact;
- -
- The assumed boundary condition of plate structure is fully clamped.
2.2. Theoretical Model Verification
- Rigid-mass impact
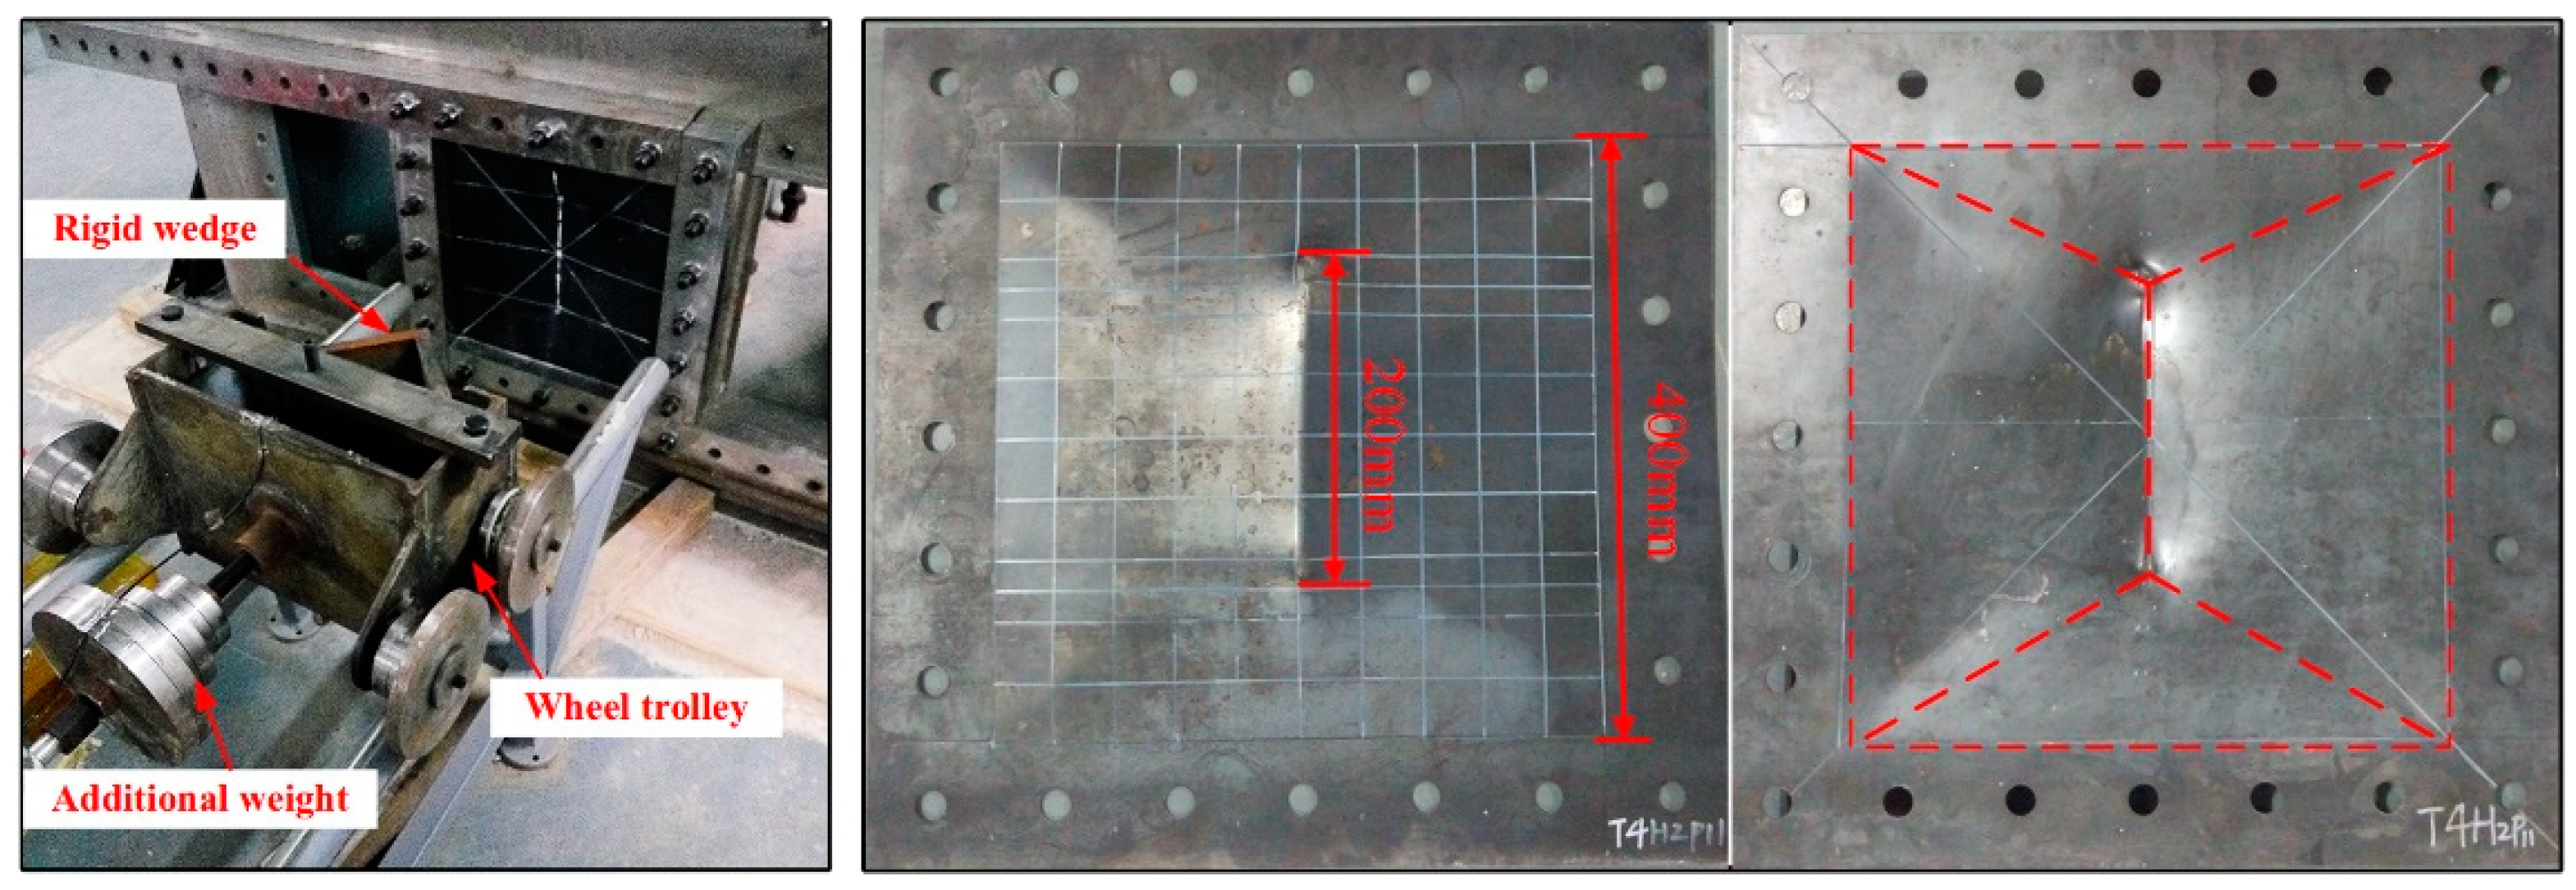
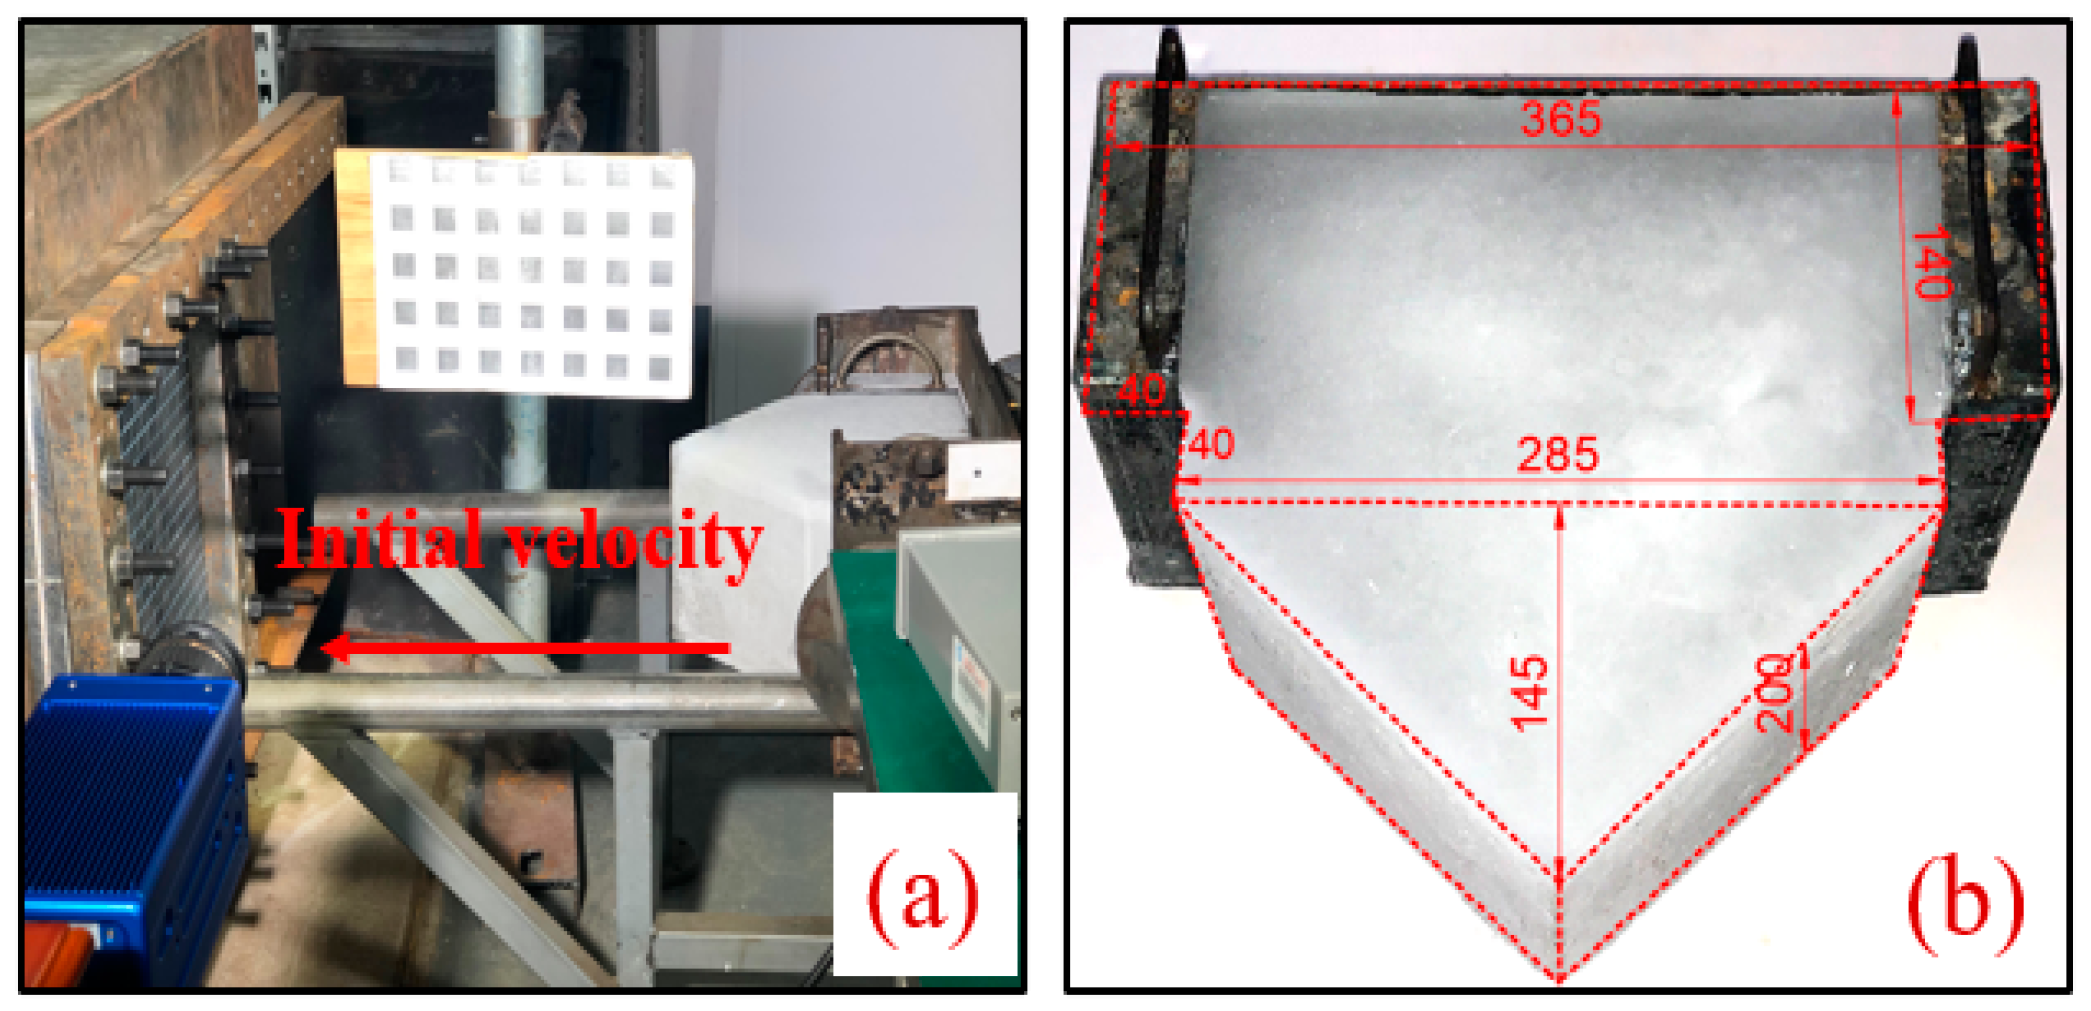
In order to verify the accuracy of theoretical model of the ship plate under rigid-mass impact, the impact tests between the rigid-wedge impactor and the steel plate were carried out. The experimental device is the same as that for ice impact, as shown in Figure 6. The height of the impactor is 200 mm, the length of the hinge line of the test plate after the impact is the same as the height of the impactor. Table 2 gives the material parameters of the test plate. Table 3 gives the dimensions of the test plate, impact mass, impact velocity, rebound velocity and the comparison of results for the plastic deformation of test plates from experiments and from the theoretical model. The theoretical results are basically consistent with the experimental results, which verifies the accuracy of the theoretical model.
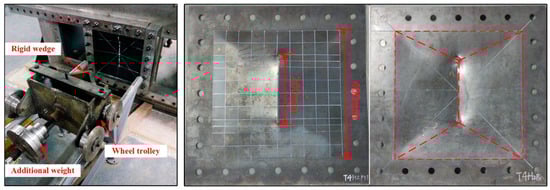
Figure 6.
Rigid-mass-impact experimental device and test-plate-deformation mode.
Table 2.
Material parameters of the steel plate specimen.
Table 3.
Experimental and theoretical results under rigid-mass impact.
- Ice impact
Cai et al. [13] carried out some wedge-shaped-ice–plate impact tests that can provide some validated data for the accuracy of the theoretical model in this paper. The experimental set-up used in the experiment is shown in Figure 7. The material parameters of the plate specimen used in the experiments are shown in Table 2. Table 4 gives the dimensions of the plate specimen, the impact mass and the initial impact velocity.

Figure 7.
(a) Experimental set-up of ice–plate impact and (b) ice sample geometry dimensions (unit: mm) [28].
Table 4.
Experimental and theoretical results of ice–plate impact.
Figure 7 shows the geometric dimensions of the wedge-shaped ice with a front-end angle of 90°. Cai et al. [28] used the same ice sample preparation method as [13] to make ice samples with the same geometric size, and they carried out ice-impact tests on a rigid plate. The P–A relationship (pressure P is in units of MPa and contact area A is in units of m2) of the ice sample based on experimental data was fitted as follows
The ice deformation damage coefficient ω is set as 0.65 in the theoretical analysis based on experimental observations. Table 4 compares the theoretical analysis results and experimental results for plastic deformation w, and the error is around 10%. The theoretical results are in good agreement with the experimental results, which verifies the accuracy of the theoretical model.
2.3. Comparative Analysis of Theoretical Results of Ice Impact and Rigid-Mass Impact
In this section, the head-on impact scenario with the typical side structure and the ice floe is selected in order to compare and analyze the theoretical results of ice impact and rigid-mass impact. The side structure of the midship is a transversely framed structure with a framing spacing of 0.6 m. The plate height is 1.2 m and the plating thickness is 25 mm. The ship plate material is polar cryogenic steel and its material parameters, which are referred to the test data of Q390D steel, are shown in Table 5. The initial impact velocity V0 is 4~6 m/s, and the impact position is assumed to be at the center of the ship plate. The mass of ice or rigid body m0 is 15,000 kg. For ice impact, the ice floe is assumed to be wedge-shaped ice with a front-end angle of 90°, the ice thickness h is taken as 0.6 m, the ice damage coefficient ω is taken as 0.6 and the coefficient of restitution α of the ice floe is taken as 0.1. For rigid-mass impact, the impactor is a wedge-shaped rigid body and the height is 0.6 m, which is as high as the ice thickness. The coefficient of restitution α of the rigid impactor is 0.5 according to the experiment. The P–A relationship of ice obtained from the DNV rules [2] is used, and its expression is
where C is the parameter related to the ice strength and the ice belt region, . σice is nominal ice strength and FA is the coefficient related to the ice belt, where A is the contact area between the ice and the ship plate. The value range of the parameter C corresponding to the ICE-05 and ICE-10 ice classes is 1.4~1.95. The parameter C is taken as 1.7 in this section. Therefore, the P–A relationship is
Table 5.
Material parameters of the polar cryogenic Q390D steel.
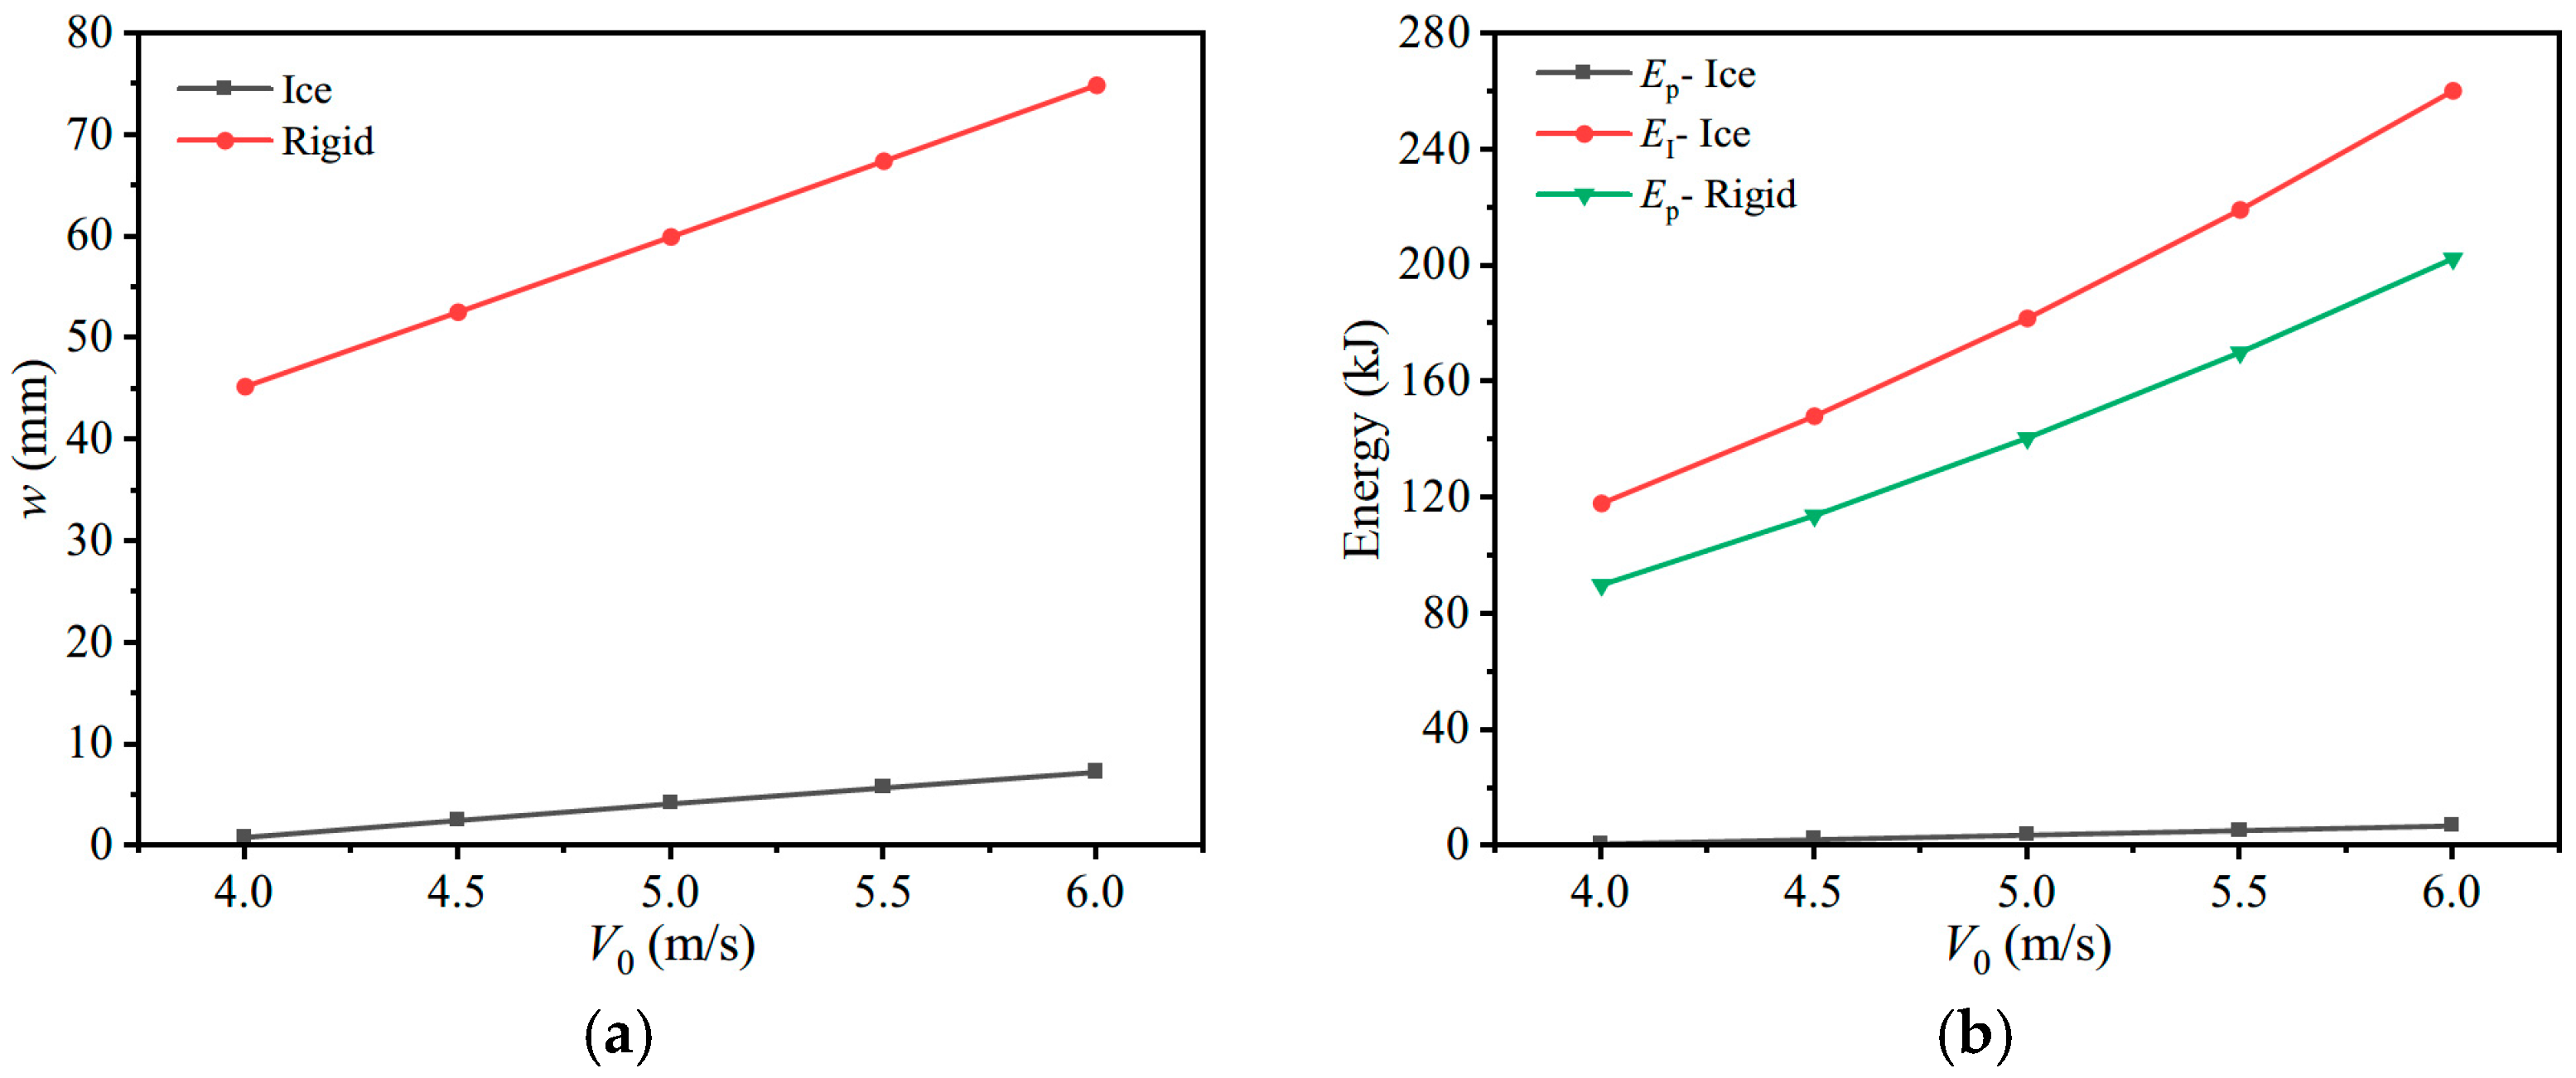
Figure 8 shows the plastic deformation and energy absorption under ice impact and rigid-mass impact conditions. From Figure 8a, the plastic deformation of the plate under ice/rigid impact increases approximately linearly with the increase in velocity. It can be seen from Figure 8b that the energy absorbed by each part of the impact system increases with the increase in velocity. The plastic-strain energy of the ship plate under ice impact is much smaller than that under rigid-mass impact. This shows that during impact, the ice damage will absorb most of impact energy, so that a small part of the impact energy is absorbed by the ship plate by undergoing plastic deformation.
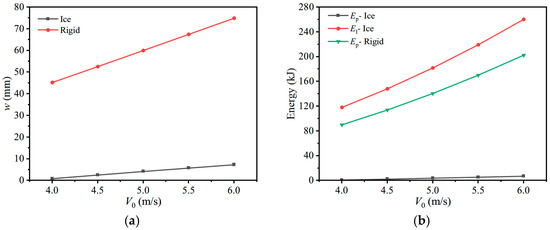
Figure 8.
Comparison of plastic deformation and energy absorption between ice impact and rigid-mass impact. (a) Plastic deformation; (b) Energy absorption.
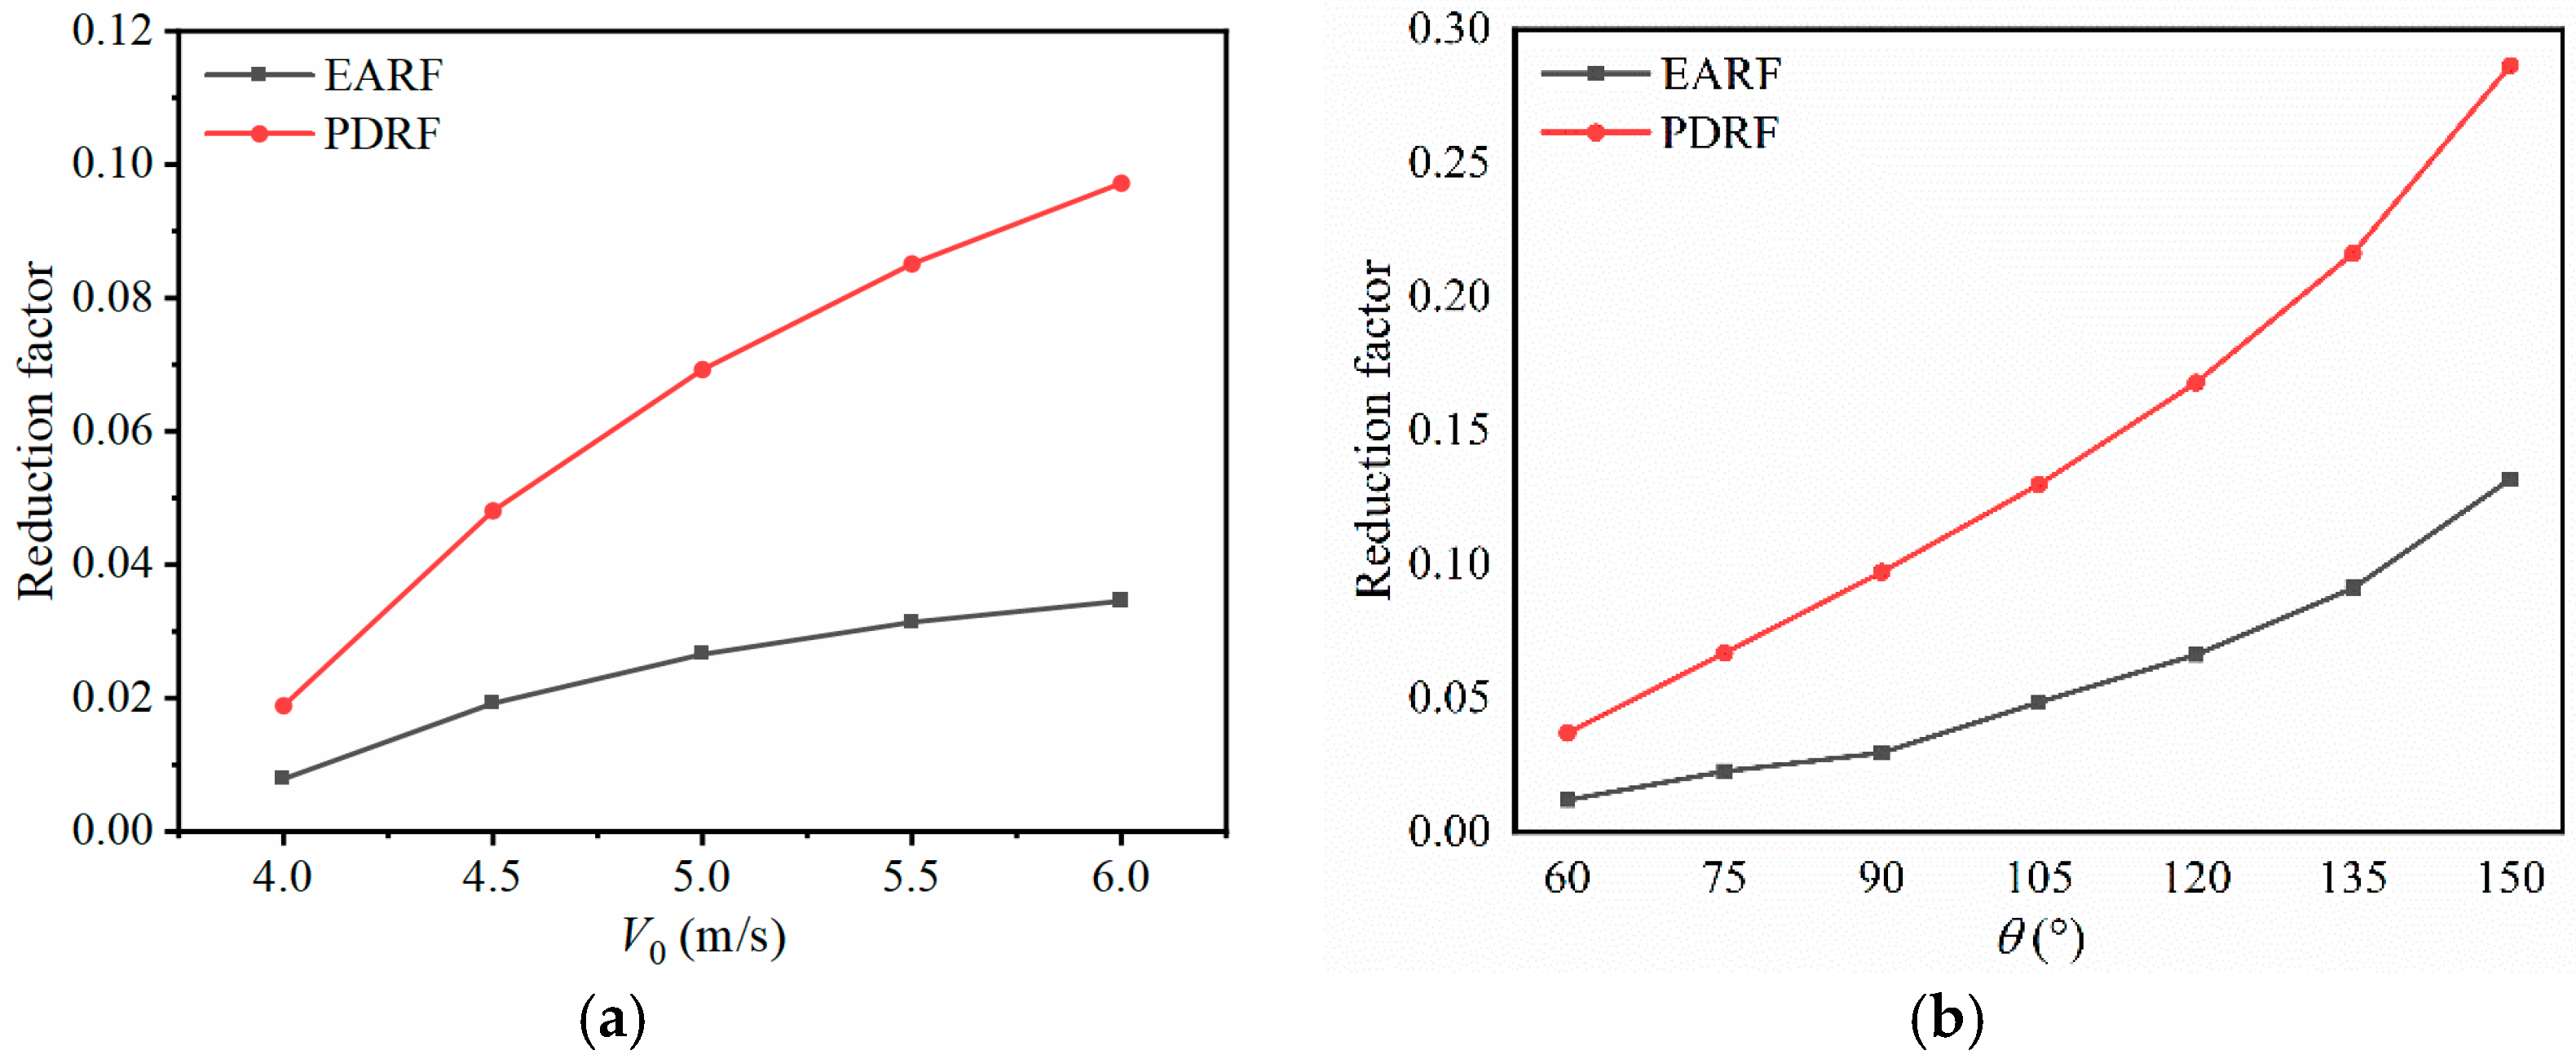
In order to further study the energy-absorption difference of the ship plate under the impacts of ice and rigid body, and under the influence of absorption energy owing to ice damage on the plastic deformation of the ship plate, the energy-absorption reduction factor (EARF) [12] and the plastic deformation reduction factor (PDRF) [44] of the ship plate are introduced as follows
where Epi is the plastic-strain energy of the ship plate under ice impact and Eps is the plastic-strain energy of the ship plate under rigid-mass impact. wpi and wps are the plastic deformation of ice impact and rigid-mass impact, respectively.
Figure 9a shows the relationship between the reduction factor and the impact velocity. It can be found that, with the increase of the impact velocity, the energy-absorption reduction factor and the plastic deformation reduction factor also increase gradually but the growth rate decreases gradually. Figure 9b shows the relationship between the reduction factor and the front-end angle of the ice floe. It demonstrates that EARF and PDRF increase with the increase in the angle, and that the growth rate is also increasing. It can be seen from Figure 9 that, compared with rigid-mass impact, the absorption energy owing to ice damage reduces the plastic-strain energy and plastic deformation of the ship plate during ice–plate impact.
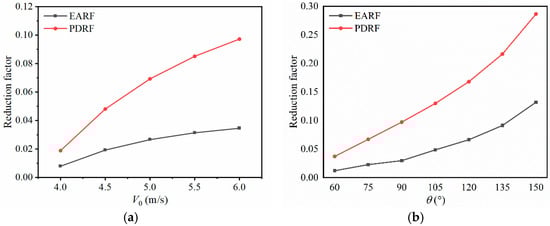
Figure 9.
Reduction factor (EARF, PDRF) of the ship plate. (a) Relationship between the reduction factor and the impact velocity; (b) Relationship between the reduction factor and the front-end angle.
According to Equation (6), the energy-absorption reduction factor of the ship plate can be expressed as
where and are the initial net impact velocities under ice impact and rigid-mass impact, respectively.
According to Equation (13), the relationship between the initial net impact velocity and the plastic deformation of the ship plate can be obtained as follows
The relationship between the energy-absorption reduction factor and the plastic deformation reduction factor can be obtained by comparing the Equation (22) corresponding to the ice/rigid impact.
where αi and αs are the coefficients of restitution of ice impact and rigid-mass impact, respectively; a1, a2 and a3 are constants related to plate size, ice height, and ice damage parameters, respectively, as follows
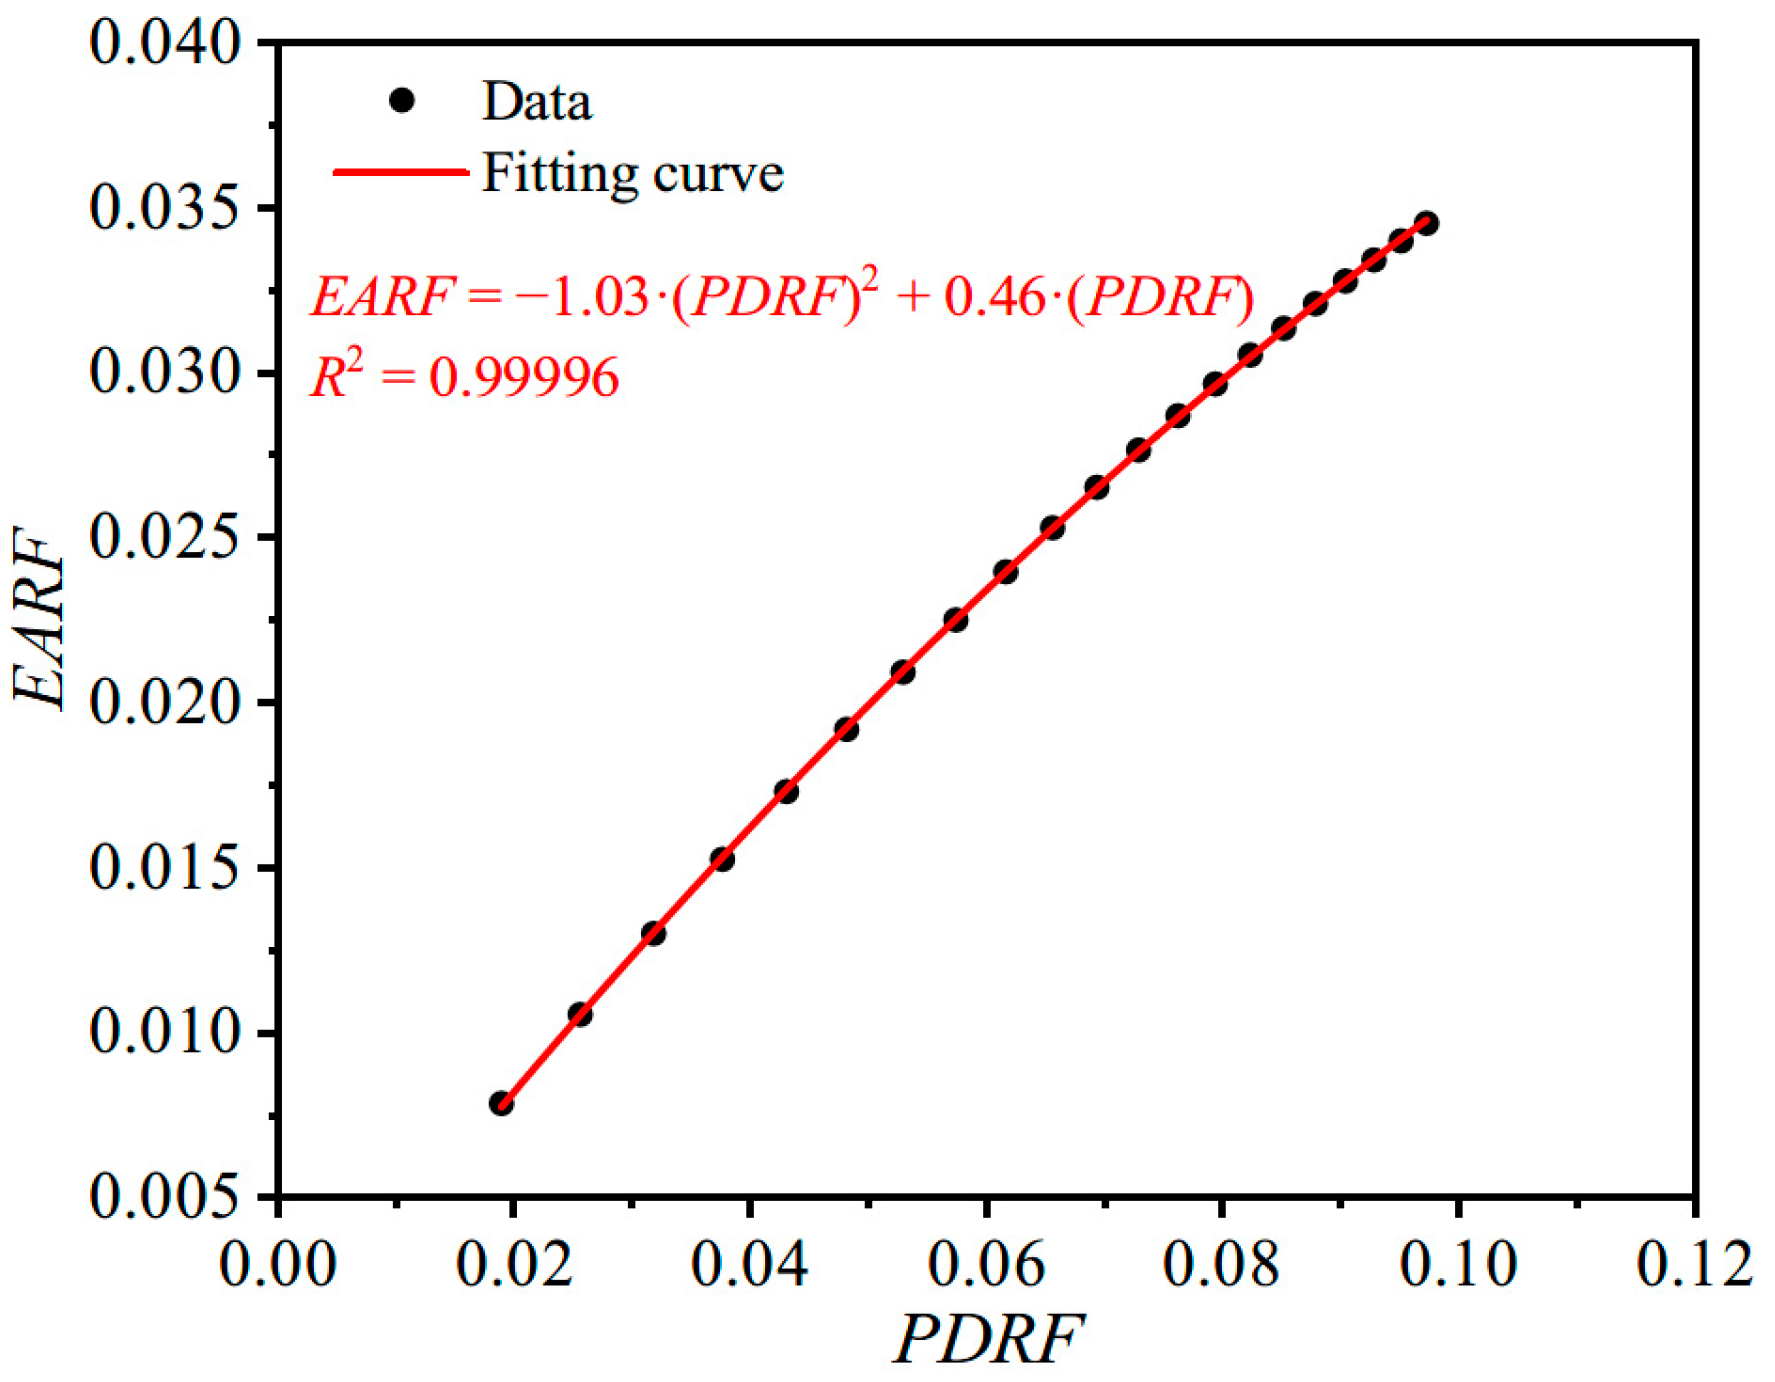
Figure 10 is the curve fitting the energy-reduction coefficient to the plastic deformation reduction factor, and it gives the fitting formula, . Combined with Equation (23) and Figure 10, EARF changes parabolically with the ratio of plastic deformation. The plastic-strain energy of the ship plate under ice impact can be estimated by the ratio of plastic deformation and the plastic-strain energy of the ship plate under rigid impact.
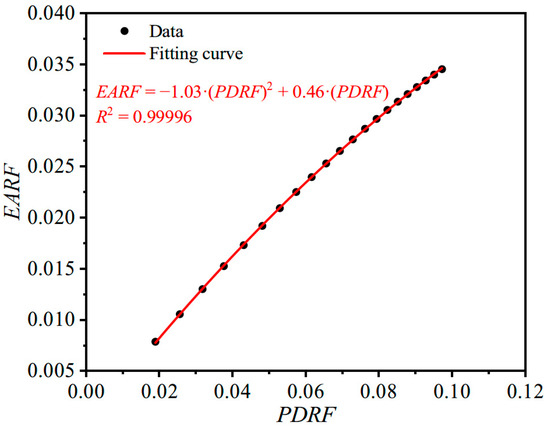
Figure 10.
The energy-absorption reduction factor.
3. Design Formula for Plating Thickness under Ice-Impact Load
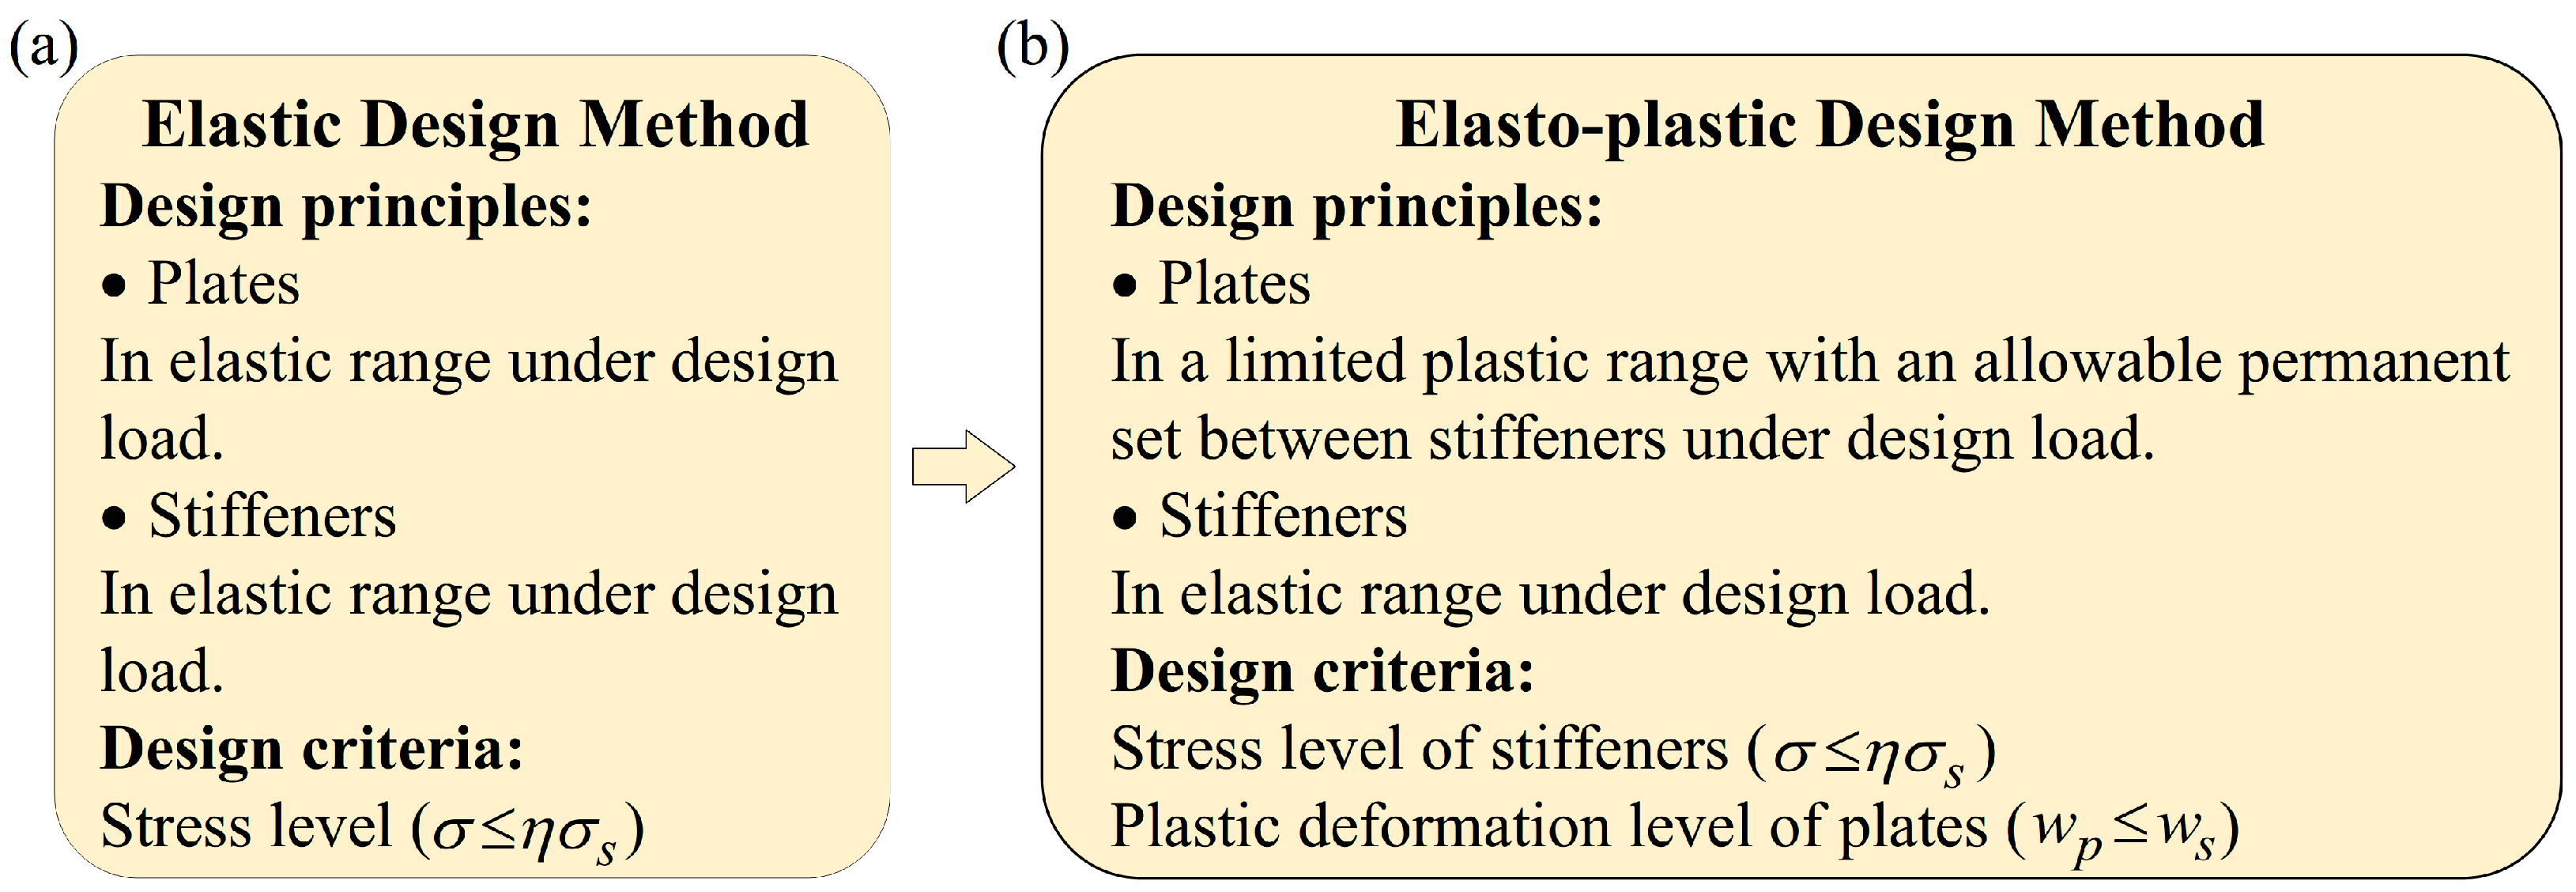
The design principles and the criteria guiding the design of ship structures have evolved over time. Initially, the elastic design method was used in ships’ structural design, as shown in Figure 11a. The design criteria in the elastic design method are the maximum allowable stress determined by the yield strength of the material and a defined safety factor. Using the elastic design method, the design dimensions of the structure will be too large, which makes the design’s weight heavier and increases the high cost of ship construction. The elastic theory applies in plate design only if the plate material does not yield. However, the load that causes the ship plate to yield does not represent the maximum load that the plate can withstand. The plate can withstand loads several times greater than the yield strength before failure or large deformation occurs [29]. For the safety of a ship’s strength structure, recognizing that a structure with small plastic deformation still has high structural strength means that it is acceptable for the ship to occasionally undergo small plastic deformation during navigation and operation in an icy region. Therefore, it is significant to develop the plastic design method based on a maximum allowable-permanent set. In the plastic design method, the determination of allowable-permanent-set criteria is related to the operability, reliability and safety of ship structures. Therefore, it is necessary to find the optimal critical value among structural operability, safety and construction cost and so on. The plastic design criteria of the ship’s structure is shown in Figure 11b. Based on the plastic design method, this paper proposes a plastic design formula for determining the preferred plating thickness under ice floe impact.
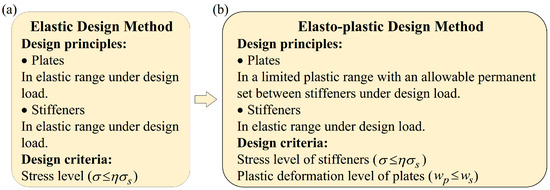
Figure 11.
Design method of ship structure: (a) the elastic design method; (b) the elastic-plastic design method [37].
According to Equation (13), under a given plastic deformation the thickness of the plate can be obtained. The allowable-permanent set ws is substituted into the Equation (13) to obtain the Equations (29) and (30).
The intermediate values η2 and γ are
where ; φ1, φ2 are dimensionless coefficients related to the dimensions of the ship plate and the length of the middle hinge line, as follows
Substituting Equations (31) and (32) into Equation (30), the parabolic equation of the plating thickness H is obtained as follows
According to the formula of root, the analytical formula of plating thickness is obtained as follows
In the formula , when Vi = 0, the thickness of the plate under rigid-mass impact can be directly obtained. When Vi ≠ 0, the plating-thickness design formula under ice impact cannot be obtained by using only Equation (34). Therefore, the force balance equation and the ice damage absorption energy equation should be introduced on this basis, that is,
The ratio of Equation (36) to Equation (35) shows that the relationship between the damage length of ice floes and the velocity is
From Equation (29), we can obtain
Substituting Equation (38) into Equation (37), the relationship between the crushing length of ice floe and the ice loss velocity parameters Vi is obtained
Substituting Equations (38) and (40) into Equation (35), we get
Substituting Equation (39) into Equation (41), the relationship between the allowable-permanent set ws and the intermediate values η2 and γ related to the plating thickness H is obtained
Let , then Equation (42) can be written as follows
Substituting Equations (31) and (32) into Equation (44), we get
then the implicit expression of plating thickness H is obtained
where is a small amount relative to the initial mass m0 of the ice floe. Therefore, this can be ignored and removed in Equation (46). The theoretical formula of the plating thickness H can be obtained as expressed in Equation (47). According to Equation (47), the numerical solution of the design’s thickness for the ship plate can be calculated.
4. Plating-Thickness Design Cases
4.1. Plating-Thickness Design Procedure
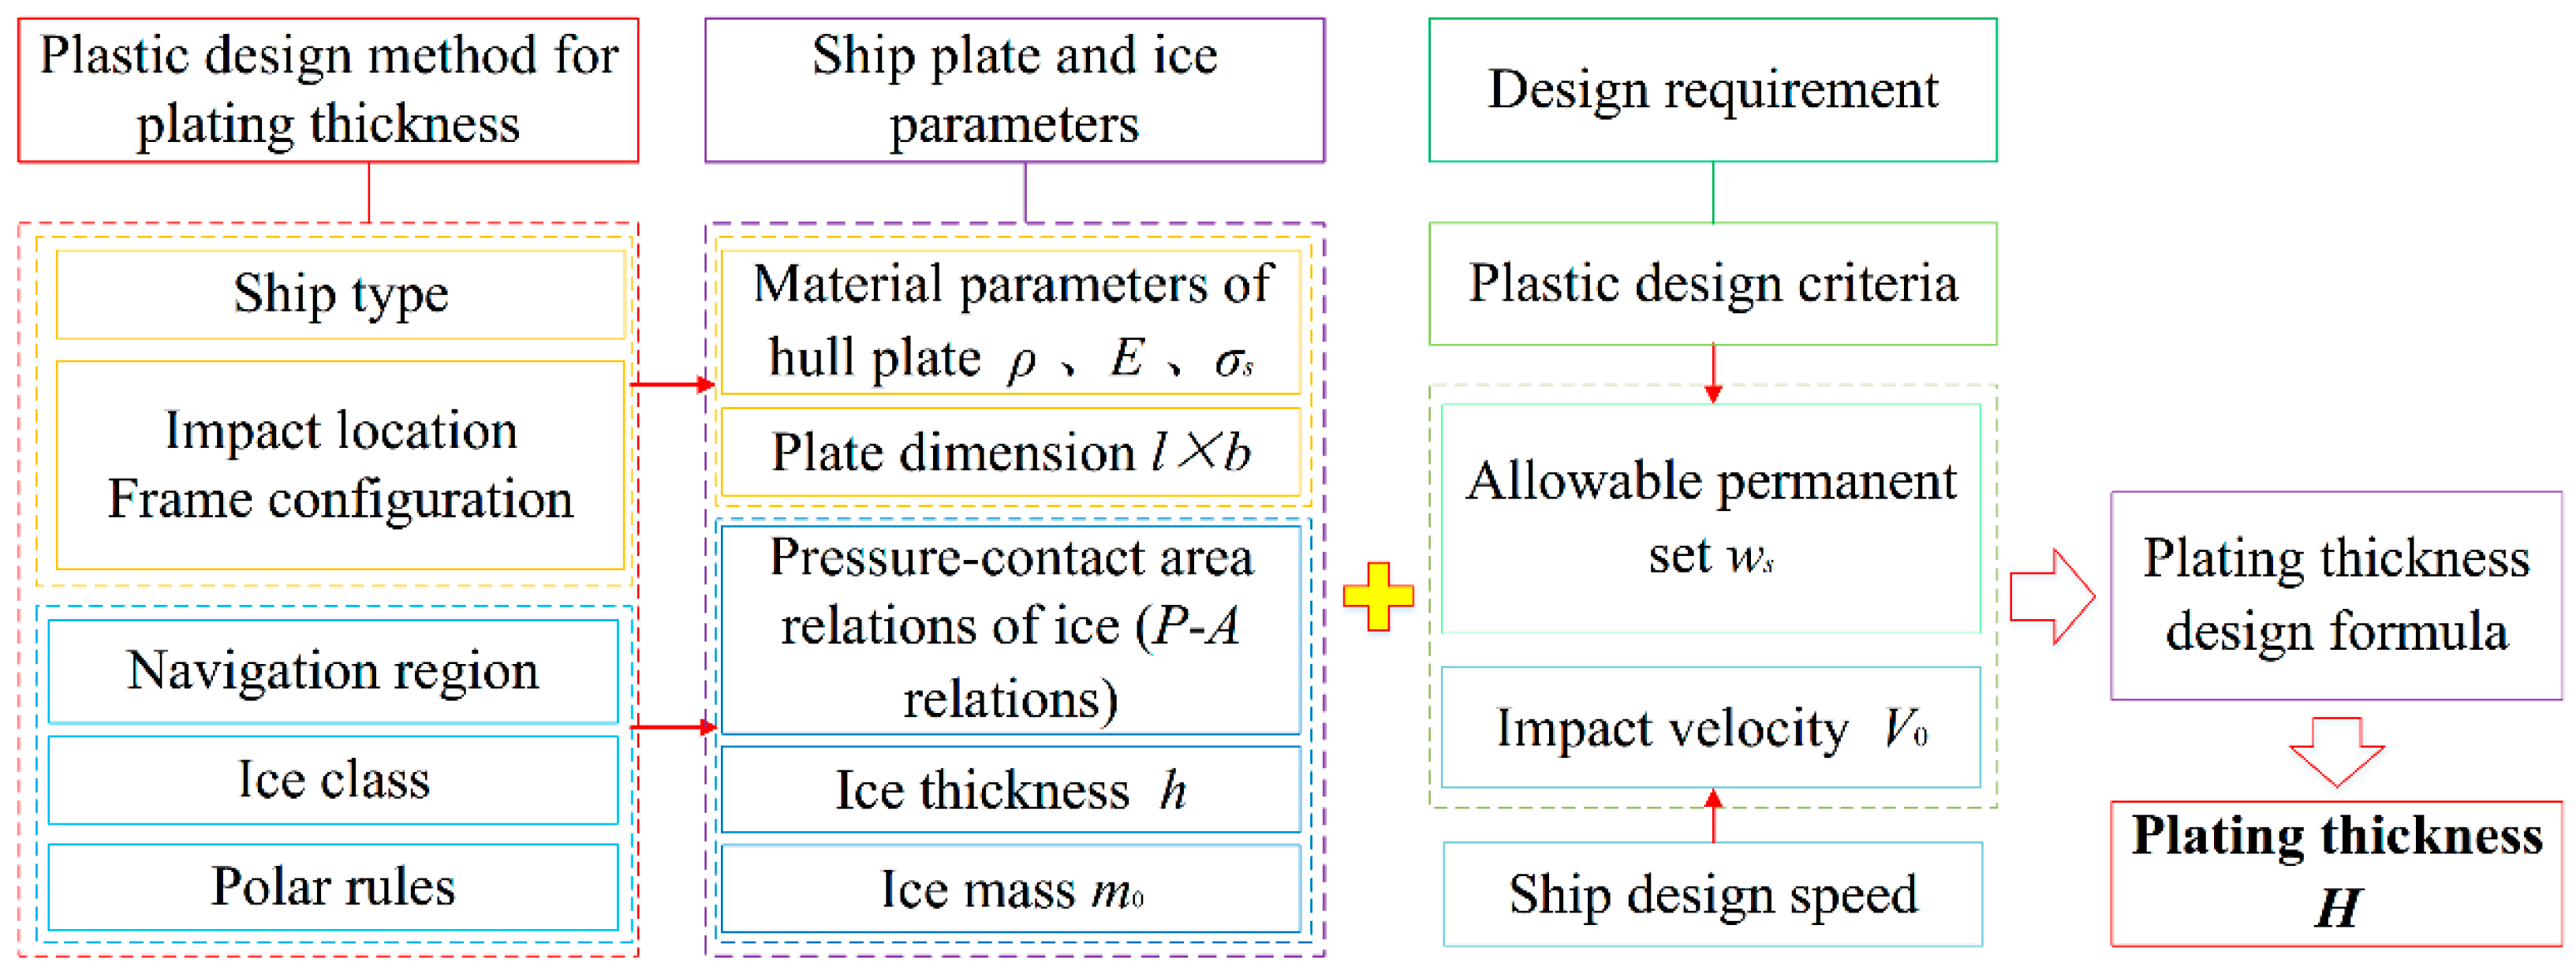
Based on the above design formula for plating thickness, the design procedure for the plating thickness of the vertical-side plate of a polar ship under ice floe impact is given, as shown in Figure 12. In order to calculate the thickness of the side plate, the related input parameters of ice–structure impact should be provided according to the ship type, ice class, the impact location and the ice condition in the navigation region, and then the impact velocity V0 and the allowable-permanent set ws of the ship should be determined according to the actual service condition. Finally, the above parameters are substituted into the plating-thickness design formula and the minimum designed plating thickness is obtained by numerical solution.
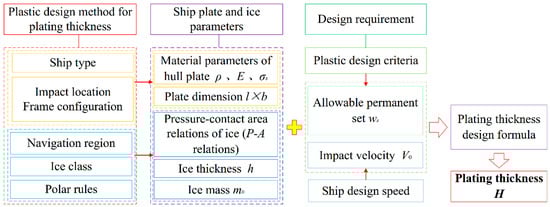
Figure 12.
A diagram to introduce the plating-thickness design procedure.
This section considers the head-on impact scenario with a typical side structure of an ice-strengthened ship and an ice floe as an example to illustrate the design procedure. The side structure of the midship is transversely framed, with a framing spacing of 0.6 m and a plate height of 1.2 m. The material of the ship plate is selected as polar cryogenic steel, and its material parameters are shown in Table 5. The mass of ice floes affects the total energy input in the impact system. Most of the ice floes in the navigation ice area applied in this paper are thin first-year ice, and the mass range is assumed as 1000~30,000 kg. The geometry of the ice feature is very important for an ice–structure impact scenario. In order to simplify the theoretical analysis of the ice–structure interaction in the impact process, a typical wedge-shape of ice floe is chosen and used in the analysis as shown in Figure 4. The geometric parameters of wedge-shaped ice mainly include ice thickness and front-end angle. In this paper, the ice thickness is 0.74 m and the front-end angle is 120°. The described in Section 2.3 and obtained from the DNV rules is adopted in this section.
The dimensionless allowable-permanent set parameter Cw is used to represent the allowable plastic deformation degree of the ship plate, which is defined as follows
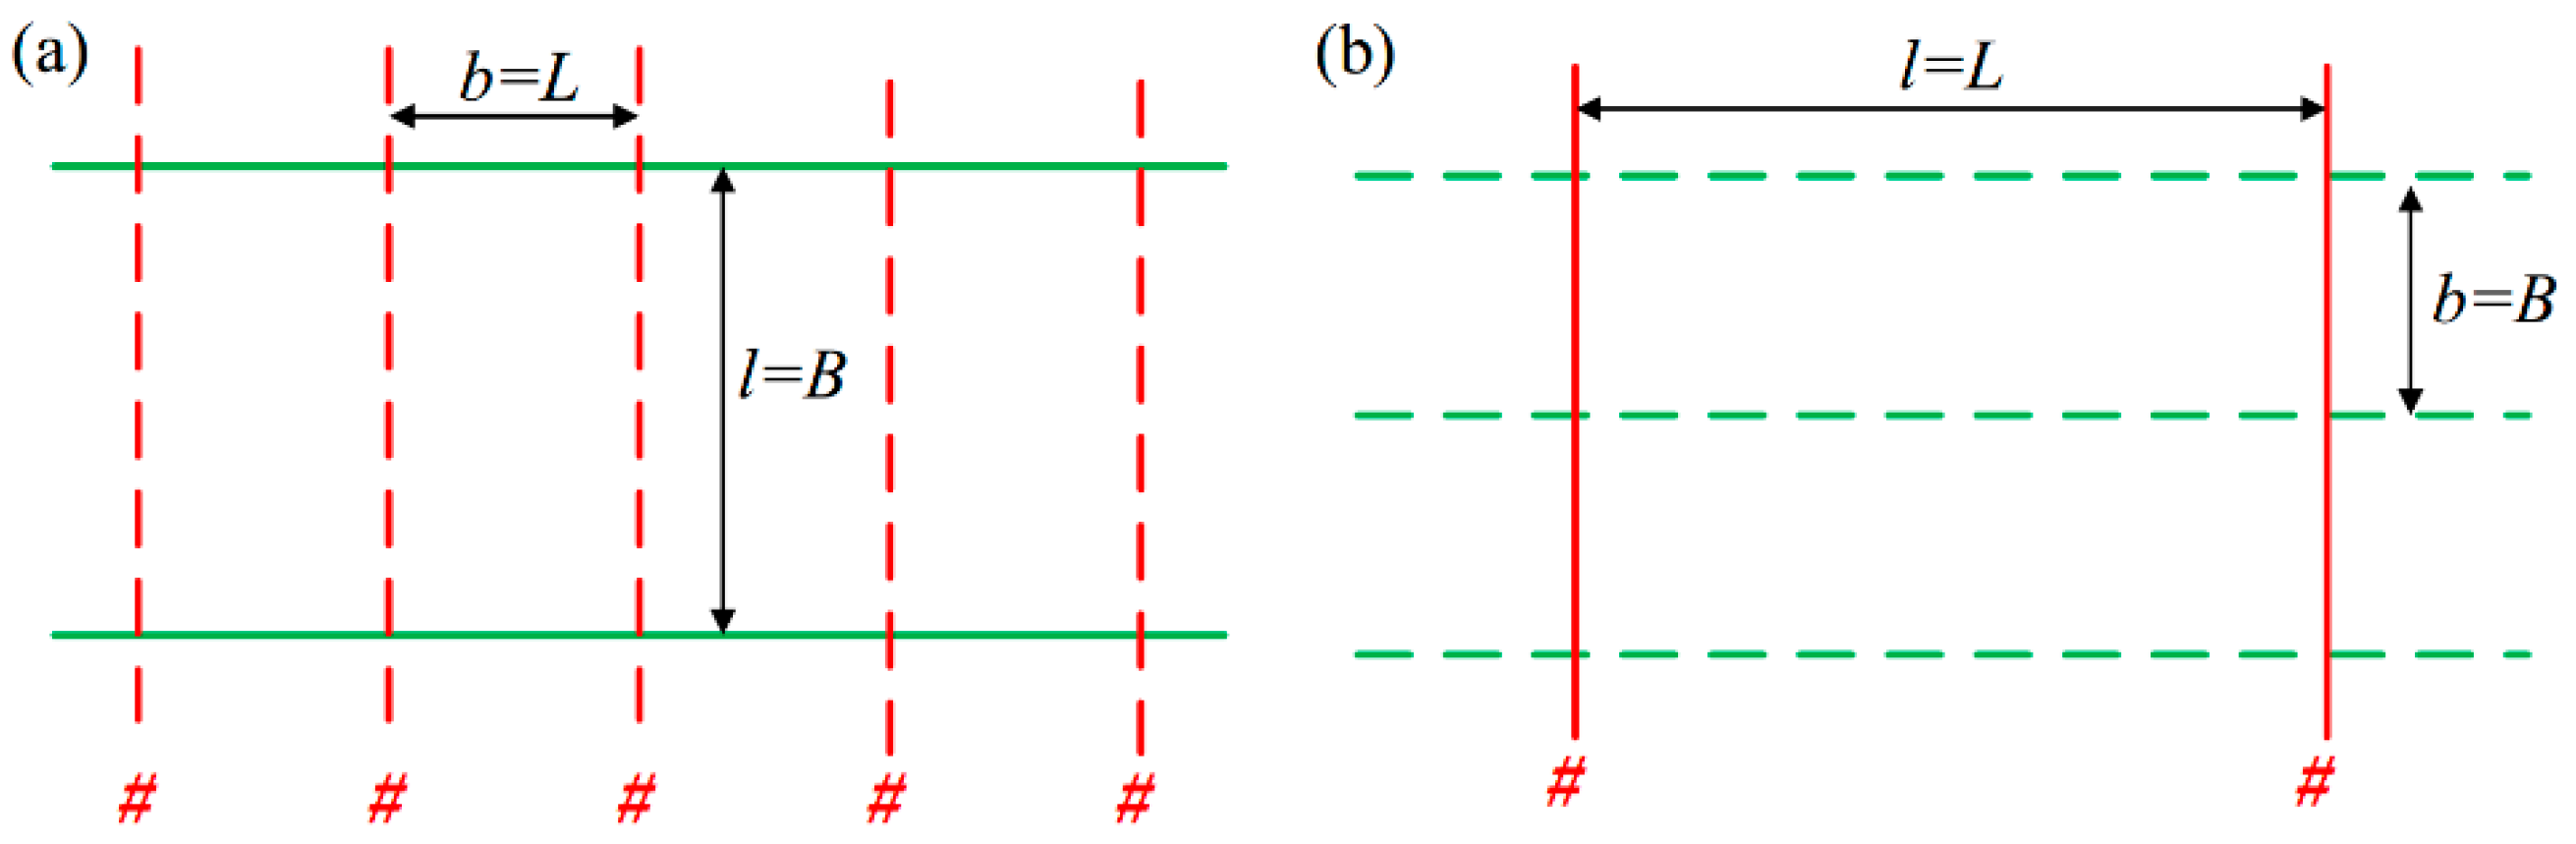
where b is the short side length of the panel. In general, the value range for the allowable-permanent set ws of the plate is 0~b/50 [29]. For different frame structures, the dimension parameter definitions in the corresponding design formulas of the plate width as shown in Figure 13. In this section, it is transversely framed, so b = L = 600 mm. According to the material parameters and the allowable-permanent set range, the range of Cw is determined to be 0.1~0.5.
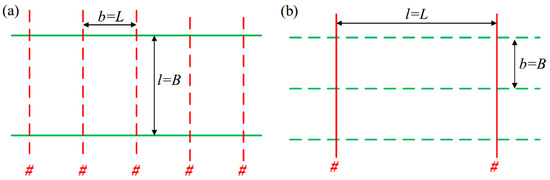
Figure 13.
Vertical-side structure with different frame configurations: (a) transversely framed structure; (b) longitudinally framed structure.
Therefore, according to the above parameters and the damage coefficient ω of the ice is 0.6, the impact velocity is 2.25 m/s and the coefficient of restitution α is taken as 0.1. The allowable-permanent set parameter Cw is 0.3. According to Equation (47), the design value of plating thickness is 18.3 mm.
4.2. Design Curves under Different Design Parameters and Cases
In this section, the head-on impact scenario with the typical side structure of an ice-strengthened ship and an ice floe is selected to design the plating thickness, and the plating-thickness design curves under different working conditions are given. The side structure of the midship with transversely-framing spacing of 0.6 m is selected, and the aspect ratio of the plate is 2. The ship plate is made of polar cryogenic steel material, and the material parameters are shown in Table 5. The range for the ice floe mass is 1000~30,000 kg, the damage coefficient ω of ice is 0.6, the range of impact velocity is 3~8 m/s, and the coefficient of restitution α of ice is 0.1. The following section will give the H-V0 design curves under different cases and some parameter-influence analysis for the designed plating thickness.
4.2.1. Case 1. Different Ice Strengths (P–A Curves)
In this condition, the ice mass m0 is taken as 15,000 kg, the ice thickness h is taken as 0.74 m, the front-end angle θ is taken as 120° and the allowable-permanent set parameter Cw is taken as 0.3.
The P–A relationship is generally obtained by fitting the experimental data, which is a macroscopic characterization of the mechanical properties of ice materials and has different applicable conditions. A series of P–A relationships are summarized in Table 6.
Table 6.
P–A relationships (the units of P and A are MPa and m2, respectively).
The influence of ice strength on plating-thickness design will be examined by taking the P–A relationship within DNV rules as an example. The P–A relationship of ice obtained from the DNV rules [2] is expressed as
where C is the parameter related to the ice strength and the ice belt region, . σice is nominal ice strength and FA is the coefficient related to the ice belt, and, where A is the contact area between the ice and the ship plate. In general, FA is 0.6 for a midship area. For ships with ice classes of ICE-05 and ICE-10, the nominal strength σice is 4.2 MPa and 5.6 MPa, respectively. Therefore, the value range of the parameter C corresponding to the ICE-05 and ICE-10 ice classes is 1.4~1.95.
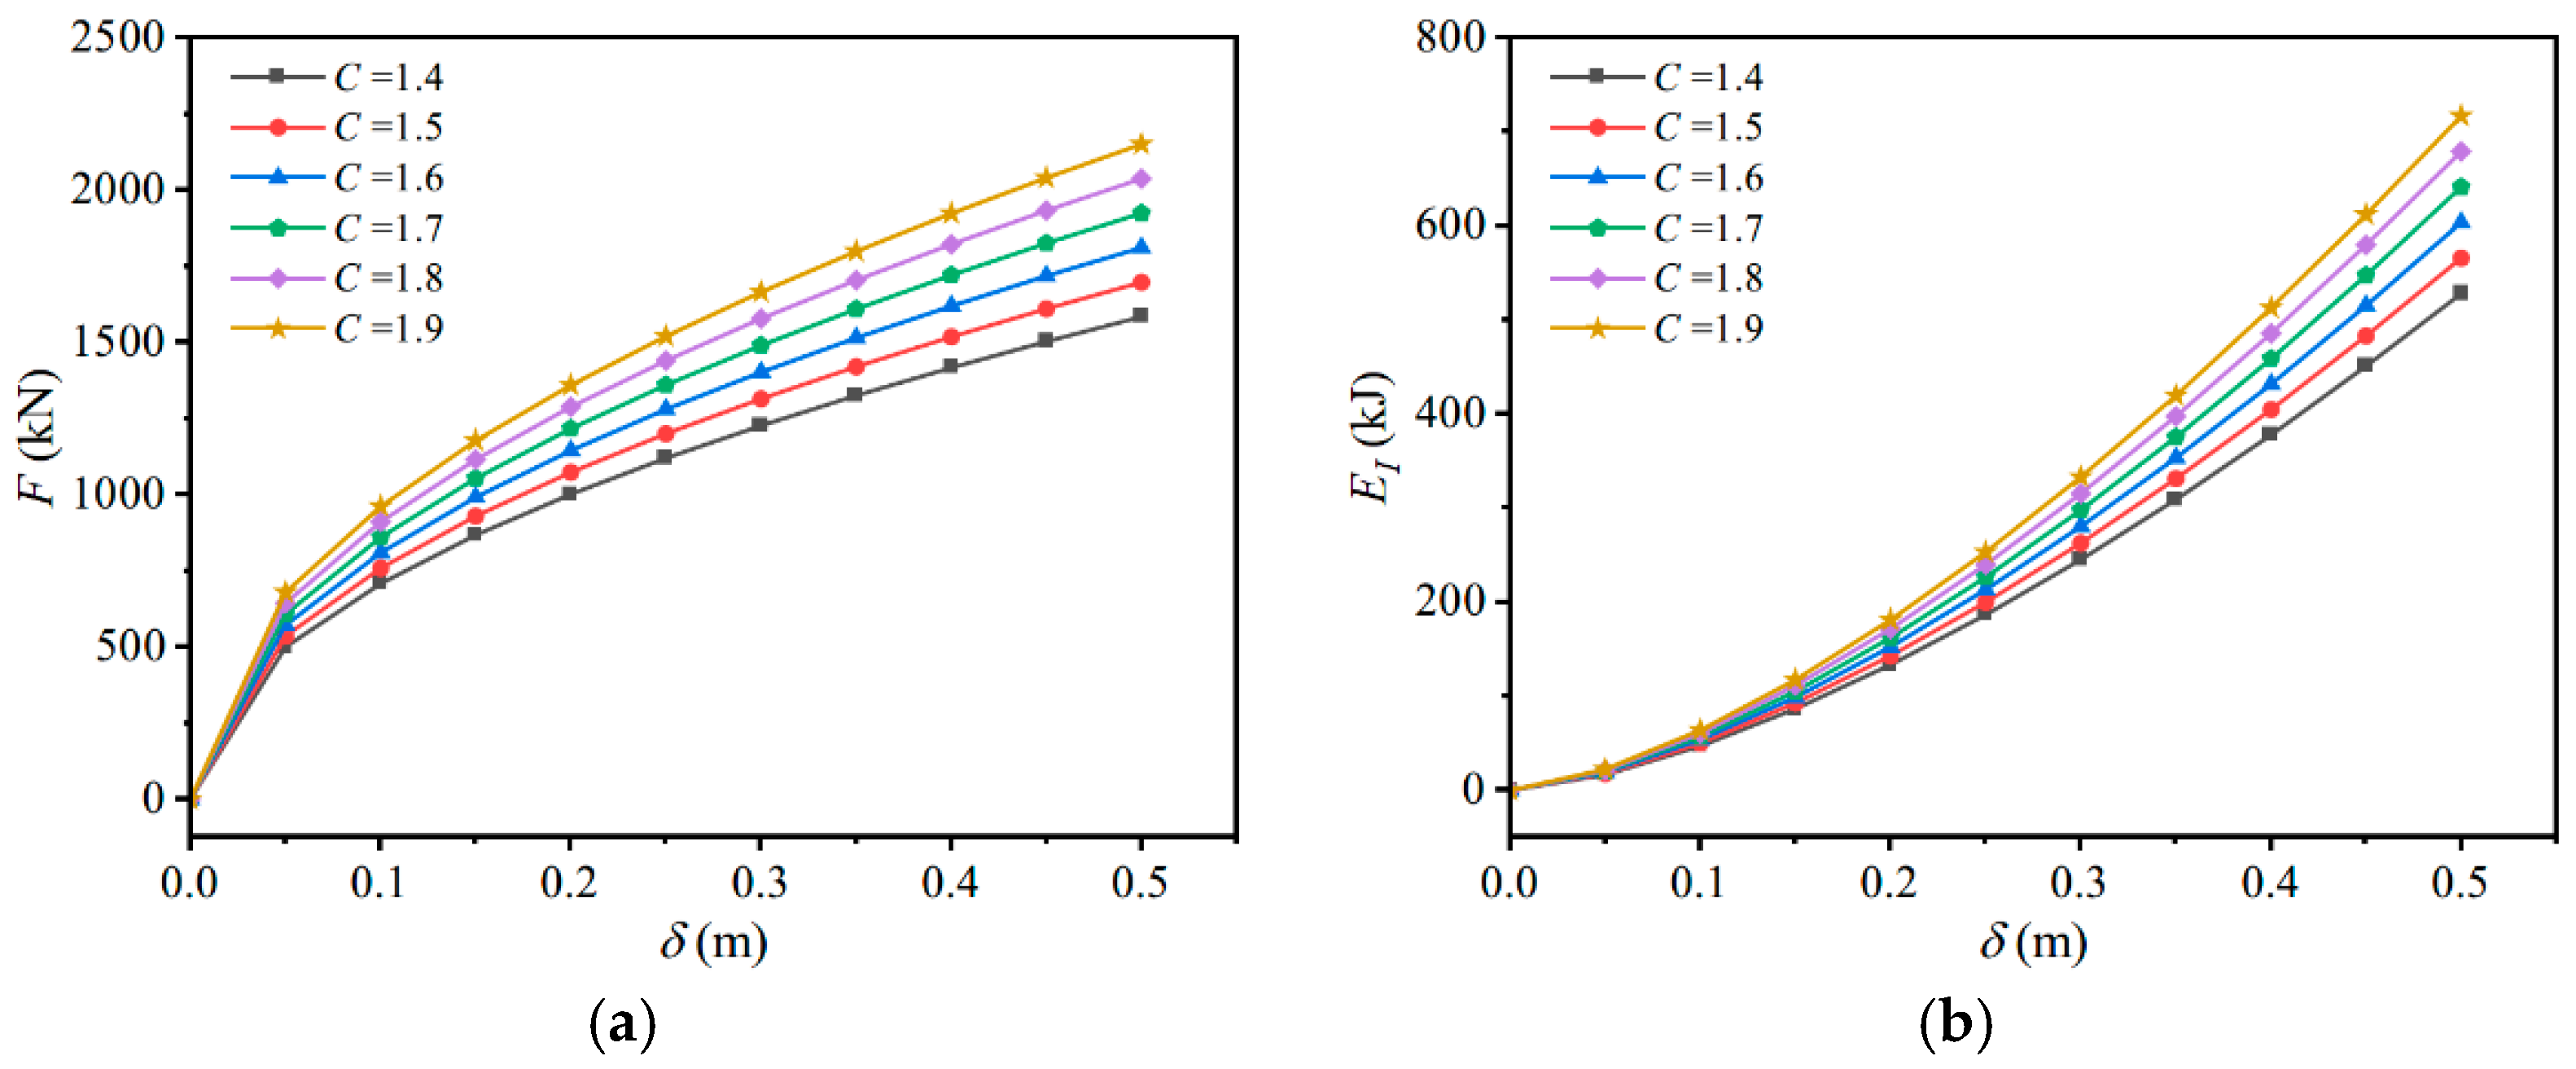
According to Equations (2) and (3), the impact force and ice dissipation energy of the ice floe at different C values can be obtained, and these are used to evaluate the ice-material strength during local ice crushing. Figure 14a shows the relationship between the impact force and the ice-crushing length under different C values. The impact force reflects the magnitude of ice-impact loading, and the impact force increases with the increase of C value under the same ice-crushing length. Figure 14b shows the relationship between the ice dissipation energy and the ice-crushing length under different C values. It is seen that when the ice floe with different C values reaches the same crushing length, the larger the C value and the ice dissipation energy. In summary, the ice strength characterized by the P–A relationship corresponding to different C values increases with the increase of C value.
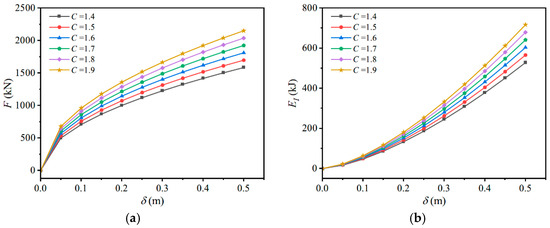
Figure 14.
The impact force and dissipated energy of ice under different C values during impact against the ice-crushing length. (a) Impact force; (b) Dissipated energy.
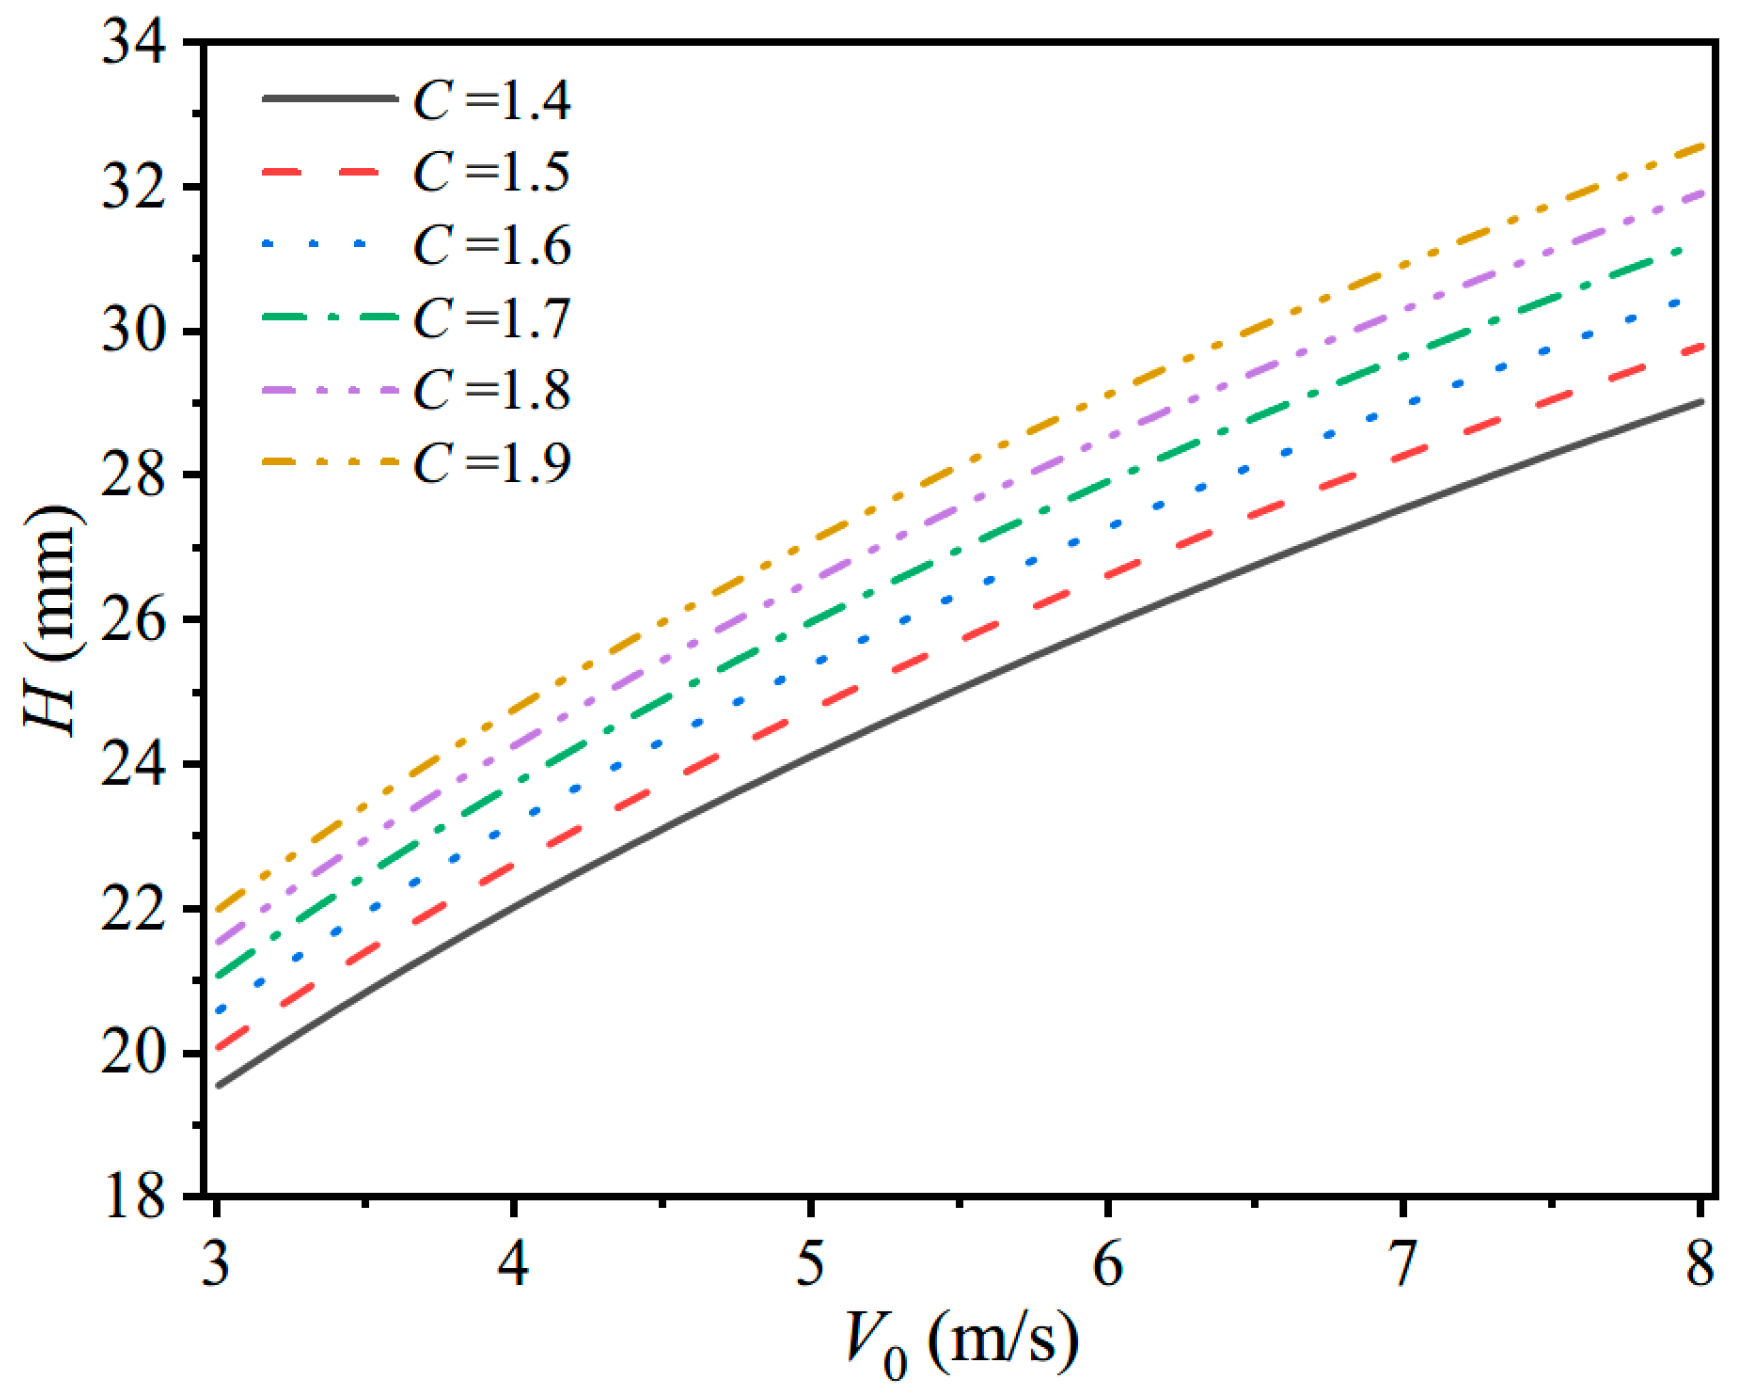
Figure 15 shows the design curves of plating thickness under different C values in DNV rules. It can be found that with the increase of impact velocity, the designed plating thickness gradually increases. It is due to that when the impact velocity increases, the ice-impact loading will increase, resulting in that the designed plating thickness. The designed plating thickness is more sensitive to the determination of ice strength. The designed plating thickness increases with the ice strength increasing when the impact velocity is the same. The reason is that under the same impact working condition, the ice floe with larger ice strength is not easy to occur deformation or damage, so the energy absorption owing to ice damage will decrease, and then the plastic-strain energy of the ship plate under ice impact will increase so that the required designed plating thickness is larger. If the parameter C takes a larger value in structural design, which means that the ice-impact loading due to the chosen larger ice strength is larger, the designed plating thickness required will be much greater.
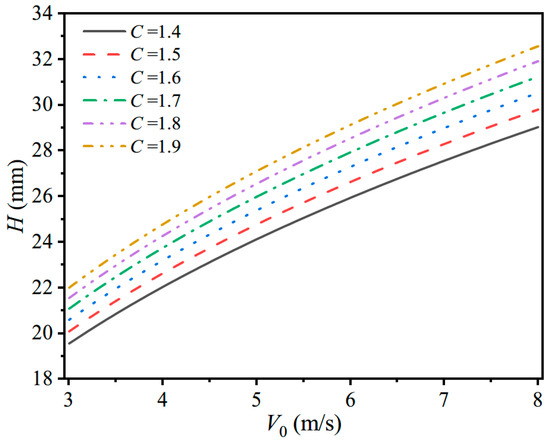
Figure 15.
Plate thickness design curves of the DNV P–A relationship.
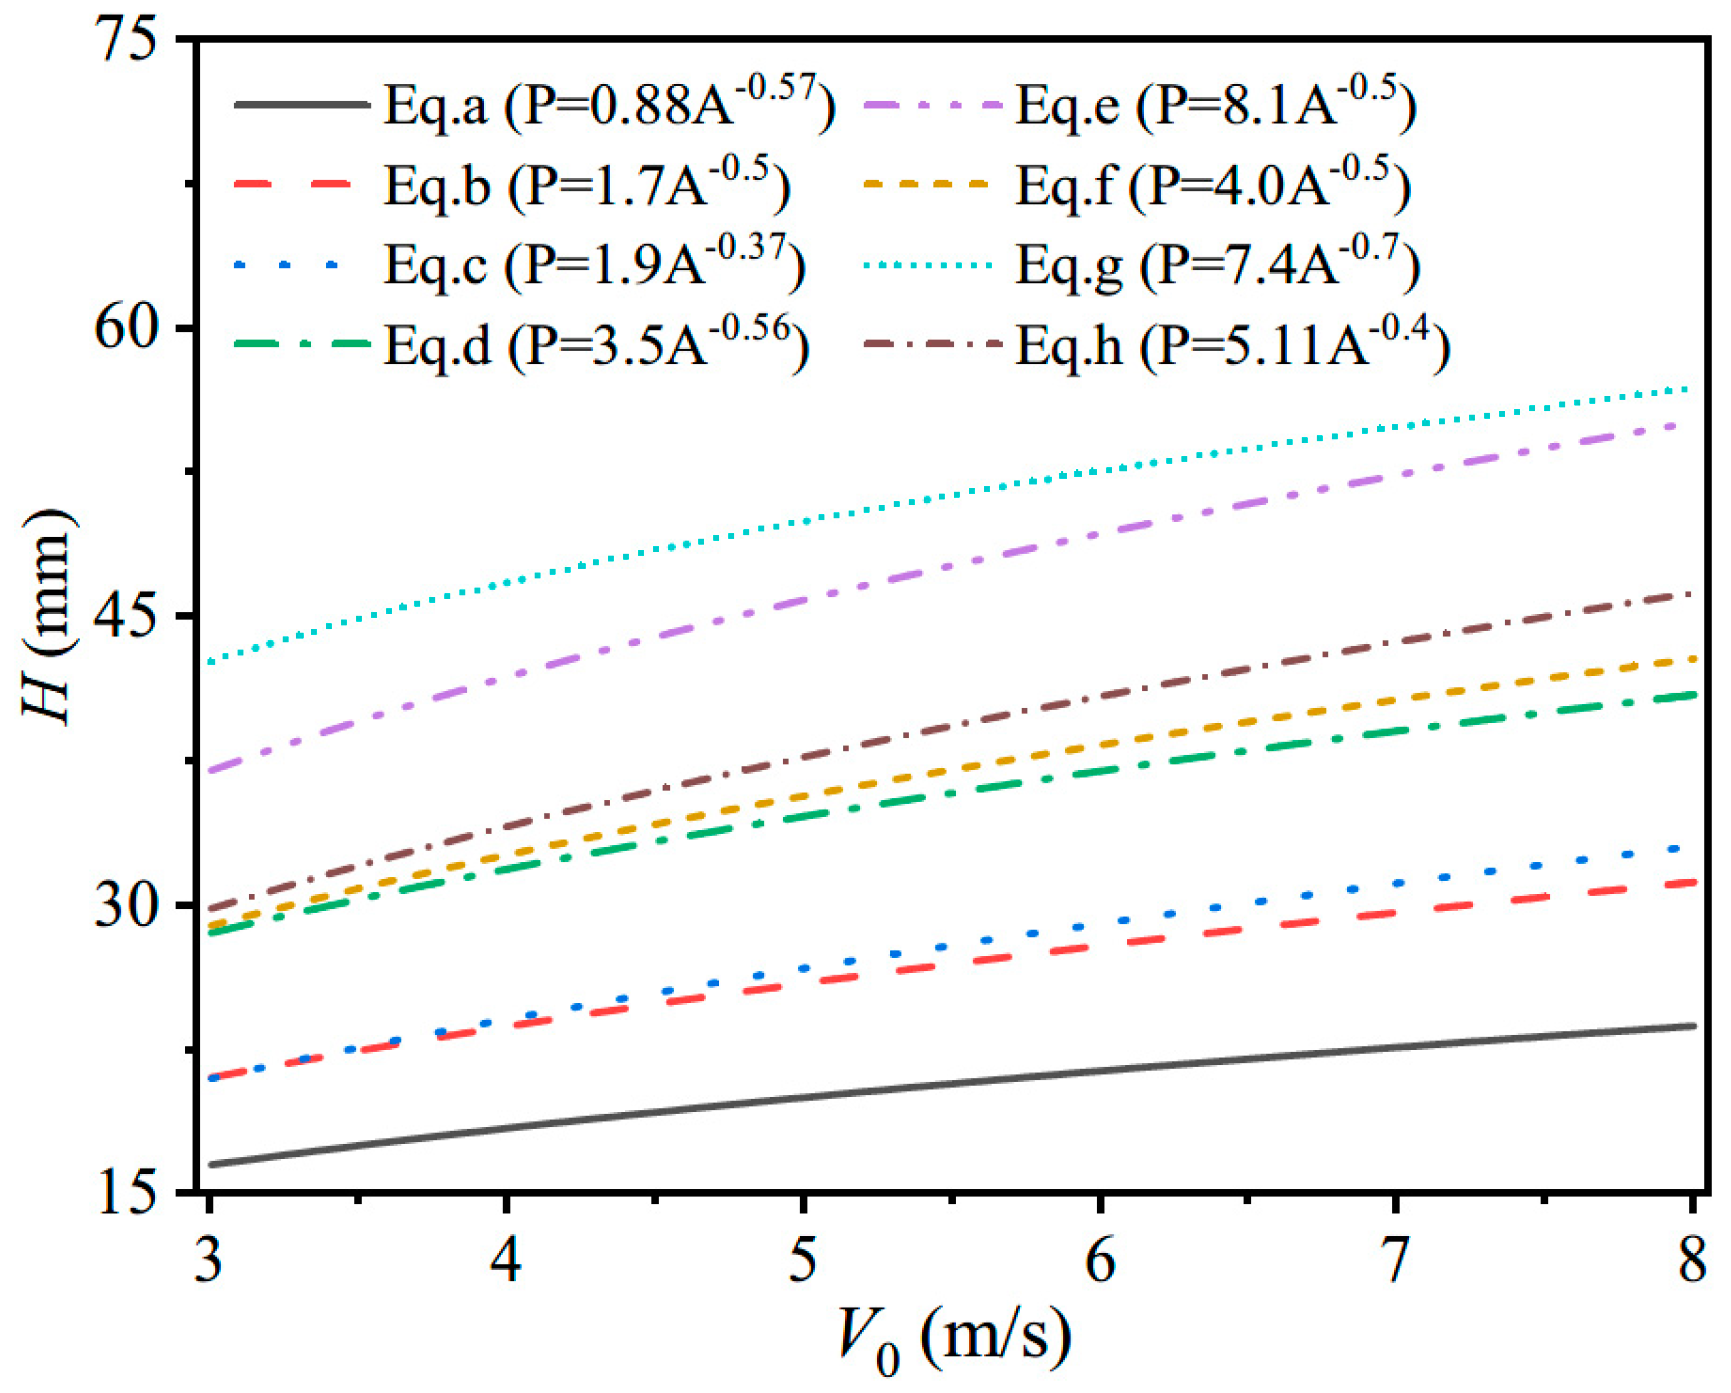
It can be seen from Figure 16 that the designed plating thickness of different P–A relationships increase with the increase of velocity. And the plating-thickness design values of different P–A relationships are shown in Table A1 in Appendix A.1. The design’s thicknesses based on the P–A relationship from (Eq. a) are the smallest compared to those based on other P–A relationships. This is due to the original test data for the P–A relationships from (Eq. a) that were measured from the ice floe impact on the fixed concrete Norströmsgrund lighthouse [43], and the relative impact velocity between the ice floe and the fixed lighthouse is very small compared to the impact velocity of ship–ice impact, which leads to a smaller ice-impact loading. The P–A relationship from (Eq. b) is suitable for the mid-side structure of a ship with an ice class of ICE-05 or ICE-10 when the value of C is 1.7 when following the DNV rules. According to the P–A relationship from (Eq. c), its plating thickness is close to that of the P–A relationship from (Eq. b). The test data for the P–A relationship from (Eq. c) were measured from first-year-ice impacts on the Molikpaq platform caisson structure [43]. The Molikpaq, which consists of a continuous steel annulus, is similar to the side structure of ship and the first-year-ice condition belongs to the low-ice class. Therefore, the P–A relationship from (Eq. c) could be applied to guide the plating-thickness design of ice-strengthened ships navigating in first-year-ice floe regions. The design’s thicknesses based on the P–A relationship from (Eq. d) are larger than those based on the P–A relationship from (Eq. b). Because the measured data was from a collision between the Terry Fox icebreaker and B 14 and B 17 glacier ice (mass of 1900 t and 8500 t, respectively) [7], the mass and ice strength of glacier ice is larger than for ice within low-ice-class conditions. According to the P–A relationships from (Eq. e, Eq. f, Eq. g and Eq. h), their design thicknesses are larger than those based on the P–A relationship from (Eq. b). This is due to the original test data of the four P–A relationships having been mostly measured from the fixed structure Molikpaq platform being subjected to ice floe impact [41], and the ice-impact loading is larger than the force of ship–ice impact. Among them, the thicknesses based on P–A relationships from (Eq. f) are the smallest, since the test data was from first-year-ice impact; however, the date of the other three was from impact with multi-year ice that has higher strength than first-year ice. From the above analysis, it can be seen that P–A relationships from (Eq. b and Eq. c) can be used to guide the structural design of ice-strengthened ships with ice classes PC6 and PC7.
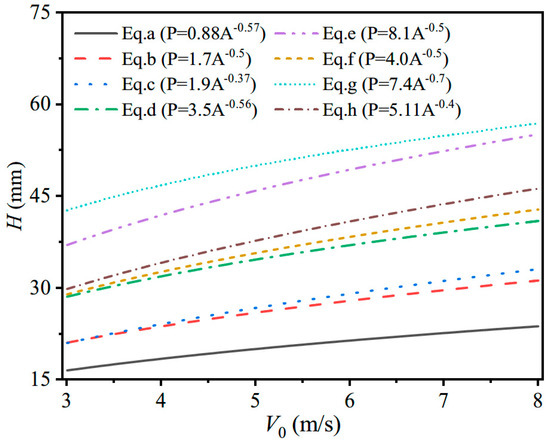
Figure 16.
Plating-thickness design curves of different P–A relationships.
4.2.2. Case 2. Different Allowable-Permanent Set Parameters Cw
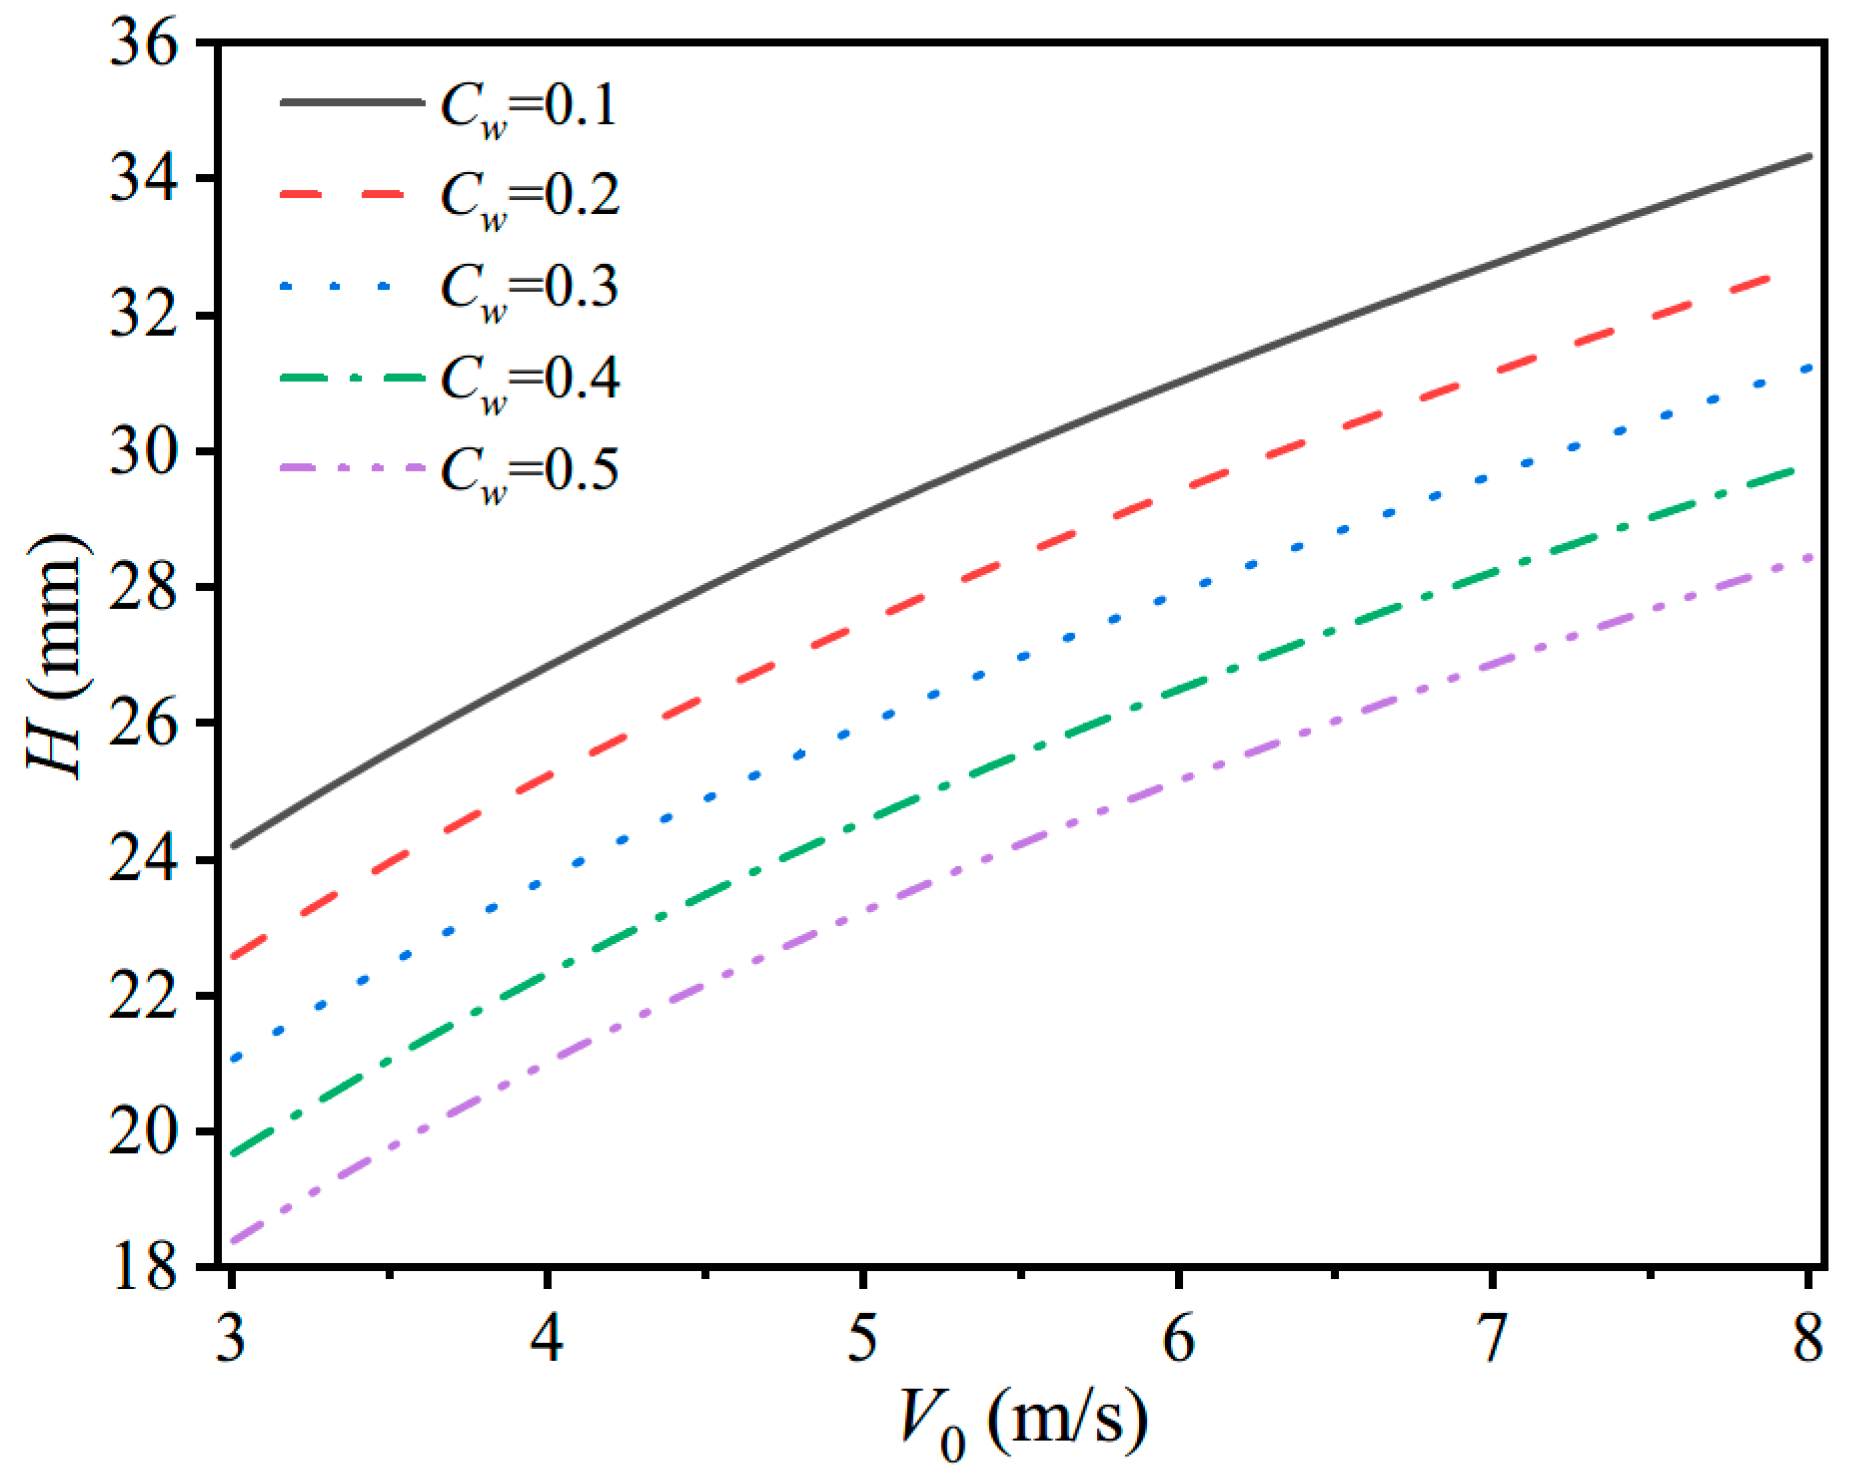
In the elastic-plastic design method, the determination of the allowable-permanent set parameter is related to the residual bearing capacity, safety, flatness and work performance of ship structures. According to references [29,30], the value range of allowable-permanent set ws of the plate is 0~b/50, and the allowable-permanent-set parameter Cw ranges from 0.1~0.5. Under these conditions, the ice mass m0 is taken as 15,000 kg, the ice thickness h is taken as 0.74 m, the front-end angle θ is 120° and the P–A relationship is taken as the formula from DNV rules: .
Figure 17 shows the plating-thickness design curves of different values for allowable-permanent-set parameter Cw. It can be seen that the designed plating thickness of different allowable-permanent set Cw values increases with an increase in velocity, and different design curves are approximately parallel. The plating thickness is sensitive to the determination of the allowable-permanent set, and the plating thickness increases with a decrease in Cw. This is due to the fact that when the allowable-permanent set gradually decreases, the design criteria of plastic design method is closer to the elastic design criteria, and the designed plating thickness becomes increasingly conservative. Table A2 in Appendix A.2 shows plating-thickness design values of different values of Cw.
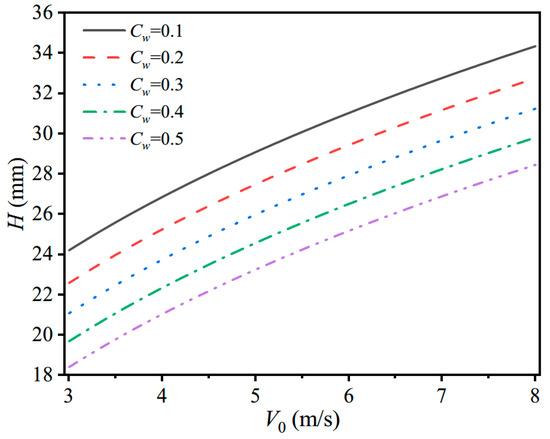
Figure 17.
Plating-thickness design curves of different values for allowable-permanent set Cw.
4.2.3. Case 3. Influences of Ice Shapes (θ, h) and Impact Energy
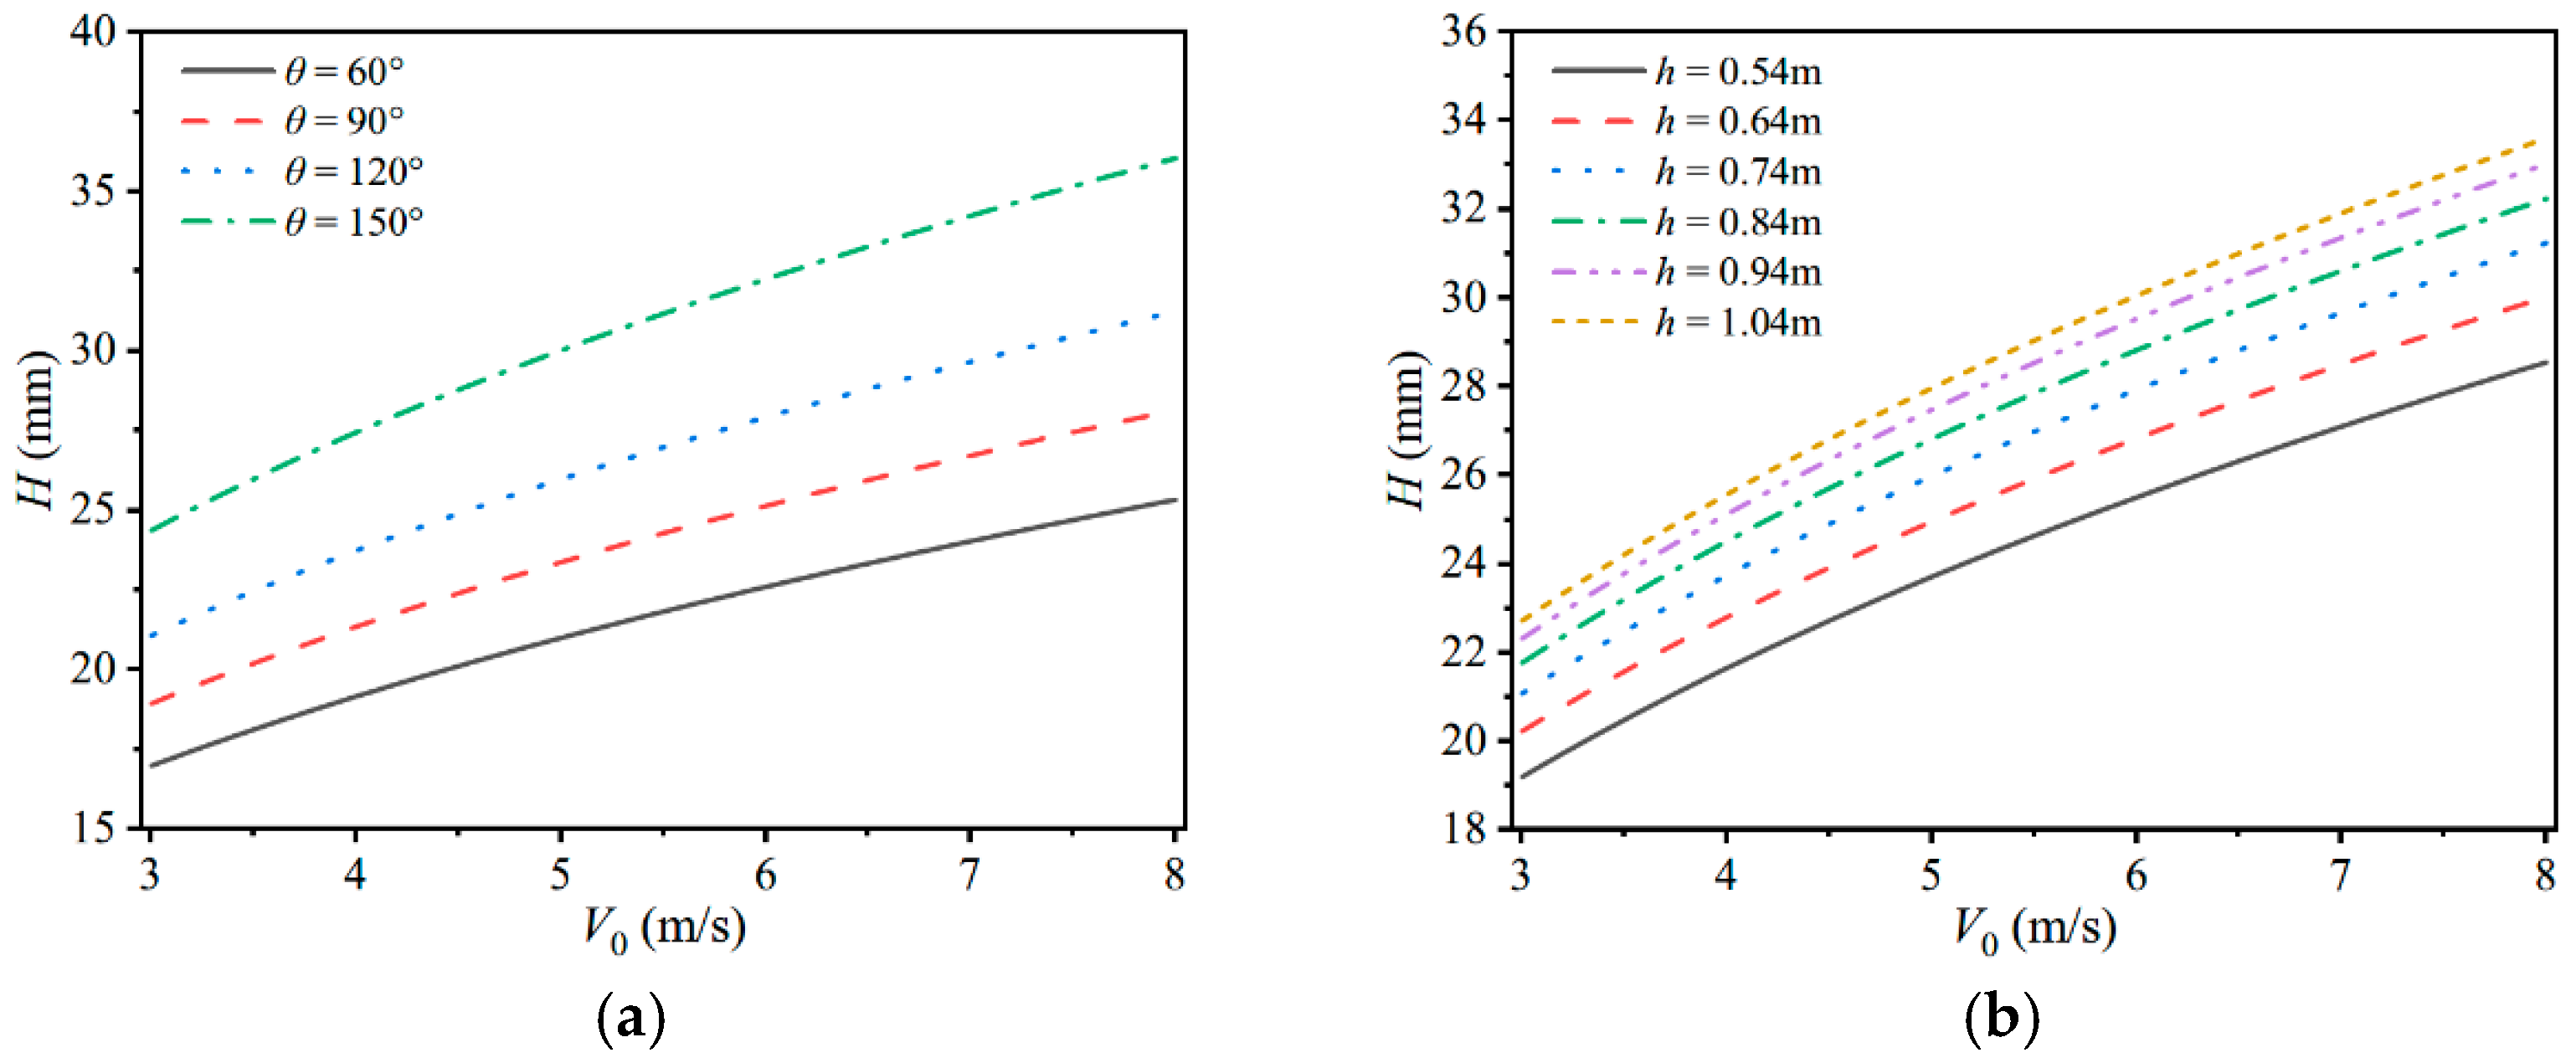
For different ice shapes, the P–A relationship is based on the formula of the DNV rules: , and the allowable-permanent-set parameter Cw is 0.3. When exploring the influence of ice thickness, the ice front-end angle θ is 120°. According to the DNV rules [2], the ice thickness range of ice classes ICE-05 and ICE-10 is 0.5~1.0 m. The ice mass increases proportionally with the ice thickness, kg. When exploring the influence of the ice front-end angle, the ice thickness h is 0.74 m, the ice mass is 15,000 kg and the ice front-end angle θ is taken as 60°, 90°, 120° or 150°.
Figure 18 shows the design curves for different ice shapes. It can be seen from Figure 18a that, with the increase of the front-end angle, the plating thickness gradually increases. Figure 19a demonstrates that the plating thickness increases parabolically with this angle and the fitting formula is . During the ice-impact process, with an increase in the front-end angle, the energy absorption due to ice crushing will become smaller, so the plate will absorb more impact energy and generate greater plastic deformation, as indicated in Ref. [28]. Therefore, in the structural design the ice with a larger angle is selected as the most dangerous condition to obtain a much more secure plating thickness. And the plating-thickness design values of different ice front-end angles θ are illustrated in Table A3 in Appendix A.3. Figure 18b shows that the plating thickness increases with an increase in the velocity at different ice thicknesses. It can be seen from Figure 19b that the plating thickness increases parabolically with the increase of ice thickness, and the fitting formula is . Table A4 in Appendix A.3 shows the plating-thickness design values under different ice thicknesses h.
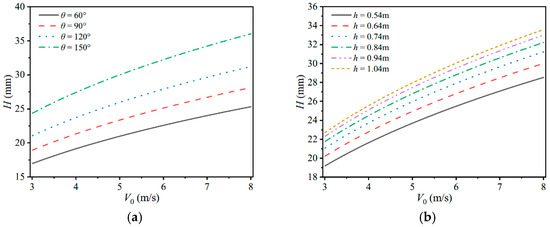
Figure 18.
Plating-thickness design curves of different ice shapes. (a) Design curves for different ice front-end angles; (b) Design curves for different ice thickness.
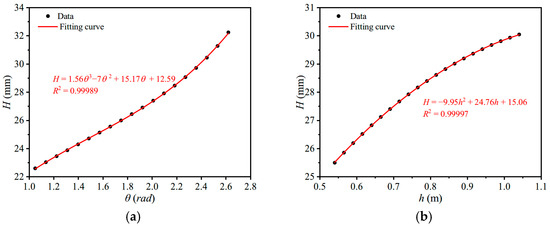
Figure 19.
The influence of ice shape (θ, h) on plating thickness. (a) H–θ curve when V0 = 6 m/s. (b) H–h curve when V0 = 6 m/s.
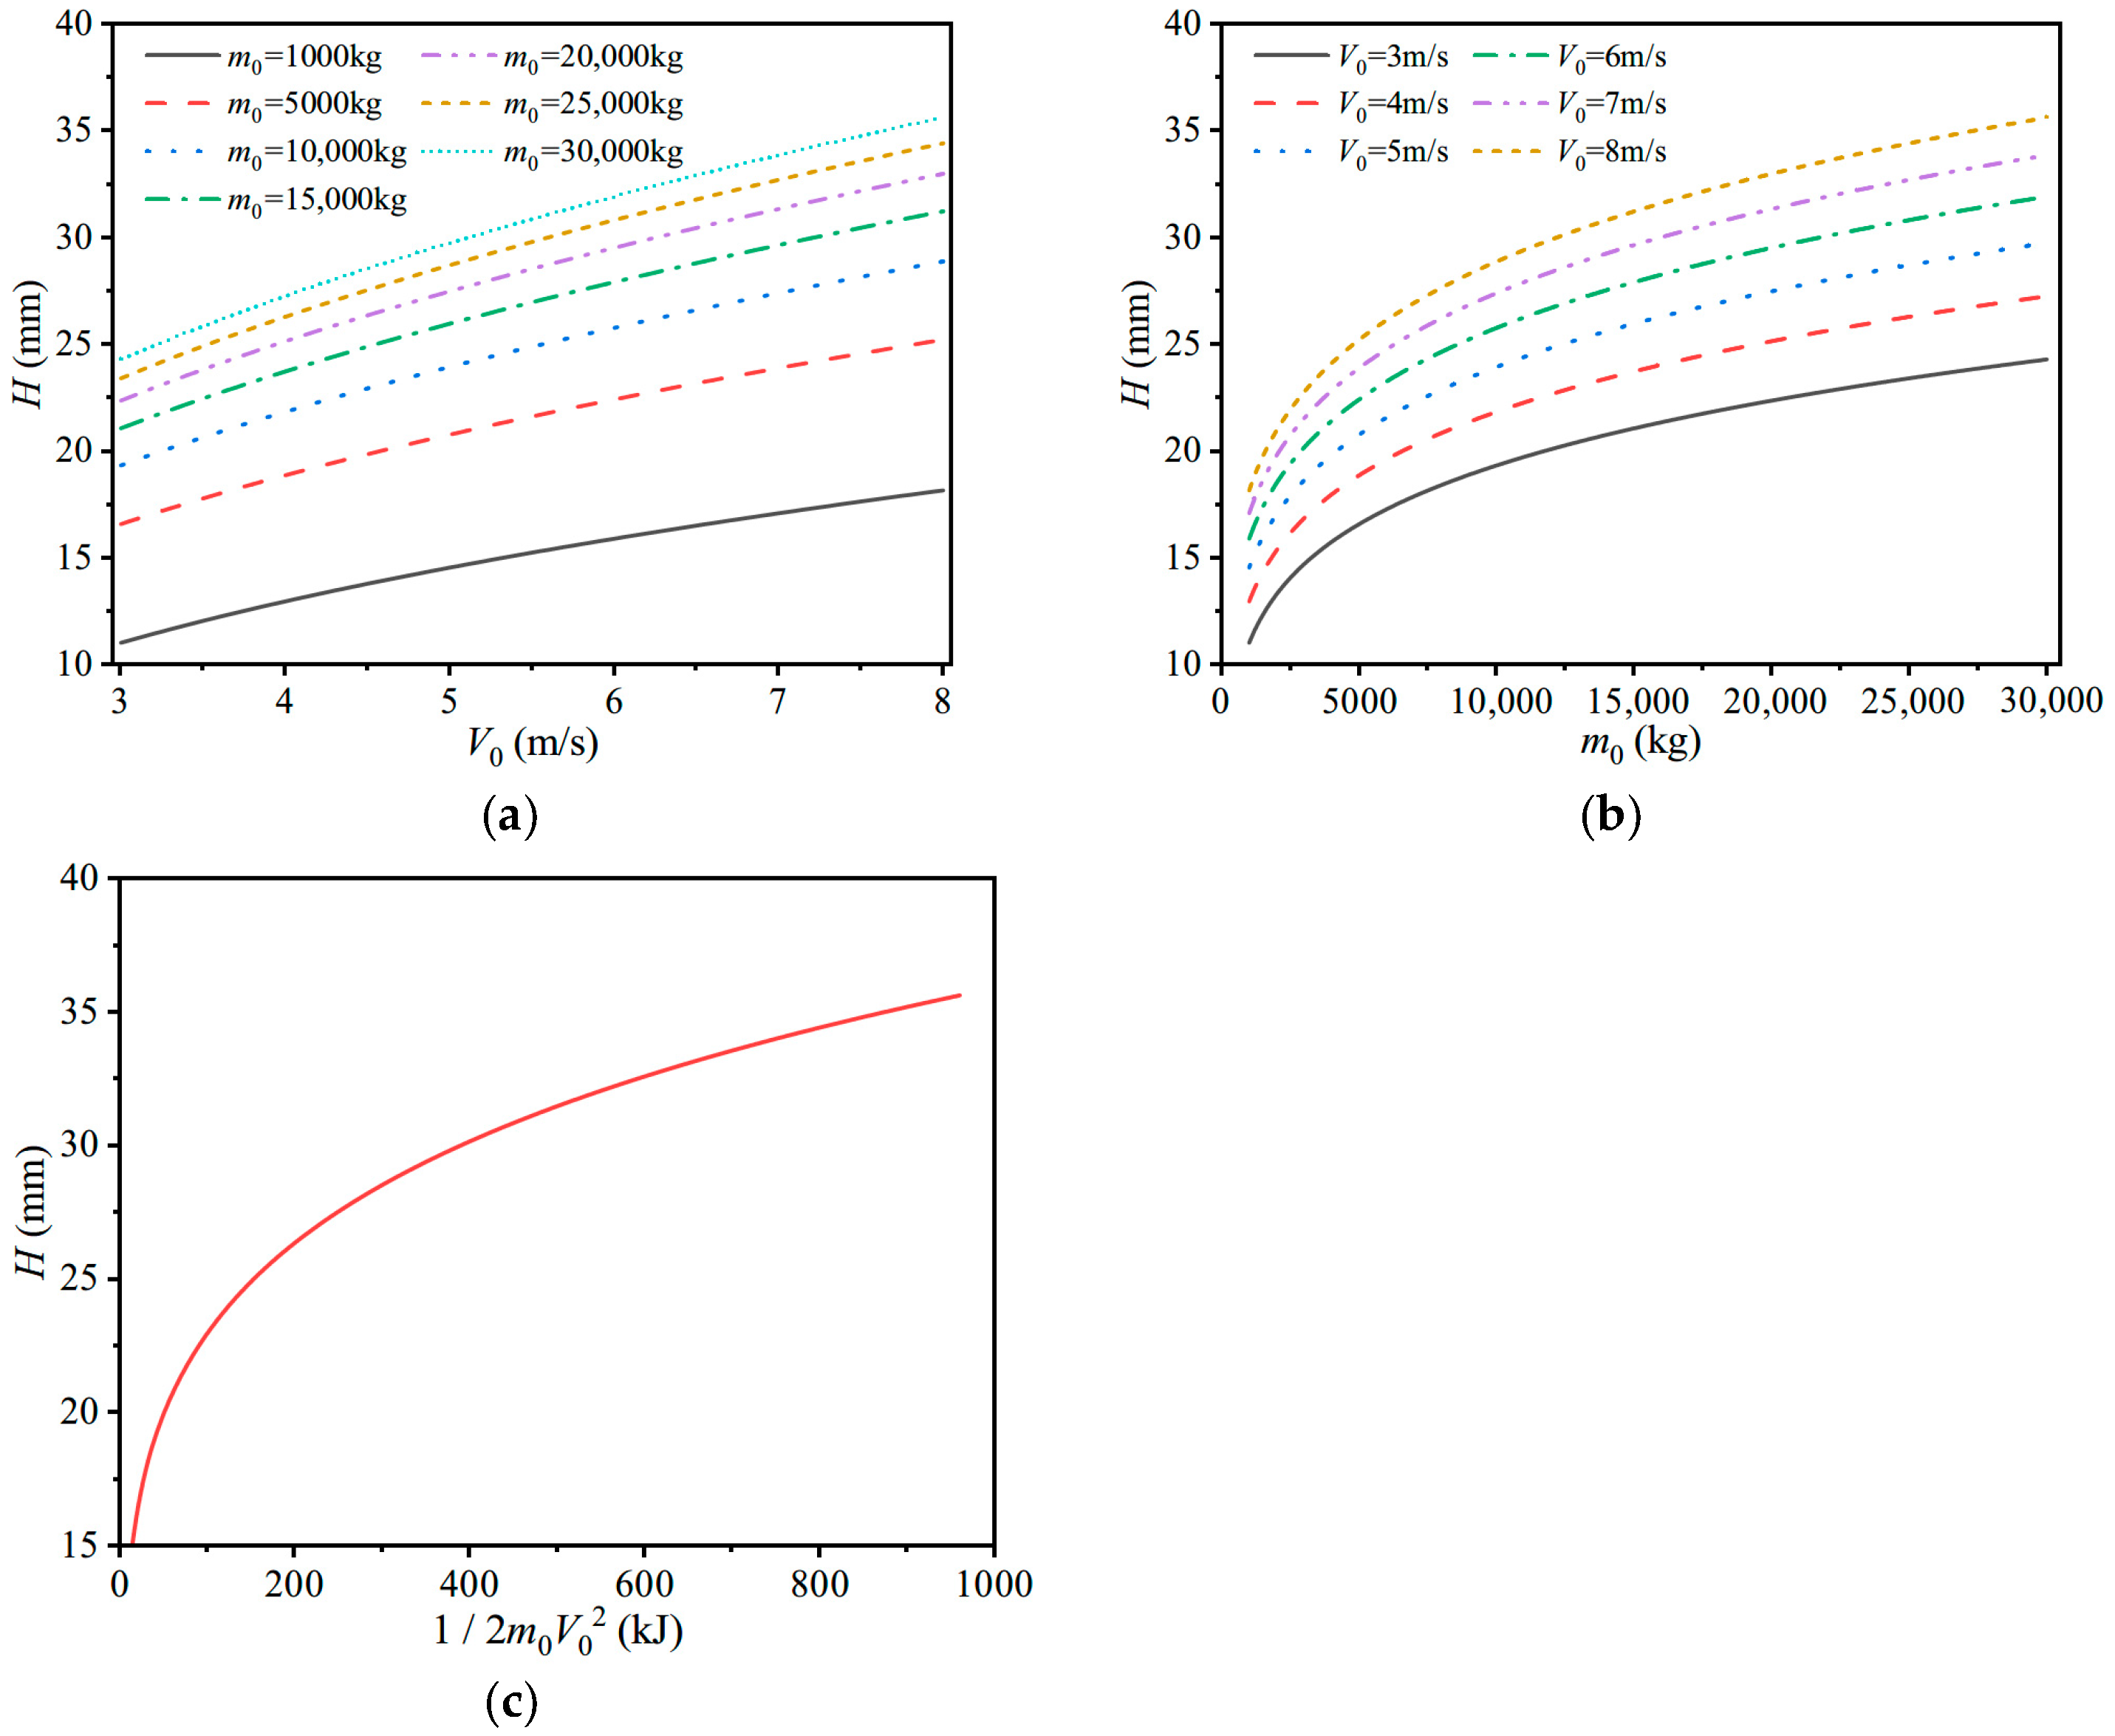
To explore the influence of impact energy, the ice thickness h is 0.74 m, the front-end angle θ is 120°, the range of ice mass is 1000~30,000 kg, the range of impact velocity is 3~8 m/s and the P–A relationship () is used in the calculation. Figure 20a demonstrates that the plating thickness for different masses increases with increasing velocity. And the plating-thickness design values under different ice masses m0 are demonstrated in Table A5 in Appendix A.3. It can be seen from Figure 20b that the plating thickness of different impact velocities increase with increasing ice mass. According to the design curves for plating thickness in Figure 20a,b, the design curve for plating thickness using initial impact energy is obtained as illustrated in Figure 20c.
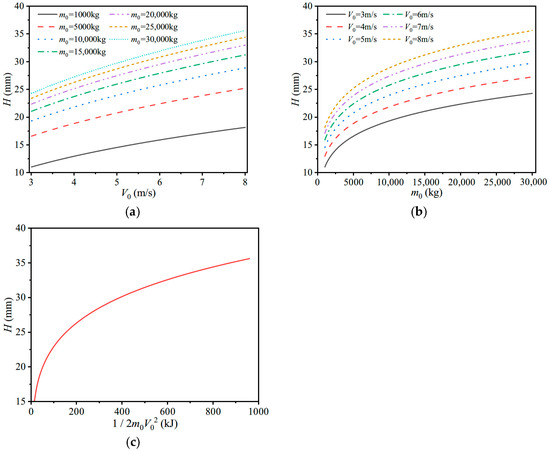
Figure 20.
Plating-thickness design curves for different ice masses, impact velocities and impact energies. (a) Design curves for different masses; (b) design curves for different velocities and (c) design curves for different impact energies.
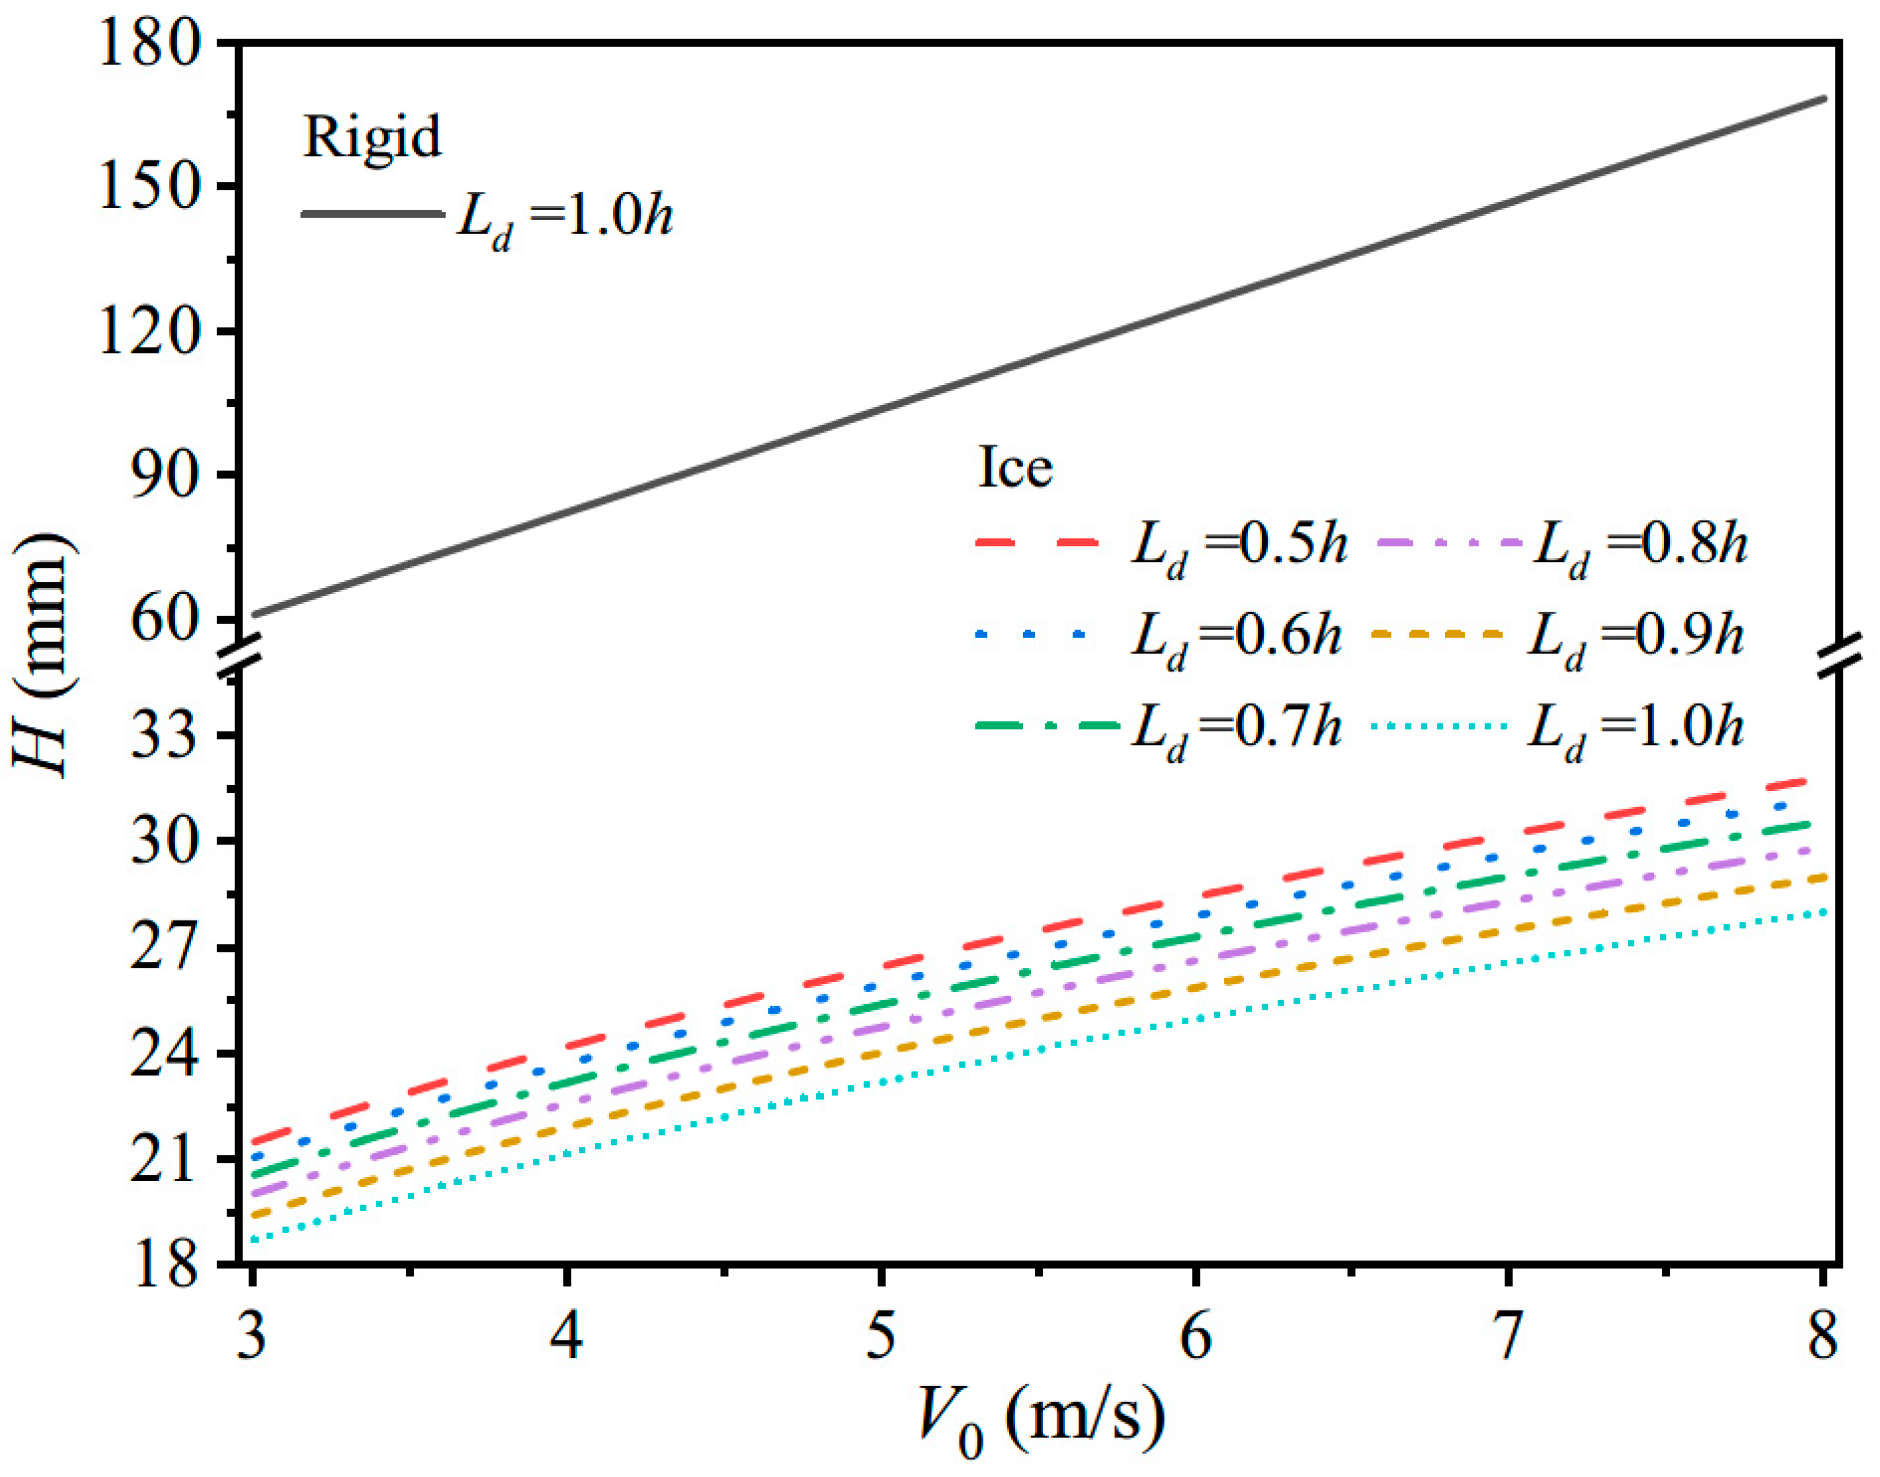
4.2.4. Case 4. Comparison of Plating-Thickness Designs for Ice Impact and Rigid-Mass Impact
In this case, the ice mass is 15,000 kg, the ice thickness is 0.74 m, the front-end angle is 120°, the P–A relationship () obtained from the DNV rules is chosen, and the coefficient of restitution of ice is 0.1. In order to explore the influence of the length of the middle plastic hinge line (Ld = ωh) on the plating-thickness design, a damage coefficient ω of ice are selected from 0.5~1.0. For rigid-mass impact, the mass of the rigid impactor is 15,000 kg, the impactor height is 0.74 m, and the coefficient of restitution of the rigid impactor is 0.5. The allowable-permanent-set parameter Cw under ice for rigid-mass impact is taken as 0.3.
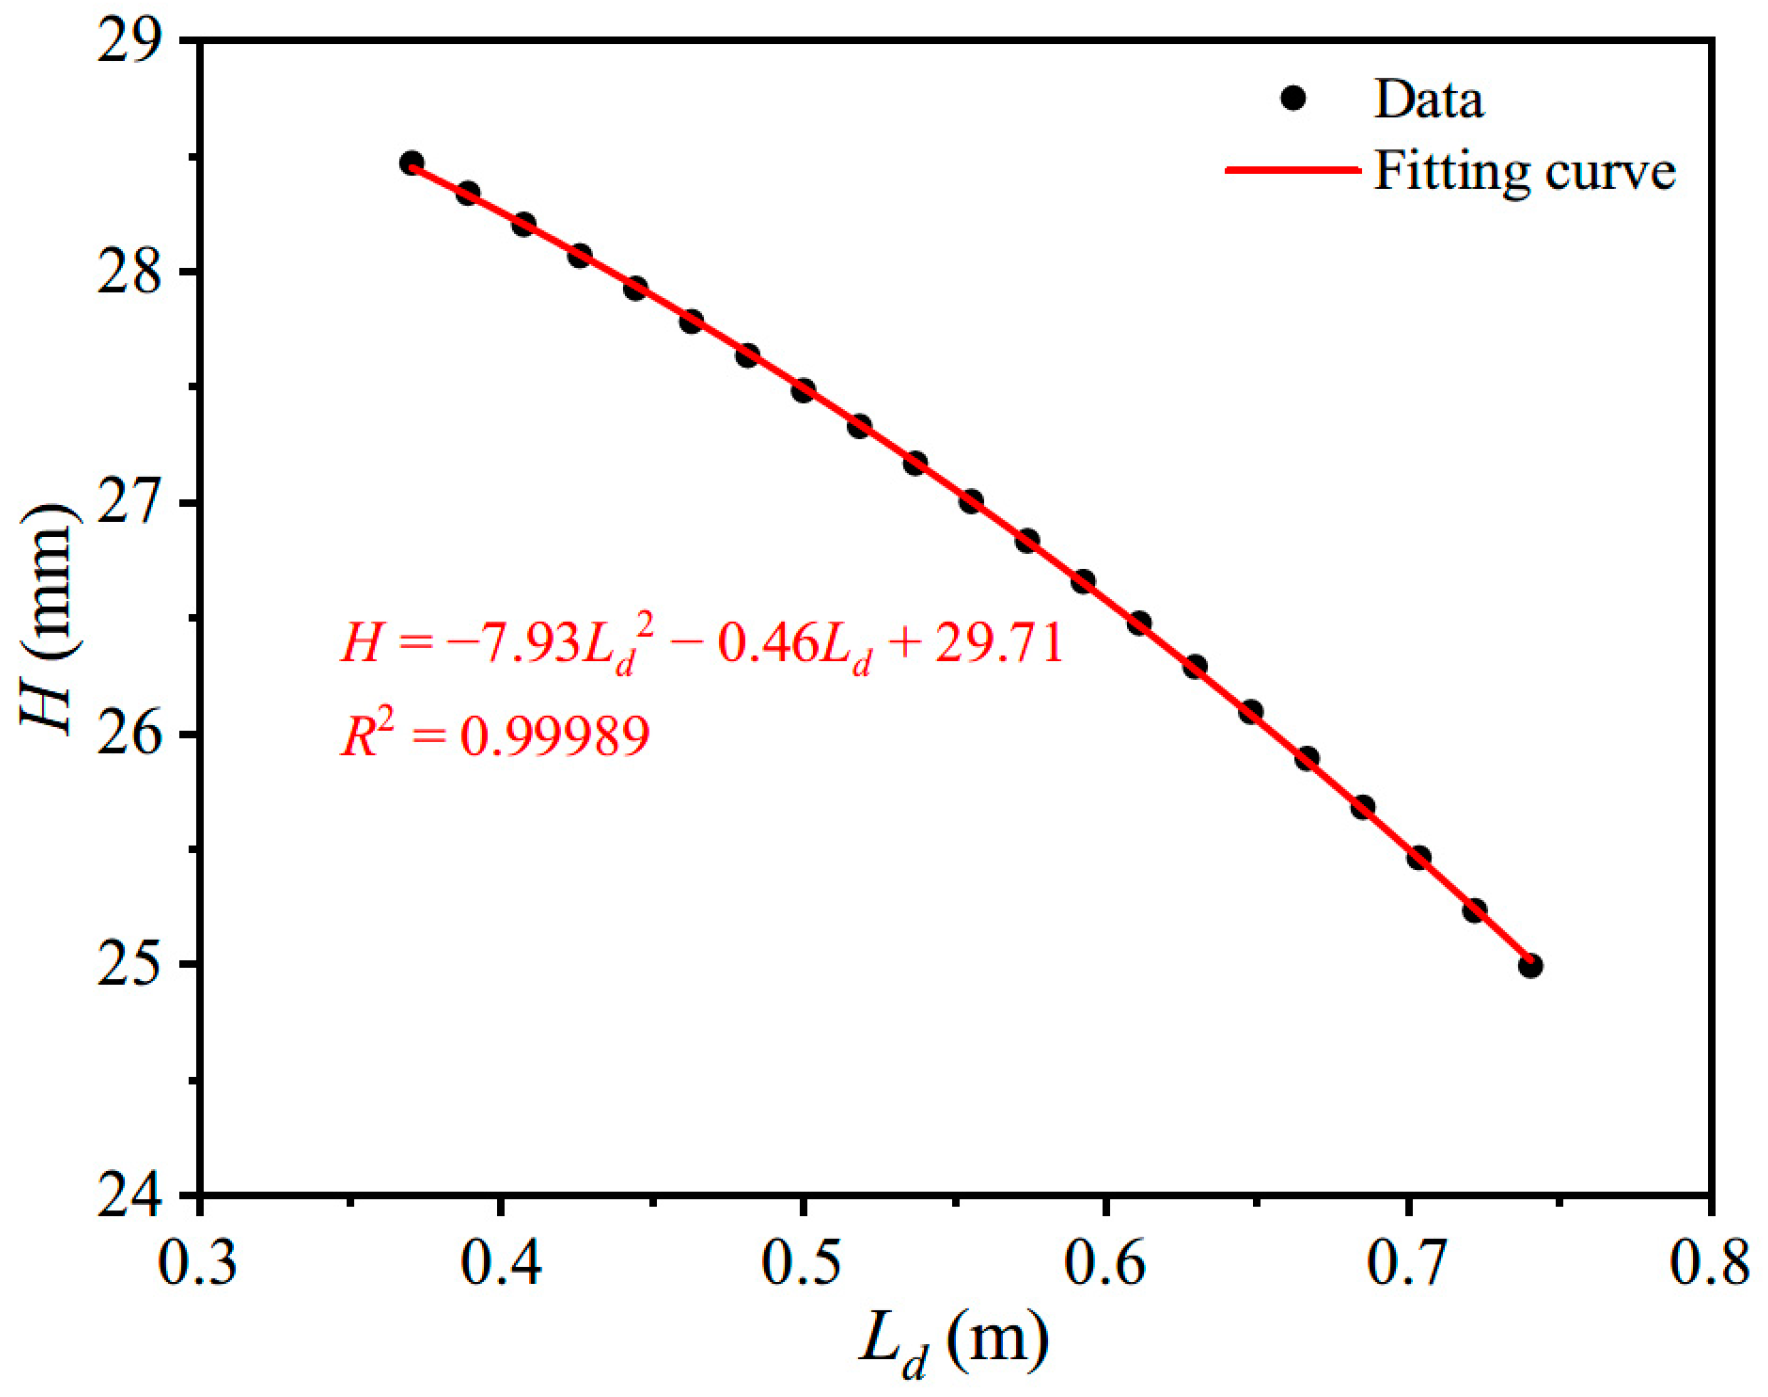
Figure 21 shows the comparison of plating-thickness design curves for ice floe impact and rigid-mass impact under the same impact conditions. It can be found that the designed plating thickness for ice impact and rigid-mass impact increases with increasing impact velocity. The plating thickness designed for rigid-mass impact is much larger than that designed for ice impact. The structural dimension design applied for rigid-mass impact is too conservative. Therefore, the influence of ice damage on plating-thickness design should be considered in the structural design of polar ships subjected to ice floe impact. Under ice impact, the length of the middle plastic hinge line of the ship plate is Ld = ωh (ω is a constant). Figure 21 shows the plating-thickness design curves for different hinge line lengths. Figure 22 demonstrates that the designed plating thickness gradually decreases with increasing middle plastic hinge line length and the fitting formula is .
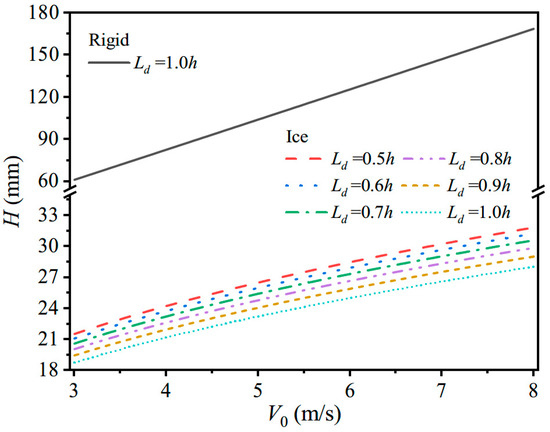
Figure 21.
Plating-thickness design curves for ice impact and rigid-mass impact under the same impact conditions.
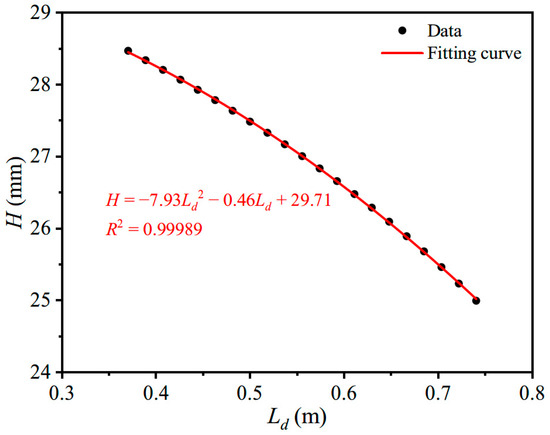
Figure 22.
H–Ld curve when V0 = 6 m/s.
5. Conclusions
In this paper, a theoretical model for the impact response between the vertical-side plate of an ice-strengthened ship and an ice floe is established. The plastic deformation of the ship plate under ice impact can be obtained based on the theoretical analytical method presented here, which compared well with the experimental results. On this basis, the thickness design formula of the ship plate under ice-impact loading based on the plastic design criteria has been derived, and the plating-thickness design curves under different design parameters or conditions are shown. The parameter-influence analysis on the designed plating thickness is discussed. Some concluding remarks are summarized as follows:
When designing the plating thickness of an ice-strengthened ship subjected to ice floe impact, the dimensionless allowable-permanent-set parameter Cw within the plastic design approach needs to be determined according to the actual structural design requirements. The designed plating thickness gradually decreases with increasing Cw. If the smaller value of the allowable-permanent set is taken in the proposed plastic design approach, the design criteria of plastic design method is closer to the elastic design criteria, and the designed plating thickness becomes increasingly conservative.
The dynamic responses of the ship plate to ice impact and rigid-mass impact under the same impact conditions are compared in this paper. The plastic deformation of the ship plate with ice impact is much less than that with rigid-mass impact. This is due to the fact that the ice will experience deformation and damage to absorb impact energy, and the energy absorption of ice occupies a large proportion of impact energy during impact. The designed plating thickness under rigid-mass impact is much larger than that under ice impact. Therefore, it will be particularly conservative when using rigid-mass-impact loads instead of ice-impact loads for structural design. It is necessary to consider the energy absorbed by ice damage for the plating-thickness design of ice-strengthened ships subjected to ice floe impacts.
The ice contact pressure–area (P–A) relationship is widely used to assess the ice strength during ship–ice impact. The design formula proposed to determine the plating thickness under ice-impact loading is very sensitive to the P–A relationship of ice. Design curves for plating thickness based on different P–A relationships obtained from polar-ship design rules and reported empirical data are compared in this paper. For example, for the P–A relationship () obtained from the measured data of the collision between a fixed cylindrical concrete lighthouse structure and an ice floe, the ice strength using this relationship in the impact process is relatively small, resulting in a designed plating thickness that is small due to its low ice strength, which is not suitable for the design of the plating thickness for ships under ice floe impact. For the P–A relationship () obtained from the experimental data of the collision between a small iceberg and an icebreaker, the iceberg strength is relatively high, which causes the designed plating thickness to be large, which is not suitable for the plating-thickness plastic design of an ice-strengthened ship of a low-ice class subject to ice floe impact. The P–A relationship coming from DNV rules can be used to guide the structural plastic design of polar ships of a low-ice class. Therefore, it is necessary to select the appropriate P–A relationship according to the ice conditions in the navigation regions when designing plating thickness.
Differing from the assumption of ice floe impact as rigid mass impact loading or local uniformly distributed patch loading for structural plastic design, this paper directly uses an ice-impact loading to carry out plastic design for ship-plate thickness, and it considers the influence of ice damage and the inertia effect of ice impact on structural design. The research in this paper provides a new method for the structural plastic design of ice-strengthened ships of low-ice class.
In future research, the strain-rate-hardening effect and strain-hardening effect of material should be considered in the proposed theoretical model. In addition, in this paper, the plastic design formula for determining plating thickness is mainly suitable for simple ice–plate impact scenarios. The plastic design method should be further developed for the complex frame structure of polar ship under ice floe impacts.
Author Contributions
Writing—original draft preparation, M.M.; conceptualization, K.G.; writing—review and editing, W.C.; methodology, L.Z.; formal analysis and investigation, Z.P. and S.Z. All authors have read and agreed to the published version of the manuscript.
Funding
This work was financially supported by the project of National Natural Science Foundation of China (Grant number: 12302481, 12202328) and the Fundamental Research Funds for the Central Universities (WUT: 2022IVA175, 2023IV018h).
Institutional Review Board Statement
Not applicable.
Informed Consent Statement
Not applicable.
Data Availability Statement
Data are contained within the article.
Acknowledgments
The authors gratefully acknowledge the support from the project of National Natural Science Foundation of China (Grant number: 12302481, 12202328) and the Fundamental Research Funds for the Central Universities (WUT: 2022IVA175, 2023IV018h).
Conflicts of Interest
The authors declare no conflict of interest.
Nomenclature
| An, A | Contact area and integral of the ship-plate-deformation area, respectively |
| a1, a2, a3, b1, b2 | Constants related to plate size, ice height, and ice damage parameters |
| B | Width of the ship plate |
| b | Length of short side of the panel |
| C | Parameter related to the ice strength and the ice belt region |
| Cw | Allowable-permanent set parameter |
| E | Young’s modulus of the plate material |
| EARF | Energy-absorption reduction factor |
| E0 | Initial total impact energy |
| EI | Dissipated energy of the ice damage |
| Ep | Plastic-strain energy or absorbed energy of the ship plate |
| Epi, Eps | Plastic-strain energy of the ship plate under ice impact and rigid-mass impact, respectively |
| Er | Rebound-kinetic energy in the rebound process |
| ex | Constant |
| FA | Coefficient related to the ice belt |
| Fm | Maximum impact force |
| H | Plating thickness |
| h | Ice thickness |
| L | Length of the ship plate |
| Ld | Length of middle plastic hinge line |
| l | Length of long side of the panel |
| lm | Length of plastic hinge line |
| M0, N0 | Ultimate plastic bending moment and ultimate plastic membrane force per unit length, respectively |
| Mp, Np | Bending moment and membrane force of the plastic hinge line per unit length, respectively |
| m0, mr | Initial ice mass and residual mass after ice impact, respectively |
| P | Average pressure of ice in the process of impact extrusion |
| P0 | Pressure with a contact area of 1 m2 |
| PDRF | Plastic deformation reduction factor |
| s | The number of plastic hinge lines |
| V0 | Initial impact velocity of the ice floe and structure |
| V0′ | Initial net impact velocity |
| V0i′, V0s′ | Initial net impact velocities under ice impact and rigid-mass impact, respectively |
| Vi | Loss velocity parameter caused by ice damage |
| Vr | Rebound velocity in the rebound process |
| w | Plastic deformation of the plate |
| wc | Plastic deformation at the center of the plate |
| wm | Maximum plastic deformation |
| wpi,wps | Plastic deformation of ice impact and rigid-mass impact, respectively |
| ws | Allowable-permanent set |
| α | Coefficient of restitution |
| αi, αs | Coefficients of restitution of ice impact and rigid-mass impact, respectively |
| β | Parameter related to linear density |
| δ, δm | Ice-crushing length and final ice-crushing length, respectively |
| φ1, φ2 | Dimensionless coefficients related to the dimensions of the ship plate and the length of the middle hinge line |
| η2, γ | Intermediate values |
| μ | Unit area density of the plate |
| θ | Front-end angle of the wedge-shaped ice |
| Relative angular velocity between adjacent rigid plates | |
| ρ | Density of the plate |
| σice | Nominal ice strength |
| σs | Yield strength of the plate material |
| ω | Coefficient of ice damage along the height direction |
| ξ | Coefficient related to P0, m0, h, θ and ex |
| ζ | Value of square yield surface |
Appendix A
The appendix gives the design values of plating thickness under different conditions.
Appenidx A.1. Case1. Infuences of the Ice Strengths (P–A Curves)
Table A1.
Plating-thickness design values of different P–A relationships.
Table A1.
Plating-thickness design values of different P–A relationships.
| V0 (m/s) | 3.0 | 3.5 | 4.0 | 4.5 | 5.0 | 5.5 | 6.0 | 6.5 | 7.0 | 7.5 | 8.0 |
|---|---|---|---|---|---|---|---|---|---|---|---|
| 16.5 | 17.6 | 18.5 | 19.3 | 20.1 | 20.8 | 21.4 | 22.1 | 22.7 | 23.2 | 23.8 | |
| 21.1 | 22.5 | 23.8 | 24.9 | 26.0 | 27.0 | 27.9 | 28.8 | 29.7 | 30.5 | 31.2 | |
| 21.0 | 22.6 | 24.1 | 25.5 | 26.8 | 28.0 | 29.1 | 30.2 | 31.2 | 32.2 | 33.1 | |
| 28.6 | 30.4 | 31.9 | 33.4 | 34.7 | 35.9 | 37.0 | 38.1 | 39.1 | 40.1 | 41.0 | |
| 37.0 | 39.6 | 41.9 | 44.0 | 45.9 | 47.7 | 49.4 | 50.9 | 52.4 | 53.8 | 55.1 | |
| 29.0 | 30.9 | 32.7 | 34.3 | 35.7 | 37.1 | 38.4 | 39.6 | 40.7 | 41.8 | 42.9 | |
| 42.7 | 44.9 | 46.8 | 48.5 | 50.0 | 51.4 | 52.6 | 53.8 | 54.9 | 55.9 | 56.9 | |
| 29.9 | 32.1 | 34.1 | 36.0 | 37.7 | 39.4 | 40.9 | 42.3 | 43.7 | 45.0 | 46.3 |
Appenidx A.2. Case2. Influence of the Allowable-Permanent-Set Parameter Cw
Table A2.
Plating-thickness design values of different values of Cw.
Table A2.
Plating-thickness design values of different values of Cw.
| V0 (m/s) | 3.0 | 3.5 | 4.0 | 4.5 | 5.0 | 5.5 | 6.0 | 6.5 | 7.0 | 7.5 | 8.0 |
|---|---|---|---|---|---|---|---|---|---|---|---|
| Cw = 0.1 | 24.2 | 25.6 | 26.9 | 28.0 | 29.1 | 30. 1 | 31.0 | 31.9 | 32.8 | 33.6 | 34.3 |
| Cw = 0.2 | 22.6 | 24.0 | 25.3 | 26.4 | 27.5 | 28.5 | 29.4 | 30.3 | 31.2 | 32.0 | 32.8 |
| Cw = 0.3 | 21.1 | 22.5 | 23.8 | 24.9 | 26.0 | 27.0 | 27.9 | 28.8 | 29.7 | 30.5 | 31.2 |
| Cw = 0.4 | 19.7 | 21.1 | 22.4 | 23.5 | 24.6 | 25.6 | 26.5 | 27.4 | 28.2 | 29.0 | 29.8 |
| Cw = 0.5 | 18.4 | 19.8 | 21.0 | 22.2 | 23.3 | 24.2 | 25.2 | 26.1 | 26.9 | 27.7 | 28.5 |
Appenidx A.3. Case3. Influences of Ice Shapes (θ, h) and Impact Energy
Table A3.
Plating-thickness design values of different ice front-end angles θ.
Table A3.
Plating-thickness design values of different ice front-end angles θ.
| V0 (m/s) | 3.0 | 3.5 | 4.0 | 4.5 | 5.0 | 5.5 | 6.0 | 6.5 | 7.0 | 7.5 | 8.0 |
|---|---|---|---|---|---|---|---|---|---|---|---|
| θ = 60° | 17.0 | 18.1 | 19.2 | 20.1 | 21.0 | 21.8 | 22.6 | 23.3 | 24.0 | 24.7 | 25.3 |
| θ = 90° | 18.4 | 19.8 | 21.0 | 22.2 | 23.3 | 24.2 | 25.2 | 26.1 | 26.9 | 27.7 | 28.5 |
| θ = 120° | 21.1 | 22.5 | 23.8 | 24.9 | 26.0 | 27.0 | 27.9 | 28.8 | 29.7 | 30.5 | 31.2 |
| θ = 150° | 24.4 | 26.0 | 27. 5 | 28.8 | 30.0 | 31.2 | 32.3 | 33.3 | 34.3 | 35.2 | 36.1 |
Table A4.
Plating-thickness design values under different ice thicknesses h.
Table A4.
Plating-thickness design values under different ice thicknesses h.
| V0 (m/s) | 3.0 | 3.5 | 4.0 | 4.5 | 5.0 | 5.5 | 6.0 | 6.5 | 7.0 | 7.5 | 8.0 |
|---|---|---|---|---|---|---|---|---|---|---|---|
| h = 0.54 m | 19.2 | 20.5 | 21.7 | 22.7 | 23.7 | 24.6 | 25.5 | 26.3 | 27.1 | 27.8 | 28.6 |
| h = 0.64 m | 20.2 | 21.6 | 22.8 | 23.9 | 25.0 | 25.9 | 26.8 | 27.7 | 28.5 | 29.3 | 30.0 |
| h = 0.74 m | 21.1 | 22.5 | 23.8 | 24.9 | 26.0 | 27.0 | 27.9 | 28.8 | 29.7 | 30.5 | 31.2 |
| h = 0.84 m | 21.8 | 23.2 | 24.5 | 25.7 | 26.8 | 27.9 | 28.8 | 29.7 | 30.6 | 31.4 | 32.2 |
| h = 0.94 m | 22.3 | 23.8 | 25.1 | 26.4 | 27.5 | 28.5 | 29.5 | 30.5 | 31.4 | 32.2 | 33.0 |
| h = 1.04 m | 22.7 | 24.2 | 25.6 | 26.8 | 28.0 | 29.0 | 30.1 | 31.0 | 31.9 | 32.8 | 33.6 |
Table A5.
Plating-thickness design values under different ice masses m0.
Table A5.
Plating-thickness design values under different ice masses m0.
| V0 (m/s) | 3.0 | 3.5 | 4.0 | 4.5 | 5.0 | 5.5 | 6.0 | 6.5 | 7.0 | 7.5 | 8.0 |
|---|---|---|---|---|---|---|---|---|---|---|---|
| m0 = 1000 kg | 11.1 | 12.1 | 13.0 | 13.8 | 14.6 | 15.3 | 15.9 | 16.5 | 17.1 | 17.7 | 18.2 |
| m0 = 5000 kg | 16.6 | 17.8 | 18.9 | 19.9 | 20.8 | 21.6 | 22.4 | 23.2 | 23.9 | 24.6 | 25.2 |
| m0 = 10,000 kg | 19.4 | 20.7 | 21.9 | 23.0 | 24.0 | 24.9 | 25.8 | 26.6 | 27.4 | 28.2 | 28.9 |
| m0 = 15,000 kg | 21.1 | 22.5 | 23.8 | 24.9 | 26.0 | 27.0 | 27.9 | 28.8 | 29.7 | 30.5 | 31.2 |
| m0 = 20,000 kg | 22.4 | 23.8 | 25.2 | 26.4 | 27.5 | 28.6 | 29.5 | 30.5 | 31.4 | 32.2 | 33.0 |
| m0 = 25,000 kg | 23.4 | 24.9 | 26.3 | 27.6 | 28.7 | 29.8 | 30.8 | 31.8 | 32.7 | 33.6 | 34.4 |
| m0 = 30,000 kg | 24.3 | 25.9 | 27.3 | 28.6 | 29.8 | 30.9 | 32.0 | 32.9 | 33.9 | 34.8 | 35.6 |
References
- IACS. Unified Requirement Polar Class; International Association Classification of Societies: London, UK, 2016. [Google Scholar]
- DNV. Rules for Classification of Ships. In Ships for Navigation in Ice; Det Norske Veritas: Oslo, Norway, 2013. [Google Scholar]
- RMRS. Rules for the Classification and Construction of Sea-Going Ships; Russian Maritime Register of Shipping: Saint-Petersburg, Russia, 2016. [Google Scholar]
- LR. Rules and Regulations for the Classification of Ships; Lloyd’s Register: London, UK, 2017. [Google Scholar]
- FSICR. Ice Class Regulations and the Application Thereof (Finnish-Swedish Ice Class Regulations); Finnish Transport Safety Agency: Helsinki, Finland, 2017. [Google Scholar]
- CCS. Guidelines for Polar Ship; China Classification Society: Beijing, China, 2023. [Google Scholar]
- Ritch, R.; Frederking, R.; Johnston, M.; Browne, R.; Ralph, F. Local ice pressures measured on a strain gauge panel during the CCGS Terry Fox bergy bit impact study. Cold Reg. Sci. Technol. 2008, 52, 29–49. [Google Scholar] [CrossRef]
- Gagnon, R.E.; Derradji-Aouat, A. First results of numerical simulations of bergy bit collisions with the CCGS Terry Fox icebreaker. In Proceedings of the 18th IAHR International Symposium on Ice, Sapporo, Japan, 28 August–1 September 2006. [Google Scholar]
- Gagnon, R.; Andrade, S.L.; Quinton, B.; Colbourne, B. Pressure distribution data from large double-pendulum ice impact tests. Cold Reg. Sci. Technol. 2020, 175, 103033. [Google Scholar] [CrossRef]
- Ince, S.T.; Kumar, A.; Park, D.K.; Paik, J.K. An advanced technology for structural crashworthiness analysis of a ship colliding with an ice-ridge: Numerical modelling and experiments. Int. J. Impact Eng. 2017, 110, 112–122. [Google Scholar] [CrossRef]
- Kim, H.; Daley, C.; Kim, H. Evaluation of large structural grillages subjected to ice loads in experimental and numerical analysis. Mar. Struct. 2018, 61, 467–502. [Google Scholar] [CrossRef]
- Zhu, L.; Cai, W.; Chen, M.; Tian, Y.; Bi, L. Experimental and numerical analyses of elastic-plastic responses of ship plates under ice floe impacts. Ocean Eng. 2020, 218, 108174. [Google Scholar] [CrossRef]
- Cai, W.; Zhu, L.; Qian, X. Dynamic responses of steel plates under repeated ice impacts. Int. J. Impact Eng. 2022, 162, 104129. [Google Scholar] [CrossRef]
- Jang, H.-S.; Hwang, S.-Y.; Lee, J.H. Experimental Evaluation and Validation of Pressure Distributions in Ice–Structure Collisions Using a Pendulum Apparatus. J. Mar. Sci. Eng. 2023, 11, 1761. [Google Scholar] [CrossRef]
- Kim, E.; Storheim, M.; Amdahl, J.; Løset, S.; Bock und Polach, R.U.F. Laboratory experiments on shared-energy collisions between freshwater ice blocks and a floating steel structure. Ships Offshore Struct. 2017, 12, 530–544. [Google Scholar] [CrossRef]
- Liu, Z.; Amdahl, J.; Løset, S. Plasticity based material modelling of ice and its application to ship–iceberg impacts. Cold Reg. Sci. Technol. 2011, 65, 326–334. [Google Scholar] [CrossRef]
- Shi, C.; Hu, Z.; Ringsberg, J.; Luo, Y. Validation of a temperature-gradient-dependent elastic-plastic material model of ice with finite element simulations. Cold Reg. Sci. Technol. 2017, 133, 15–25. [Google Scholar] [CrossRef]
- Yu, T.; Liu, K.; Wang, J.; Wang, Z. Establishment and verification of a constitutive model of ice material considering the effect of temperature. J. Mar. Sci. Eng. 2020, 8, 193. [Google Scholar] [CrossRef]
- Mokhtari, M.; Kim, E.; Amdahl, J. Pressure-dependent plasticity models with convex yield loci for explicit ice crushing simulations. Mar. Struct. 2022, 84, 103233. [Google Scholar] [CrossRef]
- Yu, T.; Liu, K.; Wang, G.G.; Liu, J.; Wang, Z. A tri-axial ice model for simulating ice-stiffened panel impact: Experiments and numerical modeling. Mar. Struct. 2023, 88, 103358. [Google Scholar] [CrossRef]
- Cai, W.; Zhu, L.; Yu, T.X.; Li, Y. Numerical simulations for plates under ice impact based on a concrete constitutive ice model. Int. J. Impact Eng. 2020, 143, 103594. [Google Scholar] [CrossRef]
- Yu, Z.; Lu, W.; van den Berg, M.; Amdahl, J.; Løset, S. Glacial ice impacts: Part II: Damage assessment and ice-structure interactions in accidental limit states (ALS). Mar. Struct. 2021, 75, 102889. [Google Scholar] [CrossRef]
- Chen, Z.; Zhao, W.; Chen, Z.; Feng, G.; Ren, H.; Gui, H. Dynamic Response Analysis of Submarines Based on FEM-ALE Coupling Method in Floating Ice Conditions. J. Mar. Sci. Eng. 2023, 11, 1560. [Google Scholar] [CrossRef]
- Zhou, L.; Wang, F.; Diao, F.; Ding, S.; Yu, H.; Zhou, Y. Simulation of ice-propeller collision with cohesive element method. J. Mar. Sci. Eng. 2019, 7, 349. [Google Scholar] [CrossRef]
- Zhu, L.; Faulkner, D. Damage estimate for plating of ships and platforms under repeated impacts. Mar. Struct. 1996, 9, 697–720. [Google Scholar] [CrossRef]
- Zhu, L.; Shi, S.; Jones, N. Dynamic response of stiffened plates under repeated impacts. Int. J. Impact Eng. 2018, 117, 113–122. [Google Scholar] [CrossRef]
- Guo, K.; Mu, M.; Cai, W.; Xu, B.; Zhu, L. Theoretical Analysis of Plastic Behavior of Sandwich Beam with Metal Foam under Repeated Impacts. J. Mar. Sci. Eng. 2023, 11, 1974. [Google Scholar] [CrossRef]
- Cai, W.; Zhu, L.; Gudmestad, O.T.; Guo, K. Application of rigid-plastic theory method in ship-ice collision. Ocean Eng. 2022, 253, 111237. [Google Scholar] [CrossRef]
- Jackson, R.I.; Frieze, P.A. Design of deck structures under wheel loads. Nav. Archit. 1981, 3, 119–144. [Google Scholar]
- Hughes, O.F. Design of laterally loaded plating-uniform pressure loads. J. Ship Res. 1981, 25, 77–89. [Google Scholar] [CrossRef]
- Konieczny, L.; Bogdaniuk, M. Design of transversely loaded plating based on allowable permanent set. Mar. Struct. 1999, 12, 497–519. [Google Scholar] [CrossRef]
- Daley, C.G. Derivation of plastic framing requirements in polar ships. Mar. Struct. 2002, 15, 543–559. [Google Scholar] [CrossRef]
- Daley, C.G. Application of plastic framing requirements for polar ships. Mar. Struct. 2002, 15, 533–542. [Google Scholar] [CrossRef]
- Daley, C.G.; Daley, K.H.; Dolny, J.; Quinton, B.W.T. Overload response of flatbar frames to ice loads. Ships Offshore Struct. 2017, 12, 68–81. [Google Scholar] [CrossRef]
- Hong, L.; Amdahl, J. Plastic design of laterally patch loaded plates for ships. Mar. Struct. 2007, 20, 124–142. [Google Scholar] [CrossRef]
- Zhu, L.; Shi, S.; Yu, T.X. A New Ice Load Response Model for Structural Design of Ice Classed Ships. In Proceedings of the International Ocean and Polar Engineering Conference, Kona, HI, USA, 21–26 June 2015. [Google Scholar]
- Zhu, L.; Cai, W.; Frieze, P.A.; Shi, S. Design Method for Steel Deck Plates under Quasi-static Patch Loads with Allowable Plastic Deformations. Mar. Struct. 2020, 71, 102702. [Google Scholar] [CrossRef]
- Kim, H.; Quinton, B. Evaluation of moving ice loads on an elastic plate. Mar. Struct. 2016, 50, 127–142. [Google Scholar] [CrossRef]
- Quinton, B.W.T.; Daley, C.G.; Gagnon, R.E. Response of IACS URI ship structures to real-time full-scale operational ice loads. Transactions. Soc. Nav. Archit. Mar. Eng. 2012, 120, 203–209. [Google Scholar]
- Masterson, D.M.; Frederking, R.M.W. Local contact pressures in ship/ice and structure/ice interactions. Cold Reg. Sci. Technol. 1993, 21, 169–185. [Google Scholar] [CrossRef]
- Masterson, D.M.; Frederking, R.M.W.; Wright, B.; Karna, T.; Maddock, W.P. A revised ice pressure-area curve. In Proceedings of the 19th International Conference on Port and Ocean Engineering under Arctic Conditions, Dalian, China, 27–30 June 2007; Volume 1, pp. 305–314. [Google Scholar]
- Palmer, A.C.; Dempsey, J.P.; Masterson, D.M. A revised ice pressure-area curve and a fracture mechanics explanation. Cold Reg. Sci. Technol. 2009, 56, 73–76. [Google Scholar] [CrossRef]
- Timco, G.W.; Sudom, D. Revisiting the Sanderson pressure–area curve: Defining parameters that influence ice pressure. Cold Reg. Sci. Technol. 2013, 95, 53–66. [Google Scholar] [CrossRef]
- Zhu, L.; Qiu, X.; Chen, M.; Yu, T.X. Simplified Ship-ice Collision Numerical Simulations. In Proceedings of the 26th International Ocean and Polar Engineering Conference, Rhodes, Greece, 26 June–1 July 2016. [Google Scholar]
- API RP 2N; Planning, Designing and Constructing Structures and Pipelines for Arctic Conditions. 2nd ed. American Petroleum Institute: Washington, DC, USA, 1995.
- ISO/CD 19906; Petroleum and Natural Gas Industries-Arctic Offshore Structures, ISOTC67/SC7/WG 8, Final Draft International Standard. International Standardizations Organization: Geneva, Switzerland, 2010.


Disclaimer/Publisher’s Note: The statements, opinions and data contained in all publications are solely those of the individual author(s) and contributor(s) and not of MDPI and/or the editor(s). MDPI and/or the editor(s) disclaim responsibility for any injury to people or property resulting from any ideas, methods, instructions or products referred to in the content. |
© 2024 by the authors. Licensee MDPI, Basel, Switzerland. This article is an open access article distributed under the terms and conditions of the Creative Commons Attribution (CC BY) license (https://creativecommons.org/licenses/by/4.0/).