Article

Hydrodynamic Performance and Mooring Safety Assessment of an Offshore Floating Movable Fish Cage

1
Fisheries Engineering Division, National Institute of Fisheries Science, Busan 46083, Republic of Korea
2
School of Electrical and Control Engineering, Tongmyong University, Busan 48520, Republic of Korea
*
Author to whom correspondence should be addressed.
J. Mar. Sci. Eng. 2024, 12(12), 2351; https://doi.org/10.3390/jmse12122351
Submission received: 21 November 2024 / Revised: 16 December 2024 / Accepted: 17 December 2024 / Published: 21 December 2024
(This article belongs to the Special Issue Numerical Analysis and Modeling of Floating Structures)

Abstract

:
This study evaluates the hydrodynamic performance of a movable fish cage equipped with a spread mooring system in offshore condition. It investigates the global behavior and safety of a mooring system under environmental influences such as waves, currents, and biofouling. A numerical model was developed using the Cummins equation and a lumped-mass line model to capture the coupling effects between the floating structure and mooring lines. The steel frame was modeled using Morison members, whereas fishing nets were represented by a screen model incorporating drag forces. Parametric studies were performed to assess the effects of varying mooring line lengths, current speeds, and biofouling on cage behavior. Evidently, heavier chains reduced excursions but increased tension, whereas high current speeds increased the line tension (owing to increased drift) and mooring line stiffness by up to 66%. Biofouling increased the maximum excursion by 6% and line tension by up to 17%. Safety evaluations based on the American Bureau of Shipping rules examined intact and damaged conditions, comparing estimated line tensions with allowable values. The findings confirm that the mooring system ensures reliable station-keeping performance even under challenging conditions, validating its suitability for offshore deployment and ensuring the safety and stability of floating fish cage systems.

1. Introduction

Fish cages are aquaculture structures designed to create controlled environments for cultivating various fish species in open water. Fish cage farming has attracted increasing attention owing to depleting fishery resources and the decline in labor-intensive fishing practices. Among the various types of fish cages, floating fish cages offer advantages, such as seamless access for feeding, monitoring, and maintenance, as well as improved water circulation. Moreover, it promotes a healthier aquatic environment for fish. However, offshore fish cage farming has limitations. These facilities are generally open systems, rendering them vulnerable to environmental loads, including typhoons, algal blooms, and high water temperatures. Exposure to such natural hazards increases the risk of damage to the structures and loss of stock, necessitating robust design and effective mooring systems to ensure stability and safety under extreme environmental conditions [1].
The number of offshore fish cage aquaculture facilities has significantly increased. However, a growing trend exists toward the use of semi-submersible structures instead of traditional collar-type facilities, owing to their enhanced safety and stability. Such structures must adhere to marine design standards, particularly those established by Det Norske Veritas (DNV) or the American Bureau of Shipping (ABS) [2]. Most floating structures, including fish farms and oil and gas platforms, are analyzed solving potential theory-based 3D radiation/diffraction problems to assess hydrodynamic performance while incorporating the drag and lift effects of nets [3,4,5,6,7,8,9,10,11,12,13,14,15,16]. Finite element analysis (FEA) is suitable for evaluating mooring line behavior and performing floater–net–mooring system coupled analyses [4,17]. A common model for offshore applications is the semi-submersible offshore fishing farm (SOFF) model. Yu et al. [8] and Miao et al. [9] conducted experimental and numerical studies to analyze the hydrodynamic performance of a SOFF under regular waves, with and without uniform currents. They employed the potential theory and a simple spring-based mooring system for simplicity. Ma et al. [10] and Yue et al. [11] applied vessel-shaped floating aquaculture platforms with single-point mooring. Moreover, they modeled the system using the potential theory and the lumped-mass line model to investigate the global behavior and coupling effects under regular waves. Pang et al. [13] validated the dynamics of a vessel-shaped structure with Y-shaped moorings. Chen et al. [15] examined the hydrodynamic performance of a spread-moored semi-submersible structure certified by the China Classification Society. Zhang et al. [16] proposed a new aquaculture platform combining an upper rigid structure with lower collar-type nets, assessing the hydrodynamic impact of the netting system under irregular waves. Mohapatra and Soares [18,19] adopted a semi-analytic solution, based on the potential and linear wave theories, to evaluate the hydro-elastic behavior of an array of vertical cylindrical flexible fish cages under regular waves and ocean currents. Therefore, most studies have primarily focused on evaluating the hydrodynamics of floating aquaculture structures, with limited attention given to assessing mooring line behavior.
Considering the effects of biofouling on fish cages and the safety of mooring systems under a one-line failure scenario is critical in the design of floating fish cages. Previous studies on the biofouling effects on nets have primarily focused on evaluating drag forces, mass variation, and blockage effects [20,21,22], without addressing the hydrodynamic performance of fish cages. Additionally, studies on damaged mooring conditions have been solely focused on the assessment of the safety of mooring systems for arrays of collar-type fish cages [23,24,25], and other floating structures have rarely been explored. To the best of the authors’ knowledge, comprehensive studies evaluating the performance of offshore floating fish cages—encompassing the global performance of floating aquaculture structures, the safety of mooring systems in accordance with ship registry guidelines, and the impact of biofouling on nets—remain scarce.
This study evaluated the hydrodynamic performance of a floating movable fish cage (X-AQUDS), assessing the safety of its mooring system based on the ABS rules [26] and guidelines [27]. A movable fish cage is appealing for rearing and transporting farmed species, facilitating the cultivation of high-value and diverse species, including migratory fish. Its mobility also helps avoid natural disasters like typhoons and red tides. In 2014, the X-AQUDS was designed by the National Institute of Fisheries Science (NIFS), as shown in Figure 1, in accordance with the IMO regulations [28,29]. These include typhoons, algal blooms, and elevated sea temperatures. Kim and Jeong [30] conducted resistance tests on a fish cage in a NIFS towing tank to optimize the shield design for the netting system. In 2014, a prototype model was constructed. From 2015 to 2017, a real sea test was performed in the coastal area of Tongyeong, Republic of Korea, achieving a fish survival rate exceeding 95% during transport tests to evade extreme environmental loads. This study explores the potential applications of this cage in offshore installations. A dynamic analysis model incorporating the potential theory and the lumped-mass line model was established to evaluate the global behavior of the fish cage and its interactions with the mooring lines. The effects of the netting system were modeled by the screen model approach of Kristensen and Faltinsen’s screen-type approach [31]. The study optimized the spread mooring system, analyzed the impact of current speed and netting (including biofouling effects), and assessed the mooring system’s safety, following the ABS standards and guidelines, based on this numerical model [26,27].
This study provides valuable guidelines for optimizing mooring systems, advancing sustainable offshore aquaculture infrastructure, and ensuring system stability in challenging environments. The remainder of this study is organized as follows: Section 2 presents the mathematical formulation. Section 3 presents the numerical model and environmental conditions. Section 4 discusses the results. Section 5 concludes the study.

2. Mathematical Formulation

A floating moored fish cage comprises pontoons with steel frames, netting, and mooring lines, necessitating careful consideration of the coupling effects among these components. Although steel frames and mooring systems have slender body, pontoons are relatively blunt and generate radiated and diffracted waves. The dynamics of the fish cage can be expressed by Equation (1), based on the Cummins equation [32]. This study evaluates the global six degree-of-freedom (DOF) motions of a floating fish cage and the safety of its mooring system, with the assumption that the pontoons and steel frames function as a single rigid body without local deformation.
M + M a , ξ ¨ t + K ξ t = F w t + F C t + F D r a g t + F M t
where M , M a , , and K represent the mass matrix (including pontoons and steel frames), added mass matrix at infinite frequency, and restoring coefficient matrix, respectively. These matrices have 6 × 6 dimensions. The F w , F C , F D r a g , and F M correspond to the wave excitation load, radiation damping force, drag force, and connection force of the mooring system, respectively. The position vector ξ combines three translational motion components (surge, sway, and heave) and three rotational motion components (roll, pitch, and yaw). The overdot notation indicates time derivatives; for instance, ξ ˙ and ξ ¨ are the velocity and acceleration vectors, respectively, of the six DOF motions. The restoring coefficients are calculated based on the hydrostatic pressure and submerged volume of the fish cage.
Radiation and diffraction problems must be solved to evaluate the added masses and radiation damping coefficients. The radiation problem involves assessing the effects of radiated waves generated by an oscillating body in calm water. However, the diffraction problem examines the wave excitation loads on a fixed body subjected to incident waves. The radiation damping force vector can be expressed by Equation (2), using a memory function derived from frequency-dependent radiation damping coefficients (C) through the Fourier cosine transform expressed in Equation (3). Wave excitation loads from the diffraction problem are calculated using a 3D hydrodynamic analysis program based on potential theory and the boundary element method, as shown in Equation (4).
F C t = 0 t R τ t ξ ˙ τ d τ
R ( t ) = 2 π 0 C ( ω ) cos ( ω t ) d ω
F w t = Re j = 1 N w A j L ω j e i ω j t
where R and L represent the memory function, also known as the impulse response function, and the linear transfer function for the wave excitation loads, respectively. The variable N w denotes the number of wave-frequency components used to generate irregular waves. However, A j and ω j represent the j-th wave amplitude and its corresponding wave frequency, respectively. The wave amplitude at each wave frequency can be determined based on the wave spectrum and statistical characteristics of the design waves.
The drag force terms in the Morison equation were used to express the drag effects induced by the pontoons, steel frames, and netting. These drag forces can be expressed as shown in Equation (5), which evaluates the forces based on the drag coefficient ( C D ) and the projected area ( A P ).
F D r a g = 1 2 ρ C D A P u ξ ˙ u ξ ˙
where ρ and u denote fluid density and velocity, respectively. Since this study focuses on the net effect on the global performance of the fish cage and the mooring system safety, the net effect is applied by adopting a drag screen model. The drag coefficient is determined based on the solidity index (Sn), which is the ratio of the effective area (Apn) occupied by the net’s threads and knots to the total area (At) covered by the net, as shown in Equation (6), as well as on the Reynolds number (Re).
S n = A p n A t
The connection force vector can be evaluated iteratively by considering the interaction between the rigid body and the mooring lines. This study adopted two distinct approaches to estimate the connection forces: theoretical and numerical.
The connection forces in the theoretical approach are estimated using the catenary equation, which iteratively calculates the force based on simple line properties, such as weight, buoyancy, and axial stiffness, at each time step. Equations (7)–(9) outline the catenary equation for a freely hanging line in a vertical plane, extending between its bottom ( x b , z b ) and top ends ( x t , z t ).
t t = t b + w l u T h
x t = x b + l u 1 t t t b ln t t + 1 + t t 2 t b + 1 + t b 2 + T h E A
z t = z b + l u 1 + t t 2 1 + t b 2 t t t b + T h E A t b + t t 2
where t b and t t are the angles of the line tangents at the bottom and top ends. w , l u , T h , and E A denote the net weight of the line per unit length, unstretched length of the suspended line segment, horizontal component of tension, and axial stiffness of the line, respectively. A theoretical approach was used to identify the optimal configuration for the mooring system, minimizing the computation time. However, it does not account for environmental factors, including wave- and current-induced loading acting on the lines or bottom friction. Once the optimal condition was determined, a numerical approach was applied to analyze the detailed dynamics of the mooring system. In this model, the line is divided into discrete elements, with each element represented by two masses located at its ends and connected by massless springs and dampers, as illustrated in Figure 2. The hydrodynamic load acting on the lines from these factors can be calculated using Equation (10) because the dynamics of the mooring lines are influenced by waves and currents.
F h y = C M Δ a f C a Δ a r + 1 2 ρ D l C D v v
where C M , C a , Δ , D , and l represent the inertia coefficient matrix, added mass coefficient matrix, mass, diameter, and sectional length of each line element, respectively. a f and a r denote the fluid acceleration and the relative acceleration between the fluid and line elements.
Finally, the dynamics of a floating moored fish cage can be estimated by fully considering the coupling effects between the rigid body and the mooring system using an implicit calculation method to achieve accurate simulation results.

3. Numerical Model and Environmental Condition

The floating movable fish cage (X-AQUDS) comprised six pontoons and numerous steel frames to maintain cage space. The spaces between the frames were covered with nets to ensure the safety of the aquaculture fish, as shown in Figure 1. Six horizontal cylindrical pontoons were employed to provide buoyancy to the cages. Three pontoons existed on each side of the x-axis. Table 1 outlines the fish cage’s specifications, and the mass and restoring characteristics of the cage are presented in Table 2.
Pontoons have relatively blunt bodies; hence, the 3D radiation/diffraction problem was solved in the frequency domain by the commercial software, ANSYS AQWA 18.2. Figure 3 shows the mesh system for the six pontoons comprising 14,992 mesh elements. The torsional effects of the fish cage were neglected, and the entire structure was treated as a single rigid body. The mesh system was validated by comparing the root mean square error (RMSE) of the added mass and radiation damping coefficients for the 14,992 nodes (Table 3). The results showed a significant decrease in the RMSE with increasing node numbers. With an RMSE below 1% for all coefficients, the current mesh system was considered suitable for the present study. Figure 4 shows the frequency-dependent added masses, moments of inertia, and radiation damping coefficients at a water depth of 50 m. The added masses for the sway and heave motions were more significant than those for the surge motion, owing to the symmetrical installation of pontoons along the x-axis. The moments of inertia for the roll motion were superior to those for the pitch and yaw motions. These tendencies were observable for the radiation damping coefficients. This configuration enables seamless cage movement to a sheltered location during typhoons.
Figure 5 illustrates the numerical model of the moored fish cage (X-AQUDS). Figure 6 shows the layout of the spread mooring system. A numerical model was constructed by adding steel frames to six pontoons, totaling 94 steel frames, each with a diameter of 216.3 mm. We modeled pontoons and steel frames as rigid bodies, focusing solely on the inertia and drag effects. Fish cages were anchored to four groups of mooring lines, with each group comprising two lines. Each group was positioned at a 55° angle relative to the x-axis, with a 10° separation between the lines within each group (Figure 6). The mooring lines had a horizontal radius of 290 m from the origin. In this study, we examined four lengths of these lines, ranging from 285 m to 300 m at 5 m intervals. The mooring system was composed of studless chains, as illustrated in Table 4 [34]. The added mooring lines mass and drag coefficients were 1.0 and 1.2, respectively. The drag coefficient of the steel frame of the fish cage was 1.2.
The drag coefficient for the netting was determined based on the solidity ratio (Sn) and Reynolds number (Re). This study employed the empirical formula using Sn and Re proposed by Ninu et al. [35]. They conducted experiments to determine the drag coefficients of typical nylon fishing nets with and without biofouling and provided the empirical formula as Equation (11).
C D = a n R e + b n
where an and bn are constants obtained by the experiment. Table 5 illustrates the solidity ratios, the constants, and the drag coefficients for different net conditions. This study used nylon nets with a similar solidity ratio as in the work of Ninu et al. [35]. Hence, the drag coefficient values can be directly applied to estimate the effects of nets and biofouling. A drag screen model was employed, and the instantaneous drag coefficient of the nets was evaluated by considering the Reynolds number and wetted surface area of each part at each timestep.
The environmental design conditions for this study were selected based on the study by Hong et al. [36]. They built a numerical estimation model using SWAN based on the design environmental conditions, providing offshore design wave conditions for the Korean Peninsula. In accordance with the ABS guidelines [27], a 50-year return period of wave and current conditions can be used as design environmental condition for mobile mooring systems. Table 6 illustrates the design of the environmental conditions. The JONSWAP wave spectrum was adopted to generate irregular waves, with the enhancement factor calculated in accordance with the DNV GL rules [37]. Figure 7 displays the time series and power spectral densities of wave elevation and the vertical current profile. The calculated wave statistics showed a significant wave height of 6.5498 m and a peak wave period of 10.76 s. The reconstructed wave spectrum aligned closely with the theoretical solution, differing by less than 3%. A vertical current profile was calculated using the seventh power law with no directional variation along the z-axis. The wave and current directions were aligned to represent the worst-case scenario for a floating structure. Two environmental conditions were applied: a maximum excursion condition (LC1) and a maximum tension condition (LC2). The maximum excursion condition occurs when incoming waves and coplanar currents impact the front of the structure. However, the maximum tension condition occurs when environmental loads are applied to the center of the mooring line group, as shown in Figure 6.

4. Results

This study aimed to evaluate the dynamics of a floating moveable fish cage with a spread mooring system situated far from the seashore, assessing the safety of the mooring system according to the ABS rules [18,19].

4.1. Motion Response Amplitude Operators of the Freely Floating Fish Cage

The motion response amplitude operators (RAOs) of the freely floating fish cages were evaluated based on the numerical model (Section 2). Three different calculation scenarios were considered to assess the effects of the steel frames and netting system: (1) pontoons only, (2) pontoons with steel frames, and (3) pontoons with steel frames and nets. However, the local deformation in the numerical model was not considered. The analysis considered a freely floating body with incoming waves at an incident angle of 0°. Thus, we compared the displacements of the heave and pitch motions. While Figure 8 shows the time series of these motion displacements, Figure 9 shows the motion RAOs. When analyzing the time series, the drag effects from the steel frames and nets yielded smaller motion displacements and phase angle differences. We compared the motion RAOs from the frequency and time domain analyses to validate the numerical model, as depicted in Figure 9. The frequency domain results were obtained by solving the 3D radiation/diffraction problem. These results are in good agreement. Excessive motion reduction due to the drag effects from additional structures (steel frames and nets) is observed near the natural frequency. This drag damping typically reduces motion at the natural frequency, and the results align with these trends. The damped natural frequencies for the heave and pitch motions were 1.05 and 0.7 rad/s, respectively.

4.2. Dynamics of a Moored Fish Cage

For station-keeping, a spread mooring system was applied to the cage by employing eight mooring lines. Two wave and current heading angles were applied to assess the maximum excursion and mooring line tension. First, we considered the maximum excursion condition, whereby the incident angle was 0°. Moreover, the motion displacement and mooring line tensions were observable. All the simulations involving irregular waves were conducted for 1 h with a time step of 0.025 s. For a one-hour simulation, the theoretical approach to calculating connection forces requires a computational cost of 6 h. Table 6 illustrates the environmental conditions. Two mooring line chains were used with a mooring line length of 290 m (Table 2). Figure 10 illustrates the three degree-of-freedom motion (surge, heave, and pitch) displacements. When the heave and pitch motions were compared, no significant differences were observed depending on the chain type. The maximum excursion was more noticeable with the lighter chain than with the heavier chain (owing to its greater stiffness). The low-frequency surge motion was more evident with the lighter chain than with the heavier chain, as observed in the power spectral densities. Consequently, the maximum excursion was significantly affected by the chain weight, whereas the other motion modes were less affected. Additionally, an analysis of the motion response spectrum indicated that the peak frequency of the primary responses aligned with the wave peak frequency because the incident waves had a longer peak period than the natural period of the cage.
The mooring line tensions were compared under two different chain conditions, as shown in Figure 11. A heavier chain yielded a more significant static tension across all the mooring lines. Owing to the drifting of the moored fish cage in the positive x-direction under the influence of surface currents, mooring lines #7 and #8 experienced higher tension than mooring lines #1 and #2, with line #8 exhibiting the maximum tension. No significant differences were observable in the motion responses at the wave peak frequency depending on the chain type. The heavier chain demonstrated higher line tension owing to its greater stiffness.
Subsequently, the maximum tension condition was applied to assess the safety of the mooring system. Compared with the maximum excursion condition, where only three DOF motions were considered, this scenario required the consideration of six DOF motions because environmental loading was applied along the mooring lines. Figure 12 illustrates the trajectory of the fish cage. Table 7 illustrates the statistical values of the global motion of the cage, including the mean and standard deviation of the six DOF motions. The excursion range was broader when using the lighter chain owing to its weaker static tension than that of the heavier chain, as shown in Figure 10. Evaluation of the hydrodynamic characteristics revealed that the mean surge and sway motions were attributable to the chain diameter. However, the standard deviations of the surge, sway, and heave motions were nearly identical despite the chain diameter. The differences in the rotational motion displacements were also insignificant. Figure 13 shows the time histories and power spectral densities of the line tensions for the two mooring lines that experienced the highest tension. The maximum tension was observed in line #8 and was significantly higher than that in the maximum excursion scenario. The case with a chain diameter of 32 mm exhibited a more significant drift, yielding a higher line tension level. The spectral analysis of line tension indicated that its spectral tendencies aligned closely with those of the motion responses. The wave-frequency motion responses predominantly affected line tension, with a minor contribution from the low-frequency motion responses.

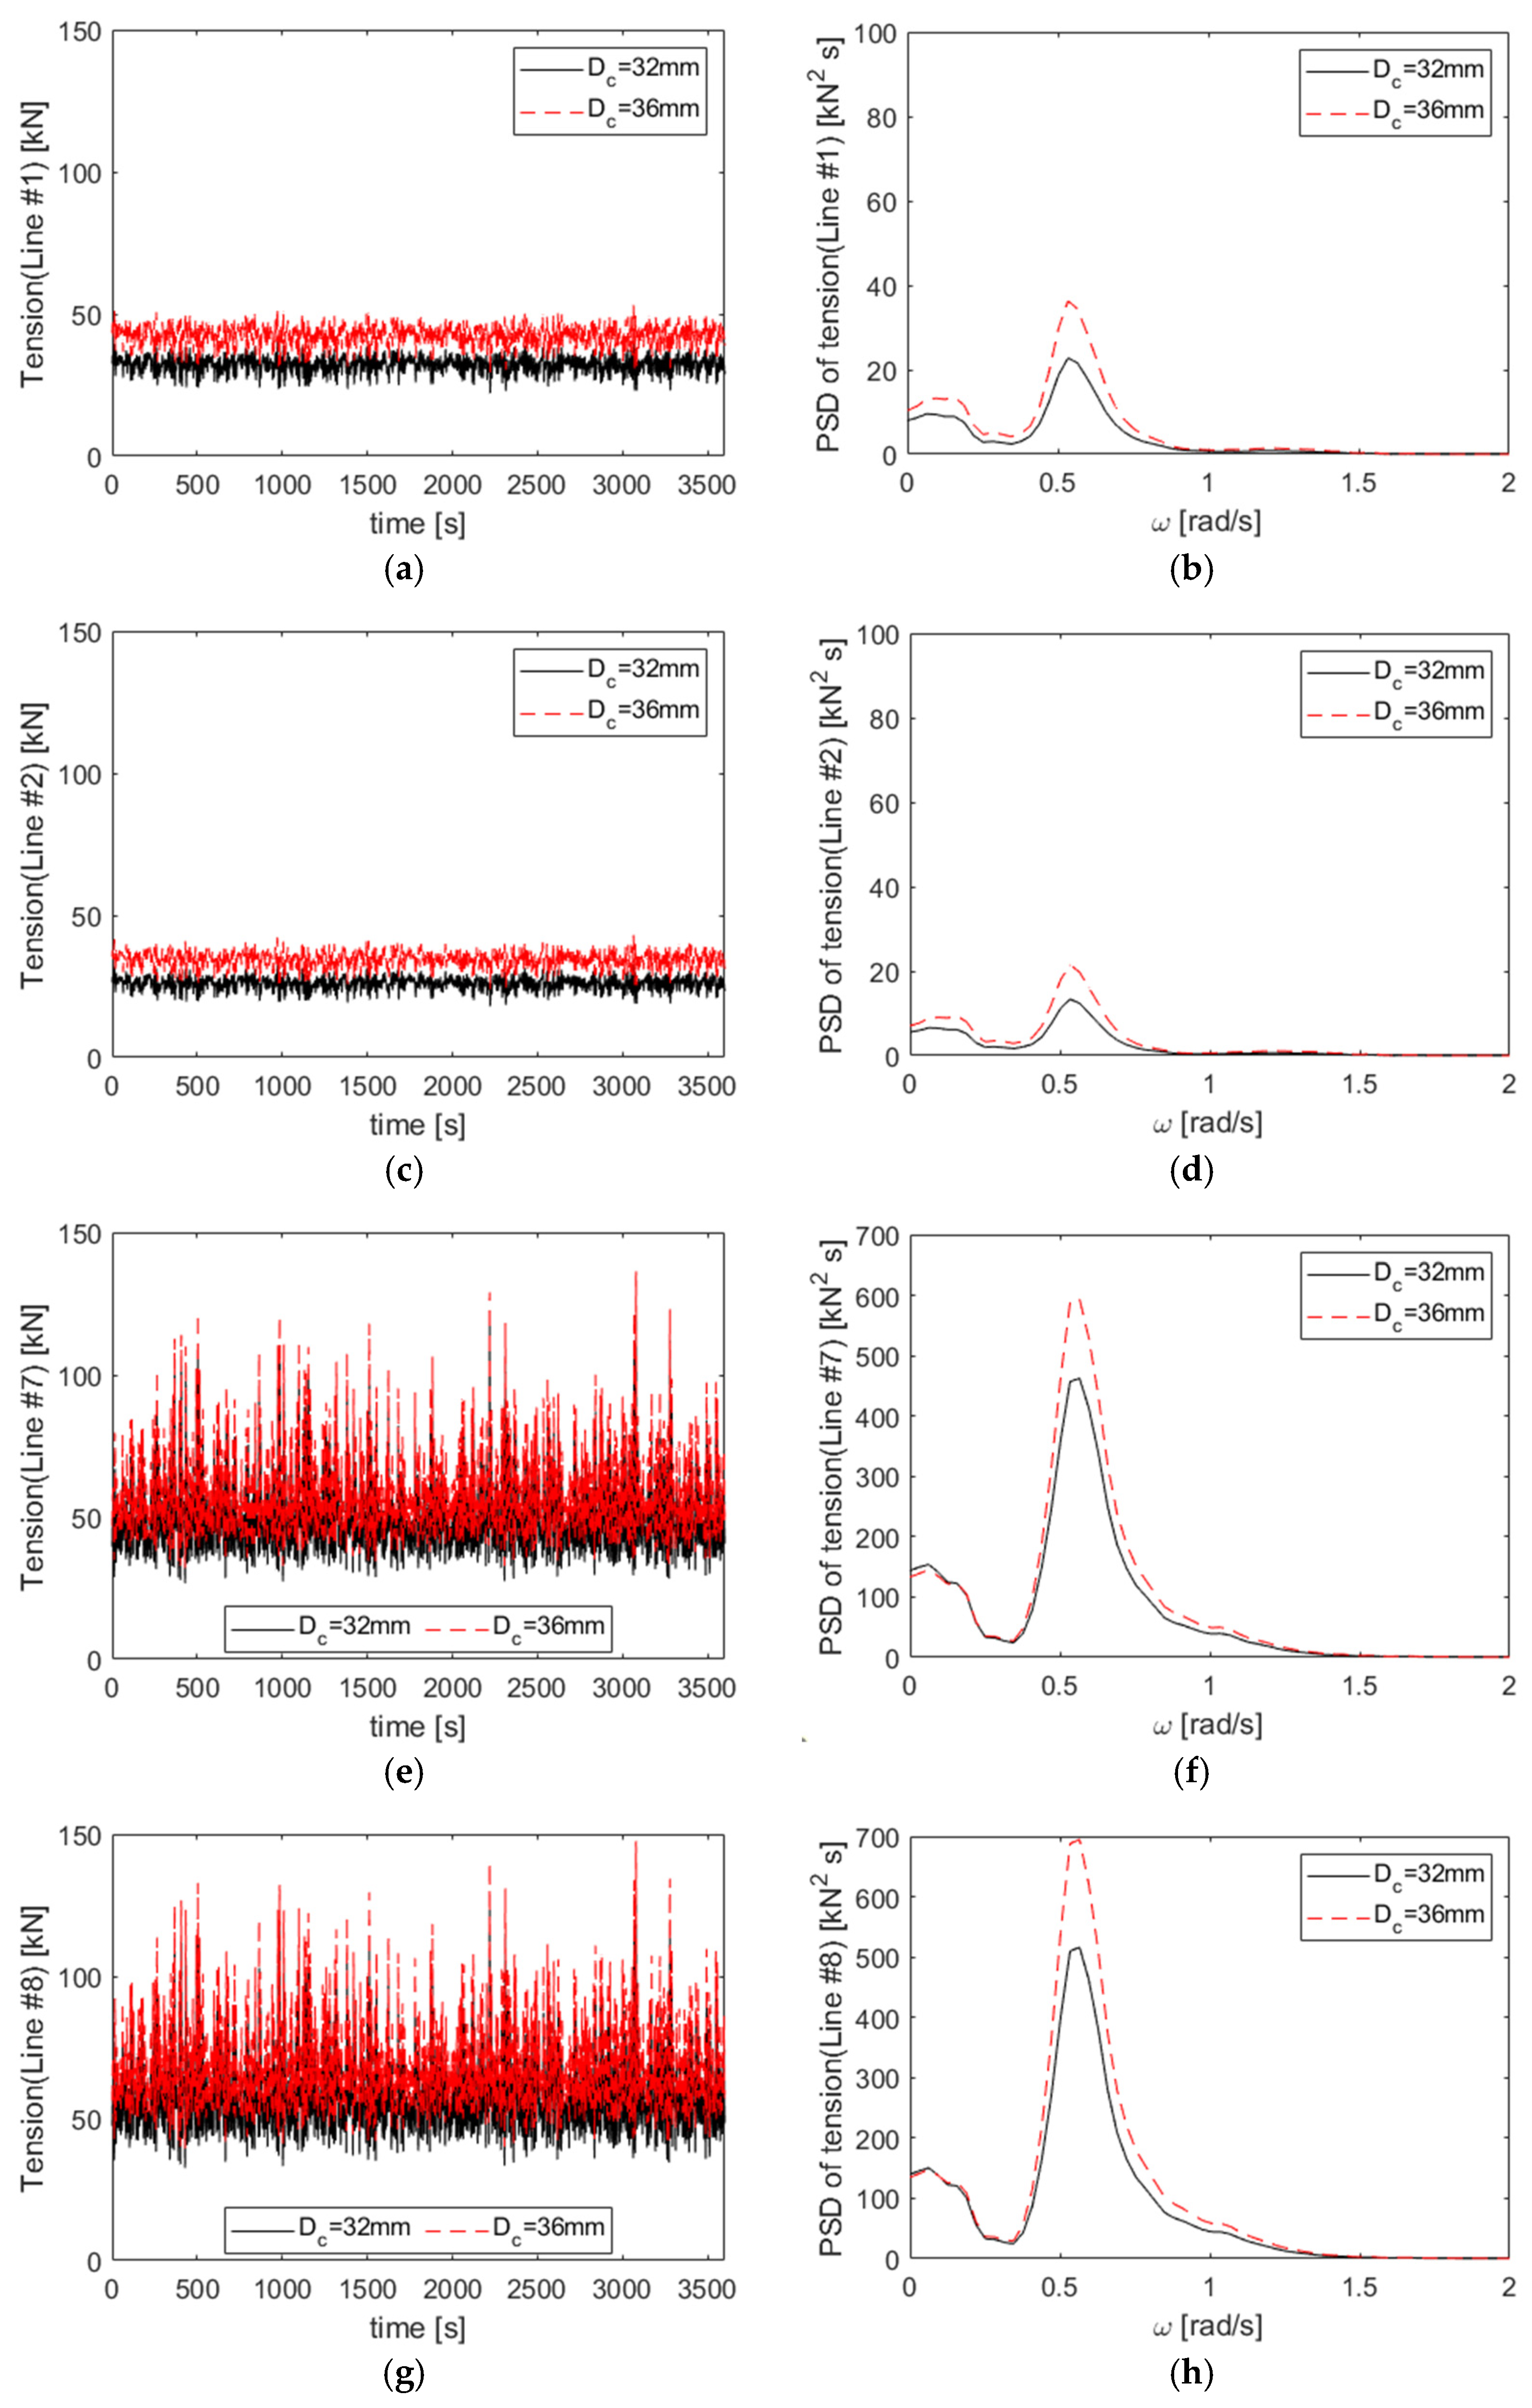
4.3. Effect of Mooring Line Length

We conducted a parametric study to examine the effect of mooring line length. The weight, pretension, and fairlead angle of the mooring lines were controlled by adjusting the line length while keeping the anchor and fairlead points fixed. Therefore, four different line lengths ranging from 285 to 300 m were applied. We used a catenary equation-based theoretical approach to minimize computational cost. Table 8 illustrates the hydrodynamic characteristics of the fish cage under the maximum excursion conditions. Table 9 illustrates the statistical values of the line tensions under the maximum tension conditions. Longer mooring lines yielded a superior maximum excursion and a more significant heave motion owing to the reduced pretension in the mooring system. Conversely, the pitch motion decreased as the mooring line length increased because a stiffer mooring line induced superior rotational motion. Regarding the longest mooring line, the maximum excursion was approximately half the water depth, suitable for designing the mooring system of the cage.
The safety of the mooring system was evaluated by comparing the maximum measured tension with the maximum allowable tension, calculated by dividing the minimum breaking load by the factor of safety (FoS). For intact mobile and permanent mooring systems under extreme design conditions, the FoS was 1.67 in accordance with the ABS rules. For a damaged floating structure, such as a one-line broken structure under similar environmental conditions, the FoS was 1.25. The maximum allowable tensions for the two chain diameters under intact conditions were 535.9 and 673.6 kN, respectively. A mooring system with heavier chain lines was suitable for this fish cage because the maximum tension of all mooring line lengths with lighter chains surpassed the allowable tension owing to the lower pretension in the lines. Moreover, longer mooring lines yielded a lower maximum tension and reduced tension variability related to fatigue damage. Therefore, longer mooring lines enhanced the safety of fish cage systems. Moreover, a mooring line length of 290 m with a chain diameter of 36 mm was selected owing to its insignificant excursion and the validated safety of the mooring lines at a low cost for the mooring system.

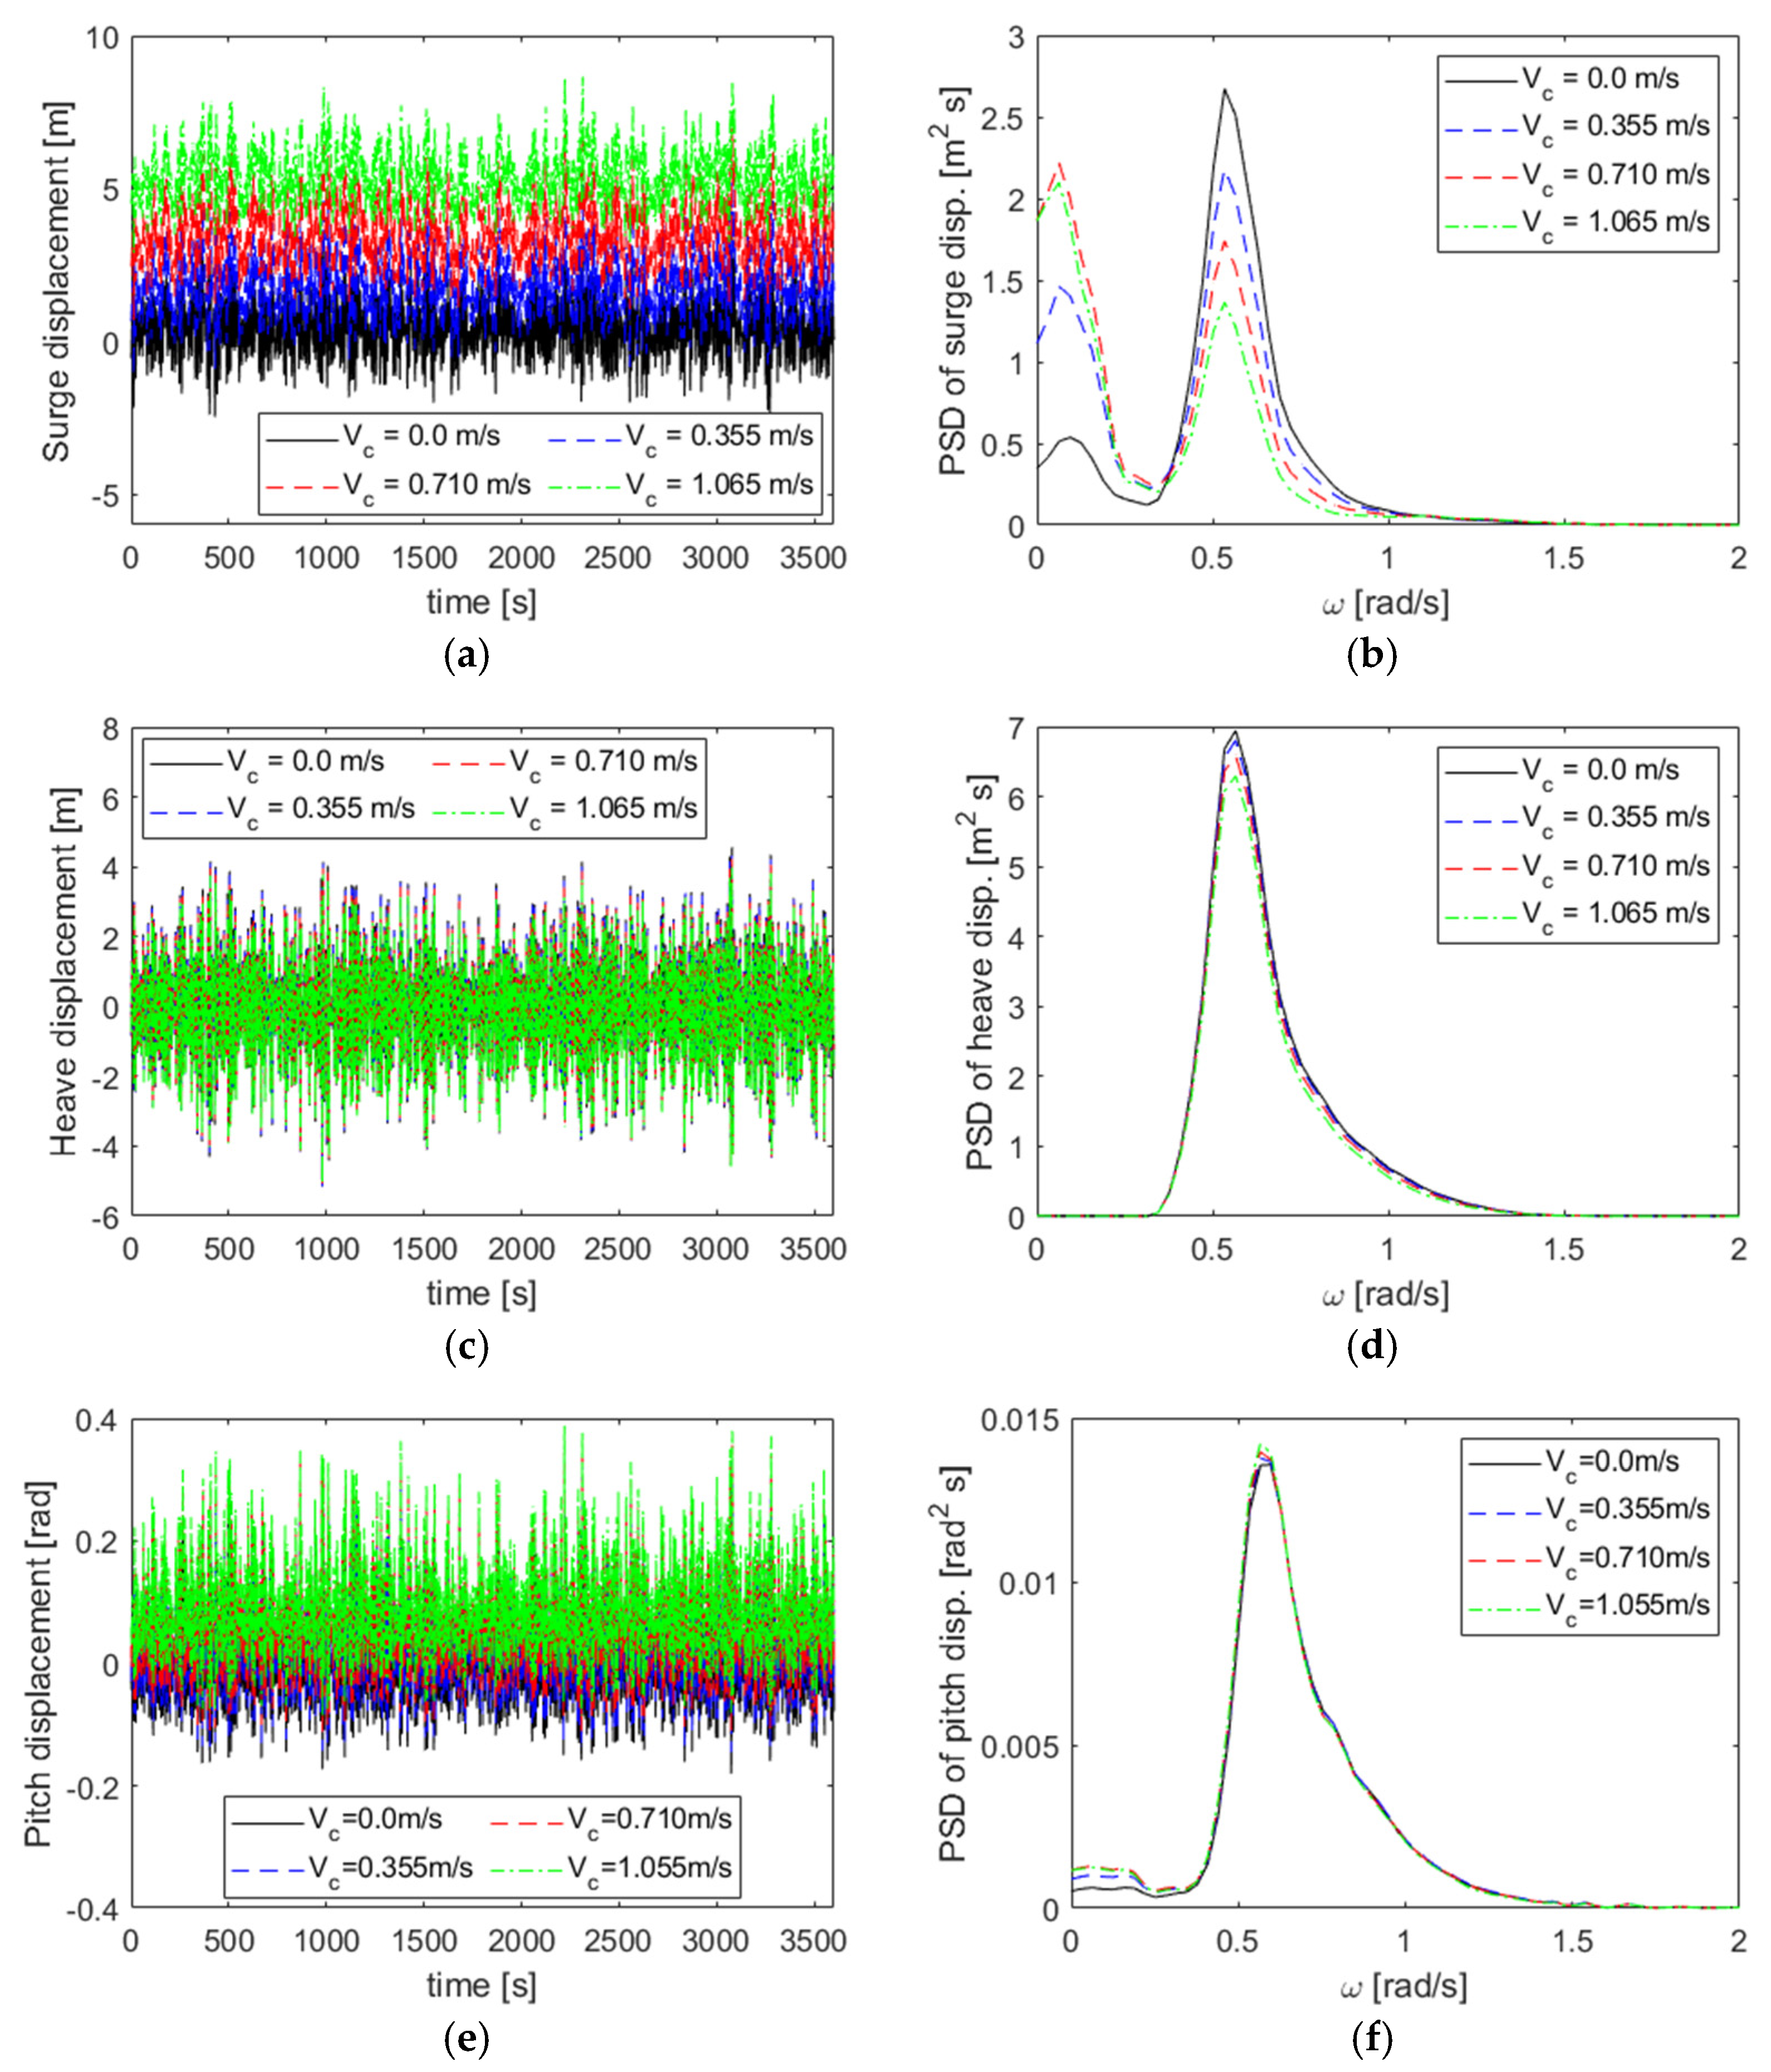
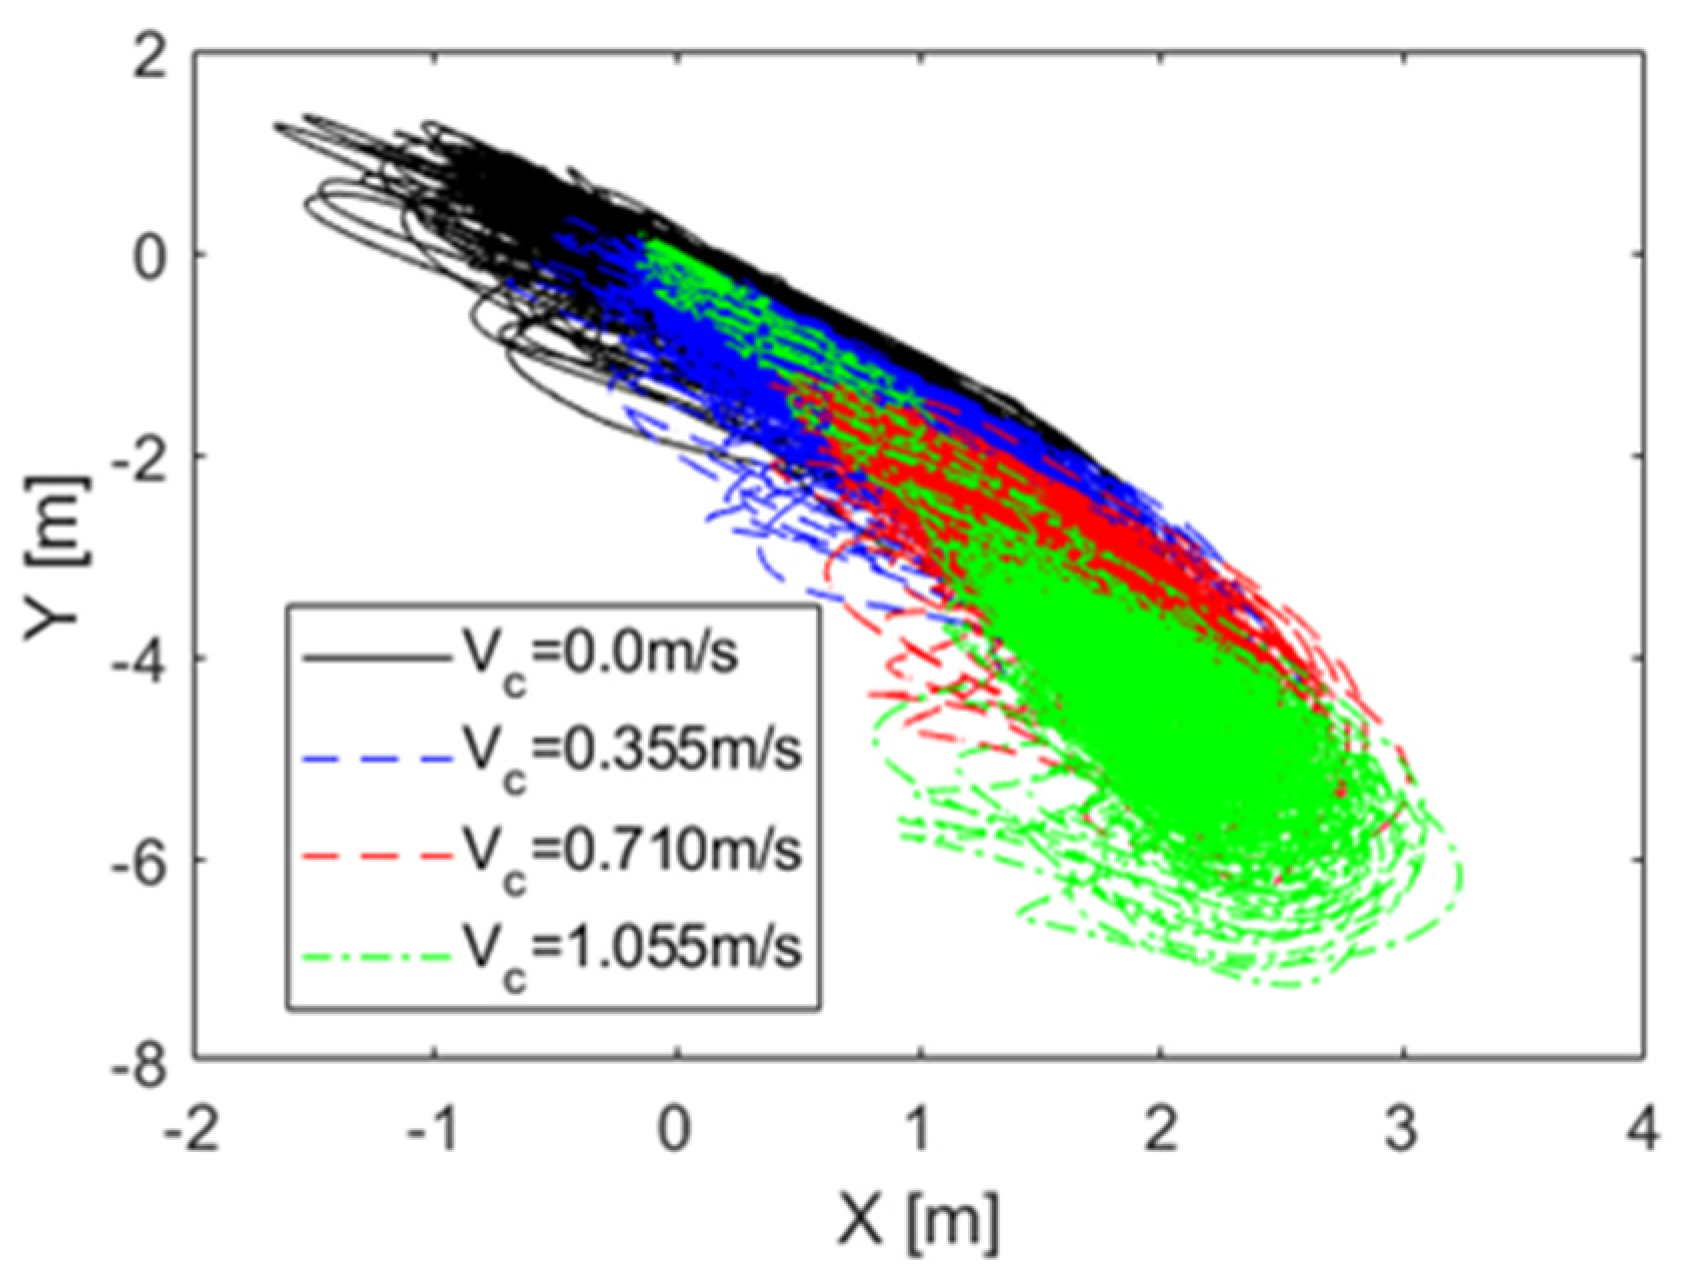
4.4. Effect of Surface Current Speed

The optimal mooring conditions selected in the previous section were applied for further analysis. This study conducted a finite element analysis employing the lumped-mass line model approach to analyze the line dynamics and coupling effect between a fish cage and mooring lines. The theoretical approach and the FE-based numderical approach required 6 and 12 h of computational times, respectively. The maximum tension condition (LC2) requires approximately 24 h of computational time owing to its dependency on environmental conditions. Figure 14 shows the motion responses at different surface current speeds under the maximum excursion conditions. The surge motion responses were significantly affected by the current speed. The fish cage experienced greater drift, stretching the mooring lines under high current speeds. Moreover, the stiffness of the mooring system increased, reducing the motion responses around the wave peak frequency. However, the heave and pitch motions were not significantly affected by changes in the current speed. Figure 15 illustrates the mooring line tension at various surface current speeds. Although the smaller wave-frequency surge motion responses were observable at higher current speeds, the mooring line tension was higher. This was attributable to the stiffened mooring lines inducing significant tension at the wave peak frequency despite the insignificant corresponding motion responses. Consequently, higher current speeds negatively affected the safety of the mooring system by increasing the mooring line tensions.
The maximum tension condition was used as an input to evaluate the hydrodynamic performance of the fish cage and the safety of the mooring system. Figure 16 illustrates the trajectory of the cage under various current speed conditions. With an incident wave and current angle of −55°, the cage moved southeast. As the current speed increases, the mean position moves farther from the origin, as shown in Figure 14a. Table 10 illustrates the maximum excursion and statistical values of the line tensions. As the current speed increased, the maximum excursion and statistical values of the line tensions increased. At a current speed of 1.055 m/s, the tension in line #8 surpassed the permissible limit of 673.6 kN, which is determined by dividing the minimum breaking load by the safety factor. This result suggests that the structural stability of the movable fish cage is compromised at speeds above 1 m/s, which must be maintained to ensure integrity. Since maximum tension and its variability are closely linked to mooring lines’ structural failure and fatigue damage, the current speed must be carefully accounted for in the design of mooring systems.

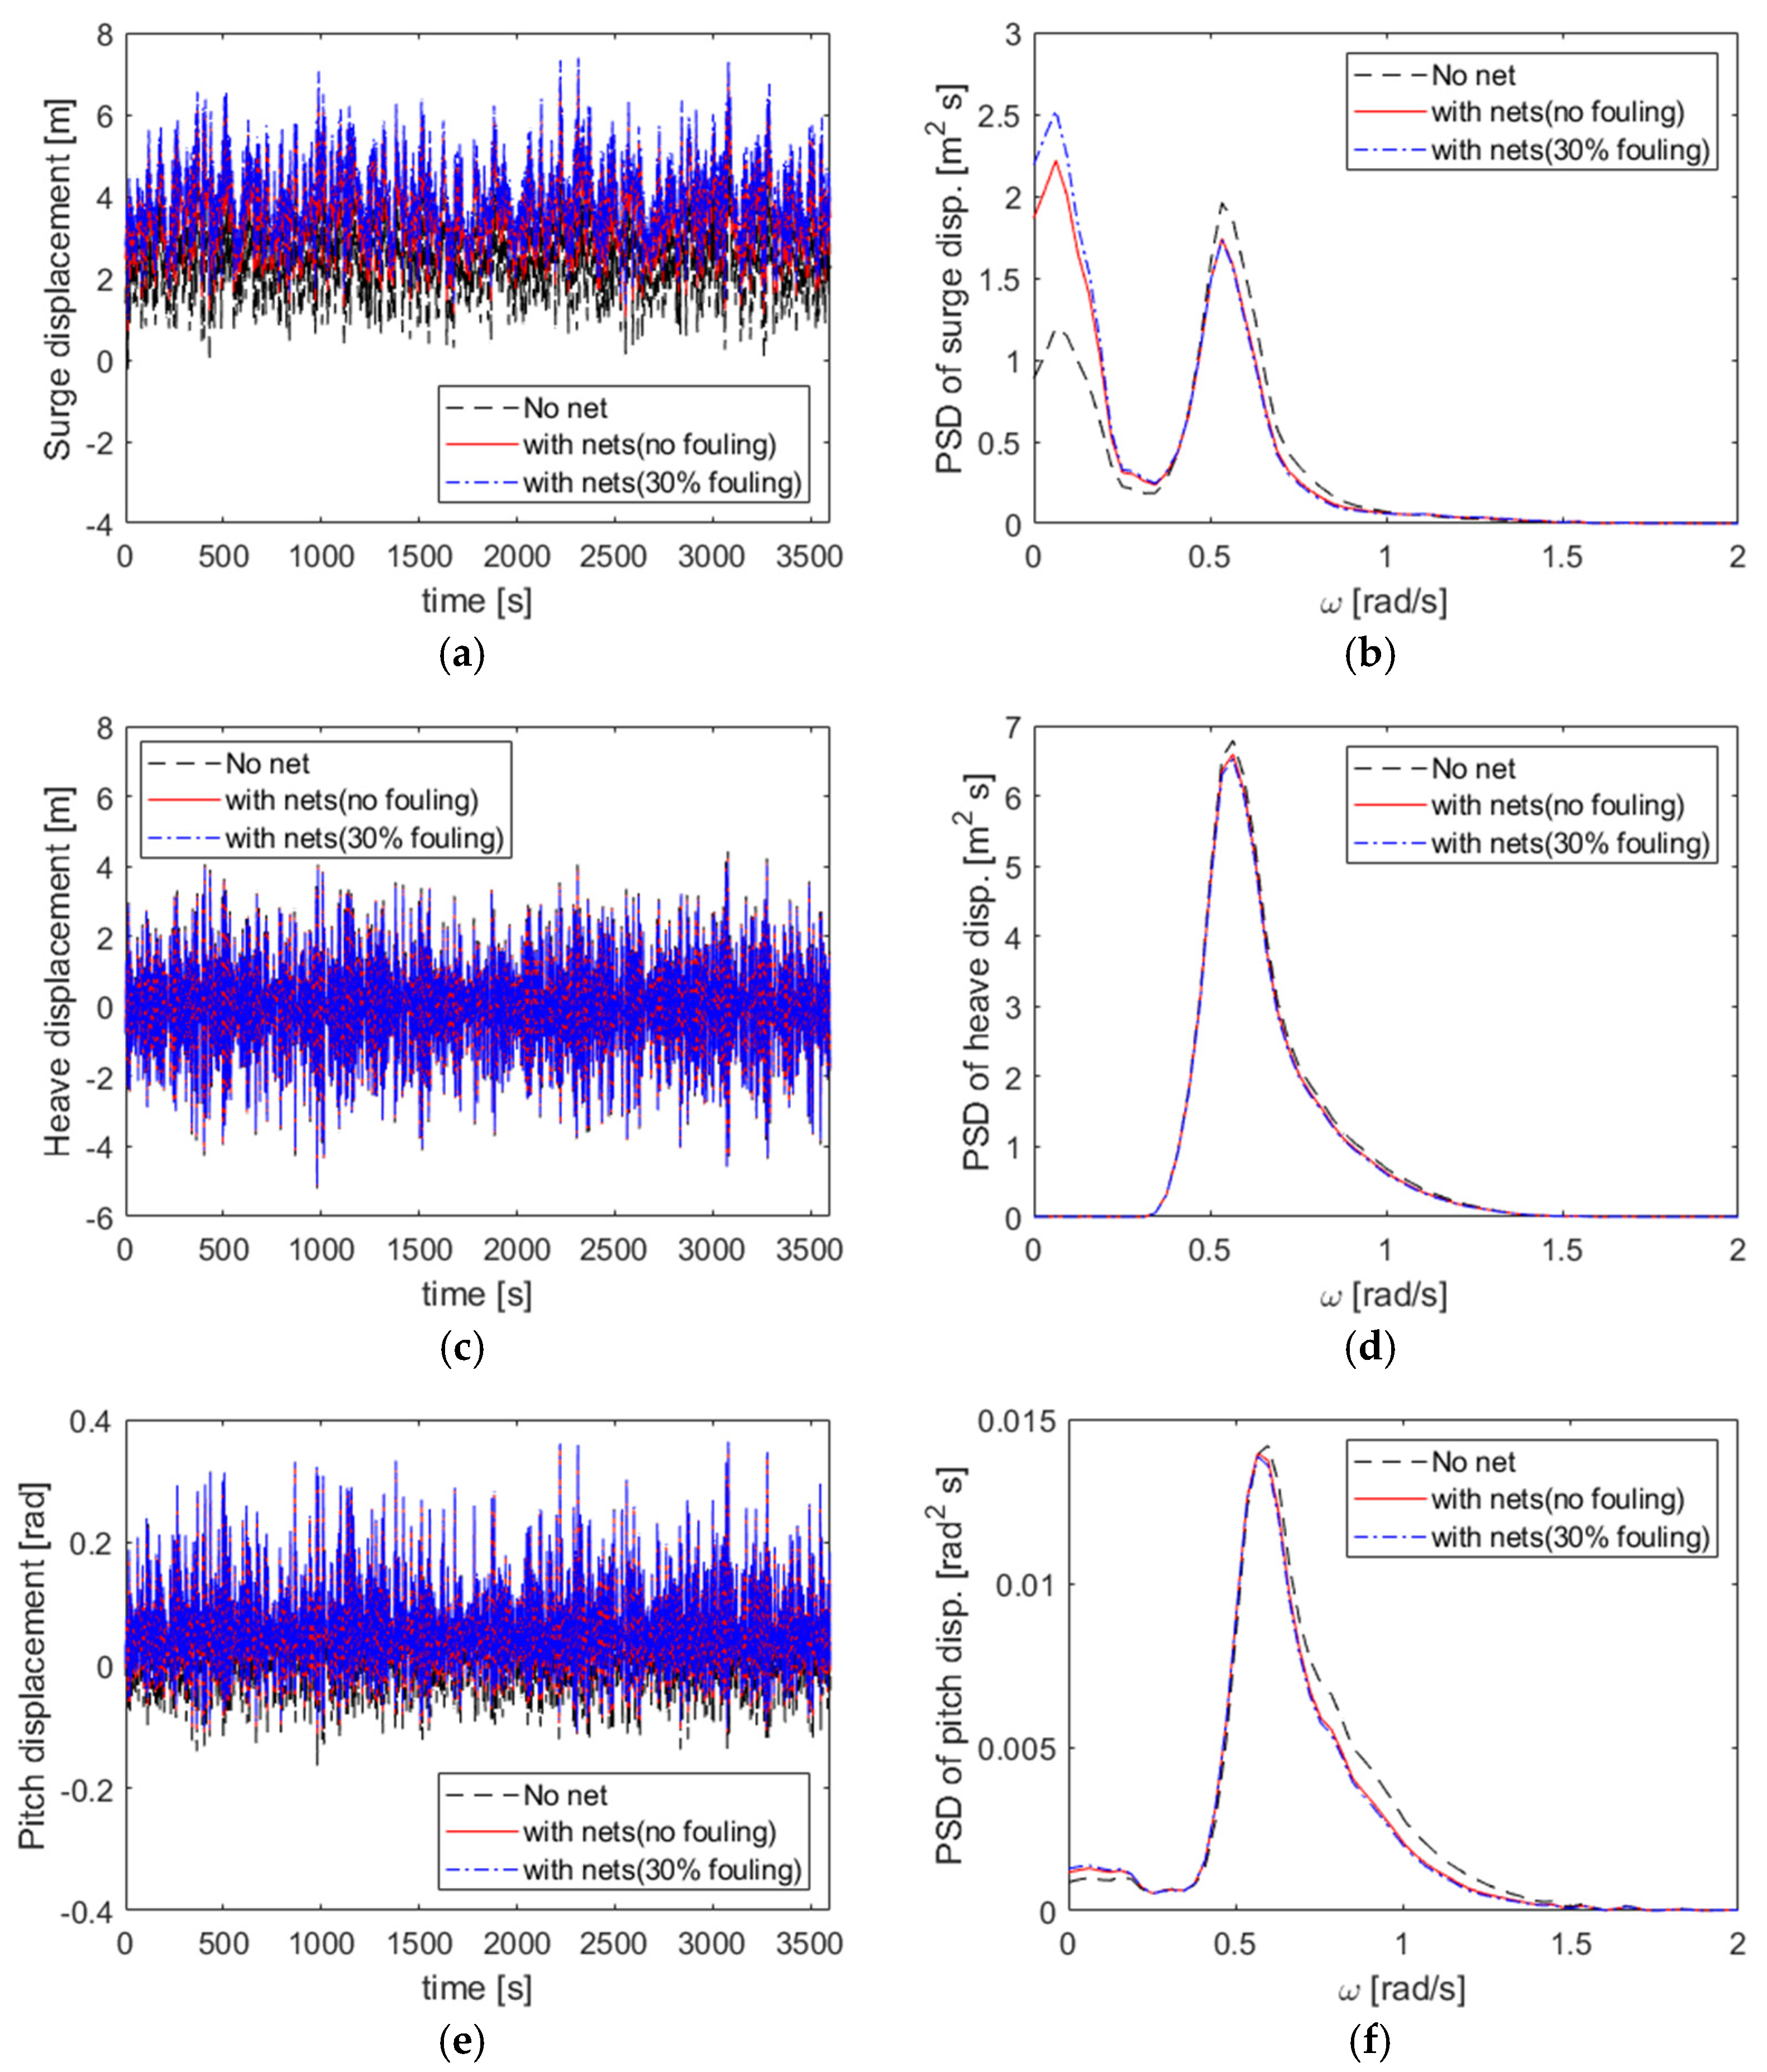
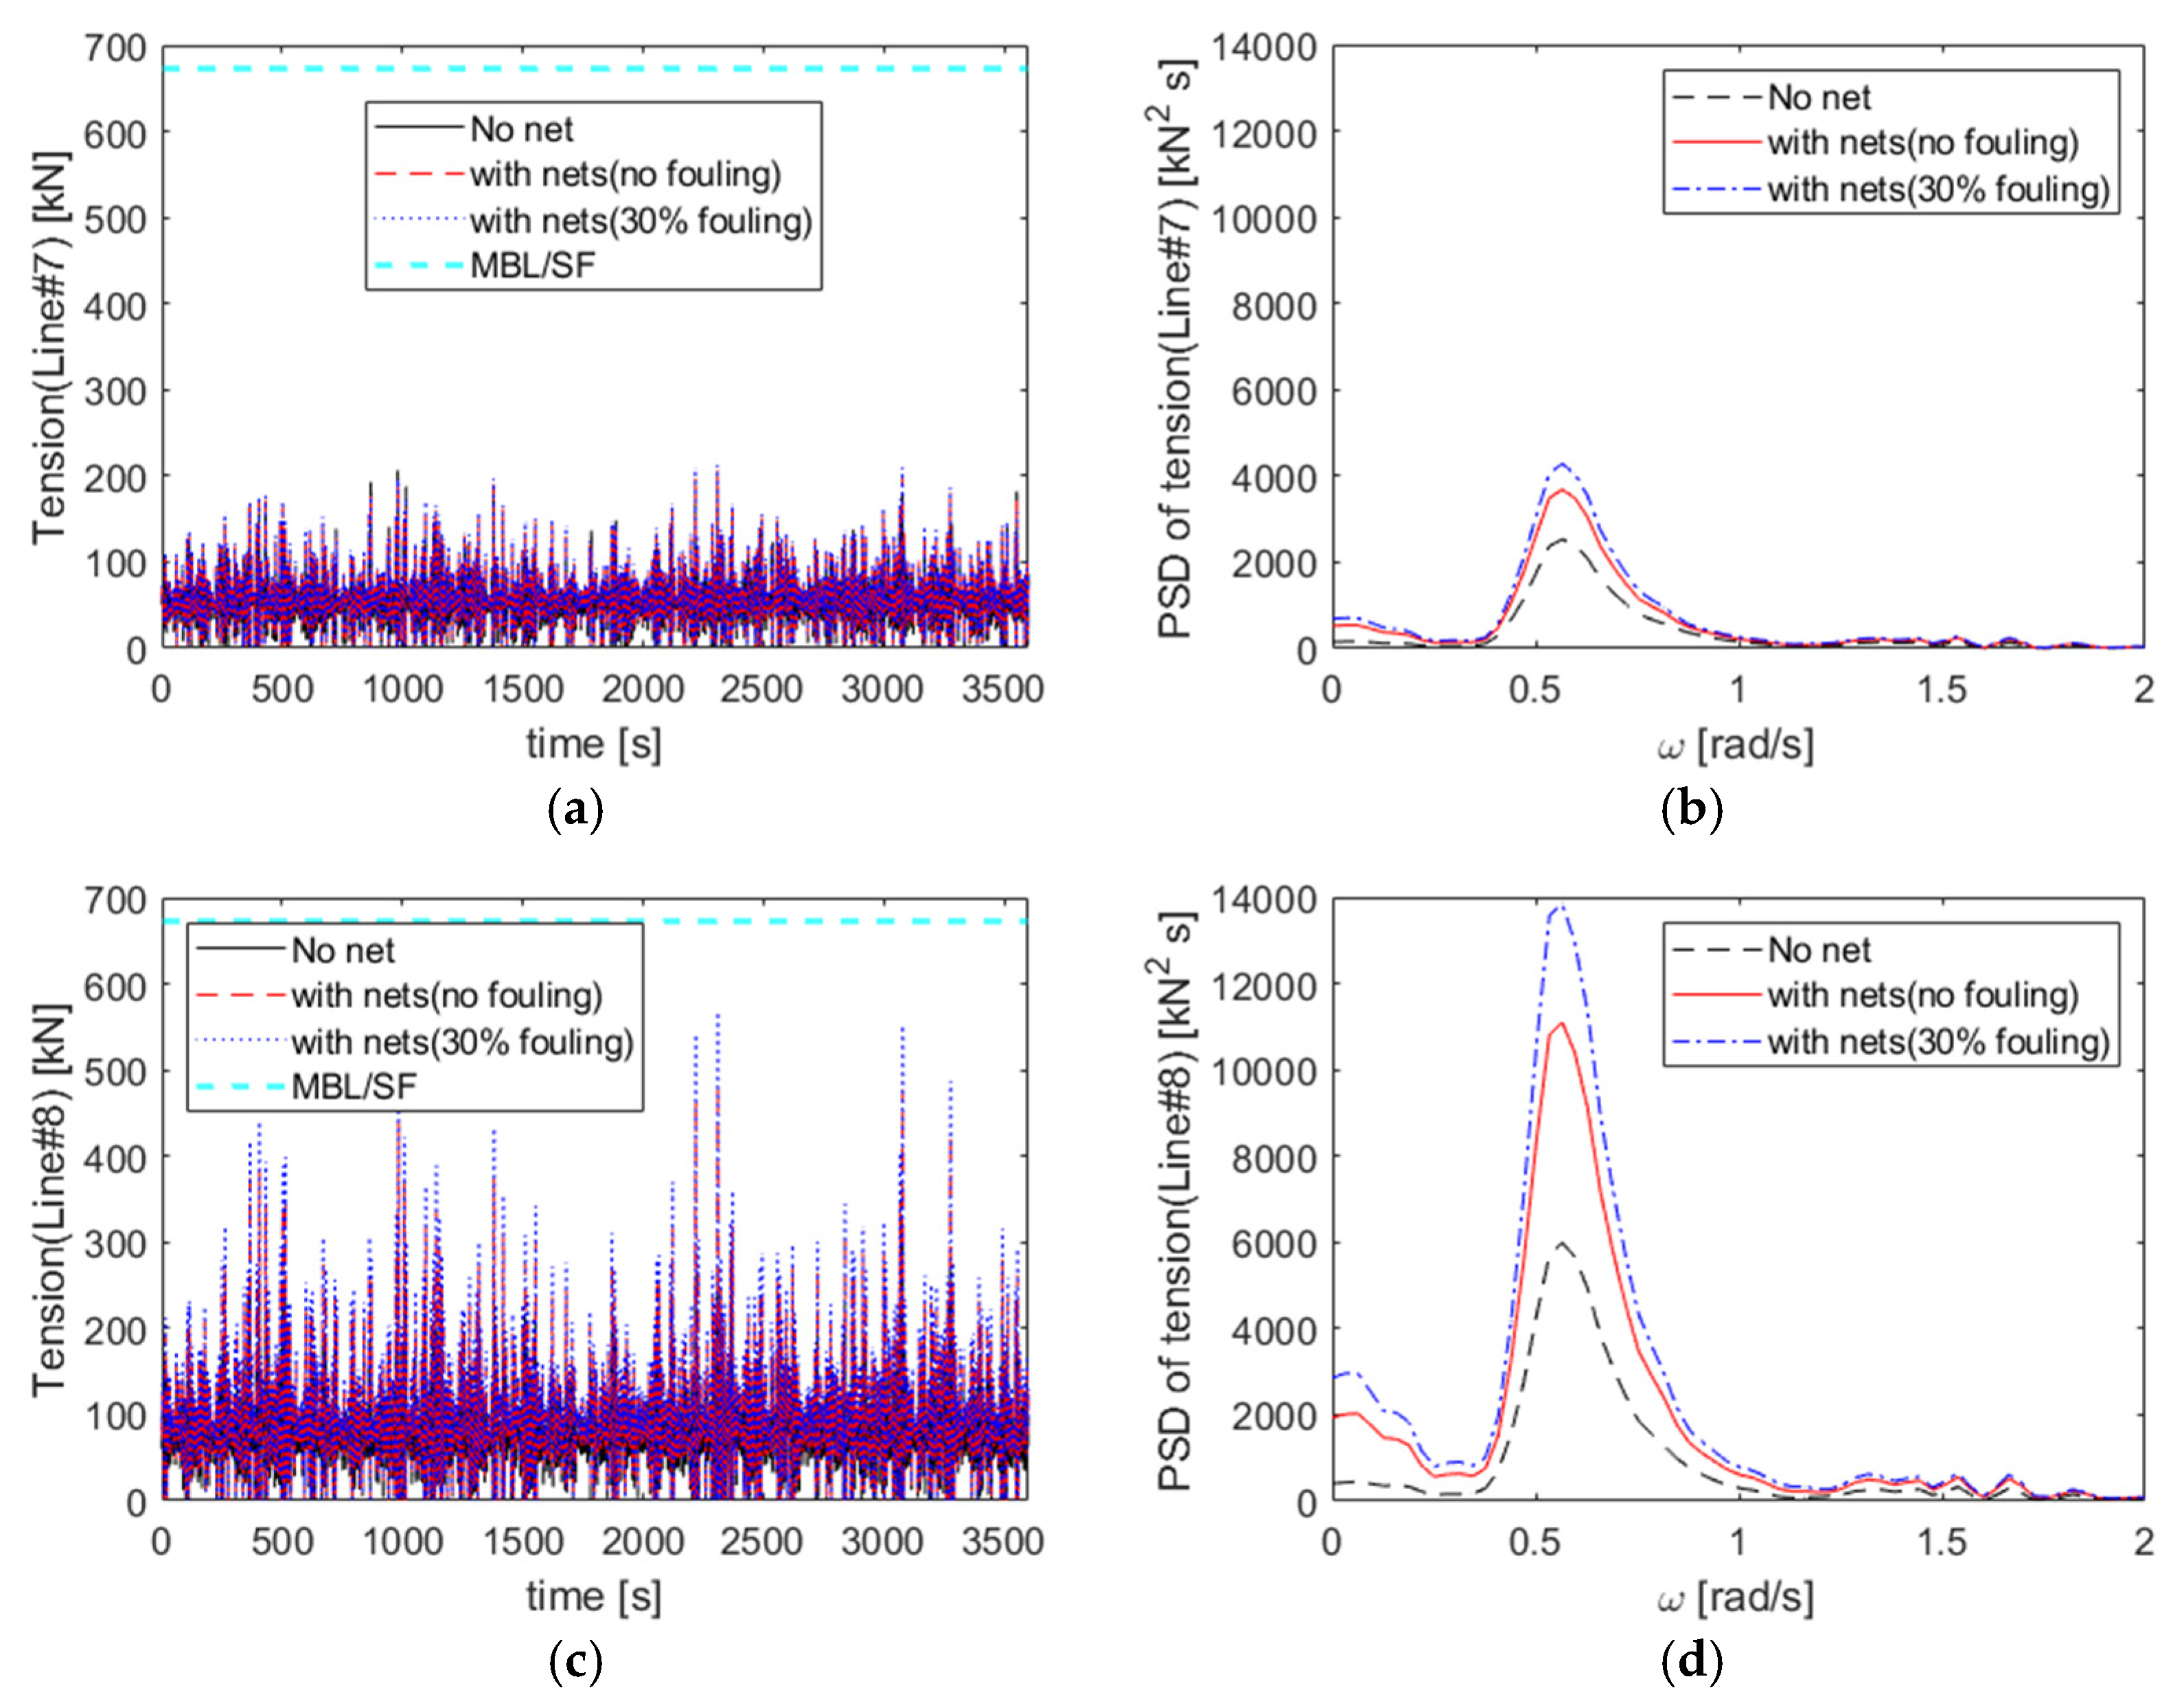
4.5. Effect of the Netting System

Biofouling is a critical factor when considering fish cages because it alters material properties, such as mass and drag effects. For simplicity, the mass variation was not considered in this study. However, the drag coefficient variation was considered using the experimentally obtained drag coefficients. Table 5 illustrates the solidity ratios and drag coefficients. First, the dynamic responses were compared regarding the net conditions, as shown in Figure 17. The heave and pitch motion responses were minimally affected; however, the surge motion yielded significant changes. A substantially increased low-frequency surge motion was observable owing to the increased drag force. However, the wave-frequency surge motion was slightly reduced with the application of the netting system. Under biofouling, the maximum excursion increased by approximately 6%.
The maximum tension condition (β = −55°) was applied to evaluate the safety of the mooring system under the influence of biofouling. Figure 18 shows the trajectories of the fish cages. As the drag coefficient increased owing to biofouling, the maximum excursion also increased, as shown in Figure 17. When examining the tensions of lines #7 and #8 (Figure 19), line #8 experienced significant tension. Increased line tension was observable at the wave peak frequency with a higher drag effect. Compared with Figure 17, the low-frequency surge motion is a crucial parameter related to the line tension. Although the maximum tension with biofouling is 17% higher than that without biofouling, it remained below the maximum allowable tension. Therefore, this moored cage system is considered well designed from a safety perspective despite having 30% biofouling.

4.6. Mooring Line Failure Condition

Finally, two worst-case scenarios were examined to assess the safety of the mooring system when one mooring line was broken. The first scenario (Damaged Case 1) involved the absence of mooring line #7. The second scenario (Damaged Case 2) involved the absence of mooring line #8. This analysis applied a single environmental load condition (maximum tension condition) to test the safety of the mooring system. Figure 20 illustrates the trajectory of the fish cage in all three cases (one intact and two damaged). The cage experienced a more significant drift when the line was broken. Owing to the high tension on line #8, the fish cage drifted considerably southeast when the line broke. When only line #7 was broken, line #8 reduced the drift to the west because its laid angle was deeper (60°) than that of line #7 (50°). Figure 21 shows the line tensions of mooring lines #7 and #8 under the two damage scenarios. The tension was significantly higher than in the intact condition. For the damaged cases, a safety factor of 1.25 was applied, resulting in a maximum allowable tension of 900 kN. Because the maximum tension for the damage scenarios did not exceed the allowable tension, the mooring system was considered suitable for the moveable fish cage at the selected offshore site.

5. Conclusions

This study evaluated the hydrodynamic performance and safety of a floating movable fish cage with a spread mooring system under offshore conditions. A numerical model was developed using potential theory with radiation/diffraction problems, the Cummins equation to represent the dynamics of the floating structure, and a lumped-mass line model to capture the detailed behavior and tension of the mooring lines. The steel frames were modeled using Morison members. However, fishing nets were incorporated using a screen model to account for the drag forces, which depend on the solidity ratio and Reynolds number. The mooring system comprises eight lines with four station-keeping groups. The numerical model was examined under environmental conditions with a 50-year return period to evaluate the maximum excursion and line tension of the mooring system. A parametric study was performed regarding mooring line length, current speed, and fishing nets with and without biofouling. The study findings are summarized as follows:
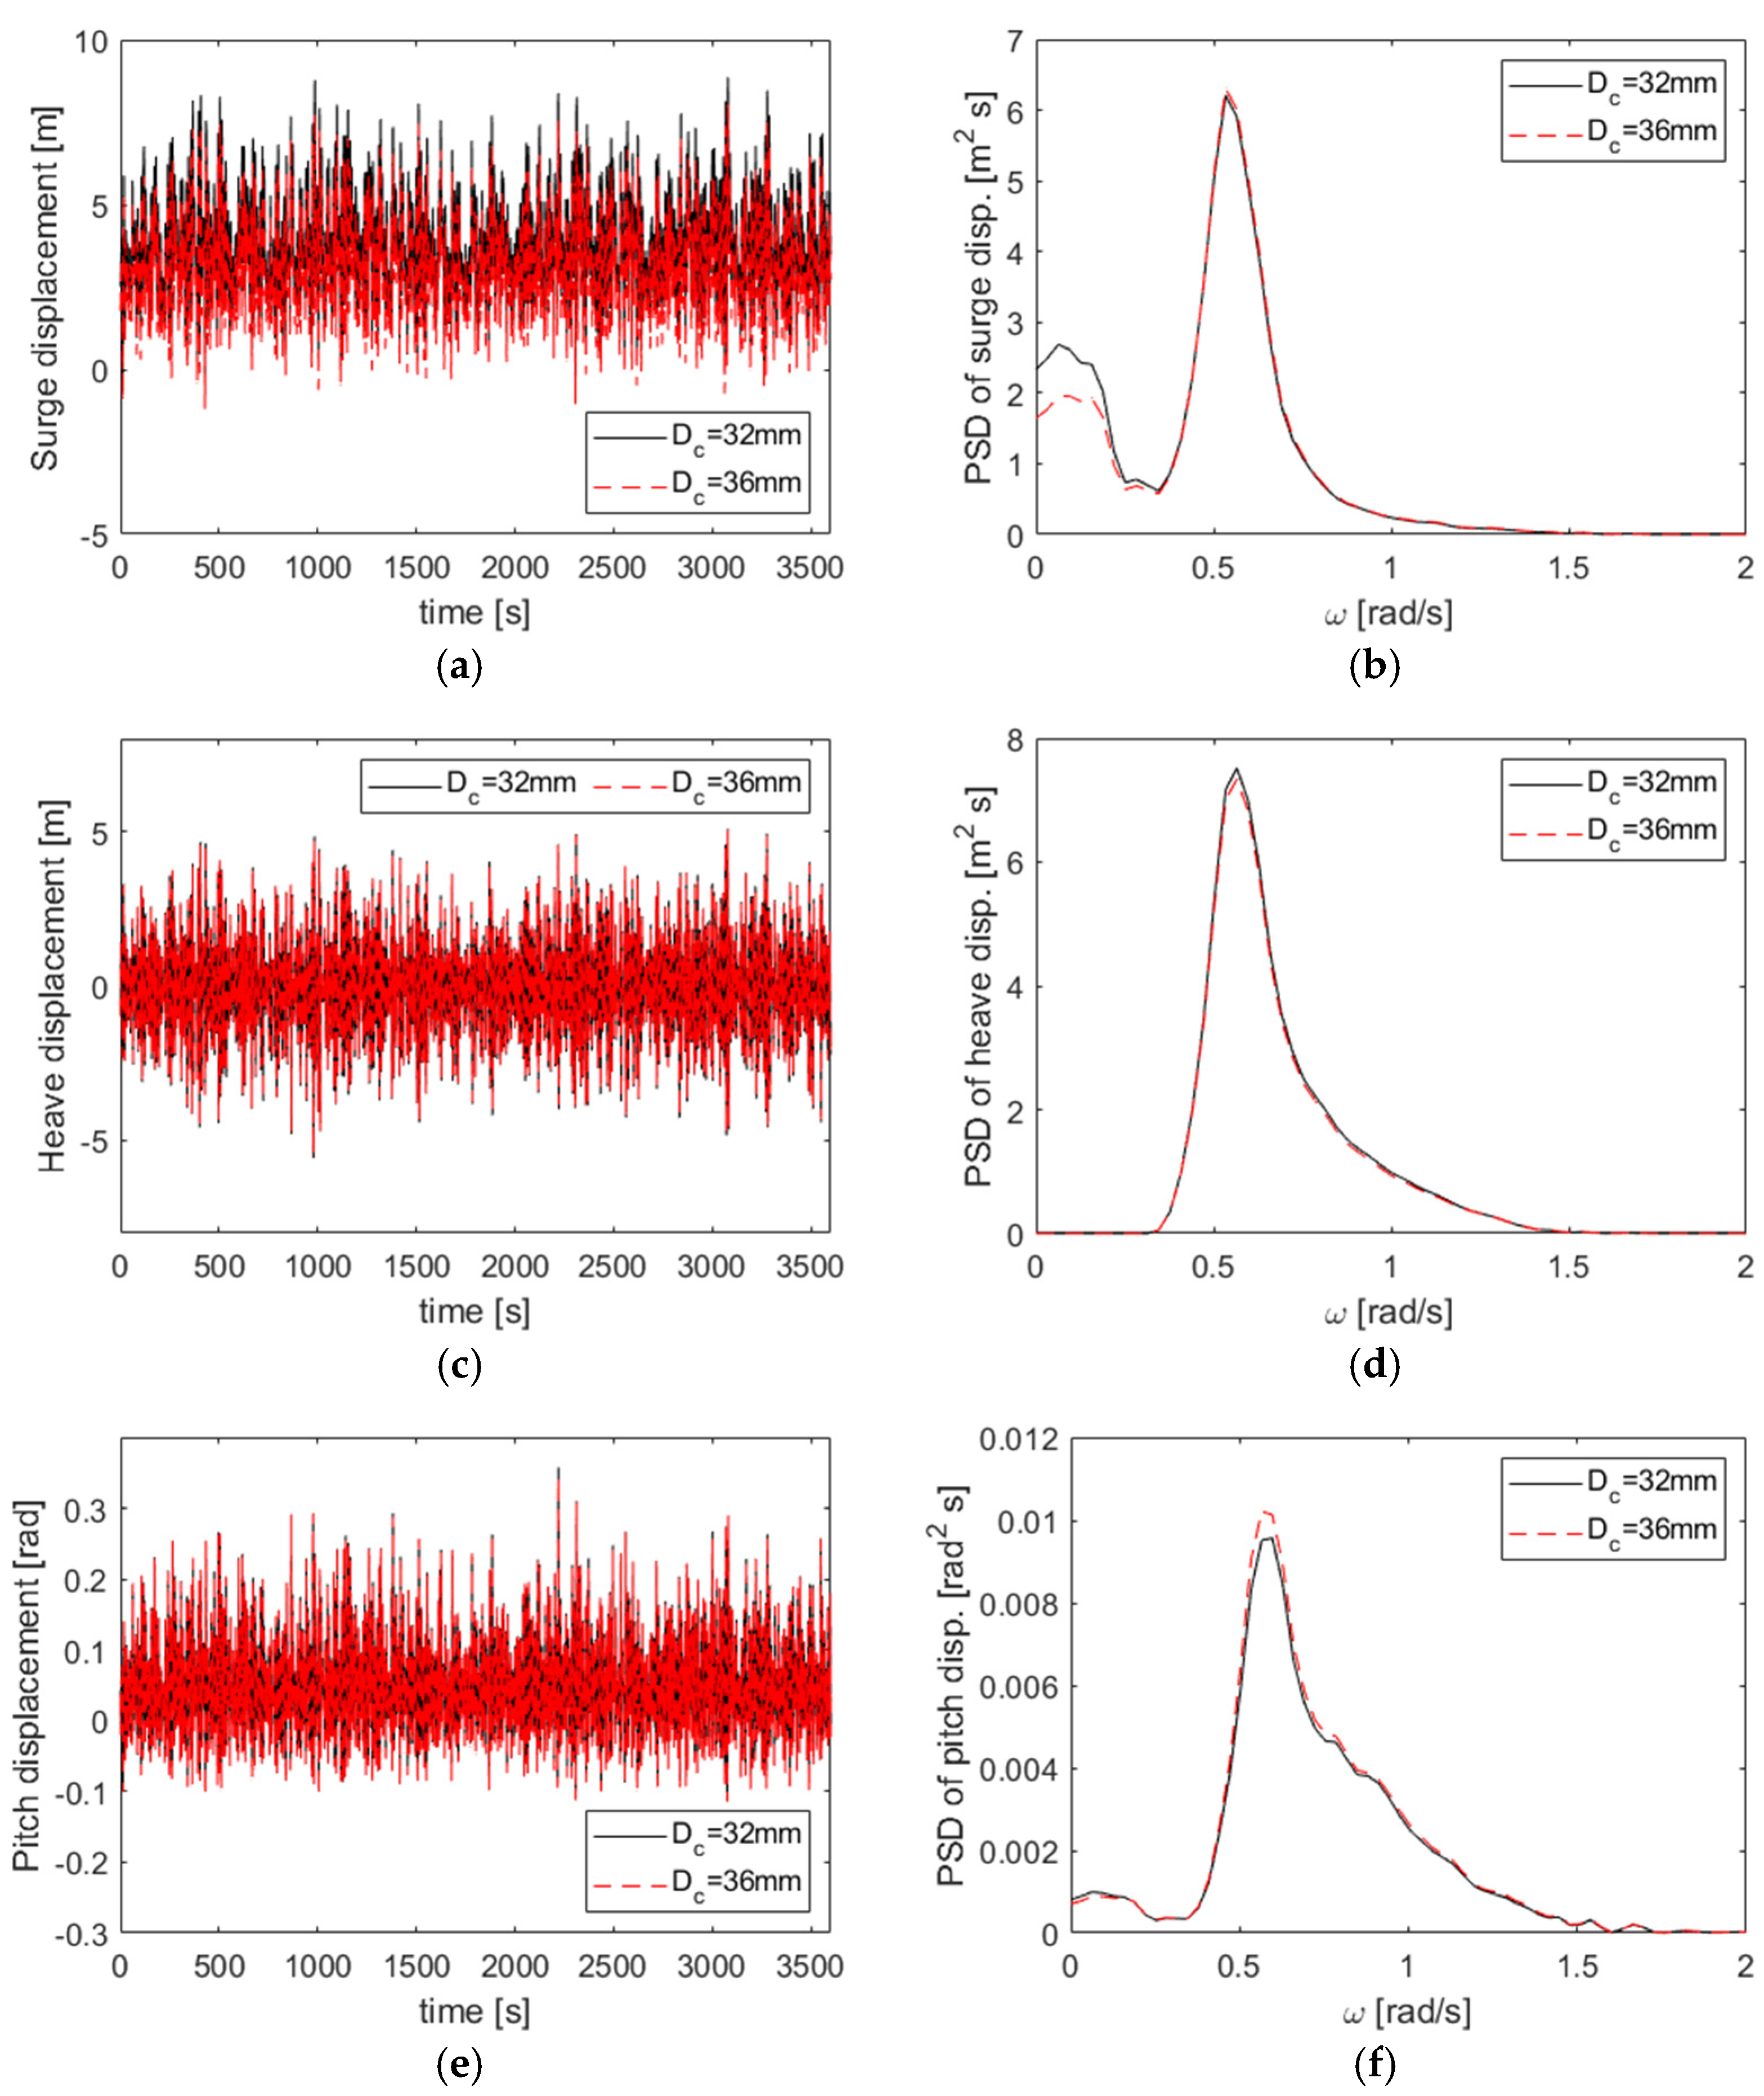
  • A parametric study showed that longer mooring lines increased excursions but reduced the pitch motion and tension variability. Heavier chains (36 mm diameter) decreased excursions by up to 33%, improving station-keeping, but increased the maximum line tension by 17% compared with lighter chains. A 290 m line with a 36 mm chain diameter optimized excursions and mooring system safety.
  • Higher current speeds significantly affected the surge motion, causing greater drift and stretching mooring lines, while minimally impacting the heave and pitch motions. Increased current speeds stiffened the mooring system, reducing motion responses near the wave peak frequency but increasing mooring line tension. At a 1.055 m/s current speed, mooring line tension exceeded safe limits, emphasizing the importance of considering current speed in mooring system design for stability and structural safety.
  • Biofouling substantially altered the fish cage hydrodynamics by changing drag properties, leading to an increased low-frequency surge motion and a 6% rise in the maximum excursion, with minimal effects on the heave and pitch motions. Under the maximum tension conditions, biofouling induced the increased line tension at the wave peak frequency by 17%; however, the line tension remained within allowable limits.
  • Two worst-case scenarios involving individual mooring line failures were investigated to evaluate system safety and resilience. Both scenarios led to increased drift and higher line tension levels compared to the intact condition. Nevertheless, the mooring system kept the line tension within the allowable safety threshold.
The fish cage mooring system installed offshore met the safety criteria established by the ABS rules in intact and damaged conditions. This comprehensive analysis confirms the structural and hydrodynamic integrity of the fish cage and its mooring system. However, further consideration of the characteristics of cultured species in fish cages, surrounding marine facilities, and seabed topography is crucial.

Author Contributions

Conceptualization: S.-J.K. and S.-J.J.; methodology, S.-J.K.; software, S.-J.P.; validation, S.-J.K. and S.-J.P.; formal analysis, S.-J.K.; investigation, S.-J.K. and S.-J.J.; resources, S.-J.J.; data curation, S.-J.J. and S.-J.P.; writing—original draft preparation, S.-J.K.; writing—review and editing, S.-J.J. and S.-J.P.; visualization, S.-J.J. and S.-J.P.; supervision, S.-J.K.; project administration, S.-J.J.; funding acquisition, S.-J.K. and S.-J.J. All authors have read and agreed to the published version of the manuscript.

Funding

This study was supported by a grant from the National Institute of Fisheries Science, Ministry of Oceans and Fisheries, Republic of Korea (grant number: R2024034).

Institutional Review Board Statement

Not applicable.

Informed Consent Statement

Not applicable.

Data Availability Statement

The original contributions presented in this study are included in the article. Further inquiries can be directed to the corresponding author.

Conflicts of Interest

The authors declare no conflicts of interest.

References

  1. Chu, Y.I.; Wang, C.M.; Park, J.C.; Lader, P.F. Review of cage and containment tank designs for offshore fish farming. Aquaculture 2020, 519, 734928. [Google Scholar] [CrossRef]
  2. Chu, Y.-I.; Wang, C.-M.; Zhang, H.; Abdussamie, N.; Karampour, H.; Jeng, D.-S.; Baumeister, J.; Aland, P.A. Offshore fish farms: A review of standards and guidelines for design and analysis. J. Mar. Sci. Eng. 2023, 11, 762. [Google Scholar] [CrossRef]
  3. Kim, M.H.; Koo, B.; Mercier, R.M.; Ward, E.G. Vessel/mooring/riser coupled dynamic analysis of a turret-moored FPSO compared with OTRC experiment. Ocean Eng. 2005, 32, 1780–1802. [Google Scholar] [CrossRef]
  4. Cifuentes, C.; Kim, M.H. Hydrodynamic response of a cage system under waves and currents using a Morison-force model. Ocean Eng. 2017, 141, 283–294. [Google Scholar] [CrossRef]
  5. Jin, C.; Kang, H.; Kim, M.H.; Bakti, F.P. Performance evaluation of surface riding wave energy converter with linear electric generator. Ocean Eng. 2020, 218, 108141. [Google Scholar] [CrossRef]
  6. Kim, S.-J.; Koo, W.; Kim, M.H. The effects of geometrical buoy shape with nonlinear Froude-Krylov force on a heaving buoy point absorber. Int. J. Nav. Archit. Ocean Eng. 2021, 13, 86–101. [Google Scholar] [CrossRef]
  7. Kim, S.-J.; Koo, W. Numerical study on a multibuoy-type wave energy converter with hydraulic PTO system under real sea conditions. IEEE J. Ocean. Eng. 2021, 46, 573–582. [Google Scholar] [CrossRef]
  8. Yu, S.; Qin, H.; Li, P.; Xu, Z. Nonlinear vertical accelerations and mooring loads of a semi-submersible offshore fish farm under extreme conditions. Aquac. Eng. 2021, 95, 102193. [Google Scholar] [CrossRef]
  9. Miao, Y.-J.; Ding, J.; Tian, C.; Chen, X.-J.; Fan, Y.-L. Experimental and numerical study of a semi-submersible offshore fish farm under waves. Ocean Eng. 2021, 225, 108794. [Google Scholar] [CrossRef]
  10. Ma, C.; Zhao, Y.-P.; Bi, C.-W. Numerical study on hydrodynamic responses of a single-point moored vessel-shaped floating aquaculture platform in waves. Aquac. Eng. 2022, 96, 102216. [Google Scholar] [CrossRef]
  11. Yue, W.; Wang, W.; Sheng, S.; Ye, Y.; Hong, T. Analysis of the wave load and dynamic response of a new semi-submersible wave-energy-powered aquaculture platform. Ocean Eng. 2022, 248, 110346. [Google Scholar] [CrossRef]
  12. Ding, W.-W.; Jiang, J.-Q.; Yue, W.-Z.; Li, Y.-Z.; Wang, W.-S.; Sheng, S.-W.; Chen, M. Numerical study on hydrodynamic performance of a new semi-submersible aquaculture platform. Appl. Sci. 2023, 13, 12652. [Google Scholar] [CrossRef]
  13. Pang, G.; Zhang, S.; Liu, H.; Zhu, S.; Yuan, T.; Li, G.; Han, X.; Huang, X. Hydrodynamic response analysis for a new semi-submersible vessel-shaped fish farm platform based on numerical simulation. Front. Mar. Sci. 2023, 10, 1135757. [Google Scholar] [CrossRef]
  14. Kim, S.-J.; Jin, C.; Kim, M. Time-dependent responses and mooring tensions of a moored floating structure in tsunami waves. Mar. Struct. 2024, 93, 103538. [Google Scholar] [CrossRef]
  15. Chen, M.; Huang, L.; Cheng, H.; Wu, Q. Numerical investigation on mooring line configurations of a semisubmersible fish farm for global performance. J. Mar. Sci. Eng. 2024, 12, 880. [Google Scholar] [CrossRef]
  16. Zhang, L.; Zhen, X.; Duan, Q.; Huang, Y.; Chen, C.; Li, Y. Hydrodynamic characteristics analysis and mooring system optimization of an innovative deep-sea aquaculture platform. J. Mar. Sci. Eng. 2024, 12, 972. [Google Scholar] [CrossRef]
  17. Lee, C.-W.; Kim, Y.-B.; Lee, G.-H.; Choe, M.-Y.; Lee, M.-K.; Koo, K.-Y. Dynamic simulation of a fish cage system subjected to currents and waves. Ocean Eng. 2008, 35, 1521–1532. [Google Scholar] [CrossRef]
  18. Mohapatra, S.C.; Guedes Soares, C. A semi-analytical model of an array of moored floating flexible offshore net cages under current loads. Ocean Eng. 2024, 291, 116309. [Google Scholar] [CrossRef]
  19. Mohapatra, S.C.; Guedes Soares, C. A review of the hydroelastic theoretical models of floating porous nets and floaters for offshore aquaculture. J. Mar. Sci. Eng. 2024, 12, 1699. [Google Scholar] [CrossRef]
  20. Reyes, R.; del Norte-Campos, A.; Añasco, N.C.; Santander-de Leon, S.M.S. Biofouling development in marine fish farm influenced by net colour, immersion period and environmental conditions. Aquac. Res. 2020, 51, 3129–3138. [Google Scholar] [CrossRef]
  21. Cornejo, P.; Guerrero, N.M.; Montes, R.M.; Quiñones, R.A.; Sepúlveda, H.H. Hydrodynamic effect of biofouling in fish cage aquaculture netting. Aquaculture 2020, 526, 735367. [Google Scholar] [CrossRef]
  22. Chen, Q.-P.; Bi, C.-W.; Zhang, Z.-X.; Zhao, Y.-P. Hydrodynamic effect of different biofouling types on aquaculture netting. Ocean Eng. 2023, 279, 114430. [Google Scholar] [CrossRef]
  23. Tang, H.-J.; Yeh, P.-H.; Huang, C.-C.; Yang, R.-Y. Numerical study of the mooring system failure of aquaculture net cages under irregular waves and current. Ocean Eng. 2020, 216, 108110. [Google Scholar] [CrossRef]
  24. Cheng, H.; Li, L.; Ong, M.C.; Aarsæther, K.G.; Sim, J. Effects of mooring line breakage on dynamic responses of grid moored fish farms under pure current conditions. Ocean Eng. 2021, 237, 109638. [Google Scholar] [CrossRef]
  25. Hou, H.-M.; Liu, Y.; Dong, G.-H.; Xu, T.-J. Reliability assessment of mooring system for fish cage considering one damaged mooring line. Ocean Eng. 2022, 257, 111626. [Google Scholar] [CrossRef]
  26. ABS. Rules for Building and Classing Floating Production Installations; American Bureau of Shipping: Houston, TX, USA, 2014. [Google Scholar]
  27. ABS. Guide for Building and Classing Aquaculture Installations; American Bureau of Shipping: Spring, TX, USA, 2020. [Google Scholar]
  28. IMO. Standards for Ship Maneuverability; MSC 76/23/Add. 1; International Maritime Organization: London, UK, 2002. [Google Scholar]
  29. IMO. Explanatory Notes to the Standards for Ship Maneuverability, MSC/Circ.1053; International Maritime Organization: London, UK, 2002. [Google Scholar]
  30. Kim, H.-J.; Jeong, S.-J. Resistance and stability evaluation of mobile fish-cage. J. Korean Soc. Fish. Ocean Technol. 2016, 52, 79–87. [Google Scholar] [CrossRef]
  31. Kristiansen, T.; Faltinsen, O.M. Modeling of current loads on aquaculture net cages. J. Fluids Struct 2012, 34, 218–235. [Google Scholar] [CrossRef]
  32. Cummins, W. The impulse response function and ship motion. Schiffstechnik 1962, 47, 101–109. [Google Scholar]
  33. Chung, W.C.; Jin, C.; Kim, M.; Kim, S. Parametric study on mooring system design of submerged floating tunnel under extreme wave and seismic excitation. J. Mar. Sci. Eng. 2023, 11, 2357. [Google Scholar] [CrossRef]
  34. Depalo, F.; Wang, S.; Xu, S.; Guedes Soares, C. Design and analysis of a mooring system for a wave energy converter. J. Mar. Sci. Eng. 2021, 9, 782. [Google Scholar] [CrossRef]
  35. Niño, Y.; Vidal, K.; Tamburrino, A.; Zamorano, L.; Beltrán, J.F.; Estay, G.; Muñoz, A. Normal and tangential drag forces of nylon nets, clean and with fouling, in fish farming: An experimental study. Water 2020, 12, 2238. [Google Scholar] [CrossRef]
  36. Hong, S.N.; Yun, U.H.; Kim, K.W.; Choi, C.Y.; Hwang, B.G.; Lee, S.C. Development of Eco-Friendly Brass Fishing Nets and Cage Aquaculture Facilities; Ministry of Oceans and Fisheries: Sejong-si, Republic of Korea, 2020.
  37. DNVGL. Environmental Conditions and Environmental Loads; Det Norske Veritas: Oslo, Norway, 2000. [Google Scholar]
Figure 1. Floating movable fish cage (X-AQUDS; (a) real sea test; (b) 3D model; (c) GA in front view; and (d) GA in side view).
Jmse 12 02351 g001
Figure 2. Lumped-mass line model [33].
Jmse 12 02351 g002
Figure 3. Numerical meshes for pontoons.
Jmse 12 02351 g003
Figure 4. Added masses and moments of inertia (a,b) and radiation damping coefficients (c,d).
Jmse 12 02351 g004
Figure 5. Numerical model for the fish cage with a spread mooring system.
Jmse 12 02351 g005
Figure 6. Layout of the spread mooring system for the fish cage (The numbers in the bracket indicate the mooring line number).
Jmse 12 02351 g006
Figure 7. Time histories of the designed waves (a), their wave spectrum (b), and the vertical current profile (c).
Jmse 12 02351 g007
Figure 8. Time histories of heave (a) and pitch (b) motion displacements of a freely floating fish cage (β = 0° and ω = 1.05 rad/s).
Jmse 12 02351 g008
Figure 9. Heave (a) and pitch (b) motion RAOs without mooring systems (β = 0°).
Jmse 12 02351 g009
Figure 10. Time histories (a,c,e) and power spectral densities (b,d,f) of motion responses of the moored fish cage under the maximum excursion conditions (β = 0°; (a,b) surge: (c,d) heave; and (e,f) pitch).
Jmse 12 02351 g010
Figure 11. Time histories (a,c,e,g) and power spectral densities (b,d,f,h) of mooring line tensions of the moored fish cage under the maximum excursion conditions (β = 0°; (a,b) line #1; (c,d) line #2; (e,f) line #7; and (g,h) line #8).
Jmse 12 02351 g011
Figure 12. Trajectory of the fish cage in the global coordinate system under the maximum tension conditions.
Jmse 12 02351 g012
Figure 13. Time histories (a,c) and power spectral densities (b,d) of mooring line tensions of the moored fish cage under the maximum tension conditions (β = −55°; (a,b) line #7; and (c,d) line #8).
Jmse 12 02351 g013
Figure 14. Time histories (a,c,e) and power spectral densities (b,d,f) of motion displacements of the moored fish cage with various surface current speed conditions under the maximum excursion conditions (β = 0°; (a,b) surge; (c,d) heave; and (e,f) pitch).
Jmse 12 02351 g014
Figure 15. Time histories (a,c) and power spectral densities (b,d) of mooring line tensions of the moored fish cage with various surface current speed conditions under the maximum excursion conditions (β = 0°; (a,b) line #7; and (c,d) line #8).
Jmse 12 02351 g015
Figure 16. Trajectory of the fish cage with various surface current speed conditions under the maximum tension conditions (β = −55°).
Jmse 12 02351 g016
Figure 17. Time histories (a,c,e) and power spectral densities (b,d,f) of motion displacements of the moored fish cage with and without nets under the maximum excursion conditions (β = 0°; (a,b) surge; (c,d) heave; and (e,f) pitch).
Jmse 12 02351 g017
Figure 18. Trajectory of the fish cage with and without nets under the maximum tension conditions (β = −55°).
Jmse 12 02351 g018
Figure 19. Time histories (a,c) and power spectral densities (b,d) of mooring line tensions of the moored fish cage with and without nets under the maximum tension conditions (β = −55°; (a,b) line #7; and (c,d) line #8).
Jmse 12 02351 g019
Figure 20. Trajectory of the fish cage under one intact case and two different damaged cases (β = −55°).
Jmse 12 02351 g020
Figure 21. Time histories (a,c) and power spectral densities (b,d) of mooring line tensions of the moored fish cage under two different damaged conditions (β = −55°; (a,b) line #7 and (c,d) line #8).
Jmse 12 02351 g021
Table 1. Dimensions of the X-AQUDS.
ItemUnitDimension
Length (L)m35.0
Breadth (B)m23.0
Depth (D)m14.0
Draft (T)m8.5
Volume (V)m35500
Center of gravity above Base (KG)m5.2
Pontoon (Material: SS510)
Upper pontoon diameter (Dup)m1.2
Upper pontoon length (Lup)m16.0
Middle pontoon diameter (Dmd)m0.8
Middle pontoon length (Lmd)m16.0
Lower pontoon diameter (Dlw)m1.4
Lower pontoon length (Llw)m23
Steel frame (Material: STPG)
Outer diametermm216.3
Wall thicknessmm8.2
Table 2. Mass and restoring characteristics of the X-AQUDS.
ItemUnitDimension
Total mass (M)ton114.03
Roll radius of gyration at CG (Rxx)m4.92
Pitch radius of gyration at CG (Ryy)m5.00
Yaw radius of gyration at CG (Rzz)m5.68
Heave restoring coefficient (K33)kN/m364.1
Roll restoring coefficient (K44)kN m/rad4199.7
Pitch restoring coefficient (K55)kN m/rad40,529.2
Table 3. RMSEs under different node number conditions (relative to 14,992 nodes).
# of NodesRMSE
(Heave–Heave Added Mass)
RMSE
(Pitch–Pitch Added Moment of Inertia)
RMSE
(Heave–Heave
Radiation Damping)
RMSE
(Pitch–Pitch
Radiation Damping)
518412.08595.710.95172.4
78007.44413.76.5990.5
12,6640.4672.01.0212.2
Table 4. Specification of the mooring chain.
Chain Diameter
[mm]
Wet Weight [N/m]Axial Stiffness [MN]Minimum Breaking Load (MBL) [kN]
3219292.16895
36243116.641125
Table 5. Solidity ratio and drag coefficients with and without biofouling.
ConditionSolidity
Ratio
anbnDrag Coefficient
(Re = 2000)
Drag Coefficient
(Re = 4000)
No
biofouling
0.22−1.12 × 10−50.200.17760.1552
With
biofouling
0.31−1.75 × 10−50.270.23500.2000
Table 6. Environmental condition (50-year return period).
Significant Wave Height [m]Peak Period [s]Enhancement FactorSurface Current Speed [m/s]
6.5511.192.060.71
Table 7. Hydrodynamic characteristics of the cage under the maximum tension conditions.
ItemChain Diameter = 32 mmChain Diameter = 36 mm
MeanSTDMeanSTD
Surge1.0950.9230.9800.922
Sway−3.5371.091−2.9541.061
Heave−0.0451.349−0.0411.332
Roll0.0150.0630.0150.062
Pitch0.0160.0350.0160.036
Yaw−0.0040.025−0.0030.024
Table 8. Hydrodynamic characteristics of the fish cage with various mooring line length conditions under the maximum excursion conditions.
Chain Diameter [mm]Line Length [m]Max. Excursion [m]STD of Heave [m]STD of Pitch [deg]
322854.3401.4674.279
2908.8631.5343.733
29515.1921.5543.623
30022.3051.5633.633
362853.8351.4294.122
2908.0301.5133.819
29513.7541.5393.639
30020.6061.5513.638
Table 9. Statistical characteristics of mooring line tensions for the fish cage with various mooring line length conditions under the maximum tension conditions.
Chain Diameter [mm]Length [m]Max. Excursion [m]Line Tension (#7) [kN]Line Tension (#8) [kN]
StaticMaxSTDStaticMaxSTD
322853.65187.17349.6037.07128.75835.0394.90
2908.37187.17244.2722.83128.75654.7046.95
29513.43287.17188.2617.87128.75550.1239.15
30018.75587.17165.3715.71128.75542.3639.04
362853.317107.89357.4939.39158.30908.9695.36
2907.834107.89250.9524.33158.30623.8345.18
29512.685107.89200.1818.15158.30484.9335.10
30017.925107.89173.0315.87158.30451.3734.18
Table 10. Statistical characteristics of mooring line tensions for the moored fish cage with various surface current speed conditions under the maximum tension conditions.
Current Speed [m/s]Max. Excursion [m]Line Tension (#7) [kN]Line Tension (#8) [kN]
StaticMaxSTDStaticMaxSTD
0.04.27542.01205.0819.9757.32237.2028.84
0.3555.54742.02210.0825.1474.37331.7639.64
0.716.72042.03284.1833.44104.34483.6857.91
1.0657.69342.03374.8446.30150.06699.7486.38
Disclaimer/Publisher’s Note: The statements, opinions and data contained in all publications are solely those of the individual author(s) and contributor(s) and not of MDPI and/or the editor(s). MDPI and/or the editor(s) disclaim responsibility for any injury to people or property resulting from any ideas, methods, instructions or products referred to in the content.

