Article

Numerical Simulation on the Frequency Response of 3-D Reef–Seawater–Seabed Coupling System Under Seismic Excitation

1
Institute of Marine Science and Technology, Shandong University, Qingdao 266237, China
2
Qingdao Institute of Marine Geology, Qingdao 266237, China
*
Author to whom correspondence should be addressed.
J. Mar. Sci. Eng. 2024, 12(12), 2343; https://doi.org/10.3390/jmse12122343
Submission received: 31 October 2024 / Revised: 16 December 2024 / Accepted: 17 December 2024 / Published: 20 December 2024
(This article belongs to the Section Marine Environmental Science)

Abstract

:
The seismic safety evaluation of artificial reef islands is of great significance for ensuring their long-term stable operation and the safety of residents’ lives. However, due to an insufficient understanding of coral reefs’ basic characteristics, current research on coral reef seismic stability neglects the influence of pore water pressure and abnormal reef layers formed during geological evolution. To further study the impact of earthquakes on coral reefs in the South China Sea, this paper takes Meiji Reef as the research object, establishes a 3-D model containing a saturated coral reef–seawater–seabed coupling system, and considers the influence of abnormally high-porosity weathered layers to study the seismic response of the coupling system in the frequency domain. The results show that ignoring the influence of pore water pressure will underestimate the impact of earthquakes on coral reefs. The seismic waves with a frequency of 4.1 Hz in the horizontal direction have a significant impact on the reef, and the side parallel to the direction of wave propagation is more affected, while the side perpendicular to the direction of wave propagation is less affected. The reef flat near the seawater side is less affected by earthquakes, while that on the lagoon side is more affected. Highly porous, weathered layers increase the seismic impact on reef flats.

1. Introduction

As an essential component of the 21st Century Maritime Silk Road, the South China Sea (SCS) plays a crucial role in economic value, scientific research, and resistance to external interference due to its vast sea area, abundant resource reserves, and unique geographical location. Coral reefs are incredibly scarce land resources in the SCS. Since December 2013, China has successively built approximately 13 square kilometers of new land on seven reefs, including the Meiji Reef, the Zhubi Reef, the Yongshu Reef, etc., which enjoy sovereignty [1,2,3]. A series of marine engineering constructions, such as airports, large lighthouses, and communication and radar equipment, have been constructed on these reefs, and these constructions are of great significance to China’s maritime search and rescue, disaster prevention and reduction, marine scientific research, meteorological observation, ecological environment protection, and military defense.
However, the formation and evolution of the SCS are governed by the tectonic activity of the Eurasian Plate, the Pacific Plate, and the Indo-Australian Plate, many fault zones have developed inside and around the SCS (Figure 1a,b), and diverse marine geo-hazards with different severity levels are present on the reefs, with earthquakes, landslides, and turbidity flows being among the most dangerous [4]. Compared to other natural coral reefs worldwide, the reefs in the SCS usually have smaller sizes [5], permanent populations, and essential infrastructure, such as airports and docks, making them more susceptible to being affected by marine geo-hazards. Among numerous marine geo-hazards, the priority of earthquake stability assessment is usually higher due to earthquakes’ suddenness, unpredictability, and destructive nature. Since there have been multiple cases in history in which earthquakes have caused significant casualties and economic losses on reef islands [6,7,8], it is urgent to study the seismic stability of coral reefs in the SCS as reef engineering construction continues to increase.
Figure 1. (a) Plate tectonic context of the Western Pacific region, modified from [9]. (b) Distribution of internal faults in the SCS, modified from [9,10]. (c) Geometric shape of the Meiji Reef. The A, B, C, and D represent research points at different locations of the reef, and the number 1 and 2 represent the outer reef flat and the reef flat on one side of the lagoon, respectively.
Jmse 12 02343 g001
In the past decade, extensive studies have been conducted on the response of reef islands to earthquake excitation, mainly based on two methods. The first method is numerical simulation, which considers reefs as single-phase elastic solid materials or with additional spring damping. It has been found that the reefs in the SCS have good stability under their weight [11,12]. However, when subjected to earthquakes, the smaller, shallow landslides are prone to collapse, and the slopes on one side of the lagoon are also susceptible to collapse [11,12,13]. Increases in the depths of lagoons will lead to increases in the seismic responses of reefs [14]. Different strata and landforms of reefs have different levels of seismic stability, and shallow strata are more susceptible to impact by earthquakes [15,16]; as the thickness of the shallow reef layer increases, the seismic response at the reef flat increases and is more susceptible to impact by low-frequency waves, with seawater’s damping effect reducing reefs’ seismic response [17]. Compared to 2-D models, 3-D models can better reflect the seismic responses of coral reefs with irregular geometric shapes [18]. The second method is the physical experiment, which is conducted by proportionally reducing reef islands to construct physical models. It can be concluded that during the propagation of seismic waves from bottom to top, acceleration accumulates in the shallow reef layer, resulting in a strong seismic response [19,20]. However, due to the insufficient accumulation of excess pore water pressure, coral sand is difficult to liquefy [20,21]. With the rapid improvement in computing power, numerical simulation has been widely applied due to its simple implementation and high repeatability [22]. However, since China’s development and construction of reefs in the SCS are still in their initial stage, there are still some shortages in using numerical simulation to solve the seismic responses of reef islands: (1) the reefs, which are located in seawater, have developed pores, and are almost 100% saturated, were considered as single-phase linear elastic solid materials; (2) neglecting the influence of geological events such as strata exposure, erosion, and weathering events that occur during the formation of reefs, which results in high-porosity reef layers.
From May 2017 to January 2018, theNK1 well was drilled to a depth of 2020.2 m on the Meiji Atoll, and the recovery rate was up to 91% [23], which, combined with three ambient noise tomography profiles [24] around the NK1 well can help us better understand the stratification of the Meiji Reef and the size and range of abnormal layers inside the reef. Furthermore, well-logging curves and rock physics experiments on core samples can provide physical and mechanical parameters for each Meiji Reef layer. This provides favorable conditions for further study of the seismic response of the Meiji Reef.
Therefore, this paper selects the Meiji Reef as the research target, using the NK1 well’s drilling data, three ambient noise tomography profiles, and published data on the water depth of the lagoon of the Meiji Reef, as well as the slope angle, etc., to construct a complete 3-D Meiji Reef–seawater–seabed coupling system, studying the frequency response of the coupling system. The u-p formulation of Biot theory is used to model the saturated porous reef and weathered layer, and the perfectly matched layer (PML) is adopted as an absorbing boundary condition to truncate the computational domain [25]. The dynamic compatibility among various calculation domains is fully considered. Without considering the influence of highly porous weathered layers within the reef, the earthquake-induced responses of the reef–seawater–seabed coupling system, such as acceleration amplitudes in the reef and the hydrodynamic pressure of seawater, are discussed first. Next, the weathered layers are added to the model, and the impact of the presence of weathered layers on the seismic response of the reef is studied. Finally, parametric studies are carried out on the influences of weathered layers of different sizes, positions, and depths on the dynamic response of the reef.

2. Construction of the 3D Model

Meiji Atoll lies in the northeast of the Nansha block. It is an oval-shaped coral that has developed on the Late Triassic volcanic rock basement since the Oligocene [26,27], with a length of ~9 km and a width of ~6.2 km (Figure 1c). The outer side of Meiji Atoll is a circular reef flat, which ranges from 400 to 600 m in width along the north side and from 100 to 400 m in width along the south side, with an area of 8.5 km2. At low tide, the entire Meiji reef flat is located above the water surface, with the northern reef flat located 0.3–0.5 m above the water surface and the southern reef flat located 0.1–0.2 m above the water surface. In the center of the Meiji Atoll is a semi-enclosed lagoon with a depth of 15–25 m [28]. The lagoon covers an area of 36 km2.
The drilling data for the NK1 well show that the Meiji Reef is 997 m thick and can be roughly divided into five layers, of which the top layer is hydraulic-filled material with a thickness of 3–5 m. Down to 20 m is the second layer, which is unconsolidated bioclastic sand and has not undergone diagenesis [23,27]. Below 20 m, the coral reef has undergone diagenesis and can be divided into three layers (20–120 m, 120–540 m, and 540–997 m) (Figure 2d) [27]. Between 20 m and 120 m, it mainly consists of coral skeletons, rudstones, and packstones. Between 20 m and 120 m, it mainly consists of bioclastic grainstones and wackestones. While it presents coral framestones, rudstones and floatstones are occasionally interbedded with grainstones from 540 to 997 m. Below 997 m is the volcanic rock basement [27,29]. Previous modeling of coral reefs in the SCS [17,30] and ambient noise tomography profiles (Figure 2a,c) indicate that the layers of the Meiji Reef are in a nearly horizontal stratification.
However, multiple sea-level-change events in the SCS since the early Miocene have resulted in the Meiji Reef being exposed above sea level [26,31]; this made it undergo strata exposure, erosion, and weathering events during its history, and areas of low wave velocity and high porosity grew within the reef. There are two areas of low wave velocity and high porosity in the northeast of the Meiji Reef, at depths of 25–75 m and 200–300 m. The shallower part is approximately 500 m × 400 m × 50 m in size and distributed horizontally, while the deeper part is approximately 500 m × 400 m × 100 m in size and distributed downward at a 45-degree angle (Figure 2).
The slope angles of coral reefs in the SCS gradually decrease from top to bottom. The top slope, especially the shallow part below 20 m, is steeper, with slopes mainly ranging from 45° to 60°, and a few can reach 90°.

3. Theoretical Formulation

The reef–seawater–seabed coupling system is illustrated in Figure 3, which includes the seawater, the porous coral reefs, and the viscoelastic solid seabed.

3.1. Governing Equation of Seawater

The seawater is assumed to be an inviscid fluid, and the water pressure p w for time-harmonic behavior is e x p   ( i ω t ) governed by the scalar wave equation:
2 p w + ω 2 c 2 p w = 0
where t is time, 2 is the Laplace operator, and c is sound speed in the seawater equal to K w / ρ w , where K w and ρ w are the bulk modulus and density of the seawater, respectively.

3.2. Governing Equation of Coral Reefs

The dynamic response of the coral reefs, which consists of a solid and a water phase, is described by Biot’s equations [32]:
ρ a v u ¨ r + ρ f w ¨ r · σ r = 0
ρ f u ¨ r + μ f k p w ˙ r + τ n ρ f w ¨ r + p r = 0
where u r is the displacement of the reef, w r is the fluid displacement with respect to the porous matrix, σ r is the total stress tensor of the porous material, ρ f and μ f are the fluid density and viscosity, respectively, τ is the tortuosity factor, n is the porosity, p r is the fluid pore pressure, k p is the permeability, and ρ a v is the average density of soils expressed as
ρ a v = ρ d + n ρ f
where ρ d is the drained density of coral reefs.
Assuming a time-harmonic dependency for the displacement variables, u r x , y , z , t = u r ( x , y , z ) e i ω t , w r x , y , z , t = w r ( x , y , z ) e i ω t , after the time derivatives are removed, Equations (2) and (3) are rewritten as
ρ a v ω 2 u r + ρ f ω 2 w r + · σ r = 0
ρ f ω 2 u r ρ c ω 2 w r + p r = 0
where ρ c is the complex density accounting for the tortuosity, porosity, and fluid density, which can be defined as
ρ c = τ ρ f n + μ f i ω k p
In general, the formulations of u r and w r (Equations (5) and (6)) are not optimal from the numerical viewpoint, since they require solving for two displacement fields. The dynamic Biot’s equations, known as the “u-p” approximation [33], which solve for the fluid pore pressure variable instead of the fluid displacement field, are always used in seismic analyses of seabed and offshore structures [25,34,35].
Moving the displacement term of the fluid to the left side of the equation, Equation (6) can be written as
w r = 1 ρ c ω 2 p r ρ f ω 2 u r
Substituting Equation (8) into Equation (5) yields formulas about variables u r and p r :
ρ a v ρ f 2 ρ c ω 2 u r + ρ f ρ c p r + · σ r = 0
The total stress tensor of the porous material is associated with the drained elastic porous matrix and the pore fluid:
σ r = c : ε α B p r I
where c is the elasticity tensor containing the elastic properties of drained porous matrix, ε is the strain tensor of the porous matrix, I is the identity tensor, α B is Biot–Willis coefficient.
Taking the divergence of another formula in Biot’s theory (Equation (6)) divided by ρ c , we obtain
ω 2 · ρ f ρ c u r + ω 2 · w r + · 1 ρ c p r = 0
Using the formulas for the volumetric strain (Equation (12)) and fluid displacement (Equation (13)),
ε v o l = · u r
· w r = p r M + α B ε v o l
Equation (11) can be further written as
ω 2 α B · u r + ω 2 M p r + · 1 ρ c p r ρ f ω 2 u r = 0
where M is Biot’s modulus calculated from the porosity n , fluid compressibility β f Biot–Willis coefficient α B , and the drained bulk modulus of the porous matrix K d , which can be defined as
M = n β f + α B n K d 1 α B 1
Equations (10) and (14) are Biot’s theory for u r and p r .

3.3. Governing Equation of Seabed

The dynamic response of a linearly isotropic viscoelastic solid seabed under seismic action can be represented by the constitutive equation, the equilibrium equation, and the coordination equation.
The constitutive equation is
σ i j b = D i j k l ε k l b
The equilibrium equation is
· σ b + ρ b ω 2 u b = 0
The compatibility equation is
ε i j b = 1 2 u i , j b + u j , i b
where σ b is the stress tensor of seabed, D i j k l is the tangent coefficient matrix, ε k l b is the strain change from the initial state, ρ b is the density of the seabed, ω is the angular frequency, u b is the displacement of the seabed, and u i , j b and u j , i b are the derivatives of the solid displacement with respect to spatial coordinates.
Since the elastic modulus tensor can also be represented by Lame’s parameters, for linearly elastic isotropic materials, stress can also be expressed as
σ i j b = λ b ε k k b δ i j + 2 μ b ε i j b
where λ b and μ b are the Lame’s parameters of seabed.

3.4. Boundary Conditions

Figure 3b shows various interfaces between different materials: seawater–air boundary, seawater–reef boundary, seawater–seabed boundary, reef–air boundary, reef–reef boundary, and reef–seabed boundary. Coupling conditions at these interfaces are imposed by enforcing equilibrium of stress (pressure) and displacement compatibility as described below.

3.4.1. Seawater–Air Boundary

Zero pressure at the interface of seawater and air (z = 0) is satisfied:
p w = 0

3.4.2. Seawater–Reef Boundary

At the interface between seawater and reef, the normal stress on the reef is equal to the seawater pressure, the shear stress on the reef is assumed to be zero, and the pore pressure of the reef is equal to the seawater pressure at the contact surface:
σ n r = p w
σ t r = 0
p w = p r

3.4.3. Seawater–Seabed Boundary

At the interface between seawater and seabed, the normal stress on the seabed is equal to the seawater pressure, and the shear stress at the seabed is assumed to be zero:
σ n b = p w
σ t b = 0

3.4.4. Reef–Air Boundary

At the reef–air boundary, all stresses are set to zero:
σ r = 0

3.4.5. Reef–Reef Boundary

At the interface between the reef and the reef, the displacement, stress, and pore pressure of the upper and lower layers of the reef are equal:
u r 1 = u r 2
σ r 1 = σ r 2
p r 1 = p r 2

3.4.6. Reef–Seabed Boundary

The equilibrium of displacement and stress should be satisfied at the interface between the reef and the seabed:
u r 3 = u b
σ r 3 = σ b

4. Numerical Implementation
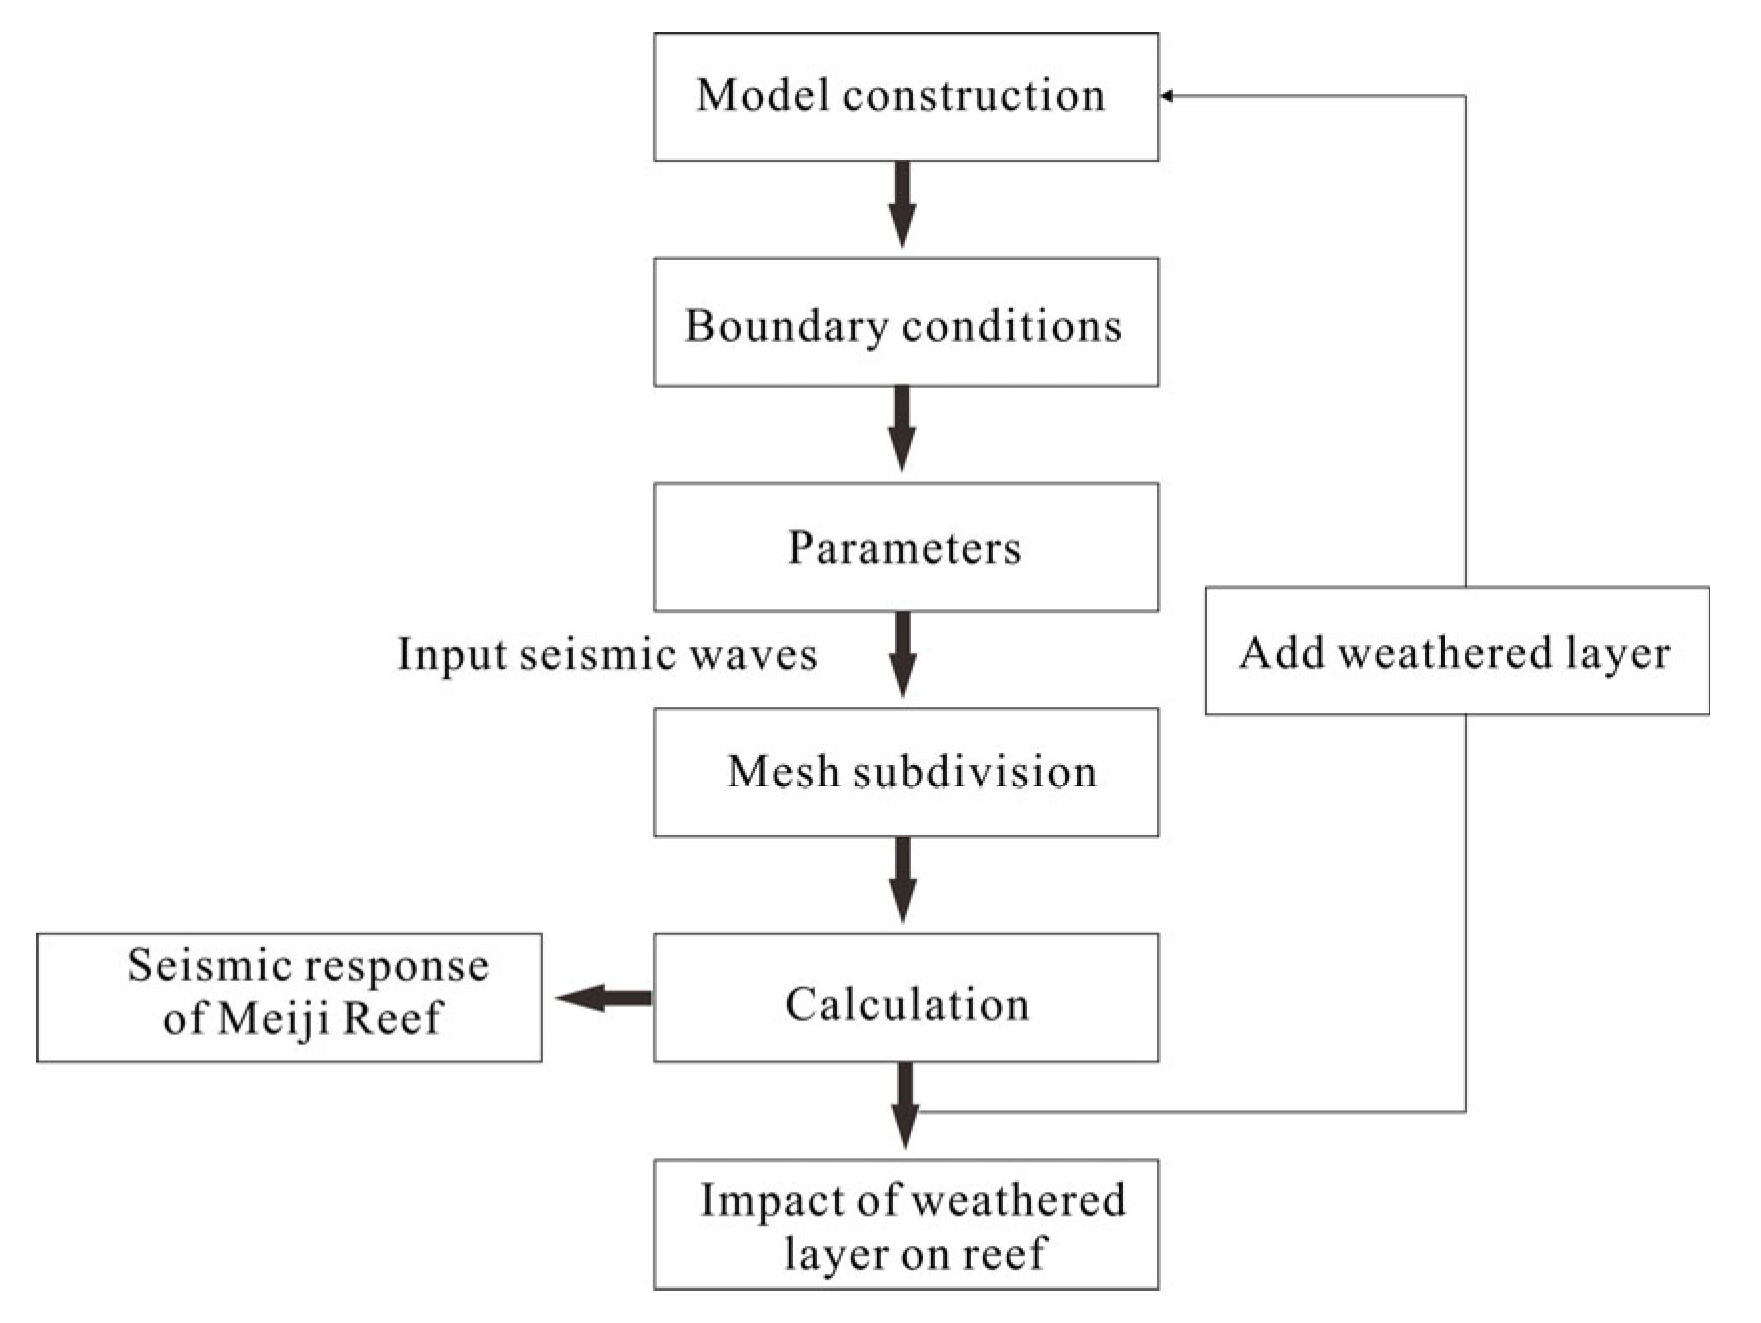
The response of the reef–seawater–bedrock coupling system under earthquake is implemented in the COMSOL Multiphysics 6.1 version [34,36], and the flowchart is shown in Figure 4:
(1)
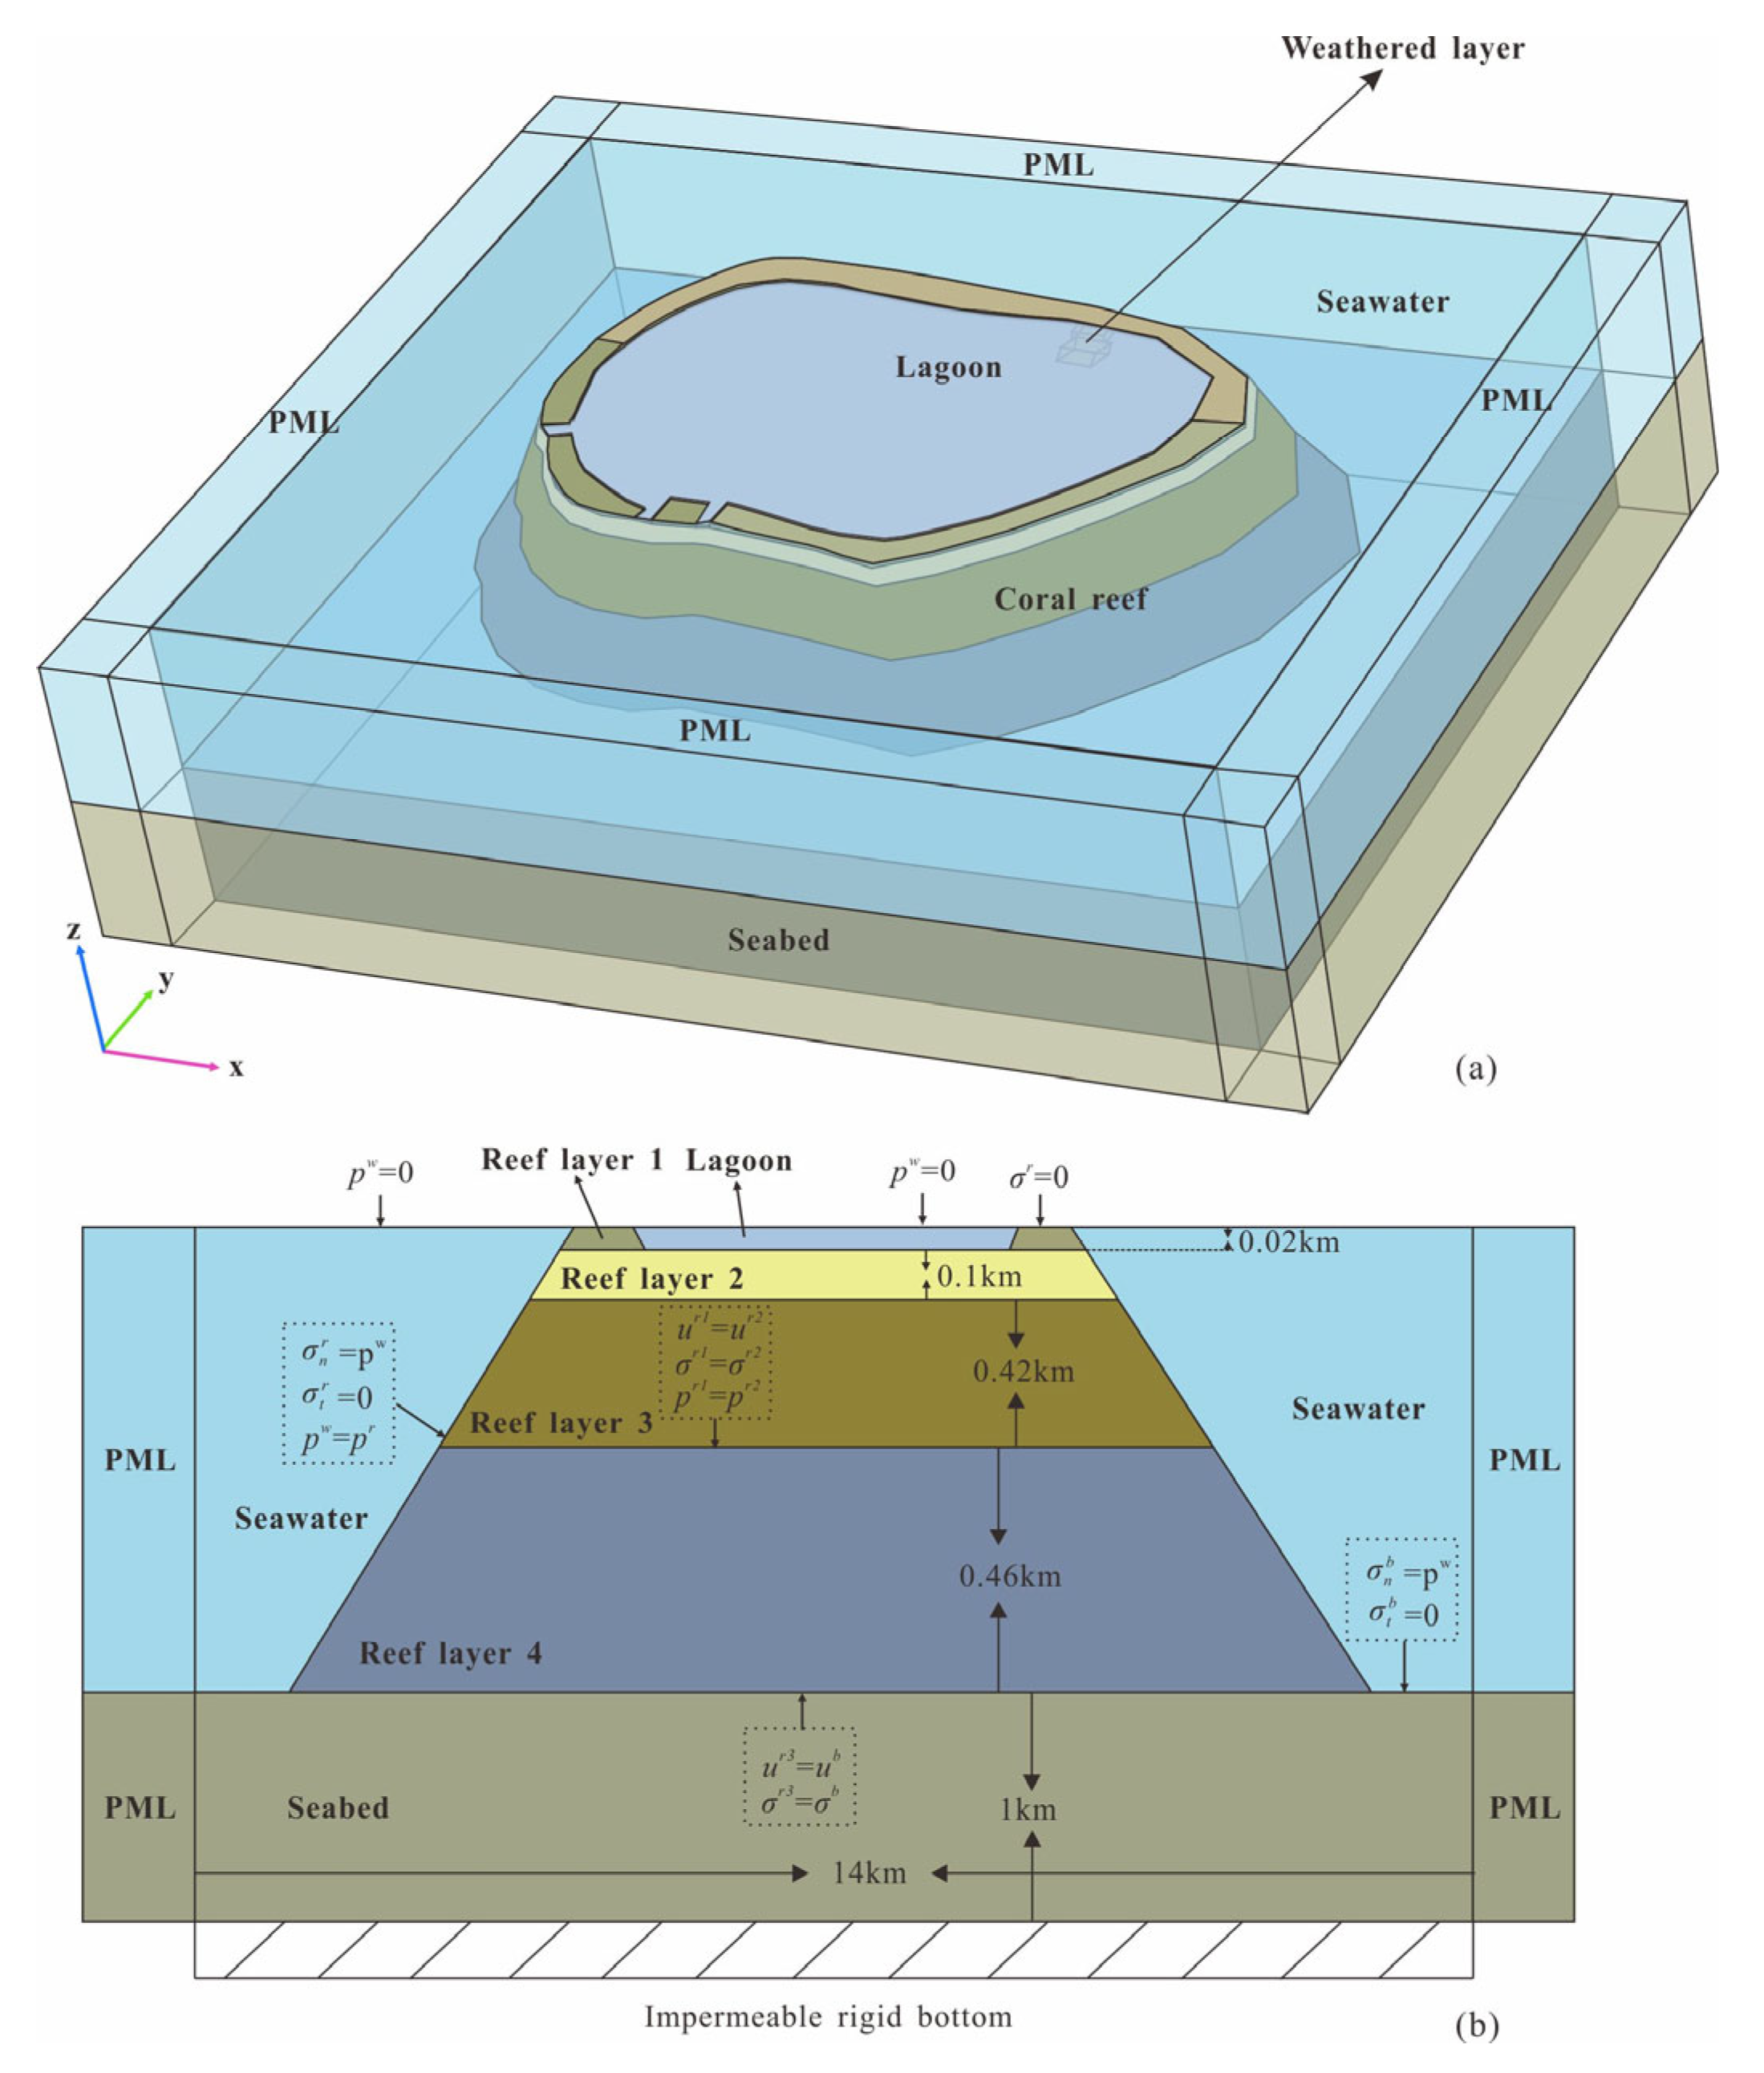
Model construction. Establish a 3-D model with dimensions of 16 km × 14 km × 2 km based on parameters such as slope angle, reef stratification, lagoon depth, and weathered layer in Section 2 of this paper. The depth of the lagoon water is 0.02 km. The slope angle of the first layer of the reef is 60°, while the other layers are 45°. The thickness of each reef layer from top to bottom is 0.02 km, 0.1 km, 0.42 km, and 0.46 km, respectively. Below the reef is a 1 km thick volcanic bedrock. The outermost layer of the model is a 1 km thick PML, used to simulate the infinite domain (Figure 3).
(2)
Physical field and boundary conditions. The detailed physical field and boundary conditions are described in Section 3 of this paper, and all equations are built-in equations in the software.
(3)
Parameters. As described in the third section, the coupled model includes the fluid domain, the solid domain, and the saturated porous domain. The fluid domain is seawater, with a density of 1000 kg/m3, acoustic velocity of 1483 m/s, dynamic viscosity of 1 × 10⁻³ Pa·s, and compressibility of 1/(2.2 × 109) 1/Pa [25,34]. The solid domain is the late Triassic volcanic rock, with a density of 1000 kg/m3, and the P-wave and S-wave velocities are 5000 m/s and 2200 m/s, respectively [17]. The porous domain consists of four layers of reefs, and the parameters are shown in Table 1. Among them, only the permeability cannot be directly obtained. Fortunately, the influence of permeability on the acceleration of the coupled system can be ignored [25]. Therefore, it can be assumed that the permeability of each layer is equal to those of the others [37].
(4)
Mesh subdivision. To ensure the accuracy of the calculations, the size of a single grid in the solid and porous domains should be less than one eighth of the wavelength in the corresponding material at the highest frequency [36]. Due to the lack of strong earthquake records in the SCS, and considering that the Fourier spectrum frequencies of the Umbria waves, the Hualian waves, and the Denali waves detected in areas with similar seismic tectonic backgrounds to the SCS are usually below 6 Hz [15], this paper mainly studies the response of Meiji Reef induced by the earthquake at frequencies of 0.1–6.0 Hz. So, the maximum grid size of the seabed should be less than 0.05 km, and the maximum grid size of the reef should be less than 0.02 km. In addition, mesh refinement is conducted in and around the irregular boundaries.
(5)
Calculation. The coupled model is solved using the MUMPS solver, and the second-order Lagrange elements are used to ensure accuracy in evaluating the dependent variable in the computational domain of solids and others. The research step is 0.05 Hz between 0.1 and 3.5 Hz, while it is 0.01 Hz between 3.5 and 6.0 Hz, and the relative tolerance is 0.001.
(6)
The impact of the weathered layer on the reef. A weathered layer was added to the initial model, keeping all other conditions constant, to obtain the impact of the high-porosity weathered layer on the flat overlying reef. The drilling data show that the acoustic velocity and porosity of the weathered layer are close to those of the first layer of the reef [24], so it is assumed that the parameters of the weathered layer are the same as those of layer 1 of the reef in Table 1.
The accuracy of the model can be verified from three perspectives, the fluid–solid interaction, the saturated porous material, and the PML, by comparing the calculated results of the model with the theoretical results. Previous studies have confirmed that this method has good accuracy, and it has been successfully applied to the study of the seismic responses of marine geological structures [25,34]. Therefore, this paper will not further elaborate on the reliability of this method.

5. Results and Discussion

First, without considering the high-porosity weathered layer, a simple model was constructed, and the responses of the two-phase porous reef–seawater–seabed system induced by the earthquake, such as acceleration amplitudes at the reef flat ( a x ) and the dynamic water pressure of seawater ( p w ), are studied. Next, the weathered layer is added to the model to investigate the impact of the weathered layer on the reef under the earthquake further.

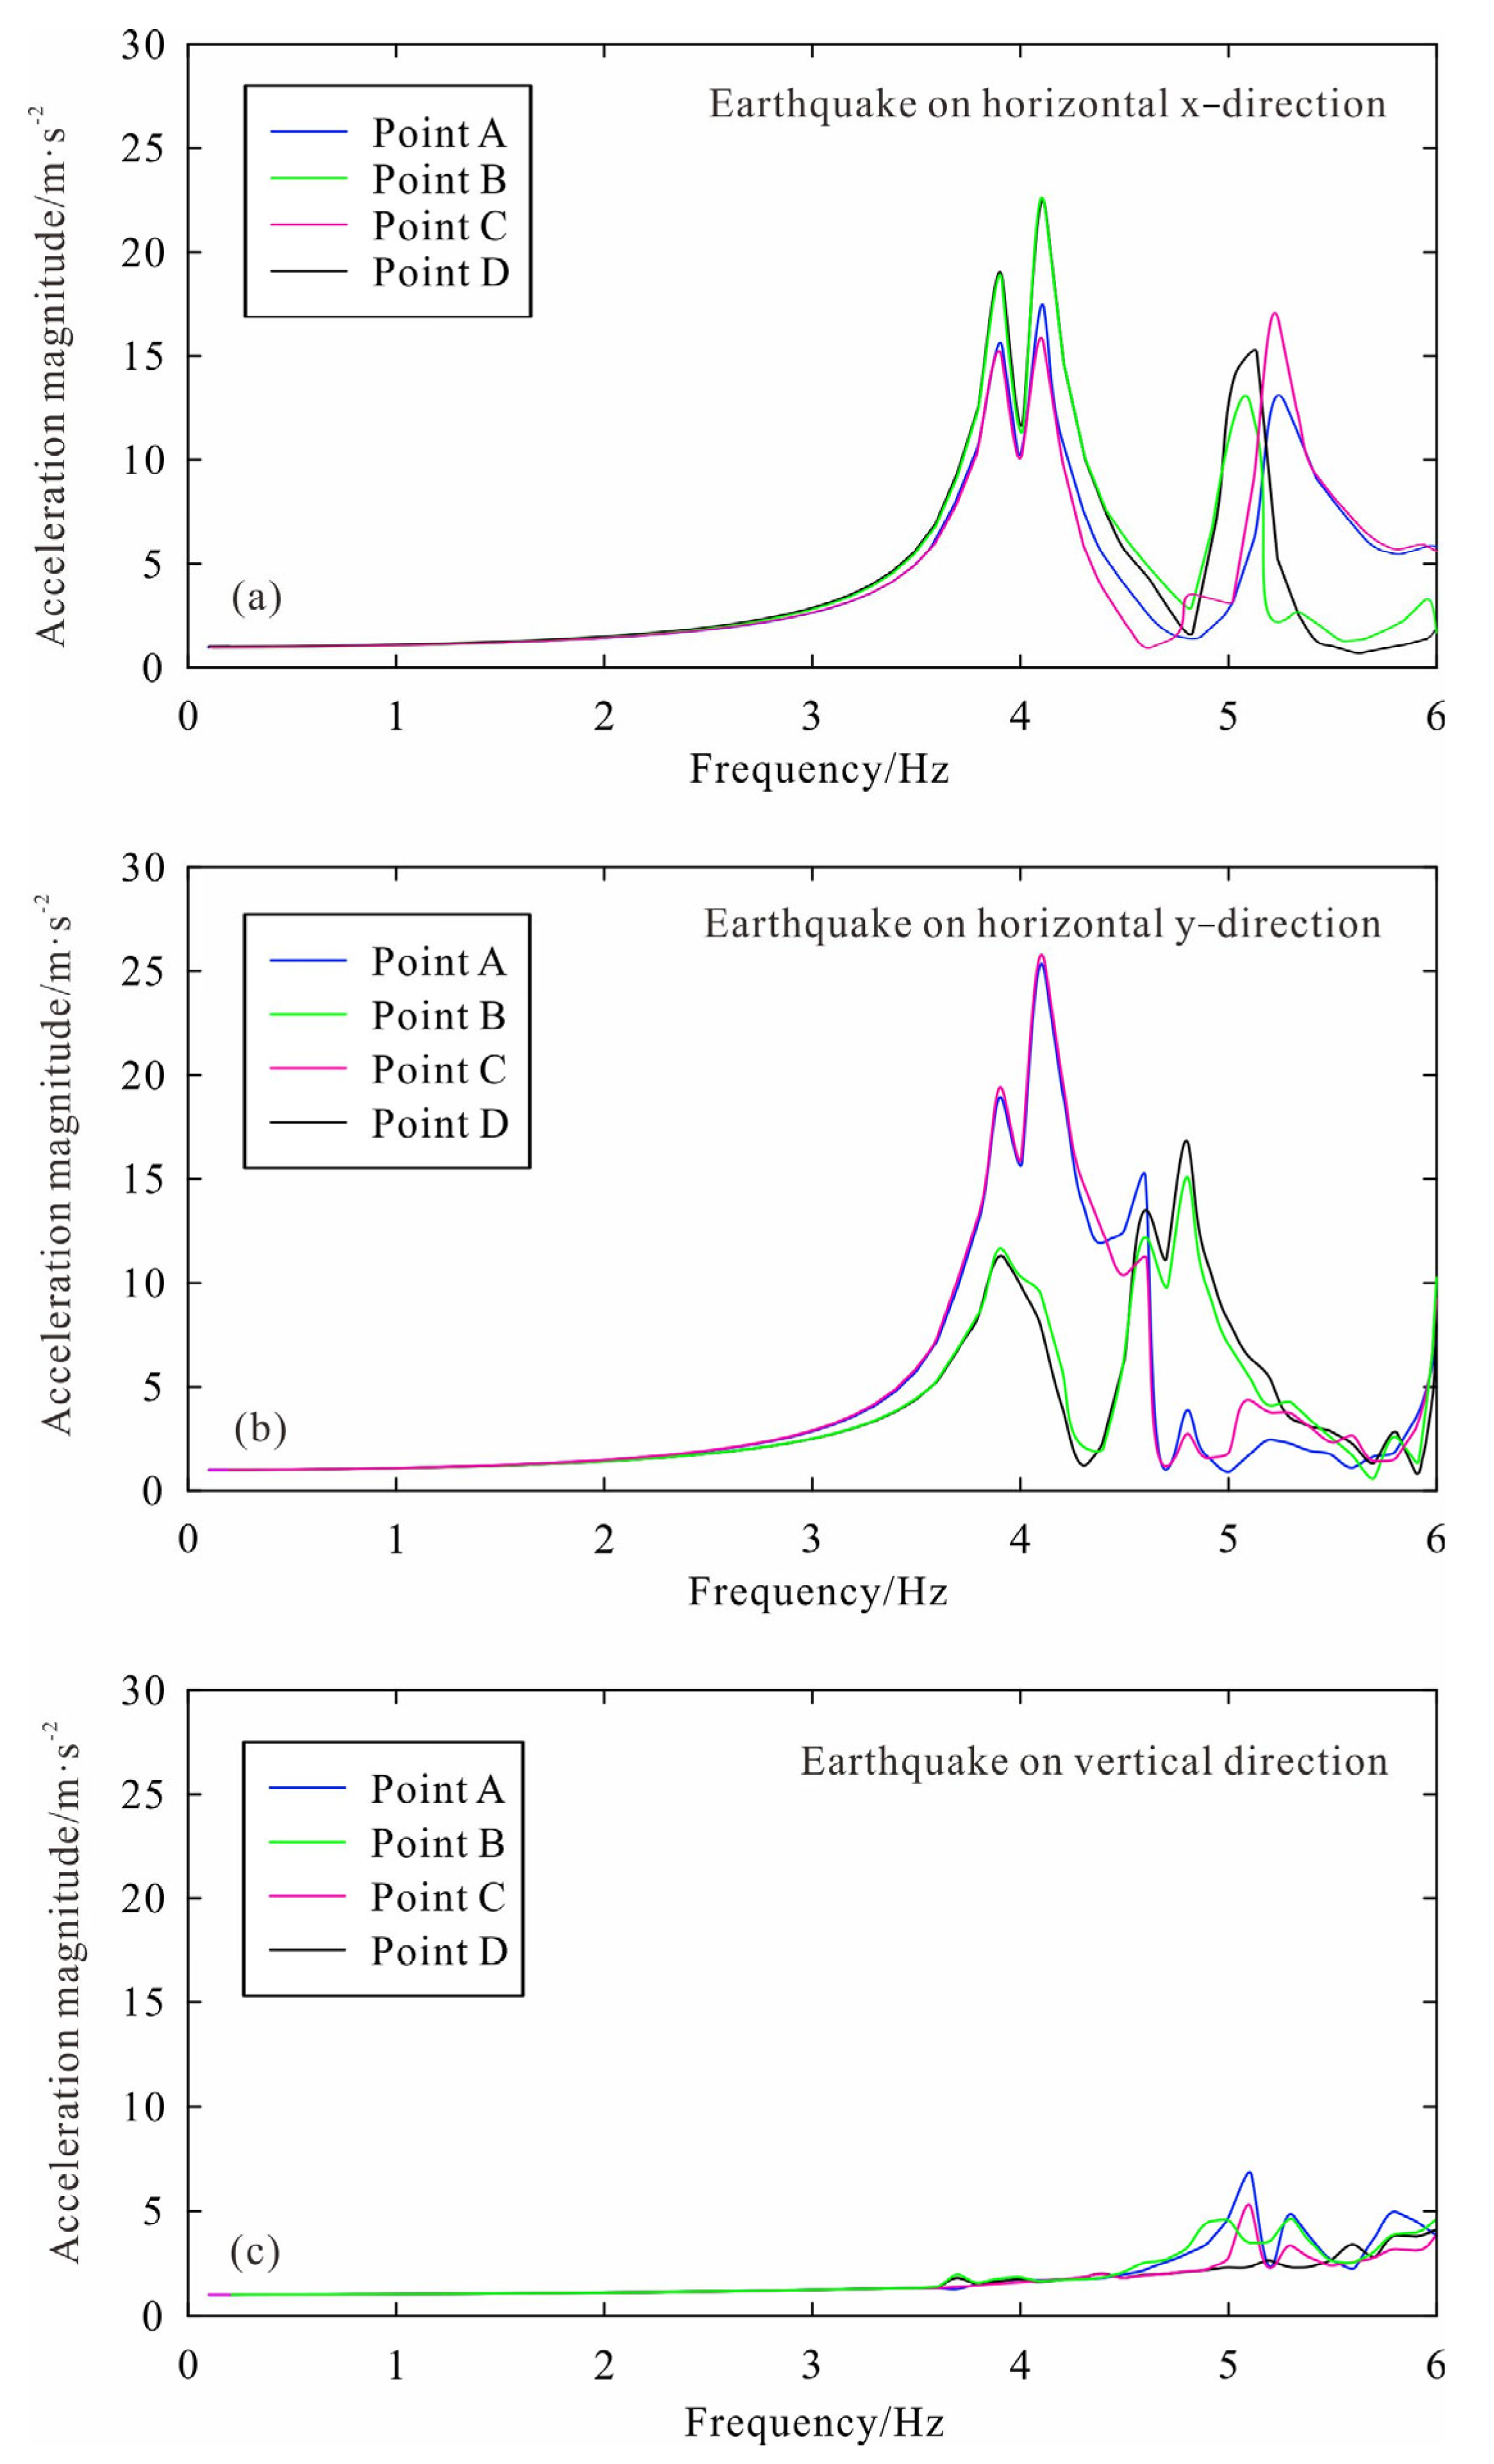
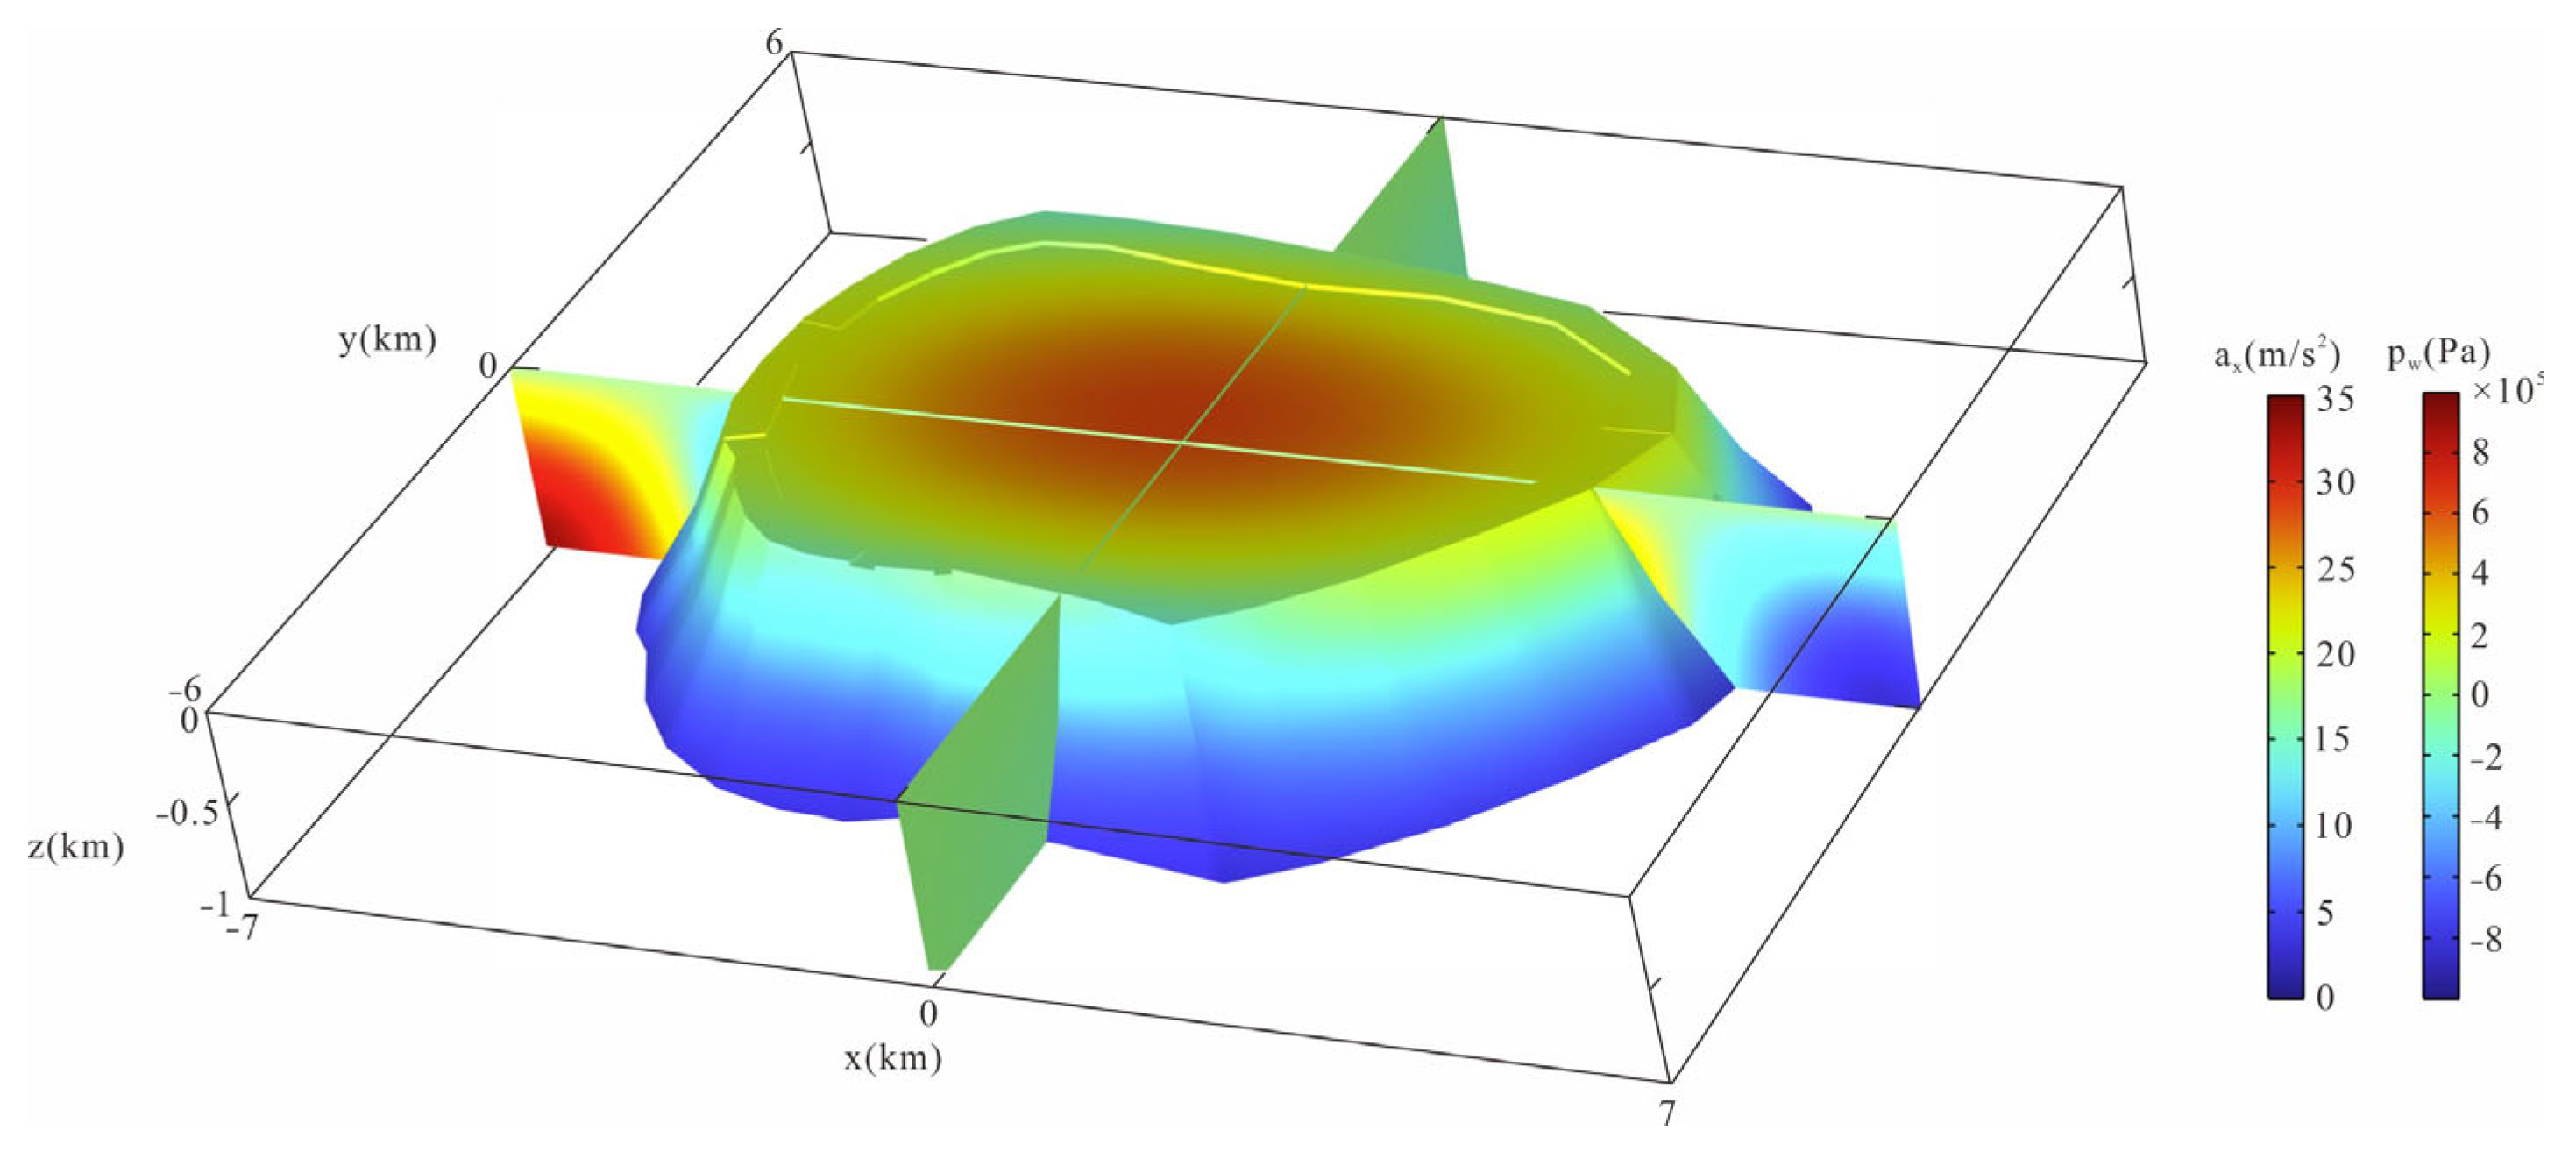
5.1. Earthquake-Induced Responses of Reef–Seawater–Seabed System

For when the influence of the weathered layer is not considered, the acceleration magnitudes with frequency in different areas of the reef flat (Figure 1c, point A, point B, point C, and point D) of the coupling system under horizontal (x-direction, y-direction) and vertical seismic excitations are shown in Figure 4. It can be seen that when the frequency is below 3.5 Hz, the impact of earthquakes in any direction on coral reefs is relatively limited. As the frequency increases, earthquakes in different directions have different impacts on reefs. Under the action of horizontal x-direction seismic excitations, there are three peak frequencies of 3.9 Hz, 4.1 Hz, and 5.1 Hz, with the main peak frequency being 4.1 Hz. Currently, the acceleration at the reef flat is 22.7 m·s−2. The acceleration magnitude of the reef flat is relatively high at point B and point D (parallel to the direction of the input seismic wave). In contrast, the acceleration magnitude at point A and point C (perpendicular to the direction of the input seismic wave) is relatively low (Figure 5a). When the seismic excitations are in the horizontal y-direction, there are also three peak frequencies, namely 3.9 Hz, 4.1 Hz, and 4.9 Hz, and the main peak frequency is also 4.1 Hz. At this time, the acceleration magnitude of the reef flat is relatively high at point A and point C (parallel to the direction of the input seismic wave). In contrast, the acceleration magnitudes at point B and point D (perpendicular to the direction of the input seismic wave) are relatively low (Figure 5b). However, under the action of vertical seismic excitations, the main peak frequency of the reef is 5.1 Hz, and the acceleration magnitudes of the reef flat caused by the vertical propagating waves are significantly weaker than those of the horizontal propagating waves (Figure 5c).
Previous studies in this paper showed that earthquakes in the horizontal direction have a significant impact on coral reefs. Next, in a further study on the acceleration magnitude of reefs at different depths under earthquake, taking seismic waves propagating in the horizontal x-direction and a frequency of 4.1 Hz as an example, the variation of the acceleration with depth at points A, B, C, and D is shown in Figure 6. It can be seen that the deeper the positions of the coral reefs, the smaller their acceleration, and the shallower their positions, the larger their acceleration. This can also be observed in previous studies, in which the acceleration accumulates in the shallow reef layer during the propagation of seismic waves from bottom to top, making it more susceptible to influence [17,19,20].
In addition to the different acceleration amplitudes of coral reefs at different depths, significant differences exist in the acceleration amplitudes in different areas of the reef flat (including the outer reef flat, the middle of the reef flat, and the reef flat near the lagoon). Taking point A as an example, at the main peak frequency (4.1 Hz), the acceleration amplitude of the outer reef flat is ~18 m·s−2, the acceleration of the middle reef flat is ~19 m·s−2, and near the lagoon side, it is ~20 m·s−2 (Figure 7a). Points B, C, and D exhibit the same pattern, the acceleration is the smallest at the outer reef flat, and the closer it is to the lagoon, the larger the acceleration amplitude (Figure 7b–d). This is consistent with previous studies [11,12].
To visually display the seismically induced responses of the reef–seawater–seabed coupling system, Figure 8 shows the 3-D distribution of the hydrodynamic pressure p w (in lagoon and seawater) and acceleration amplitude a x (in reef body) at the main peak frequency (4.1 Hz when the seismic wave is in the horizontal direction and 5.1 Hz when the seismic wave is in the vertical direction) of Meiji Reef under different directions of seismic excitations. Under the action of horizontal seismic excitations, the center of the lagoon is the most affected. As it moves outward, the impact of earthquakes will gradually decrease. Reefs in deep layers are less affected by earthquakes, while they are more affected when in shallow layers. The influence of earthquakes on reefs is also related to the direction of wave propagation. Horizontal x-direction seismic waves cause the reef to be more affected on the side parallel to the x-axis, while the side perpendicular to the x-axis is less affected. Meanwhile, the earthquake-induced hydrodynamic pressure of seawater around the reef is also mainly generated in the horizontal x-direction (Figure 8a). Similarly, horizontal y-direction seismic waves cause more effects in the y-direction, while they are less affected by the x-direction (Figure 8b). Compared to seismic waves in the horizontal direction, the dynamic responses of the reefs are less affected by the vertical propagating waves, and the acceleration amplitudes of the reef in all directions are roughly equal. In addition, the values for the hydrodynamic pressure of seawater around the reef caused by earthquakes are also much smaller and nearly equal to each other in all directions (Figure 8c).
Taking the horizontal x-direction earthquake excitation as an example, considering when the reef is composed of saturated porous material and single-phase linear elastic material, the acceleration changes with frequency are shown in Figure 9. Compared to saturated porous materials, when the reefs are single-phase linear elastic materials, coral reefs also have three peak frequencies, but this will reduce the peak acceleration and increase the peak frequency to ~0.2 Hz. Furthermore, the 3-D distribution of the hydrodynamic pressure and the acceleration amplitude of the horizontal x-direction excitation at the frequency of 4.1 Hz when the reef is a single-phase linear elastic solid material is shown in Figure 10.

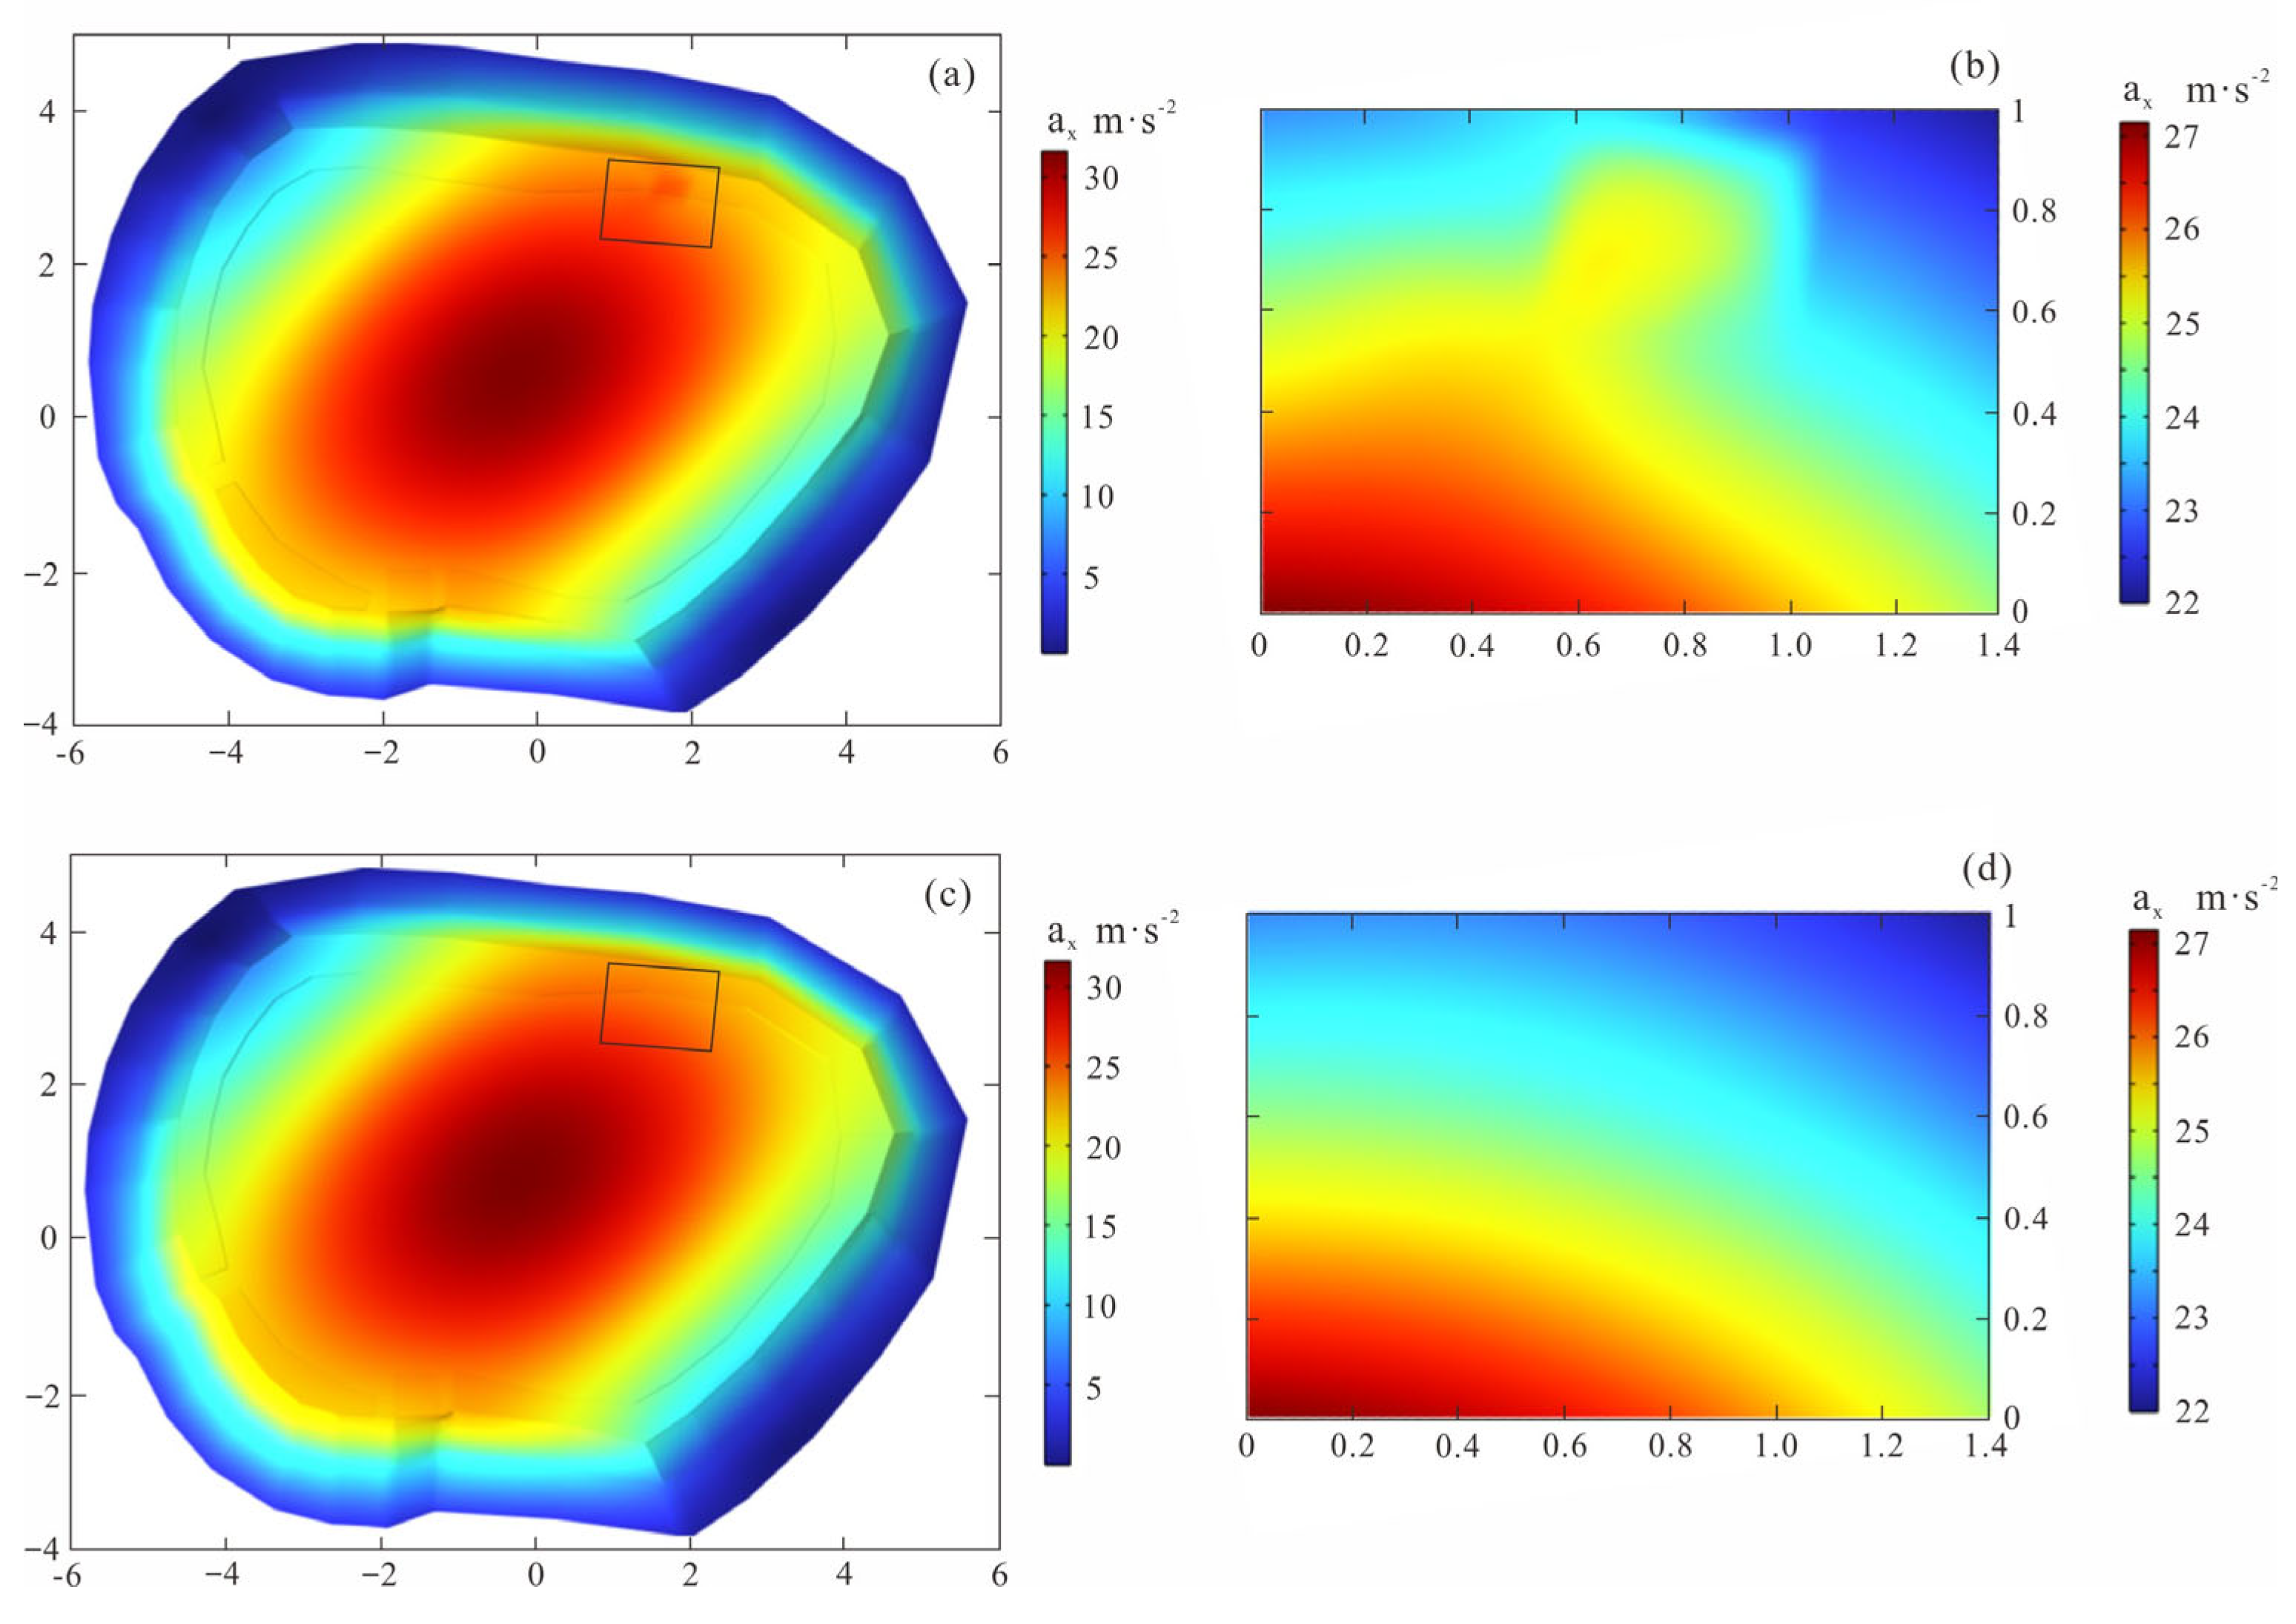
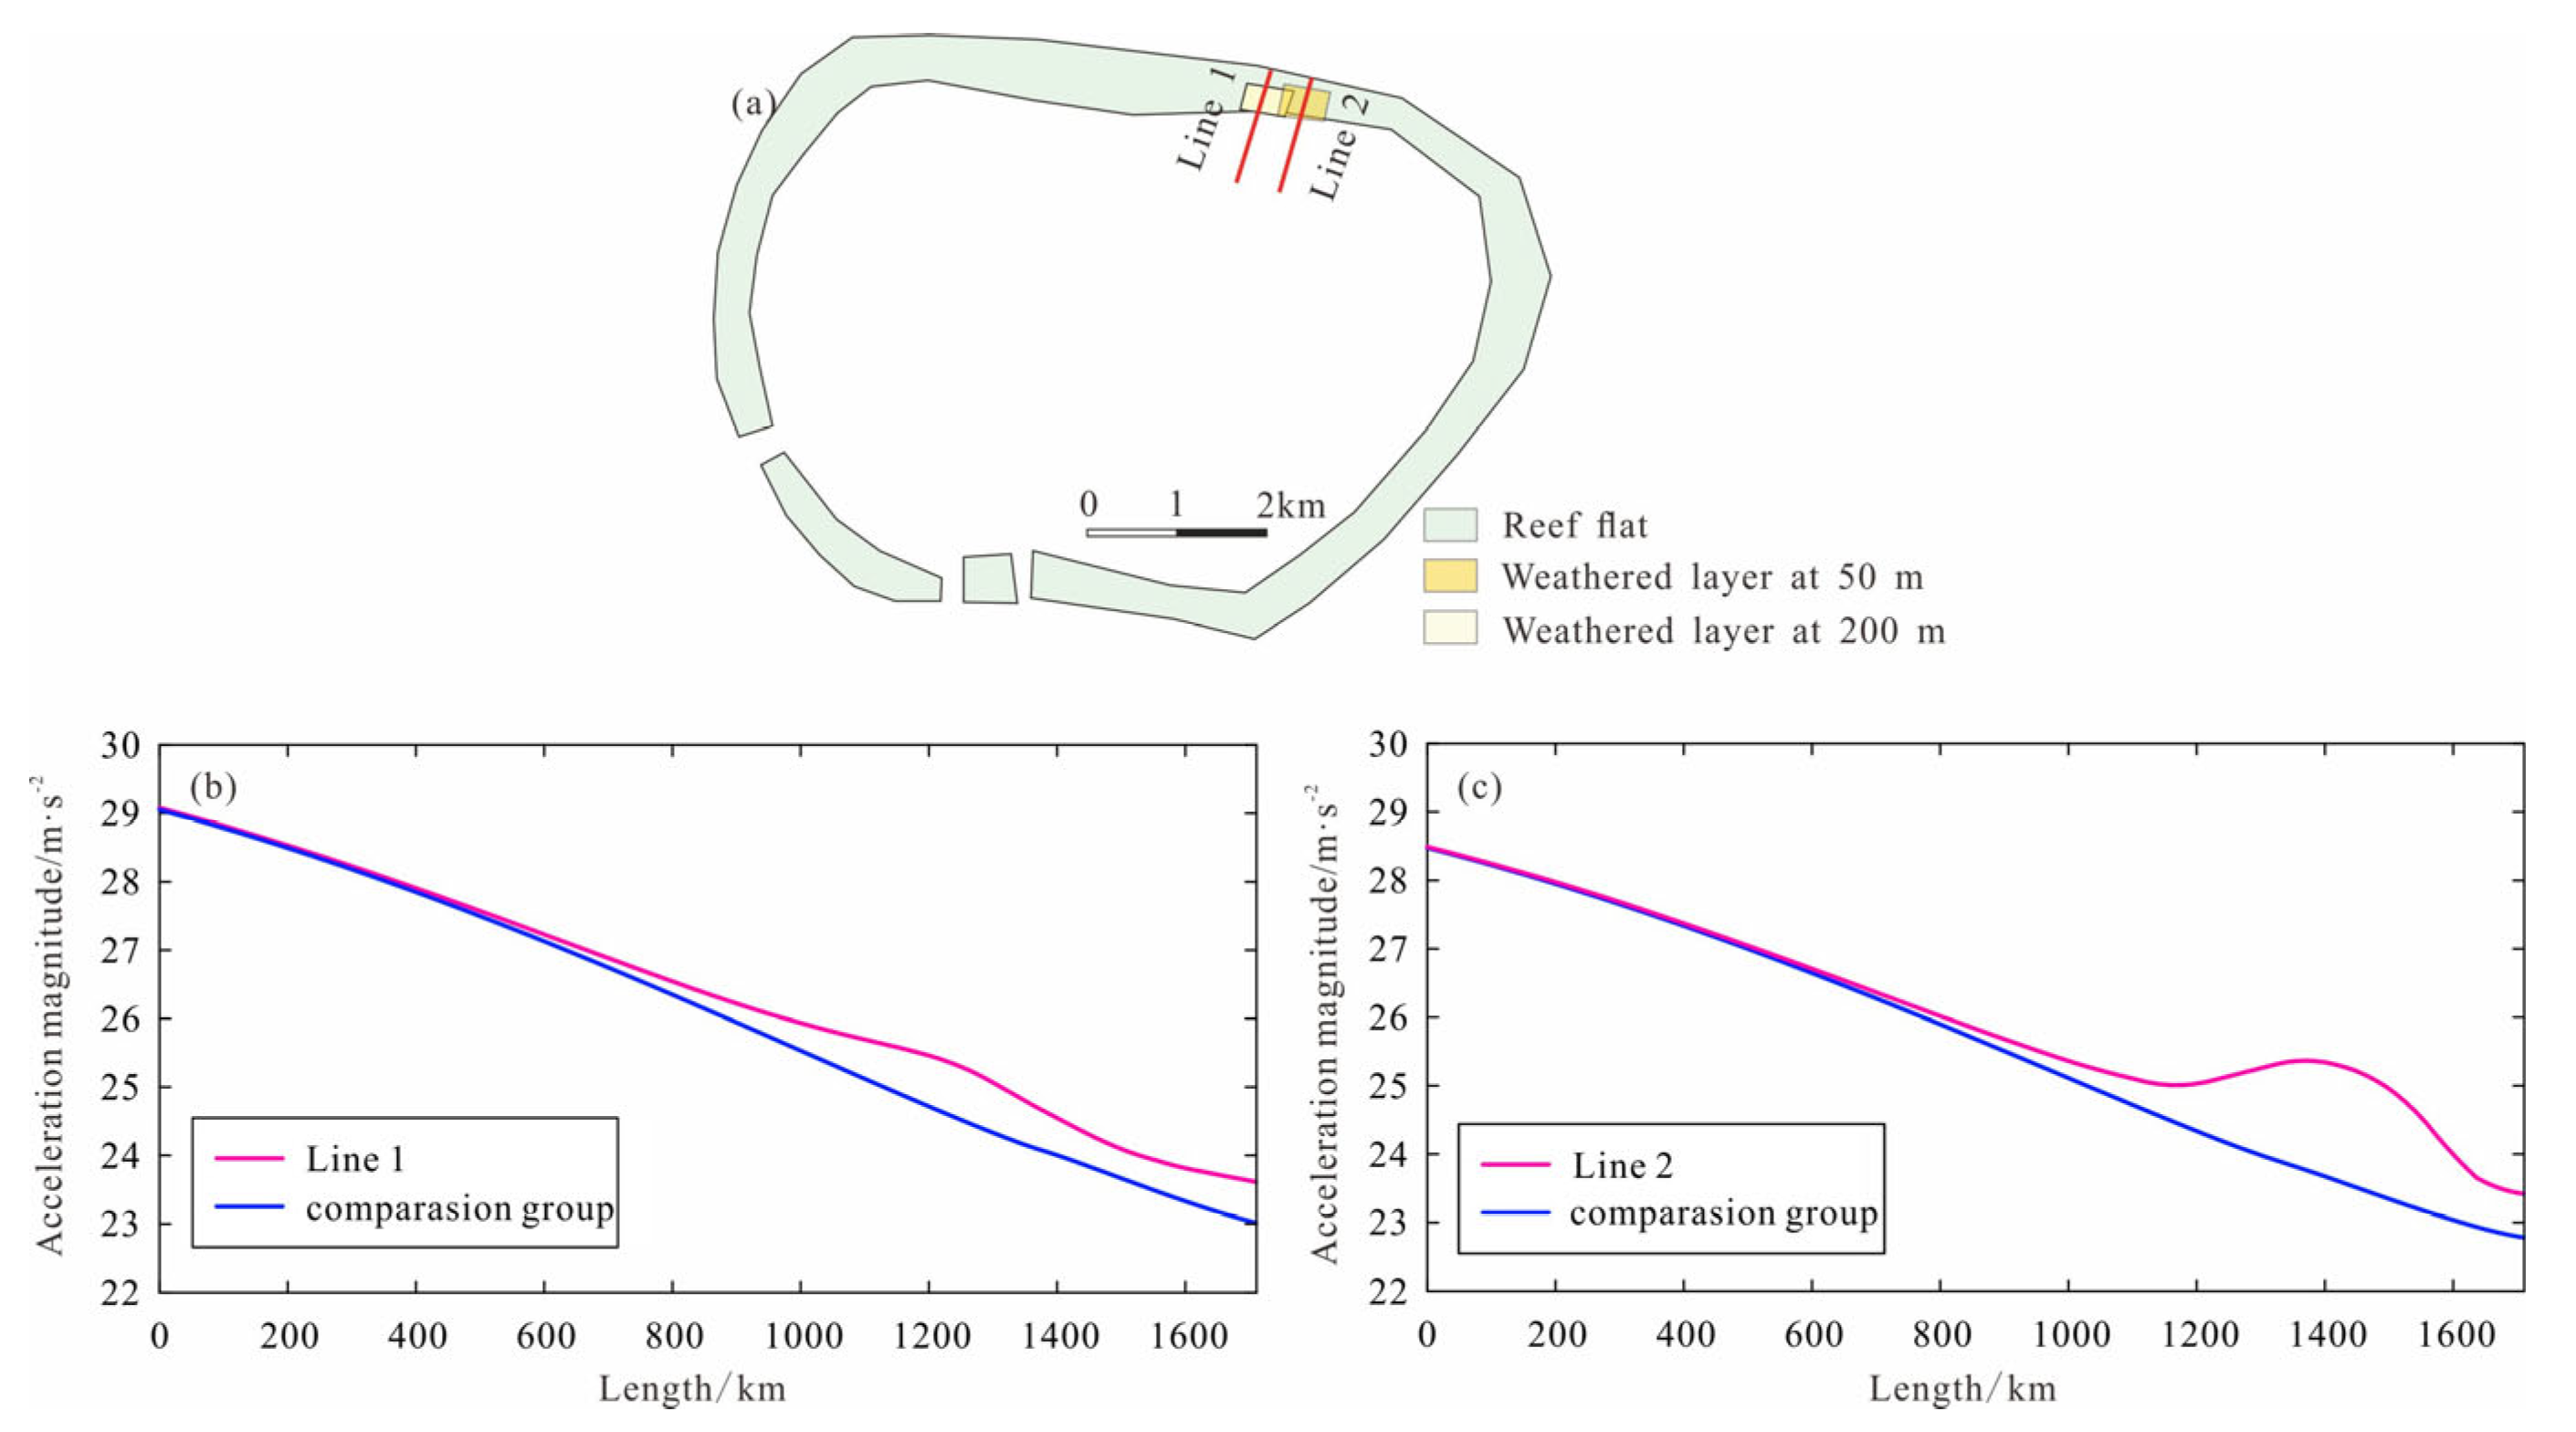
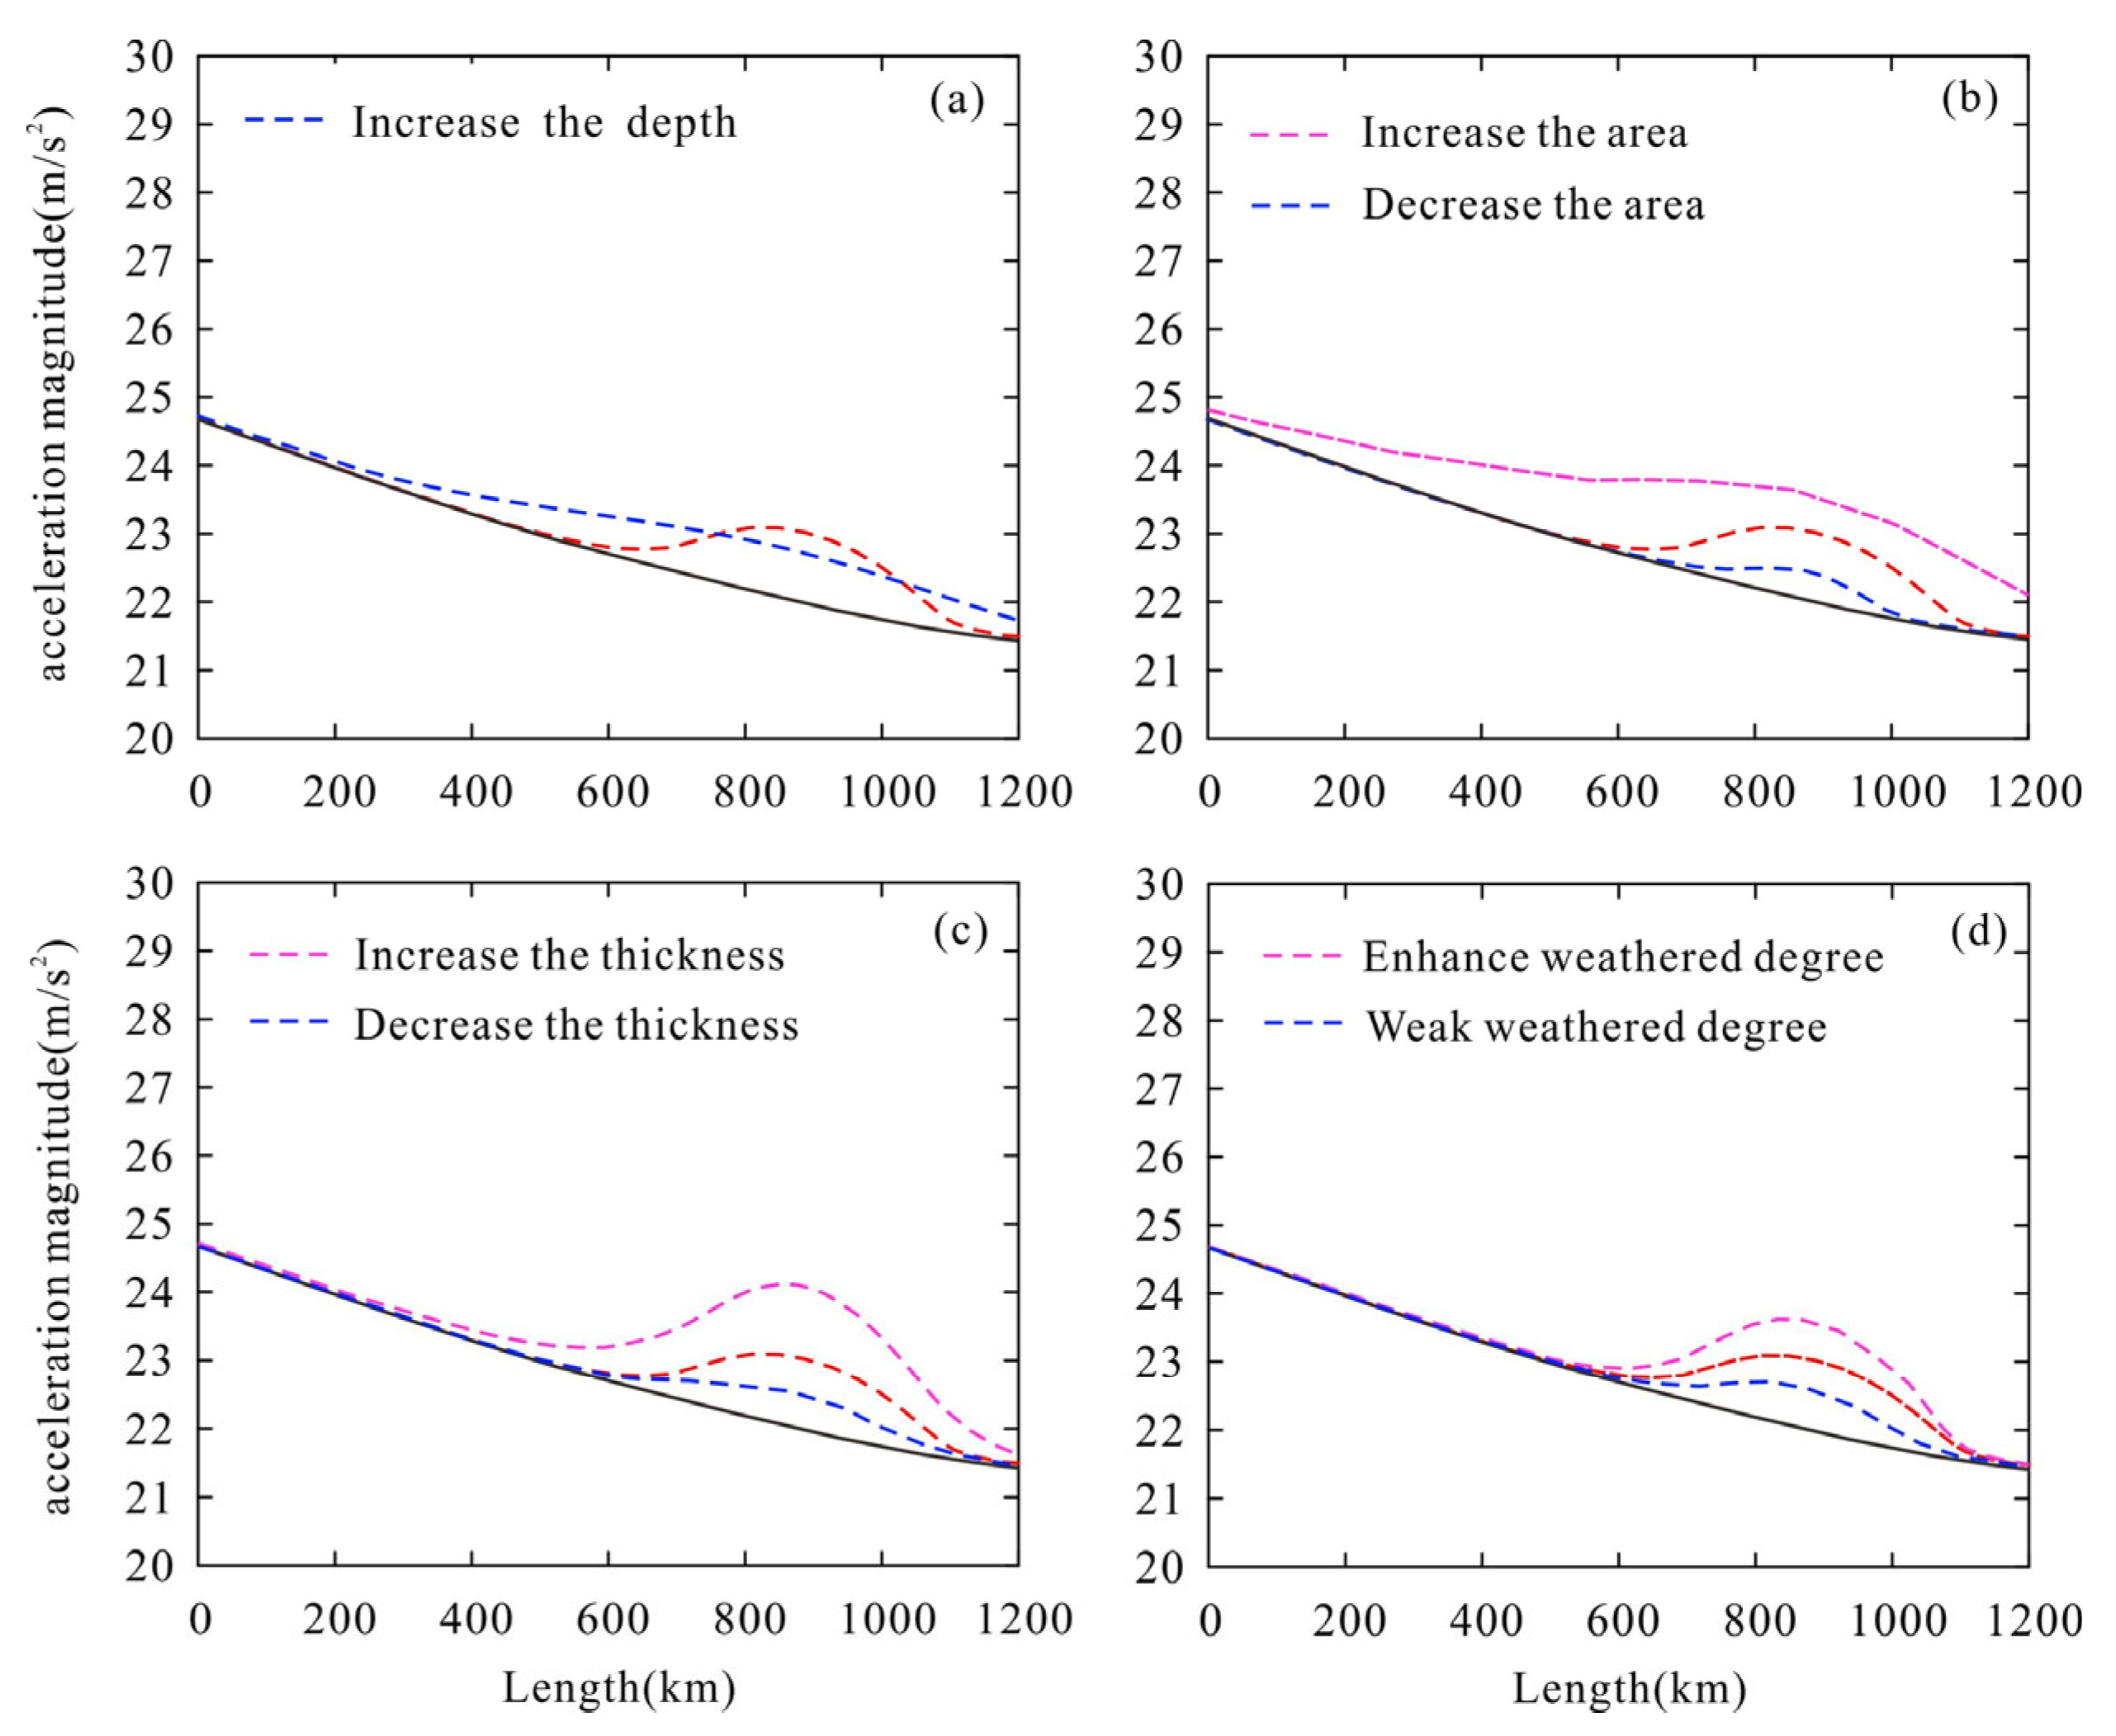
5.2. The Impact of High-Porosity Weathered Layer on the Overlying Reef Flat

In reality, high-porosity, low-wave-velocity weathering layers are located northeast of the Meiji Reef, with geometric shapes, dimensions, and positions as described in Section 2. Based on the results in Section 5.1, seismic excitation with a frequency of 4.1 Hz, in the horizontal direction, and pointing towards the weathering layer is satisfied. Meanwhile, the frequency responses of non-weathered-layer reefs under the same seismic action were used as the contrast group for this research.
The results indicate that the high-porosity weathering layer within the reef will significantly increase the seismic impact on the reef and the adjacent areas above it (Figure 11). To more clearly identify the impact of the weathered layer on the reef flat above it, the acceleration amplitudes of the reef flat above the 200 m deep weathered layer (line 1) and 50 m deep weathered layer (line 2) were studied separately (Figure 12a). Similarly, the acceleration magnitudes of the same two lines without the weathered layer were used as a contrast group. It can be seen that when the weathered layer is located at a depth of 200 m, the acceleration amplitude of the reef flat above it only increases to 0.74 m·s−2, but the affected area is 800 m wide, with an affected area almost twice the width of the weathered layer (Figure 12b). When the weathered layer is located at a depth of 50 m, the acceleration amplitude of the reef flat above it increases to 2.05 m·s−2, while the affected area on the reef flat is only 560 m (Figure 12c). In addition, the weathered layer has the most significant impact on the reef flat directly above its center, and its effect gradually decreases from the center to the surrounding areas.
However, only one high-porosity weathered layer has been identified in the northeast of the Meiji Reef, and in the actual geological evolution process, erosion and weathering events are unlikely to occur only in one place, and the degree of weathering may also vary. This means that there may be weathered layers of different sizes, depths, and degrees within the Meiji Reef. Taking the actual weathered layer (whose size is 500 m × 400 m × 50 m, and whose top surface is 25 m deep) as the initial situation, the impact of weathered layers of different depths, sizes, thicknesses, and degrees of weathering on the reef flat is studied further. The earthquake excitation’s frequency is 4.1 Hz, with a horizontal direction pointing toward the weathered layer.
When an earthquake occurs, the weathered layer located at a depth of 25 m induces the peak acceleration of the reef flat above it to increase by 5.2%, affecting the reef flat within an area of 550 m. When the depth of the weathered layer increases to 75 m, the peak acceleration of the reef flat above it decreases, but the affected area increases (Figure 13a). When the area of the weathered layer is increased to 1000 m × 800 m × 50 m, the peak acceleration of the reef flat above it increases by 9.1%, affecting an area of 1150 m. However, when it is decreased to 250 m × 200 m × 50 m, both the peak acceleration and affected area decrease (Figure 13b). When the thickness of the weathered layer increases to 100 m, the peak acceleration of the reef flat above it increases by 9.8%, affecting an area of 580 m. When the thickness of the weathered layer is reduced to 25 m, the peak acceleration of the reef above it only increases by 2.8%, and this affects an area of 470 m (Figure 13c). The change in weathering degree is achieved by changing the porosity and acoustic velocity of the weathered layer; the parameters are shown in Table 2 (the enhanced and weakened weathering degrees are based on the actual weathered layer parameters mentioned in Section 4. An enhanced weathering degree means an increase in porosity and a decrease in density and acoustic velocity, while with a lower weathered degree, the opposite changes occur in the various parameters). If it is subjected to more severe weathering, the peak acceleration of the overlying reef flat increases by 8.8%, while its impact on the overlying reef plateau will decrease when decreasing the weathering degree. However, the lateral impact range is almost unaffected by the degree of weathering.

6. Conclusions

This paper constructed a 3-D model of saturated porous coral reefs, seawater, and a single-phase linear elastic solid seabed, fully considering the dynamic interactions between different materials. By studying in frequency domain, the following can be concluded:
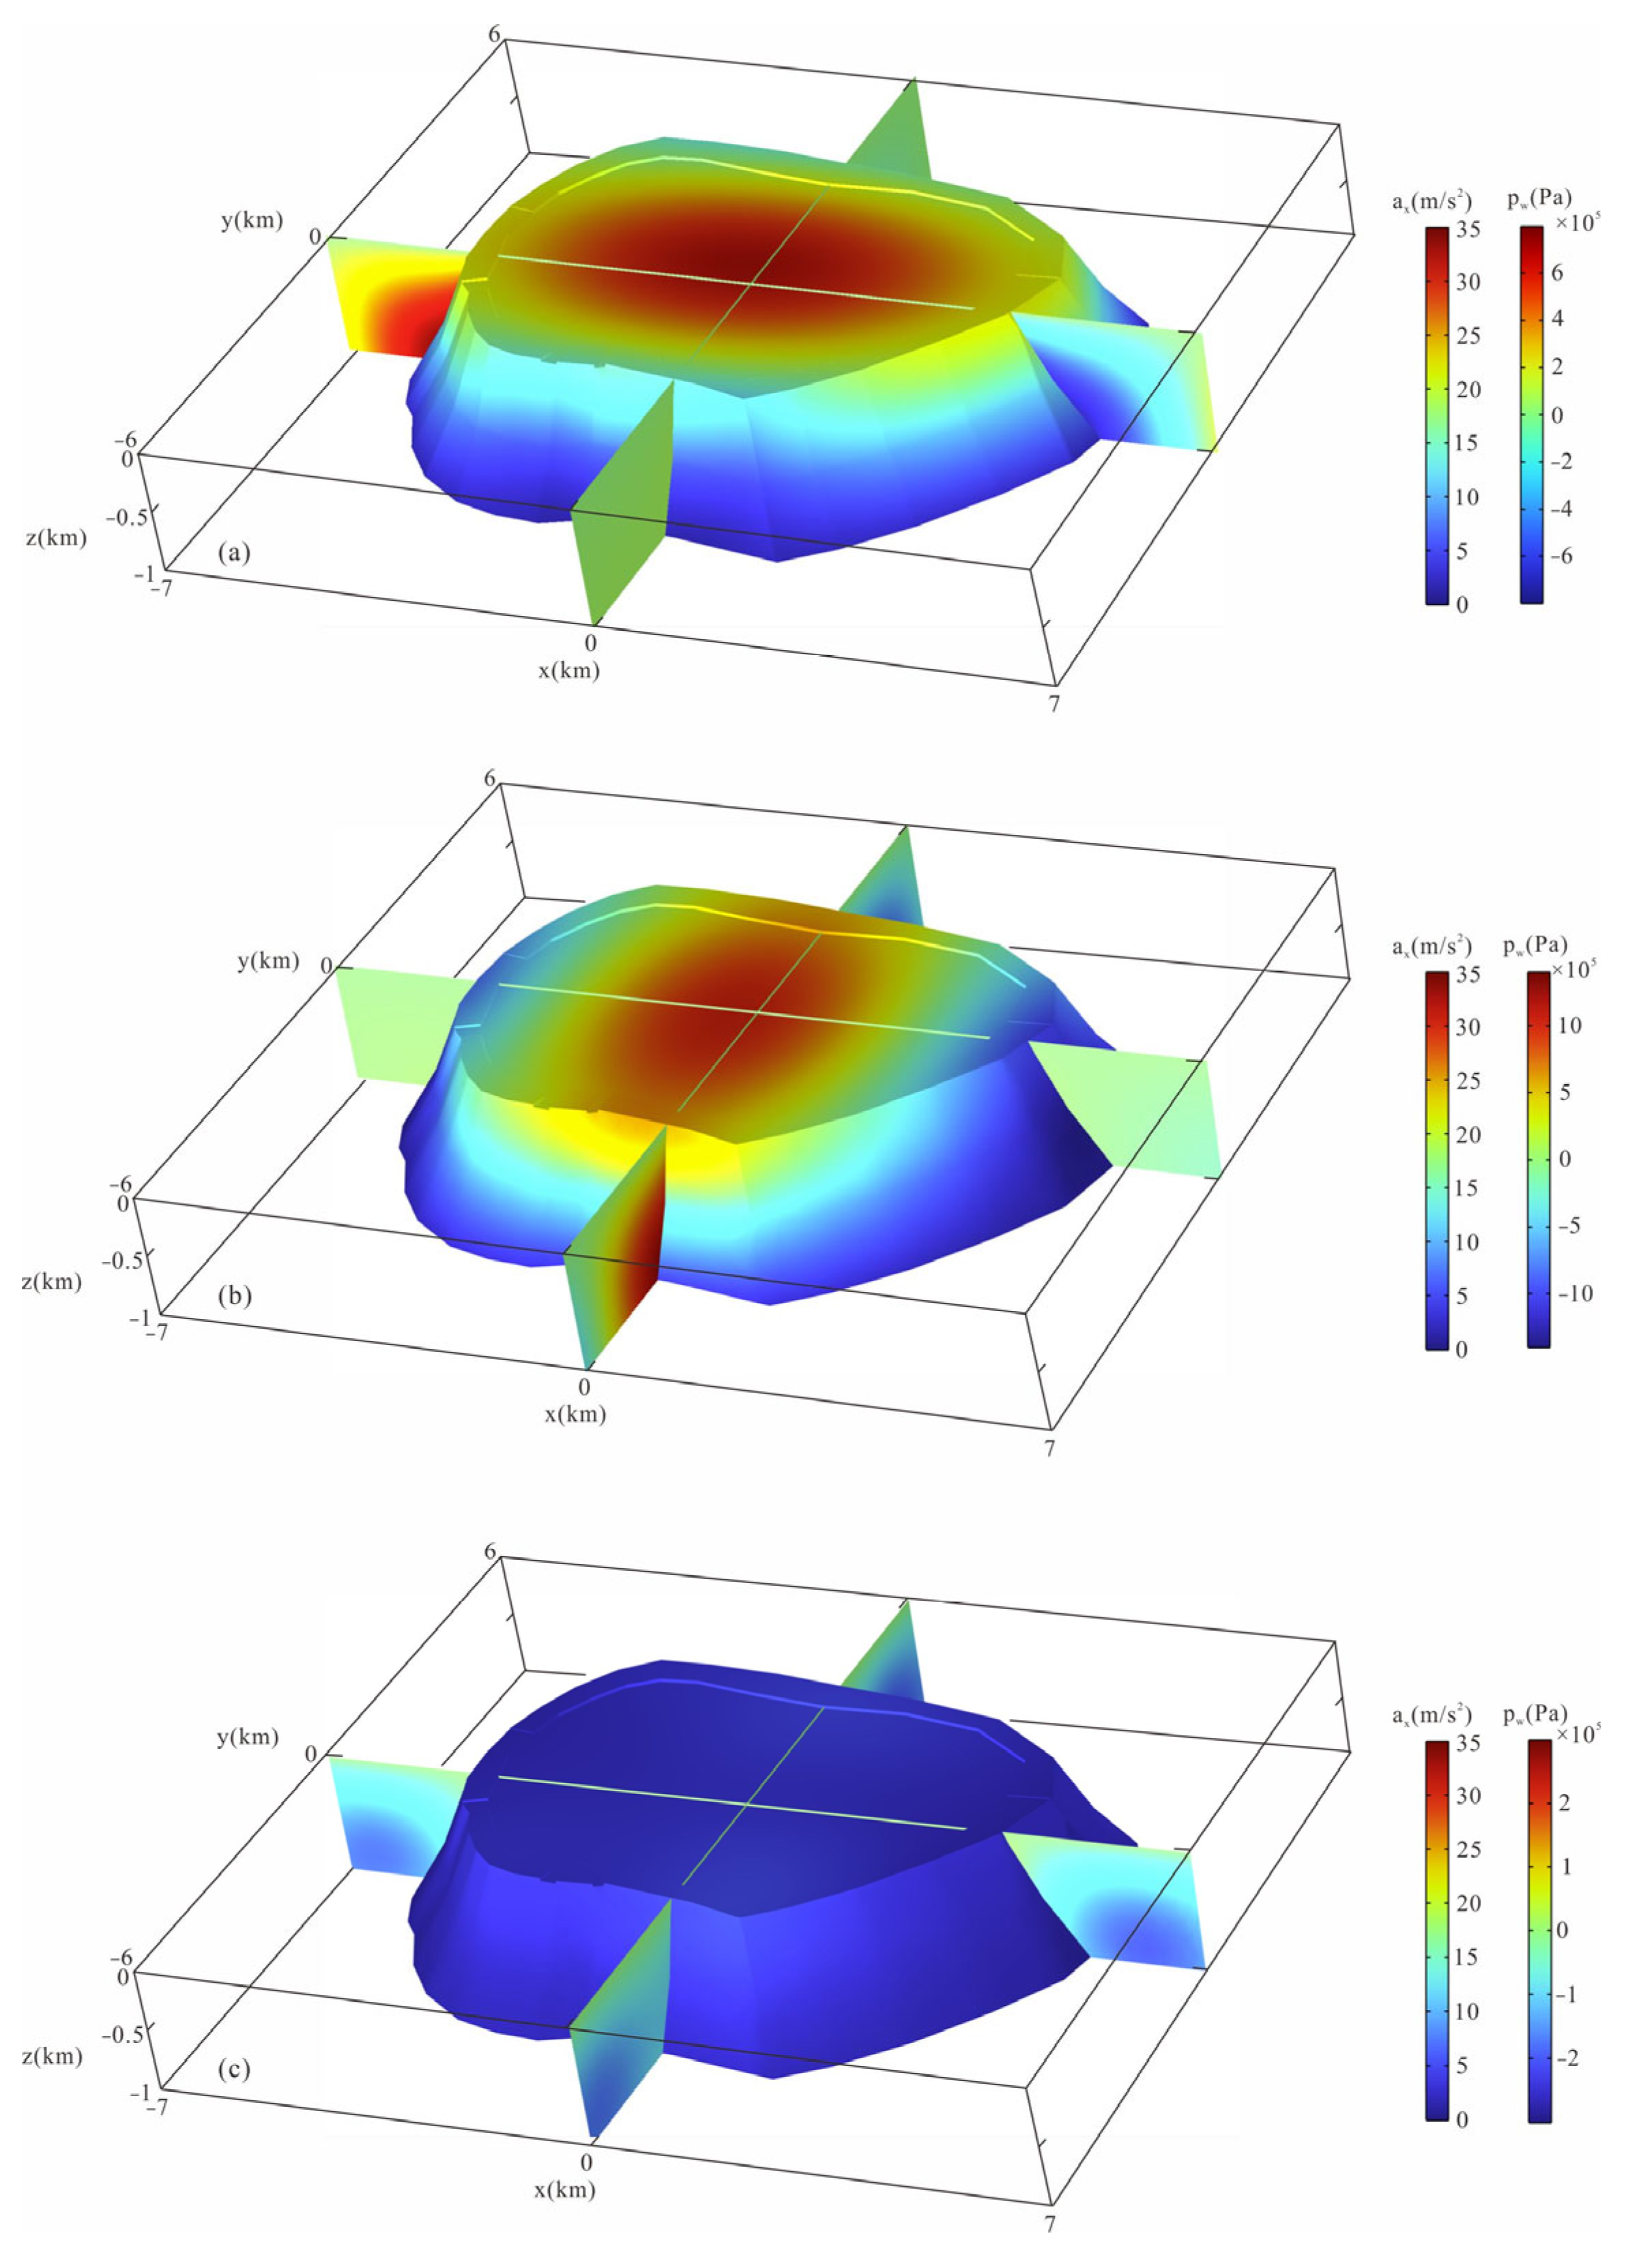
  • The impact of horizontal seismic excitation on reefs is greater than that of vertical excitation, and the seawater dynamic pressure and reef acceleration caused by earthquakes are mainly concentrated on the side parallel to the direction of seismic wave propagation, while fewer effects occur perpendicular to the direction of the wave propagation.
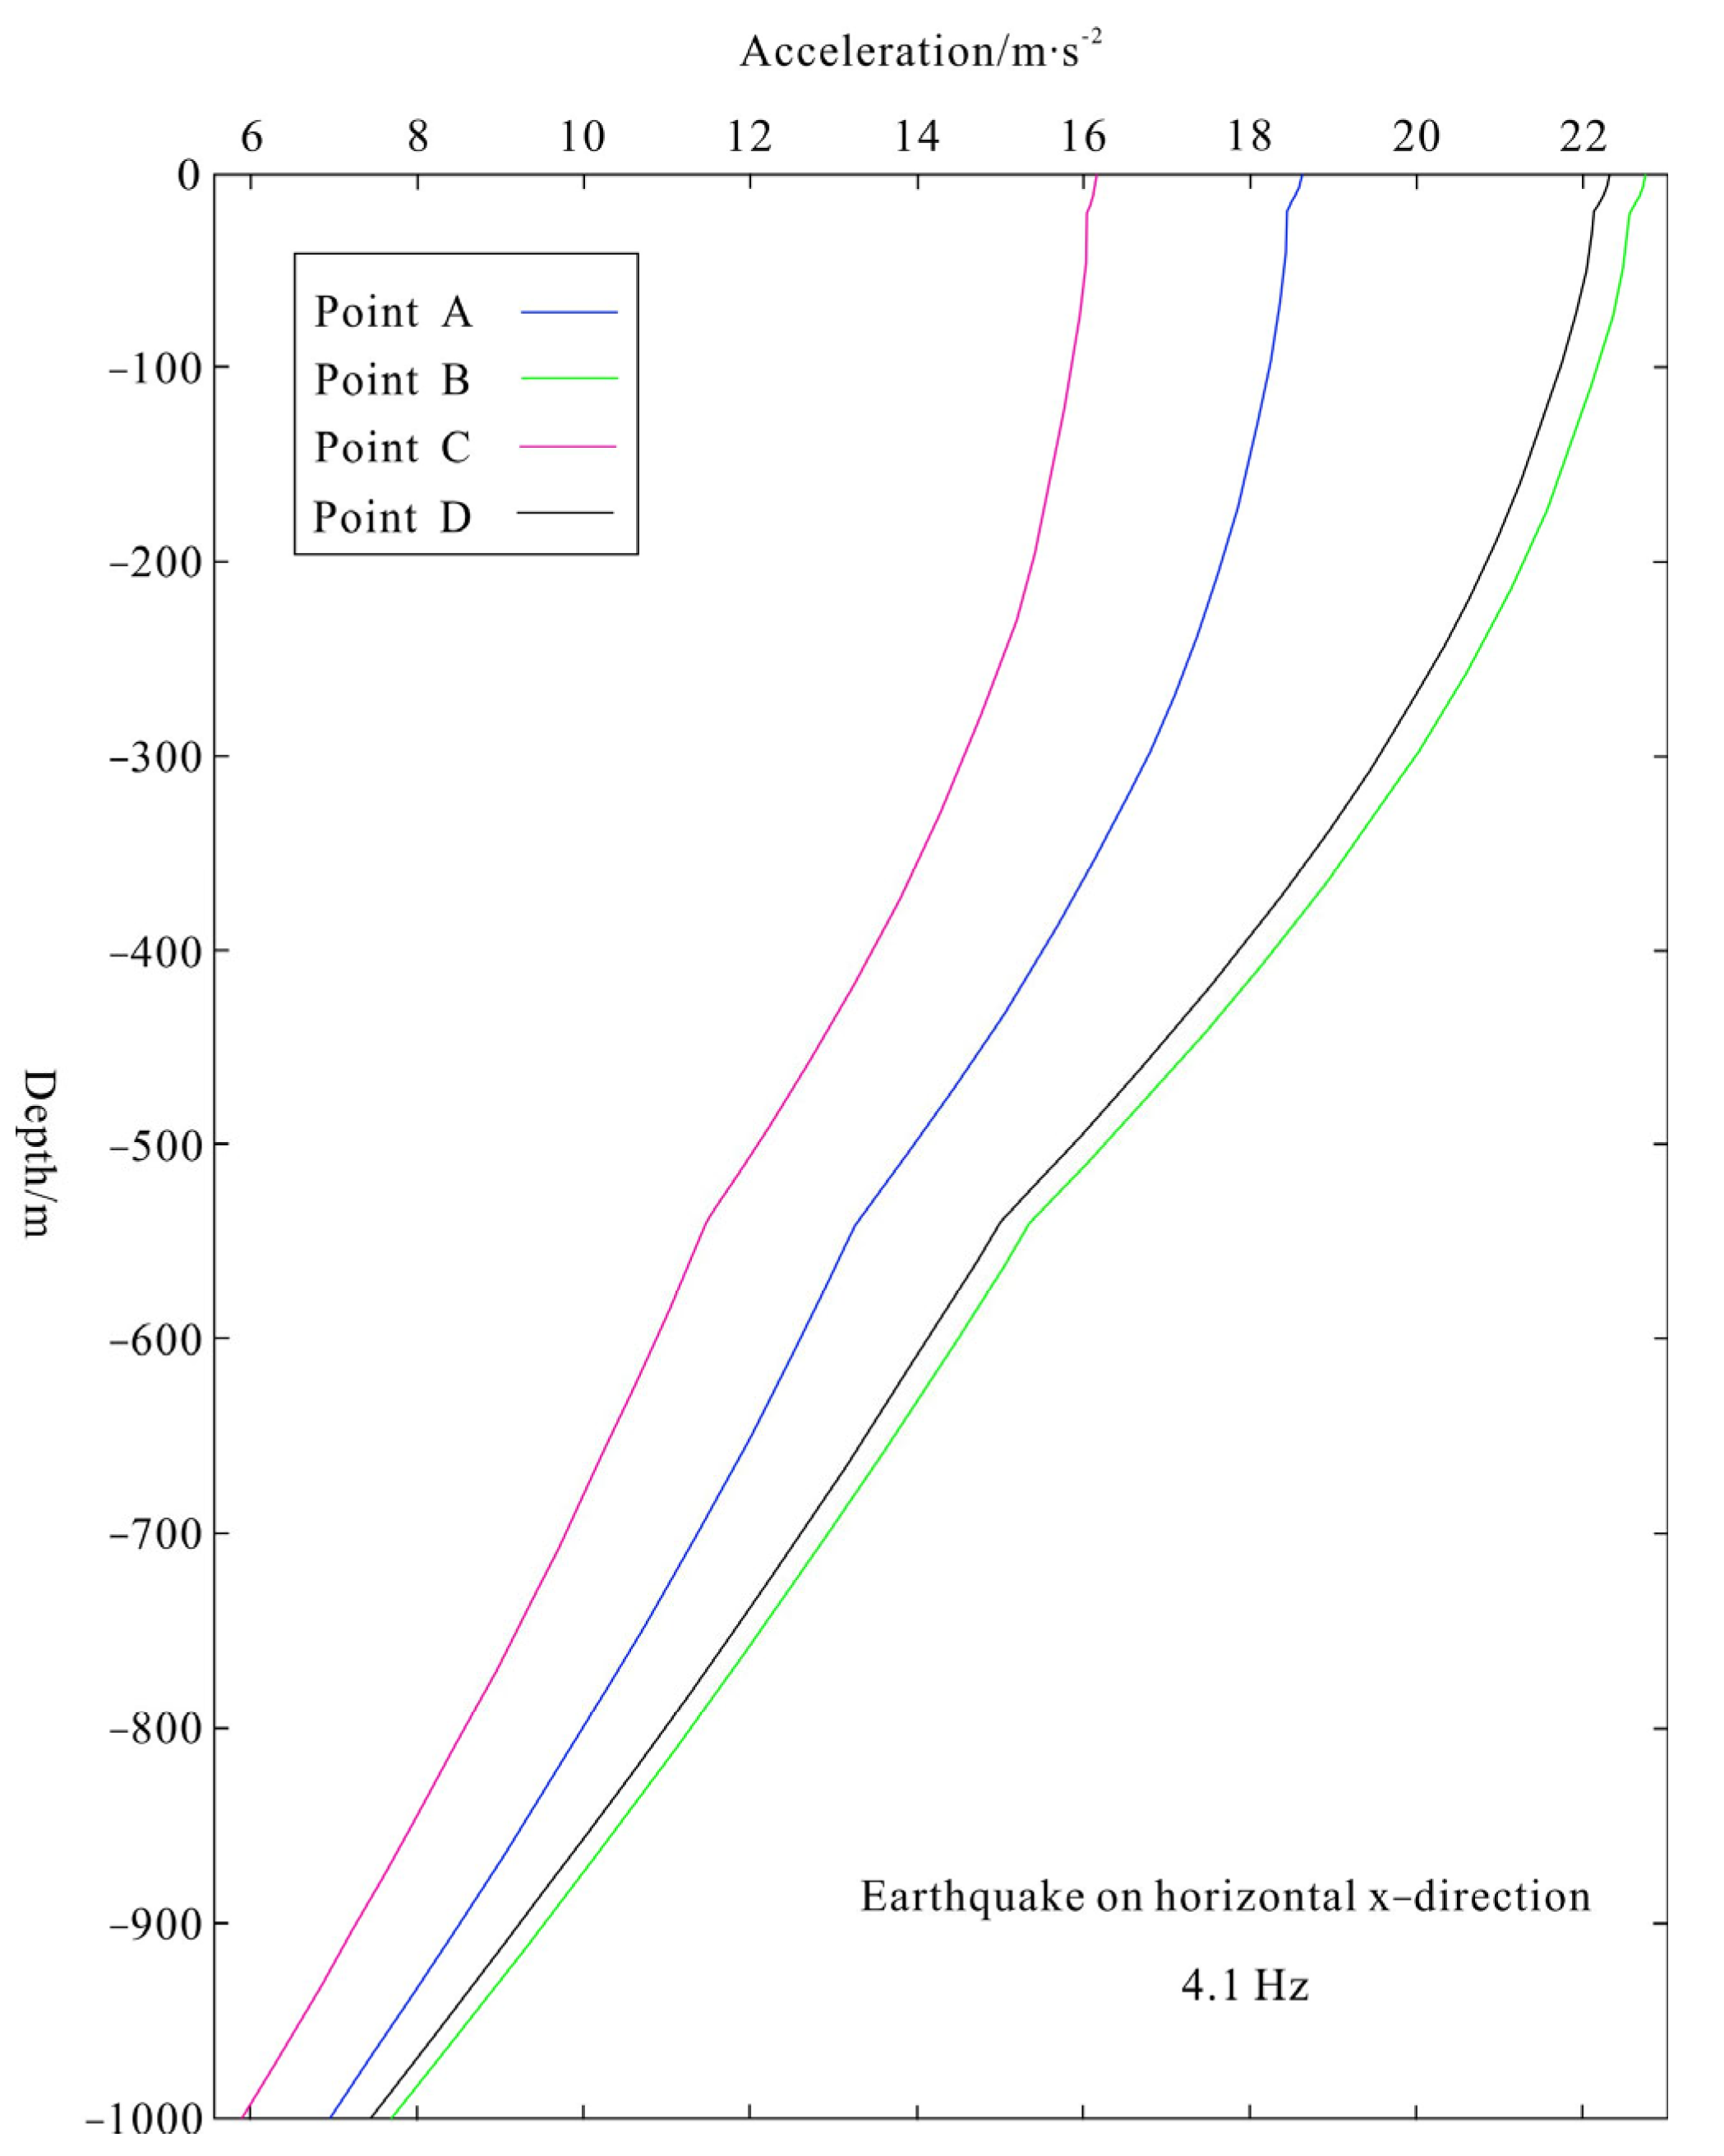
  • The reef near the lagoon is more affected by earthquakes, while the side near the seawater is less affected. During the propagation of seismic waves from bottom to top, the acceleration accumulates in the shallow reef layer, making the shallow reef layer more susceptible impact.
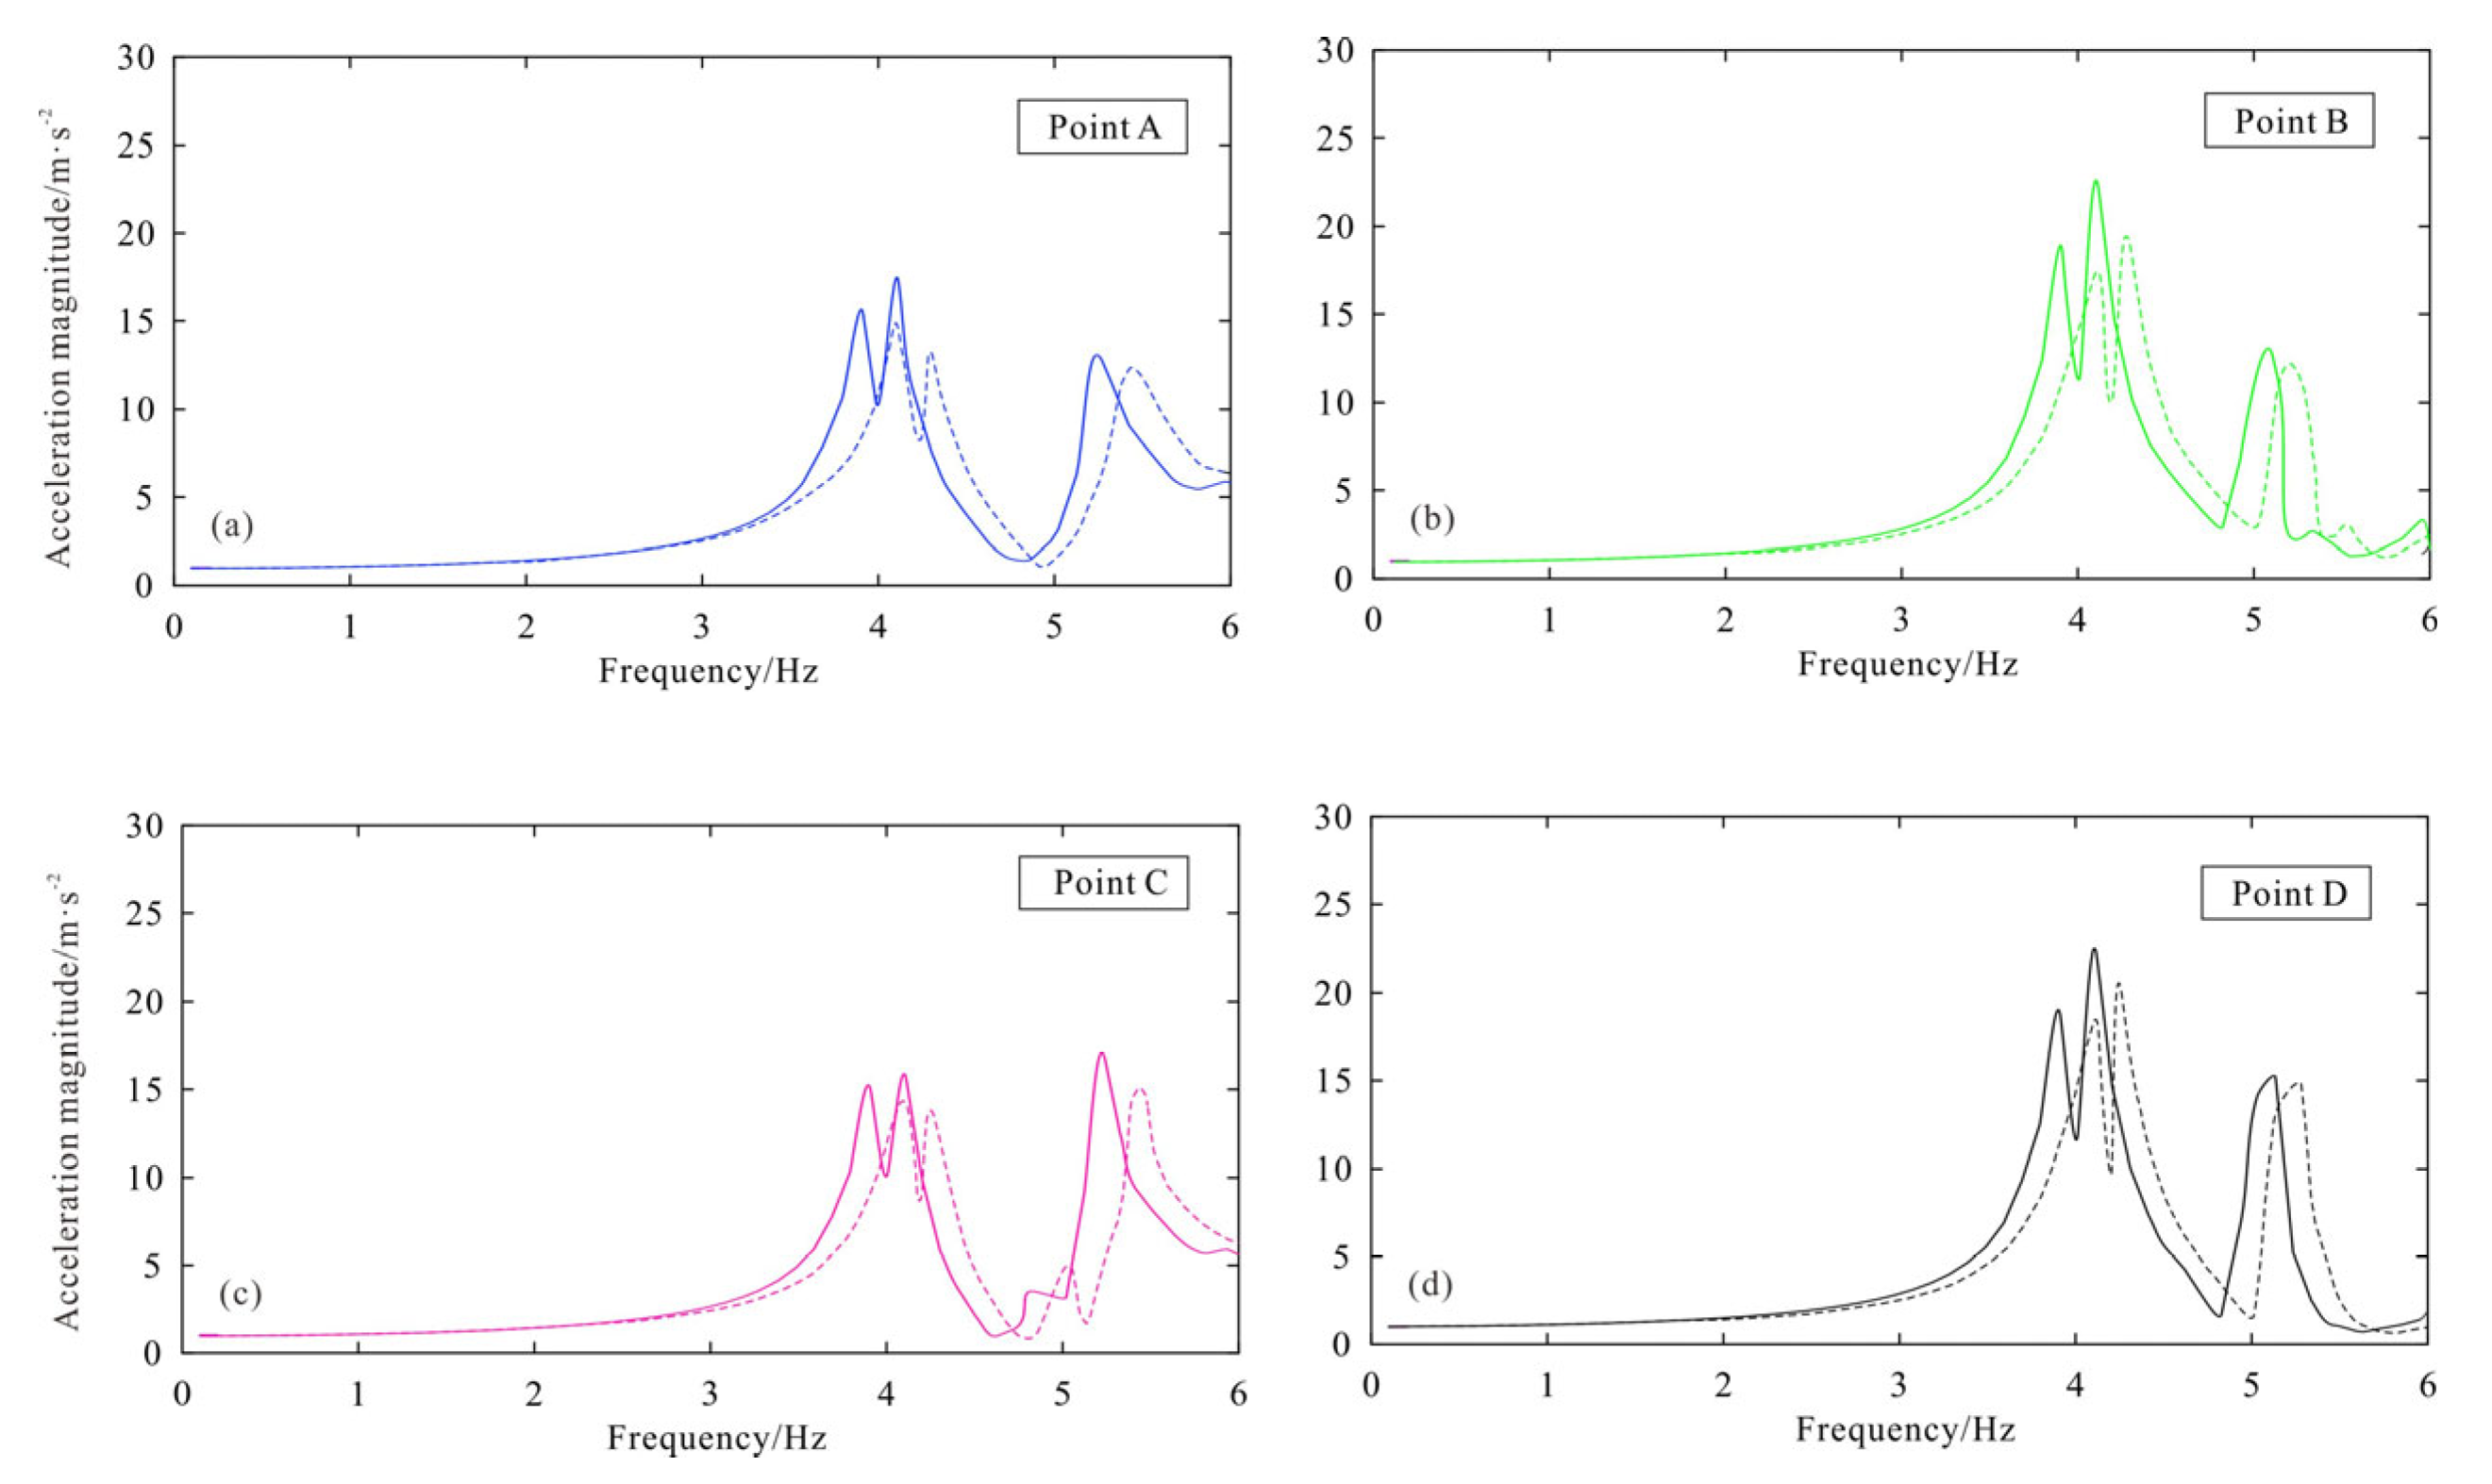
  • Compared to saturated porous elastic materials, single-phase linear elastic solid materials would reduce the seismic response of coral reefs and increase the peak frequency to ~0.2 Hz.
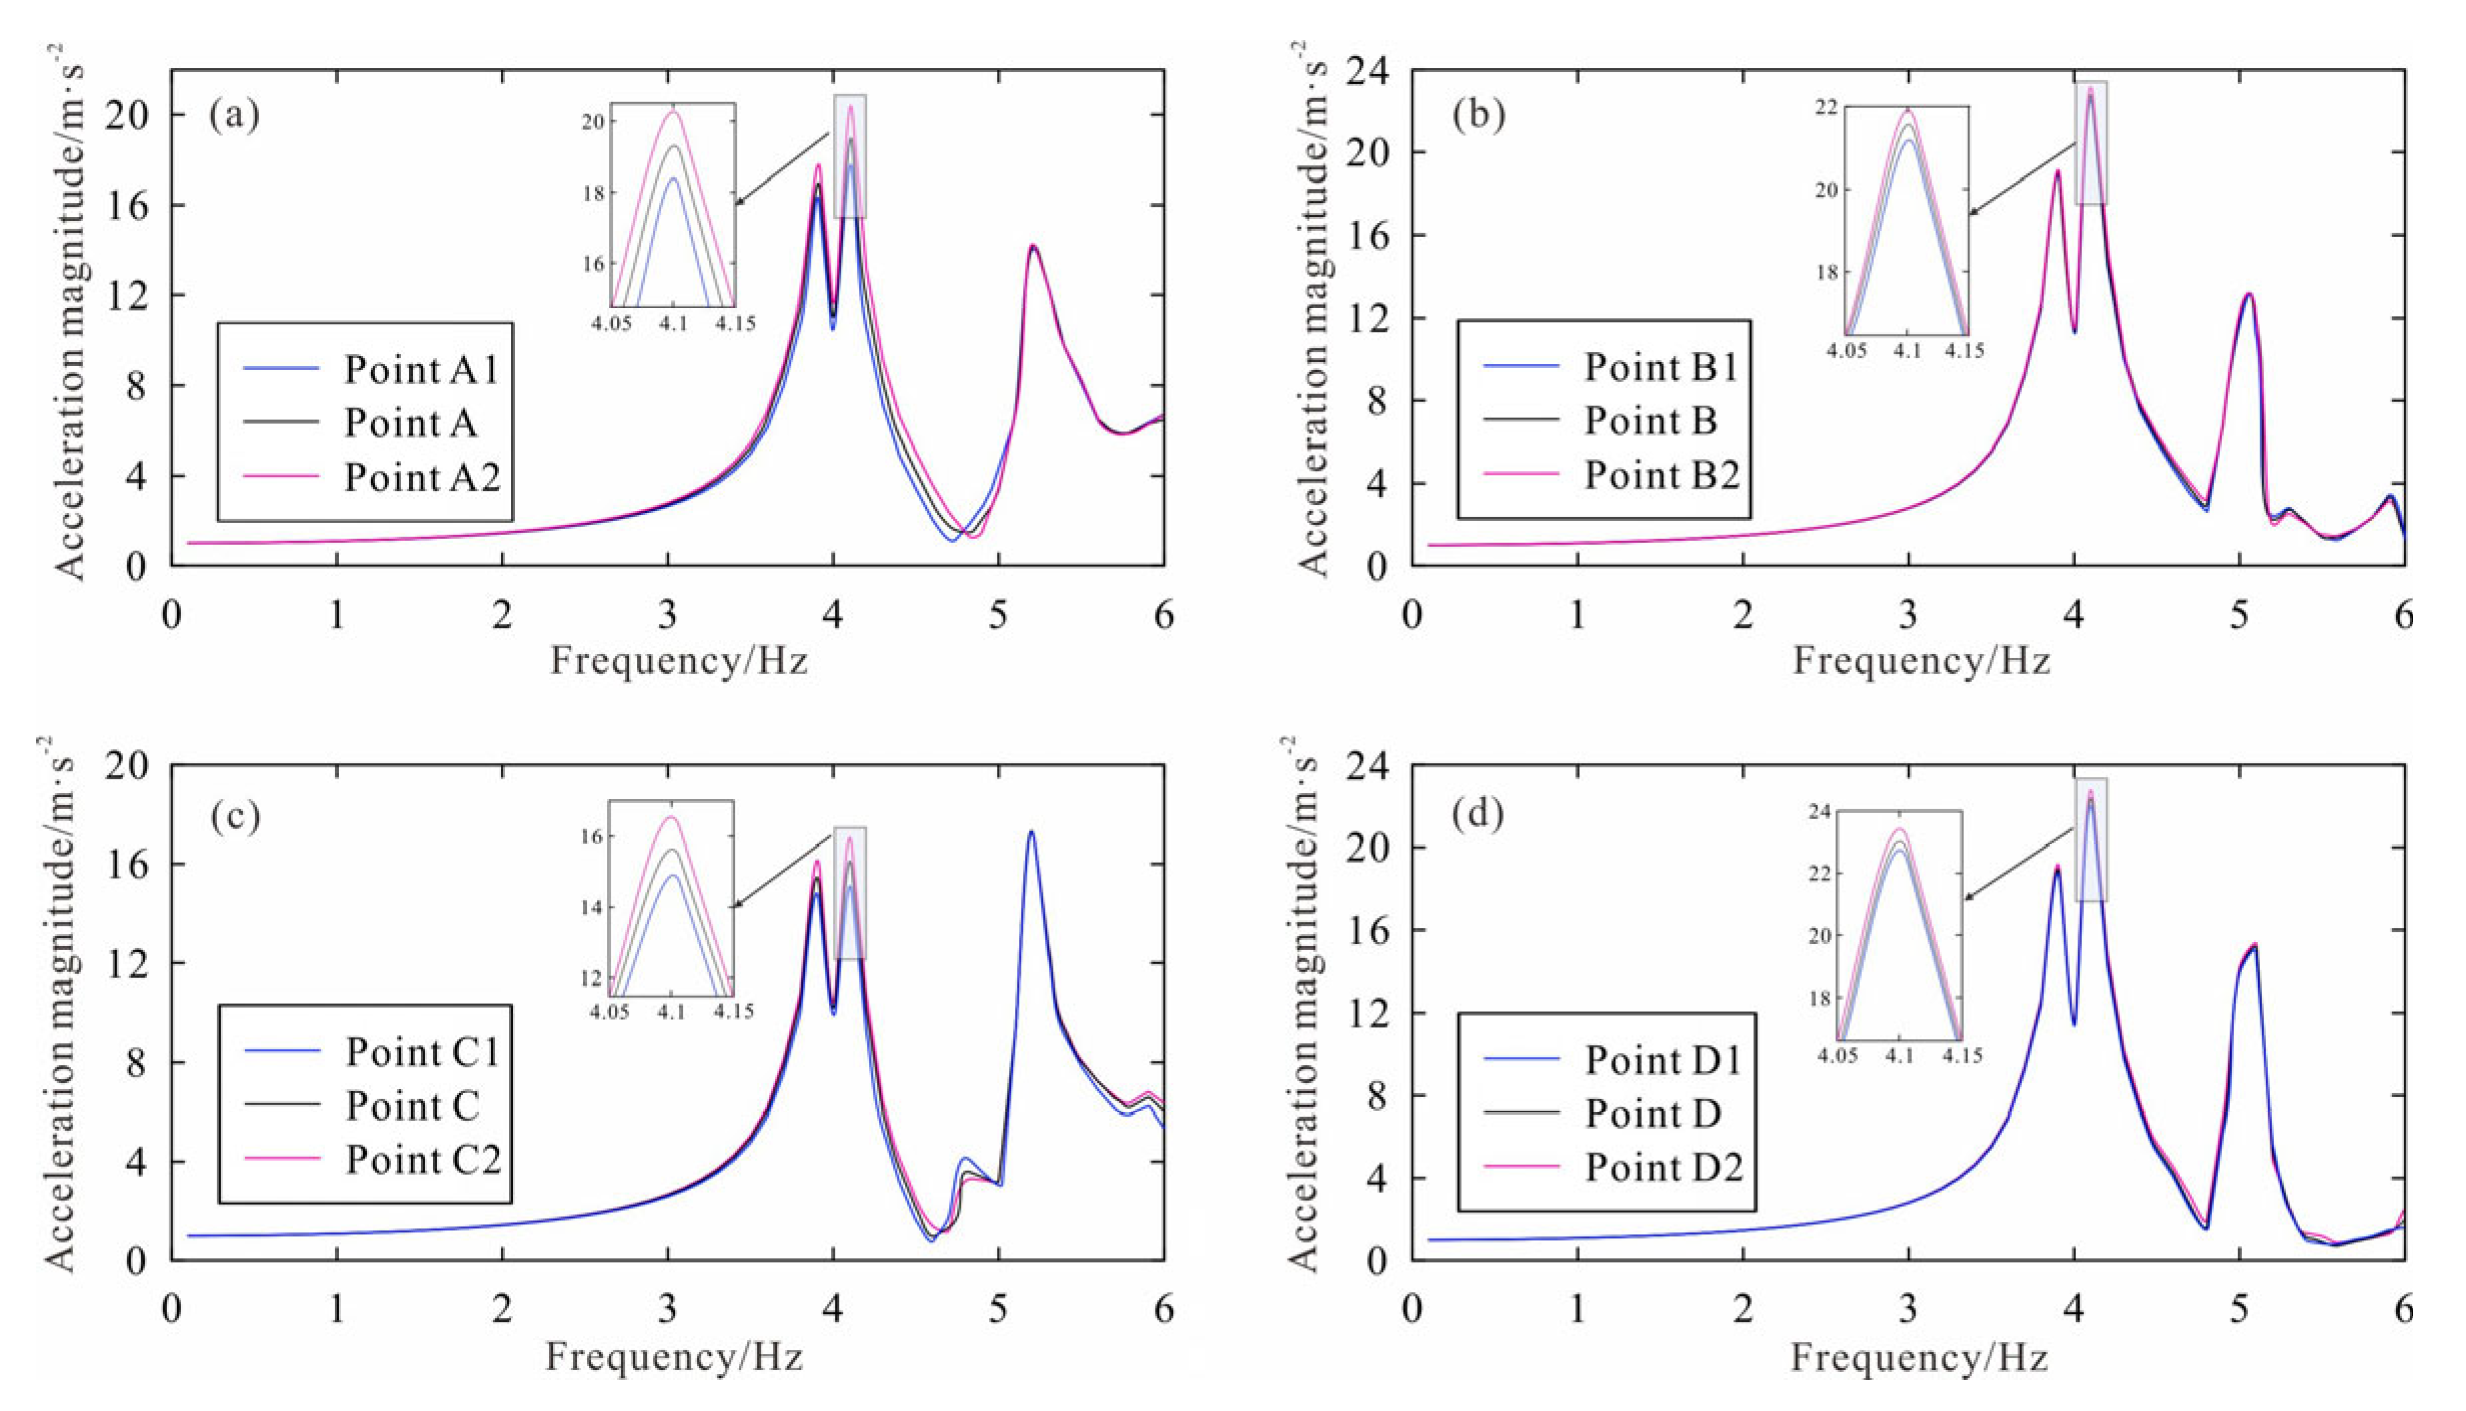
  • The high-porosity weathered layer increases the seismic response at the reef flat above it. Increasing the depth of the weathered layer, decreasing the area of the weathered layer, and decreasing the weathering degree reduce the seismic response of reefs. By contrast, decreasing the depth of the weathered layer, increasing the area of the weathered layer, and increasing the weathering degree increase the seismic response of reefs.

Author Contributions

Conceptualization, L.Y. and X.G.; methodology, L.Y.; software, L.Y.; validation, L.Y.; formal analysis, J.Q.; investigation, X.Z.; resources, X.G.; data curation, L.Y., and J.Q.; writing—original draft preparation, L.Y.; writing—review and editing, L.Y. and X.Z.; visualization, X.Z.; supervision, X.G.; project administration, X.G. and X.Z.; funding acquisition, X.G. and X.Z. All authors have read and agreed to the published version of the manuscript.

Funding

This research was funded by the National Key Research and Development Program of China (2022YFC3102200) and the National Natural Science Foundation of China (U2244221).

Institutional Review Board Statement

Not applicable.

Informed Consent Statement

Not applicable.

Data Availability Statement

The data presented in this study are available on request from the corresponding author.

Conflicts of Interest

The authors declare no conflicts of interest.

References

  1. Li, G.; Yan, S. The construction of islands and reefs in the South China Sea under the promotion of the “21st Century Maritime Silk Road” initiative. Contemp. World Social. 2018, 156–162. (In Chinese) [Google Scholar] [CrossRef]
  2. Wang, J.; Ma, L. Research progress of long-term safety theory and technology for reef engineering. Prot. Eng. 2019, 41, 70–78. (In Chinese) [Google Scholar]
  3. Yu, M.; Zhang, Q. The multiple significance of the construction of islands and reefs in the South China Sea for safeguarding China’s sovereignty and maritime rights and interests in the South China Sea. J. Bound. Ocean Stud. 2019, 4, 34–55. (In Chinese) [Google Scholar]
  4. Li, L.; Qiu, Q.; Li, Z.; Zhang, P. Tsunami Hazard Assessment in the South China Sea: A Review of Recent Progress and Research Gaps. Sci. China Earth Sci. 2022, 65, 783–809. [Google Scholar] [CrossRef]
  5. Souter, D.; Planes, S.; Wicquart, J.; Obura, D.; Staub, F. Status of Coral Reefs of the World: 2020. International Coral Reef Initiative. 2021. Available online: https://www.unep.org/resources/status-coral-reefs-world-2020 (accessed on 16 December 2024).
  6. Fukue, M.; Kawakami, T. Damage to Man-made Islands Caused by the 1995 Hyogo-ken Nanbu Earthquake. Mar. Georesour. Geotechnol. 1996, 14, 237–250. [Google Scholar] [CrossRef]
  7. Green, R.A.; Olson, S.M.; Cox, B.R.; Rix, G.J.; Rathje, E.; Bachhuber, J.; French, J.; Lasley, S.; Martin, N. Geotechnical Aspects of Failures at Port-Au-Prince Seaport During the 12 January 2010 Haiti Earthquake. Earthq. Spectra 2011, 27, 43–65. [Google Scholar] [CrossRef]
  8. Brandes, H.G.; Nicholson, P.G.; Robertson, I.N. Liquefaction of Kawaihae Harbor and Other Effects of 2006 Hawai‘i Earthquakes. In Proceedings of the Seventeenth International Offshore and Polar Engineering Conference, Lisbon, Portugal, 1–6 July 2007; Volume 2, pp. 1169–1176. [Google Scholar]
  9. Lu, B.; Wang, P.; Zhang, G.; Wang, W. Characteristic of regional fractures in South China Sea and its basement tectonic framework. Prog. Geophys. 2015, 30, 1544–1553. (In Chinese) [Google Scholar] [CrossRef]
  10. Mazur, S.; Green, C.; Stewart, M.G.; Whittaker, J.M.; Williams, S.; Bouatmani, R. Displacement along the Red River Fault Constrained by Extension Estimates and Plate Reconstructions. Tectonics 2012, 31, 2012TC003174. [Google Scholar] [CrossRef]
  11. Guo, L.; Zhan, W.; Zhang, F.; Zhang, J.; Yao, Y.; Li, J.; Feng, Y.; Chen, M.; Cheng, G. The Influence of Earthquakes on Zhubi Reef in the Nansha Islands of the South China Sea. Acta Oceanol. Sin. 2017, 36, 99–108. [Google Scholar] [CrossRef]
  12. Tang, Q.; Zhang, J.; Feng, Y.; Li, J.; Yao, Y.; Sun, J.; Zhan, W. Numerical Simulation for Shallow Strata Stability of Coral Reef in the Southwest of Yongshu Reef (South China Sea). J. Ocean Univ. China 2018, 17, 763–772. [Google Scholar] [CrossRef]
  13. Zhao, W.; Wang, G.; Yin, X.; Zhao, J. Analysis and evaluation of dynamic stability of coral reef in the southwest of Yongshu Reef in Nansha Islands. J. Nat. Disasters 2021, 30, 181–189. (In Chinese) [Google Scholar] [CrossRef]
  14. Liu, J.; Bao, X.; Li, S.; Zhao, Q.; Wang, F.; Wang, D. Seismic response analysis on reef site considering influence of lagoon. Comput. Aided Eng. 2020, 29, 46–50, 69. (In Chinese) [Google Scholar] [CrossRef]
  15. Chen, G.; Zhu, X.; Zhao, D.; Liu, J. Nonlinear seismic response characteristics of a coral island site. Chin. J. Geotech. Eng. 2019, 41, 405–413. (In Chinese) [Google Scholar]
  16. Qiu, Y.; Yin, X.; Wang, G. Seismic response analysis of coral island reef site considering different influencing factors. J. Nat. Disasters 2023, 32, 131–138. (In Chinese) [Google Scholar] [CrossRef]
  17. Bao, X.; Liu, J.; Wang, F. Influence of Topographic and Geological Features on the Seismic Response of the Reef Site in the South China Sea. J. Mar. Sci. Eng. 2023, 11, 881. [Google Scholar] [CrossRef]
  18. Bao, X.; Liu, J.; Chen, S.; Wang, P. Seismic Analysis of the Reef-Seawater System: Comparison between 3D and 2D Models. J. Earthq. Eng. 2022, 26, 3109–3122. [Google Scholar] [CrossRef]
  19. Zhang, Y.; He, K.; Li, X.; Ye, J. Centrifuge Shaking Table Test on the Seismic Dynamics of Revetment Breakwater and a Nearby Aircraft Runway Built on Reclaimed Coral Sand Foundation. J. Mar. Sci. Eng. 2023, 11, 41. [Google Scholar] [CrossRef]
  20. Zhang, Y.; Ye, J. Seismic dynamics of revetment breakwater built on reclaimed coral sand foundation in the SCS: Insight from 1 g shaking table tests. Bull. Eng. Geol. Environ. 2023, 82, 134. [Google Scholar] [CrossRef]
  21. He, K.; Ye, J. Physical modeling of the dynamics of a revetment breakwater built on reclaimed coral calcareous sand foundation in the South China Sea-tsunami wave. Bull. Eng. Geol. Environ. 2021, 80, 3315–3330. [Google Scholar] [CrossRef]
  22. Zhao, M.; Zhang, G.; Wang, P.; Du, X.; Zhang, X. An accurate frequency-domain model for seismic responses of breakwater-seawater-seabed-bedrock system. Ocean Eng. 2020, 197, 106843. [Google Scholar] [CrossRef]
  23. Luo, Y.; Li, G.; Xu, W.; Cheng, J.; Liu, J.; Yan, W. Characteristics of Quaternary exposure surfaces in Well Nanke-1 and their relationship with sea-level changes. J. Trop. Oceanogr. 2022, 41, 143–157. (In Chinese) [Google Scholar] [CrossRef]
  24. Xia, S.; Zhang, C.; Cao, J. Ambient Noise Tomography for Coral Islands. Engineering 2023, 25, 182–193. [Google Scholar] [CrossRef]
  25. Chen, W.; Huang, L.; Xu, L.; Zhao, K.; Wang, Z.; Jeng, D. Numerical Study on the Frequency Response of Offshore Monopile Foundation to Seismic Excitation. Comput. Geotech. 2021, 138, 104342. [Google Scholar] [CrossRef]
  26. Yi, L.; Deng, C.; Yan, W.; Wu, H.; Zhang, C.; Xu, W.; Su, X.; He, H.; Guo, Z. Neogene–Quaternary Magnetostratigraphy of the Biogenic Reef Sequence of Core NK–1 in Nansha Qundao, South China Sea. Sci. Bull. 2021, 66, 200–203. [Google Scholar] [CrossRef] [PubMed]
  27. Li, G.; Xu, W.; Luo, Y.; Liu, J.; Zhao, J.; Feng, Y.; Cheng, J.; Sun, Z.; Xiang, R.; Xu, M.; et al. Strontium Isotope Stratigraphy and LA-ICP-MS U-Pb Carbonate Age Constraints on the Cenozoic Tectonic Evolution of the Southern South China Sea. GSA Bull. 2023, 135, 271–285. [Google Scholar] [CrossRef]
  28. Liu, J.; Webster, J.M.; Salles, T.; Wang, S.; Ma, Y.; Xu, W.; Li, G.; Yan, W. The Formation of Atolls: New Insights from Numerical Simulations. J. Geophys. Res. Earth Surf. 2022, 127, e2022JF006812. [Google Scholar] [CrossRef]
  29. Zhu, X.; Jia, G.; Tian, Y.; Chen, F.; Li, G.; Xu, W.; Miao, L.; Yan, W. Ancient Hydrocarbon Slicks Recorded by a Coral Atoll in the South China Sea. Chem. Geol. 2023, 619, 121316. [Google Scholar] [CrossRef]
  30. Bao, X.; Liu, J.; Li, S.; Wang, F. Three-Dimensional Seismic Response Analysis of Zhubi Reef in the South China Sea. Shock Vib. 2021, 2021, 2195304. [Google Scholar] [CrossRef]
  31. Shapiro, N.M.; Campillo, M.; Stehly, L.; Ritzwoller, M.H. High-Resolution Surface-Wave Tomography from Ambient Seismic Noise. Science 2005, 307, 1615–1618. [Google Scholar] [CrossRef]
  32. Biot, M.A. Theory of Propagation of Elastic Waves in a Fluid-Saturated Porous Solid. I. Low-Frequency Range. J. Acoust. Soc. Am. 1956, 28, 168–178. [Google Scholar] [CrossRef]
  33. Zienkiewicz, C.; Chang, C.T.; Bettess, P. Drained, Undrained, Consolidating and Dynamic Behaviour Assumptions in Soils. Geotechnique 1980, 30, 385–395. [Google Scholar] [CrossRef]
  34. Chen, W.; Wang, Z.; Chen, S.; Ma, J.; Liang, Y. Frequency Response Analysis of Concrete Seawall Including Soil-Structure-Seawater Interaction. Soil Dyn. Earthq. Eng. 2020, 139, 106392. [Google Scholar] [CrossRef]
  35. Ye, J.; Jeng, D. Three-Dimensional Dynamic Transient Response of a Poro-Elastic Unsaturated Seabed and a Rubble Mound Breakwater Due to Seismic Loading. Soil Dyn. Earthq. Eng. 2013, 44, 14–26. [Google Scholar] [CrossRef]
  36. De Falco, A.; Mori, M.; Sevieri, G. Simplifed soil-structure interaction models for concrete gravity dams. In Proceedings of the 6th European Conference on Computational Mechanics, 7th European Conference on Computational Fluid Dynamics, Glasgow, UK, 11–15 June 2018; pp. 2269–2280. [Google Scholar]
  37. Zhong, Y.; Wang, R.; Li, Q.; Wei, H.; Li, X. Research progress on physical and engineering properties of coral reef limestone. Technol. Rev. 2020, 38, 57–70. (In Chinese) [Google Scholar]
  38. Zhao, H.; Jeng, D.; Liao, C.; Zhu, J. Three-Dimensional Modeling of Wave-Induced Residual Seabed Response Around a Mono-Pile Foundation. Coast. Eng. 2017, 128, 1–21. [Google Scholar] [CrossRef]
  39. Tian, Y.; Chen, Z.; Huang, W.; Hou, Z.; Yan, W.; Wang, X. P-wave velocity properties and its influencing factors of coral reef limestone in Nansha area. J. Trop. Oceanogr. 2021, 40, 133–141. (In Chinese) [Google Scholar]
  40. Yu, D.; Ye, J.; Yao, L. Prediction of the Long-Term Settlement of the Structures Built on a Reclaimed Coral Reef Island: An Aircraft Runway. Bull. Eng. Geol. Environ. 2020, 79, 4549–4564. [Google Scholar] [CrossRef]
Figure 2. Three geophysical profiles are in Figure 1c, and the changes in minerals and lithology of the Meiji Reef are shown in depth. (ac) Ambient noise tomography profiles. (d) Changes in minerals and lithology of the Meiji Reef with depth.
Jmse 12 02343 g002
Figure 3. (a) 3-D Meiji Reef–seawater–seabed coupling system model. The stratification of coral reef is shown in (b). (b) The section of the 3-D model along the x-z direction in (a), and shows the stratification and boundary conditions of the model.
Jmse 12 02343 g003
Figure 4. Flowchart of numerical implementation.
Jmse 12 02343 g004
Figure 5. The variation of acceleration magnitude with frequency in different areas of the reef flat; the points are in Figure 1c. (a) Horizontal x-direction excitation. (b) Horizontal y-direction excitation. (c) Vertical excitation.
Jmse 12 02343 g005
Figure 6. The acceleration magnitude at different depths of point A, point B, point C, and point D in Figure 1c.
Jmse 12 02343 g006
Figure 7. The variation of acceleration magnitude with frequency at different positions of the reef flat, and the positions of each point are in Figure 1c.
Jmse 12 02343 g007
Figure 8. The 3-D distribution of hydrodynamic pressure and acceleration amplitude at the peak frequency. (a) Horizontal x-direction excitation at the frequency of 4.1 Hz. (b) Horizontal y-direction excitation at the frequency of 4.1 Hz. (c) Vertical excitation at the frequency of 5.1 Hz.
Jmse 12 02343 g008
Figure 9. The acceleration magnitude changes with frequency at point A, point B, point C, and point D in Figure 1c when the coral reef is saturated with porous elastic material or single-phase linear elastic material. Specifically, the solid lines represent saturated porous materials, while the dashed lines represent single-phase linear elastic materials.
Jmse 12 02343 g009
Figure 10. The 3-D distribution of hydrodynamic pressure and acceleration amplitude of horizontal x-direction excitation at the frequency of 4.1 Hz when the reef is a single-phase linear elastic solid material.
Jmse 12 02343 g010
Figure 11. Distribution of acceleration amplitudes of reef body in the horizontal plane. (a) The presence of highly porous weathered layers. (b) The rectangular box in Figure 8a. (c) There is no high-porosity weathering layer. (d) The rectangular box in Figure 8c.
Jmse 12 02343 g011
Figure 12. (a) Surface geometry, weathering layers, and line positions of the Meiji Reef. (b,c) The acceleration magnitudes of the two lines.
Jmse 12 02343 g012
Figure 13. Acceleration magnitudes of reef flat above different types of weathered layers. The black solid lines are the acceleration magnitude of non-weathered layer, and the red dashed lines are the acceleration magnitude in the initial situation. (a) Change in the depth. (b) Change in the area. (c) Change in the thickness. (d) Change in the weathering degree.
Jmse 12 02343 g013
Table 1. Main parameters in the numerical models (the data are from [17,37,38,39,40]).
ParametersReef Layer 1Reef Layer 2Reef Layer 3Reef Layer 4
Velocity of S wave vs (m/s)500160018002200
Velocity of P wave vp (m/s)1225400044855000
Density (kg/m3)2000230024002700
Porosity0.40.250.20.15
Permeability (m2)1 × 10−121 × 10−121 × 10−121 × 10−12
Damping ratio0.050.020.0250.025
Tortuosity factor1.251.251.251.25
Table 2. Parameters of weathered layers with different degrees of weathering.
ParametersEnhanced Weathering DegreeLower Weathering Degree
Velocity of S wave vs (m/s)3001000
Velocity of P wave vp (m/s)7002500
Density (kg/m3)15002300
Porosity0.70.2
Permeability (m2)1 × 10−121 × 10−12
Damping ratio0.050.05
Tortuosity factor1.251.25
Disclaimer/Publisher’s Note: The statements, opinions and data contained in all publications are solely those of the individual author(s) and contributor(s) and not of MDPI and/or the editor(s). MDPI and/or the editor(s) disclaim responsibility for any injury to people or property resulting from any ideas, methods, instructions or products referred to in the content.

