Article

Seasonal Variability of Golden Tides (Pylaiella littoralis, Phaeophyceae) and Nutrient Dynamics in a Potentially Eutrophic Intertidal Estuary

1
Earth and Life Sciences, School of Natural Sciences and Ryan Institute, University of Galway, H91 TK33 Galway, Ireland
2
Department of Ecology and Geology, Faculty of Sciences, University of Malaga, 29010 Málaga, Spain
3
Civil Engineering and Ryan Institute, University of Galway, H91 TK33 Galway, Ireland
4
Department of Catchment Hydrology, Helmholtz Centre for Environmental Research, D-06120 Halle, Germany
5
Teagasc, Environment Research Centre, Johnstown Castle, Y35 Y521 Wexford, Ireland
6
Institute for Biological Sciences, University of Rostock, Albert-Einstein-Straße 3, D-18059 Rostock, Germany
*
Authors to whom correspondence should be addressed.
J. Mar. Sci. Eng. 2024, 12(12), 2336; https://doi.org/10.3390/jmse12122336
Submission received: 3 December 2024 / Revised: 17 December 2024 / Accepted: 18 December 2024 / Published: 20 December 2024
(This article belongs to the Section Marine Ecology)

Abstract

:
Understanding macroalgal bloom development is crucial for managing eutrophication and protecting estuarine ecosystems. In this study, brown macroalgal blooms (i.e., golden tides) were identified in a potentially eutrophic temperate estuary (NW Ireland). Pylaiella littoralis (Phaeophyceae, Ectocarpales) was monitored at low tide over seven sampling occasions between June 2016 and August 2017. In situ biomass, tissue nutrients (nitrogen (N) and phosphorus (P)), and isotopic signature (δ15N contents) were measured, and relations with environmental drivers were explored. Difference Vegetation Index (NDVI) values from Sentinel-2 satellite imagery were used to assess the spatiotemporal dynamics of P. littoralis biomass (2016–2022). The results indicated that NDVI attributed to golden tides were lowest in 2022, during summer (coinciding with high temperatures and high rainfall) and at the lower shore on the right margin of an entering river. The highest tissue P content was recorded in April 2017, coinciding with in situ biomass peaks (spring–early summer), suggesting elevated P demand. Tissue N content (>2%) and N:P ratios (10–30) indicated occasional P limitation but no N limitation. δ15N data were very low and it was not possible to identify any primary N source. These findings highlight the importance of nutrient management in mitigating golden tides, addressing eutrophication, and preserving estuarine ecosystems.

1. Introduction

Estuaries are highly dynamic and complex ecosystems that experience considerable variations in physicochemical conditions due to both natural and anthropogenic processes. These variations lead to changes in the structure and composition of macroalgal assemblages [1,2]. Under pristine or near-pristine environmental conditions, aquatic macrophytes play an important role in ecological functioning (e.g., primary production, nutrient cycling, provisioning habitat), and offer a great diversity of ecosystem services including the provision of goods (e.g., food resource, fibers, biochemicals, pharmaceuticals), ecosystem regulation (e.g., climatic, erosion, environmental monitoring) and cultural amenities (e.g., recreation, ecotourism) [3]. However, the nutrient enrichment or imbalance resulting from anthropogenic loadings trigger the proliferation of opportunistic macroalgal blooms and gives rise to estuarine and coastal eutrophication [4]. Large accumulations of seaweed biomass on the shoreline are commonly known as seaweed tides (green, red, or golden), which form rotting piles on the shore, causing severe and manifold impacts on marine ecosystems worldwide [5]. In particular, the accumulation of decaying macroalgae on shores creates shifts in intertidal primary producers, mortalities of biota, anoxic events, H2S release during algae decomposition, unpleasant odors, decreasing tourism, and higher management costs [6]. Therefore, management of seaweed tides and nutrient inputs is essential to mitigate the effects of macroalgal blooms in coastal and estuarine ecosystems, and to prevent coastal eutrophication [7,8].
Green tides (e.g., Ulvales order) and golden tides (e.g., Ectocarpales order, Sargassum genus or Rugulopteryx genus) are an environmental and social problem worldwide [5,9,10,11]. While Ulvoids and Sargassum blooms have been extensively studied over a wide geographical scale, Ectocarpales blooms (Ectocarpus spp., Hincksia spp., and Pilayella spp.) have been less frequently examined [12]. Regarding Ectocarpales, only a few studies have assessed the seasonal variability of ectocarpoid biomass [13,14,15,16], despite the wide geographical spread of the areas affected by golden tides dominated by brown seaweeds belonging to this order. For instance, reports of blooms dominated by Pilayella have been recorded and studied from the North Atlantic, including in Newfoundland (Canada [13]), Massachusetts (USA [17]), the Baltic Sea [15,18,19], Dublin Bay (Ireland [14,20]), and the coast of Brittany (France; Sophie Richier oral communication). Since the 1990s, blooms of Ectocarpus spp. have been impacting the eastern coastline of Ireland [14], whereas blooms of Pilayella spp. are affecting Ireland’s north-west coastline [20].
The study of the spatiotemporal dynamics of seaweed blooms can offer initial insights into the most relevant local environmental drivers explaining the development of these blooms [21,22]. This is critical in order to propose effective management actions controlling the development of brown macroalgal blooms. In this sense, the combination of in situ fieldwork and the use of novel earth observation technologies may be combined to monitor the abundance of aquatic flora (in terms of cover percentage, bloom extent, and average biomass) [10,22,23,24]. Among these, the Normalized Difference Vegetation Index (NDVI) is frequently utilized to estimate photosynthetic biomass (e.g., seaweeds and seagrass) in intertidal systems during low tides [25,26,27].
The main factors controlling primary production in aquatic ecosystems are light, temperature, and nutrients, as well as grazing, salinity, and geomorphological features related to prevailing winds, currents and tidal dynamics [4,28,29]. In temperate areas of the world, macroalgal primary production is often limited by light and temperature in winter and by nutrient availability in spring and summer in temperate estuaries [4,21,30]. Nitrogen (N) and phosphorus (P) are recognized as the main limiting nutrients for natural assemblages in freshwater and coastal ecosystems [31,32,33]. Anthropogenic nutrient over-enrichment of aquatic ecosystems, mainly N and P, has been reported as a key factor driving the development of macroalgal blooms in estuarine environments [4,34]. Therefore, the assessment of the nutrient limitation status of the bloom and the identification of the main inputs of nutrients entering a water body are essential for the establishment of effective management strategies for the control of macroalgal blooms [35,36].
While the concentration of dissolved nutrients in water is considered in many water quality monitoring programs due to the well-standardized, reliable, and accurate methodologies, the information provided is often limited when assessing nutrient limitation in primary producers. Furthermore, dissolved nutrient concentrations can be highly transient, as the observed value is the result of various processes acting at different temporal and spatial scales (e.g., tidal currents, nutrient uptake by primary producers, weather conditions) [35,36,37,38,39]. Therefore, comprehensive and representative assessments necessitate long-term monitoring periods, which can be unpractical for large-scale monitoring programs or research studies. By contrast, the tissue nutrient content and its ratio provide direct information about the role of certain nutrients as limiting factors [40,41,42]. On the other hand, different N sources can show a different isotopic ratio between 14N and the less abundant 15N (i.e., δ15N) as a result of isotopic fractionation by physical, chemical, or biological processes [38,43]. Taking advantage of this isotopic fractioning, it is possible to use the δ15N values in macroalgae to identify the most likely sources of N [44,45,46], when no or little isotopic fractionation during nutrient uptake by macroalgae occur (i.e., low concentration of dissolved nutrients in the environment [36,47,48]).
The objective of this study was to evaluate the spatiotemporal variability of Pylaiella littoralis (L.) Kjellm. (Phaeophyceae, Ectocarpales) [49] biomass accumulations along an intertidal gradient in a European North Atlantic estuary potentially affected by eutrophication, and to identify the environmental factors controlling the golden tides. This main objective was subdivided into three specific aims: (i) to determine the seasonal variability of the P. littoralis biomass and other biological and chemical indicators of water quality; (ii) to examine the nutrient status of golden macroalgal blooms and N sources in the estuary on the basis of the internal nutrient content and δ15N determinations, and (iii) to analyze the spatiotemporal patterns of NDVI along the intertidal gradient from 2016 to 2022 using Sentinel-2 satellite imagery acquired at low tides.

2. Materials and Methods

2.1. Study Area

The northern part of McSwyne’s Bay, located near Killybegs (Co. Donegal), is a shallow, sheltered embayment with high nutrient levels, affected by extensive intertidal golden tides primarily composed of P. littoralis [20]. The landscape around Killybegs consists of a patchwork of natural areas (mainly peat bogs) and agricultural land. The Killybegs Bay (4°38′54.83″ N; 8°25′40.802″ W) receives freshwater inflows from the Stragar River (Figure 1), and the primary wastewater discharges in the region come from a combination of domestic sources and industrial activities, particularly fish processing plants. These industrial discharges exhibit strong seasonality, peaking from late winter to early spring and dropping considerably during the summer [50]. In this case, the annual N loadings were estimated at 31,107 kg y−1, while the P loadings were estimated at 1560 kg y−1 [51].
Muddy sediment, located in the upper shore on both sides of the Stragar River, is mainly covered by free-living P. littoralis [52]. Changes in the sediment type are observed along the intertidal gradient, with the presence of sand and coarse sand close to the subtidal. Patches of Ulva spp. cover sandier sediments, while Fucus sp. and Ascophyllum sp. occur on boulders on the mudflat.

2.2. Biomass Sample Collection

P. littoralis biomass in the Killybegs estuary was sampled over seven sampling occasions between June 2016 and August 2017 (Figure 1a). In each sampling occasion, eighteen sampling stations were distributed randomly along the intertidal on each side of the Stragar River. The only exceptions occurred during the sampling conducted in February 2017 and July 2017, during which only approximately 50% of the sampling stations were sampled due to extreme weather conditions. At each sampling station, three quadrats (25 × 25 cm) were used to assess the brown macroalgal biomass. The biomass within each quadrat was manually collected and placed in nets submerged in seawater for transport to the laboratory. Once in the laboratory, the seaweed biomass was rinsed with seawater to remove adherent sedimentary and particulate material, debris, and organisms. Subsequently, after removing excess water using a manually operated low-speed centrifuge (i.e., salad spinner), the fresh biomass of P. littoralis was weighed. The fresh biomass was standardized to grams per square meter.

2.3. Tissue Nutrient Content and Isotopic Composition

Six biomass replicates per sampling occasion were randomly selected, and a 2 g subsample of clean biomass from each replicate was collected to determine the tissue N and P content, along with the δ15N isotopic composition. These samples were rinsed with deionized distilled water, freeze dried at −52 °C (Freezone 12, Labconco, Kansas City, MO, USA), and stored in a desiccator until analysis. Shortly before analysis, the freeze-dried samples of P. littoralis were ground into a fine, homogeneous powder using a ball mill (TissueLyser II, QIAGEN, Hilden, Germany). The homogenized tissue was divided into two subsamples: one for P analysis, and the other for δ15N determination and N analysis.
Tissue P content was analyzed using a standard method involving oxidation with boiling H2SO4, followed by spectrophotometric analysis [53]. For tissue N content and δ15N determination, aliquots of the pulverized sample were weighed into tin capsules and combusted in an elemental analyzer Vario ISOTOPE Cube (Elementar Analysensysteme GmbH, Hanau, Germany) connected to an isotope ratio mass spectrometer (Isoprime 100; Isoprime Ltd., Cheadle Hulm, UK). The analytical precision was 0.15%, and all analyses were performed in duplicate.

2.4. Water Sample Collection

Water samples to determine the concentration of dissolved inorganic nutrients were manually collected during the high tide, either before or after the biomass sampling. Samples were collected at a depth of 20 cm at four sampling stations (two stations on each side of the river). At each station, three independent water samples were collected and filtered in situ using a syringe and a nylon disposable filter with a pore size of 0.45 µm (Sarstedt, Newton, NC, USA). The filtered water samples were placed in 50 mL Falcon tubes and kept refrigerated until the arrival to the laboratory, where they were stored at −20 °C until further analyses. Dissolved nutrient concentrations in the water column, i.e., dissolved inorganic nitrogen (DIN) and dissolved reactive phosphorous (DRP), were measured using on a Thermo Aquakem discrete analyzer (Thermo Scientific, Vantaa, Finland). Concentrations in water column of DIN were calculated as the sums of nitrate-N (NO3-N), nitrite-N (NO2-N), and ammonium-N (NH4-N). Salinity was determined in situ using a hand refractometer (ATAGO S-20E, Tokyo, Japan).

2.5. Spatiotemporal Patterns of NDVI from Sentinel-2A/B

Thirty-six Sentinel-2 multispectral satellite images (Level 2A) were visualized and selected from Sentinel Hub EO Browser between 2016 and 2022. All Sentinel-2A images for 2016 were download from the Copernicus DataSpace Browser, while Google Earth Engine scripts were used to download the NDVI from 2017 to 2022. All images were acquired at low tide and with a cloud cover of up to 20%. The NDVI was calculated using the red and near-infrared reflectance bands as (Band 8 − Band 4)/(Band 8 + Band 4), where Band 4 corresponds to the red reflectance and Band 8 to the near-infrared (NIR) reflectance. The utilization of NDVI as proxy of P. litorallis biomass was validated in Killybegs on April 2022, where a statistically significant linear relationship was found between in situ P. litorallis biomass and NDVI (r = 0.89; n = 12; p < 0.05) [52]. Scenes were registered in the WGS 84/UTMzone29N coordinate system (EPSG: 32629) using QGIS 3.10 ‘A Coruña’ (QGIS Development Team, 2019).
To determine the temporal and spatial variability of NDVI for golden tides, four transects (A, B, C, and D) were traced along the intertidal gradient (Figure 1b). NDVI were extracted every 10 m along transects over a length of 80 m using QGIS “Zonal statistics” plugin. The transects were divided into three sections as a function of shore position: upper intertidal (the first 30 m closest to shore), middle intertidal (from 40 to 60 m), and low intertidal (from 60–80 m). The average NDVI of golden tides, i.e., P. littoralis, was calculated along the intertidal from 2016 to 2022 and the temporal (interannual and seasonal) and spatial (4 transects and intertidal position) variability of golden seaweed NDVI were assessed. The seasons were categorized as winter (December to February), spring (March to May), summer (June to August), and autumn (September to November).

2.6. Statistical Analysis

Temporal dynamics in tissue N and P contents and δ15N of P. littoralis were tested using a one-way ANOVA with sampling occasion as factor. Given that all datasets were unbalanced, Type II ANOVA was applied [54]. When significant differences were observed, pairwise comparisons were conducted using Tukey’s Honest Significant Difference test. For P. littoralis biomass, data were square root-transformed prior to analysis, and tissue N contents and δ15N were transformed using a second power transformation. Residual diagnostics, including residual versus fitted plots and Q-Q plots, were inspected to verify the assumptions of normality and homoscedasticity, ensuring the validity of the statistical models.
A Kruskal–Wallis non-parametric test (One-Way Analysis of Variance on Ranks) and Dunn’s post-hoc pairwise comparisons with Bonferroni correction were used to identify significant differences between dissolved nutrient concentrations in the water column (i.e., DIN and DRP), for the seven sampling occasions. In addition, the temporal (interannual and seasonal) and spatial variability (transects and intertidal position) of the NDVI of P. littoralis in the estuary were analyzed using PERMANOVA (Permutational Multivariate Analysis of Variance) based on a Euclidean distance matrix. The analysis included “Year”, “Season”, “Transects”, and “Intertidal position” as factors, including their interactions, which were added sequentially (first to last) under a reduced model. The significance of the factors was assessed through 999 free permutations. Pairwise comparisons were conducted for each factor (Year, Season, Transects, and Intertidal position) to identify specific group differences [55,56,57]. Subsequently, interactions between factors (e.g., Year and Season; Year and Transect; and Transects and Intertidal position) were analyzed to assess the spatiotemporal variability of NDVI associated with golden tides.
With the objective of identifying the abiotic environmental drivers explaining the seasonal variation of the brown macroalgal accumulations (i.e., P. littoralis) at low tide, meteorological data (Figure S1) were downloaded from the weather station at Finner Camp, located less than 20 km from the Killybegs estuary (Met Éireann). Meteorological variables (air temperature, wind speed, wind direction, global radiation) were averaged for the previous 7 days of each sampling occasion. The accumulated rainfall was also calculated as the sum of the previous 7 days. Spearman correlation coefficients were generated to assess the relationships among P. littoralis biomass, biological and chemical water quality indicators, and meteorological factors, as well as between NDVI and meteorological factors. All statistical analyses were performed using R Studio (version 2022.07.2 + 576).

3. Results

3.1. Biomonitoring Golden Tides: Biomass and Tissue Nutrient Content

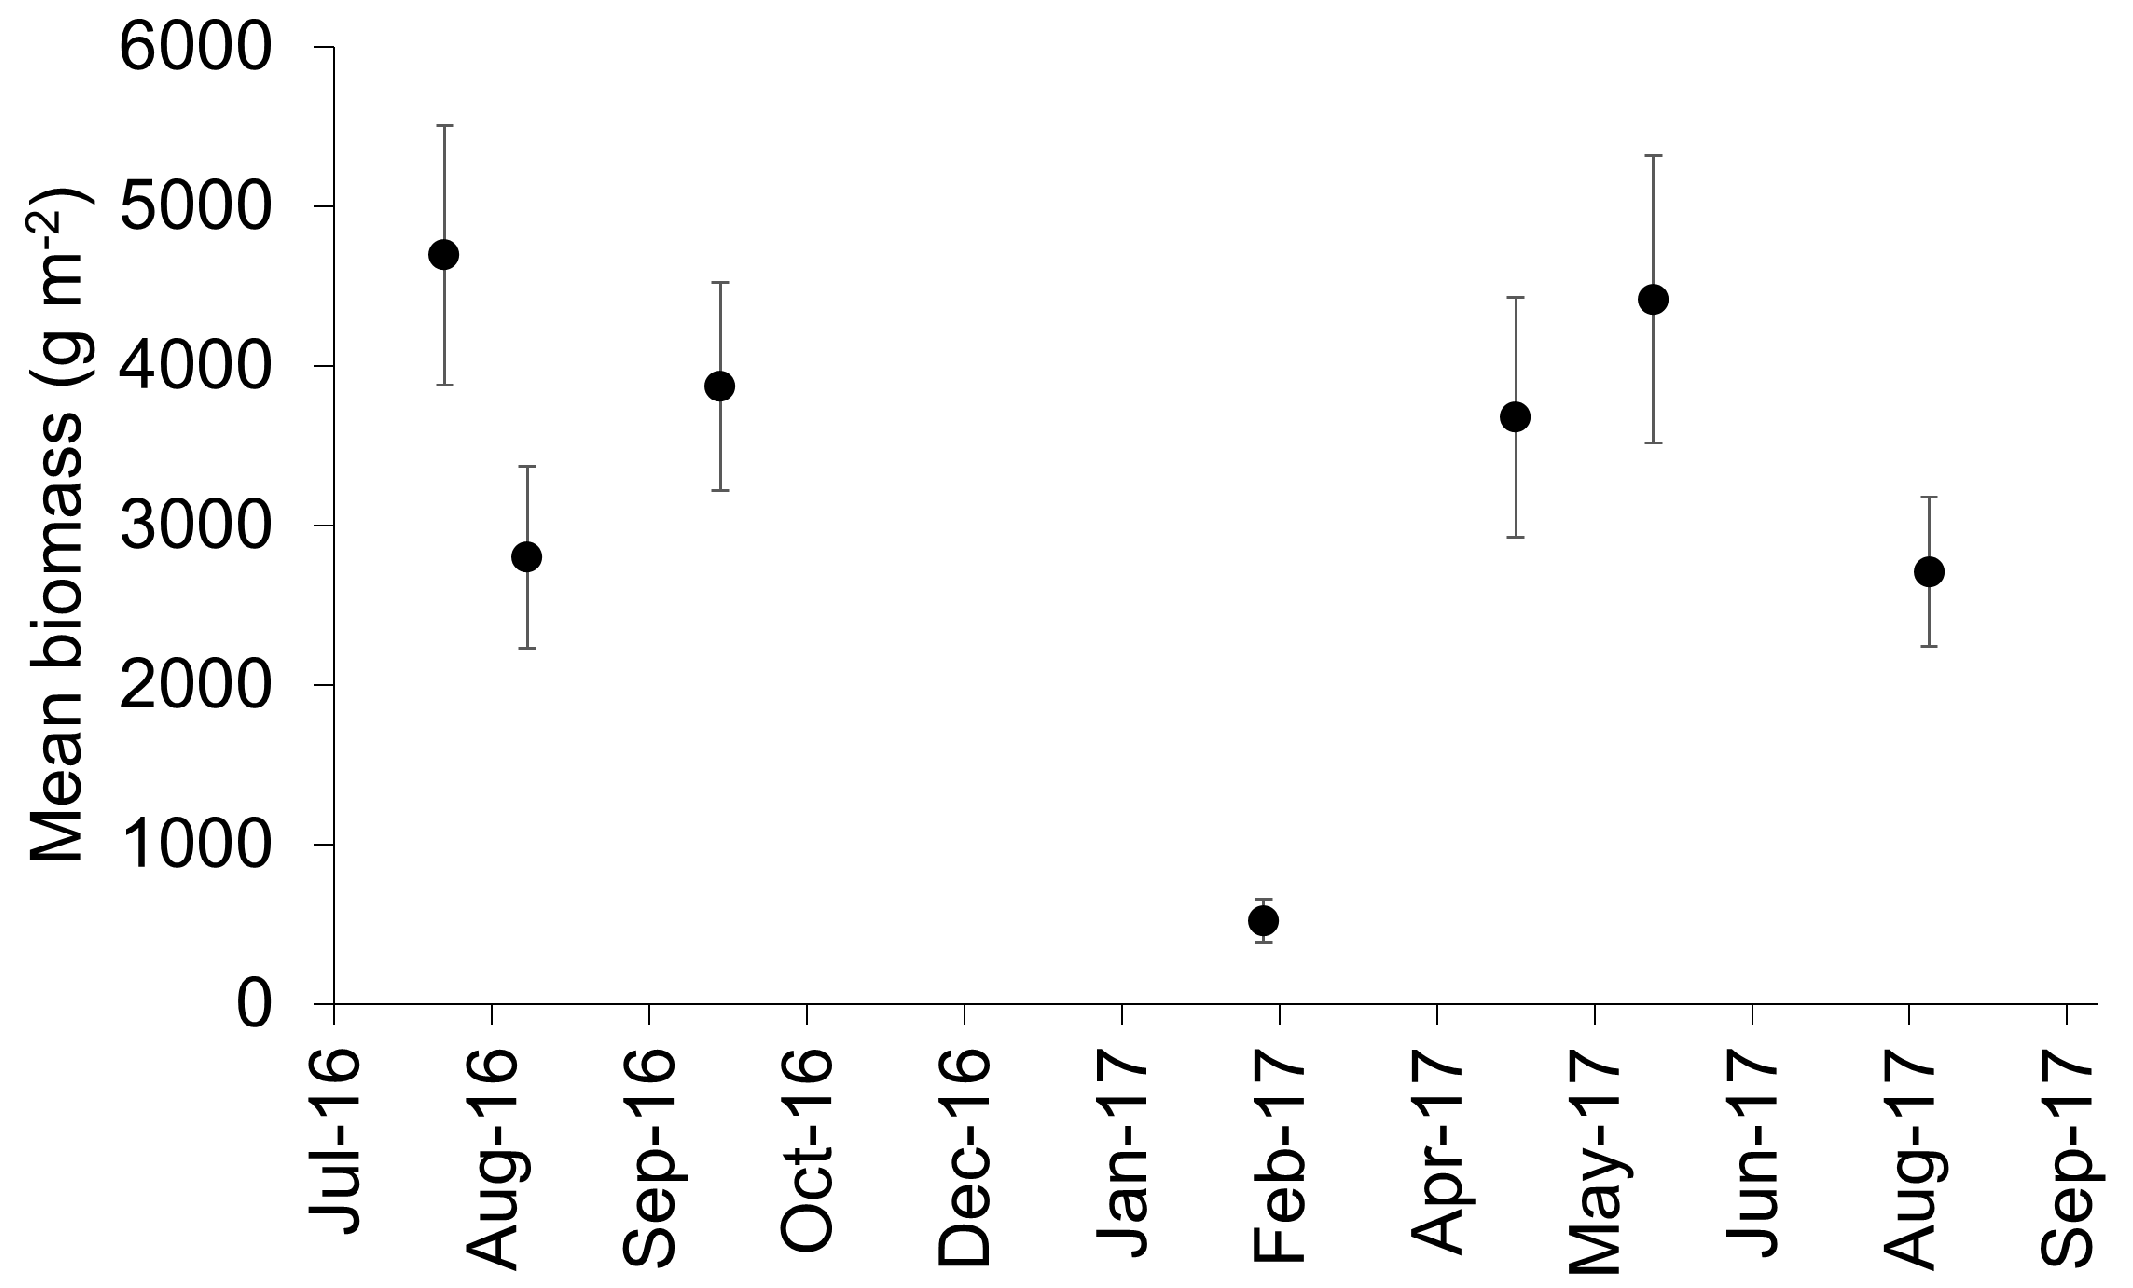
The biomass of P. littoralis biomass showed a minimum in February 2017 (522 ± 136 g m−2, n = 9) and a maximum in July 2016 (4693 ± 813 g m−2, n = 18) and June 2017 (4417 ± 903 g m−2, n = 18) (Figure 2). Significant differences were observed between sampling occasions (F6,107 = 3.77; p = 0.0019, one-way ANOVA), with February 2017 significantly lower than July and October 2016 and April and June 2017 (p < 0.05, Tukey’s post hoc test).
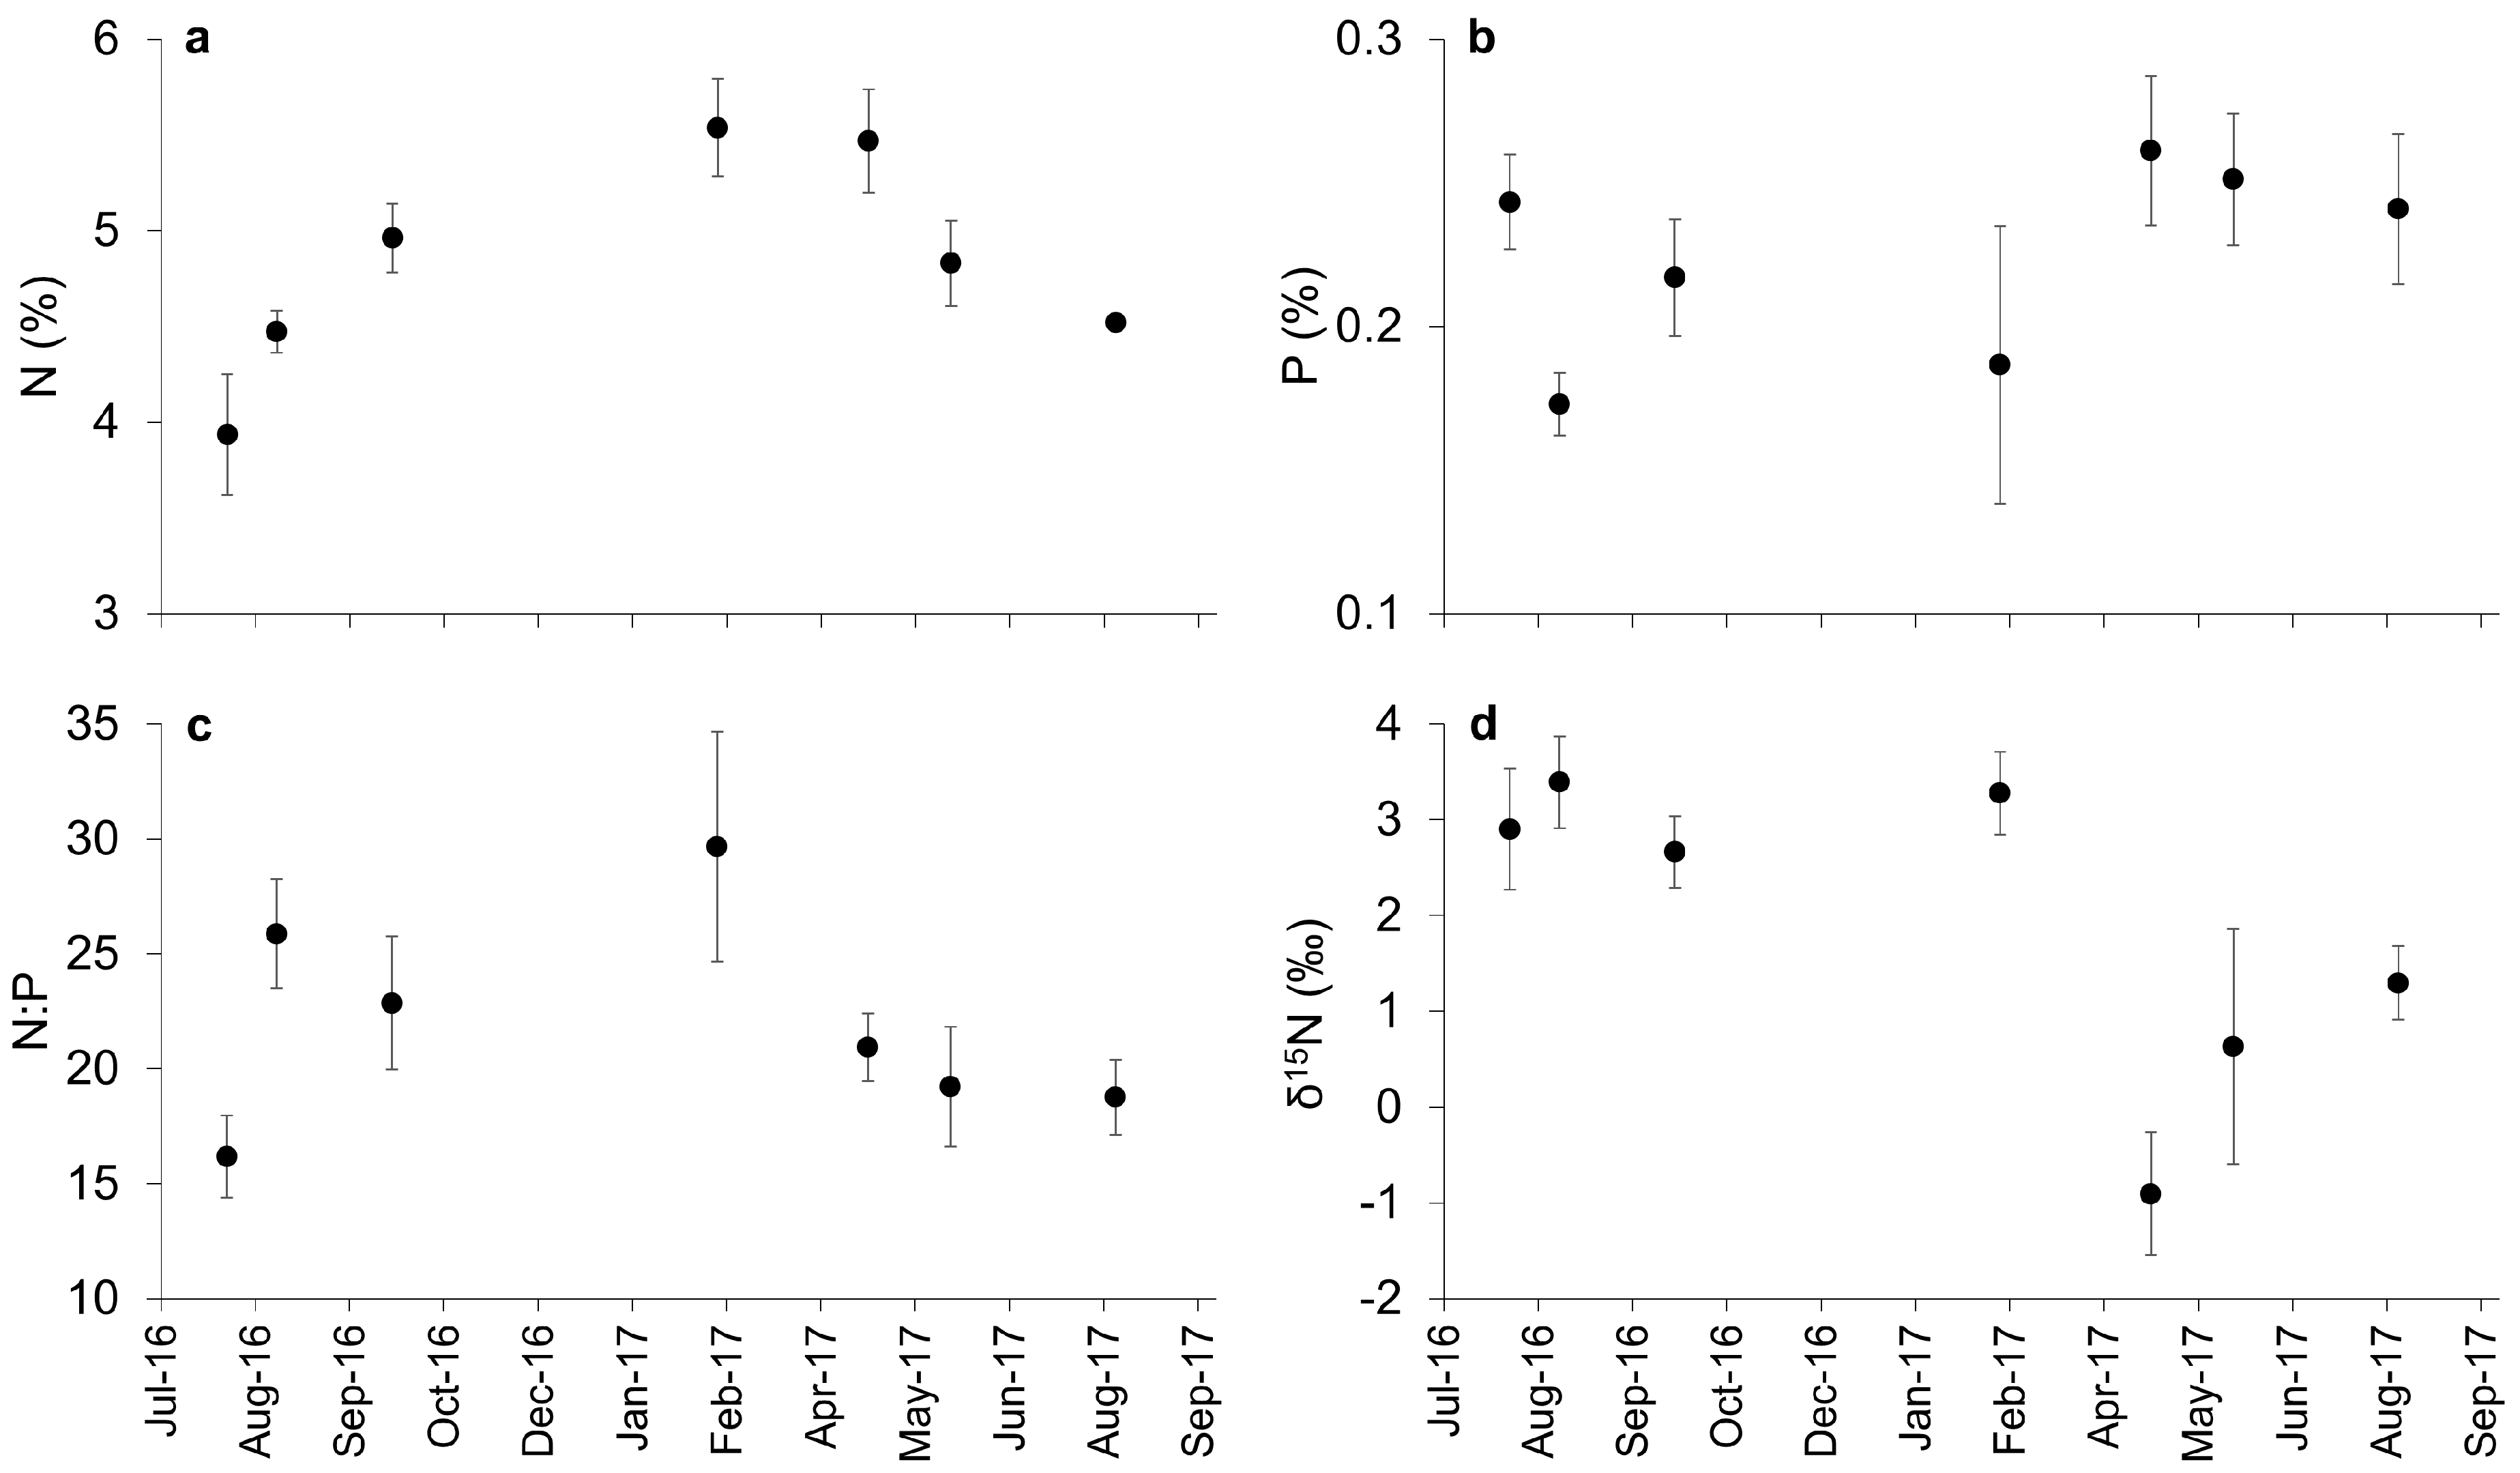
The mean tissue N content was 4.82 ± 0.22% for each sampling occasion (Figure 3a). Significant differences were found between sampling occasions (F6,32 = 6.71; p = 0.0001, one-way ANOVA), with tissue N content significantly lower in July 2016 (3.44 ± 0.31%; n = 6), compared to October 2016, February 2017, and April 2017 (up to 5%) (p < 0.05; Tukey’s post hoc test). Tissue P contents oscillated between 0.17 and 0.26% (Figure 3b). The highest values in tissue P contents were observed during spring and early summer (April and June 2017), although significant differences were not found between sampling occasions. The N:P ratio ranged between 16.2 and 29.5 (Figure 3c). The δ15N values in the P. littoralis biomass ranged between −0.91 and 3.39 (Figure 3d), with maximum values in summer 2016 and February 2017, and minimum values in April 2017. Significant differences were not found in the δ15N content between sampling occasions (F6,32 = 2.31; p = 0.0577, one-way ANOVA).

3.2. Physical-Chemical Factors: Dissolved Seawater Nutrient Concentrations

The DIN concentrations ranged between 2.8 ± 0.6 µM in August 2017 and 17.1 ± 3.8 µM in August 2016 (mean ± SE, n = 12), exhibiting significant differences between sampling occasions (X2 = 32.86, df = 5, p < 0.001, Kruskal–Wallis) (Figure 4a). DIN was significantly higher in February than April and August (p < 0.05, Dunn’s post hoc test). Conversely, DRP concentrations were significantly higher in August 2017 (0.45 ± 0.07 µM) than all other measurements (χ2 = 42.52, df = 5, p < 0.001, Kruskal–Wallis test; p < 0.05, Dunn’s post hoc test). Minimum concentrations of DRP were observed in October 2016 (Figure 4b). The N:P ratios in April and August 2017 (25.1 ± 7.5 and 5.9 ± 0.9, respectively) were significantly lower compared to the other sampling occasions, where the N:P ratio was approximately 80 (Figure 4c) (χ2 = 38.86, df = 5, p < 0.001, Kruskal–Wallis test; p < 0.05, Dunn’s post hoc test).
Salinity ranged between 1.1‰ and 27.1‰, with the exceptionally lowest values recorded in February 2017 during a storm event. The annual average salinity in the Killybegs estuary between 2016 and 2021 was 28 ± 1.9‰ (mean ± SE, n = 15). The average water temperature varied seasonally, being 7 ± 0.4 °C in winter (n = 5) and 15 ± 0.6 °C in summer (n = 10). The annual average dissolved oxygen was 8.9 ± 0.1 mg L−1 (n = 15), and the annual average pH was 8.1 ± 0.0 (n = 15). These data were reported by the Environmental Protection Agency (EPA) (Ireland; Robert Wilkes oral communication).

3.3. Spatiotemporal Variability of Golden Seaweed NDVI

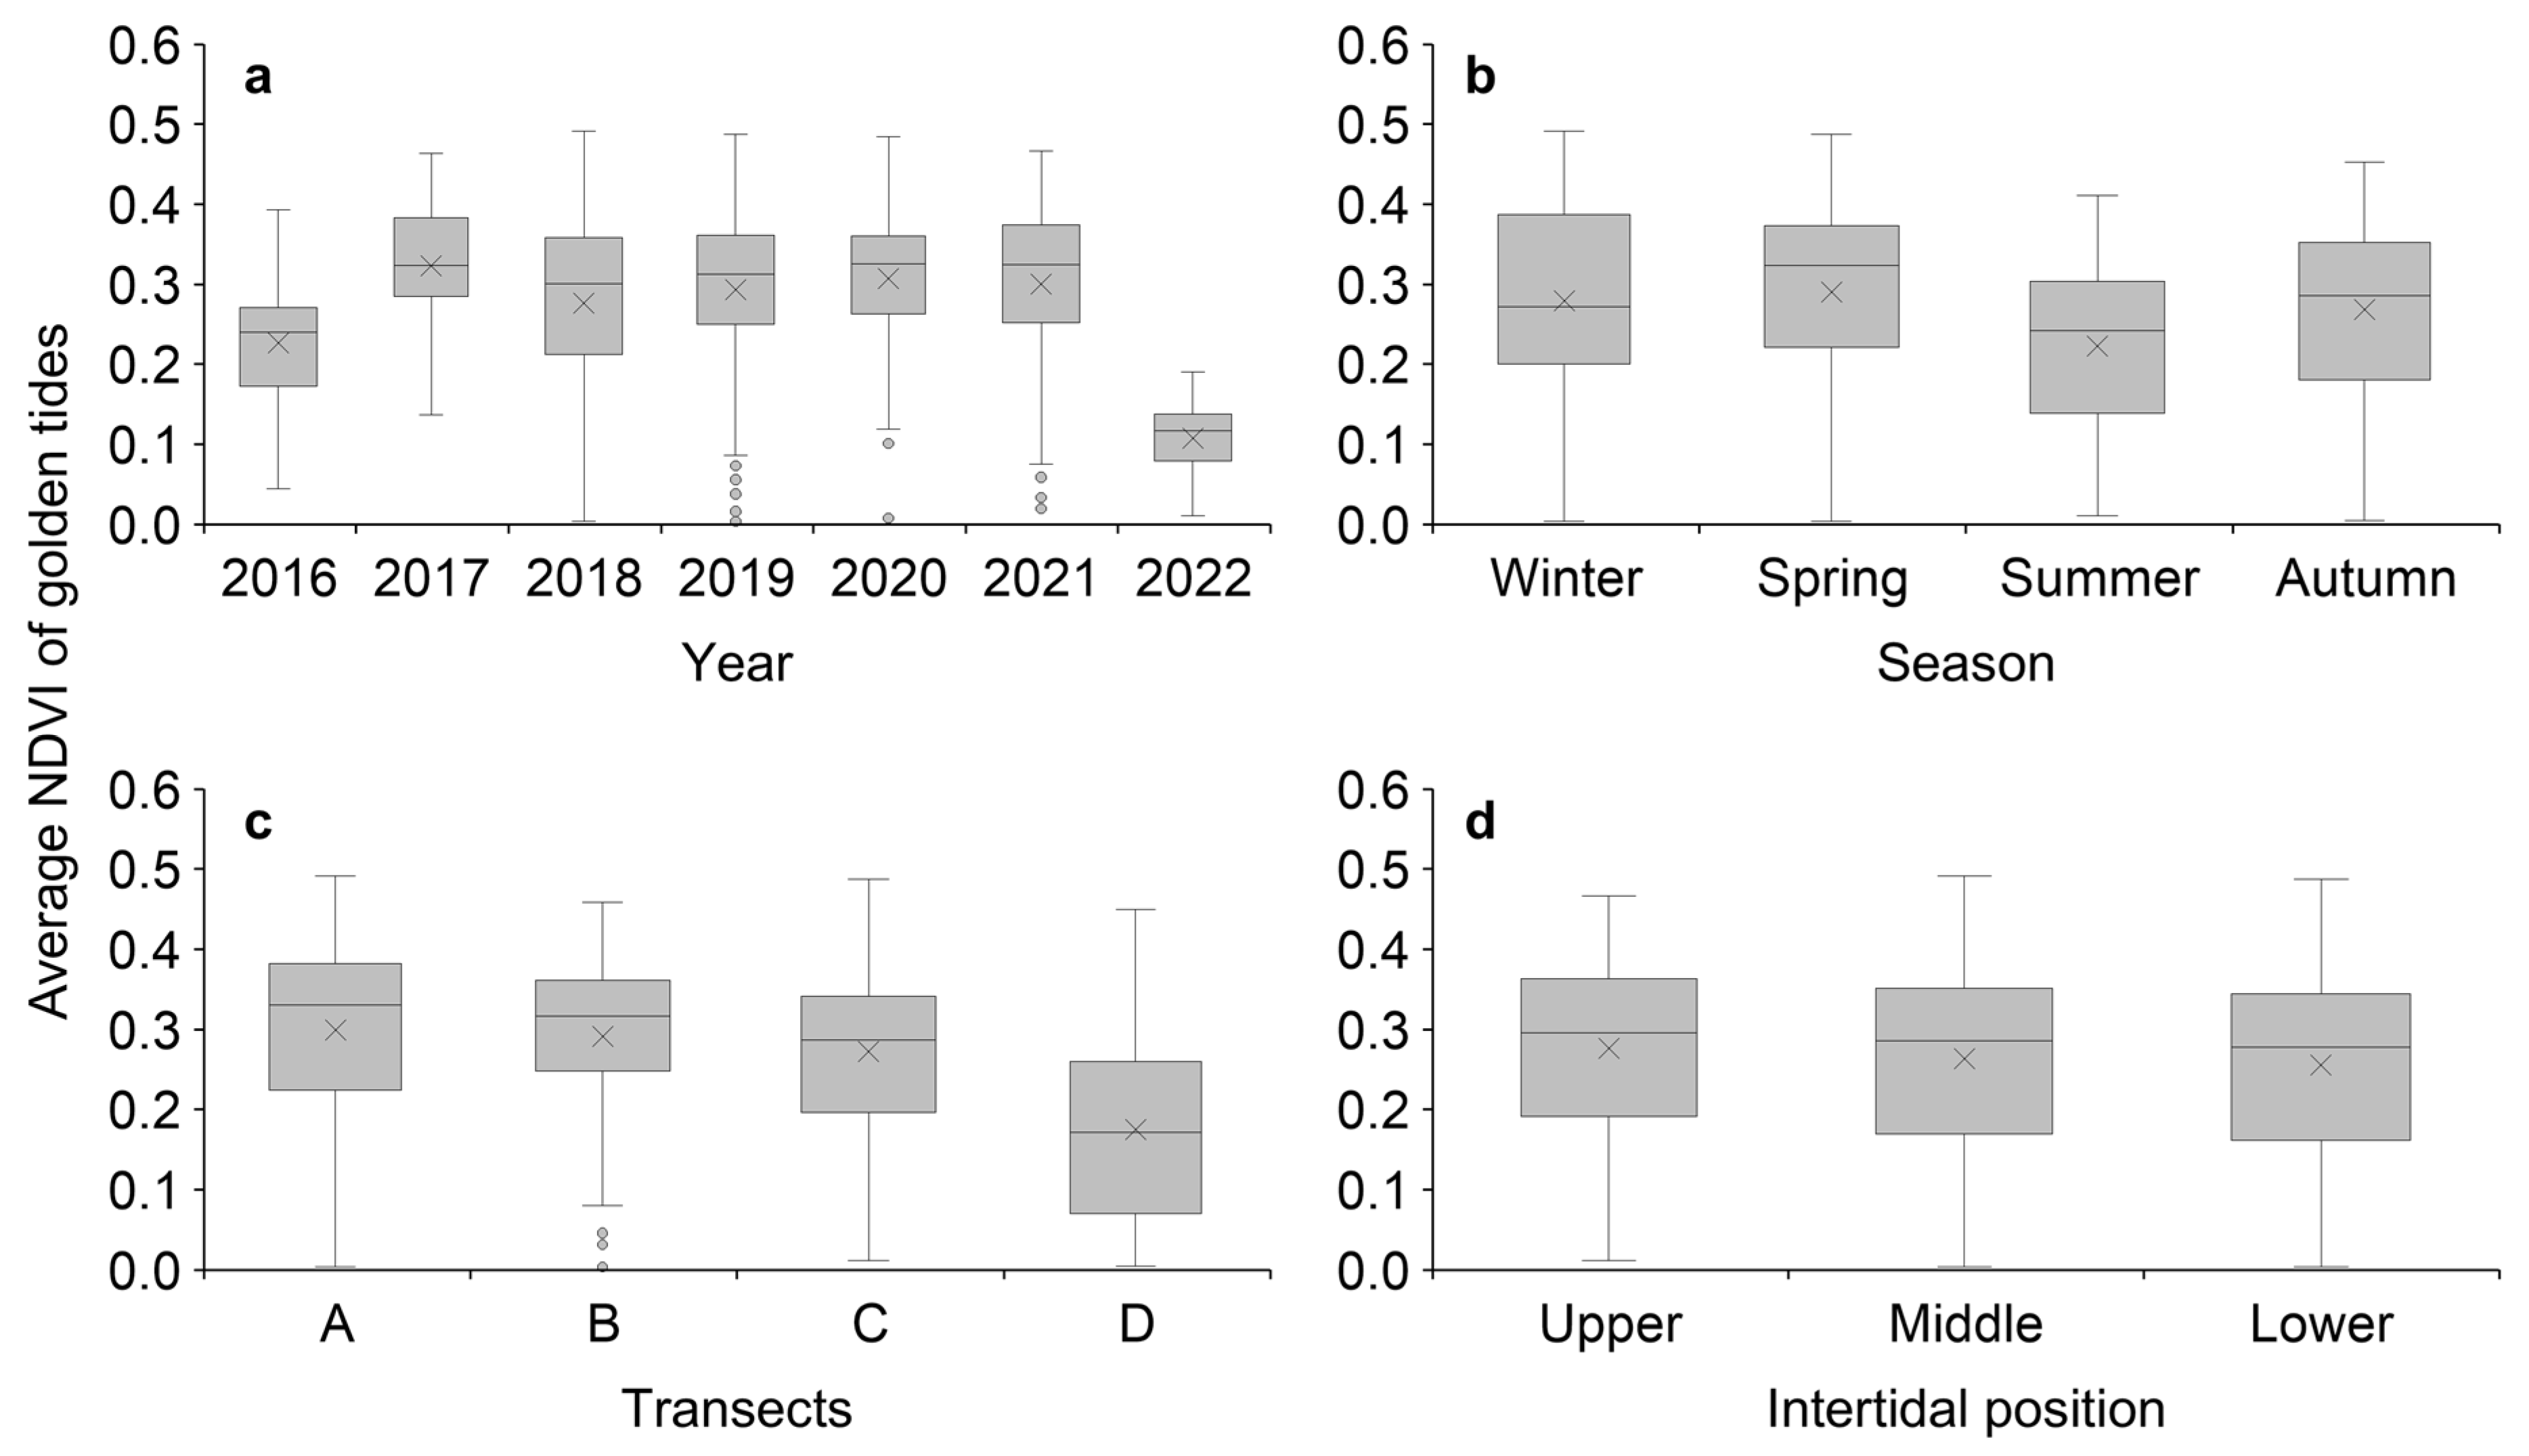
Based on the PERMANOVA results, “Year” explained the largest proportion of NDVI variability associated with golden tides (32%), followed by “Transects” (15.4%), “Season” (6%), and “Intertidal position” (0.8%) (Table 1). Significant differences in NDVI were found for all these factors individually (p < 0.001). The annual average NDVI ranged between 0.11 ± 0.00 in 2022 and 0.32 ± 0.01 in 2017 (mean ± SE) (Figure 5a). The most significant differences were observed between 2016 and 2022, as well as between these years and others (p < 0.05). Overall, NDVI showed minimum values in summer and maximum values in winter and spring (Figure 5b). The main significant differences were observed between summer and spring (F = 64.18; p = 0.001) and between summer and fall (F= 33.33; p = 0.001), while marginally significant differences were also observed between summer and winter, and between autumn and spring (p = 0.04). Both combined factors, “Year” and “Season” contributed approximately ~5% to explain the temporal variability of golden tides NDVI (Table 1).
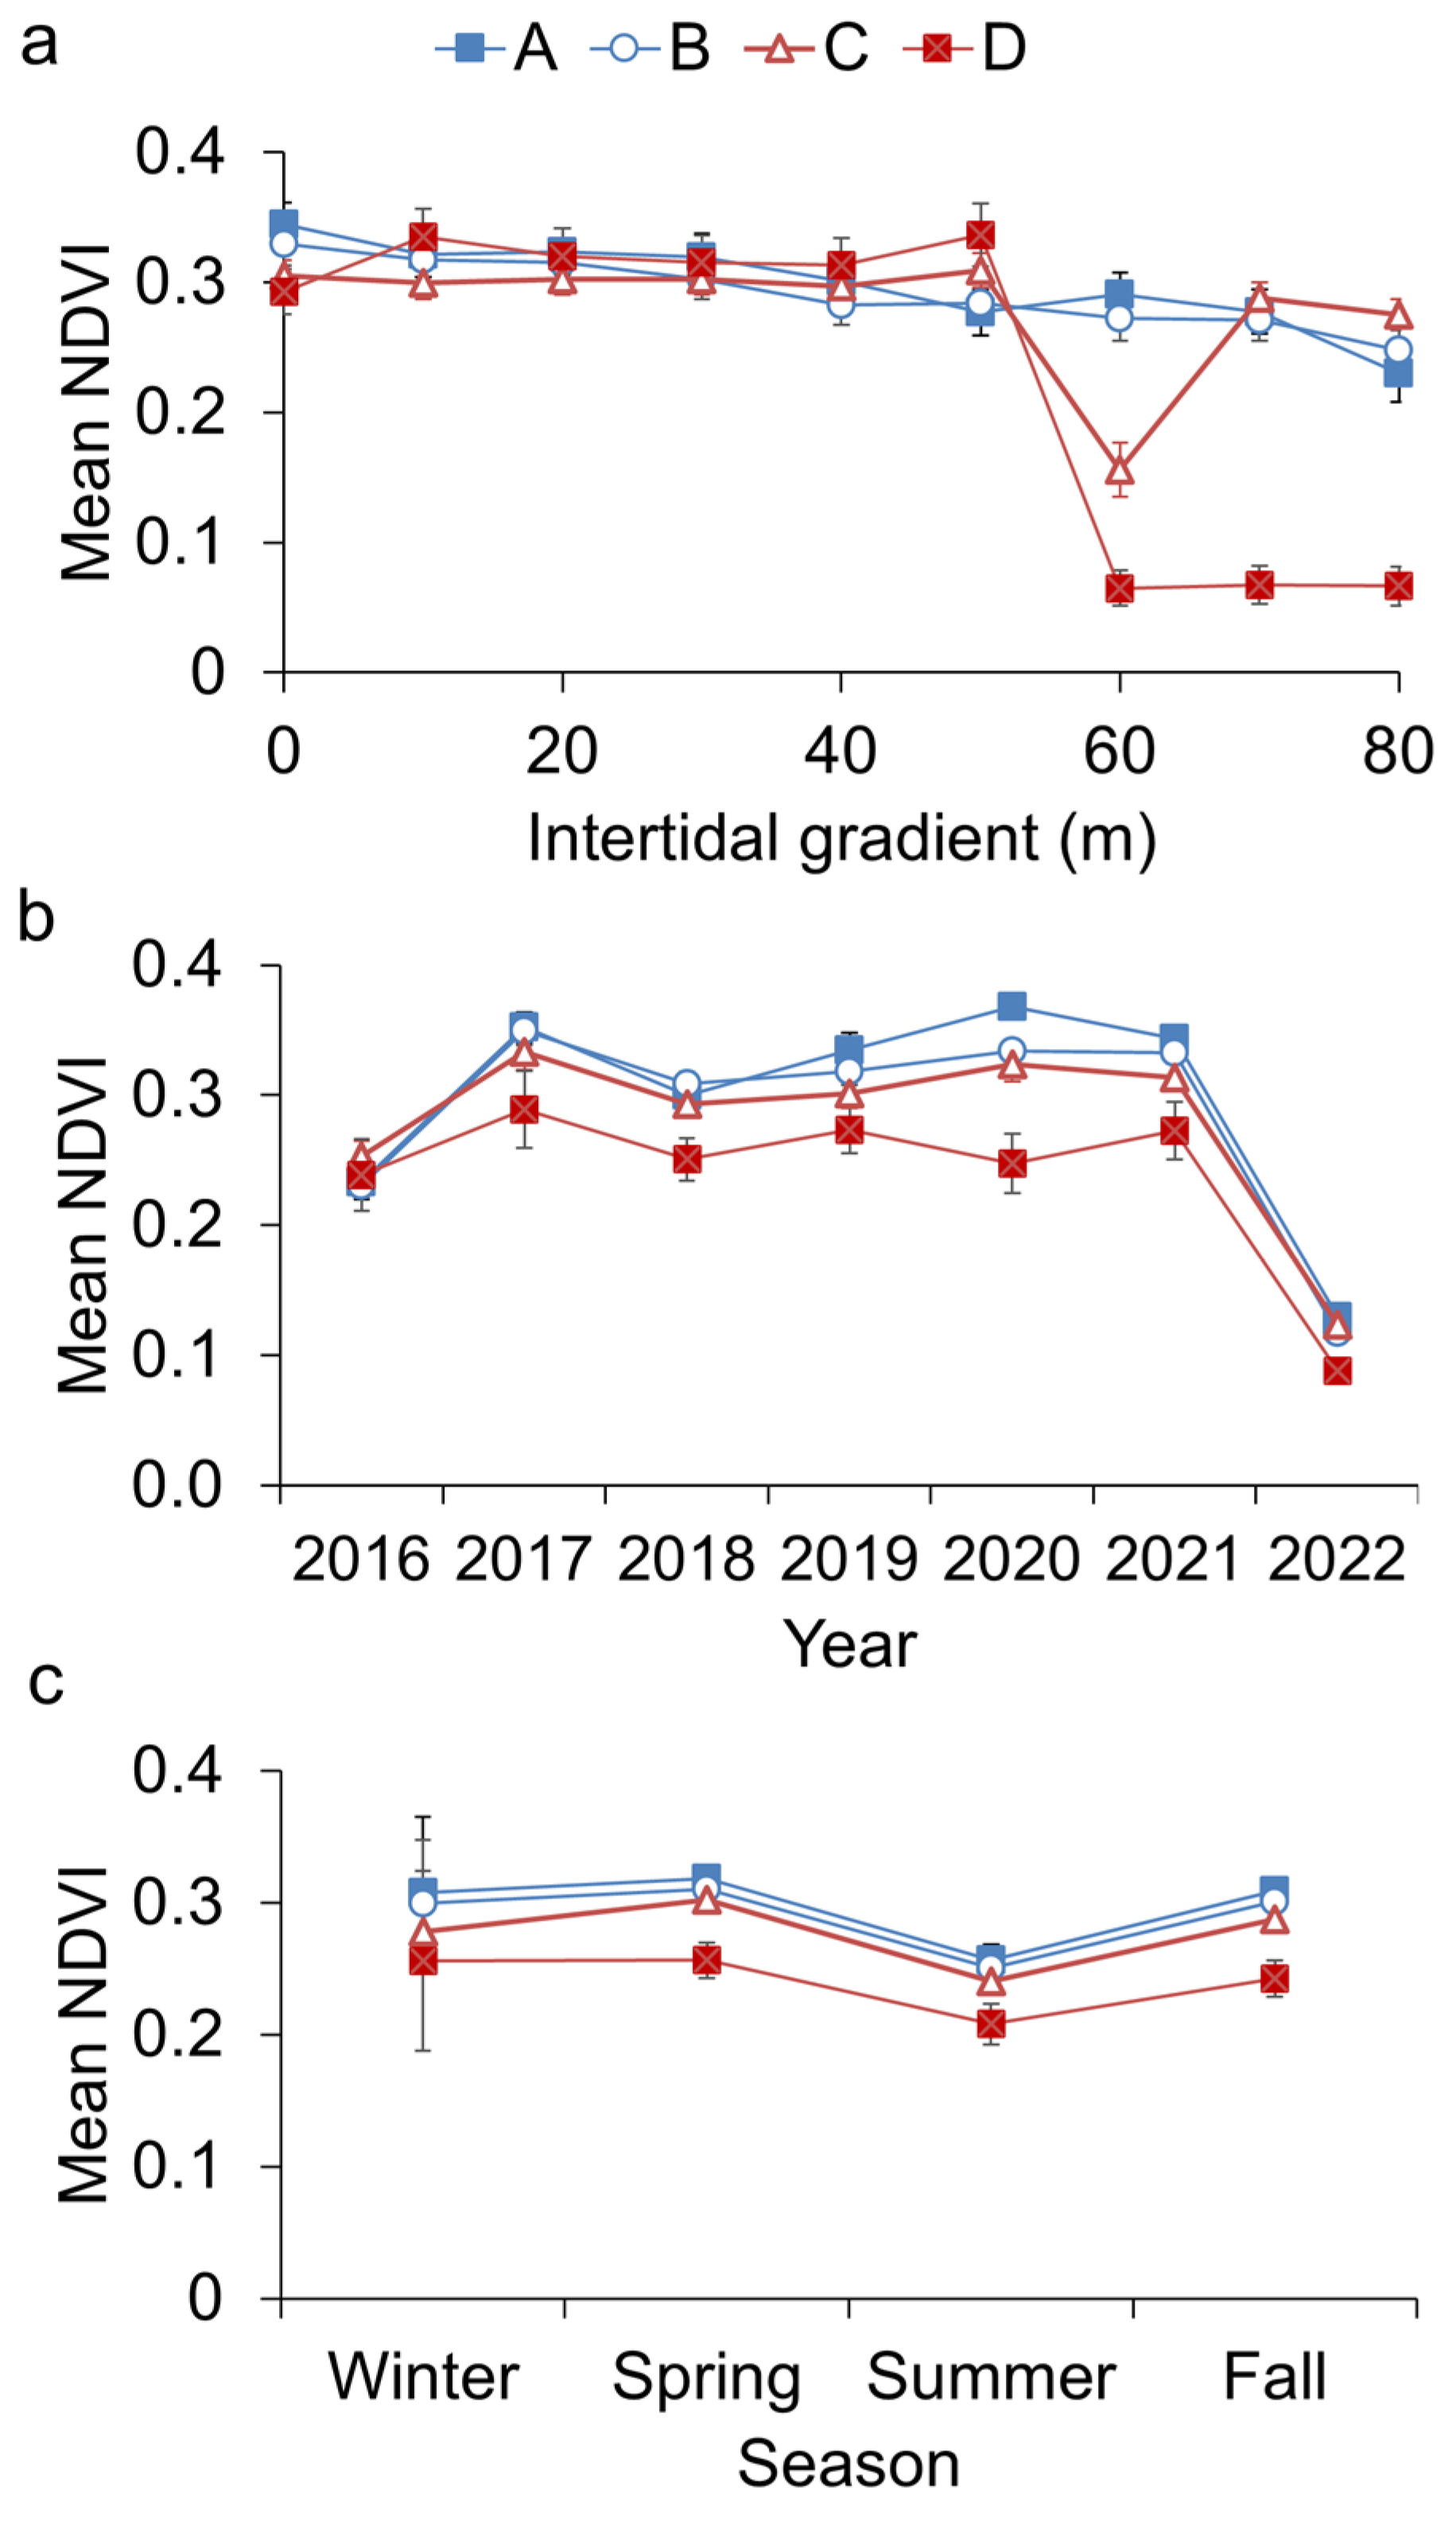
NDVI values were significantly higher in transects A, B, and C (~0.3 ± 0.01) in comparison with D (0.17, respectively) (Figure 5c). Significant differences were observed between Transects A and D (F = 181.93, p = 0.006), B and D (F = 183.55, p = 0.006), and C and D (F = 127.95, p = 0.006; PERMANOVA Pairwise comparisons). Moreover, NDVI showed significant differences along intertidal gradient between upper and lower intertidal position (F = 6.58, p = 0.03) (Figure 5d). The interaction between “Transects” and “Intertidal” contributed approximately 2% to the spatial variability of golden tides NDVI, emphasizing the role of intertidal gradients within individual transects (Table 1). The NDVI average along the intertidal gradient was 0.26 ± 0.01, being significantly higher at the upper shore in comparison with the lower shore (Figure 6a). The highest discrepancies were found in the lower region of the intertidal, with NDVI values (mean NDVI = 0.06 ± 0.01) clearly lower in Transect D. In addition, the interactions between “Year” and “Transects” and between “Season” and “Transects” accounted for approximately 1.9% and 1.2%, respectively, of the spatiotemporal variability (Table 1), indicating that fluctuations (annual and/or seasonal) may influence the spatial patterns of NDVI across different transects (Figure 6b,c). The average annual NDVI variability was similar between transects, with significantly lower values observed for Transect D (Figure 6b). Seasonal variability in NDVI was evident across all transects, with significant minimum levels in summer and maximum levels in winter and spring (Figure 6c). Annual and seasonal NDVI variability for golden tides were spatially consistent in Killybegs estuary.

4. Discussion

4.1. Identifying Nitrogen and Phosphorus Limitation, and Nitrogen Sources

The critical quota (i.e., the tissue nutrient concentration where maximum growth is possible) and the subsistence quota (i.e., the minimum tissue nutrient concentration required to support growth) are key concepts for assessing nutrient limitation in macroalgal blooms [36,40,41]. These parameters have been widely used to evaluate the role of nutrient dynamics in the proliferation of massive macroalgal blooms, which are often linked to nutrient over-enrichment in aquatic ecosystems due to human activities. Understanding the nutritional status of macroalgal blooms (e.g., golden tides) and identifying limiting nutrients are essential for managing these systems and mitigating their ecological impacts. The critical quota for N in Hincksia sordida (Ectocarpales order) were estimated at 2.08% and 2.12% in winter and summer, respectively, while the subsistence quota were estimated at 0.88% for winter and 1.14% for summer [58]. In the present study, the tissue N contents were higher than the N critical quota for this close related species, suggesting the absence of N limitation (Figure 3a). Overall, the N:P ratio was >10 and <30, which suggested a nutritional equilibrium and an absence of nutrient limitation (N or P) over the entire year, with the exception of 10% of the samples collected in February 2017, indicating P limitation during this sampling occasion (Figure 3c) [59,60]. The lowest values for tissue N content were observed in June 2016, and the highest tissue P contents were recorded during April 2017 (Figure 3a,b). The highest tissue P contents coincided with the highest biomass values measured in spring and early summer (Figure 2), highlighting an important nutritional requirement of P by brown seaweeds. The minimum tissue N content observed during the peak bloom in summer (July 2016; 3.44 ± 0.31%; n = 6) likely reflects a dilution effect due to rapid biomass growth [59]. P limitation has similarly been reported in western Atlantic estuaries affected by golden tides of invasive Sargassum spp. [61]. In coastal environments with high N availability, Sargassum spp. may accumulate high levels of arsenic when P availability decreases relative to N [61,62]. This finding has implications for nutrient management, particularly in coastal zones impacted by anthropogenic activities, as elevated N inputs could not only drive nutrient imbalances but also lead to potential toxic element accumulation. Unfortunately, the critical or subsistence quota for P and N:P stoichiometry ratios have not been previously studied in Ectocarpales algae, such as Ectocarpus spp., or Pilayella spp., and hence any discussion regarding ecophysiology and nutrient status in P. littoralis should be treated with some caution.
The N and P demands of golden tides can be contrasted with those of red and green tides, which often have differing nutrient requirements and ecological impacts. The N critical quota and tissue N content of 2.5% and 2–6%, respectively (i.e., N critical quota ≤ tissue N content), have been previously reported for Ulva spp. in three Irish estuaries, suggesting the absence of N limitation [36,63,64]. However, P limitation was indicated, as tissue p values were lower than the critical quota (P critical quota ≥ tissue P content, specifically 0.215% versus 0.1–0.2), and the N:P ratio was higher than 30. This suggests a nutritional disequilibrium, supporting the idea that the nutritional status of Ulva spp. tends toward P limitation [36,65]. With respect to red tides, i.e., red tide-forming algae such as the invasive red seaweed Agarophyton vermiculophyllum, tissue N contents higher than 2% suggest that N limitation was unlikely, as tissue N content exceeded the N critical quota of 2.14% [66]. However, P contents were below the P critical quota (0.14%) [66] during the period of active growth (February to June), indicating that Agarophyton could be limited by P. In contrast, P. littoralis in this study exhibited a nutritional equilibrium, with an N:P ratio usually found between 10 and 30. This suggests that, although previous studies have identified P limitation in other seaweed species in Irish estuaries, P may not be a limiting factor for the golden tides of P. littoralis in Killybegs Bay.
The observed isotopic δ15N signature of P. littoralis ranged between −0.9 and 3.4‰. According to previous scientific literature and standards, the main N sources to the estuary are likely synthetic fertilizers [67]. The δ15N values were considerably lower than expected. In the surrounding area, the presence of urban wastewater and fish processing waste were anticipated to be the most important sources of nutrients fueling the development of the golden tide occurring in the estuary. However, the observed δ15N for P. littoralis were different to previously reported values for fish processing waste material (7.1‰ [67]) and urban waste waters (15‰ [46,68]). Further research is needed to identify the δ15N signatures of all potential N sources in the Killybegs area, including inputs from the fish processing industry, urban wastewaters, and runoff from the surrounding catchment.

4.2. Spatiotemporal Patterns of Golden Tides on the Shoreline

DNA sequence analysis of ectocarpoid biomass samples from the seaweed blooms in the Killybegs estuary identified P. littoralis as the primary component of these blooms [20]. In general, P. littoralis biomass accumulations (using NDVI as a biomass proxy) were more persistent at the upper and middle shore (Figure 6a), while increased tidal action at the lower shore likely moved the brown seaweed accumulations seaward. Moreover, P. littoralis accumulation was higher on the left side of the river mouth entering the estuary, where NDVI remained constant along the intertidal gradient. In contrast, macroalgal accumulations on the right margin, mainly in transect D, decreased seaward, i.e., toward the lower shore. This pattern may result from the geomorphological characteristics of the Killybegs estuary, where the incoming tide covers the right margin faster than the left.
Time series analysis of NDVI revealed consistent annual and seasonal trends across the four studied transects (Figure 5 5a,b and Figure 6b,c). Interannual variability was observed, with lower NDVI values recorded in 2022 (Figure 5a), possibly indicating an improvement in water quality in Killybegs Harbor. The reduction in blooms detected through remote sensing could corroborate the improvement in water quality reported by the Irish Environmental Protection Agency, which recently stated that water quality in Killybegs Bay is generally good [69]. Moreover, a decline in coastal water quality to moderate status was reported in Killybegs Harbor between 2016 and 2021 [70], coinciding with the increase in blooms observed in this study.
Overall, macroalgal blooms (e.g., Ulva spp., Agarophyton) affecting Irish estuaries often did not show clear seasonal patterns [21,22,71]. However, for P. littoralis macroalgal blooms, seasonal variability was observed thorough NDVI monitoring. Minimum NDVI values (i.e., a proxy for biomass) were consistently recorded in summer across all four transects studied, while maximum values occurred in spring. High data dispersion was observed during winter (Figure 5b and Figure 6c). A significant negative linear regression was found between the daily NDVI average and the daily maximum temperature (average of the previous 7 day), indicating that lower biomass was observed on the shoreline under conditions of elevated temperatures (Spearman coefficient (rho) = −0.33; p = 0.04; n = 36) (Figure S2). In contrast, the lowest P. littoralis biomass measured in situ was recorded in February 2017 (Figure 2), coinciding with a strong storm, which limited biomass collection to half of the intended samples (n = 9). This may explain the moderate negative regression observed between in situ P. littoralis biomass and accumulated rainfall (rho = −0.77; p = 0.07; n = 6) (Figure S3). Although significant regressions were not observed between average NDVI and accumulated rainfall, the highest NDVI values were detected in spring, coinciding with lower levels of accumulated rainfall (~3 mm) (Figure S1).
Minimum NDVI values observed in summer could be due to higher levels of grazing [13] as well as elevated air temperatures. In the northern Baltic Sea, the degradation rate of P. littoralis by mesograzers was studied, showing lower degradation rates in spring due to colder water temperatures [72]. In addition, a higher presence of green tides, such as Cladophora or Ulva, were observed in summer, suggesting a shift in macroalgal dominance as part of a temporal species succession [21]. The peak in summer for Ulva spp. in other Irish estuaries, together with a decrease in golden seaweed coverage, suggests a temporal species succession in the Killybegs estuary. It has been reported that (1) germlings and adults of P. littoralis appear earlier in spring in the Baltic Sea, reaching a 10-fold higher biomass than Ulva spp. (previously referred to as Enteromorpha spp. [73]), and (2) a reproductive cycle for Pilayella spp. that is shorter than Ulva spp., which continually produces spores between April and October [15]. In addition to Ulva spp., P. littoralis cohabits with Fucus sp. and Ascophyllum nodosum, in the intertidal at Killybegs. The effects of P. littoralis on Fucus vesiculosus have been studied in coastal areas of the Baltic Sea affected by eutrophication, where a decline in the perennial macroalga F. vesiculosus has been linked to the development of opportunistic blooms of P. littoralis and Ulva spp. [74]. The species’ temporal succession observed in the Killybegs estuary reinforces the idea that Irish blooms consist of different species with varying ecological requirements, as initially reported [71] and more recently validated through molecular identification tools [21].
The lowest NDVI values observed in summer may be slightly underestimated, potentially explaining the discrepancies between in situ biomass measurements and NDVI (Figure 2 and Figure 5a), despite a good linear relationship between NDVI and P. litoralis biomass being observed in Killybegs on 28 April 2022 [52]. NDVI is frequently utilized often used as a proxy for the intertidal biomass of benthic photosynthetic communities, such as seagrass, seaweeds, and the microphytobenthos [25,26,75]. However, NDVI may underestimate biomass in summer (apparently with a higher in situ biomass) due to the satellite acquiring the reflected light from the surface biomass but not consider the biomass at depth, whereas with field sampling all the biomass is collected within each measured square. Although this limitation has not been specifically tested for seaweed strandings, it has been demonstrated for intertidal benthic microalgae on mudflats [76,77].

4.3. Nutrients in the Water Column

Clear seasonal patterns of DIN and DRP concentrations were not observed in the study area. In Killybegs, additional increases in dissolved nutrients in the water may have toxic effects on P. littoralis, potentially reducing its biomass and causing unpredictable ecological outcomes (e.g., a shift from macroalgal to microalgal blooms or a significant rise in nutrient export to the open sea [28,78,79]). However, significant relationships were not found between dissolved nutrient concentrations in the water column and macroalgal biomass and tissue nitrogen content. The observed P limitation contradicted the expected nutrient limitation patterns typically found in pristine or undisturbed temperate estuaries, where N limitation is generally expected to regulate primary production during spring and summer [4]. The findings support the notion of P limitation, consistent with studies regarding the nutrient status of Ulva spp. blooms in three Irish estuaries (Tolka, Clonakilty, and Argideen) [36]. During the last century, P loadings have increased with the global rise in human population and the intensification of agriculture, although this has been smaller than the increase in N loadings [6,34]. This has led to a global alteration in the N:P ratio of nutrient inputs, affecting nutrient limitation patterns on a worldwide scala. Since 1960, the manufacture and application of N-based fertilizers rose from 11.3 to 107.6 Mt N yr−1 in 2013, and P-based fertilizers from 4.6 to 17.5 Mt P yr−1 over the same period [80]. In Ireland, between 2018 and 2020, N loadings in aquatic ecosystems from human activities were estimated at 71,279 tons, while anthropogenic P loadings reached 1451 tons (49.1:1 ratio [81]). This disproportion in N and P loadings may partially account for the observed P limitation in these nutrient over-enriched estuaries. Given this context, managing both N and P inputs is essential to decrease coastal and estuarine eutrophication [31], and restore biogeochemical imbalances in estuarine and coastal systems.

5. Conclusions

This study proposes an accessible method for monitoring estuarine water quality using free Level-2 Sentinel-2 multispectral imagery to track macroalgal blooms, such as P. littoralis golden tides. The presence of macroalgal blooms on shorelines is often used as a bioindicator of water quality degradation under the EU Water Framework Directive. Here, an example is presented where estuarine water quality monitoring was indirectly assessed using remote sensing, detecting a reduction in macroalgal presence in 2022. This reduction coincided with an improvement in water quality reported by the Irish Environmental Protection Agency. This approach could complement the assessments conducted by the Irish Environmental Protection Agency, supporting compliance with the EU Water Framework Directive. NDVI was used as a proxy for shoreline macroalgal biomass, revealing both temporal and spatial patterns: the lowest NDVI values were recorded in 2022, with seasonal minima in summer and peaks in spring. Spatially, the highest NDVI values occurred on the left side of the river mouth, while the effect of intertidal position was significant only in the lower shore region of one transect on the right margin. Tissue nitrogen analysis indicated that brown seaweed blooms in Killybegs were not N-limited, challenging the established view that N is the primary limiting nutrient in temperate estuaries and suggesting a reassessment of nutrient management strategies. However, as critical quotas for N and P have not been previously determined for P. littoralis, further laboratory experiments are required to establish these thresholds accurately. This study is one of the few to measure tissue N, P, and δ15N values in a brown macroalgal bloom, underscoring the importance of assessing the nutritional requirements of fast-growing brown seaweeds. Given the ongoing threats of habitat and biodiversity loss due to climate change and human activity, the preservation of estuarine health is essential, with findings from this study offering valuable insights for the management of golden tides to mitigate eutrophication impacts.

Supplementary Materials

The following supporting information can be downloaded at: https://www.mdpi.com/article/10.3390/jmse12122336/s1, Figure S1: Monthly average of maximum air temperature (°C) (in orange), wind speed (Knot) (in black) and precipitation (mm) (in blue) from 2016 to 2022; Figure S2: Significant Spearman correlations (rho) between daily average NDVI (used as a proxy for Pilayella litoralis biomass) and meteorological variables; Figure S3: Significant Spearman correlations (rho) for each sampling occasion between biotic (P. littoralis biomass [g m−2], tissue N content, N [%]; tissue P content, P [%]; tissue N:P ratio; and δ15N determination [‰]) and environmental variables (dissolved inorganic nitrogen, DIN [µM]; dissolved phosphorous, DRP [µM]; DIN:DRP ratio; salinity, Sal [‰]; maximum temperature, Tmax [°C]; minimum temperature, Tmin [°C]; accumulated rainfall, Rain [mm]; wind speed, wdsp [knots]; wind direction, ddhm [degree]; global radiation, Rad [J cm−2]).

Author Contributions

Conceptualization, S.H. (Sara Haro), R.B. and L.M; methodology, S.H. (Sara Haro), R.B. and L.M.; software, S.H. (Sara Haro); validation, S.H. (Sara Haro); formal analysis, S.H. (Sara Haro); investigation, S.H. (Sara Haro), R.B., S.H. (Svenja Heesch) and O.F.; resources, L.M., M.G.H. and K.K.; data curation, S.H. (Sara Haro) and R.B.; writing—original draft preparation, S.H. (Sara Haro); writing—review and editing, R.B., M.G.H., K.K., O.F., S.H. (Svenja Heesch) and L.M.; visualization, S.H. (Sara Haro); supervision, L.M.; project administration, L.M.; funding acquisition, L.M., R.B., K.K. and S.H. (Sara Haro). All authors have read and agreed to the published version of the manuscript.

Funding

This research has been co-financed under the 2014–2020 EPA Research Strategy (Environmental Protection Agency, Ireland), project no: 2015-W-MS-20 (the Sea-MAT Project) and project no: 2018-W-MS-32 (the MACRO-MAN Project). Sara Haro was funded by the postdoctoral fellowship of the Fundación Ramón Areces “XXXIII Convocatoria para Ampliación de Estudios en el Extranjero en Ciencias de la Vida y de la Materia”.

Institutional Review Board Statement

Not applicable.

Informed Consent Statement

Not applicable.

Data Availability Statement

Data are contained within the article.

Conflicts of Interest

The authors declare no conflicts of interest.

References

  1. Kennish, M.J. Environmental Threats and Environmental Future of Estuaries. Environ. Conserv. 2002, 29, 78–107. [Google Scholar] [CrossRef]
  2. Nelson, T.A.; Haberlin, K.; Nelson, A.V.; Ribarich, H.; Hotchkiss, R.; van Alstyne, K.L.; Buckingham, L.; Simunds, D.J.; Fredrickson, K. Ecological and Physiological Controls of Species Composition in Green Macroalgal Blooms. Ecology 2008, 89, 1287–1298. [Google Scholar] [CrossRef] [PubMed]
  3. Cotas, J.; Gomes, L.; Pacheco, D.; Pereira, L. Ecosystem Services Provided by Seaweeds. Hydrobiology 2023, 2, 75–96. [Google Scholar] [CrossRef]
  4. Valiela, I.; McClelland, J.; Hauxwell, J.; Behr, P.J.; Hersh, D.; Foreman, K. Macroalgal Blooms in Shallow Estuaries: Controls and Ecophysiological and Ecosystem Consequences. Limnol. Oceanogr. 1997, 42, 1105–1118. [Google Scholar] [CrossRef]
  5. Smetacek, V.; Zingone, A. Green and Golden Seaweed Tides on the Rise. Nature 2013, 504, 84–88. [Google Scholar] [CrossRef]
  6. Glibert, P.M. Eutrophication, Harmful Algae and Biodiversity—Challenging Paradigms in a World of Complex Nutrient Changes. Mar. Pollut. Bull. 2017, 124, 591–606. [Google Scholar] [CrossRef]
  7. Corzo, A.; Van Bergeijk, S.A.; Garcia-Robledo, E. Effects of Green Macroalgal Blooms on Intertidal Sediments: Net Metabolism and Carbon and Nitrogen Contents. Mar. Ecol. Prog. Ser. 2009, 380, 81–93. [Google Scholar] [CrossRef]
  8. Hering, D.; Borja, A.; Carstensen, J.; Carvalho, L.; Elliott, M.; Feld, C.K.; Heiskanen, A.S.; Johnson, R.K.; Moe, J.; Pont, D.; et al. The European Water Framework Directive at the Age of 10: A Critical Review of the Achievements with Recommendations for the Future. Sci. Total Environ. 2010, 408, 4007–4019. [Google Scholar] [CrossRef]
  9. Xing, Q.; Guo, R.; Wu, L.; An, D.; Cong, M.; Qin, S.; Li, X. High-Resolution Satellite Observations of a New Hazard of Golden Tides Caused by Floating Sargassum in Winter in the Yellow Sea. IEEE Geosci. Remote Sens. Lett. 2017, 14, 1815–1819. [Google Scholar] [CrossRef]
  10. Schreyers, L.; van Emmerik, T.; Biermann, L.; Le Lay, Y.-F. Spotting Green Tides over Brittany from Space: Three Decades of Monitoring with Landsat Imagery. Remote Sens. 2021, 13, 1408. [Google Scholar] [CrossRef]
  11. Haro, S.; Morrison, L.; Caballero, I.; Figueroa, F.L.; Korbee, N.; Navarro, G.; Bermejo, R. Assessing Golden Tides from Space: Meteorological Drivers in the Accumulation of the Invasive Algae Rugulopteryx Okamurae on Coasts. Remote Sens. 2024, 16, 2689. [Google Scholar] [CrossRef]
  12. Bermejo, R.; Green-Gavrielidis, L.; Gao, G. Editorial: Macroalgal Blooms in a Global Change Context. Front. Mar. Sci. 2023, 10, 1204117. [Google Scholar] [CrossRef]
  13. Steele, D.H.; Whittick, A. Seasonal Variation in Pilayella littoralis (Phaeophyceae) and Its Consequences as a Food Source for the Amphipod, Gammarus lawrencianus, in the Intertidal of Newfoundland. J. Mar. Biol. Assoc. UK 1991, 71, 883–889. [Google Scholar] [CrossRef]
  14. Jeffrey, D.W.; Madden, B.; Rafferty, B. Beach Fouling by Ectocarpus Siliculosus in Dublin Bay. Mar. Pollut. Bull. 1993, 26, 51–53. [Google Scholar] [CrossRef]
  15. Lotze, H.K.; Schramm, W.; Schories, D.; Worm, B. Control of Macroalgal Blooms at Early Developmental Stages: Pilayella littoralis versus Enteromorpha spp. Oecologia 1999, 119, 46–54. [Google Scholar] [CrossRef]
  16. Haro, S.; Bermejo, R.; Wilkes, R.; Bull, L.; Morrison, L. Monitoring Intertidal Golden Tides Dominated by Ectocarpus siliculosus Using Sentinel-2 Imagery. Int. J. Appl. Earth Obs. Geoinf. 2023, 122, 103451. [Google Scholar] [CrossRef]
  17. Pregnall, A.M.; Miller, S.L. Flux of Ammonium from Surf-Zone and Nearshore Sediments in Nahant Bay, Massachusetts, USA in Relation to Free-Living Pilayella littoralis. Mar. Ecol. Prog. Ser. 1988, 50, 161–167. [Google Scholar] [CrossRef]
  18. Berglund, J.; Mattila, J.; Rönnberg, O.; Heikkilä, J.; Bonsdorff, E. Seasonal and Inter-Annual Variation in Occurrence and Biomass of Rooted Macrophytes and Drift Algae in Shallow Bays. Estuar. Coast. Shelf Sci. 2003, 56, 1167–1175. [Google Scholar] [CrossRef]
  19. Lotze, H.K.; Worm, B.; Sommer, U. Strong Bottom-up and Top-down Control of Early Life Stages of Macroalgae. Limnol. Oceanogr. 2001, 46, 749–757. [Google Scholar] [CrossRef]
  20. Bermejo, R.; Heesch, S.; Donnell, M.O.; Golden, N.; Mac Monagail, M.; Edwards, M.; Curley, E.; Fenton, O.; Daly, E.; Morrison, L. Nutrient Dynamics and Ecophysiology of Opportunistic Macroalgal Blooms in Irish Estuaries and Coastal Bays (Sea-MAT). Environ. Prot. Agency Res. Rep. 2019, 56, 1–56. [Google Scholar]
  21. Bermejo, R.; Heesch, S.; Mac Monagail, M.; O’Donnell, M.; Daly, E.; Wilkes, R.J.; Morrison, L. Spatial and Temporal Variability of Biomass and Composition of Green Tides in Ireland. Harmful Algae 2019, 81, 94–105. [Google Scholar] [CrossRef] [PubMed]
  22. Bermejo, R.; MacMonagail, M.; Heesch, S.; Mendes, A.; Edwards, M.; Fenton, O.; Knöller, K.; Daly, E.; Morrison, L. The Arrival of a Red Invasive Seaweed to a Nutrient Over-Enriched Estuary Increases the Spatial Extent of Macroalgal Blooms. Mar. Environ. Res. 2020, 158, 104944. [Google Scholar] [CrossRef] [PubMed]
  23. Zoffoli, L.M.; Gernez, P.; Godet, L.; Peters, S.; Oiry, S.; Barillé, L. Decadal Increase in the Ecological Status of a North-Atlantic Intertidal Seagrass Meadow Observed with Multi-Mission Satellite Time-Series. Ecol. Indic. 2021, 130, 108033. [Google Scholar] [CrossRef]
  24. Li, Y.; Gundersen, H.; Poulsen, R.N.; Xie, L.; Ge, Z.; Hancke, K. Quantifying Seaweed and Seagrass Beach Deposits Using High-Resolution UAV Imagery. J. Environ. Manag. 2023, 331, 117171. [Google Scholar] [CrossRef]
  25. Karki, S.; Bermejo, R.; Wilkes, R.; Monagail, M.M.; Daly, E.; Healy, M.; Hanafin, J.; McKinstry, A.; Mellander, P.-E.; Fenton, O.; et al. Mapping Spatial Distribution and Biomass of Intertidal Ulva Blooms Using Machine Learning and Earth Observation. Front. Mar. Sci. 2021, 8, 633128. [Google Scholar] [CrossRef]
  26. Haro, S.; Jesus, B.; Oiry, S.; Papaspyrou, S.; Lara, M.; González, C.J.; Corzo, A. Microphytobenthos Spatio-Temporal Dynamics across an Intertidal Gradient Using Random Forest Classification and Sentinel-2 Imagery. Sci. Total Environ. 2022, 804, 149983. [Google Scholar] [CrossRef]
  27. Haro, S.; Jimenez-Reina, J.; Bermejo, R.; Morrison, L. SoftwareX BioIntertidal Mapper Software: A Satellite Approach for NDVI-Based Intertidal Habitat Mapping. SoftwareX 2023, 24, 101520. [Google Scholar] [CrossRef]
  28. Viaroli, P.; Bartoli, M.; Giordani, G.; Naldi, M. Community Shifts, Alternative Stable States, Biogeochemical Controls and Feedbacks in Eutrophic Coastal Lagoons: A Brief Overview. Aquat. Conserv. Mar. Freshw. Ecosyst. 2008, 18, 105–117. [Google Scholar] [CrossRef]
  29. Lalegerie, F.; Gager, L.; Stiger-Pouvreau, V.; Connan, S. The Stressful Life of Red and Brown Seaweeds on the Temperate Intertidal Zone: Effect of Abiotic and Biotic Parameters on the Physiology of Macroalgae and Content Variability of Particular Metabolites. In Advances in Botanical Research; Bourgougnon, N., Ed.; Academic Press: Cambridge, MA, USA, 2020; Volume 95, pp. 247–287. ISBN 0065-2296. [Google Scholar]
  30. Zhang, D.; Zhang, Q.S.; Yang, X.Q. Plant Physiology and Biochemistry Seasonal Dynamics of Photosynthetic Activity in the Representive Brown Macroalgae Sagrassum thunbergii (Sargassaceae phaeophyta). Plant Physiol. Biochem. 2017, 120, 88–94. [Google Scholar] [CrossRef]
  31. Howarth, R.; Paerl, H.W. Coastal Marine Eutrophication: Control of Both Nitrogen and Phosphorus Is Necessary. Proc. Natl. Acad. Sci. USA 2008, 105, 2008. [Google Scholar] [CrossRef]
  32. Lapointe, B.E. Nutrient Thresholds for Bottom-up Control of Macroalgal Blooms on Coral Reefs in Jamaica and Southeast Florida. Limnol. Oceanogr. 1997, 42, 1119–1131. [Google Scholar] [CrossRef]
  33. Howarth, R.W.; Anderson, D.B.; Cloern, J.E.; Elfring, C.; Hopkinson, C.S.; Lapointe, B.; Maloney, T.J.; Marcus, N.; McGlathery, K.; Sharpley, A.N. Issues in Ecology: Nutrient Pollution in Coastal Rivers, Bays, and Seas; United States Geological Survey: Reston, VT, USA, 2000. [Google Scholar]
  34. Teichberg, M.; Fox, S.E.; Olsen, Y.S.; Valiela, I.; Martinetto, P.; Iribarne, O.; Muto, E.Y.; Petti, M.; Corbisier, T.N.; Soto-Jimenez, M.; et al. Eutrophication and Macroalgal Blooms in Temperate and Tropical Coastal Waters: Nutrient Enrichment Experiments with Ulva spp. Glob. Change Biol. 2010, 16, 2624–2637. [Google Scholar] [CrossRef]
  35. Costanzo, S.D.; O’Donohue, M.J.; Dennison, W.C. Gracilaria edulis (Rhodophyta) as a Biological Indicator of Pulsed Nutrients in Oligotrophic Waters. J. Phycol. 2000, 36, 680–685. [Google Scholar] [CrossRef] [PubMed]
  36. Bermejo, R.; Golden, N.; Schrofner, E.; Knöller, K.; Fenton, O.; Serrão, E.; Morrison, L. Biomass and Nutrient Dynamics of Major Green Tides in Ireland: Implications for Biomonitoring. Mar. Pollut. Bull. 2022, 175, 113318. [Google Scholar] [CrossRef]
  37. Licata, P.; Trombetta, D.; Cristani, M.; Martino, D.; Naccari, F. Organochlorine Compounds and Heavy Metals in the Soft Tissue of the Mussel Mytilus Galloprovincialis Collected from Lake Faro (Sicily, Italy). Environ. Int. 2004, 30, 805–810. [Google Scholar] [CrossRef]
  38. Viana, I.G.; Bode, A. Stable Nitrogen Isotopes in Coastal Macroalgae: Geographic and Anthropogenic Variability. Sci. Total Environ. 2013, 443, 887–895. [Google Scholar] [CrossRef]
  39. Viana, I.G.; Bode, A. Variability in δ 15 N of Intertidal Brown Algae along a Salinity Gradient: Differential Impact of Nitrogen Sources. Sci. Total Environ. 2015, 512–513, 167–176. [Google Scholar] [CrossRef]
  40. Lyngby, J.E.; Mortensen, S.; Ahrensberg, N. Bioassessment Techniques for Monitoring of Eutrophication and Nutrient Limitation in Coastal Ecosystems. Mar. Pollut. Bull. 1999, 39, 212–223. [Google Scholar] [CrossRef]
  41. Fong, P.; Boyer, K.E.; Zedler, J.B. Developing an Indicator of Nutrient Enrichment in Coastal Estuaries and Lagoons Using Tissue Nitrogen Content of the Opportunistic Alga, Enteromorpha intestinalis (L. Link). J. Exp. Mar. Bio. Ecol. 1998, 231, 63–79. [Google Scholar] [CrossRef]
  42. Björnsäter, B.R.; Wheeler, P.A. Effect of Nitrogen and Phosphorus Supply on Growth and Tissue Composition of Ulva fenestrata and Enteromorpha intestinalis (Ulvales, Chlorophyta). J. Phycol. 1990, 26, 603–611. [Google Scholar] [CrossRef]
  43. Mariotti, A.; Germon, J.C.; Hubert, P.; Kaiser, P.; Letolle, R.; Tardieux, A.; Tardieux, P. Experimental Determination of Nitrogen Kinetic Isotope Fractionation: Some Principles; Illustration for the Denitrification and Nitrification Processes. Plant Soil 1981, 62, 413–430. [Google Scholar] [CrossRef]
  44. Lin, D.T.; Fong, P. Macroalgal Bioindicators (Growth, Tissue N, Δ15N) Detect Nutrient Enrichment from Shrimp Farm Effluent Entering Opunohu Bay, Moorea, French Polynesia. Mar. Pollut. Bull. 2008, 56, 245–249. [Google Scholar] [CrossRef] [PubMed]
  45. Morris, E.P.; Peralta, G.; Benavente, J.; Freitas, R.; Rodrigues, A.M.; Quintino, V.; Alvarez, O.; Valcárcel-pérez, N. Caulerpa Prolifera Stable Isotope Ratios Reveal Anthropogenic Nutrients within a Tidal Lagoon. Mar. Ecol. Prog. Ser. 2009, 390, 117–128. [Google Scholar] [CrossRef]
  46. Piñón-Gimate, A.; Espinosa-Andrade, N.; Sánchez, A.; Casas-Valdez, M. Nitrogen Isotopic Characterisation of Macroalgae Blooms from Different Sites within a Subtropical Bay in the Gulf of California. Mar. Pollut. Bull. 2017, 116, 130–136. [Google Scholar] [CrossRef]
  47. Viana, I.G.; Fernández, J.A.; Aboal, J.R.; Carballeira, A. Measurement of Δ15N in Macroalgae Stored in an Environmental Specimen Bank for Regional Scale Monitoring of Eutrophication in Coastal Areas. Ecol. Indic. 2011, 11, 888–895. [Google Scholar] [CrossRef]
  48. Gröcke, D.R.; Sauer, P.E.; Bridault, A.; Drucker, D.G.; Germonpré, M.; Bocherens, H. Hydrogen Isotopes in Quaternary Mammal Collagen from Europe. J. Archaeol. Sci. Rep. 2017, 11, 12–16. [Google Scholar] [CrossRef]
  49. Kjellman, F.R. Pylaiella Littoralis (Linnaeus) Kjellman, 1872. Bih. till Kongliga Sven. Vetenskaps-Akademiens Handl. 1872, 1, 1–24. [Google Scholar]
  50. Irish Waters Killybegs WWTP; AER 2011; D011. 2011. Available online: https://epawebapp.epa.ie/licences/lic_eDMS/090151b28044d75e.pdf (accessed on 28 October 2024).
  51. Irish Water Annual Environmental Report. 2018. Available online: https://www.water.ie/sites/default/files/docs/aers/2018/Non-Priority-AERS/D0367-01_2018_aer.pdf (accessed on 28 October 2024).
  52. Bermejo, R.; Golden, N.; Haro, S.; Karki, S.; Macmonagail, M.; García-Poza, S.; Navarrete-Fernández, T.; Benedikt Brunner, K.K.; Mark Healy, O.; Fenton, P.-E.M.; et al. MACROalgal Blooms in Transitional and Coastal Waters; MANagement-Pressures, Policy and Solutions (MACRO-MAN). Environ. Prot. Agency Res. Rep. 2023, 3–14. [Google Scholar]
  53. Strickland, J.D.H.; Parsons, T.R. A Practical Handbook of Seawater Analysis. Bull. Fish. Res. Board Can. 1968, 167, 1–311. [Google Scholar]
  54. Fox, J. Applied Regression Analysis and Generalized Linear Models, 2nd ed.; SAGE Publications: New York, NY, USA, 2008. [Google Scholar]
  55. McArdle, B.H.; Anderson, M.J. Fitting Multivariate Models to Community Data: A Comment on Distance-Based Redundancy Analysis. Ecology 2001, 82, 290. [Google Scholar] [CrossRef]
  56. Oksanen, J.; Guillaume Blanchet, F.; Friendly, M.; Kindt, R.; Legendre, P.; McGlinn, D.; Minchin, P.R.; O’Hara, R.B.; Simpson, G.L.; Solymos, P.; et al. Vegan: Community Ecology Package, R Package Version 2.6-6 2023. Available online: https://cran.r-project.org/web/packages/vegan/vegan.pdf (accessed on 25 October 2024).
  57. Martinez Arbizu, P. PairwiseAdonis: Pairwise Multilevel Comparison Using Adonis, R Package Version 0.4 2020. Available online: https://github.com/pmartinezarbizu/pairwiseAdonis (accessed on 25 October 2024).
  58. Campbell, S. Ammonium Requirements of Fast-Growing Ephemeral Macroalgae in a Nutrient-Enriched Marine Embayment (Port Phillip Bay, Australia). Mar. Ecol. Prog. Ser. 2001, 209, 99–107. [Google Scholar] [CrossRef]
  59. Atkinson, M.J.; Smith, S.V. C:N:P Ratios of Benthic Marine Plants. Limnol. Oceanogr. 1983, 28, 568–574. [Google Scholar] [CrossRef]
  60. Duarte, C.M. Nutrient Concentration of Aquatic Plants: Patterns across Species. Limnol. Oceanogr. 1992, 37, 882–889. [Google Scholar] [CrossRef]
  61. McGillicuddy, D.J.; Morton, P.L.; Brewton, R.A.; Hu, C.; Kelly, T.B.; Solow, A.R.; Lapointe, B.E. Nutrient and Arsenic Biogeochemistry of Sargassum in the Western Atlantic. Nat. Commun. 2023, 14, 6205. [Google Scholar] [CrossRef]
  62. Huang, S.X.; Jiang, Q.; Ding, Y.F.; Wang, F.J.; Zhu, C. Arsenic Contents and Speciation at Different Growth Stages of Sargassum fusiforme [Harv.] Setchell (Hijiki), an Edible Seaweed. Appl. Ecol. Environ. Res. 2020, 18, 1941–1952. [Google Scholar] [CrossRef]
  63. Villares, R.; Carballeira, A. Nutrient Limitation in Macroalgae (Ulva and Enteromorpha) from the Rías Baixas (NW Spain). Mar. Ecol. 2004, 25, 225–243. [Google Scholar] [CrossRef]
  64. Bermejo, R.; Galindo-Ponce, M.; Golden, N.; Linderhoff, C.; Heesch, S.; Hernández, I.; Morrison, L. Two Bloom-forming Species of Ulva (Chlorophyta) Show Different Responses to Seawater Temperature and No Antagonistic Interaction. J. Phycol. 2023, 59, 167–178. [Google Scholar] [CrossRef]
  65. Hernández, I.; Pérez-Pastor, A.; Mateo, J.J.; Megina, C.; Vergara, J.J. Growth Dynamics of Ulva rotundata (Chlorophyta) in a Fish Farm: Implications for Biomitigation at a Large Scale. J. Phycol. 2008, 44, 1080–1089. [Google Scholar] [CrossRef]
  66. Pedersen, M.F.; Johnsen, K.L. Nutrient (N and P) Dynamics of the Invasive Macroalga Gracilaria Vermiculophylla: Nutrient Uptake Kinetics and Nutrient Release through Decomposition. Mar. Biol. 2017, 164, 1–12. [Google Scholar] [CrossRef]
  67. Bateman, A.S.; Kelly, S.D. Fertilizer Nitrogen Isotope Signatures. Isotopes Environ. Health Stud. 2007, 43, 237–247. [Google Scholar] [CrossRef]
  68. Cohen, R.A.; Fong, P. Using Opportunistic Green Macroalgae as Indicators of Nitrogen Supply and Sources to Estuaries. Ecol. Appl. 2006, 16, 1405–1420. [Google Scholar] [CrossRef] [PubMed]
  69. Environmental Protection Agency. Chapter 9: The Marine Environment; Routledge: London, UK, 2024. [Google Scholar]
  70. Environmental Protection Agency. Water Quality in Ireland 2016–2021; Environmental Protection Agency: Wexford, Ireland, 2022. [Google Scholar]
  71. Jeffrey, D.W.; Brennan, M.T.; Jennings, E.; Madden, B.; Wilson, J.G. Nutrient Sources for In-Shore Nuisance Macroalgae: The Dublin Bay Case. Ophelia 1995, 42, 147–161. [Google Scholar] [CrossRef]
  72. Salovius, S.; Bonsdorff, E. Effects of Depth, Sediment and Grazers on the Degradation of Drifting Filamentous Algae (Cladophora glomerata and Pilayella littoralis). J. Exp. Mar. Bio. Ecol. 2004, 298, 93–109. [Google Scholar] [CrossRef]
  73. Hayden, H.S.; Blomster, J.; Maggs, C.A.; Silva, P.C.; Stanhope, M.J.; Waaland, J.R. Linnaeus Was Right All along: Ulva and Enteromorpha Are Not Distinct Genera. Eur. J. Phycol. 2003, 38, 277–294. [Google Scholar] [CrossRef]
  74. Råberg, S.; Berger-Jönsson, R.; Björn, A.; Granéli, E.; Kautsky, L. Effects of Pilayella littoralis on Fucus Vesiculosus Recruitment: Implications for Community Composition. Mar. Ecol. Prog. Ser. 2005, 289, 131–139. [Google Scholar] [CrossRef]
  75. Zoffoli, L.M.; Gernez, P.; Rosa, P.; Le, A.; Brando, V.E.; Barillé, A.; Harin, N.; Peters, S.; Poser, K.; Spaias, L.; et al. Remote Sensing of Environment Sentinel-2 Remote Sensing of Zostera Noltei-Dominated Intertidal Seagrass Meadows. Remote Sens. Environ. 2020, 251, 112020. [Google Scholar] [CrossRef]
  76. Jacobs, P.; Pitarch, J.; Kromkamp, J.C.; Philippart, C.J.M. Assessing Biomass and Primary Production of Microphytobenthos in Depositional Coastal Systems Using Spectral Information. PLoS ONE 2021, 16, e0246012. [Google Scholar] [CrossRef]
  77. Zhang, T.; Tian, B.; Wang, Y.; Liu, D.; Zhou, Y.; van der Wal, D. Mapping Depth-Integrated Microphytobenthic Biomass on an Estuarine Tidal Flat Using Sentinel Satellite Data. Int. J. Appl. Earth Obs. Geoinf. 2023, 122, 103417. [Google Scholar] [CrossRef]
  78. Ní Longphuirt, S.; O’Boyle, S.; Stengel, D.B. Environmental Response of an Irish Estuary to Changing Land Management Practices. Sci. Total Environ. 2015, 521–522, 388–399. [Google Scholar] [CrossRef]
  79. Longphuirt, S.N.; Mockler, E.M.; O’Boyle, S.; Wynne, C.; Stengel, D.B. Linking Changes in Nutrient Source Load to Estuarine Responses: An Irish Perspective. Biol. Environ. Proc. R. Irish Acad. 2016, 116B, 295. [Google Scholar] [CrossRef]
  80. Lu, C.; Tian, H. Global Nitrogen and Phosphorus Fertilizer Use for Agriculture Production in the Past Half Century: Shifted Hot Spots and Nutrient Imbalance. Earth Syst. Sci. Data 2017, 9, 181–192. [Google Scholar] [CrossRef]
  81. Trodd, W.; O’Boyle, S. Water Quality in 2020; EPA: Wexford, Ireland, 2021. [Google Scholar]
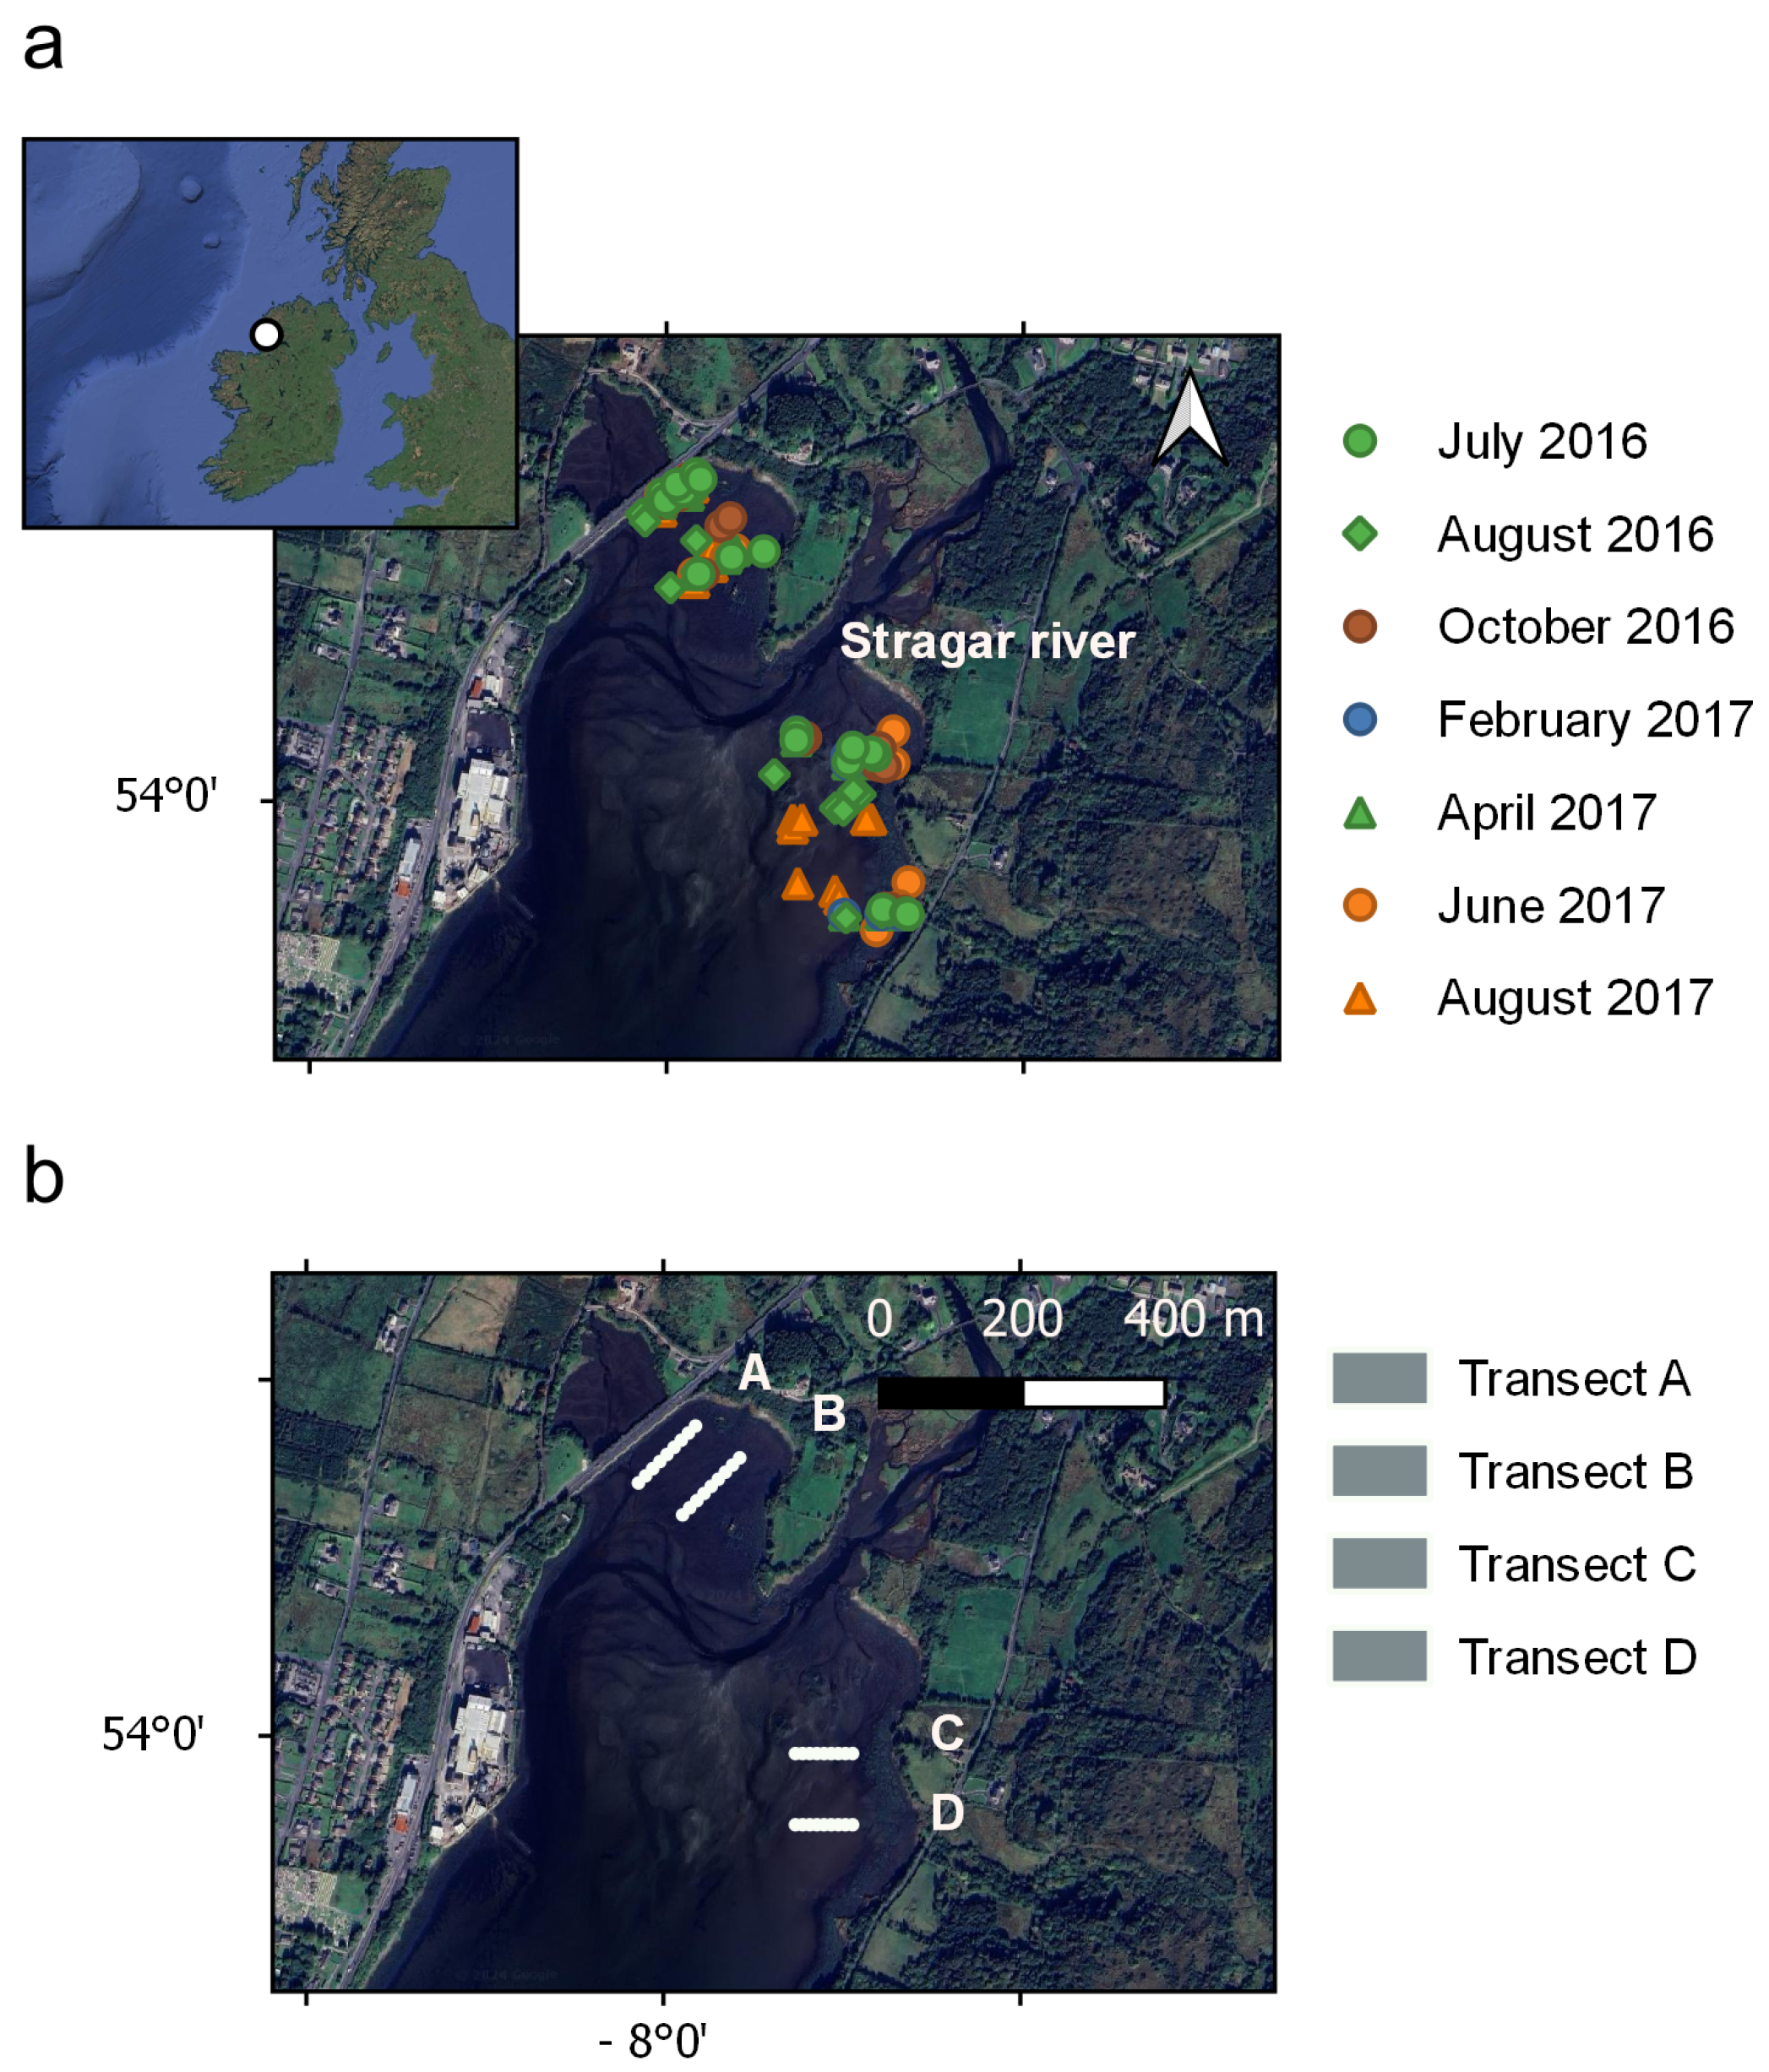
Figure 1. Aerial imagery of Killybegs Bay, located in north of Ireland (European North Atlantic): (a) In situ sampling points between 2016–2017, where biomass, tissue nitrogen, tissue phosphorus and δ15N were determined; (b) transects along intertidal gradient from which NDVI was extracted using Sentinel-2 images from 2016 to 2022.
Jmse 12 02336 g001
Figure 2. Mean fresh biomass (g m−2) of P. littoralis in the Killybegs estuary in 2016 and 2017. Error bars ± standard error (n = 9–18).
Jmse 12 02336 g002
Figure 3. Mean values for (a) tissue N content (%), (b) tissue P content (%), (c) ratio N:P, and (d) δ15N of P. littoralis in the Killybegs estuary for each sampling occasion. Error bars represent the standard error (n = 3–6).
Jmse 12 02336 g003
Figure 4. Mean concentration of (a) dissolved inorganic nitrogen (DIN, expressed as µM), (b) phosphate concentrations (DRP, expressed as µM), and (c) N:P ratio (mol:mol) measured in water column at the six sampling occasions in the Killybegs estuary in 2016 and 2017. Mean ± standard error (n = 12).
Jmse 12 02336 g004
Figure 5. (a) Annual average NDVI of golden tides, used as a proxy for P. littoralis biomass; (b) seasonal average NDVI of golden tides from 2016 to 2022; (c) mean NDVI along four intertidal transects (as shown in Figure 1); and (d) mean NDVI across the intertidal gradient. The line inside each box plot represents the median, while the cross marks the mean.
Jmse 12 02336 g005
Figure 6. (a) Average NDVI along intertidal gradient, expressed as shore distance (m), for each transect (A, B, C, and D). (b) Annual average NDVI of golden tides for each transect. (c) Seasonal average NDVI of golden tides for each transect. Mean ± standard error.
Jmse 12 02336 g006
Table 1. PERMANOVA results ordered by explained variance (R2). Analyzing temporal and spatial variability of NDVI associated with golden tides. Factors and their interactions: “Year”, “Season”, “Transects”, and “Intertidal position”.
FactorsDfSum of SqsR2FPr (>F)
Year64.690.320188.230.001
Transects32.250.154181.160.001
Season30.880.06070.510.001
Year:Season90.790.05421.150.001
Year:Season:Transects270.410.0283.640.001
Transects:Intertidal60.310.02112.620.001
Year:Transects180.280.0193.690.001
Year:Season:Transects:Intertidal520.210.0140.980.533
Year:Season:Intertidal180.190.0132.520.001
Season:Transects90.180.0124.850.001
Year:Transects:Intertidal360.010.0090.850.707
Season:Transects:Intertidal160.120.0081.760.003
Intertidal20.110.00813.320.001
Season:Intertidal60.090.0063.470.002
Residual9533.950.320
Total117614.660.154
Df: degrees of freedom; Sum of Sqs: sum of squares; R2: proportion of variance explained; F: pseudo-F value obtained through permutations; Pr (>F): p-value calculated based on 999 permutations (the lowest possible p-value is 0.001).
Disclaimer/Publisher’s Note: The statements, opinions and data contained in all publications are solely those of the individual author(s) and contributor(s) and not of MDPI and/or the editor(s). MDPI and/or the editor(s) disclaim responsibility for any injury to people or property resulting from any ideas, methods, instructions or products referred to in the content.