Article

A New Grid-Slat Fusion Device to Improve the Take-Off and Landing Performance of Amphibious Seaplanes

by
Baigang Mi
1,2,* and
Jingyi Yu
3
1
School of Aeronautics, Northwestern Polytechnical University, Xi’an 710072, China
2
National Key Laboratory of Aircraft Configuration Design, Xi’an 710072, China
3
Chinese People’s Liberation Army No. 5715 Factory, Luoyang 471000, China
*
Author to whom correspondence should be addressed.
J. Mar. Sci. Eng. 2024, 12(12), 2303; https://doi.org/10.3390/jmse12122303
Submission received: 20 October 2024 / Revised: 22 November 2024 / Accepted: 10 December 2024 / Published: 14 December 2024
(This article belongs to the Section Ocean Engineering)

Abstract

:
To reduce the aerodynamic performance degradation caused by the sculling phenomenon on the flap of amphibious seaplanes, this study proposes a grid-slat fusion design method that integrates grid channels into the slats to create multiple lift surfaces. This new configuration enhances not only the lift capacity of the slats but also the lift characteristics of the main wing, leveraging ejector effects from the grid channels. A grid-slat fusion configuration parametrization method is developed based on the “new conic curve” concept, and an optimization approach is implemented using the NSGA-II algorithm. Computational fluid dynamics (CFD) verification of the 30P30N airfoil demonstrates that the grid-slat fusion design enhances the lift-to-drag ratio of the optimized 2D configuration by up to 8.5% at a specific condition, thereby significantly improving its aerodynamic performance at high angles of attack and meeting the requirements for take-off and landing. The three-dimensional configuration demonstrates a stall angle of attack delay of 2° and a maximum lift coefficient increase of 6%. Furthermore, the grid-slat composite configuration allows a better lift-to-drag ratio, and its aerodynamic characteristics improve with increasing wave height. During the wave runup phase, aerodynamic performance is further enhanced, with different wave positions significantly influencing the aerodynamic performance.

1. Introduction

Amphibious seaplanes are a specialized type of vehicle capable of performing take-offs and landings both on land and in water wave environments. They play a crucial role in maritime rescue, transportation, and reconnaissance and have been extensively researched in various countries. Compared with land runway usage, water take-off and landing impose greater resistance. To enhance these operations, such aircrafts typically require highly sensitive control systems, efficient high-lift devices, and powerful engines [1,2,3,4]. This includes a high lift-to-drag ratio for the wing configuration. Therefore, a variety of active and passive flow control methods or high-lift devices have been adopted in amphibious seaplanes to improve their aerodynamic characteristics and flight performance during take-off and landing and optimize their stability in water and in the air. Among the many active and passive flow control methods, blow-suction technology is the most mature and effective and has numerous engineering applications. Studies by overseas researchers on wing-blown lift devices began in the 1950s [5]. In 1956, Koening et al. [6] studied the effect of trailing-edge flap suction on the leading-edge stall of a swept wing in an Ames wind tunnel. In 1996, Owens et al. [7] conducted an experimental study of a large swept delta wing in a Langley wind tunnel and found that the lift-drag ratio of the suction control in the boundary layer was 21% greater than that of the normal suction method in a wing leading-edge suction control experiment. In 2006, Boeing, NASA, and DARPA applied active flow control to an aircraft with very short take-off and landing, conducting a series of internal blown flap experiments on the half-span model in the Langley subsonic wind tunnel. These experiments demonstrated that active flow control could enhance the aerodynamic performance of the system and achieve significant improvements in take-off and landing performance goals [8]. Concurrently with research on blown lift devices, Lockheed applied a boundary-layer control system to the jet engines of the P5M-3 seaplane [9]. In the 1960s, Japan also conducted research on the flow control scheme of boundary-layer blown flaps, implementing jet-flap technology for the PS-1 anti-submarine seaplane through simulations and experiments. Subsequently, Japan developed the amphibious seaplanes US-1A and US-2 [10,11], which currently utilize variants of boundary-layer control technology. However, blowing, as an active flow control technology, is technically complex and significantly interferes with the aircraft structure. These methods, which require additional energy for boundary-layer control, are less practical and necessitate high external energy or gas sources.
Extensive research has also been conducted globally on the selection of high-lift devices. For instance, the most advanced large-jet amphibious seaplane, the Be-200 [12,13], utilizes a combination of large retreating Fuller flaps and full-span leading-edge slats. The Canadian CL-215 aircraft features a leading-edge deflection device and a single-edge flap to meet the high lift requirements for take-off and landing [14]. However, these lift effects are limited, and there is no specific consideration of factors related to water surfaces. The design standards still follow those of conventional land aircraft, with low applicability to amphibious seaplanes.
This study aims to design and optimize a lift enhancement device that is applicable in near-water and flap-splash situations. The slat is selected as the primary focus for optimal design. To simultaneously enhance the lift-to-drag characteristics of the slats and mitigate the disturbance characteristics of the main wing, a grid channel shape is introduced to create a grid-slat fusion device. A new passive flow control method adapted for the amphibious aircraft take-off and landing environment is proposed. Based on CFD and multiphase flow technology, this study compares and verifies the aerodynamic performance of 2D and 3D fusion configurations in the presence of wind and waves. The new configuration proposed in this study effectively enhances the take-off and landing flight performance of amphibious seaplanes and supports the optimization of the design of these aircraft configurations.
This article is arranged as follows: the design requirements for lift devices on amphibious seaplanes are introduced in Section 2. Then, we present the concept of grid-blended slats, design and parametrize the slot, and complete the optimization of the design in Section 2. Section 3 shows the verification of the aerodynamic efficiency and establishes wave conditions to further investigate whether the device maintains its aerodynamic enhancement performance for near-water take-off and landing, as well as flap-splash scenarios.

2. Design Considerations and Methods

2.1. Design Requirements for Lift Devices for Amphibious Seaplanes

For amphibious seaplanes, conventional high-lift devices are designed similarly to those used in landplanes, such as the widely used slat-main-wing flap high-lift configuration. Creating a slot between the slat and the main wing generates a jet-like slot effect that enhances flow energy on the upper surface of the main wing, improving its resistance to separation. Additionally, the combination of slats and flaps forms a highly cambered airfoil, thereby enhancing the lift-to-drag ratio [15]. However, amphibious seaplanes face a more complex service environment compared with conventional land-based aircraft. During the water take-off and landing processes, the distance between the lift device and the water surface decreases due to the aircraft’s gravitational force, particularly in windy and wavy conditions. During these phases, the high-energy water jets generated by waves hitting the aircraft body induce a “splashing” effect on the flap section of the high-lift device, leading to the formation of a water film on the flap surface. This effect significantly reduces its aerodynamic performance, as shown in Figure 1, Figure 2 and Figure 3.
It can be observed from the analysis above that the flaps are closer to the water surface during take-off and landing because of the influence of the pitch attitude angle; thus, their aerodynamic characteristics are more strongly affected by interference from the water surface. The purpose of the flaps is to increase the wing area and curvature, improve the lift coefficient of the wing, and reduce the effect of splashing water, as depicted in Figure 4. However, at the same time, it is also evident that during take-off and landing, the distance between the leading-edge slat and the water surface increases, and the slats are less affected by the waves in the body of water; thus, they are basically unaffected by the water surface. Therefore, the relative efficiency of a leading-edge slat is superior to that of a flap for this type of aircraft. Figure 5 illustrates the lift characteristics of typical 30P30N multi-segment wing slats and flaps. While the lift coefficient of the flaps is greater than that of the slats at small angles of attack, the slats contribute more lift than the flaps at an angle of attack of 12°, and the lift difference between the slats and flaps further increases with the increase in the attack angle. In summary, the design requirements of lifting devices for amphibious seaplanes are as follows:
(1) Fully leveraging the design concept and experience of conventional onshore lifting devices to obtain a suitable and simple design scheme;
(2) Taking the impact of splashing during take-off and landing into account to enhance aerodynamic performance while not significantly changing the design scheme.
Considering the above requirements, the classic “slat-main-wing-flap” lifting configuration was initially explored in amphibious seaplane lifting devices. Despite the limited chord length of slats, their primary function in a lifting device is to disrupt the airflow of the main wing by creating a slot flow with the main wing, thereby enhancing the stall ability. However, if the lift characteristics are further optimized and expanded, slats could have good applicability in water take-off and landing scenarios.

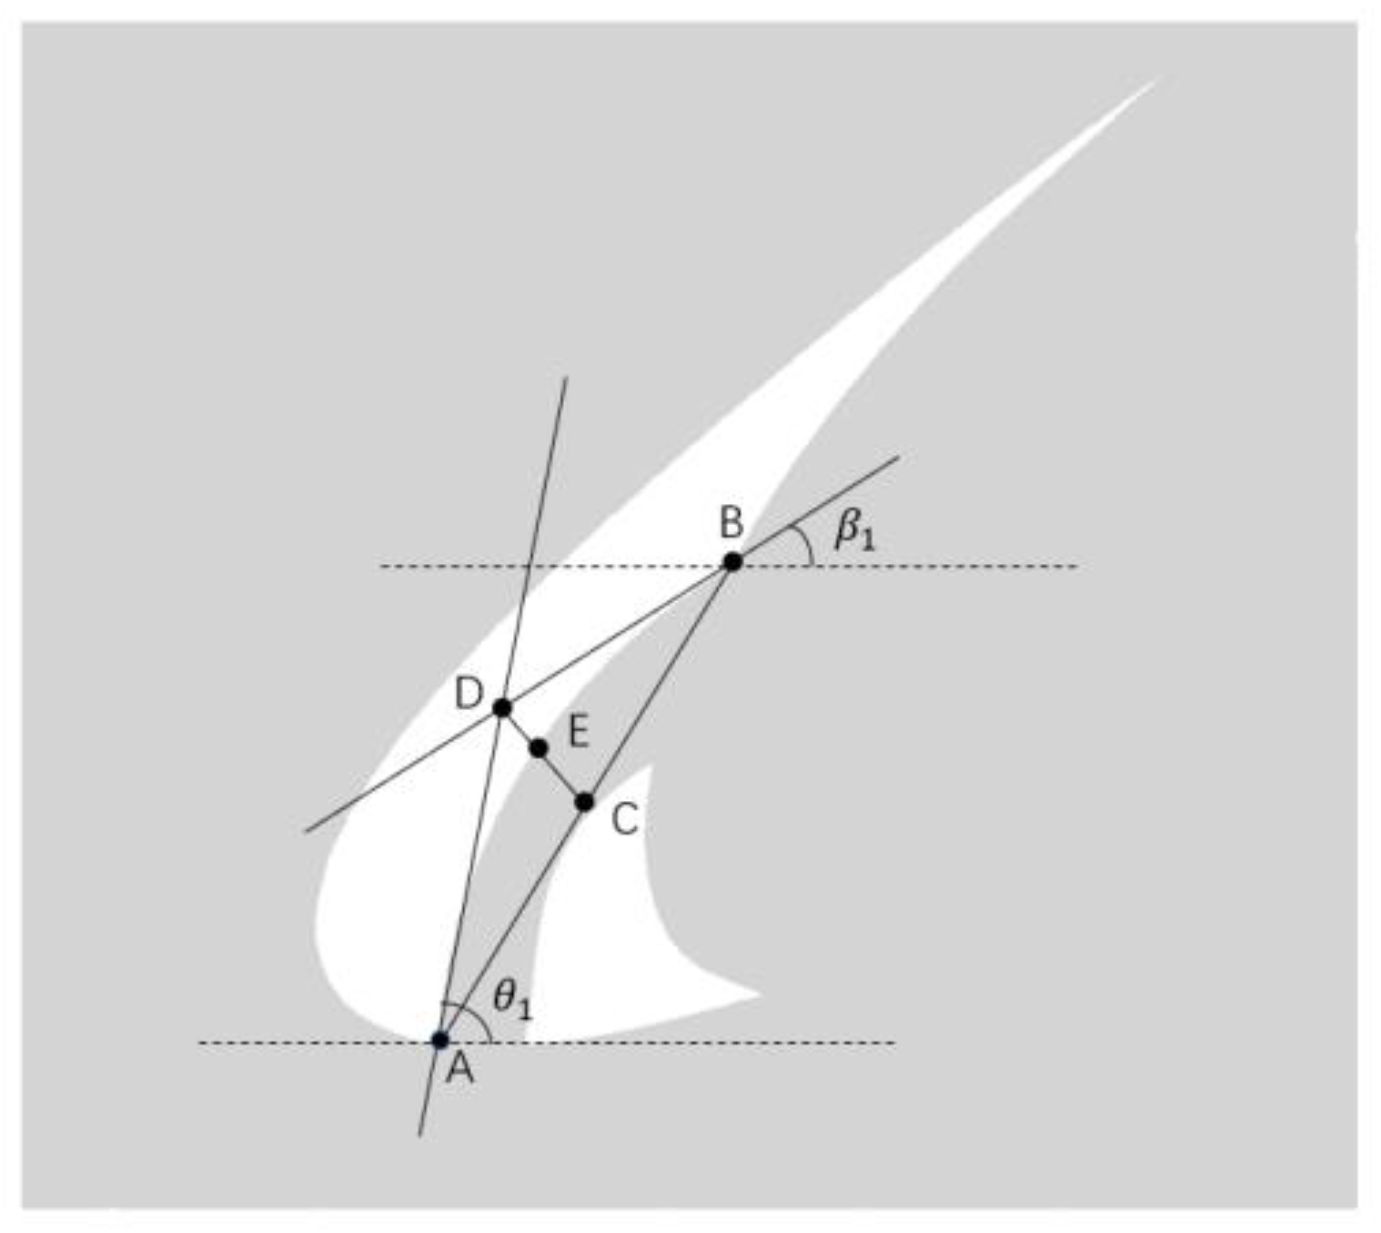
2.2. Design and Parametrization of a Grid-Slat Fusion Device

Slots have limited dimensions, and the efficiency of lift augmentation achievable under conventional circumstances is demonstrated by increasing the size of the main wing. For further enhancement of the lift-to-drag characteristics while ensuring the slot flow, an optimal aerodynamic profile design is needed. Early scholars studied slots in detail and found that jets formed through the slots could control and delay flow separation. Ramiz [16] investigated the possible effects of slot location, width, and angle on highly loaded compressor blades, and the results showed that slots increased the lift-to-drag ratio of a 2D model by 28% and the stall angle of attack by 5°. Ni [17] proposed a curved slot design method and conducted experimental tests on NACA634-021 blades, which showed a 14% increase in the maximum lift-to-drag ratio for slotted airfoils. Therefore, given that slats interfere with the main wing through the slotted section and contribute little to lift through the camber effect, the synergistic optimization of the slat design also commences from the following two aspects. Drawing upon the mature design of slats for land-based aircraft and emphasizing simplicity and reliability, this study adopts the concept of a grid [18] of blended slats to enhance the design of lift devices for water take-off and landing scenarios. The introduction of grid channels allows the lifting surface area of slats to be increased while maintaining their original size profile. Moreover, the new channels formed by the grid can also produce a jet effect similar to that of the original slats, enhancing the disturbance ability of the main wing, as illustrated in Figure 6. Following the fusion of grids and slats, from a two-dimensional perspective, the design parameters primarily encompass the grid layout location, grid number, grid channel width, and grid channel wall curvature, as depicted in Figure 7.
Grid layout location: The grid layout location dictates the quality of the airflow entering the channel. Insufficient stability in the airflow entering the channel directly impacts the lift enhancement characteristics within the channel and the flow characteristics at the channel outlet.
Grid number: The greater the number of grids, the better. However, although the channel can play a similar slot jet role, there are differences in inlet airflow characteristics between channels, and the friction drag increases significantly due to the increased contact area with the air.
Grid channel width: The height of the channel determines the velocity gradient and flow rate of the internal airflow, thereby affecting the strength of the “jet” effect in the channel.
Grid channel wall curvature: The role of grid fusion is to improve lift characteristics while enhancing the disturbance effect of slats on the main wing. The wall curvature plays a critical role in both aspects. Curved walls can mimic the leading edge of an airfoil, and the channels between these walls create various pathways with changes in curvature, altering the flow dynamics within the channels.
The aforementioned parameters are relatively specific, and the general characterization of the grid-slat fusion configuration lacks intuitiveness. Hence, a “new conic” method is devised to parametrize the grid channels [19,20]. This method reintroduces an uncommon conic expression incorporating the concept of affinity transformation into the analytic formula of conic curves, enabling arbitrary geometric modifications such as stretching, bending, and compression. The fundamental principle of this approach leverages analytic geometry, whereby a family of conic arcs can be defined by an arbitrary circumscribing triangle, and the equation for each conic arc is established, as depicted in Figure 8. In the diagram, O D represents the tangent at the beginning of the arc, B D represents the tangent at the end of the arc, θ denotes the angle at the beginning of the arc, β denotes the angle at the end of the arc, and the chord of the arc is represented by O B . The equation for this cone can be expressed as follows:
( x d y y d x ) x d x b y y b y d y b y y b + 1 4 f 2 x b y y b x 2 = 0
In the formula, f = E C E D .
Compared with the standard equation of the conic curve, this curve exhibits different shapes; it is parabolic when f = 1, elliptic when f < 1, hyperbolic when f > 1, degenerates into a straight-line OB when f = 0, and becomes a broken line as f approaches ∞. The smaller the f value is, the flatter the curve. The new conic method is employed to fit the shape of the grid channel, offering advantages such as simplicity, preservation of good convexity, and appropriate size deflection. The grid channel is divided into two curves (Figure 9)—upper and lower—fitting one curve for every five parameters. The upper curve of the grid channel is selected for a detailed explanation. Figure 10 illustrates five parameters: ratio A, ratio B, θ 1 , β 1 , and ratio E, corresponding to the position of point A (this refers to the ratio of the distance between point A and the starting point of the upper curve to the total length of the upper curve), as well as the positions of points B, θ 1 , β 1 , and f 1 = E C E D , which denote the entrance position, upper entrance angle, upper exit angle, and deflection value on the grid channel, respectively. θ 1 refers to the angle between the tangent at point A on the curve and the horizontal upper entrance angle. The five parameters selected for the parametrization of the lower curve correspond to the five parameters that describe the upper curve, respectively, as ratio H corresponds to ratio A of the upper curve. The geometric parameters of the upper and lower curves of a generic grid channel together determine the entrance width, exit width, entrance angle, exit angle, and contraction-expansion ratio of the entire grid channel.

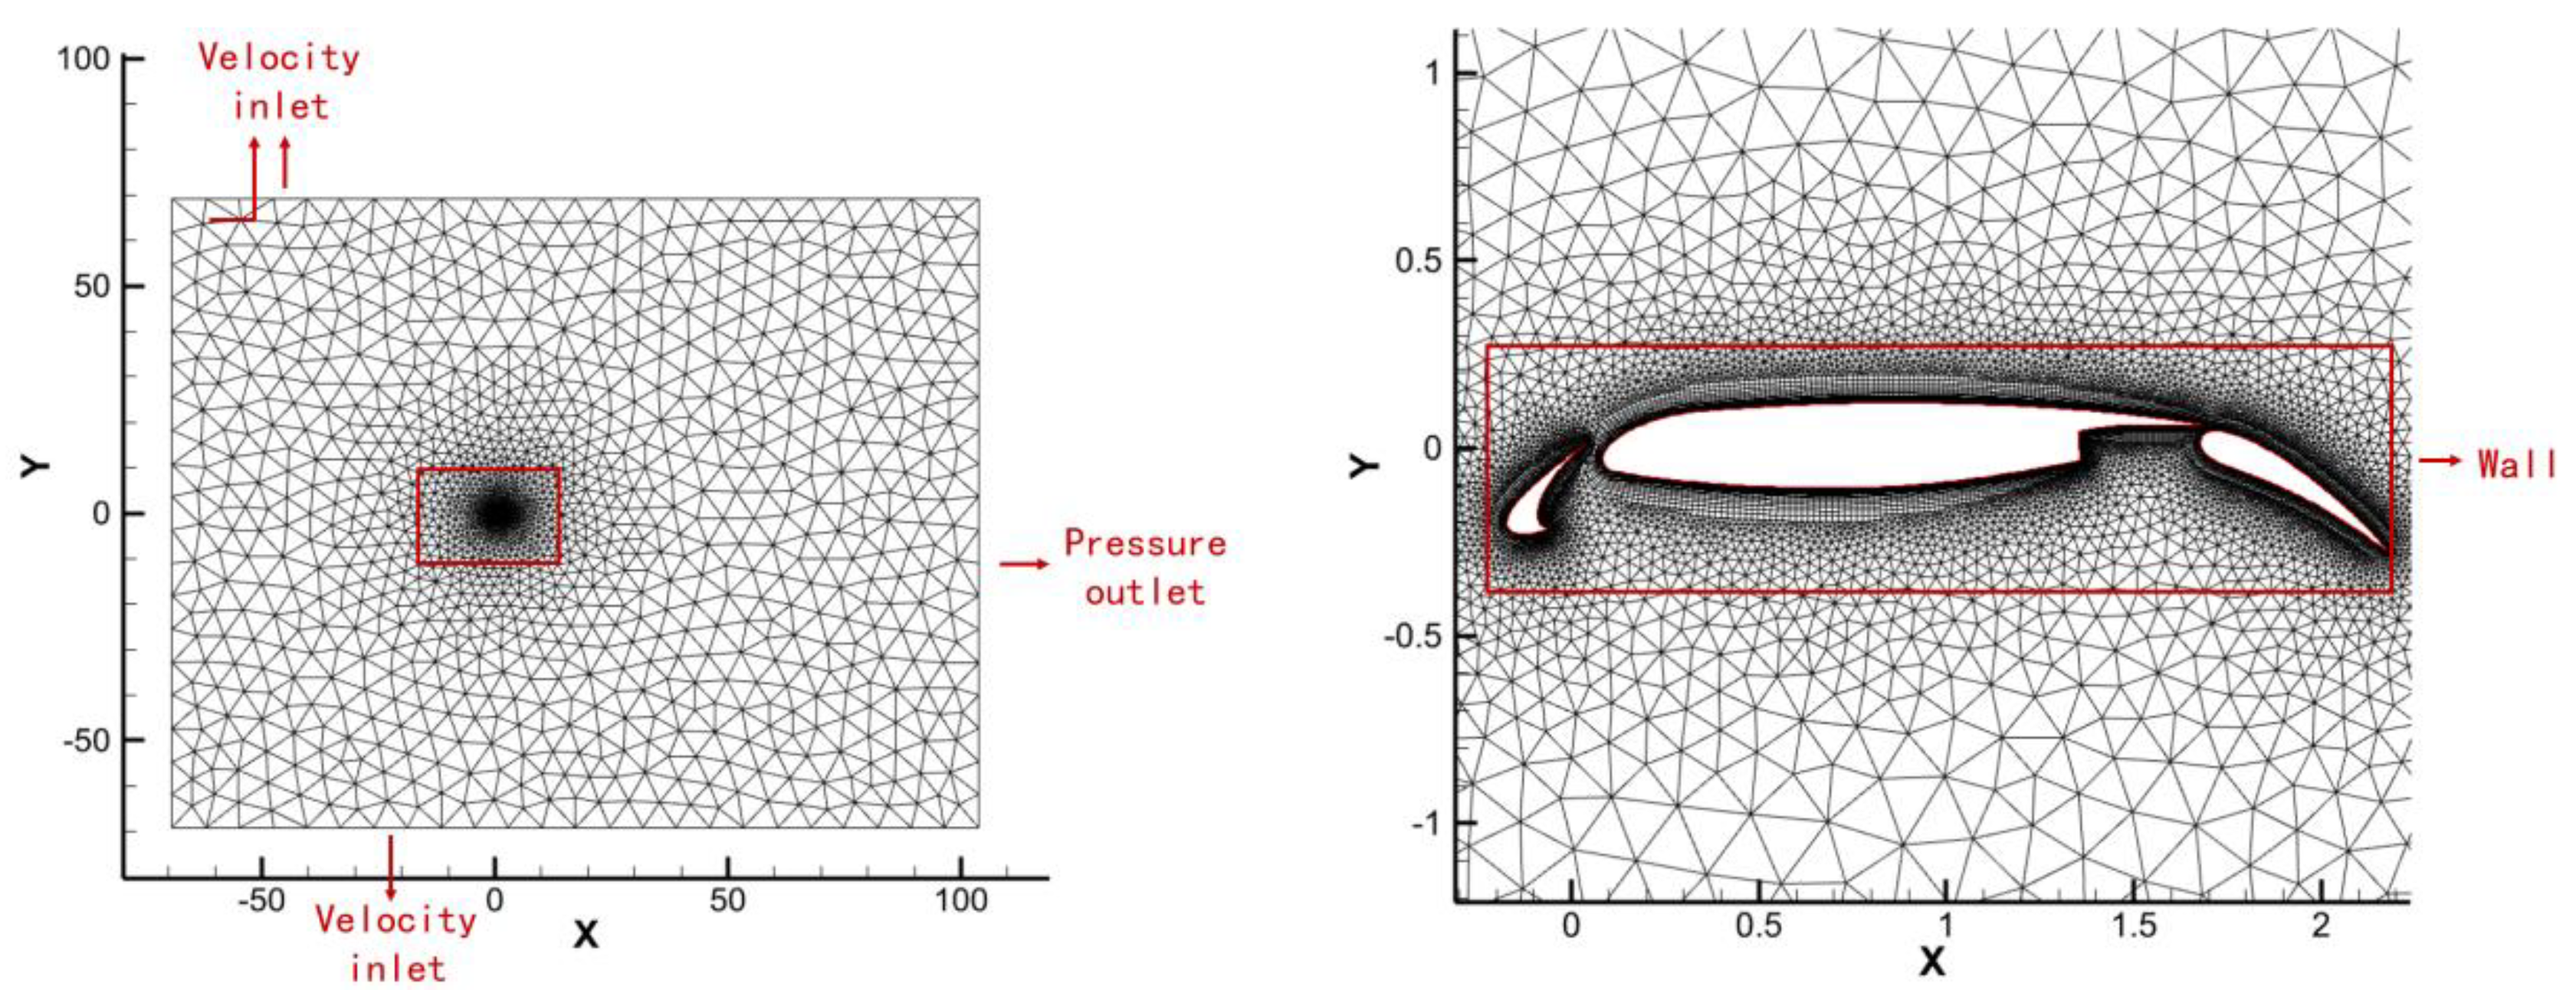
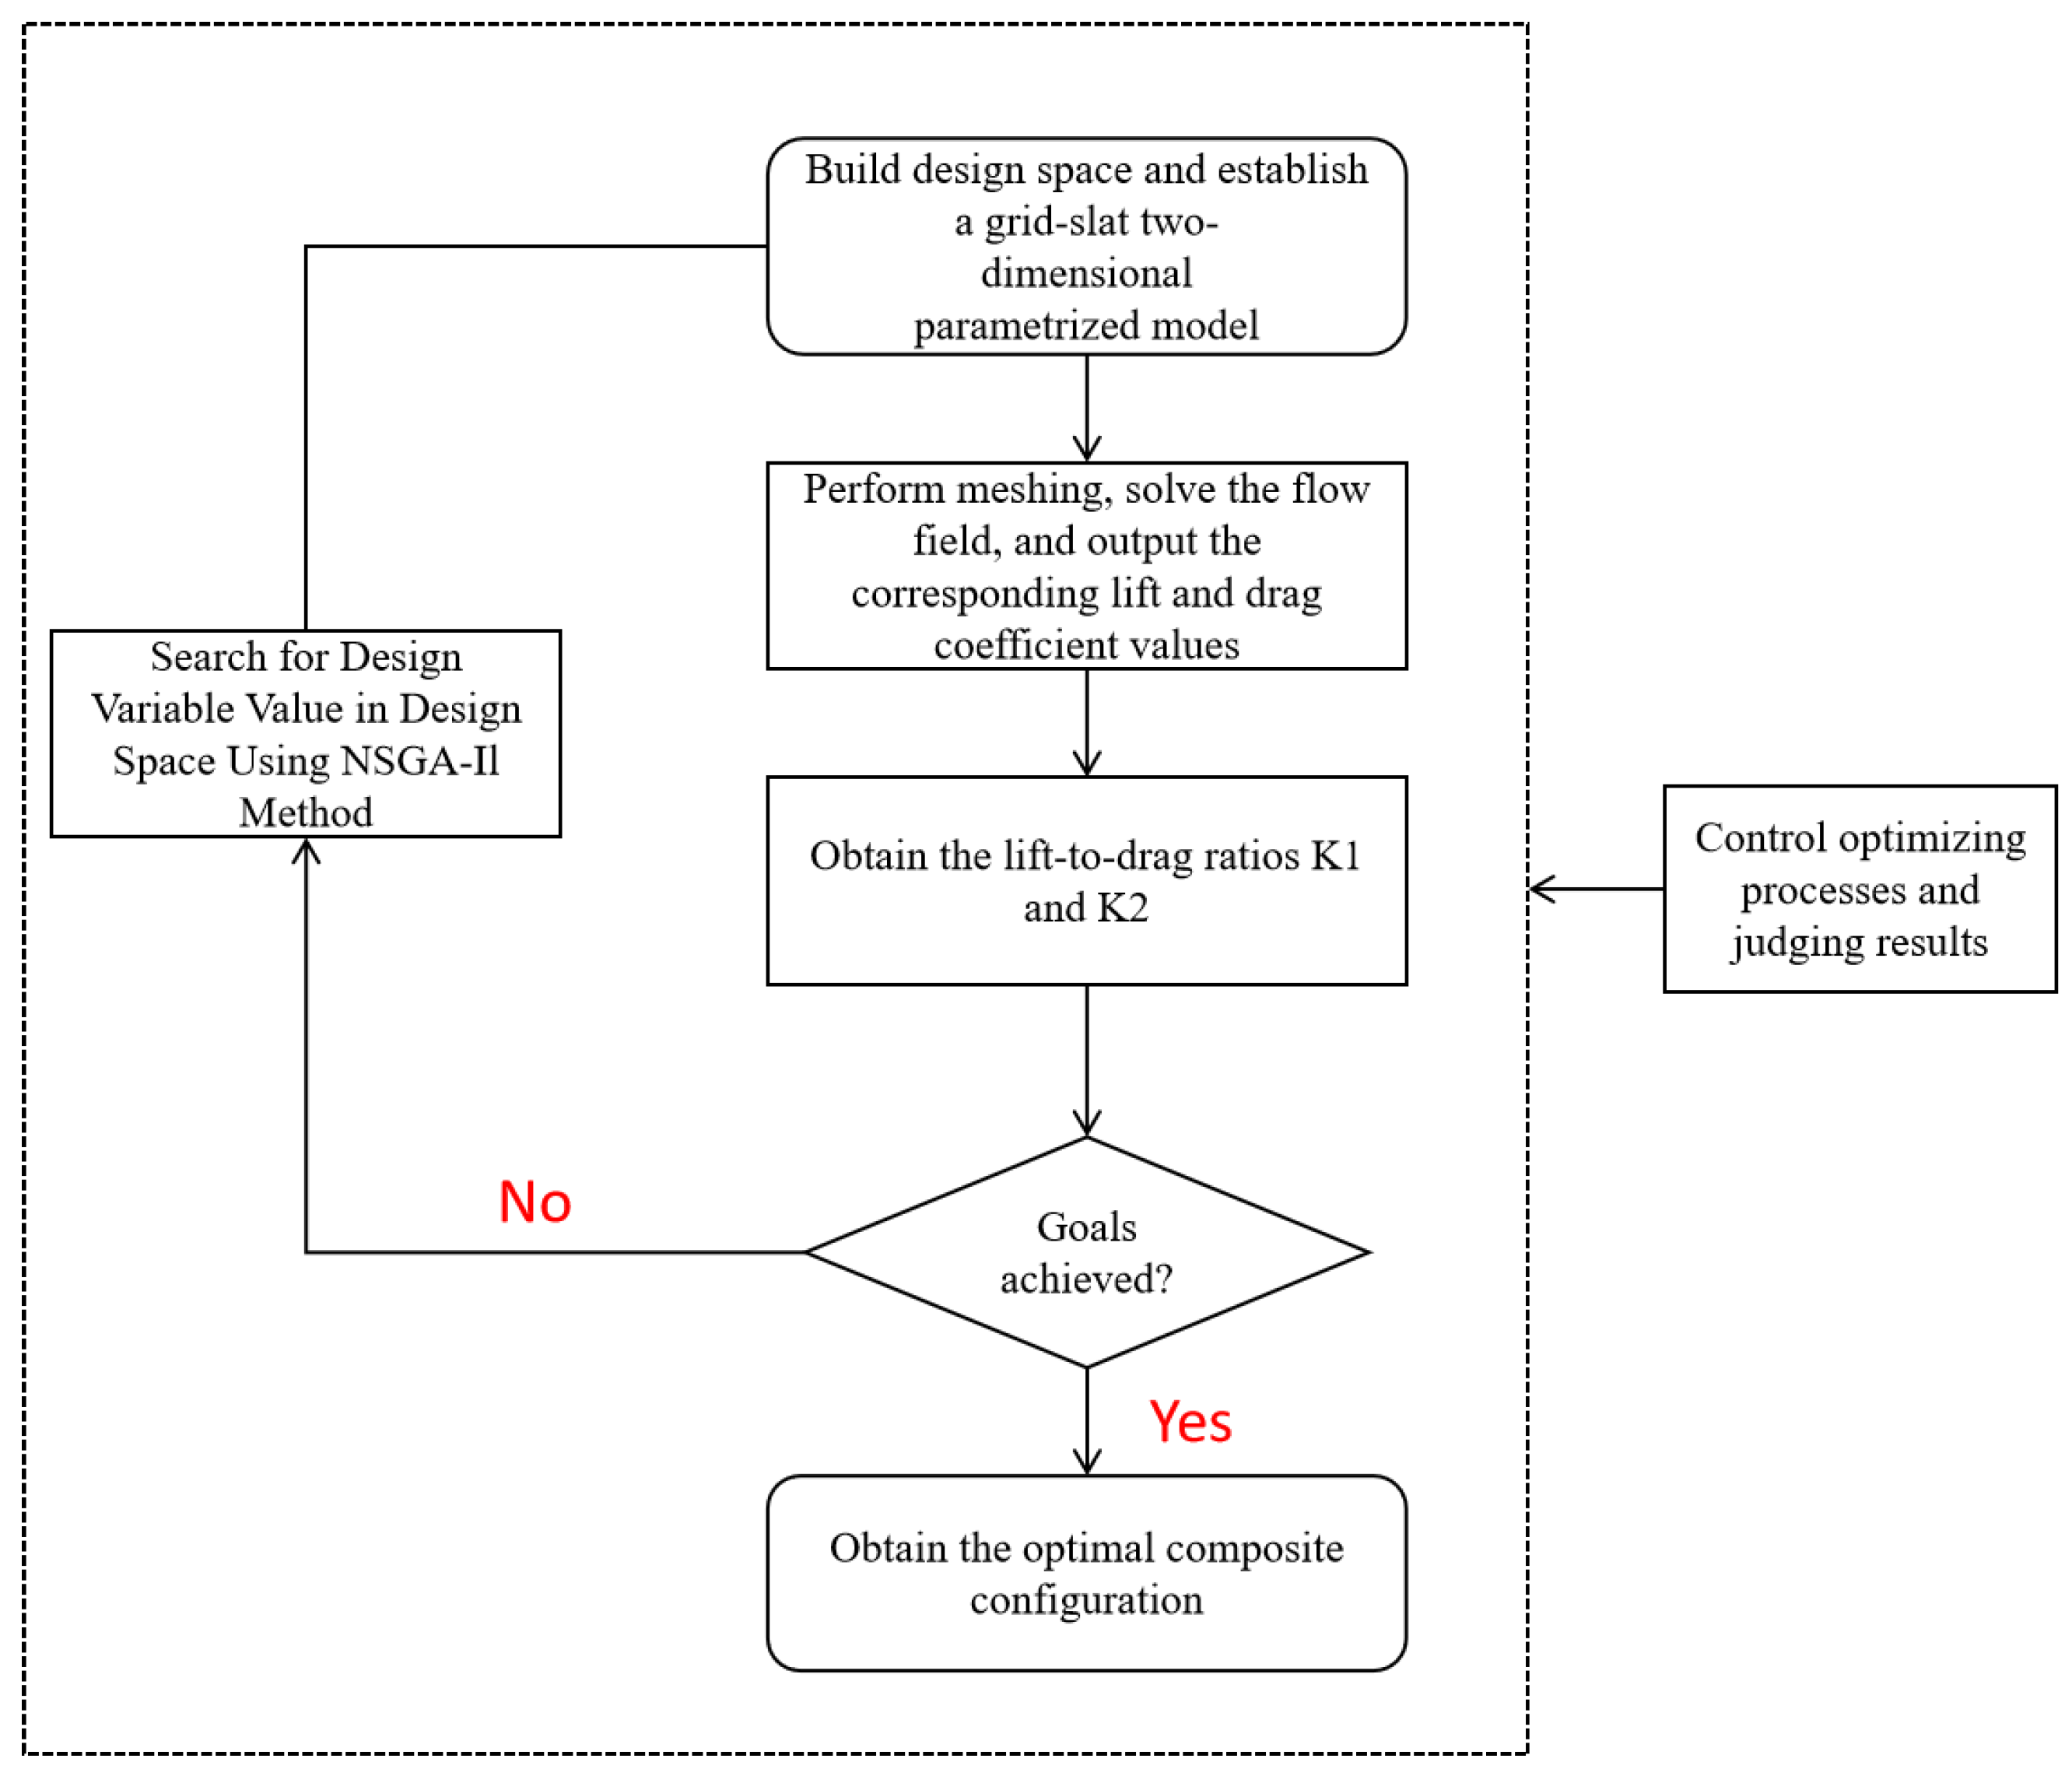
2.3. Optimal Design Methods

A 2D grid-slat blended high-lift device scheme was developed by optimizing the shape design using the constructed conic parametrization method. The reference high-lift configuration is based on the 30P30N multi-segment wing [21,22], which serves as the standard model due to its extensive experimental data. For this simulation, the Fluent Meshing software 2022 was used for mesh division and simulation calculations. The flow field was modeled using the 2D Reynolds-averaged Navier-Stokes (RANS) equations. The turbulence model employed was the SST model [23]. The SST turbulence model utilized a damping function within the vortex viscosity model to simulate the transition process, giving it broad applicability and reliable prediction performance for separation flows involving high-lift configurations.
The results of the 30P30N baseline airfoil were first compared with wind tunnel test data from NASA Langley Research Center to determine subsequent grid generation methods and simulation settings. The simulation calculation conditions were given according to the test conditions, i.e., M a = 0.2 , Re = 9 × 10 6 , angle of attack = 0.17 21 . The momentum and turbulent kinetic energy in the RANS equations are both in the second-order upwind scheme. The leading-edge slats, the main wing, and the trailing-edge flaps all employ a hybrid grid division method with the topology shown in Figure 11. Boundary-layer grids are set at the wall to satisfy the y+ requirement, and the first layer’s grid height is 1.71 × 10⁻⁵. In order to ensure the simulation of flow details in the multi-segment wing flow field, the key regions were grid-refined, and the total number of grids was about 160,000.
To ensure the accuracy of numerical calculations and reduce computational costs, a 30P30N airfoil was used as an example for grid independence verification. Table 1 gives the calculation results of the lift coefficient in different grid division schemes at an angle of attack of 14.73°. As the number of grids increases, the numerical simulation results tend to be stable, and the calculation error between the middle grid and the fine grid is less than 0.04%; the grid can be considered to meet the grid independence requirement, so the middle grid division scheme is adopted for the subsequent calculations.
Figure 12a shows the lift coefficients of the airfoil from three sets of grid calculations in comparison with those from wind tunnel experiments, and it can be seen that the results from the medium and fine grid solutions tend to coincide, with large deviations only near the stall angle of attack. Figure 12c,d shows a comparison of the calculated values of the airfoil surface pressure coefficient for a medium grid at an angle of attack of 16.3° with the experimental values. The pressure coefficient values for the main wing and flaps agree well with the experimental values, and there are some differences in the lower wing surfaces of the slats, but the overall trend is consistent. The reliability of the mesh division method and the numerical simulation method used was demonstrated.
NSGA-Ⅱ, a genetic-algorithm-based multi-objective optimization algorithm, is employed to optimize the two-dimensional grid-slat configuration [24]. There are ten design parameters in the parametrized expression of the grid-slat channel curve configuration, and they are denoted as ratio   A , ratio   B , ratio   E , θ 1 , β 1 , ratio   H , ratio   I , ratio   P , θ 2 , β 2 . The optimization objective includes the lift-to-drag ratio at small angles of attack ( K 1 ) and at high angles of attack ( K 2 ), ensuring the configuration’s suitability across a broad range of angles of attack.
The design condition point was selected based on the typical design conditions of the 30P30N configuration.
The Mach number of the incoming flow is M a = 0.2 .
The Reynolds number is Re = 9 × 10 6 .
The small angle of attack is α 1 = 3.8 , and the high angle of attack is α 2 = 16.3 .
The optimization process is shown in Figure 13.
Step 1: The design space is defined based on variable constraints, and a parametric model is established for the two-dimensional grid-slat configuration.
Step 2: Meshing is performed to compute the flow field using a CFD program, and the corresponding lift and drag coefficient values are obtained.
Step 3: The lift-to-drag ratio K 1 is calculated, and it is input into the optimization program.
Step 4: The previous steps are repeated to obtain K 2 .
Step 5: The NSGA-Ⅱ method is employed to search for optimal design variable values within the design space, and the previous steps are repeated for the final optimization output.
Four design spaces are defined based on the grid channel’s design parameters, focusing on the characteristics of the curvature of its walls, as depicted in Figure 14. These spaces include configurations where (1) both the upper and lower curves are convex, (2) the upper curve is convex and the lower curve is concave (reflecting channel expansion and contraction), (3) the upper curve is concave and the lower curve is convex (representing channel contraction-expansion), and (4) both the upper and lower curves are concave. The parameter range for each design space should be maximized to achieve a comprehensive solution set. The parameter values of design space 1 are listed in Table 2. Adjusting the four parameters θ 1 , β 1 , θ 2 , β 2 of the entrance and exit angles allows for altering the convexity or concavity of the slot curve shape. Thus, the parameter ranges for design space 2 are θ 2 , 0 45 , β 2 , and 45 90 . The ranges in the parameter values of design space 3 are θ 1 , 0 45 , β 1 , and 45 90 . The differences in the parameter values of design space 4 are θ 1 , 0 45 , β 1 , 45 90 , θ 2 , 0 45 , β 2 , and 45 90 .
Using the aforementioned steps, an optimization platform is constructed to perform multi-objective optimization for the grid-slat fusion configuration. Given a design space, a solution set in that design space is obtained using the optimization platform constructed with the NSGA-Ⅱ method for the multi-objective optimization of the design, in which there is no solution to make the lift-to-drag ratio of the two-dimensional composite configuration superior to that of the initial configuration at a small angle of attack (α = 3.8° and α = 16.3°). Considering that the composite configuration is mainly applied to the high-angle-of-attack states of take-off and landing, the lift-to-drag ratio at α = 16.3° is mainly increased, appropriately sacrificing the lift-to-drag ratio at α = 3.8 °. The optimized Pareto front is obtained. The utopian solution is identified as the optimal solution for this study. The optimal solution considers the average improvement of the two optimization objectives and aligns with the original intention of the design scheme in this study. Figure 15 illustrates the two-dimensional composite configuration corresponding to this solution, and the design parameters are detailed in Table 3.

3. Results

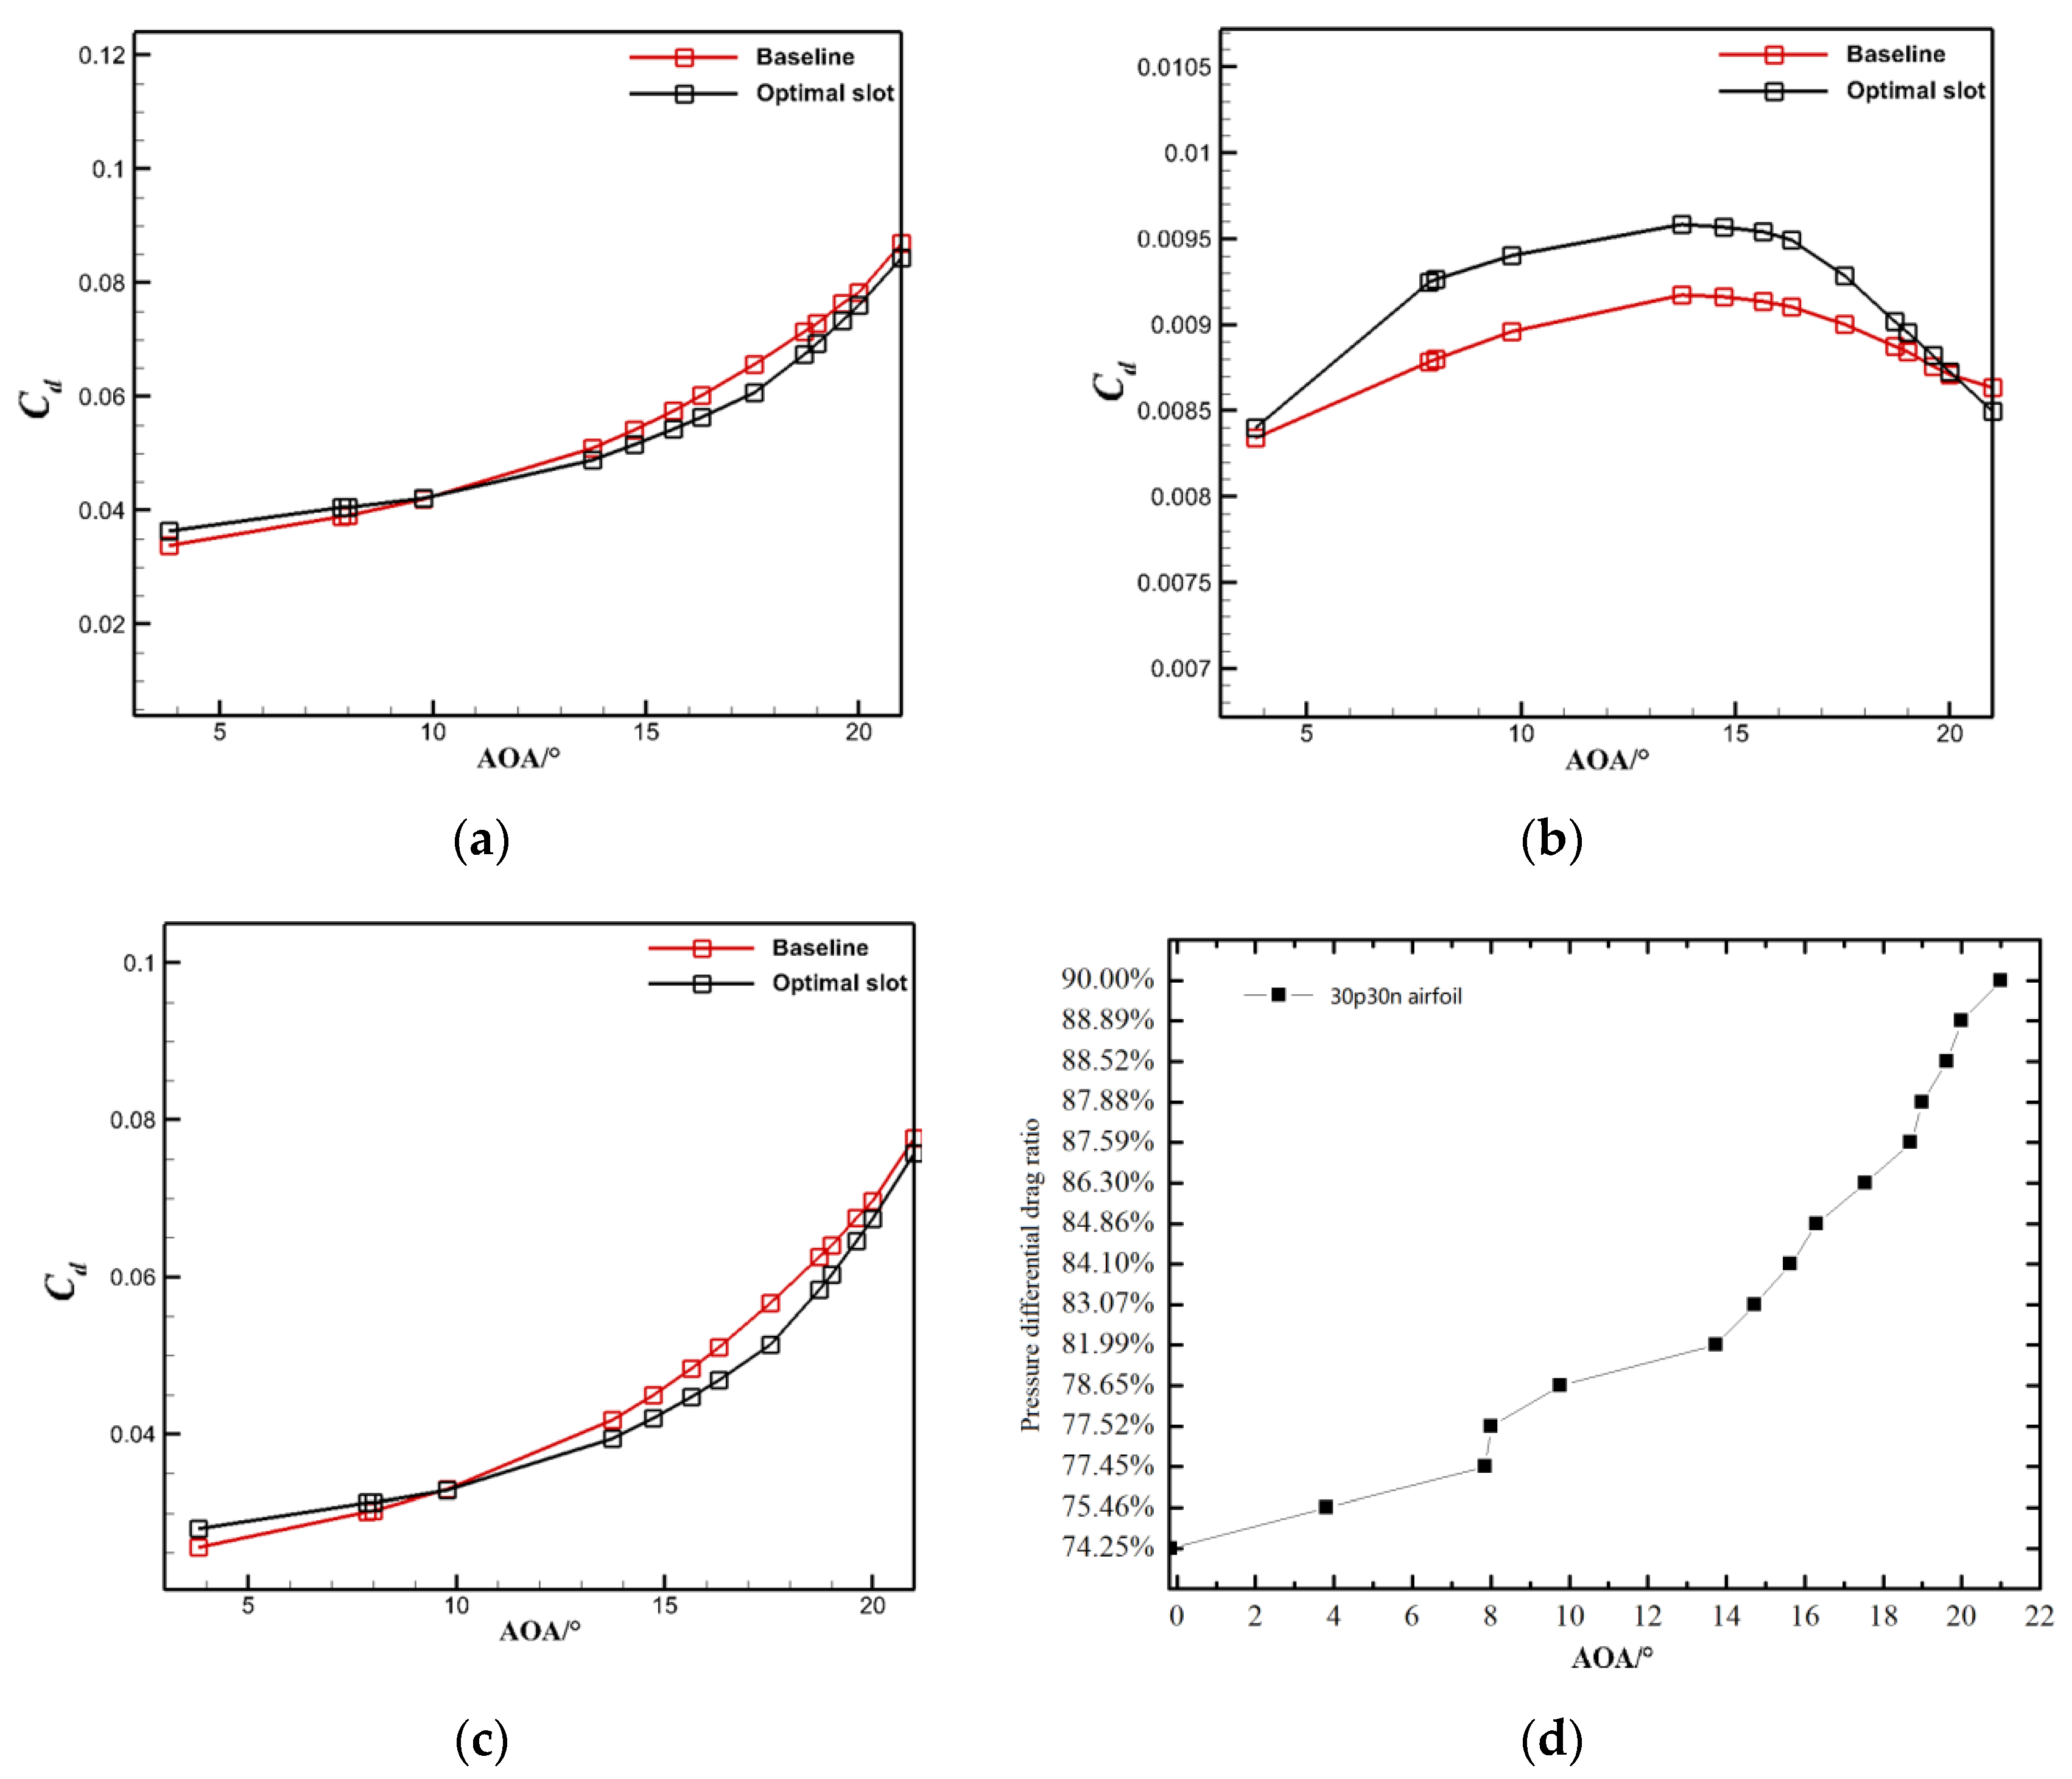
3.1. Analysis of the Increased Lift Efficiency of the Grid-Slat Fusion Configuration

A comparative analysis of aerodynamic characteristics between the optimized grid-slat lifting device and the original 30P30N airfoil in free space was conducted, and the improvement in the lift-to-drag performance of each configuration was analyzed. The flow parameters considered are as follows: the Mach number M a = 0.2 , the Reynolds number Re = 9 × 10 6 , and an angle of attack of 3.8 22.59 . Figure 16 depicts the curve of the calculated lift-to-drag ratio. At angles of attack exceeding 10 degrees, the lift-to-drag ratio of the grid-slat fusion configuration shows significant improvement over the original configuration. Since the primary objective of this configuration’s design is to enhance lift-to-drag characteristics at high angles of attack during take-off and landing, the simulation results verify the effectiveness of this design approach.
Figure 17 illustrates the lift coefficient curve, demonstrating a substantial increase in lift for slats at high angles of attack due to the lift surface properties of the grid channels. Figure 18 depicts the pressure distribution around the slat and the main wing at an angle of attack of 16.3°. Following the grid’s influence, the airflow at the main wing’s leading edge becomes disturbed, resulting in an enlarged negative pressure area. Figure 19a illustrates the drag breakdown. At angles of attack below 10°, the optimized airfoil shows a slightly higher drag coefficient than that of the baseline airfoil. At small angles of attack, friction drag predominates in the total drag, and the additional channels further augment this friction drag. However, at angles of attack exceeding 10°, the newly introduced open channels alter the airflow pattern ahead of the main wing, resulting in a significant reduction in pressure drag, as illustrated in Figure 19c. Here, pressure drag accounts for more than 80% of the total drag, leading to an overall reduction in drag for the grid-slat fusion configuration compared with the baseline airfoil. Overall, the integration of grid channels on the slats significantly affects both the lift generated by the slats themselves and the aerodynamic disturbance to the main wing across a broad spectrum of angles of attack.

3.2. Applied Research on the Grid-Fusion Device in a Wavy Environment

Section 3.1 verified the aerodynamic characteristics of the two-dimensional lift device configuration in free space. The purpose of this study is to investigate a lift device designed for near-water take-off and landing, as well as flap-splash scenarios. Therefore, in Section 3.2, wavy conditions are established to further investigate whether the device maintains its aerodynamic enhancement performance in this environment.

3.2.1. Verification of the Overwater Lift Augmentation of the Two-Dimensional Configuration

The aerodynamic response characteristics of both the baseline and the grid-slat fusion high-lift configuration in a wavy environment are examined by simulating an actual seaplane’s take-off environment and verifying the aerodynamic efficiency of the grid channel. A fifth-order Stokes wave is generated at the open channel boundary, representing a classical waveform that is extensively utilized in wave effect studies. The equation for the wave surface height is as follows [25].
k η = λ cos ( k x ω t ) + ( λ 2 B 22 + λ 4 B 24 ) cos 2 ( k x ω t ) + ( λ 3 B 33 + λ 5 B 35 ) cos 3 ( k x ω t ) + λ 4 B 44 cos 4 ( k x ω t ) + λ 5 B 55 cos 5 ( k x ω t )
The coefficient B i j in Equation (2) is a function of the relative depth d / L , which can be obtained by looking at the Stokes table of fifth-order wave coefficients; L represents the wavelength, and k represents the wave number. λ is determined using Equation (3).
π H d = 1 d L λ + λ 3 B 33 + λ 5 B 35 + B 55
The free surface was determined by utilizing the classical volume of fluid (VOF) method [26], which is known for its simplicity and clarity; here, the boundary was defined by calculating the phase volume of the grid. Consequently, the grid resolution at the gas-liquid interface demands high precision. This study employs a hybrid approach combining unstructured and prismatic meshes to discretize the computational domain, with mesh refinement being conducted in the waterline region. The inlet and outlet of the computational domain are positioned 30 chord lengths ( c ) away from the simulated airfoil, with the upper boundary at 20 c and the lower boundary at a depth d from the surface. The inlet employs a velocity inlet boundary condition, while the outlet utilizes a pressure outlet boundary condition. The upper and lower boundaries are both set as walls, with the velocity inlet being specified separately for air and water and the pressure outlet being defined separately for air and water. Figure 20 illustrates the computational mesh depicting the boundary conditions.
The calculation results remain consistent with those that were previously stated, featuring a wave height of 1.55 m and an angle of attack of 16°. Unsteady calculations are employed to determine the lift-to-drag coefficient once the output stabilizes over two cycles. Figure 21, Figure 22 and Figure 23 illustrate the lift and drag coefficients for both the baseline 30P30N configuration and the grid-slat fusion high-lift device.
The two-dimensional grid-slat fusion configuration can enhance the lift characteristics, particularly in the presence of wave surface disturbances. By separately evaluating the lift coefficient of the leading-edge slat integrated with the grid channel, as depicted in Figure 22, we observe an enhancement in the lift coefficient. This enhancement aligns with the characteristics of multiple lift surfaces generated by the grid, which is consistent with the findings in Section 3.1 of this article. However, due to the near-Earth effect, when a wing approaches the ground or a water surface, unlike a common monoplane, the lift effect on a multi-segment wing primarily manifests as a venturi effect, leading to a negative ground effect [27].
The multi-segment wing experiences a simultaneous reduction in both lift and drag coefficients. As a result, the average lift coefficient of the two-dimensional grid-slat composite configuration is approximately 3.2, which is lower than the free space lift-to-drag ratio of 4.04. From the perspective of the drag characteristics, integrating grid channels on the slot fins decreases the drag coefficient of the 30P30N airfoil profile. Specifically, the mean drag coefficient of the two-dimensional grid-slat composite configuration is approximately 0.03, contrasting with the value of 0.056 calculated in Section 3.1.
According to the lift-to-drag ratio curve shown in Figure 24, the maximum lift-to-drag ratio of the two-dimensional grid-slat composite configuration increases significantly during periods with a wavy water surface, and it has a larger amplitude of change than that of the baseline 30P30N airfoil. Overall, despite the aircraft being susceptible to ground effects from the water surface when flying near waves, the combination of the slat lift configuration and grid fusion still plays a significant role in achieving high lift and reducing drag.

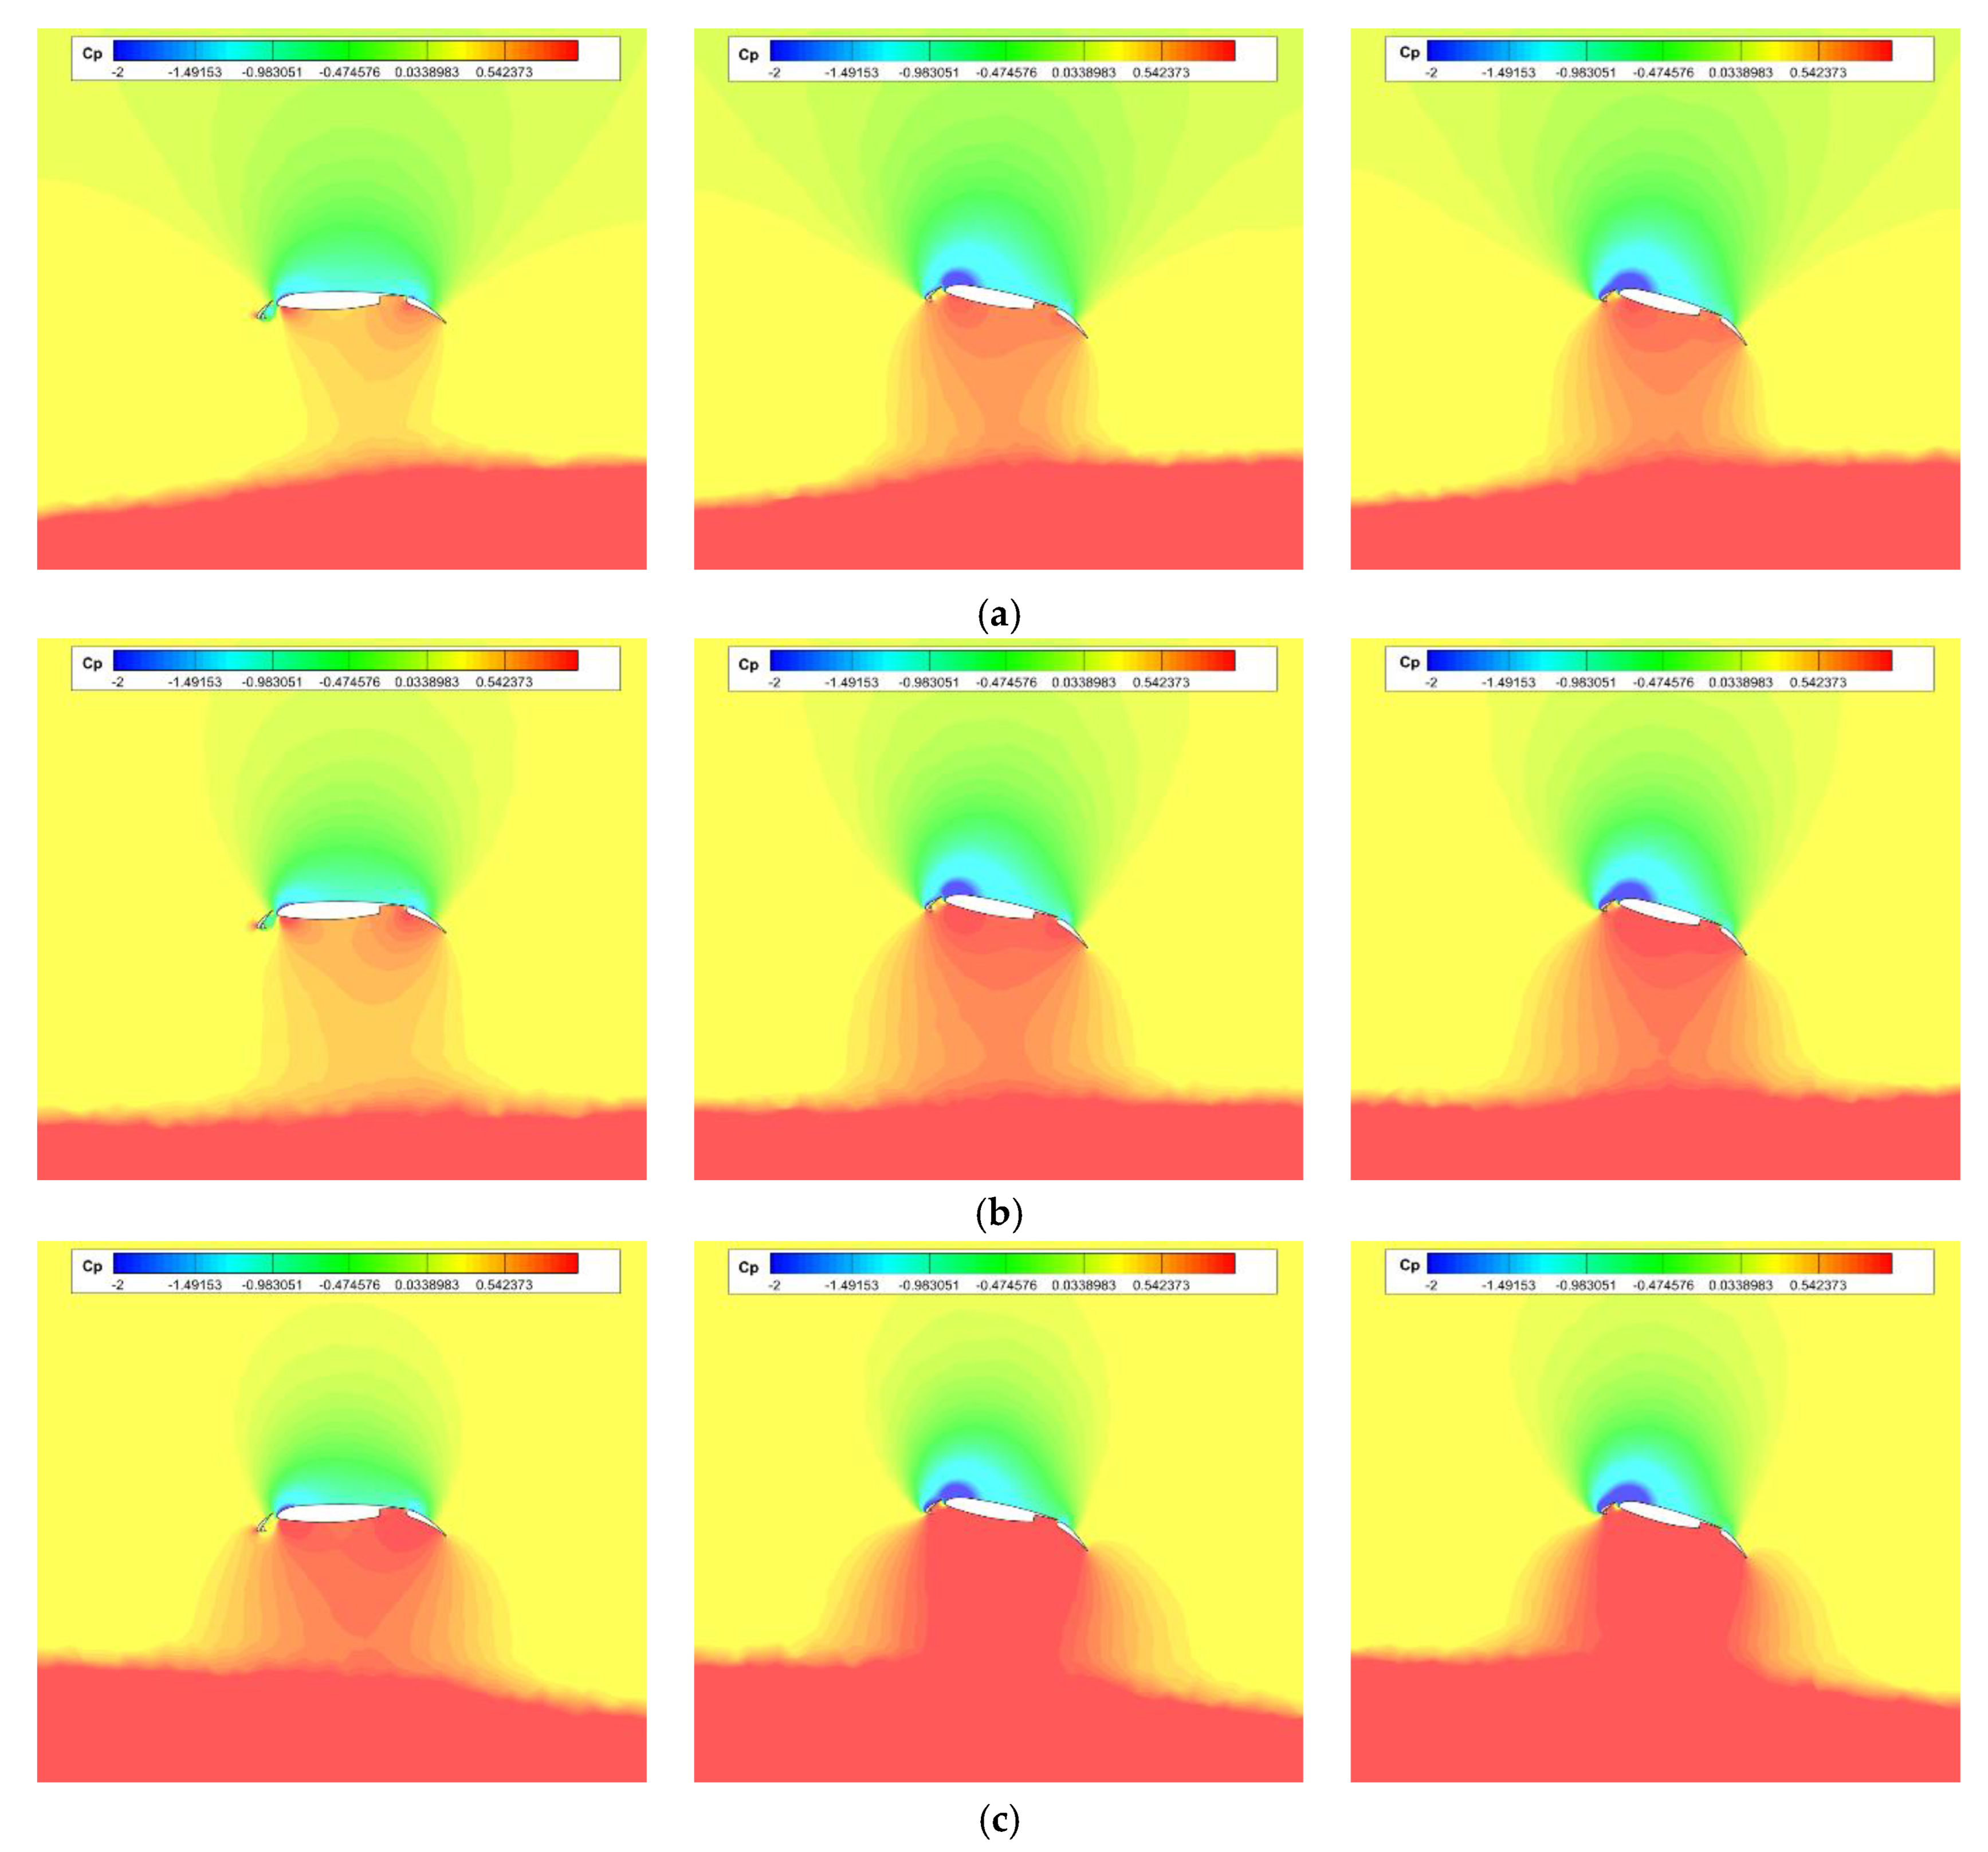
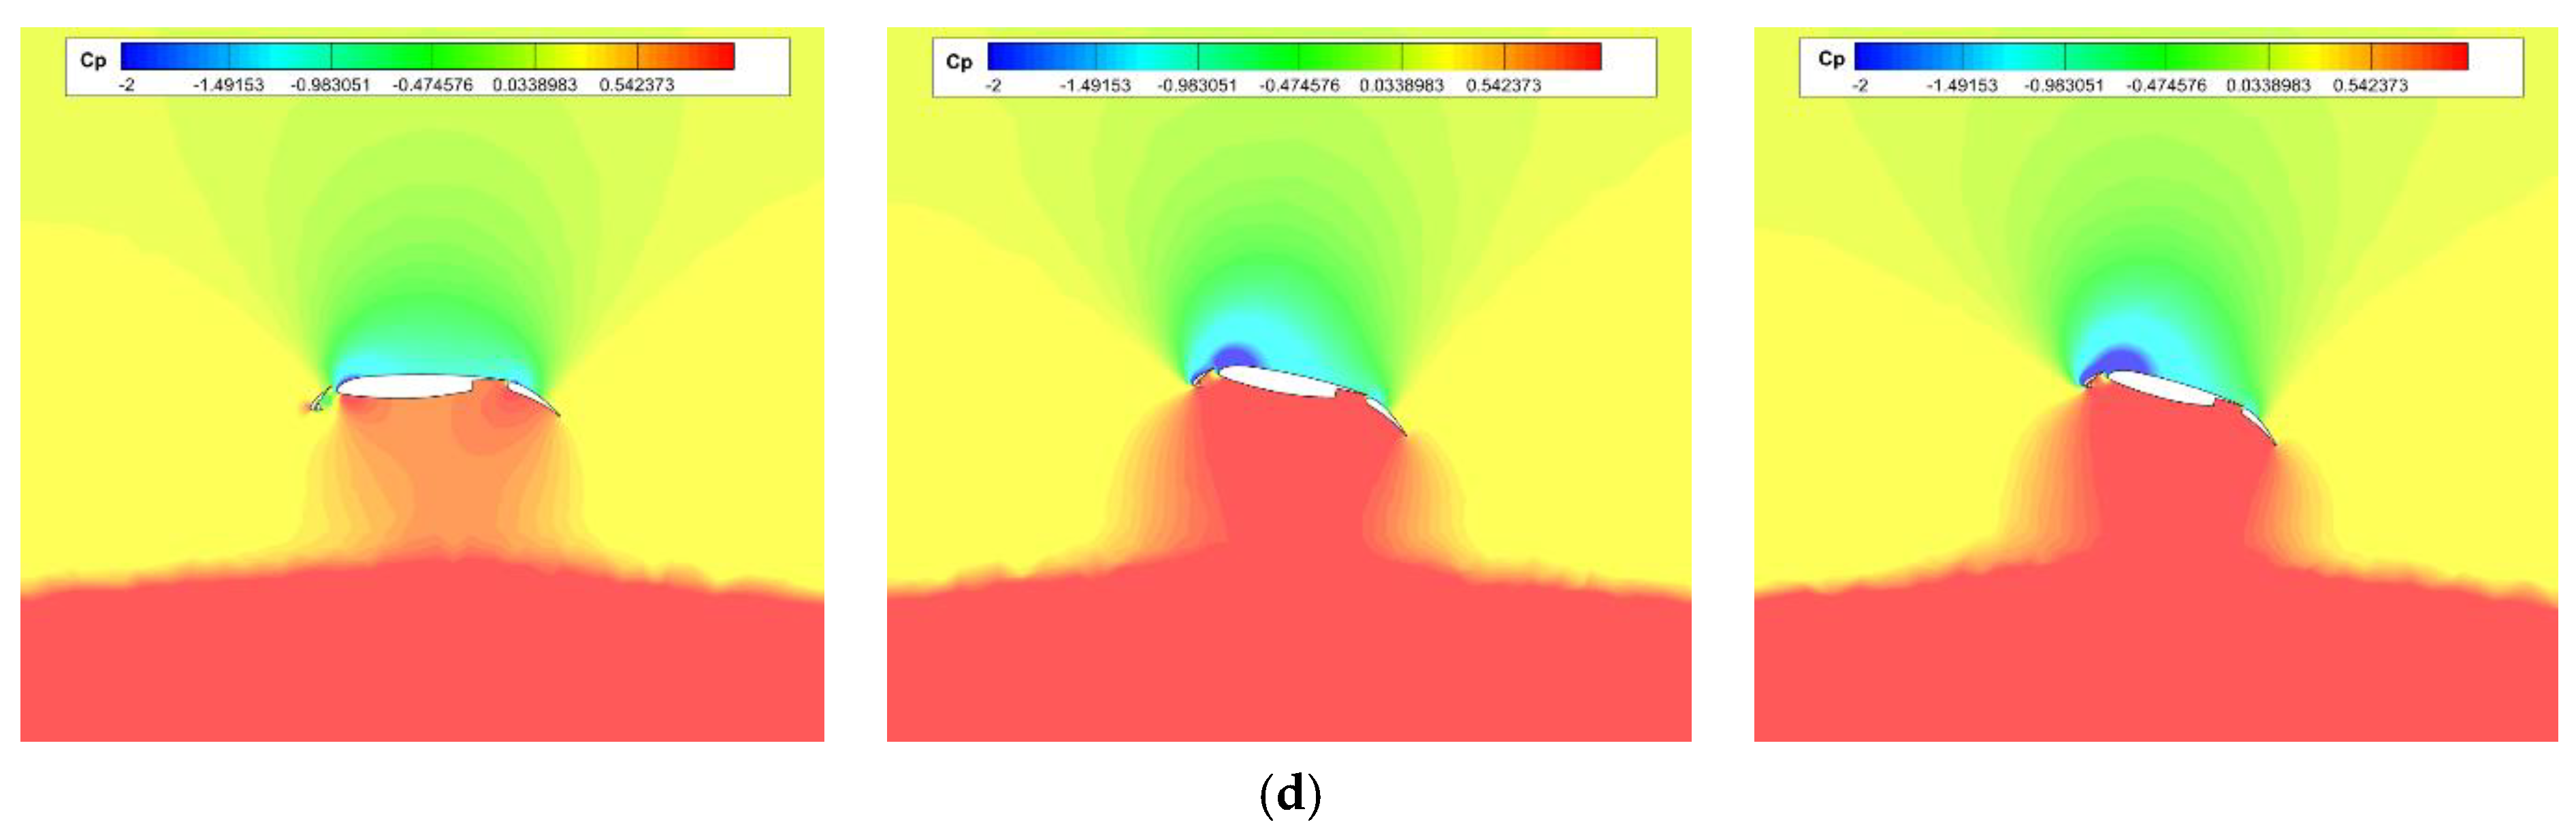
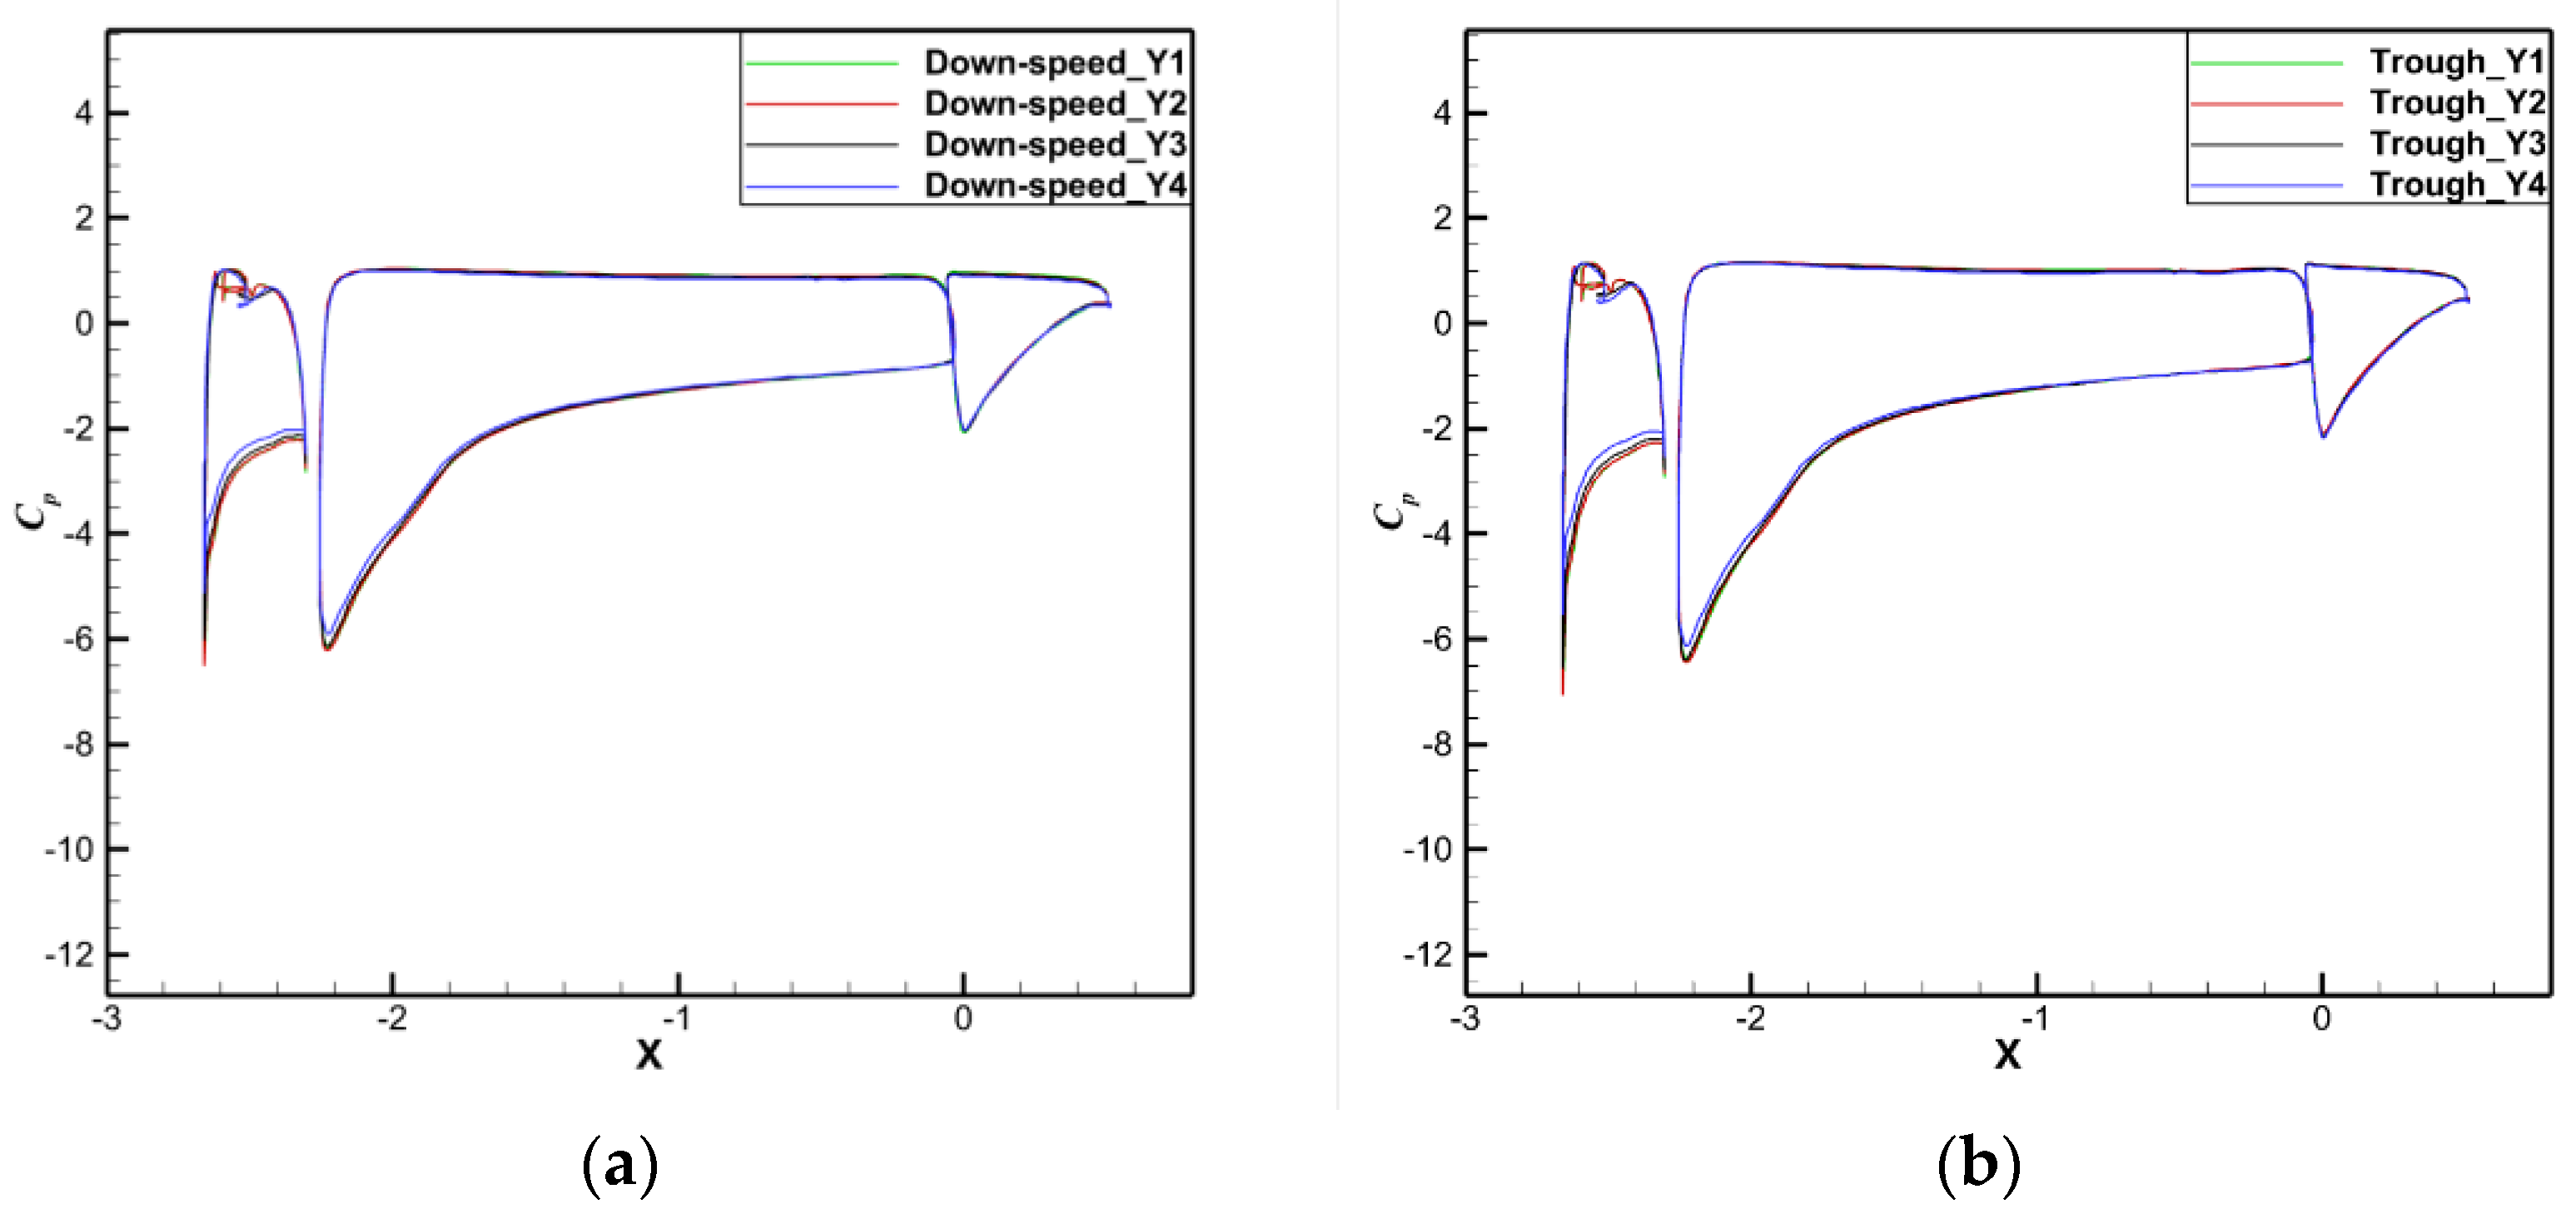
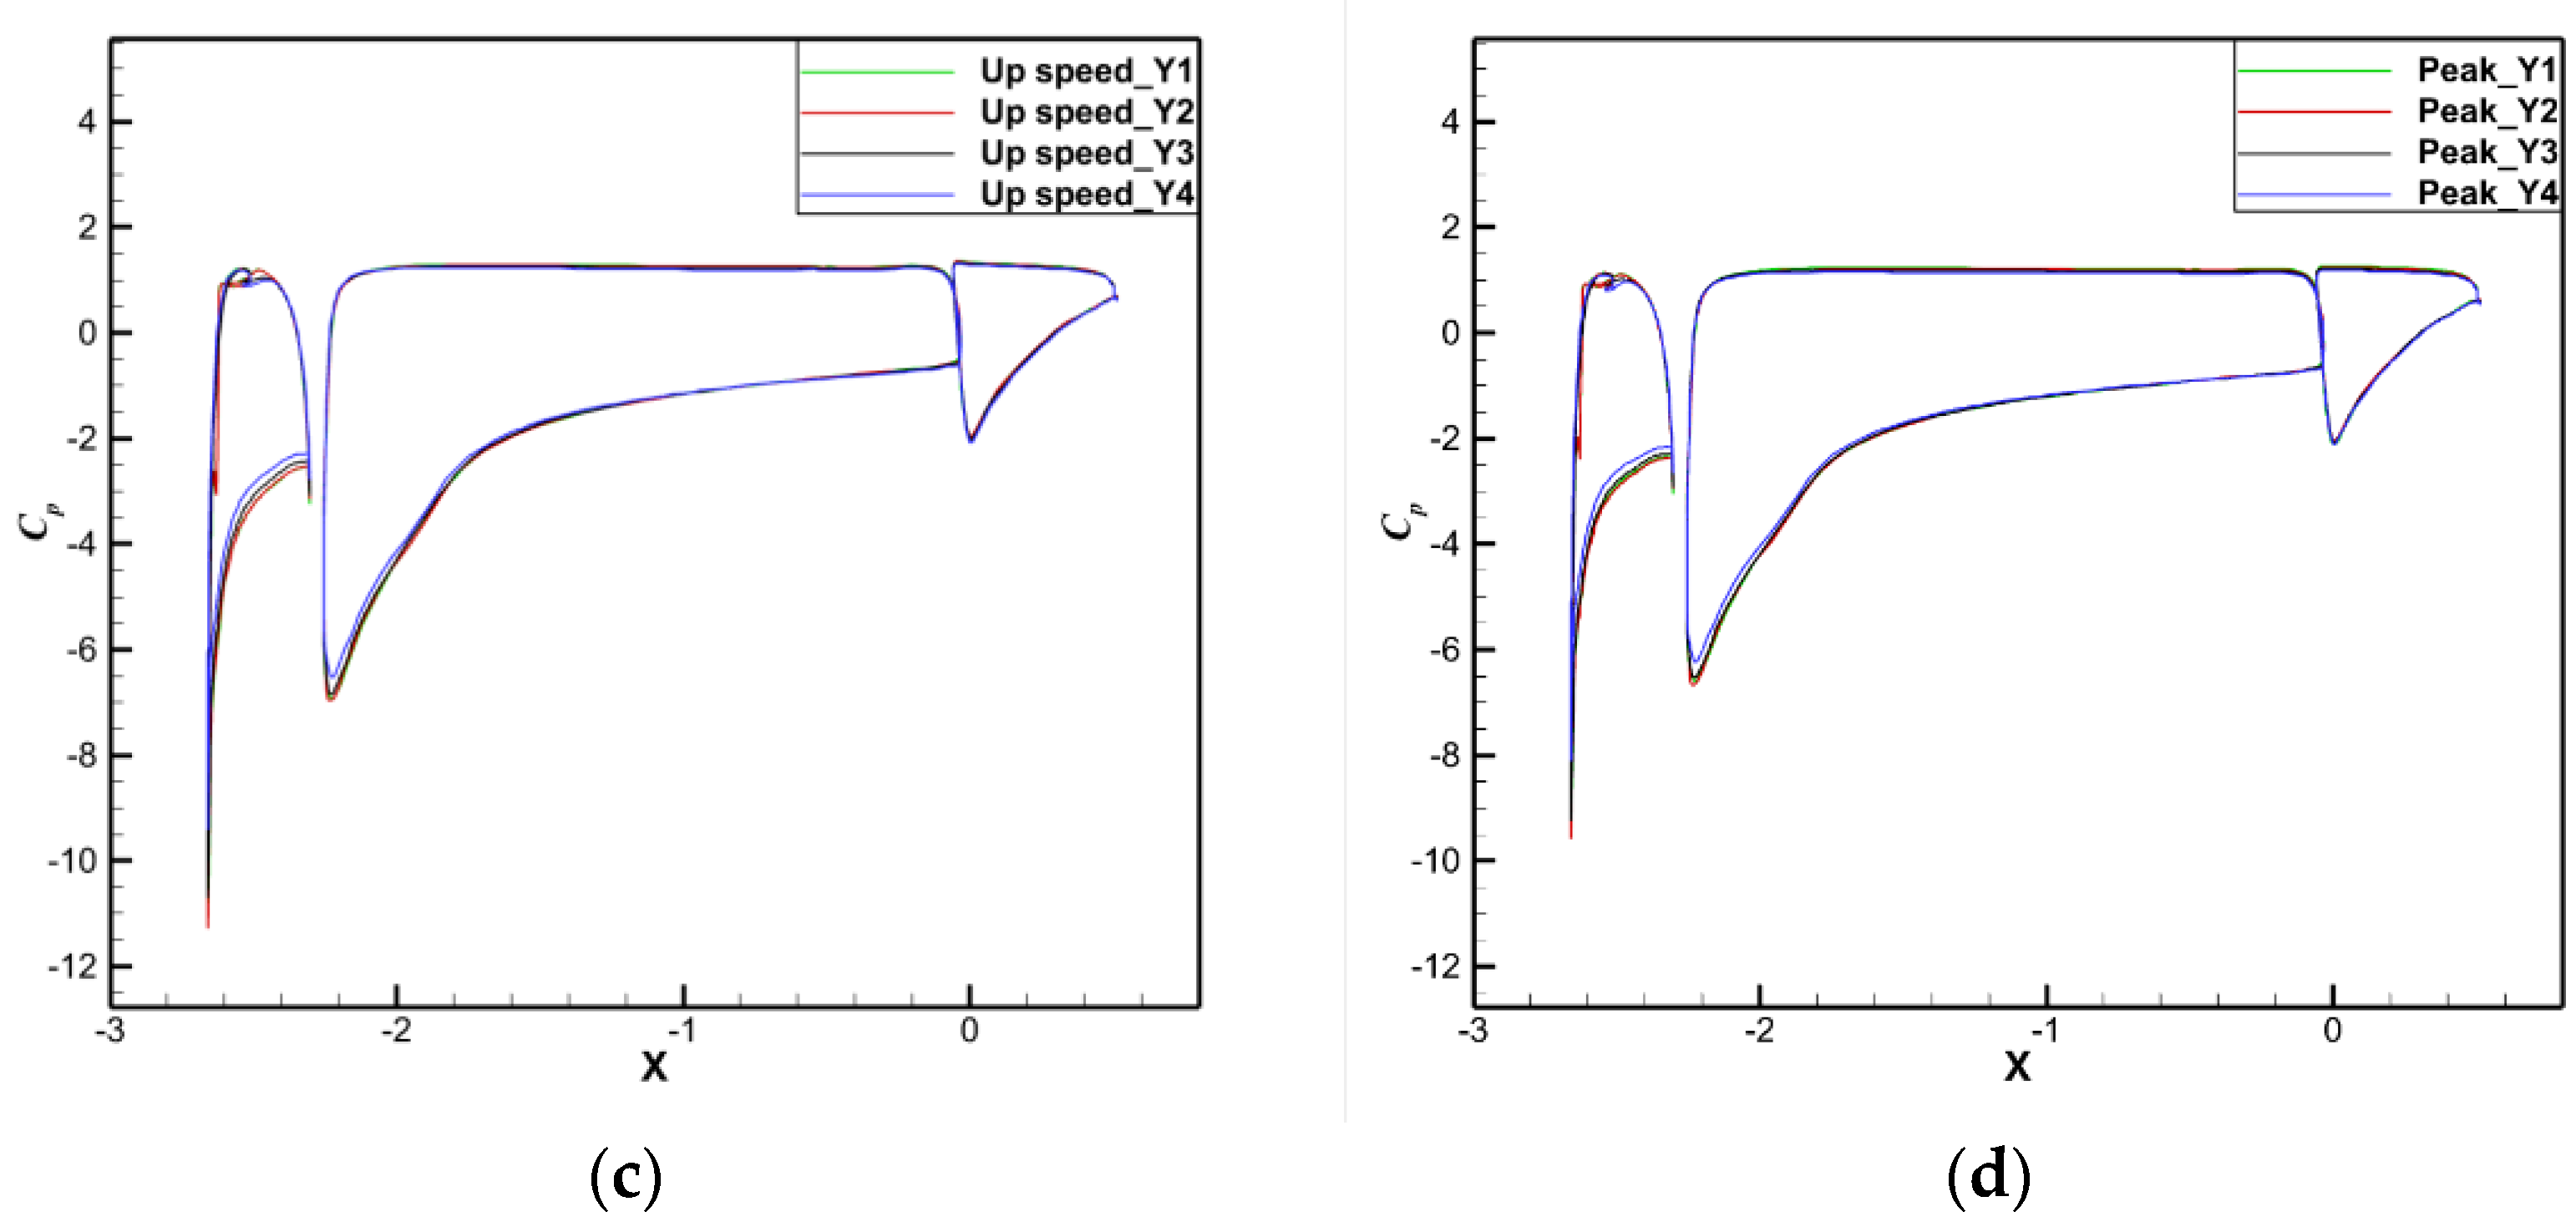
3.2.2. Verification of the Overwater Lift Augmentation of the Three-Dimensional Configuration

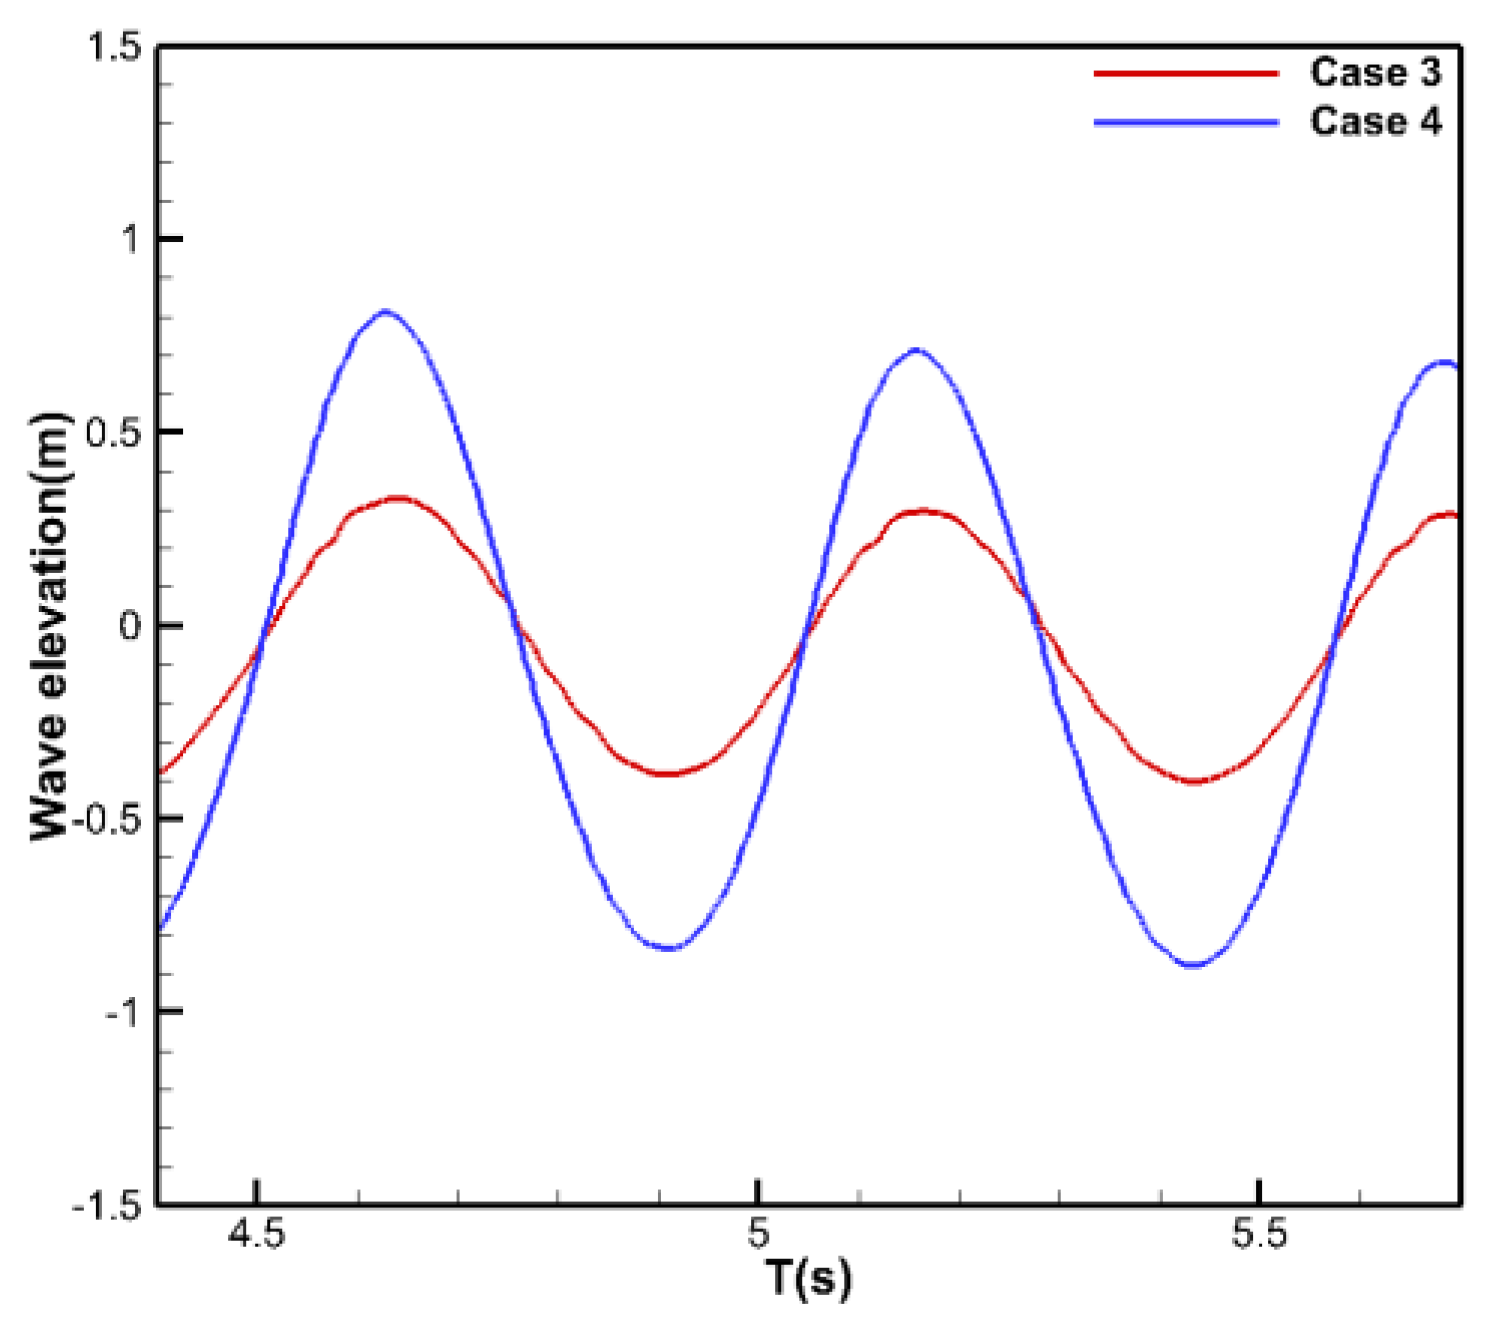
  • Calculation of different wave heights in a three-dimensional composite two-phase flow.
This section involves simulating the flight of a three-dimensional grid-slat composite configuration above a wavy water surface using full-model calculations. We first scaled the aerodynamic chord of the 30P30N airfoil to 3.3 m and then took an aspect ratio of 12 to stretch and obtain a straight wing. After analyzing the effect of the spanwise position and slot width parameters on the aerodynamic characteristics of the three-dimensional composite configuration, it can be concluded that the effect of internal slotting is better, and the aerodynamic characteristics of the advantages and disadvantages do not increase with the slotted width. Finally, we optimized a three-dimensional grid-slat composite configuration with an average aerodynamic chord of 3.3 m, a span of 39.6 m ( l ), and an inner segment slotting of 10.68 m for simulation calculations. The computational domain grid was divided using the commercial Fluent Meshing software 2022. The entrance of the computing domain was positioned at five times the model span ( l ) from the wing, while the exit was also 5 l away from the wing. The side boundary was set 3 l from the wing, with both the upper and lower boundaries being positioned at 3 l from the wing and at the water depth ( d ) from the surface, respectively. The boundary conditions included a velocity inlet at the entrance, a pressure outlet at the exit, and walls at the side boundaries. The mesh type employed was polyhedral, totaling approximately 14.15 million grids. Figure 25 illustrates these computational boundary conditions and provides a diagram of the computational domain grids.
The specific calculation conditions are shown in Table 4. The calculated angle of attack ranges from 0° to 16° (the specific calculated angles of attack are 0°, 12°, and 16°).
After achieving stable calculations, the lift and drag coefficients in two cycles were compared, and their fitting curves are depicted. At the two wave heights shown in Figure 26, the lift coefficient and drag coefficients shown in Figure 27 and Figure 28 at each angle of attack exhibit notable unsteady characteristics, displaying periodic changes akin to waveforms due to the ground effect of the waves. However, unlike in the 2D scenario, the changes in the phase angle of the lift and drag coefficients in the 3D calculation are inconsistent, differing by half a cycle.
The phase angle of the lift coefficient corresponds to that of the wave height, while the phase angle of the drag coefficient lags behind the wave height by half a cycle. For the same angle of attack, the amplitudes of the lift and drag coefficients rise with the wave height, with the mean value of the lift coefficient increasing and the mean value of the drag coefficient remaining nearly unchanged.
Figure 29 depicts a comparison of the calculated lift-to-drag ratio results at each angle of attack. The phase angle of the change in the lift-to-drag ratio is delayed compared with the wave height change and corresponds to the periodic change in the lift coefficient. However, unlike the increase in the lift and drag coefficients as the angle of attack increases, the lift-to-drag ratio of the wing decreases with increasing angle of attack, with the maximum lift-to-drag ratio being obtained at an angle of attack of 5°. During the wave runup stage, the wing’s relative height decreases, leading to an increase in the lift-to-drag ratio and enhanced aerodynamic performance. Conversely, during the wave descent stage, the lift-to-drag ratio decreases, resulting in weakened aerodynamic performance. The maximum lift-to-drag ratio (minimum drag) is achieved at the peak (trough) position.
2.
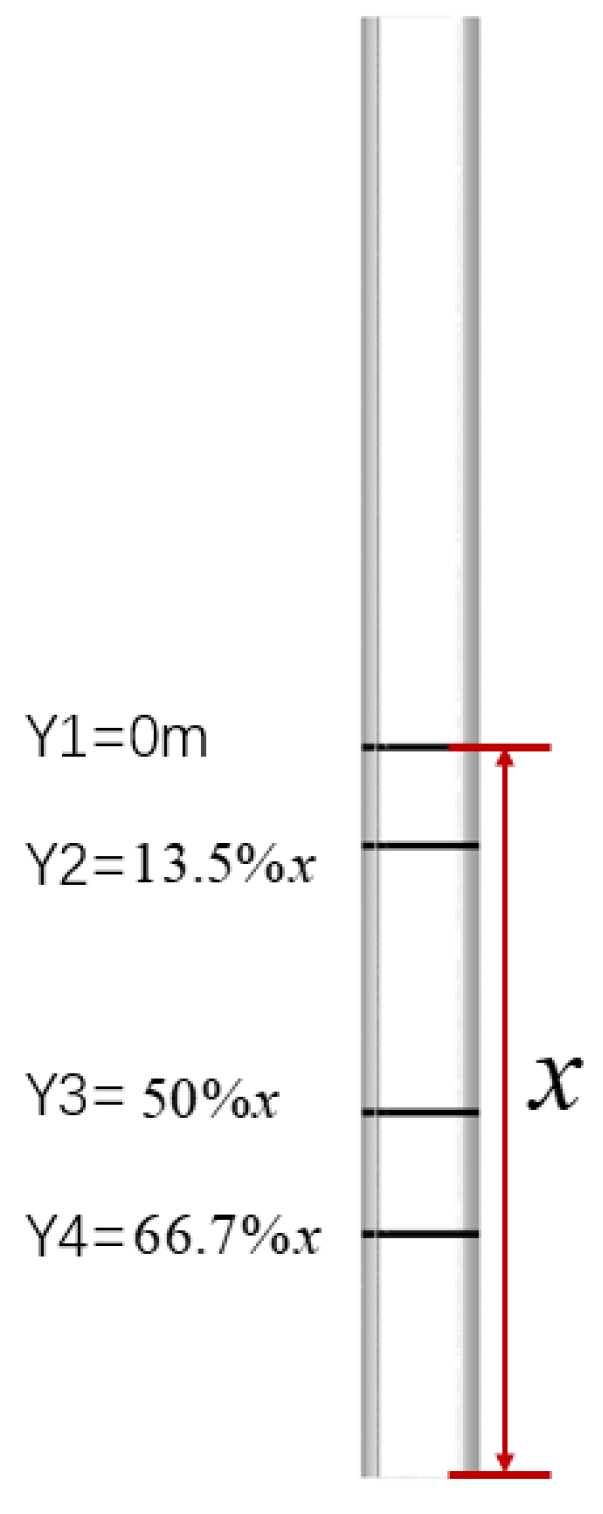
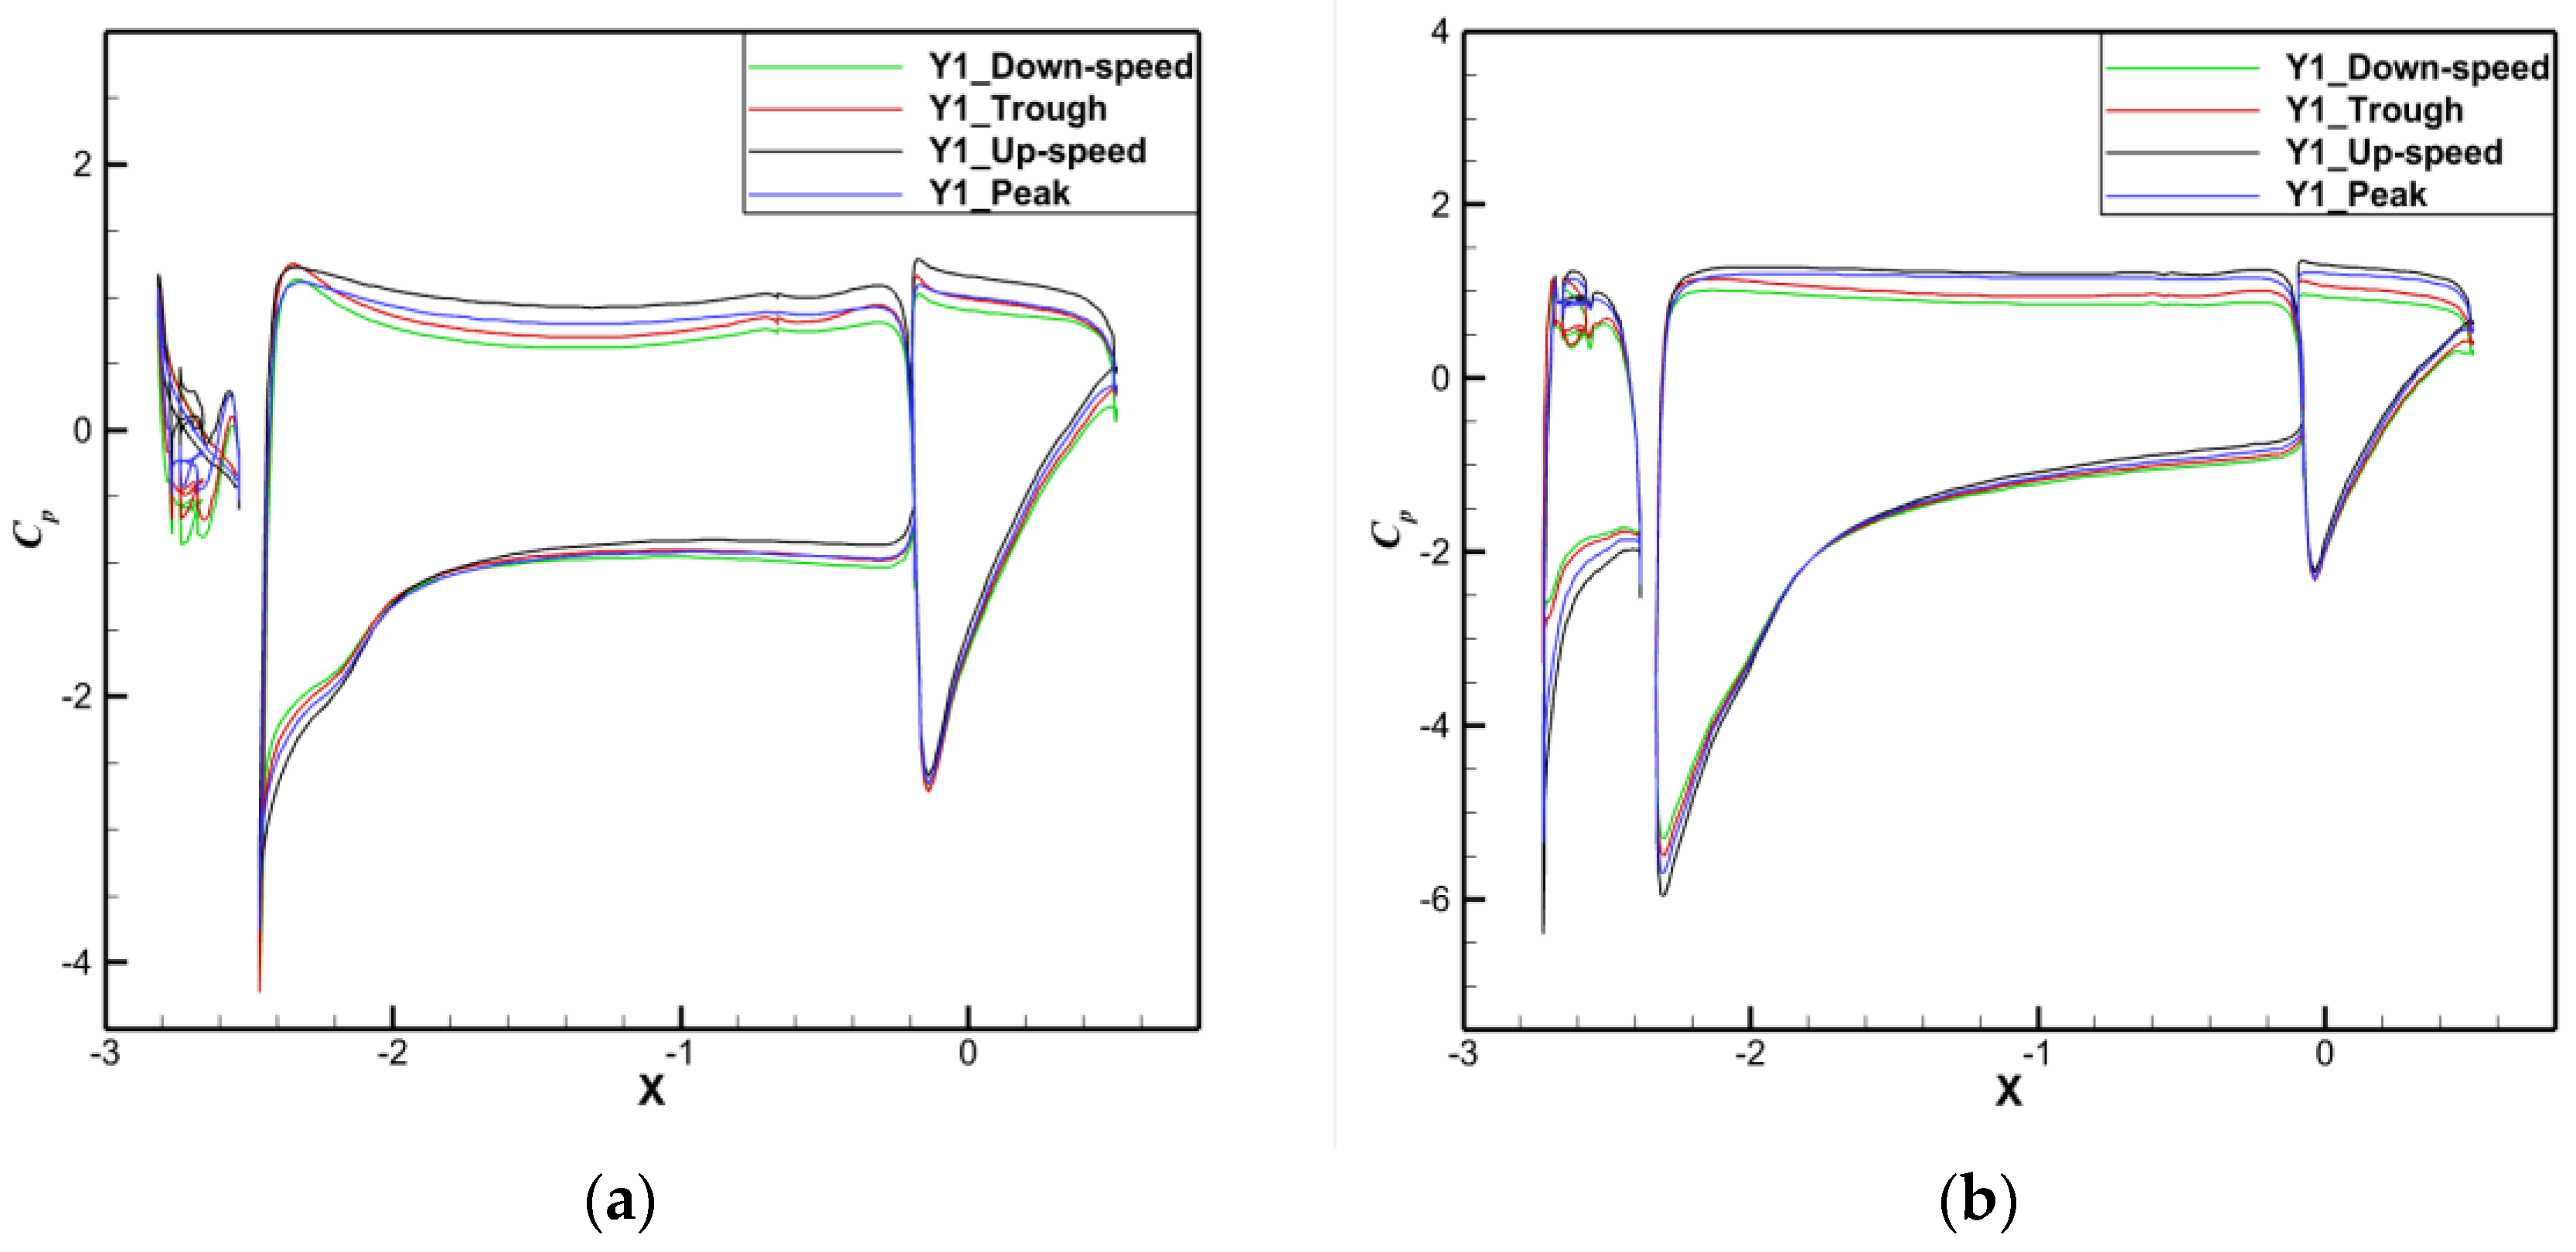
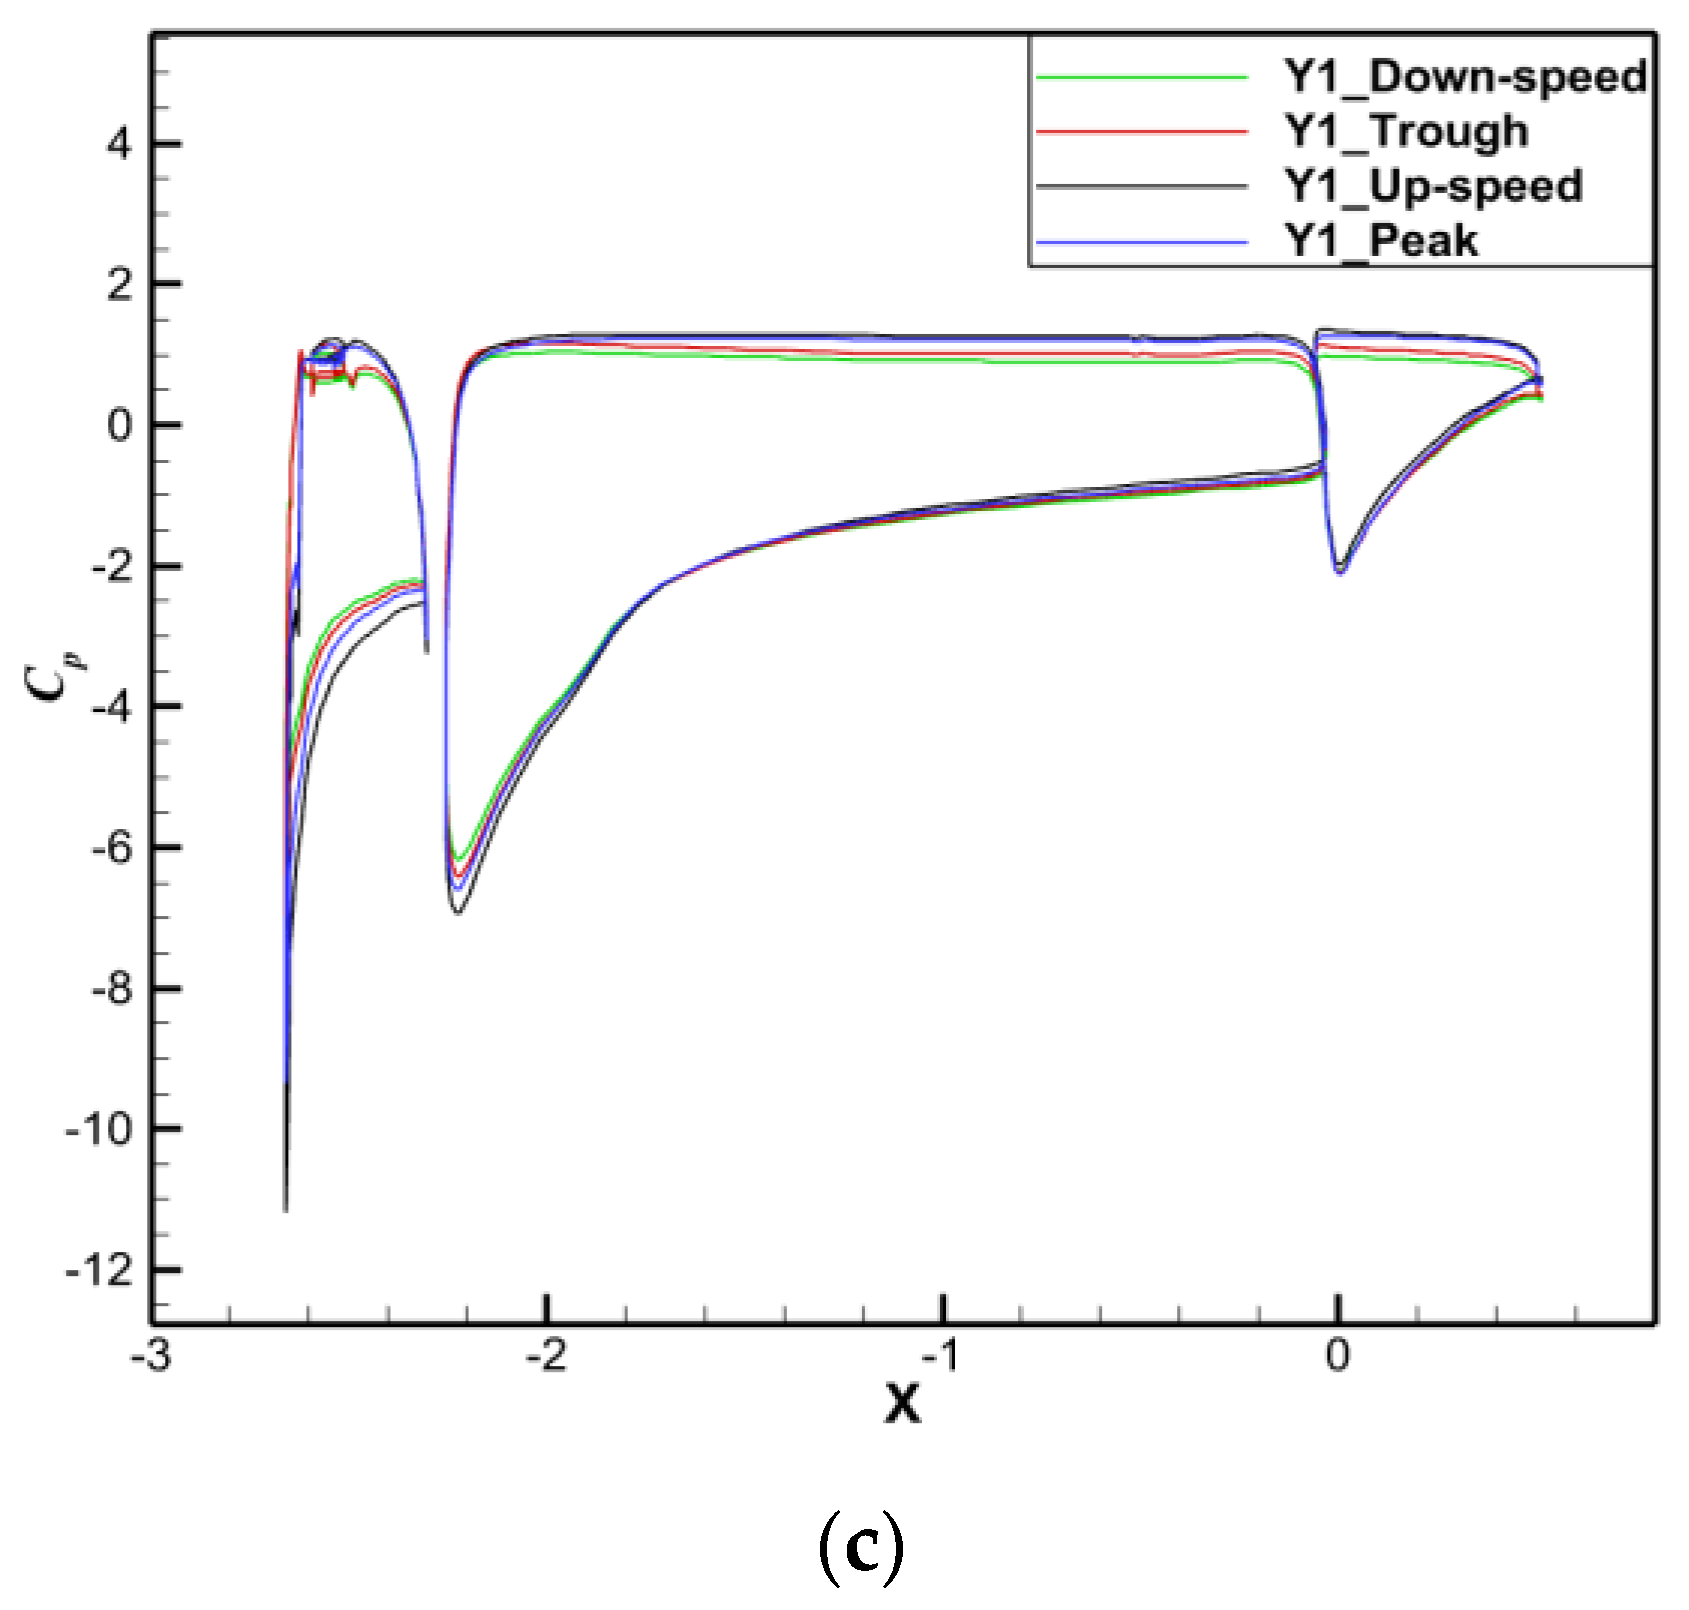
Analysis of the effect of the angle of attack and position of a wave on the aerodynamic characteristics for a given wave height in a three-dimensional composite configuration.
This section numerically simulates the flight of a three-dimensional grid-slat fusion configuration above a wave surface under specific calculation conditions, as shown in Table 5. The calculated angle of attack ranges from 0° to 16° (specifically, at 0°, 12°, and 16°). The detected wave positions are categorized into four groups based on their location relative to the leading-edge point of the airfoil: (1) down-speed (wave from balance to trough), (2) trough, (3) up-speed (wave from valley to balance), and (4) peak.
x represents the half-span of a three-dimensional grid-slat wing configuration.
Four wing sections (Y1, Y2, Y3, and Y4), are selected, as depicted in Figure 30. First, wing section Y1 is analyzed.
Figure 31 shows the distribution characteristics of the pressure coefficient at section Y1 of the wing when passing through different wave positions at three different attack angles. Comparing Figure 31a–c reveals that, at the same wave position, the negative pressure area on the upper wing surface increases significantly with the angle of attack, leading to a sharp rise in the corresponding pressure coefficient. The increase in the pressure coefficient on the upper wing surface at an angle of attack of 16° is approximately two times that at an angle of attack of 3°. The x in the plots of CP vs. x is non-dimensional according to the chord length.
Figure 32 shows the pressure distribution at wing section Y1 at different wave positions for angles of attack of 0°, 12°, and 16°. At the same wave position, as the angle of attack increases, the positive pressure region on the lower wing surface gradually expands from the leading edge of each wing segment to the wing’s lower surface, while the negative pressure region on the upper wing surface gradually expands. However, unlike the two-dimensional flow field, at the same angle of attack but different wave positions, in an up-speed wave position, the lower wing’s positive pressure region is larger than that at other wave positions, significantly impacting the wing’s aerodynamic performance.
Next, the pressure coefficient results for different wing sections at the same wave location and an angle of attack of 16° were analyzed. As shown in Figure 33, regardless of whether the wave is at the peak or in an upward velocity position, the area enclosed by the pressure coefficient curve is largest at the inner wing segment (wing section Y1), and it decreases as it moves towards the outer wing sections.
For the 3D grid-slat composite configuration, the amplitudes of the lift and drag coefficients increase with wave height at both wave altitudes, and the mean value of the lift coefficient increases, but the mean value of the drag coefficient is almost unchanged. The lift-to-drag ratio is consistent with the periodic variation in the lift coefficient. However, unlike two-dimensional cases where the lift-to-drag ratio increases with the angle of attack, in three-dimensional cases where the angle of attack increases, the lift-to-drag ratio of the wing decreases instead, and the maximum lift-to-drag ratio is obtained at the angle of attack of 0°. During the wave ascent phase, the relative height of the wing is relatively reduced, the lift-to-drag ratio is relatively increased, the aerodynamic performance is enhanced, and the lift-to-drag ratio reaches a maximum (small) value at the wave peak (trough) position.
At the same wave location, with the increase in the angle of attack, the positive pressure region of the lower wing surface gradually expands from the leading edge of each section to the lower surface of the wing, and the negative pressure region of the upper wing surface also gradually increases. However, the difference from the two-dimensional flow field is the following: for the same angle of attack, when the wave is at an ascending speed, the positive pressure region of the lower wing surface is larger than at other wave positions, and different wave positions have a greater effect on the aerodynamic performance of the wing.

4. Conclusions

Given the limited effectiveness of passive flow control in current amphibious aircraft lifting devices, this study addresses environmental factors such as the proximity to the water surface and flap-splashing during take-off and landing. Drawing upon the characteristics of grid wing design, the grid-slat fusion configuration integrates multi-channel compound design for the slats, resulting in a novel passive flow control method tailored for the take-off and landing of amphibious seaplanes. Verification of the application of a straight 3D grid-slat fusion wing in scenarios near water was successfully conducted.
(1) This study proposes a design method for a grid-slat composite lift configuration. The 30P30N airfoil is selected as the subject of study, where grid parameters are coupled and design optimization of a two-dimensional composite configuration is performed using a CFD simulation method based on a multi-objective genetic algorithm. The results indicate that the lift-to-drag ratio of the optimized two-dimensional grid-slat fusion device improves significantly by up to 8.5% compared with the baseline 30P30N airfoil at angles of attack exceeding 10°.
(2) Using the VOF model, numerical wave generation was conducted to investigate the application effectiveness of the grid-slat fusion configuration during typical take-off and landing scenarios on a wavy water surface. The results indicate a significant increase in the maximum lift-to-drag ratio of the two-dimensional grid-slat composite configuration under wavy water surface conditions, with a higher amplitude of variation compared with that of the baseline 30P30N airfoil. Overall, the grid-slat fusion device demonstrates favorable characteristics of increased lift and reduced drag.
(3) This study investigated the influence of varying wave heights, angles of attack, and wave positions on the aerodynamic characteristics of a three-dimensional grid-slat fusion configuration. The findings indicate that both wave height and wave position significantly influence the aerodynamic characteristics of a three-dimensional wing, which is attributable to the near-water effect.

Author Contributions

Methodology, B.M.; Software, J.Y.; Validation, B.M. and J.Y.; Investigation, B.M. and J.Y.; Data curation, J.Y.; Writing—original draft, B.M.; Writing—review and editing, J.Y.; Supervision, B.M.; Funding acquisition, B.M. All authors have read and agreed to the published version of the manuscript.

Funding

This research was supported by the National Natural Science Foundation of China (Grant No. 12202363), the Key Laboratory Fund (Grant No. D5150240005), and the Open Research Subject of State Key Laboratory of Intelligent Games (Grant No. ZBKF-24-10).

Institutional Review Board Statement

Not applicable.

Informed Consent Statement

Not applicable.

Data Availability Statement

The data presented in this study are available in the article.

Acknowledgments

We are grateful to all patients and centers for their participation in the study.

Conflicts of Interest

The authors declare no conflicts of interest.

References

  1. Chu, L.; Ye, S. Collection of Seaplane Essays; Aviation Industry Press: Beijing, China, 2011; pp. 489–490. [Google Scholar]
  2. Huang, L.C.; Yong, M.P. Key technologies and industrial application prospects of amphibian aircraft. Acta Aeronaut. Et Astronaut. Sin. 2019, 40, 522708. [Google Scholar]
  3. Stout, E.G. Development of high-speed water-based aircraft. J. Aeronaut. Sci. 1950, 17, 457–480. [Google Scholar] [CrossRef]
  4. Leyva, C.; Leonel, A. Seaplane Conceptual Design and Sizing; University of Glasgow: Scotland, UK, 2012. [Google Scholar]
  5. Anderson, S.B. An Examination of Handling Qualities Criteria for V/STOL Aircraft; NASA: Washington, DC, USA, 1960. [Google Scholar]
  6. Hickey, D.H.; Aoyagi, K. Large-Scale Wind-Tunnel Tests of an Airplane Model with a 45 Degree Sweptback Wing of Aspect Ratio 2.8 Employing High-Velocity Blowing over the Leading- and Trailing-Edge Flaps; University of Oxford: Oxford, UK, 1958. [Google Scholar]
  7. Owens, D.; Perkins, J. Improved performance on highly swept wings by suction boundary-layer control. In Proceedings of the 34th Aerospace Sciences Meeting and Exhibit, Reno, NV, USA, 15–18 January 1996; p. 431. [Google Scholar]
  8. Smith, D.; Dickey, E.; vonKlein, T. The ADVINT program. In Proceedings of the 3rd AIAA Flow Control Conference, San Francisco, CA, USA, 5–8 June 2006; pp. 2006–2854. [Google Scholar]
  9. AEROFILES. Martin, Martin-Willard. Available online: http://www.aerofiles.com/_martin.html (accessed on 20 April 2009).
  10. Fischer, B. US-1A amphibian retired. AirInt. 2018, 94, 17. [Google Scholar]
  11. Holzhauser, C.A.; Innis, R.C.; Vomaske, R.F. A Flight and Simulator Study of the Handling Qualities of a Deflected Slipstream Stol Sea-Plane Having Four Propellers and Boundary-Layer Control; TN D-2964; NASA: Washington, DC, USA, 1965. [Google Scholar]
  12. Abbasov, I.B.; V’iacheslav, V.O. Computational modeling of multipurpose amphibious aircraft Be-200. Adv. Eng. Softw. 2014, 69, 12–17. [Google Scholar] [CrossRef]
  13. Qu, D.C. Russia’s Be-200 multi-pulfi-purpose amphibious seaplane. Aeronaut. Sci. Technol. 2005, 1, 28–30. [Google Scholar]
  14. Taylor, J.W.R. Jane’s all the world’s aircraft. In Jane’s Yearbooks; Sampson Low, Marston and Co.: London, UK, 1976. [Google Scholar]
  15. Hammond, A.D. High-Lift Aerodynamics. In Proceedings of the Vethicle Technology for Civil Aviation the Seventies and Beond, Hampton, VA, USA, 2-4 November 1971. [Google Scholar]
  16. Ramzi, M.; Abede, G. Passive control via slotted blading in a compressor cascade at stall condition. J. Appl. Fluid Mech. 2013, 571, 3–9. [Google Scholar]
  17. Ni, Z.; Dhanak, M.; Su, T. Improved performance of a slotted blade using a novel slot design. J. Wind. Eng. Ind. 2019, 34, 2–9. [Google Scholar] [CrossRef]
  18. Peng, K.; Hu, F.; Zhang, W.H.; Zhou, Z. Review of aerodynamic characteristics and application of grid fin. J. Solid Rocket. Technol. 2015, 38, 8. [Google Scholar]
  19. Shi, Y.C. New Quadratic Curve Method-A New Method of Designing and Processing Curves and Surface. J. Harbin Inst. Nav. Eng. 1992, 1, 80–93. [Google Scholar]
  20. Liming, R.A. Practical Analytic Geometric with Application to Aircraft; Macmillan: London, UK, 1944. [Google Scholar]
  21. Wang, Y.T.; Wang, G.X.; Zhang, Y.L. Numerical study of complex flow over 30P-30N multi-element. Acta Aerodyn. Sin. 2010, 28, 99–103. [Google Scholar]
  22. Qin, X.; Liu, P.; Qu, Q.; Peng, G. Influence of gap parameters on aerodynamics of multi-element airfoil. J. Beijing Univ. Aeronaut. Astronaut. 2011, 37, 4. [Google Scholar]
  23. Anderson, J.D. Foundations and Applications of Computational Fluid Mechanics; Machine Press: Beijing, China, 2007. [Google Scholar]
  24. Lai, Y.Y. Isight arameter Optimization Theory and Case Explanation; Beijing Aerospace Publishing House: Beijing, China, 2012. [Google Scholar]
  25. Zhu, Y.R. Wave Mechanics in Marine Engineering; Tianjin University Press: Tianjin, China, 2013. [Google Scholar]
  26. Hirt, C.W.; Nichols, B.D. Volume of fluid (VOF) method for the dynamics of free boundaries. J. Comput. Phys. 1981, 39, 201–225. [Google Scholar] [CrossRef]
  27. Qin, X.G.; Liu, P.Q.; Qu, Q.L.; Xu, J. Numerical Simulation of Ground Effects on Three dimensional Multisegment Wings. Acta. Aeronaut. Sin. 2011, 32, 257–264. [Google Scholar]
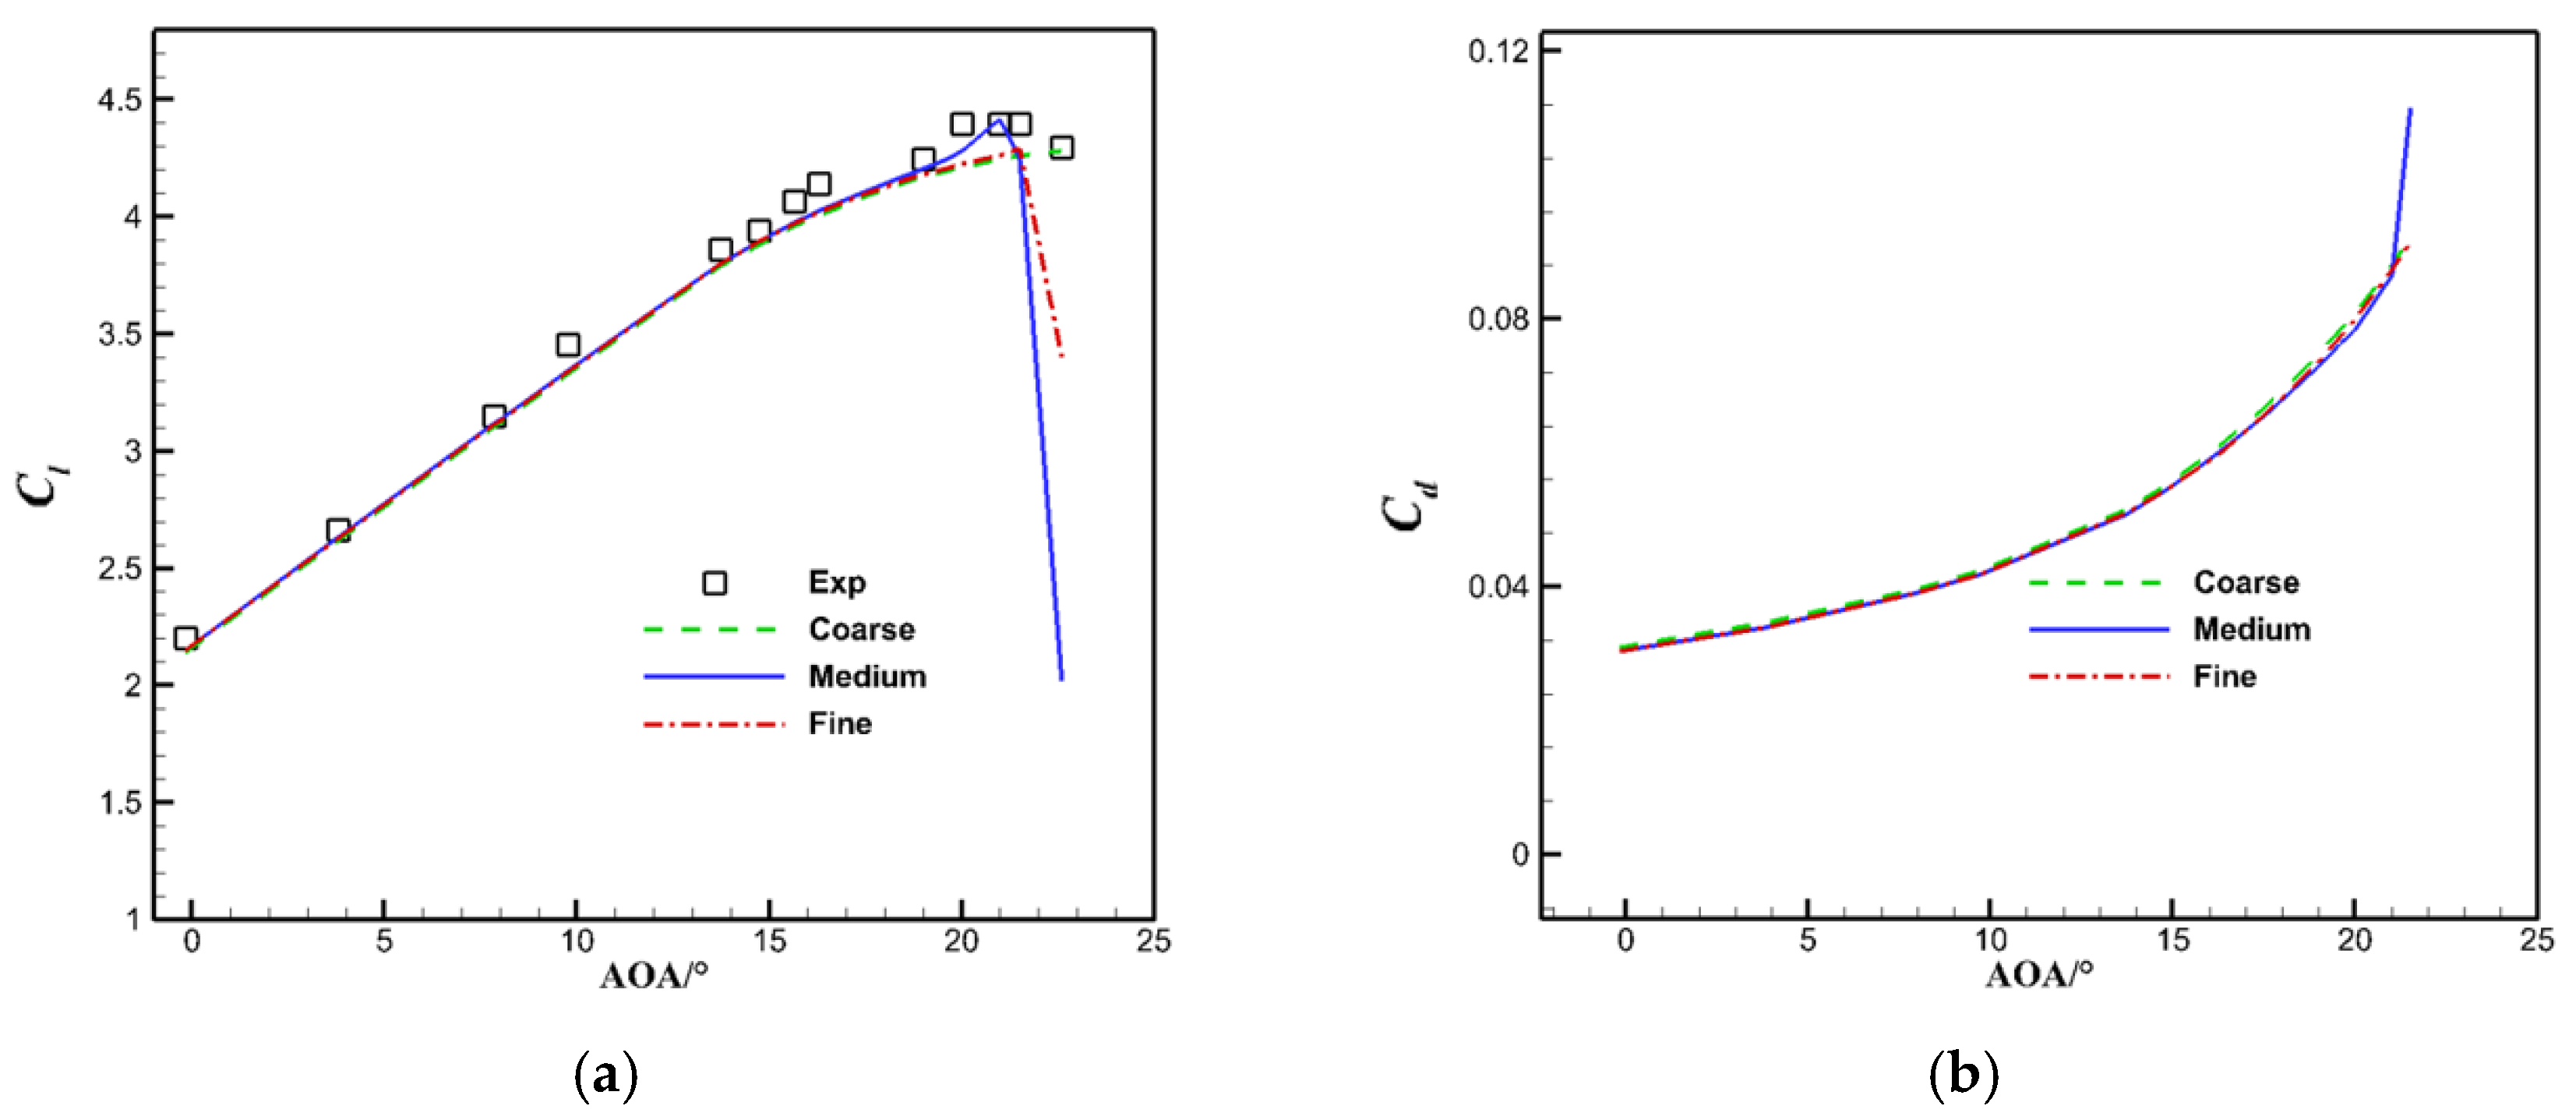
Figure 1. No splashing at the flaps.
Jmse 12 02303 g001
Figure 2. Minor splashing at the flaps.
Jmse 12 02303 g002
Figure 3. Severe splashing at the flaps.
Jmse 12 02303 g003
Figure 4. Illustration depicting slats and flaps affected by the water surface during the take-off and landing of an amphibious seaplane.
Jmse 12 02303 g004
Figure 5. Lift coefficient curves of slats and flaps.
Jmse 12 02303 g005
Figure 6. Grid-slat fusion configuration.
Jmse 12 02303 g006
Figure 7. Grid-slat fusion design parameters.
Jmse 12 02303 g007
Figure 8. “New conic” diagram.
Jmse 12 02303 g008
Figure 9. General grid channel diagram.
Jmse 12 02303 g009
Figure 10. Curve parametrization on general grid channels.
Jmse 12 02303 g010
Figure 11. Computational grid.
Jmse 12 02303 g011
Figure 12. Comparison of the calculated values of the 30P30N airfoil with wind tunnel experiments. (a) Lift coefficient ( M a = 0.2 ). (b) Drag coefficient ( M a = 0.2 ). (c) Pressure coefficient of the slat ( M a = 0.2 ). (d) Pressure coefficient of the main wing ( M a = 0.2 ). (e) Pressure coefficient of the flap ( M a = 0.2 ).
Jmse 12 02303 g012aJmse 12 02303 g012b
Figure 13. Automated flowchart of the 2D grid-slat composite configuration.
Jmse 12 02303 g013
Figure 14. Diagrams of four kinds of slot design spaces. (a) Design space 1; (b) design space 2; (c) design space 3; (d) design space 4.
Jmse 12 02303 g014
Figure 15. Diagram of the leading edge of the optimized configuration.
Jmse 12 02303 g015
Figure 16. Lift-to-drag ratio.
Jmse 12 02303 g016
Figure 17. Lift coefficient: (a) total lift coefficient; (b) lift coefficient of the slat.
Jmse 12 02303 g017
Figure 18. Pressure distribution around the 30P30N airfoil and optimized airfoil at an angle of attack of 16.3°: (a) 30P30N airfoil; (b) optimized airfoil.
Jmse 12 02303 g018
Figure 19. Drag coefficient: (a) total drag coefficient; (b) friction drag coefficient; (c) pressure drag coefficient; (d) ratio of pressure drag to the total drag.
Jmse 12 02303 g019
Figure 20. Computational mesh: (a) computational domain and boundary conditions; (b) grid details at the airfoil and water surface interaction area.
Jmse 12 02303 g020
Figure 21. Lift coefficient (at an angle of attack of 16°).
Jmse 12 02303 g021
Figure 22. Lift coefficient of the slat (at an angle of attack of 16°).
Jmse 12 02303 g022
Figure 23. Drag coefficient (at an angle of attack of 16°).
Jmse 12 02303 g023
Figure 24. Lift-to-drag ratio (at an angle of attack of 16°).
Jmse 12 02303 g024
Figure 25. Computational mesh: (a) computational domain and boundaries; (b) mesh generation.
Jmse 12 02303 g025
Figure 26. Wave height.
Jmse 12 02303 g026
Figure 27. Lift coefficient.
Jmse 12 02303 g027
Figure 28. Drag coefficient.
Jmse 12 02303 g028
Figure 29. Lift-to-drag ratio.
Jmse 12 02303 g029
Figure 30. Wing section diagram.
Jmse 12 02303 g030
Figure 31. Calculation of two-phase flow in an optimized fusion lifting device: comparison of pressure coefficients at various wave positions and angles of attack. (a) 0°; (b) 12°; (c) 16°.
Jmse 12 02303 g031aJmse 12 02303 g031b
Figure 32. Calculation of two-phase flow in an optimized fusion lifting device: comparison of pressure contours at various wave positions and angles of attack. (a) t / T = 0 (down-speed); from left to right, they are 0°, 12°, and 16°. (b) t / T = 0.25 (trough); from left to right, they are 0°, 12°, and 16°. (c) t / T = 0.5 (up-speed); from left to right, they are 0°, 12°, and 16°. (d) t / T = 0.75 (peak); from left to right, they are 0°, 12°, and 16°.
Jmse 12 02303 g032aJmse 12 02303 g032b
Figure 33. Calculation of two-phase flow using the optimized fusion lifting device involving a comparison of the pressure coefficients of different wing sections at the same wave location—specifically, at an angle of attack of 16°: (a) down-speed; (b) trough; (c) up-speed; (d) peak.
Jmse 12 02303 g033aJmse 12 02303 g033b
Table 1. Grid independence validation.
CaseGrid NumberLift Coefficient
Coarse grid74,2893.88324
Medium grid162,4023.8952
Fine grid288,0693.8993
Table 2. Parameter values for design space 1.
ratio Aratio Bratio E θ 1 β 1
0.75–0.850.55–0.650–1 45 90 0 45
ratio Hratio Iratio P θ 2 β 2
0.8–0.90.65–0.750–1 45 90 0 45
Table 3. Designed parameter values.
ratio Aratio Bratio E α 1 β 1
0.810.570.58531
ratio Hratio Iratio P α 2 β 2
0.860.70.278030
Table 4. Two-phase flow calculation conditions.
Computational Model Flight   Altitude   h / c Velocity m/sWater Surface Condition
Case 30.8c68wave height: 0.75 m
wave length: 40 m
Case 40.8c68wave height: 1.55 m
wave length: 40 m
Table 5. Calculation conditions.
Computational Model Flight   Altitude   h / c Velocity m/sWater Surface Condition
Case 40.8c68wave height: 1.55 m
wave length: 40 m
Disclaimer/Publisher’s Note: The statements, opinions and data contained in all publications are solely those of the individual author(s) and contributor(s) and not of MDPI and/or the editor(s). MDPI and/or the editor(s) disclaim responsibility for any injury to people or property resulting from any ideas, methods, instructions or products referred to in the content.

