Article

A Comparative Analysis of Buckling Pressure Prediction in Composite Cylindrical Shells Under External Loads Using Machine Learning

1
Department of Marine Convergence Design Engineering, Pukyong National University, Busan 48513, Republic of Korea
2
Department of Naval Architecture and Marine Systems Engineering, Pukyong National University, Busan 48513, Republic of Korea
*
Author to whom correspondence should be addressed.
J. Mar. Sci. Eng. 2024, 12(12), 2301; https://doi.org/10.3390/jmse12122301
Submission received: 12 November 2024 / Revised: 11 December 2024 / Accepted: 12 December 2024 / Published: 13 December 2024
(This article belongs to the Section Ocean Engineering)

Abstract

:
Composite materials are increasingly utilized in engineering due to their superior properties such as strength, flexibility, and corrosion resistance. However, accurately predicting the buckling pressure of composite cylindrical shells under external loads remains challenging due to the complexities introduced by various stacking methods. This study addressed this challenge by integrating advanced machine learning techniques with simulation-based data generation through finite element analysis (FEA). A comprehensive dataset comprising 1369 simulation results was generated using ANSYS ACP, focusing on cylindrical shells modeled with an 8-mm-thick filament winding technique and T700 material. The stacking angles ranged from −90 degrees to 90 degrees in 5-degree increments. Stacking configurations (inputs) and their corresponding buckling strength (outputs) were generated using ANSYS ACP. Machine learning models, including linear regression, elastic net, polynomial regression, random forest, support vector regression, XGBoost regression, and artificial neural networks, were implemented using Python 3.8 and Scikit-learn (version 0.24.2). A comparative analysis of these methods revealed their model performance, providing insights into the most effective approaches. Additionally, the accuracy of these models was then evaluated on previously unseen input data, allowing for a comparison of their out-of-sample accuracy. The results demonstrated that the random forest model and XGBoost regression achieved superior accuracy with minimal prediction errors. The study highlights the critical role of machine learning in predicting buckling pressure, which is essential for ensuring structural integrity and optimizing performance in marine engineering and other applications involving composite materials.

1. Introduction

Composite materials have become increasingly essential in engineering due to their superior properties including strength, flexibility, and resistance to corrosion, which far exceed those of traditional materials [1,2,3]. Another key advantage of composites is their ability to be custom-engineered to meet precise performance criteria. Unlike conventional metallic materials, composites offer the flexibility to optimize the matrix and fiber constituents as well as strategically design fiber orientations and layering sequences. This enables enhanced control over mechanical properties such as strength, stiffness, and weight [4,5,6,7]. These unique advantages have paved the way for new applications, particularly in cylindrical structures used in deep-sea environments, such as pipelines and underwater vehicles, where buckling often dictates structural performance. The suitability of composites as alternatives to traditional materials in challenging applications has been supported by numerous studies. Cho et al. [8] proposed an empirical formula to predict the ultimate load capacity of composite cylinders under external hydrostatic pressure by considering both the structural buckling and material failure. Imran et al. [9] investigated the linear buckling of composite cylindrical shells with various geometric sizes and layup configurations under external pressure. Based on the classical laminated plate theory of composites, Ehsani et al. [10] and Cho et al. [11] obtained elastic buckling loads for laminated composite structures. Several researchers [12,13,14,15] have also evaluated the buckling failure of composite structures using finite element analysis (FEA). Shen et al. [16] and Moon et al. [17] examined the buckling and failure characteristics of composite cylindrical shells manufactured through filament winding under external hydrostatic pressure using experimental and finite element analyses. They confirmed that the finite element model could predict the buckling pressure of composite cylinders within an error range of 2–25%. Joung et al. [18] designed an unmanned underwater vehicle using CFRP/GFRP combined with hybrid composites and conducted finite element analysis using ANSYS (version 6.1) and MSC NASTRAN. These studies underscore the necessity of sophisticated finite element modeling in composite structural design, emphasizing the importance of design parameters such as ply orientation, layer thickness, and stacking sequence.
Despite these advances, one limitation of numerical simulation is its high computational cost due to the need to solve complex differential equations for each model configuration. To address this challenge, machine learning (ML) algorithms offer a novel approach by leveraging existing simulation data to predict structural behaviors. Unlike traditional methods, ML eliminates the need for repetitive computations by learning from data, which significantly reduces the computational time and resource demands. This approach has been increasingly explored in recent studies, as highlighted in Table 1 [19,20,21,22,23], which reviews literature on ML applications for predicting structural strength.
Building on this emerging trend, our study integrated advanced machine learning techniques with simulation-based data from FEA to accurately predict the buckling pressure of composite cylindrical shells. The novelty of this approach lies in its ability to capture complex, nonlinear relationships between stacking configurations and buckling strength, while drastically reducing the computational cost. Unlike traditional methods reliant on classical lamination theory and ABD matrix calculations, this method allows for direct predictions based on simulation data, bypassing computationally expensive analytical procedures.
Figure 1 illustrates the research flow of the present study. The initial phase begins with identifying the most reliable method for data generation. Through comparisons of experimental results of cylindrical shells under external loads with outcomes from analytical and numerical methods, ANSYS ACP simulations were determined to be the most reliable, and were exclusively used for data generation.
The study proceeded by modeling cylindrical shells using an 8-mm-thick filament winding technique with T700-24K carbon fiber (Toray Industries, Inc., Tokyo, Japan) and bisphenol A-type epoxy resin (Kumho P&B Chemicals, Inc., Seoul, Republic of Korea), arranged in a three-lamination pattern. A comprehensive dataset was generated comprised of the stacking angles from −90 to 90 degrees in 5-degree increments, totaling 1369 data points. The stacking configurations served as input parameters, while the corresponding buckling strength values were output responses used to train and evaluate multiple machine learning algorithms. Model performance was assessed using evaluation metrics, and a comparative heatmap was generated to visually compare the error distribution and to contrast the results from FEA with the predictions from the ML models. Additionally, the accuracy of these models was evaluated on previously unseen input data, allowing for a comparison of their out-of-sample accuracy.

2. Buckling Pressure Calculation

2.1. Analytical Approaches

NASA-SP-8007 presents an equation for estimating the allowable pressure that a composite unreinforced cylinder can withstand under external water pressure [24], given by:
P a = R F n 2 + 1 2 m π R L 2 det C 11 C 12 C 13 C 21 C 22 C 23 C 31 C 32 C 33 det C 11 C 12 C 21 C 22 ,
To compute Equation (1), it is essential to first calculate the ABD matrix [25], which is based on the material properties (E1, E2, ν12, G12) and layer thickness (t) as well as the cylinder’s dimensions (radius R, length L). Additionally, the material constants C11 through C33, which are derived from the material’s properties (such as Young’s modulus, Poisson’s ratio, and shear modulus), and its laminate configuration, are detailed in Equation (1a) to Equation (1f) from NASA-RP-1351 [26]. These constants describe the stiffness of the composite material in different directions and are critical in determining the laminate’s overall mechanical behavior. The safety factor F and integers m and n (representing buckling half-waves in the axial and circumferential directions) are then used to apply Equation (1).
C 11 = A 11 m π L 2 + A 66 n R 2 ,
C 12 = C 21 = A 12 + A 66 n R ,
C 13 = C 31 = A 12 R m π L + B 11 m π L 3 + B 12 + 2 B 66 m π L n R 2 ,
C 22 = A 22 n R 2 + A 66 m π L 2 ,
C 23 = C 32 = B 12 + 2 B 66 m π L 2 n R + A 22 R n R + B 22 n R 3 ,
C 33 = D 11 m π L 4 + 2 D 12 + 2 D 66 m π L 2 n R 2 + D 22 n R 4 + A 22 R 2 + 2 B 22 R n R 2 + 2 B 12 R m π L 2 ,
The allowable buckling pressure equation, as provided by ASME [27], used to determine the maximum pressure that a structure can withstand without experiencing buckling, is presented as follows:
P a = ( K D ) 0.8531 γ E h f 3 / 4 E a t 1 / 4 t 5 / 2 ( 1 ν x ν y ) 3 / 4 L D O 2 3 / 2 F ,
where Do is the outer diameter of the cylinder, L is the length of the cylinder, t is the thickness of the cylinder, Eat is the axial tensile coefficient, and Ehf is the circumference bending coefficient. The Poisson’s ratios are νx and νy. F is the safety factor and KD is the knock-down factor set to 0.84. The reduction factor γ, as defined by Equation (2), is 1 − 0.001Zp if Zp is equal to or less than 100; otherwise, it is 0.9.
E a t = A 11 A 22 A 12 2 A 22 t ,
E h f = 12 t 3 A B D 1 5 , 5 ,
E a f = 12 t 3 A B D 1 4 , 4 ,
ν x = A B D 1 5 , 4 A B D 1 4 , 4 ,
ν y = A B D 1 5 , 4 A B D 1 5 , 5 ,
Z p = E h f 3 / 2 E a t 1 / 2 E a f 2 1 ν x ν y 1 / 2 L 2 D O 2 t

2.2. Numerical Approach

ANSYS [28] is a commercial tool specifically designed for the analysis and design of composite materials. ANSYS ACP (Pre) excels in defining precise material properties, such as elasticity and tensile strength, enabling realistic simulations. It facilitates detailed modeling of fiber orientations and stacking sequences to accurately predict anisotropic behaviors, and ensures seamless integration with ANSYS Mechanical for calculating buckling pressure and analyzing its behavior. Figure 2 illustrates the layer settings in ANSYS ACP (Pre). Figure 2a shows the fiber orientations indicated by arrows on each element, while Figure 2b presents an example of the stacking sequence including the material, fiber angle, and layer thickness. This helps clarify how different fiber orientations are applied in a cylindrical shell.

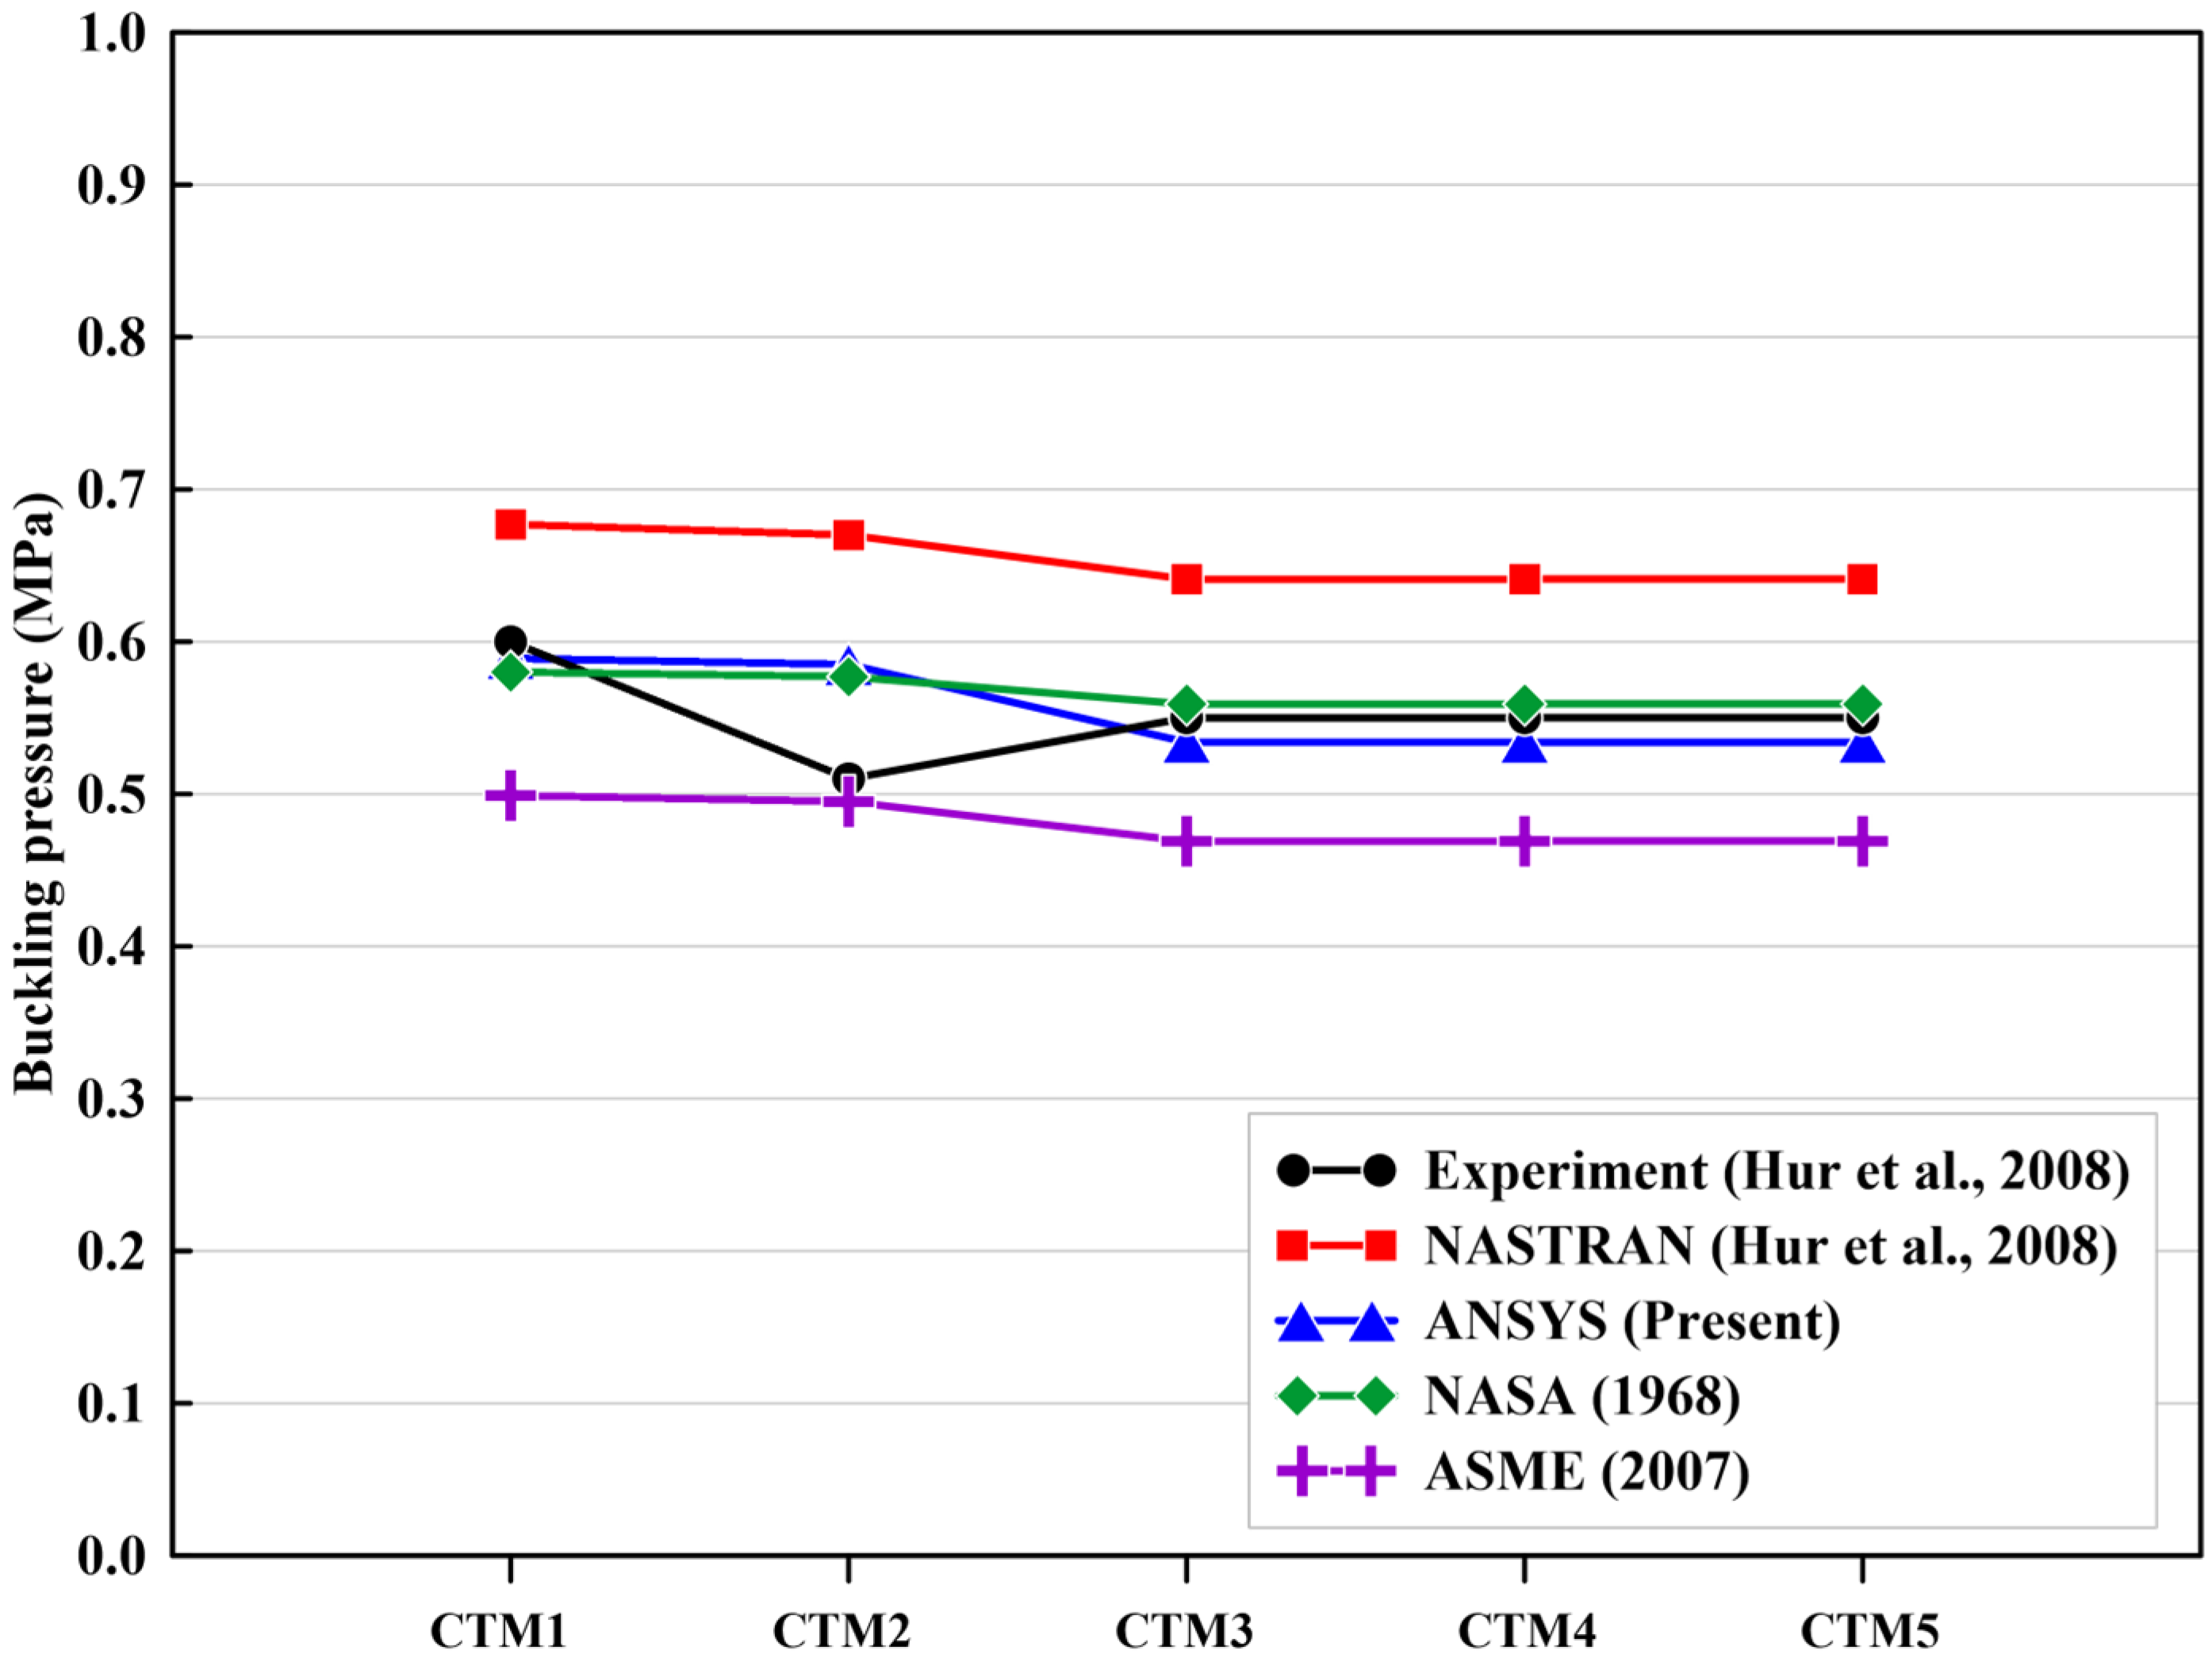
2.3. Validation with Experiment Data

To validate the accuracy and reliability of previous methodologies, experimental data [12] tests on a 12-layer composite cylinder arranged in a 0°/90° pattern, made with USN-125 and with dimensions of 316 mm in diameter, 600 mm in length, and a thickness of 2.52 mm, were conducted. The cylinder was constrained on one side with a fixed boundary, while the opposite side was fitted with a steel cover, allowing for both axial and rotational deformations.
Figure 3 compares the buckling pressures obtained from previous approaches with reference experimental results [12]. All five models were fabricated with the same thickness, but post-fabrication changes including increasing thickness to 2.69 mm and a reduction in length to 564 mm due to manufacturing defects led to variations in the observed buckling pressures. ANSYS, which accounted for initial imperfections with a deflection of 0.5% of the cylinder’s radius in the first buckling eigenmode, accurately captured these geometric deviations, yielding results that closely matched the experimental data, unlike NASTRAN [12], which did not account for them. ASME’s predictions were lower than those from ANSYS, while NASA’s results demonstrated the highest accuracy.

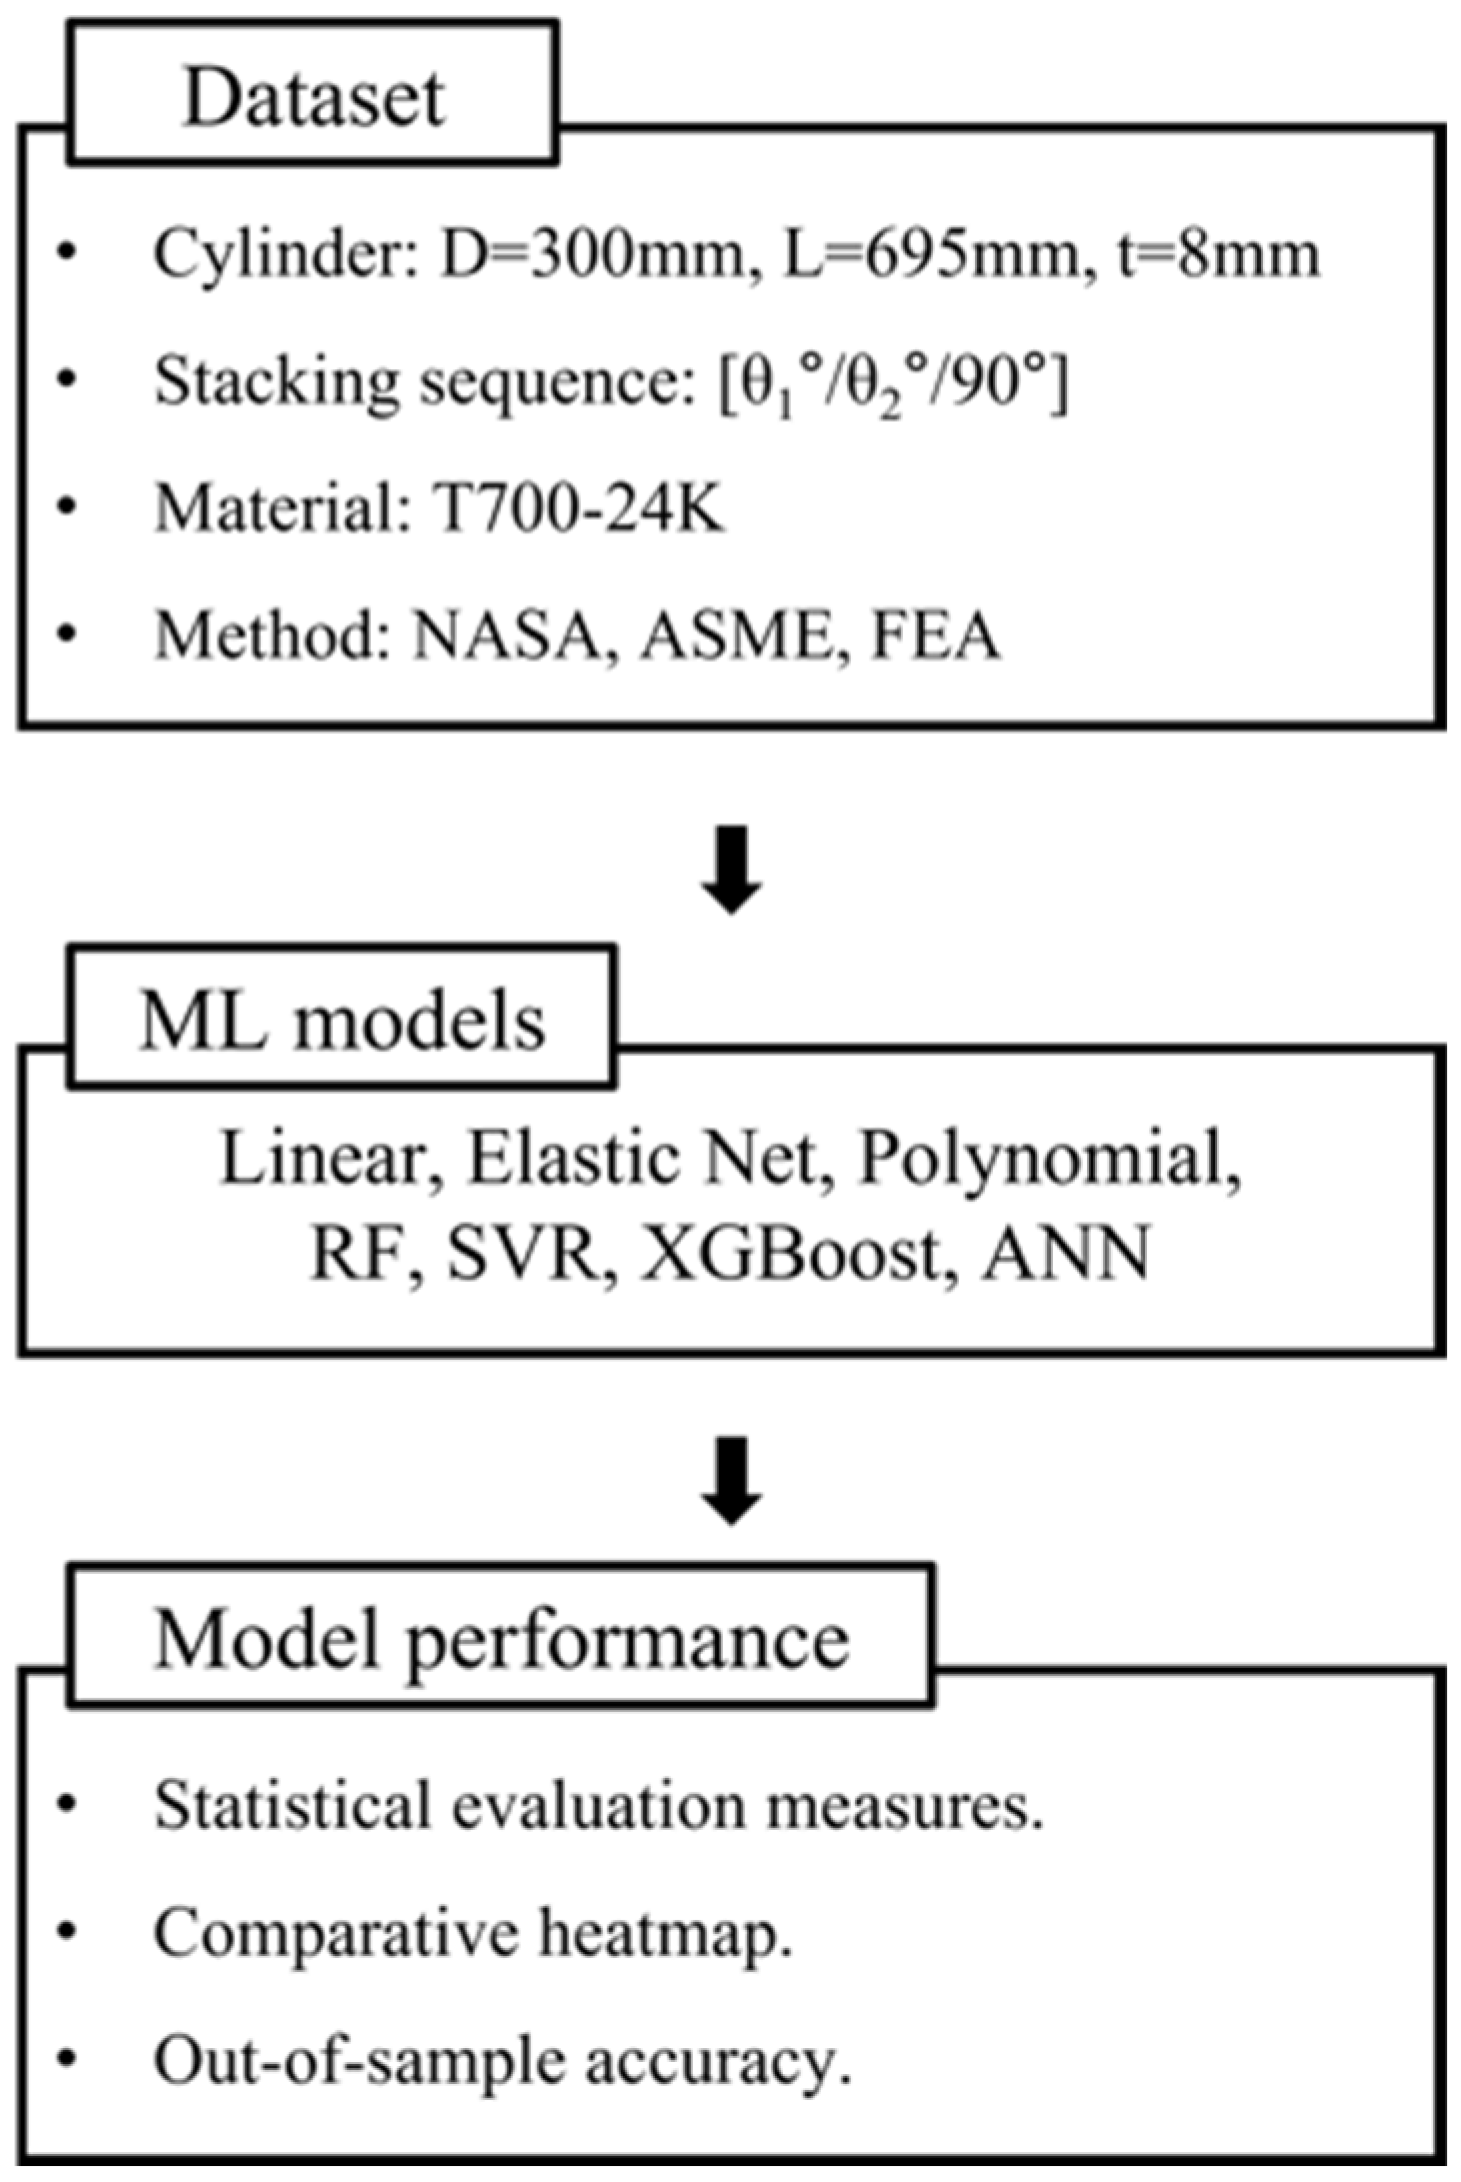
3. Data Collection and Suitability Analysis

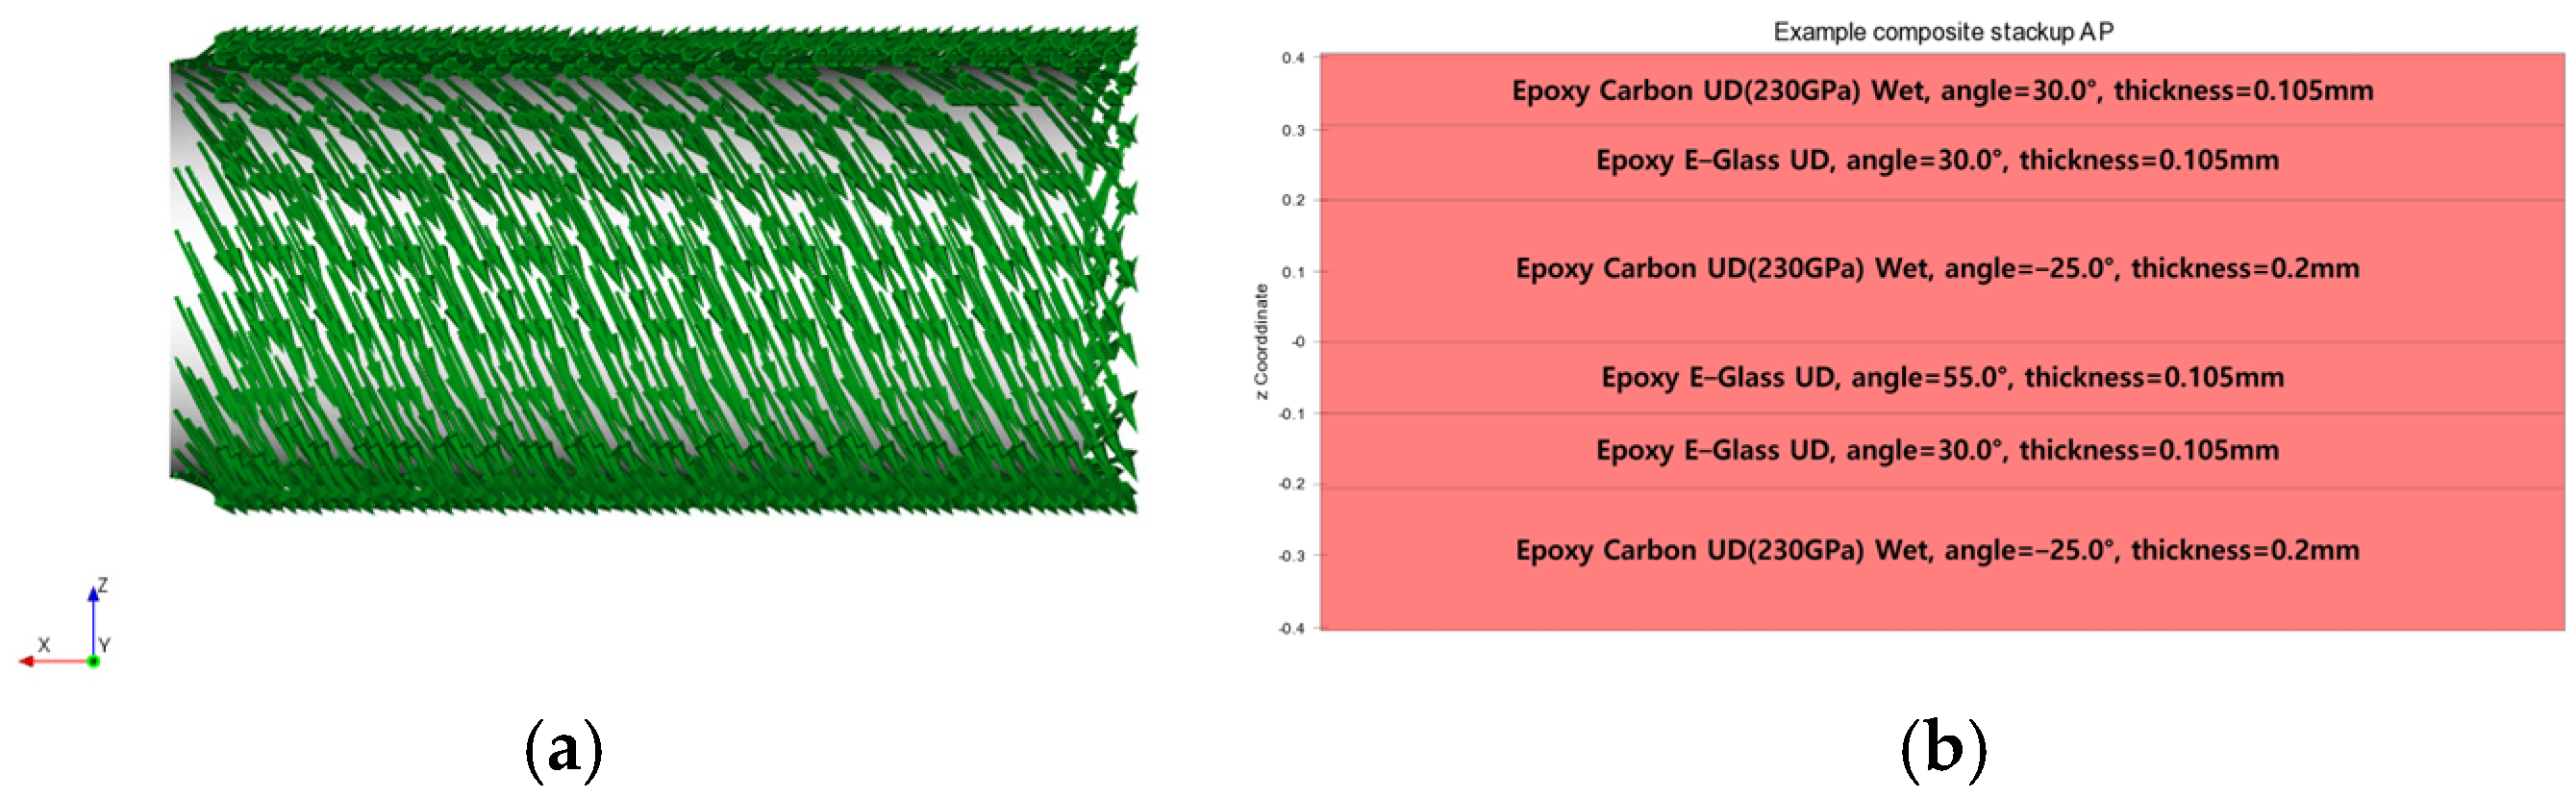
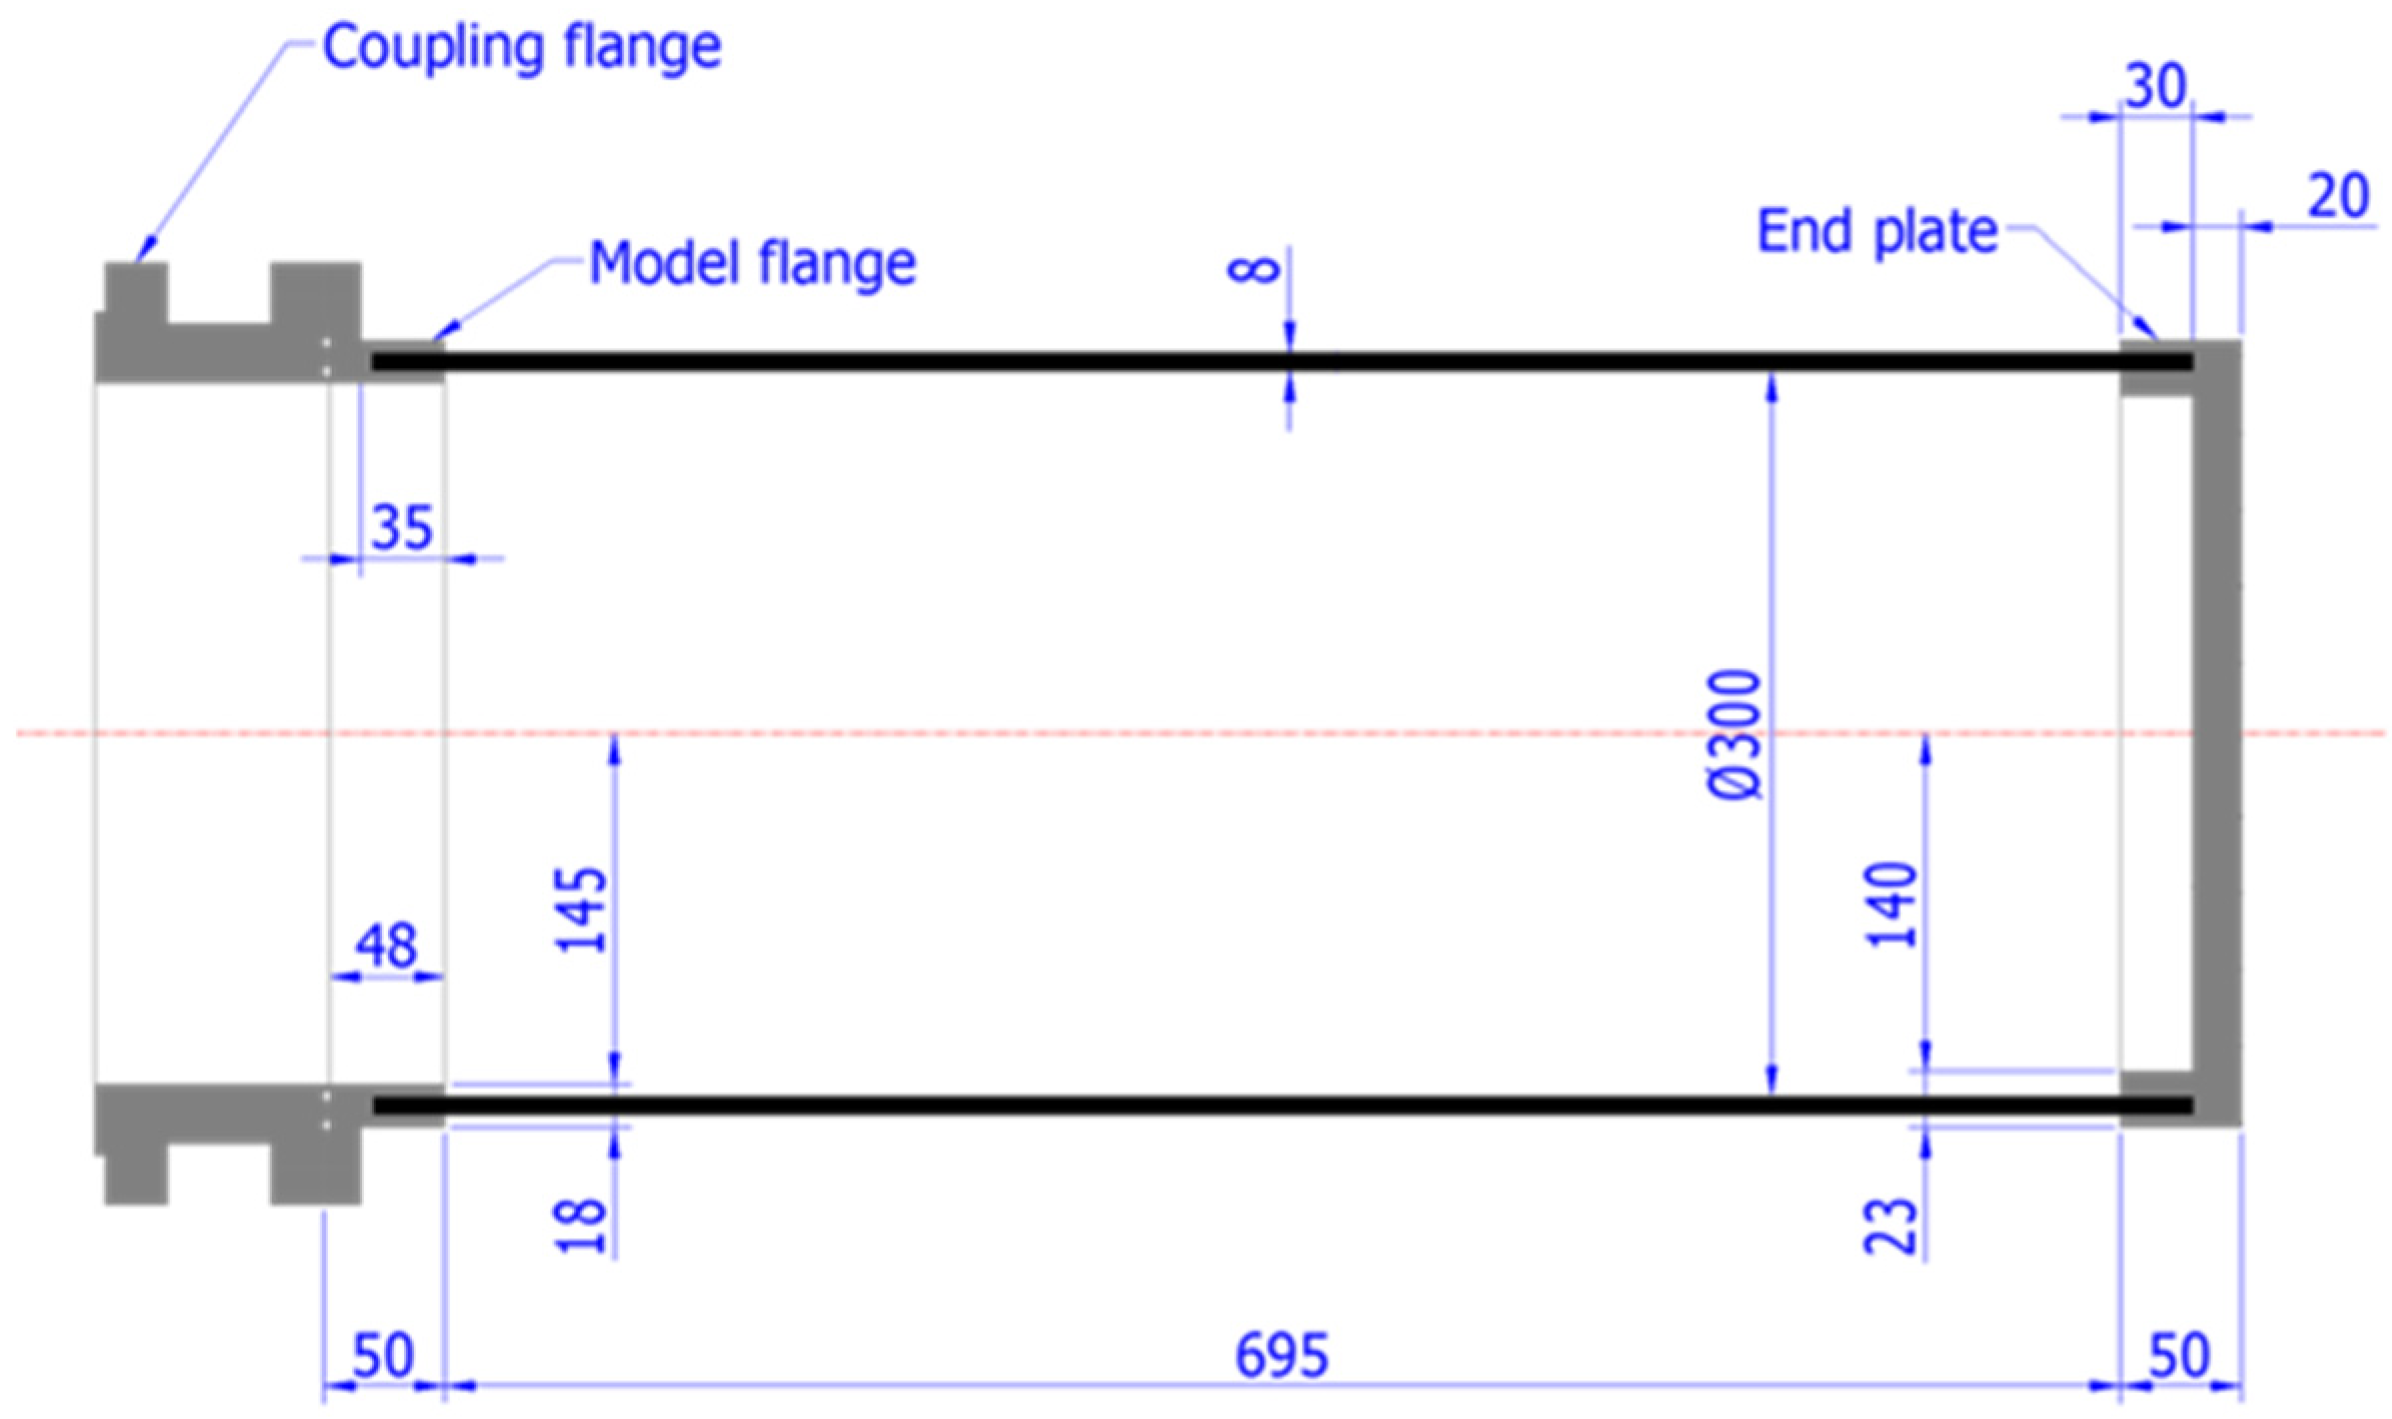
3.1. Composite Cylinder Model

To facilitate future hydrostatic pressure testing, both the flange and the cylinder were designed as an integrated assembly, as illustrated in Figure 4. The flange was included to provide the necessary boundary conditions for the tests; however, the focus of this study was on the cylindrical shell. This was constructed using an 8-mm-thick filament winding structure made of T700-24K material with a three-layer lamination pattern of [θ1°2°3°]. The model was 695 mm in length and had an inner diameter of 300 mm. Table 2 presents the calibrated material properties derived from the referenced work in [17], which accounts for the observation that the measured effective properties were approximately 19% lower than the effective modulus calculated from the manufacturer-provided material properties using the rule of mixtures. In the present study, this approach was followed without considering specific epoxy resin information.

3.2. Data Collection

In composite cylindrical structures, it is standard practice to orient the final layer in the hoop direction to withstand significant external pressure and ensure waterproofing. Positioning the third layer (θ3) at 90 degrees in the hoop direction allows the composite material to better handle circumferential stresses, thereby enhancing structural durability and waterproofing effectiveness, while the angles for helical layers (layers 1 and 2) vary within a range from −90 to 90 degrees.
To improve the learning efficiency by reducing the number of variables, the effect of thickness was explored. Figure 5 shows the buckling strength results from ANSYS for different hoop ratios ranging from 15% to 40% for three different helical angles: ±30, ±45, and ±60 degrees. A hoop ratio of 15% means that the thickness of layer 3 is 1.2 mm, while a hoop ratio of 40% corresponds to 3.2 mm. For each case, due to the manufacturing characteristics of the composite, it is standard to wind the helical layers at symmetric angles, so layers 1 and 2 had the same thickness of 3.4 mm and 2.4 mm, respectively. Although there were slight fluctuations, the overall trend remained consistent up to a 30% hoop ratio, after which a decreasing pattern was observed based on the stacking angle. The hoop ratio of 20% was chosen to minimize its influence, as it primarily serves sealing purposes and does not significantly affect the buckling behavior. This value ensures sufficient sealing while minimizing impact on the structural analysis. Based on the experimental data and the goal of optimizing performance and sealing, the hoop thickness was set at 1.6 mm, corresponding to a 20% ratio, considering the manufacturing characteristics of T700-24K, where each rotation adds 0.4 mm of thickness.
Using very small intervals for angles of layers 1 and 2 could generate a large dataset, but it introduces several challenges. As the number of data points increases, the risk of outliers rises, which can adversely affect the model’s performance. Additionally, very small intervals can significantly increase the computational time and reduce processing efficiency. Furthermore, including every possible angle in the training data may complicate the assessment of the machine learning algorithm’s accuracy with unseen data, potentially leading to overfitting. To address these concerns, layers 1 and 2 were trained with stacking angles in 5-degree increments, resulting in a dataset of 1369 data points.

3.2.1. Analytical Approaches

As observed from Equations (1) to (4), changing the stacking configuration alters the ABD matrix required for the calculations. Manually inputting these data for each case is not only cumbersome and time-consuming, but also prone to errors and inconsistencies. Additionally, this approach would require reworking the process for future models. To address these challenges and efficiently manage structured datasets, a graphical user interface (GUI) was created using Python (version 3.8) with Tkinter (version 8.6) [29], as shown in Figure 6. This was organized into four frames: material definition, layer configuration, composite properties, and buckling pressure calculation.
  • Composite material properties such as elastic modulus, shear modulus, and Poisson’s ratio are defined;
  • A layer is composed by inputting the material, stacking angle, and thickness;
  • It assembles the laminate, computes the ABD matrix, and calculates engineering constant;
  • Buckling pressure was calculated based on two analytical approaches.

3.2.2. Numerical Approach

The finite element (FE) model and boundary conditions were established in ANSYS Mechanical, while the layer configuration was carried out in ANSYS ACP (Pre), as shown in Figure 7a. In ANSYS Mechanical, the cylindrical shell was modeled using Shell181 elements, with a total of 2441 elements arranged as 60 along the circumferential direction and 40 along the axial direction of the cylinder. The stacking sequence including stacking angles, layer thicknesses, and material properties was then defined in ANSYS ACP (Pre) to accurately represent the composite structure. Boundary and loading conditions were subsequently specified in ANSYS Mechanical to facilitate eigenvalue buckling and nonlinear structural analyses as shown in Figure 7b. The eigenvalue buckling analysis was conducted first to determine the initial imperfection shape, modeled as 0.5% of the cylinder’s radius based on the first buckling eigenmode. This was followed by a nonlinear structural analysis, where a uniform external pressure corresponding to the buckling pressure obtained from the eigenvalue analysis was applied. This nonlinear analysis evaluated the cylinder’s buckling behavior and overall structural response under the applied loading.

3.3. Data Suitability Analysis

Table 3 summarizes the 1369 results obtained from ASME, NASA, and ANSYS. A survey of the buckling pressure distribution for the ANSYS data, along with the distribution of values based on buckling pressure at 1 MPa intervals, is shown in Figure 8a. This indicates a large portion of data in the 3–4 MPa range, while fewer data points were observed in the 2–3 MPa and 4–5 MPa ranges.
Assessing the data suitability is essential for identifying and addressing potential issues such as bias, inaccuracies, or gaps, which can affect the reliability of machine learning models. Box plots, as shown in Figure 8b, are useful for visualizing the data distribution, detecting outliers, and evaluating the spread and central tendency of the dataset.
  • The ASME box plot showed the lowest median and a narrow range, indicating consistently lower buckling pressures;
  • The NASA box plot featured the highest median with a wide range and significant spread above the 75th percentile, reflecting greater variability in the buckling pressure estimates;
  • The ANSYS box plot presented an intermediate median with a balanced range and a more even distribution around the central values, along with fewer extreme outliers compared to the other methods.
Therefore, it can be concluded that ANSYS is the most suitable for applying machine learning models to predict buckling pressure due to its balanced data distribution and overall accuracy. This assessment is supported by the detailed analysis provided in Section 2.3, which highlights ANSYS’s reliable performance and its ability to provide consistent and accurate predictions across a range of data points.

4. Application of Machine Learning for Predicting Buckling Pressure

4.1. Machine Learning Models

Using a machine learning model, it was first determined whether we should use a regression or classification approach. In the present study, regression was chosen to predict a numerical value (the buckling pressure). Various types of regression models were explored to predict buckling pressure in composite cylindrical structures by using the stacking angles of layers 1 and 2 as input features and buckling pressure as the output, training the models to reveal the relationship between these parameters.
  • Linear regression: A basic model that assumes a linear relationship between input and output;
  • Elastic net: A regularization method that combines Lasso and Ridge to improve model performance and prevent overfitting, especially with correlated features;
  • Polynomial regression: Extends linear regression by fitting a polynomial curve to capture more complex relationships;
  • Random forest (RF) regression: An ensemble method that combines multiple decision trees to improve prediction accuracy;
  • Support vector regression (SVR): A model that finds the best fit within a margin of tolerance, effectively handling non-linear relationships;
  • XGBoost regression: An advanced boosting method that optimizes predictive accuracy by combining multiple weak learners in an iterative manner;
  • Artificial neural network (ANN): A neural network designed to learn patterns and relationships in data through interconnected layers of neurons, commonly used for a variety of tasks including classification and regression.

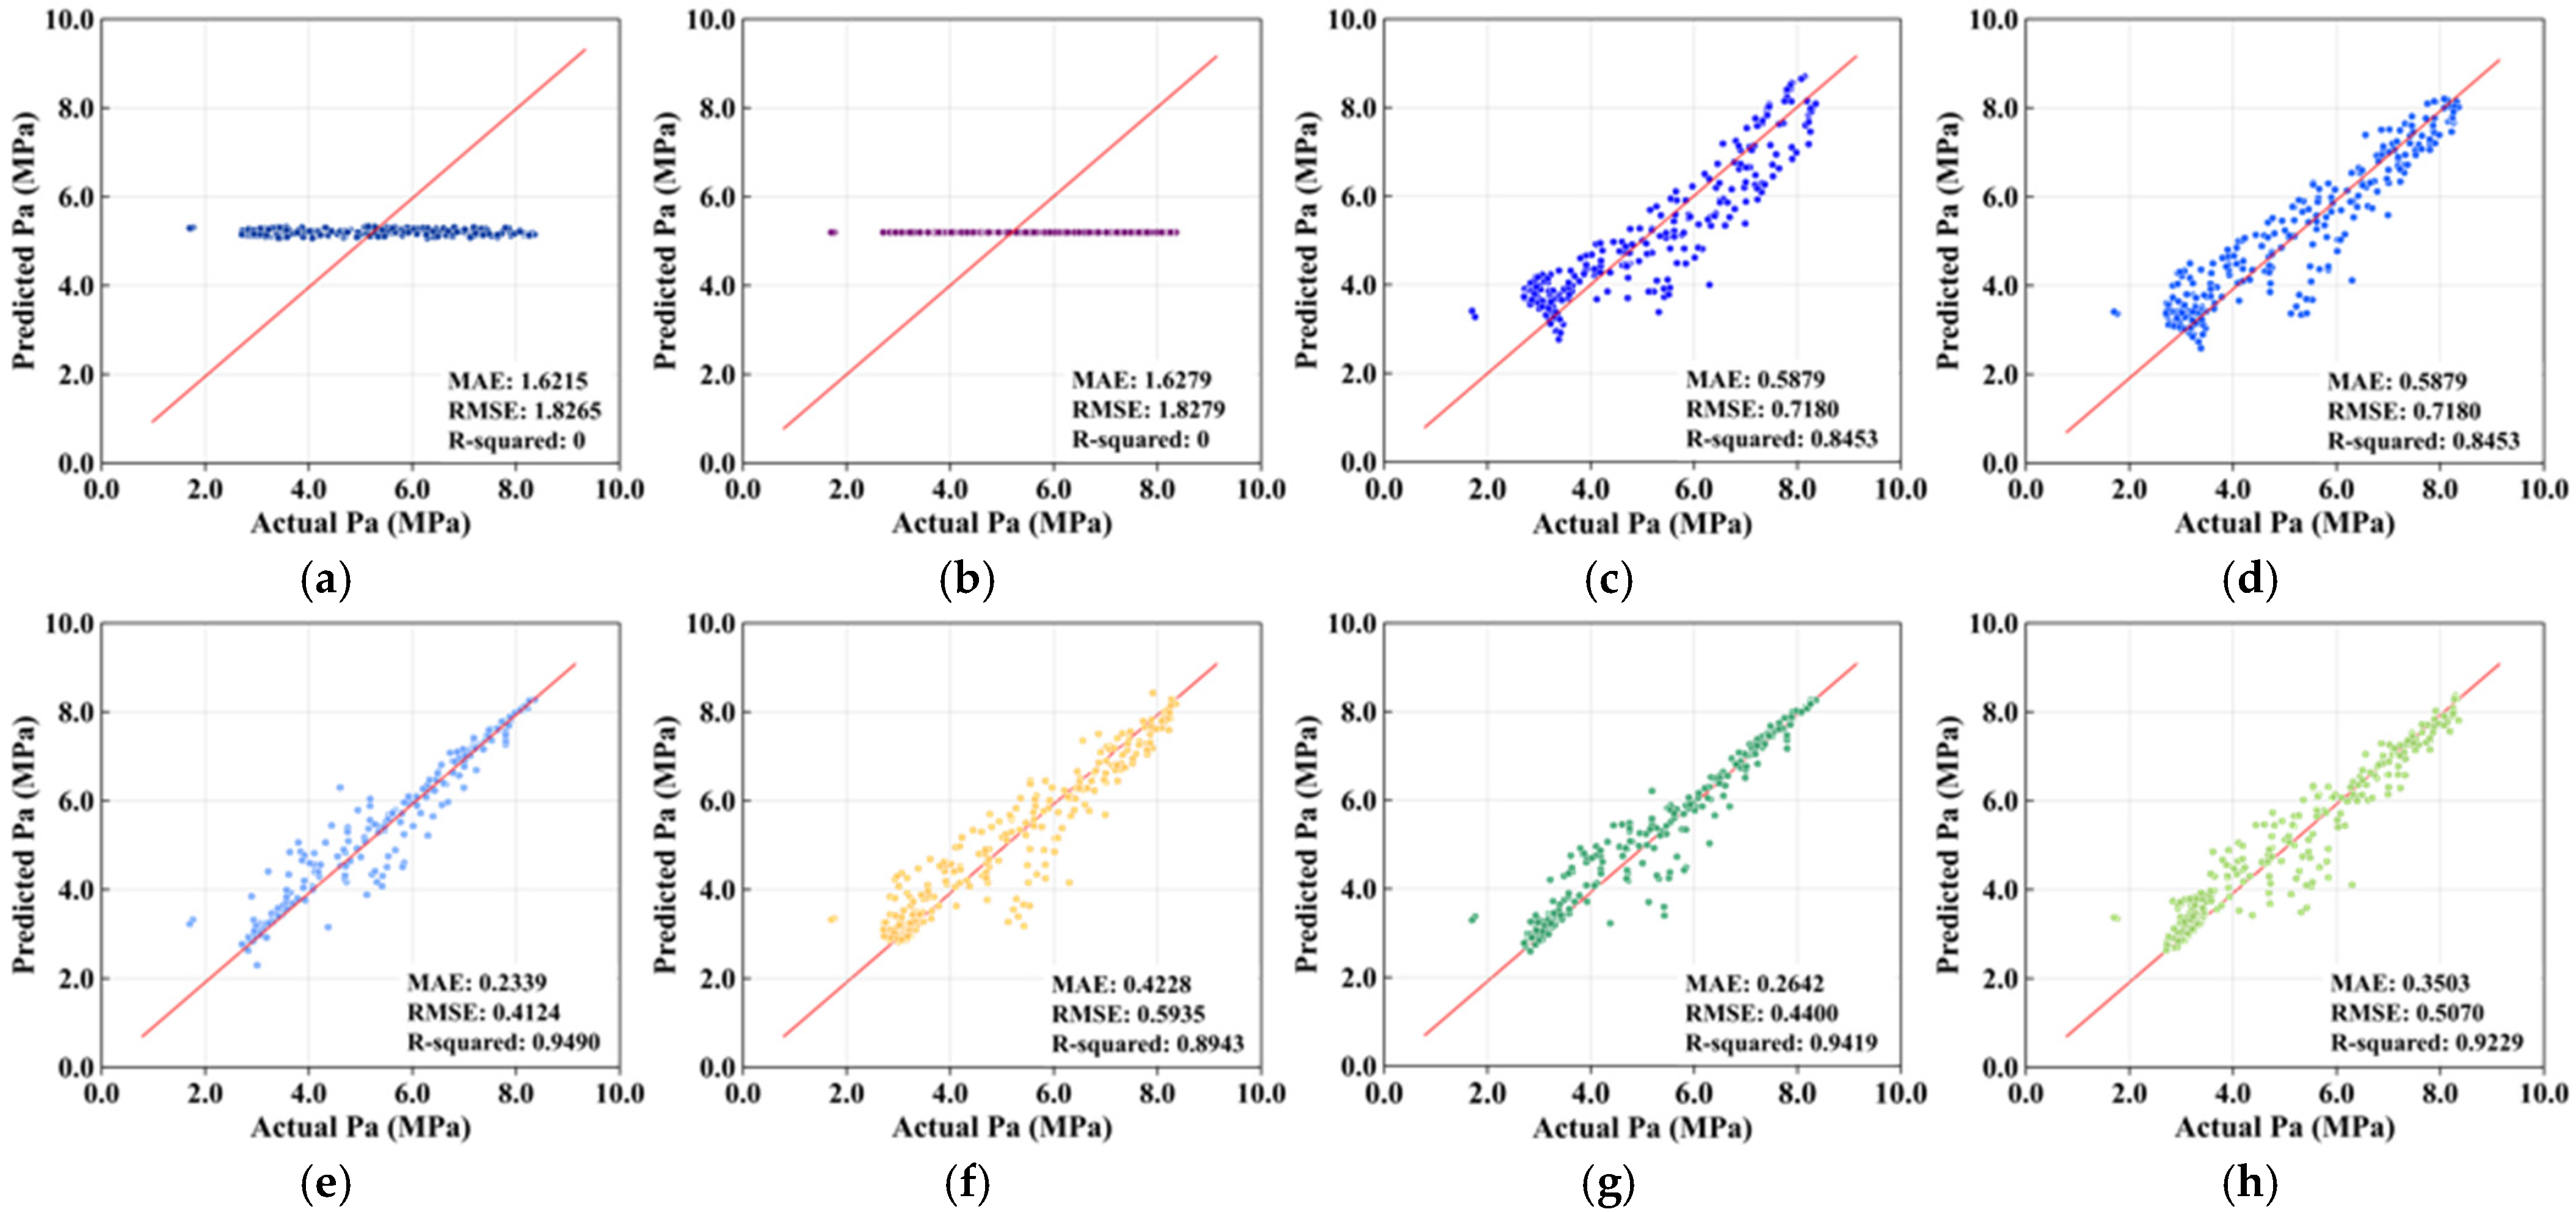
4.2. Model Performance

The ANSYS results were split into 80% for training and 20% for testing. Various regression algorithms, as discussed in the previous section, were applied to evaluate the prediction features. After training, the model’s performance was assessed on the test data by visualizing the scatter plot to examine the gap between the actual and predicted values. Metrics such as the mean absolute error (MAE), root mean squared error (RMSE), and R2 score were calculated to quantify the model’s accuracy, error magnitude, and goodness of fit. Figure 9 illustrates the individual performance of the eight machine learning models. For the polynomial model, second-degree and fourth-degree equations were used. Examining the scatter and values in the graph, random forest and XGBoost showed good results, while linear regression and elastic net failed to track the predicted values and presented similar estimates. Overall, errors were more pronounced in the 4–6 MPa range, where data were sparse compared to other ranges.
To evaluate the accuracy of the regression model’s predictions, various performance metrics were calculated including R2, MAE, RMSE, K-fold cross-validation RMSE, and the F-statistic, as presented in Table 4. The K-fold cross-validation method divides the data into k subsets, training the model on k − 1 subsets and validating it on the remaining subset. This process is repeated k times to provide a reliable estimate of the prediction error and assess the model’s generalizability [30]. According to the table, the similar values of K-fold cross-validation RMSE and RMSE indicate that the model performed consistently across different data splits, demonstrating stability, good generalization, and minimal risk of overfitting or underfitting, suggesting that it should perform well on new data. The F-statistic, a ratio comparing the regression model’s fit to data variability, is calculated using the following formula:
S S R = y ^ i y ¯ 2 ,
S S E = y i y ^ i 2 ,
F = S S R / p 1 S S E / n p
where SSR is the total sum of squares, SSE is the residual sum of squares, p is the number of predictions, and n is the number of samples. A higher F-statistic indicates that the model explains a significant portion of the variance in the data relative to random variation. A higher F-statistic indicates that the model explains a significant portion of the variance in the data relative to random variation. In the case of RF and SVR, a large F-statistic signifies that the model effectively captures the relationship between independent and dependent variables, making it a reliable model for data variability [31].

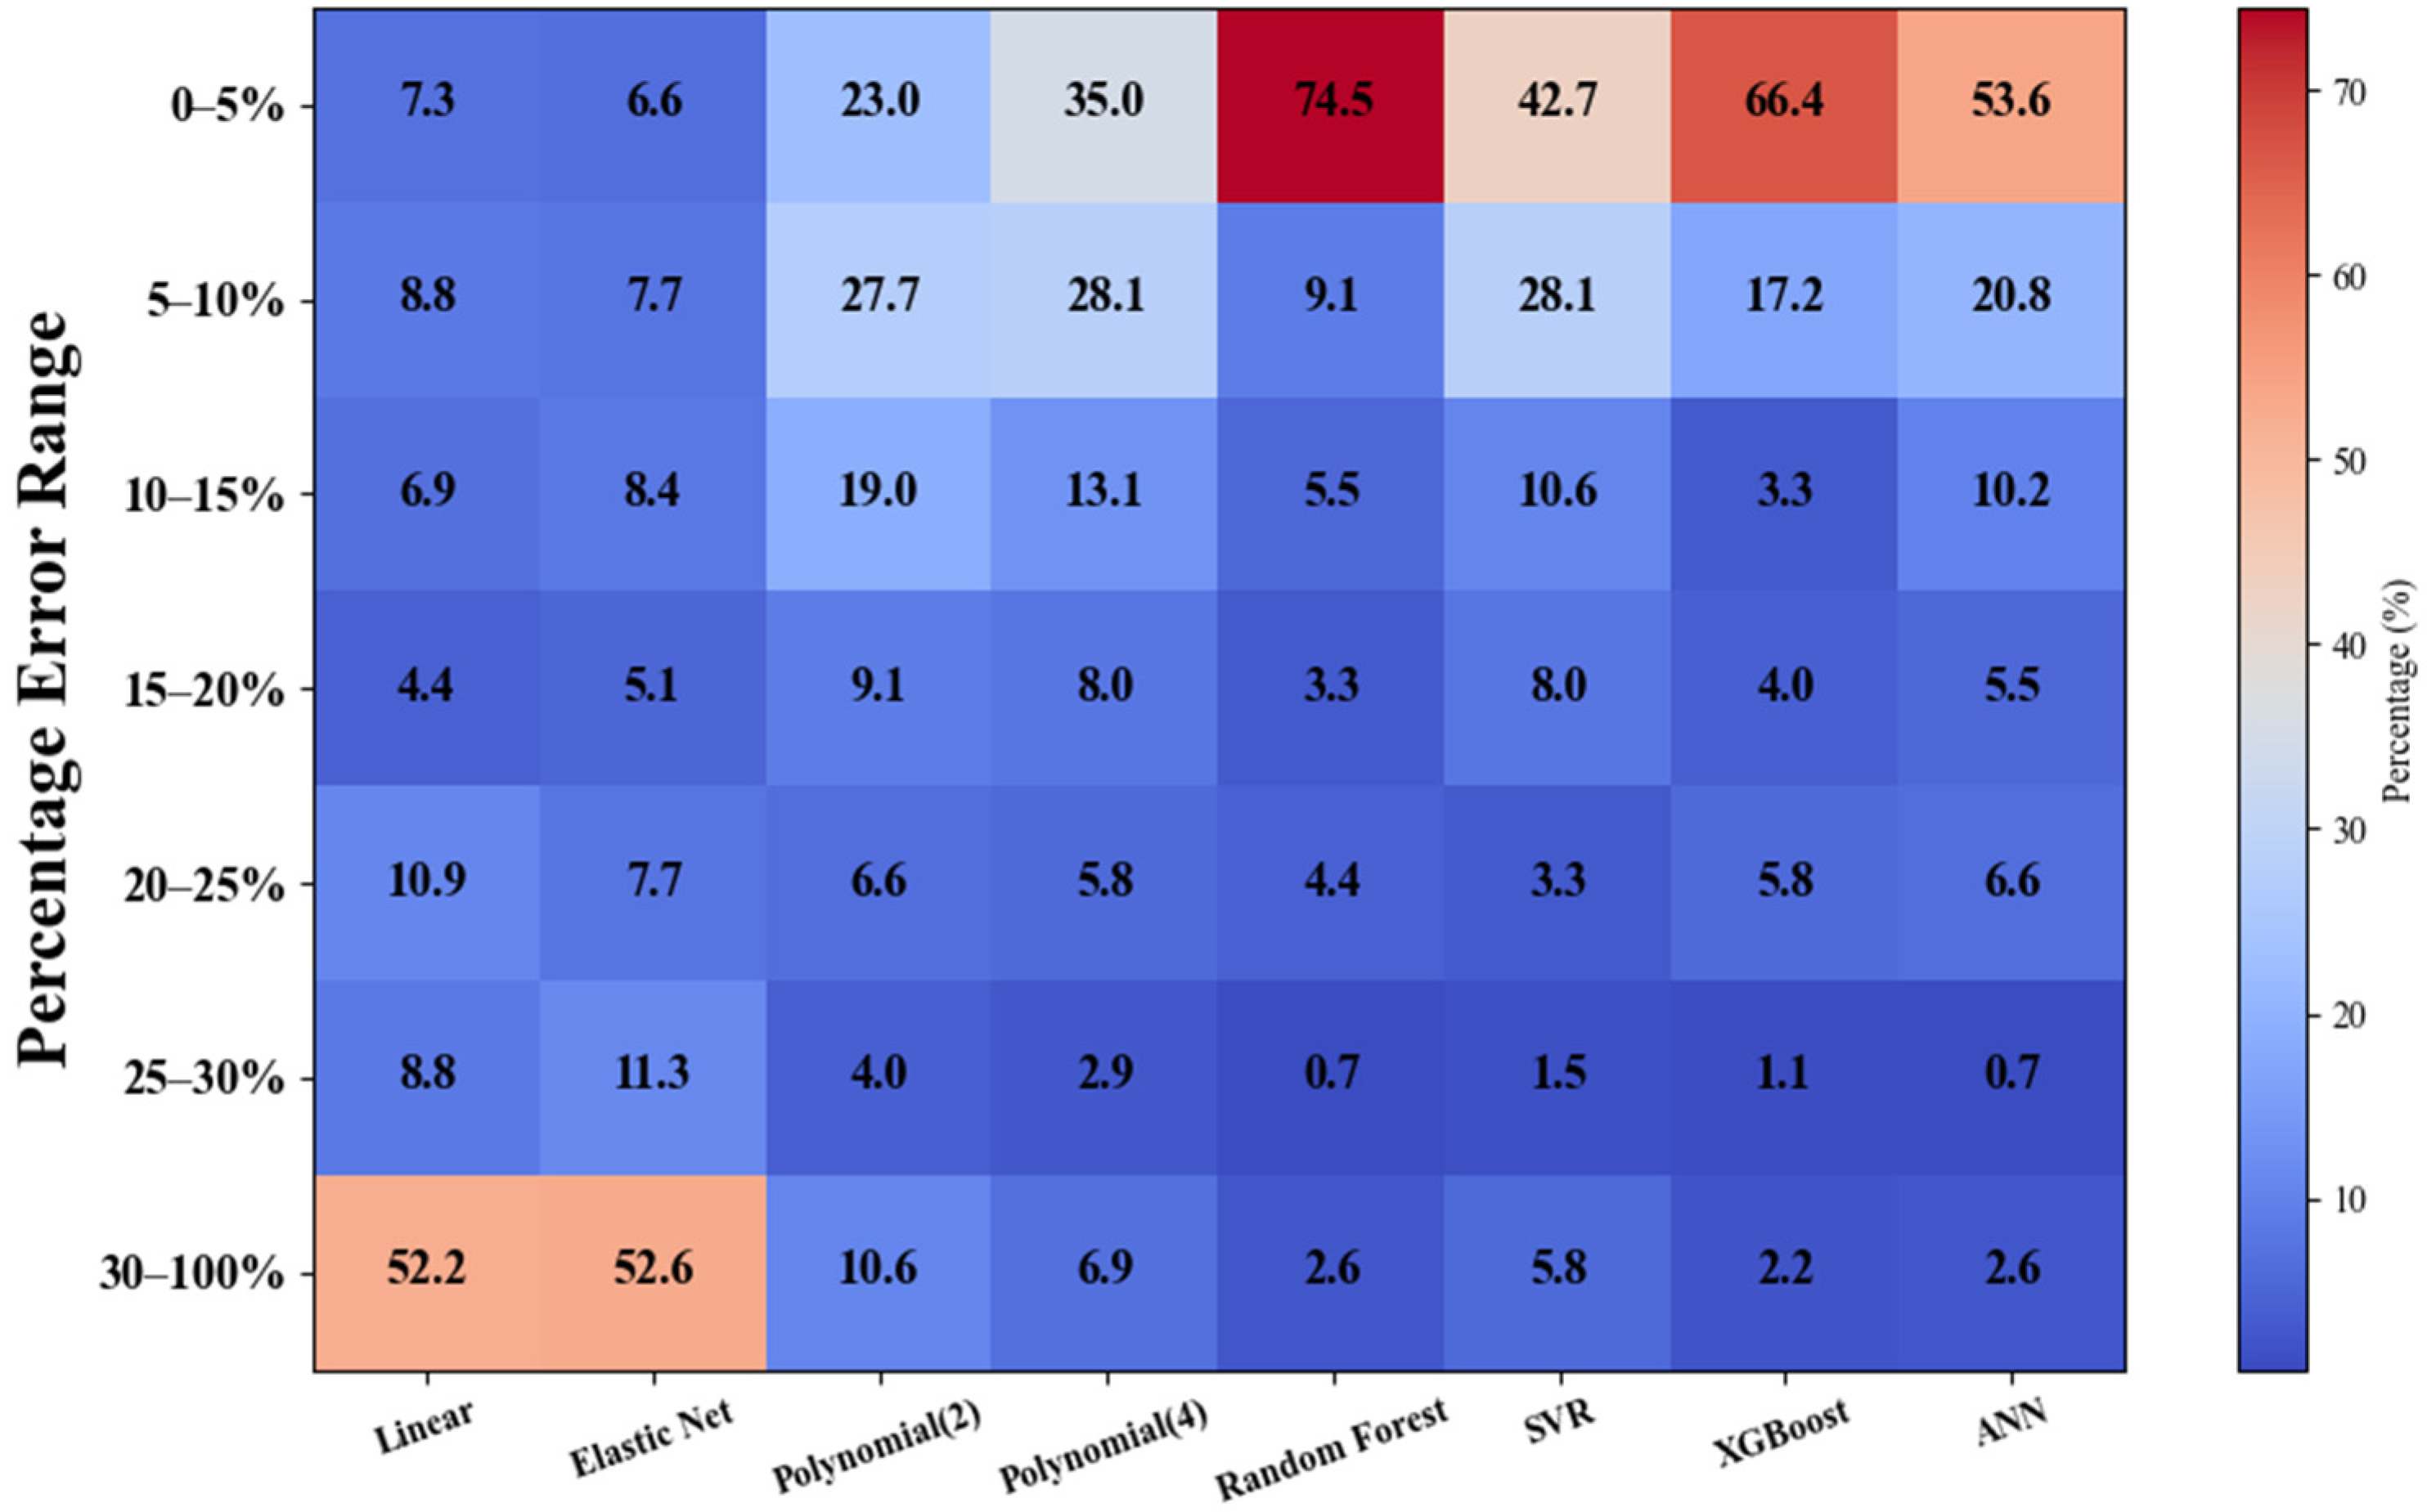
4.3. Comparative Analysis

This section presents two types of comparisons. The first involves constructing a heatmap by discretizing the prediction errors from the eight machine learning models to evaluate their performance. The second comparison assesses the models’ ability to generalize to unseen data by plotting the predicted buckling pressure values against those obtained from ANSYS, allowing for a direct comparison of the model predictions with the actual results.
Figure 10 presents the heatmap showing the error distribution across various machine learning models. Linear regression and elastic net performed poorly, with over 50% of their predictions having errors in the 30–100% range, making them unsuitable for this dataset. Polynomial regression (4th-order) showed better accuracy than the 2nd-order, with 35.0% of predictions within the 0–5% error range. Random forest stood out with 74.5% of predictions in the 0–5% range, demonstrating the highest reliability. XGBoost (66.4%) and SVR (42.7%) also performed well, though SVR had more dispersed errors. The ANN models performed moderately, with 53.6% of predictions in the 0–5% range but with more variability compared to RF or XGBoost. In conclusion, random forest and XGBoost were the most reliable models for predicting buckling pressure in this dataset, offering the highest accuracy and consistency.

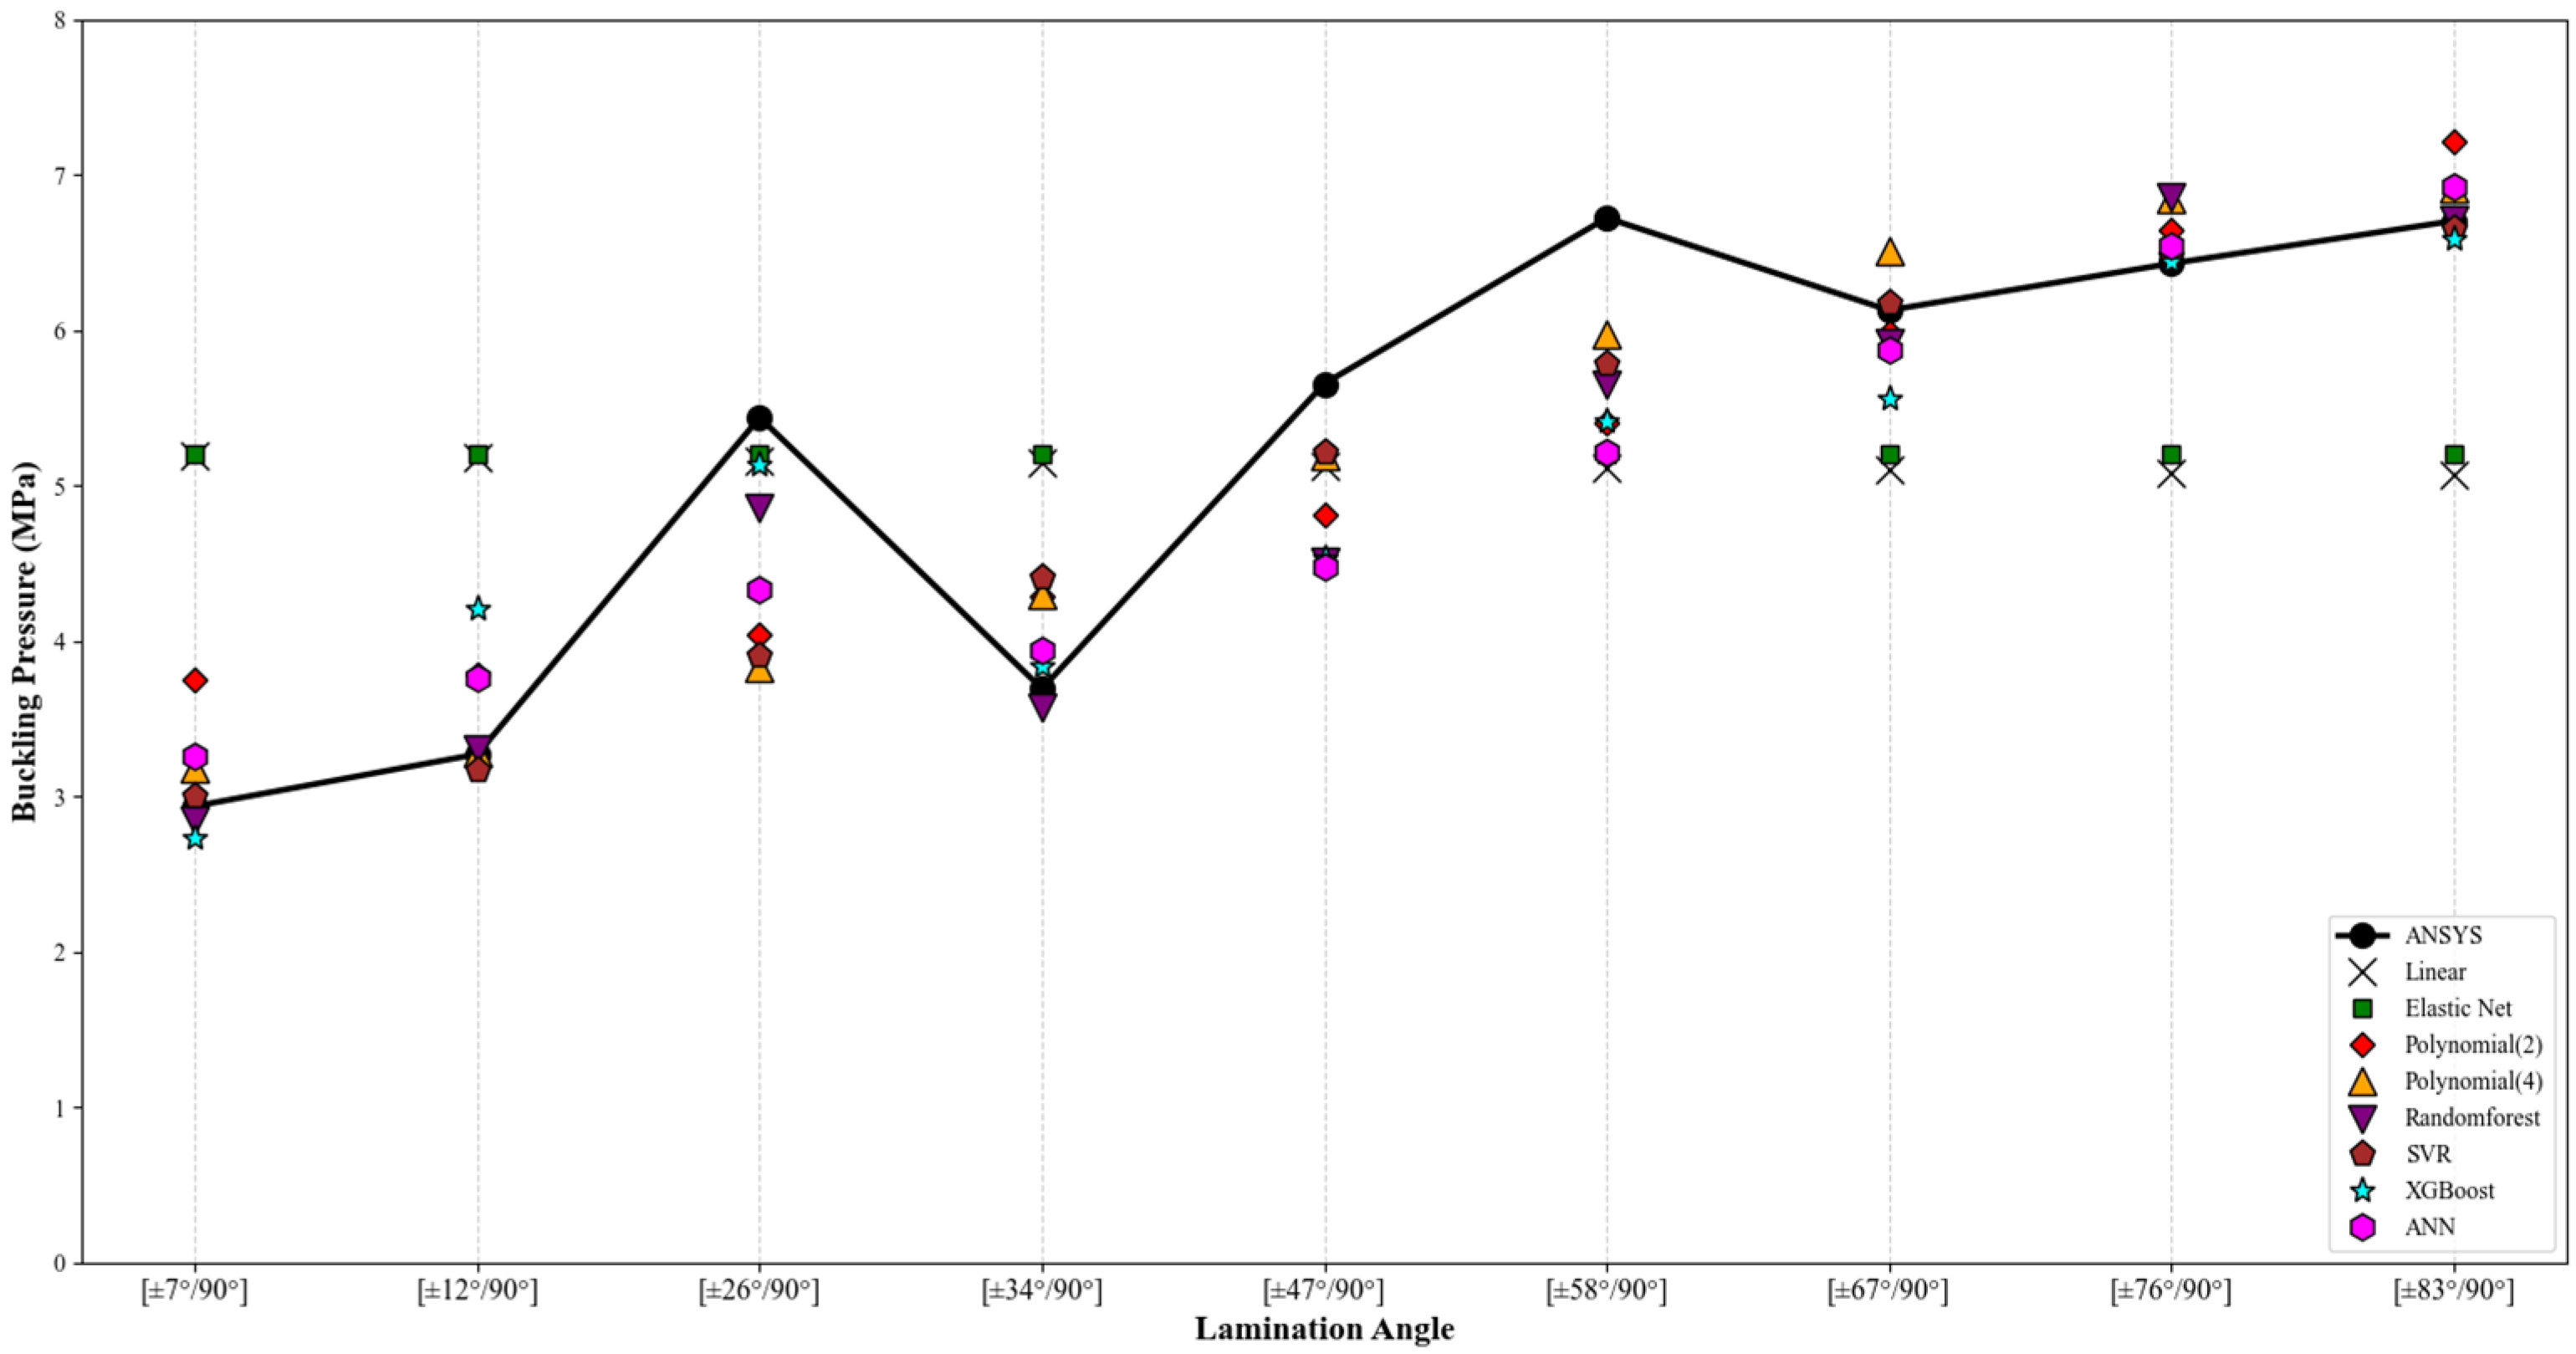
4.4. Out-of-Sample Accuracy Comparison

Figure 11 compares the predicted data with buckling pressure from the ANSYS analysis for nine unseen cases, and the accuracy of these predictions is summarized in Table 5. The 4th-order-polynomial, RF, and SVR models exhibited low error rates, demonstrating superior accuracy. The XGBoost and ANN models showed relatively good performance but with slightly higher error rates. In contrast, the linear regression and elastic net models had higher error rates, indicating lower accuracy.

5. Conclusions

This study demonstrated the effectiveness of integrating advanced machine learning techniques with simulation-based data from finite element analysis (FEA) to predict the buckling pressure of composite cylindrical shells. The key conclusions are as follows:
  • The accuracy of the ASME, NASA, and ANSYS methods was evaluated through comparisons with the experimental data and analyzed using box plots, with ANSYS exhibiting the highest accuracy among the methods evaluated.
  • A total of eight machine learning algorithms were employed to predict the buckling pressure, with their performance systematically evaluated and compared.
  • Eight machine learning algorithms were employed to predict the buckling pressure, with random forest and XGBoost emerging as the most accurate and reliable models. ANN and SVR showed reasonable performance but with more variability, while linear regression and elastic net had high error rates and struggled to capture complex relationships. Polynomial regression (4th-order) showed an improvement over linear methods, but lacked the consistency of the top ensemble models.
The method presented in this study is highly applicable to the design and optimization of composite cylindrical structures in marine industries, where accurate buckling pressure predictions are essential. The key advantages of employing machine learning include its ability to capture complex, nonlinear relationships, enhance predictive accuracy, and reduce the computational time by eliminating the need for traditional ABD matrix calculations based on classical lamination theory. Moreover, machine learning models can be continuously updated with new data, allowing them to adapt to evolving design requirements. However, the method also has certain limitations. Its performance is heavily reliant on the quality and representativeness of the training data, and it may face challenges when generalizing to novel or significantly different structural configurations. Future work will focus on enhancing the model’s accuracy, investigating hybrid approaches, and further validating these models through experimental testing including the consideration of resin properties to improve their practical applicability.

Author Contributions

Conceptualization, J.M.S.; Methodology, J.M.S.; Validation, H.G.L.; Formal analysis, H.G.L. and J.M.S.; Data curation, H.G.L.; Investigation, H.G.L. and J.M.S.; Writing—original draft preparation, H.G.L.; Writing—review and editing, J.M.S.; Visualization, H.G.L.; Supervision, J.M.S.; Project administration, J.M.S.; Funding acquisition, J.M.S. All authors have read and agreed to the published version of the manuscript.

Funding

This research was supported by a National Research Foundation of Korea (NRF) grant funded by the Ministry of Science and ICT, South Korea (NRF-2023R1A2C2002856). Additionally, it was supported by the Regional Innovation Strategy (RIS) through the National Research Foundation of KOREA (NRF), funded by the Ministry of Education (MOE) (2023RIS-007).

Institutional Review Board Statement

Not applicable.

Informed Consent Statement

Not applicable.

Data Availability Statement

The data that support the findings of this study are available from the corresponding author upon request.

Acknowledgments

The material in this paper was presented at the 43rd International Conference on Ocean, Offshore and Arctic Engineering (OMAE 2024) in Singapore.

Conflicts of Interest

The authors declare no conflicts of interest.

References

  1. Davies, P.; Choqueuse, D.; Bigourdan, B.; Chauchot, P. Composite Cylinders for Deep Sea Applications: An Overview. J. Press. Vess. Technol. 2016, 138, 060907. [Google Scholar] [CrossRef]
  2. Shen, K.C.; Pan, G.; Lu, J. Buckling and Layer Failure of Composite Laminated Cylinders Subjected to Hydrostatic Pressure. Sci. Eng. Compos. Mater. 2017, 24, 415–422. [Google Scholar] [CrossRef]
  3. Vasiliev, V.V. Mechanics of Composite Structures, 1st ed.; CRC Press: Boca Raton, FL, USA, 1993. [Google Scholar]
  4. Sun, G.; Mao, R. Optimization of Stiffened Laminated-Composite Circular-Cylindrical Shells for Buckling. Compos. Struct. 1993, 23, 53–60. [Google Scholar] [CrossRef]
  5. Nikbakt, S.; Kamarian, S.; Shakeri, M. A Review on Optimization of Composite Structures Part I: Laminated Composites. Compos. Struct. 2018, 195, 158–185. [Google Scholar] [CrossRef]
  6. Talebitooti, R.; Gohari, H.D.; Zarastvand, M.R. Multi-Objective Optimization of Sound Transmission Across Laminated Composite Cylindrical Shell Lined with Porous Core Investigating Non-Dominated Sorting Genetic Algorithm. Aerosp. Sci. Technol. 2017, 69, 269–280. [Google Scholar] [CrossRef]
  7. Rouhi, M.; Ghayoor, H.; Hoa, S.; Hojjati, M. Computational Efficiency and Accuracy of Multi-Step Design Optimization Method for Variable Stiffness Composite Structures. Thin-Walled Struct. 2017, 113, 136–143. [Google Scholar] [CrossRef]
  8. Cho, Y.S.; Oh, D.H.; Paik, J.K. An empirical formula for predicting the collapse strength of composite cylindrical-shell structures under external pressure loads. Ocean. Eng. 2019, 172, 191–198. [Google Scholar] [CrossRef]
  9. Imran, M.; Shi, D.; Tong, L.; Elahi, A.; Uddin, M. On the elastic buckling of cross-ply composite closed cylindrical shell under hydrostatic pressure. Ocean. Eng. 2011, 227, 108633. [Google Scholar] [CrossRef]
  10. Ehsani, A.; Rezaeepazhand, J. Stacking sequence optimization of laminated composite grid plates for maximum buckling load using genetic algorithm. Int. J. Mech. Sci. 2016, 119, 97–106. [Google Scholar] [CrossRef]
  11. Cho, Y.S.; Paik, J.K. Optimal Lamination Design of Composite Cylinders using an Empirical Ultimate Pressure Load Formula. J. Soc. Nav. Archit. Korea 2019, 56, 316–326. [Google Scholar] [CrossRef]
  12. Hur, S.H.; Son, H.J.; Kweon, J.H.; Choi, J.-H. Postbuckling of composite cylinders under external hydrostatic pressure. Compos. Struct. 2008, 86, 114–124. [Google Scholar] [CrossRef]
  13. Amaechi, C.V.; Gillett, N.; Odijie, A.C.; Hou, X.; Ye, J. Composite risers for deep waters using a numerical modelling approach. Compos. Struct. 2019, 210, 486–499. [Google Scholar] [CrossRef]
  14. Malinowski, M.; Belica, T.; Magnucki, K. Buckling and post-buckling behaviour of elastic seven-layered cylindrical shells—FEM study. Thin-Walled Struct. 2015, 94, 478–484. [Google Scholar] [CrossRef]
  15. Tsouvalis, N.; Zafeiratou, A.; Papazoglou, V. The effect of geometric imperfections on the buckling behaviour of composite laminated cylinders under external hydrostatic pressure. Compos. Part B Eng. 2003, 34, 217–226. [Google Scholar] [CrossRef]
  16. Shen, K.C.; Pan, G. Buckling and strain response of filament winding composite cylindrical shell subjected to hydrostatic pressure: Numerical solution and experiment. Compos. Struct. 2021, 276, 114534. [Google Scholar] [CrossRef]
  17. Moon, C.J.; Kim, I.H.; Choi, B.H.; Kweon, J.H.; Choi, J.H. Buckling of filament-wound composite cylinders subjected to hydrostatic pressure for underwater vehicle applications. Compos. Struct. 2010, 92, 2241–2251. [Google Scholar] [CrossRef]
  18. Joung, T.H.; Lee, C.H.; Hong, S.W.; Kim, J.B.; An, C.W. A study on the results of the pressure vessel design, structural analysis, and pressure test of the semi-autonomous underwater vehicle (SAUV). J. Ocean. Eng. Technol. 2004, 18, 52–58. [Google Scholar]
  19. Pathan, M.V.; Ponnusami, S.A.; Pathan, J.; Pitisongsawat, R.; Erice, B.; Petrinic, N.; Tagarielli, V.L. Predictions of the mechanical properties of unidirectional fib composites by supervised machine learning. Sci. Rep. 2019, 9, 13964. [Google Scholar] [CrossRef]
  20. Wagner, H.N.R.; Köke, H.; Dähne, S.; Niemann, S.; Hühne, C.; Khakimova, R. Decision tree-based machine learning to optimize the laminate stacking of composite cylinders for maximum buckling load and minimum imperfection sensitivity. Compos. Struct. 2019, 220, 45–63. [Google Scholar] [CrossRef]
  21. Zhang, Z.; Shi, J.; Yu, T.; Santomauro, A.; Gordon, A.; Gou, J.; Wu, D. Predicting flexural strength of additively manufactured continuous carbon fiber-reinforced polymer composites using machine learning. J. Comput. Inf. Sci. Eng. 2020, 20, 061015. [Google Scholar] [CrossRef]
  22. Zhang, C.; Li, Y.; Jiang, B.; Wang, R.; Liu, Y.; Jia, L. Mechanical properties prediction of composite laminate with FEA and machine learning coupled method. Compos. Struct. 2022, 299, 116086. [Google Scholar] [CrossRef]
  23. Cui, R.; Yang, H.; Li, J.; Xiao, Y.; Yao, G.; Yu, Y. Machine learning-based prediction of compressive strength in circular FRP-confined concrete columns. Front. Mater. 2024, 11, 1408670. [Google Scholar] [CrossRef]
  24. Nettles, A.T. Basic Mechanics of Laminated Composite Plates; No. NASA-RP-1351; NASA: Washington, DC, USA, 1994. [Google Scholar]
  25. Raju, I.S.; Wang, J.T. Classical laminate theory models for woven fabric composites. Compos. Technol. Res. 1994, 16, 289–303. [Google Scholar] [CrossRef]
  26. Weingarten, V.I.; Seide, P.; Peterson, J.P. Buckling of Thin-Walled Circular Cylinders; No. NASA-SP-8007; NASA: Washington, DC, USA, 1968. [Google Scholar]
  27. ASME. ASME Boiler and Pressure Vessel Code, Section X: Fiber-Reinforced Plastic Pressure Vessel; ASME: New York, NY, USA, 2007. [Google Scholar]
  28. ANSYS. Available online: https://www.ansys.com/products/ansys-workbench (accessed on 7 November 2024).
  29. Shipman, J.W. Tkinter 8.5 reference: A GUI for Python. N. Mex. Tech. Comput. Cent. 2013, 54, 356–359. [Google Scholar]
  30. Fushiki, T. Estimation of prediction error by using K-fold cross-validation. Stat. Comput. 2011, 21, 137–146. [Google Scholar] [CrossRef]
  31. Weir, B.S.; Hill, W.G. Estimating F-statistics. Annu. Rev. Genet. 2002, 36, 721–750. [Google Scholar] [CrossRef] [PubMed]
Figure 1. Overview of the research flow in this study.
Jmse 12 02301 g001
Figure 2. Composite lamination in ANSYS ACP (Pre): (a) fiber direction; (b) stacking information.
Jmse 12 02301 g002
Figure 3. Comparison of the experimental and calculated buckling pressure [12,26,27].
Jmse 12 02301 g003
Figure 4. Detailed drawing of the composite cylinder model.
Jmse 12 02301 g004
Figure 5. Buckling strength from ANSYS for various hoop ratios.
Jmse 12 02301 g005
Figure 6. GUI program developed to apply the NASA and ASME equations.
Jmse 12 02301 g006
Figure 7. FE model illustrating the extent, boundary conditions, and loading conditions: (a) cylinder model; (b) loading and boundary conditions.
Jmse 12 02301 g007
Figure 8. Buckling pressure distribution: (a) frequency distribution for ANSYS data; (b) box plots.
Jmse 12 02301 g008
Figure 9. Comparison of performance across 8 machine learning models: (a) linear regression; (b) elastic net; (c) 2nd-order polynomial; (d) 4th-order polynomial; (e) RF; (f) SVR; (g) XGBoost; (h) ANN.
Jmse 12 02301 g009
Figure 10. Error distribution across models.
Jmse 12 02301 g010
Figure 11. Comparison of ANYS with the predicted buckling pressure from various machine learning models for unseen data.
Jmse 12 02301 g011
Table 1. Machine learning applications for predicting structural strength [19,20,21,22,23].
ObjectiveStructure TypeML ModelInputOutputReference
Evaluate failure strength under different loading conditionsCFRP with different laminate stackingArtificial neural network (ANN)Fiber orientation
load conditions
Failure strength[19]
Optimize stacking for max. buckling load, min. imperfectionComposite cylindrical ShellsDecision treeStacking sequence
imperfection
Buckling load
imperfection
[20]
Predict mechanical properties and assess design parameter’s impactCFRP composite laminateNeural networks Random forestLaminate lay-up
material properties
Mechanical properties[21]
Predict flexural strength of additively manufactured CCFRPCCFRP composites by FDMEnsemble learningFiber layers,
fiber rings,
infill patterns
Flexural strength[22]
Predict buckling pressure and failure behaviorComposite pressure vesselsRandom forestMaterial properties
geometrical features
Buckling pressure[23]
Table 2. Calibrated mechanical properties of T700-24K (adapted from [17]).
Elastic Modulus (GPa)Poisson’s Ratio
(−)
Shear Strength
(GPa)
Tensile Strength
(MPa)
Shear Strength
(MPa)
E 1 E 2 E 3 ν 12 ν 13 ν 23 G 12 G 13 G 23 σ X u σ Y u σ Z u τ x y τ y z τ z x
1218.68.60.2530.2530.4213.353.352.6820603232454564
Table 3. A brief summary of results obtained from ASME, NASA, and ANSYS.
No.t1 (mm)θ1 (Degree)t2 (mm)θ2 (Degree)Pcr_ASME (MPa)Pcr_NASA (MPa)Pcr_ANSYS (MPa)
13.2−903.2−905.73213.7036.621
23.2−903.2−855.69413.6796.859
33.2−903.2−805.60613.6047.068
13683.2903.2855.69413.6796.584
13693.2903.2905.73213.7036.515
Table 4. Summary of accuracy metrics (MAE, RMSE, R2) and K-fold cross-validation RMSE, F-statistic between predicted and actual values.
ModelR2MAERMSEK-Fold Cross-Validation
RMSE
F-Statistic
Linear regression01.6211.8261.7590.981
Elastic net01.6281.8281.756−0.141
Polynomial regression (2)0.8450.5880.7180.72549.784
Polynomial regression (4)0.8790.4800.6340.6362.229
RF0.9490.2340.4120.383996.875
SVR0.8940.4230.5930.591453.527
XGBoost0.9420.2640.4400.403869.074
ANN0.9230.3510.5070.506641.166
Table 5. Buckling pressure from machine learning models vs. ANSYS for unseen data.
Stacking AngleANSYSLinear
(Error %)
Elastic Net
(Error %)
Polynomial (2)
(Error %)
Polynomial (4)
(Error %)
RF
(Error %)
SVR
(Error %)
XGBoost
(Error %)
ANN
(Error %)
[±7°/90°]2.93 5.18 (77%) 5.19 (77%) 3.74 (28%) 3.18 (8%) 2.84 (3%) 3.00 (2%) 2.72 (7%) 3.26 (11%)
[±12°/90°]3.27 5.18 (58%) 5.19 (59%) 3.78 (16%) 3.27 (0%) 3.29 (1%) 3.16 (3%) 4.20 (29%) 3.75 (15%)
[±26°/90°]5.43 5.15 (5%) 5.19 (4%) 4.04 (26%) 3.82 (30%) 4.85 (11%) 3.90 (28%) 5.13 (6%) 4.33 (20%)
[±34°/90°]3.69 5.14 (39%) 5.19 (41%) 4.28 (16%) 4.29 (16%) 3.57 (3%) 4.41 (20%) 3.83 (4%) 3.94 (7%)
[±47°/90°]5.65 5.12 (9%) 5.19 (8%) 4.81 (15%) 5.19 (8%) 4.51 (20%) 5.21 (8%) 4.52 (20%) 4.48 (21%)
[±58°/90°]6.72 5.11 (24%) 5.19 (23%) 5.40 (20%)5.96 (11%) 5.64 (16%) 5.78 (14%) 5.41 (19%) 5.21 (22%)
[±67°/90°]6.12 5.09 (17%) 5.19 (15%) 5.97 (2%) 6.50 (6%) 5.92 (3%) 6.17 (1%) 5.56 (9%) 5.86 (4%)
[±76°/90°]6.42 5.08 (21%) 5.19 (19%) 6.63 (3%) 6.84 (7%) 6.85 (7%) 6.47 (1%) 6.44 (1%) 6.54 (2%)
[±83°/90°]6.70 5.07 (24%) 5.19 (22%) 7.21 (8%) 6.90 (3%) 6.70 (0%) 6.65 (1%) 6.59 (2%) 6.92 (3%)
Disclaimer/Publisher’s Note: The statements, opinions and data contained in all publications are solely those of the individual author(s) and contributor(s) and not of MDPI and/or the editor(s). MDPI and/or the editor(s) disclaim responsibility for any injury to people or property resulting from any ideas, methods, instructions or products referred to in the content.

