Article

Research on a Marine Animal Behavior Recording Tag System Based on Combined Positioning and Recovery

1
Institute of Deep-Sea Science and Engineering, Chinese Academy of Sciences, Sanya 572000, China
2
University of Chinese Academy of Sciences, Beijing 100049, China
3
Hainan Deep-Sea Technology Innovation Center, Sanya 572025, China
4
Sanya Oceanographic Institution, Ocean University of China, Sanya 572025, China
5
State Key Laboratory of Marine Resource Utilization in South China Sea, Hainan University, Haikou 570228, China
*
Authors to whom correspondence should be addressed.
J. Mar. Sci. Eng. 2024, 12(12), 2292; https://doi.org/10.3390/jmse12122292
Submission received: 3 October 2024 / Revised: 26 November 2024 / Accepted: 10 December 2024 / Published: 12 December 2024
(This article belongs to the Special Issue Ocean Observations)

Abstract

:
The ocean represents the cradle of life on Earth, making it essential to comprehend the complex interactions between marine animal behaviors and the physical microstructure of their environments in order to study their behavioral ecology. Due to the vastness of the ocean, traditional observational techniques are constrained by distance, which poses significant challenges for conducting extended and continuous research on marine animal behavior and ecology. To overcome these challenges, this paper introduces a behavior recording tag system incorporating temperature, pressure, and miniature inertial measurement unit (MIMU) sensors as data collection modules. These sensors are integrated with a main control module and a data storage module to gather and archive behavioral and environmental information. A combined positioning recovery method is proposed, developed, and validated to address the issue of retrieving the tag system post data collection. The behavior recording tag system’s performance was assessed through laboratory and pool tests. The findings show that the accuracy of temperature sensor is about 0.01 °C, the accuracy of pressure sensor is approximately 0.5% of full scale, the continuous data collection duration can extend to 3 days, and the recovery window time after surfacing exceeds 7 days, underscoring its viability as a marine animal behavior recorder.

1. Introduction

The ocean, as the origin of life on Earth, supports a diverse array of marine animals that significantly affect human activities and well-being. Studying marine animals is crucial for understanding the ocean, which supports the rational development, utilization, and conservation of marine ecosystems [1]. Marine animal behavior is a key component of their life, interlinked with various ecological and evolutionary processes, including foraging, survival, reproduction, species distribution, and community dynamics [2]. Research into marine animal behavior and ecology often depends on detailed field observations or post-observation video recordings [3]. However, due to the ocean’s vast scale, observed marine animals can readily move beyond optimal observation areas, posing challenges for long-term observations and the generation of comprehensive datasets [4]. The integration of miniature sensors to observe animal behavior and ecological data through predefined software logic and the formation of biologging tags or biologgers are currently hot topics in animal behavior research [5,6].
Current biologging tags can be classified into three types based on their data transmission methods: archival tags [7], satellite-transmitting tags [8], and acoustic telemetry tags [9]. Goldbogen, J.A. et al. [10] developed a noninvasive digital tag with an integrated camera attached to whales’ skin via suction cups to record changes in limb morphology during various physiological behaviors. This archival tag stores data in onboard memory and requires retrieval for data download. When the tag detaches and surfaces, its very high frequency (VHF) transmitter antenna extends above the water, enabling recovery through radio tracking equipment. Boehme, L. et al. [11] developed a CTD–satellite relay data logger (CTD-SDRL) that utilizes Argos satellites for real-time environmental data transmission and achieves subkilometer positioning. This biologging tag, equipped with sensor suites designed and manufactured by Valeport Ltd. (Totnes, UK). [12], measures temperature and salinity with accuracies better than 0.005 °C and 0.02, respectively. Deng, Z.D. et al. [13] developed an injectable acoustic fish tag, featuring a newly designed lithium/carbon fluoride (Li/CFx) microbattery, which offers extended life and reduced weight. During measurements, the acoustic tag transmits the specific juvenile salmon acoustic telemetry system (JSATS) tag code to designated receivers at a 0.5 s pulse repetition interval.
With the advancement of sensor technology and the continuous expansion of the biologging market, the field has seen the emergence of several technically advanced companies, alongside a few self-made biologging tags. The ST-6A1600 biologging tag [14] developed by Telonics (Mesa, AZ, USA) tracked the real-time migration paths, environmental parameter data, and diving behavior of three green turtles. The PD2GT behavioral data recorder [15], developed by Little Leonardo (Tokyo, Japan), observed the biosonar behavior and body movements of finless porpoises. Observational data indicated that finless porpoises extensively search for targets and roll their bodies to expand their search area by adjusting the narrow beam axis of their biosonar. The Mini Pat detachable satellite tag [16], developed by Wildlife Computers (Redmond, WA, USA), was used in a release trial involving 36 yellowfin tuna. The study results revealed that yellowfin tuna exhibit a strong capacity for deep diving and temporary adaptation to low temperatures. Archival tags record data on the tag’s storage medium during the animal’s movement, offering detailed information but necessitating recovery, which often has a low success rate and is generally suitable for animals with predictable migration patterns or habitats [17]. Satellite-transmitting tags send compressed data in real time or with a delay via satellites, but their effectiveness is constrained by battery life and bandwidth, resulting in a smaller dataset [18]. Acoustic telemetry tags are appropriate for smaller or deep-sea animals, transmitting biological activity data to fixed hydrophones, but they are not well-suited for monitoring marine animals with wide-ranging movements [19,20].
To address these challenges, this study aims to develop a marine animal behavior recording tag system utilizing combined positioning recovery. This system records the movement and environmental parameters of marine animals and is designed to detach from the carrier at a predetermined time, surface, and facilitate rapid recovery and complete dataset retrieval through integrated positioning. Key performance metrics, such as power consumption, basic measurement accuracy, and satellite communication capability were assessed, confirming that the system meets its design objectives. The tag system’s complete workflow was tested in laboratory pools and nearshore areas, validating the accuracy of the data and the reliability of the system’s operation, and offering an effective and dependable solution for recording marine animal behavior.
The structure of this article is as follows: Section 2 outlines the architecture of the marine animal behavior recording tag, including its hardware structure and software workflow. Section 3 presents the design and evaluation of the combined positioning and recovery solution. Section 4 provides experimental validation of the integrated tag system. To finish, the conclusions of this paper and suggestions for the direction of future works are put forward in Section 5.

2. Architecture Design

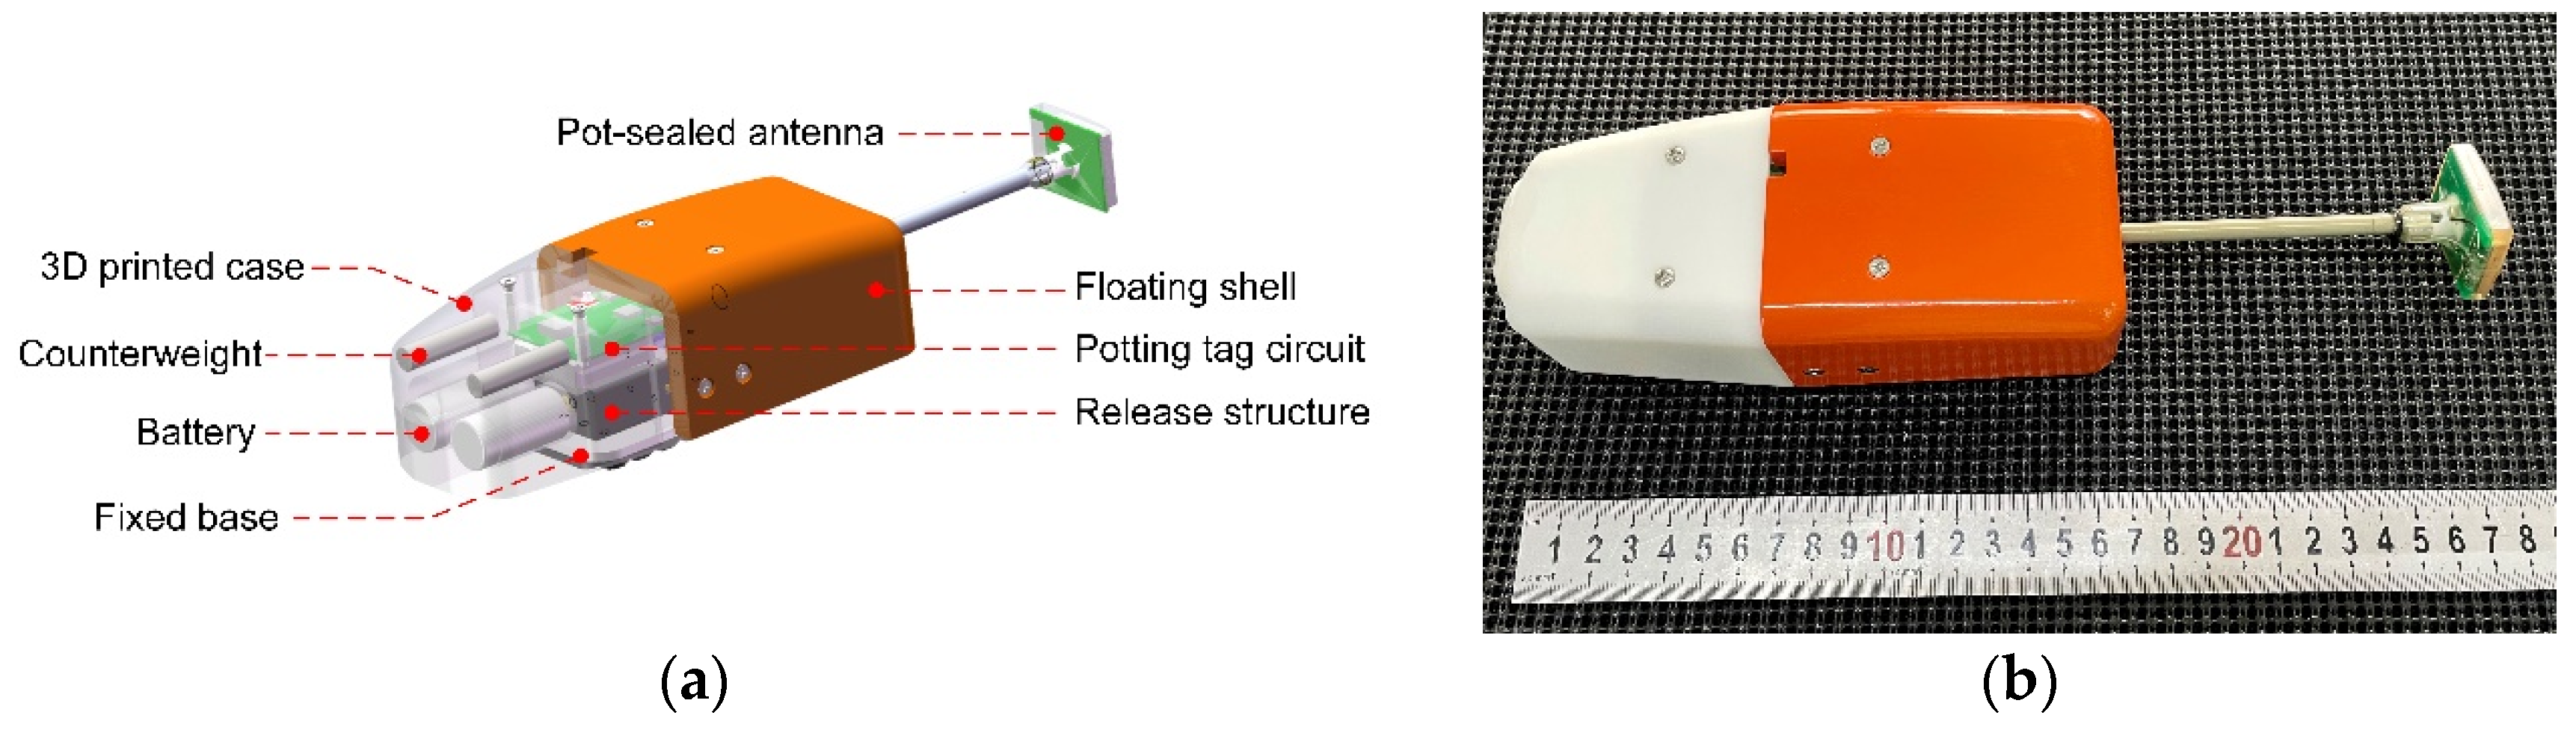
2.1. Tag Structure Design

The structural design of the tag is crucial for ensuring proper functionality and operation. Emphasis is placed on design reliability and hardware integration, taking into account the impact on marine animals as well as the manufacturing and maintenance costs of the system [21]. As illustrated in Figure 1a, the tag system comprises two components: the release base, which is affixed to the animal, and the tag body. The release base is a biodegradable material with little impact on the marine environment and animals. The tag body includes a float shell, resin shell, antenna, and tag circuit. The prototype of the tag system is depicted in Figure 1b.

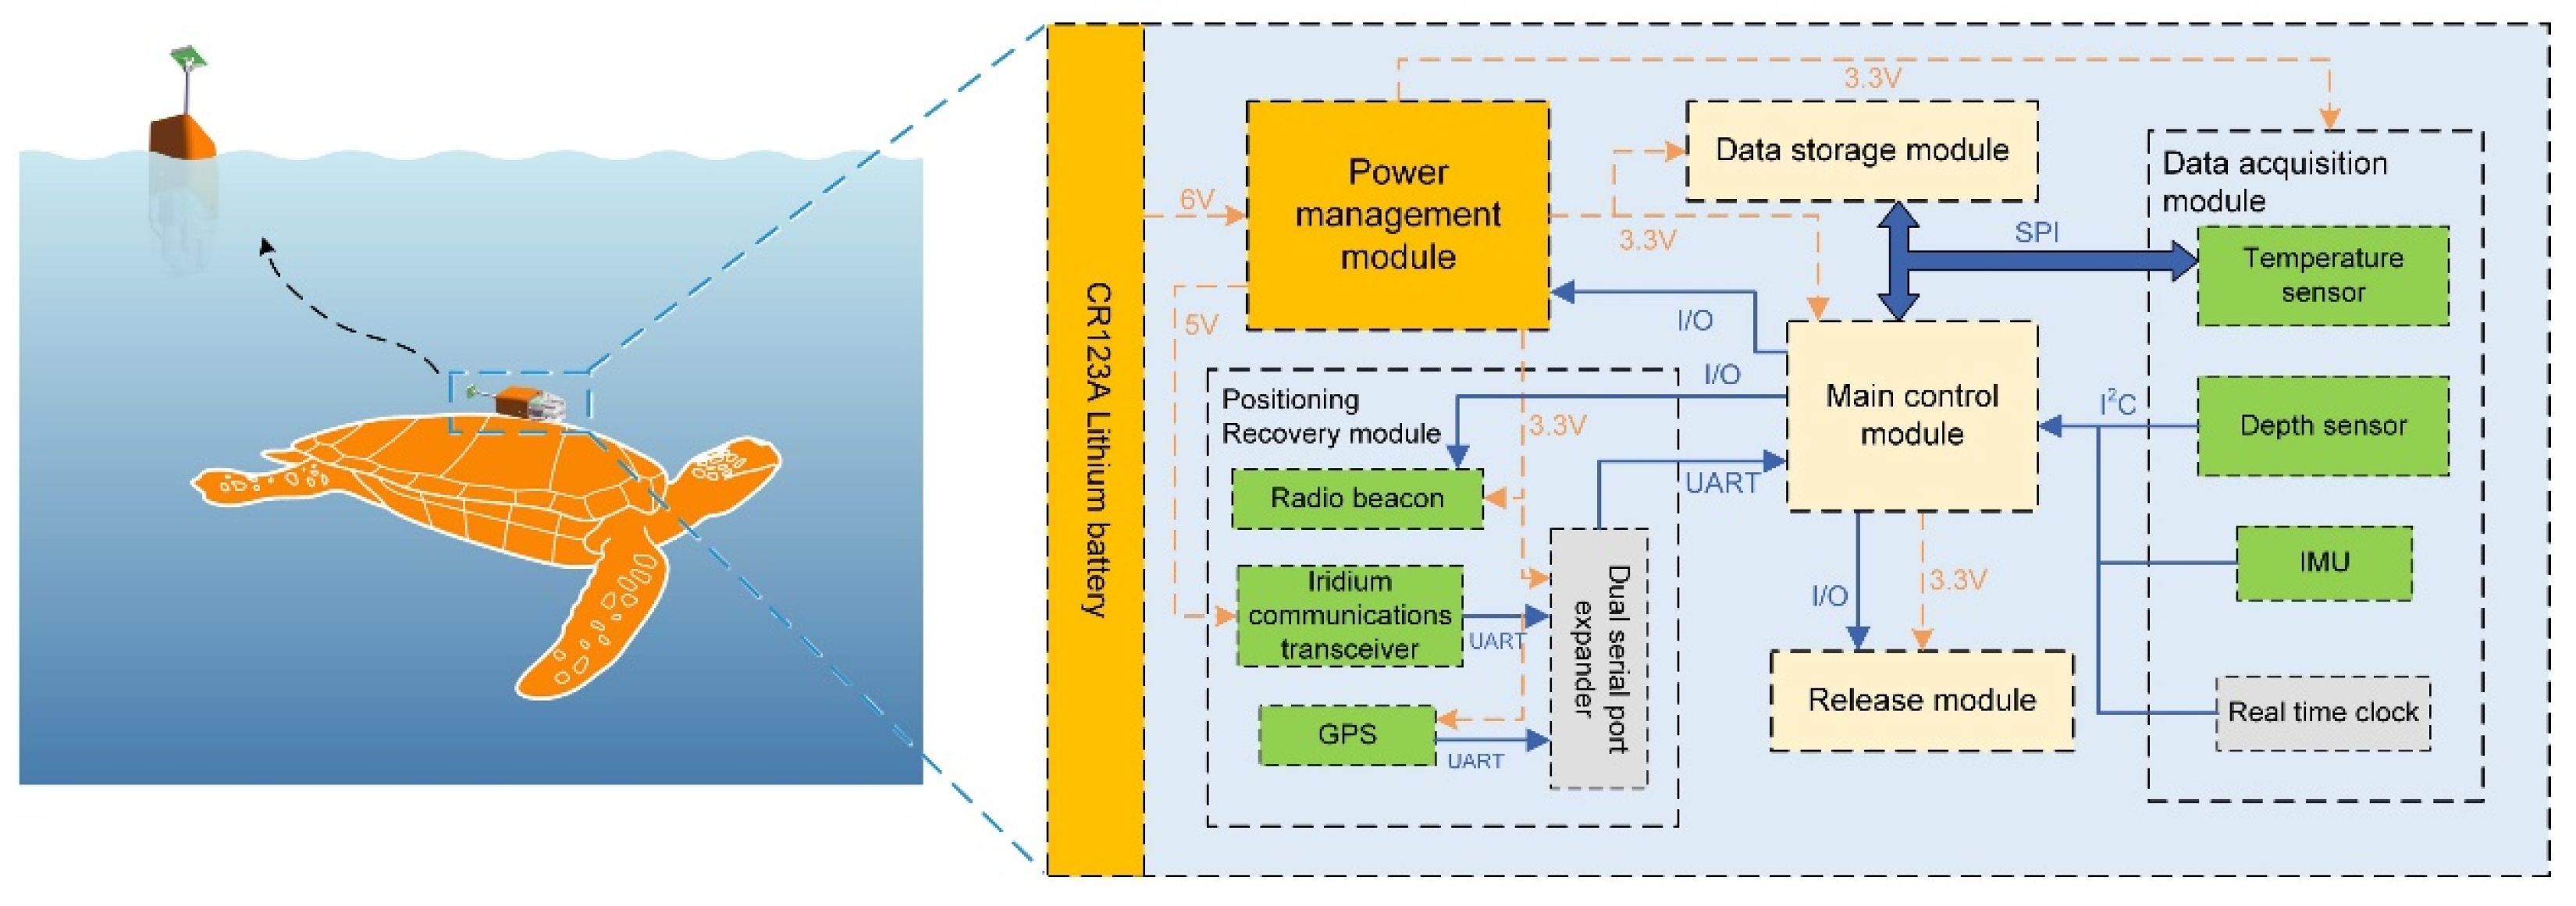
2.2. System Function Design

Adhering to principles of miniaturization and low power consumption while meeting performance criteria, the system is divided into six modules: the power management module, main control module, data storage module, data collection module, release module, and positioning recovery module, as shown in Figure 2. This modular design enables adjustments to the number, combination, and performance of sensors based on specific requirements. The power management module provides power to all other modules. The main control module handles data collection, processing, and storage, and controls the release module to detach the tag body from the base at a predetermined time. The positioning recovery module acquires global positioning system (GPS) positioning data and transmits it to the ship-based terminal via Iridium bidirectional communication [22], issues commands to activate the radio beacon, and utilizes radio direction-finding technology for beacon recovery and data retrieval.

2.2.1. Power Management Module

The power management module employs high-efficiency DC–DC converters and a low quiescent current low-dropout regulator (LDO) to manage a 1550 mAh power supply composed of two CR123A batteries connected in series, which powers the entire system. In sleep mode, the system consumes only 3.9 μA. Once the predetermined working time is reached, the main control module activates the DC–DC boost converter in the release module, elevating the battery voltage from 6 V to 30 V to charge a large capacitor. After the charging cycle is completed, the DC–DC boost converter is deactivated, finishing the charging process of the release circuit’s large capacitor. During Iridium communication, the main control chip manages the DC–DC buck converter via I/O. The Iridium transceiver requires a power supply with a voltage ripple of less than 40 mV, an average current of 145 mA, and a peak current of up to 1.5 A. The chosen DC–DC converter chip features a high switching frequency and a maximum current of 3 A, providing an efficiency greater than 90% within the output voltage range of 5 V and an output current of 100–200 mA. The high conversion efficiency supports low power consumption, and the high switching frequency reduces the inductance value required, thereby minimizing the power supply size to fulfill the system’s miniaturization requirements. As shown in Figure 3, during testing with a 30-ohm load, when a 20 MHz bandwidth limit was used on the oscilloscope and a grounding spring probe was used to reduce the ground loop length and measurement noise, the DC power supply output current was 147 mA, with a measured power ripple peak of about 12 mV, meeting the Iridium transceiver’s requirement for a maximum voltage ripple of less than 40 mV.

2.2.2. Main Control Module and Data Storage Module

The core of the system is an ultralow-power 16-bit MSP430FR series microcontroller unit (MCU), noted for its compact size, extensive peripheral resources, and minimal power consumption. The on-chip ferroelectric random access memory (FRAM) preserves essential system operation information even after a restart or power loss, thereby improving system reliability.
The data storage module utilizes 512 Mbit NOR flash memory, which ensures that animal behavior data are preserved even if the battery is depleted due to its nonvolatile nature. The substantial storage capacity supports data storage needs for at least three days. The NOR flash memory communicates with the main control module via a serial peripheral interface (SPI) bus, storing data processed by the main control module. To minimize current consumption during periods of inactivity, a positive-channel metal-oxide semiconductor (PMOS) transistor is used to efficiently control the power supply to the flash chip.

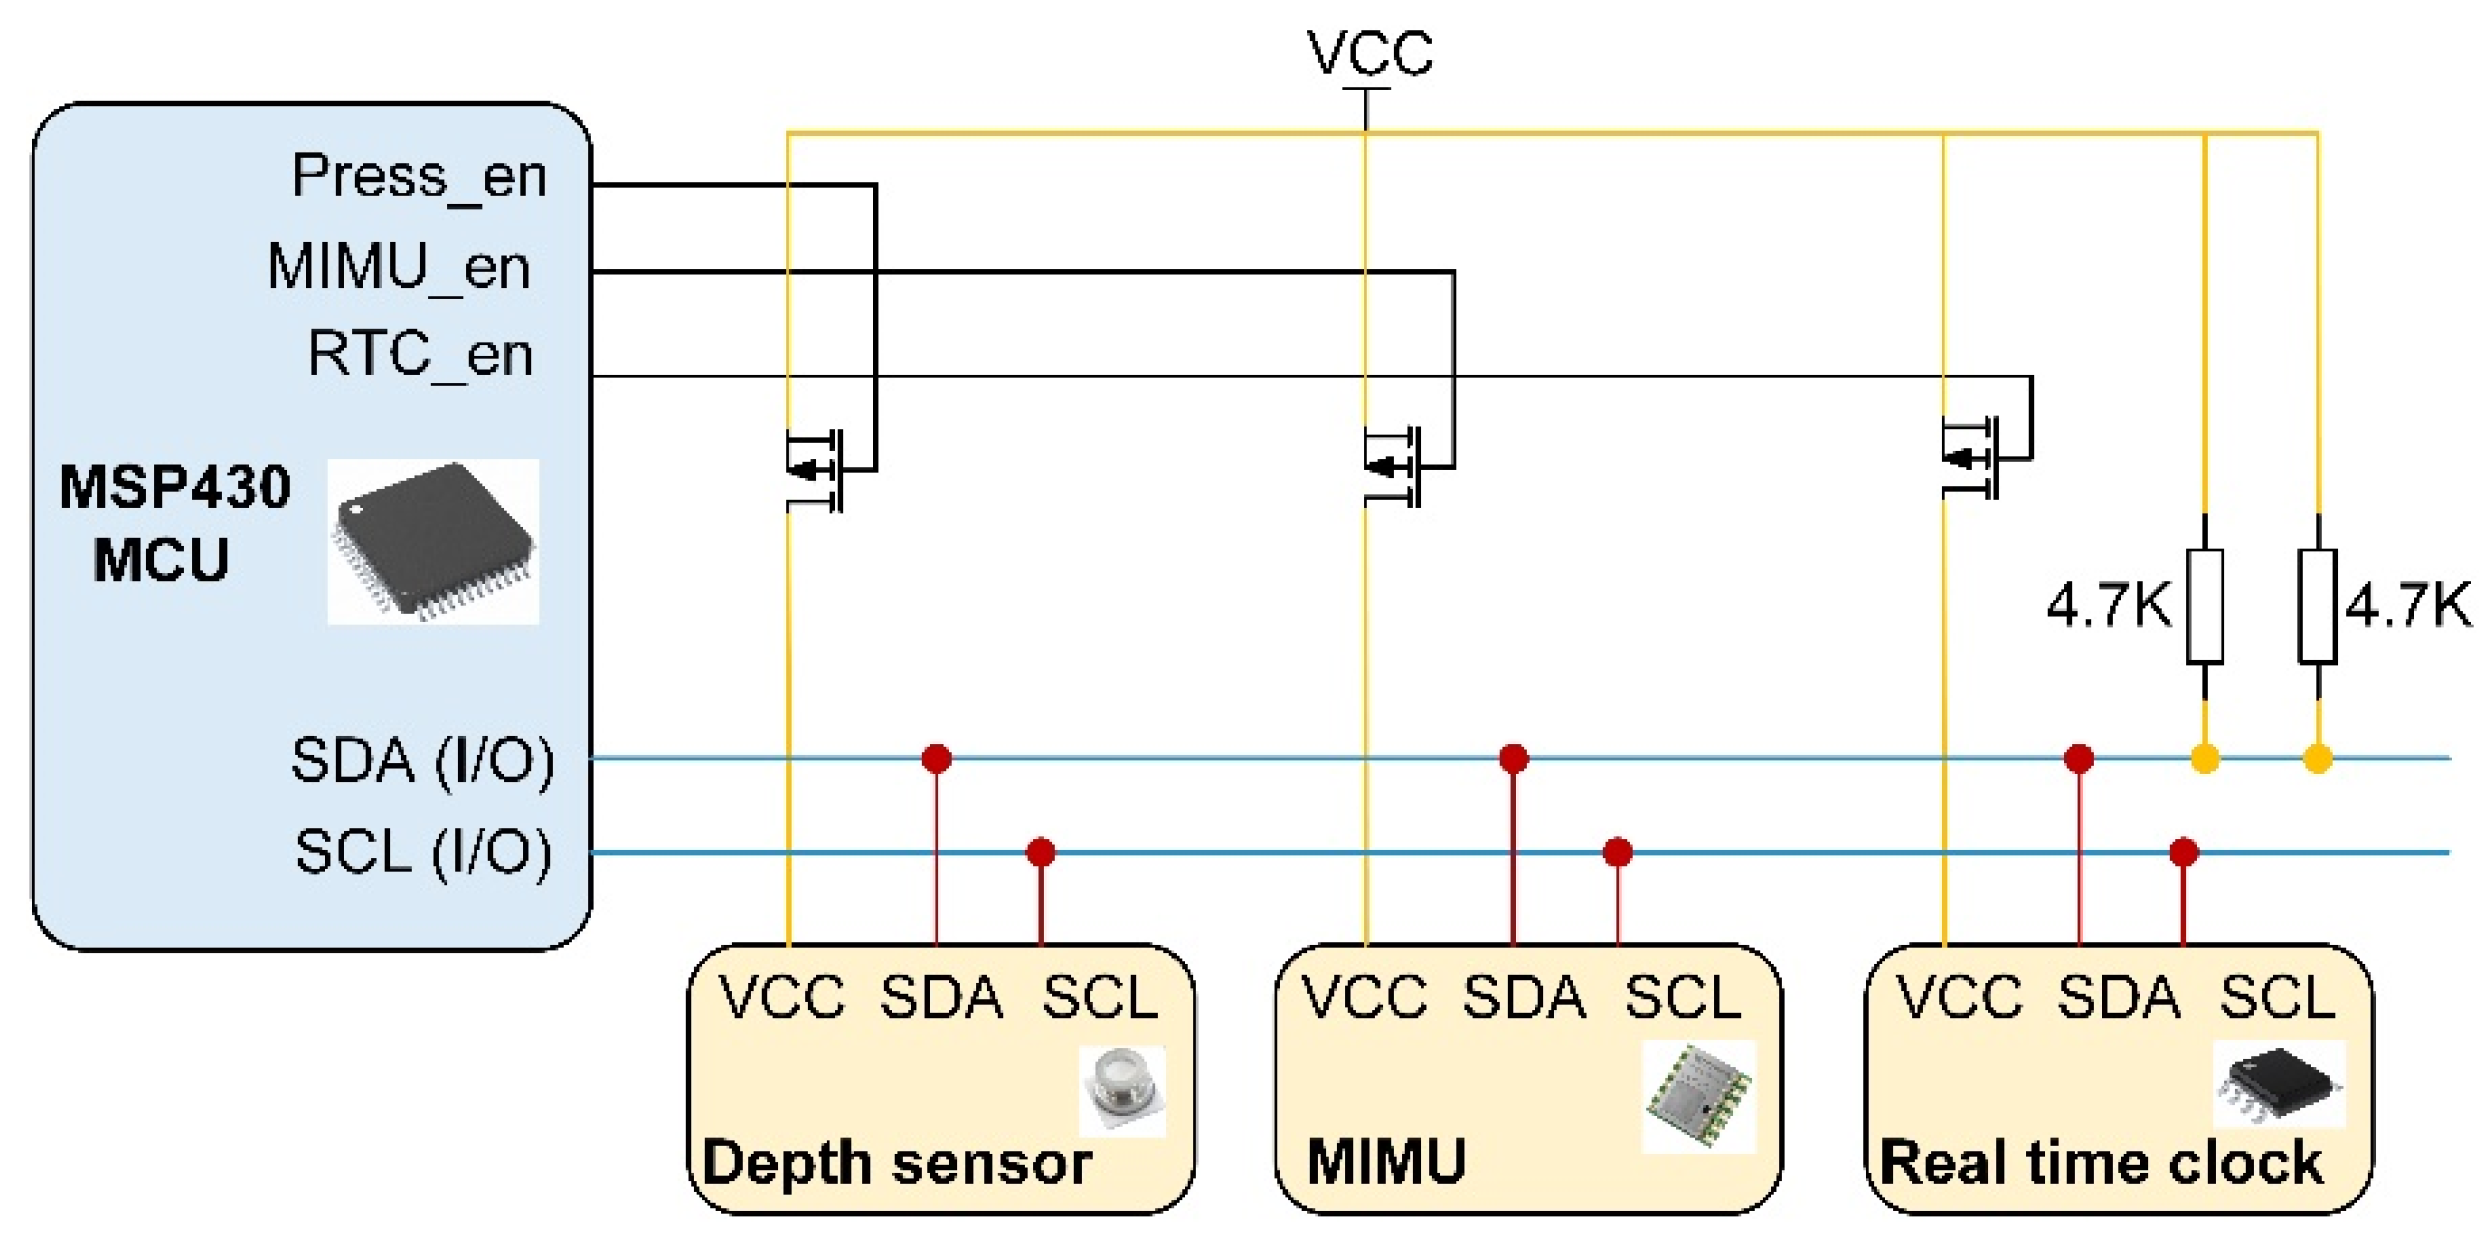
2.2.3. Data Collection Module

To accurately record and monitor marine animal behavior, the data collection module is designed to capture comprehensive behavioral data using the MIMU, pressure sensors, temperature sensors, and real-time clocks, as shown in Figure 4.
The MIMU application introduces a new dimension to marine animal research by measuring and recording parameters such as posture, angular velocity, and acceleration in real time, and providing detailed diving trajectory data [23]. The JY901S module from Wit Motion is selected for the MIMU, supporting a universal asynchronous receiver/transmitter (UART) and I2C communication and integrating an accelerometer, gyroscope, and magnetometer. Equipped with an embedded attitude solver using high-dynamic Kalman filtering, the sensor outputs data at up to 200 Hz, fulfilling the high-frequency sampling requirements.
The inclusion of a pressure sensor enhances the data collection module by monitoring depth changes and providing three-dimensional motion data [24]. The MS5837-30BA water depth pressure sensor from TE Connectivity was chosen for its high linearity and digital output via an I2C bus, recording depth data after processing and temperature compensation. Temperature sensors add a critical dimension to data collection by capturing environmental temperature changes that influence marine animal behavior [25]. The integration of temperature sensors aids in the understanding of habitat selection and migration patterns [26].
Accurate time recording is essential in marine animal behavior research, with the real-time clock (RTC) providing precise time stamps [27,28]. The DS3231 RTC chip is selected for its temperature compensation and low power consumption, ensuring time accuracy while minimizing system power usage.

2.2.4. Release Module and Positioning Recovery Module

The release module and positioning recovery module are key innovative components of the system. The release module charges a large capacitor using a DC–DC boost converter, which is deactivated once the capacitor reaches a specific voltage. The main control module then activates a metal-oxide semiconductor field-effect transistor (MOSFET) to discharge the capacitor through a high-resistance alloy wire, generating heat to melt the high-strength polyvinylidene difluoride (PDVF) line, thereby separating the tag body from the base. The release module circuit is illustrated in Figure 5. The positioning recovery module incorporates an Iridium transceiver, a GPS receiver, and a radio beacon, providing efficient and precise recovery functions [29].

2.3. Embedded Software Design

To facilitate future expansion and enhance code maintainability, the embedded software separates the hardware interface layer from the application logic layer, as shown in Figure 6. The hardware interface layer manages MCU initialization, communication protocols, and peripheral driver implementation, abstracting hardware functions into encapsulated functions. This separation allows the application logic layer to concentrate on specific functions and tasks, simply invoking the encapsulated functions and issuing commands to control the modules.

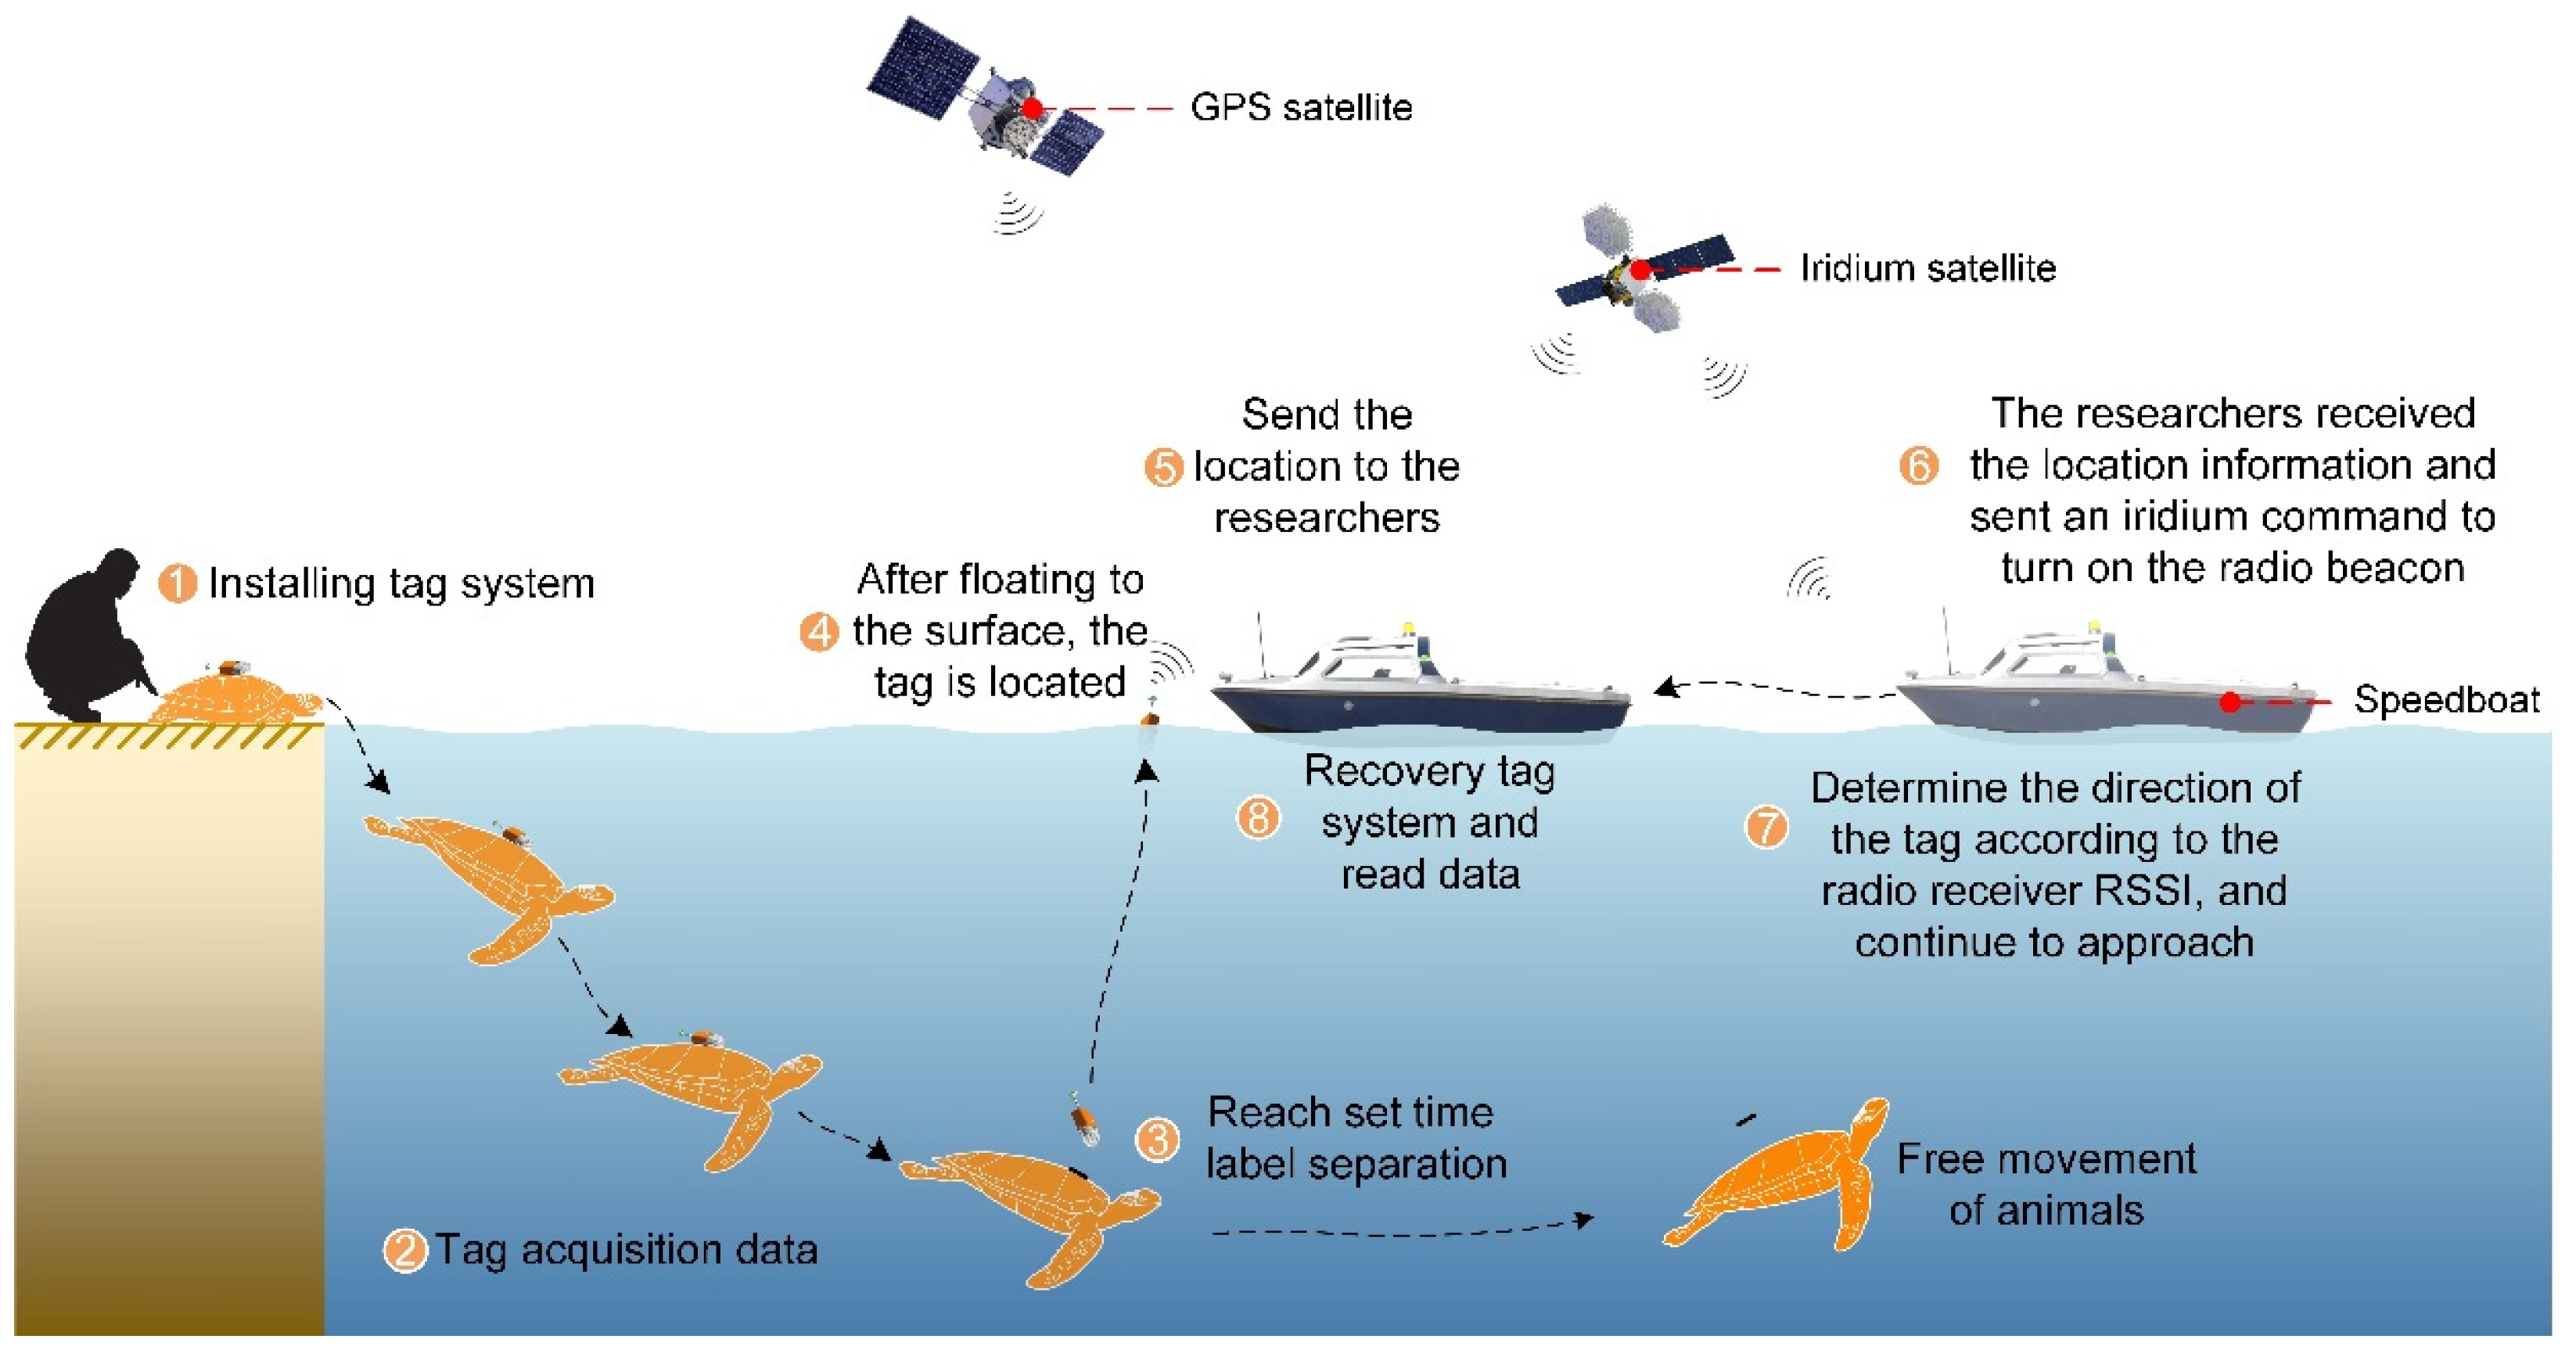
2.4. Workflow Design

As illustrated in Figure 7, the workflow starts with the tag system being attached to the carrier animal onshore, enabling it to move freely while the tag begins data collection. When the preset release time is reached, the release module detaches the tag from the base, allowing it to float to the surface. The tag then transmits GPS information via Iridium, and upon nearing the location, Iridium commands are used to activate the radio beacon. Radio direction-finding techniques are employed to locate and recover the beacon, completing the data retrieval process.

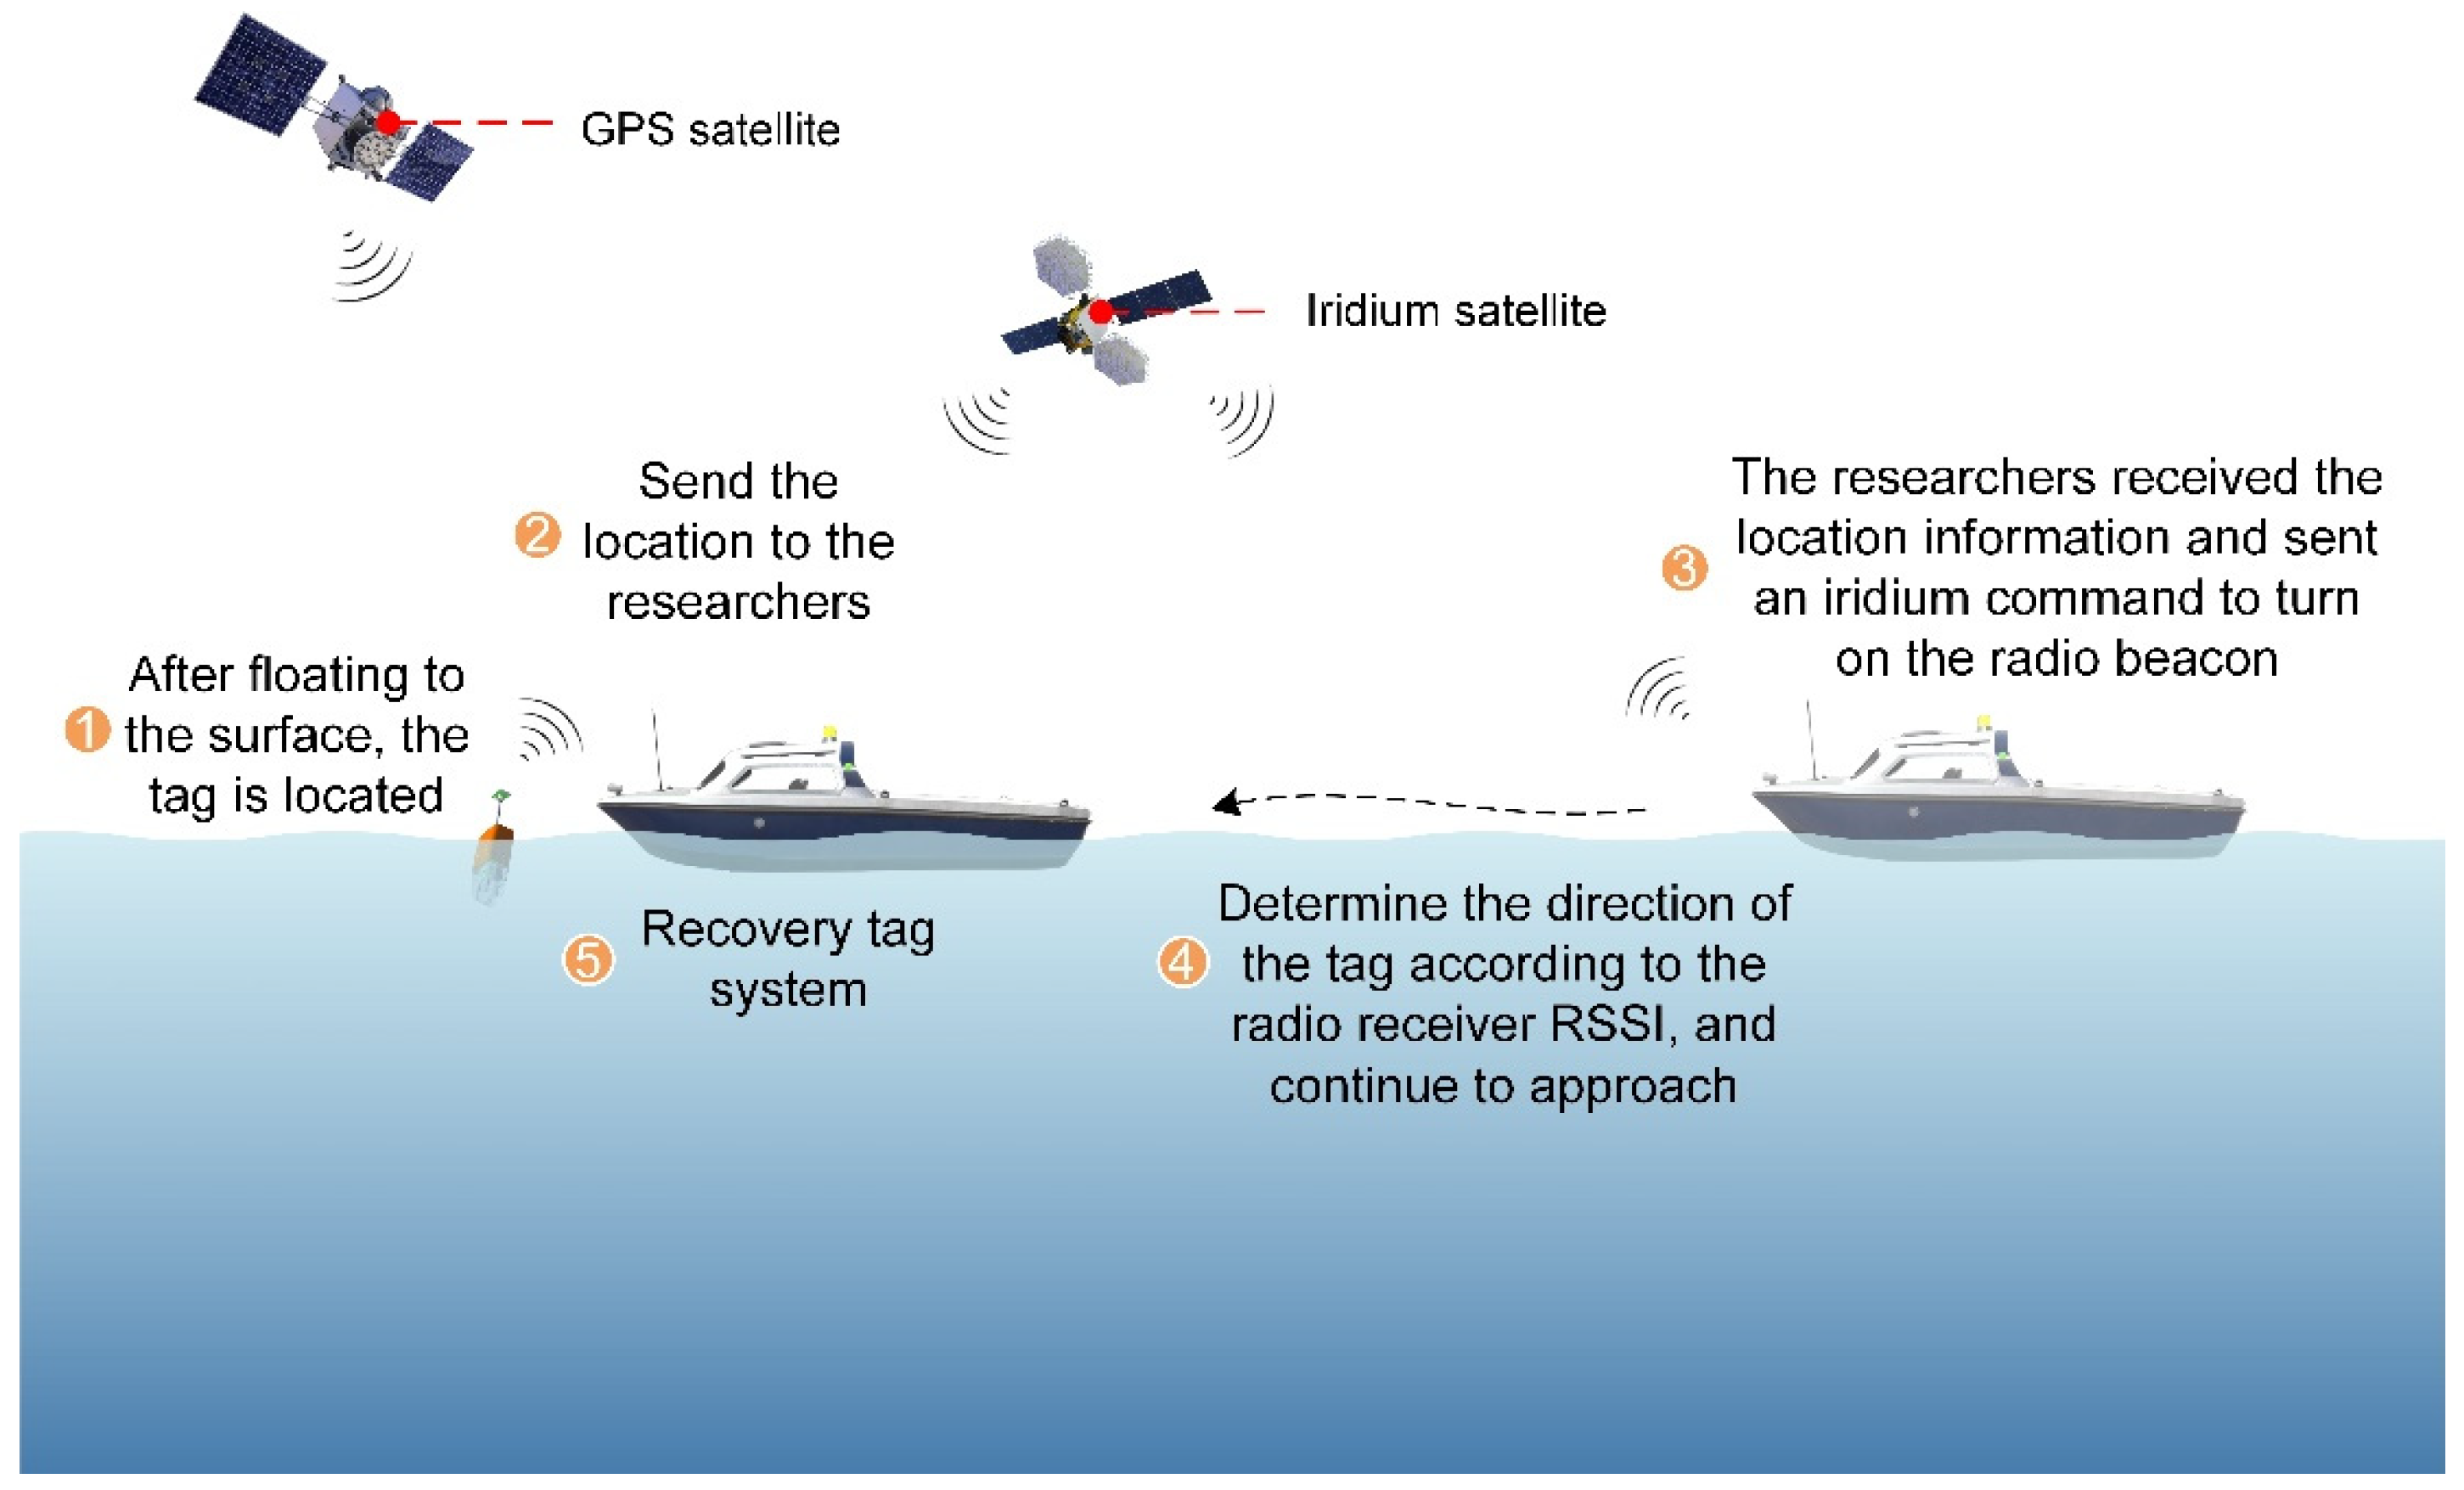
3. Combined Positioning and Recovery Scheme

3.1. Scheme Design

This paper proposes an innovative combined positioning and recovery method, as shown in Figure 8. This method integrates GPS and radio direction-finding technology [30], using the bidirectional communication capabilities of the Iridium satellite network to adjust the GPS intervals and the on/off states of the radio beacon. This approach significantly reduces the power consumption of the tag system while it floats on the water surface, extends the recovery window, and provides a longer retrieval time. By utilizing commercial miniaturized GPS technology, the positioning error ranges from 3 to 50 m, which is much smaller than the subkilometer error associated with traditional recovery methods using Argos satellite Doppler positioning. This improved positioning accuracy enhances recovery efficiency and decreases the performance requirements for radio direction-finding receivers, effectively reducing the equipment costs of the recovery process.

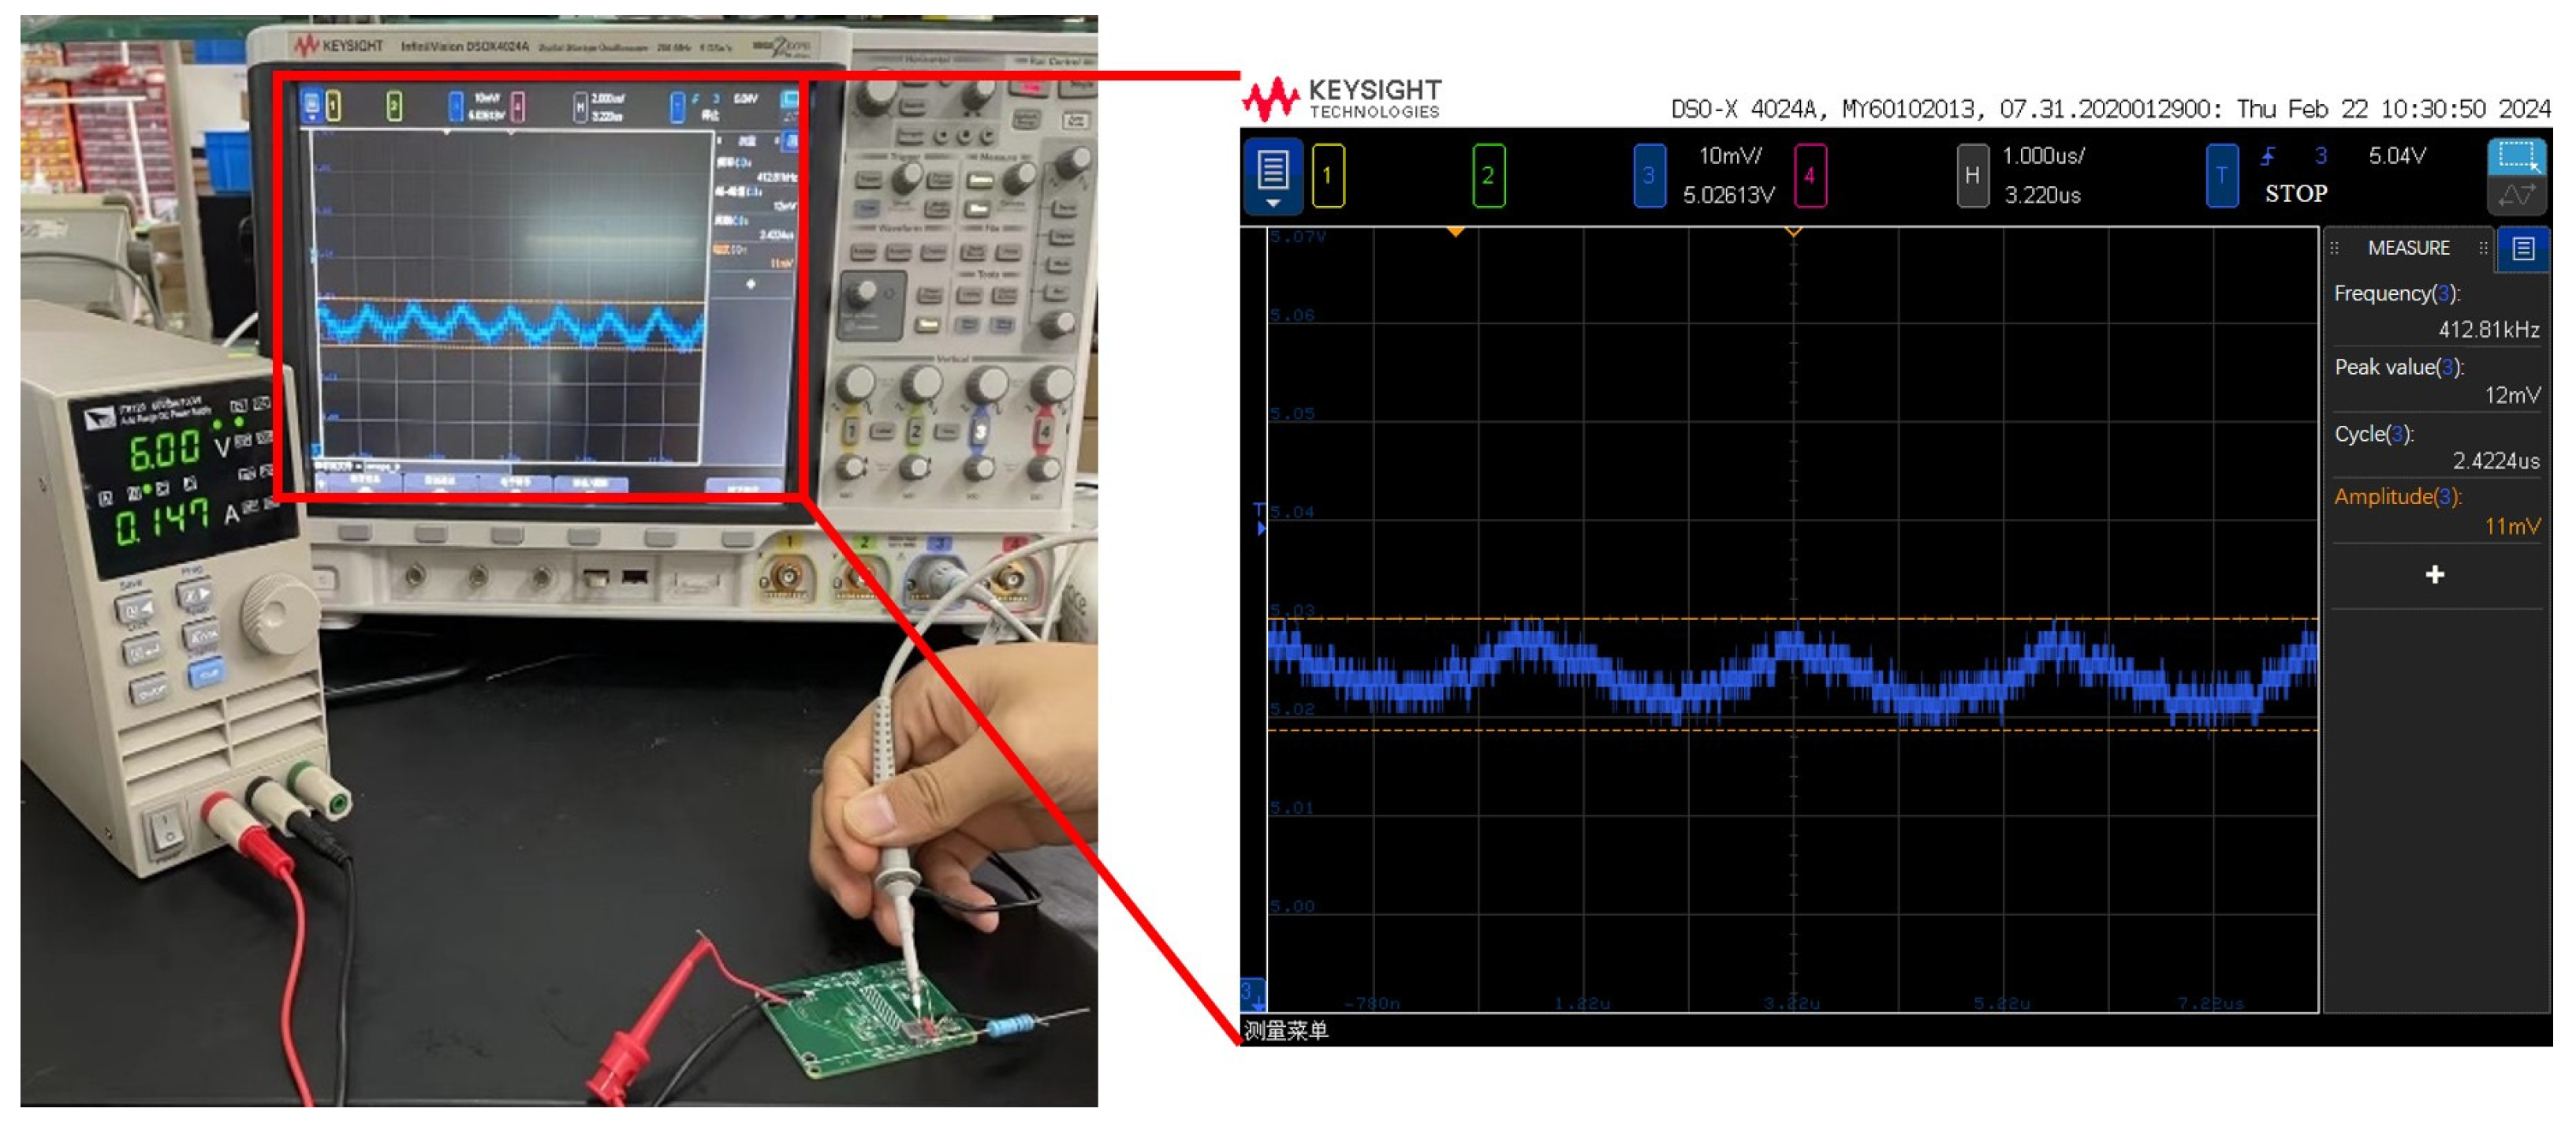
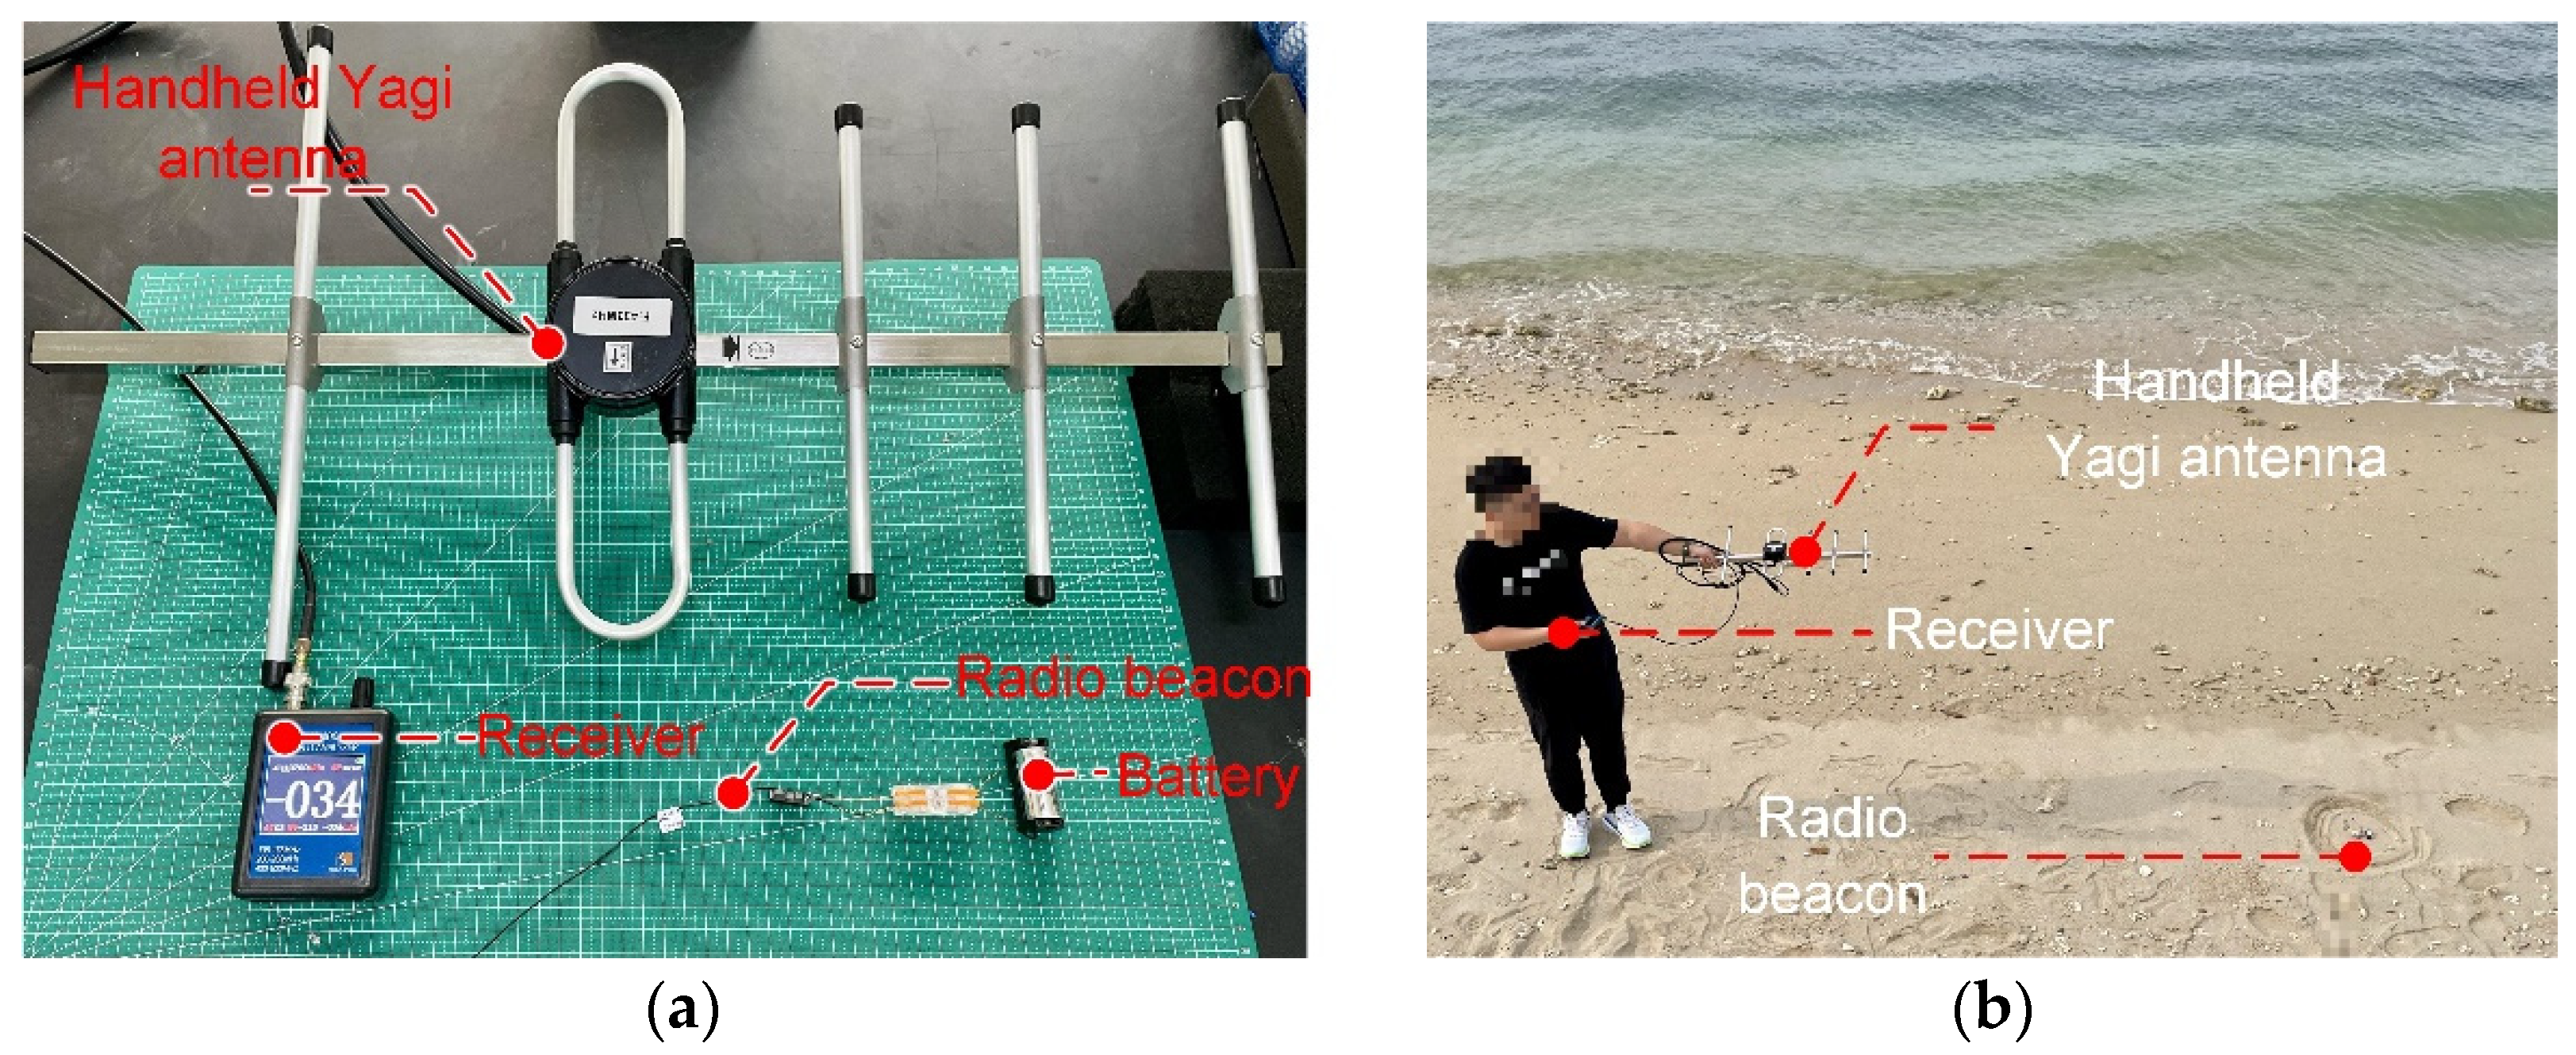
3.2. Hardware Design

The positioning and recovery module is a critical component of the tag system, delivering efficient and accurate positioning and recovery functions. This module integrates the Iridium transceiver, GPS, and radio beacon, creating a multifunctional recovery system. The hardware design of the positioning and recovery module is depicted in Figure 9.
The Iridium transceiver enables remote control, data transmission, and tag recovery. It is powered by a separate 5 V DC–DC converter, and due to its supply voltage being higher than the MCU’s TTL level, an NMOS–PMOS combination circuit is used for power control. The GPS chip, another essential component, provides initial positioning support. Powered by 3.3 V and controlled by a PMOS transistor, the chip’s internal EEPROM stores the default configuration, ensuring stable operation at the designated baud rate and sampling frequency upon power-up. The radio beacon’s on/off state is managed by commands received through the Iridium transceiver. When activated, the beacon operates with a ship-based Yagi antenna and radio receiver to create a radio direction-finding system, assisting in the auxiliary positioning and recovery of the tag body.
Due to the limited number of UARTs on the MCU, a WK2132 single-to-dual UART expansion chip is introduced. This chip handles GPS information and communicates with the Iridium transceiver. Each subchannel features a 256-byte FIFO for temporary data storage. Users can configure settings to trigger interrupts based on the number of data bytes received or on a timeout if no data are received within a specified period. This design effectively maximizes the use of limited UART resources, accommodating the requirements for both GPS and Iridium communication.
To mitigate potential power supply voltage disturbances caused by the high current consumption of the GPS chip, Iridium transceiver, and radio beacon during startup, large-capacity tantalum capacitors E1, E2, and E3 are incorporated. These capacitors supply adequate power during peak consumption periods, reducing voltage fluctuations and preventing chip resets or other anomalies.

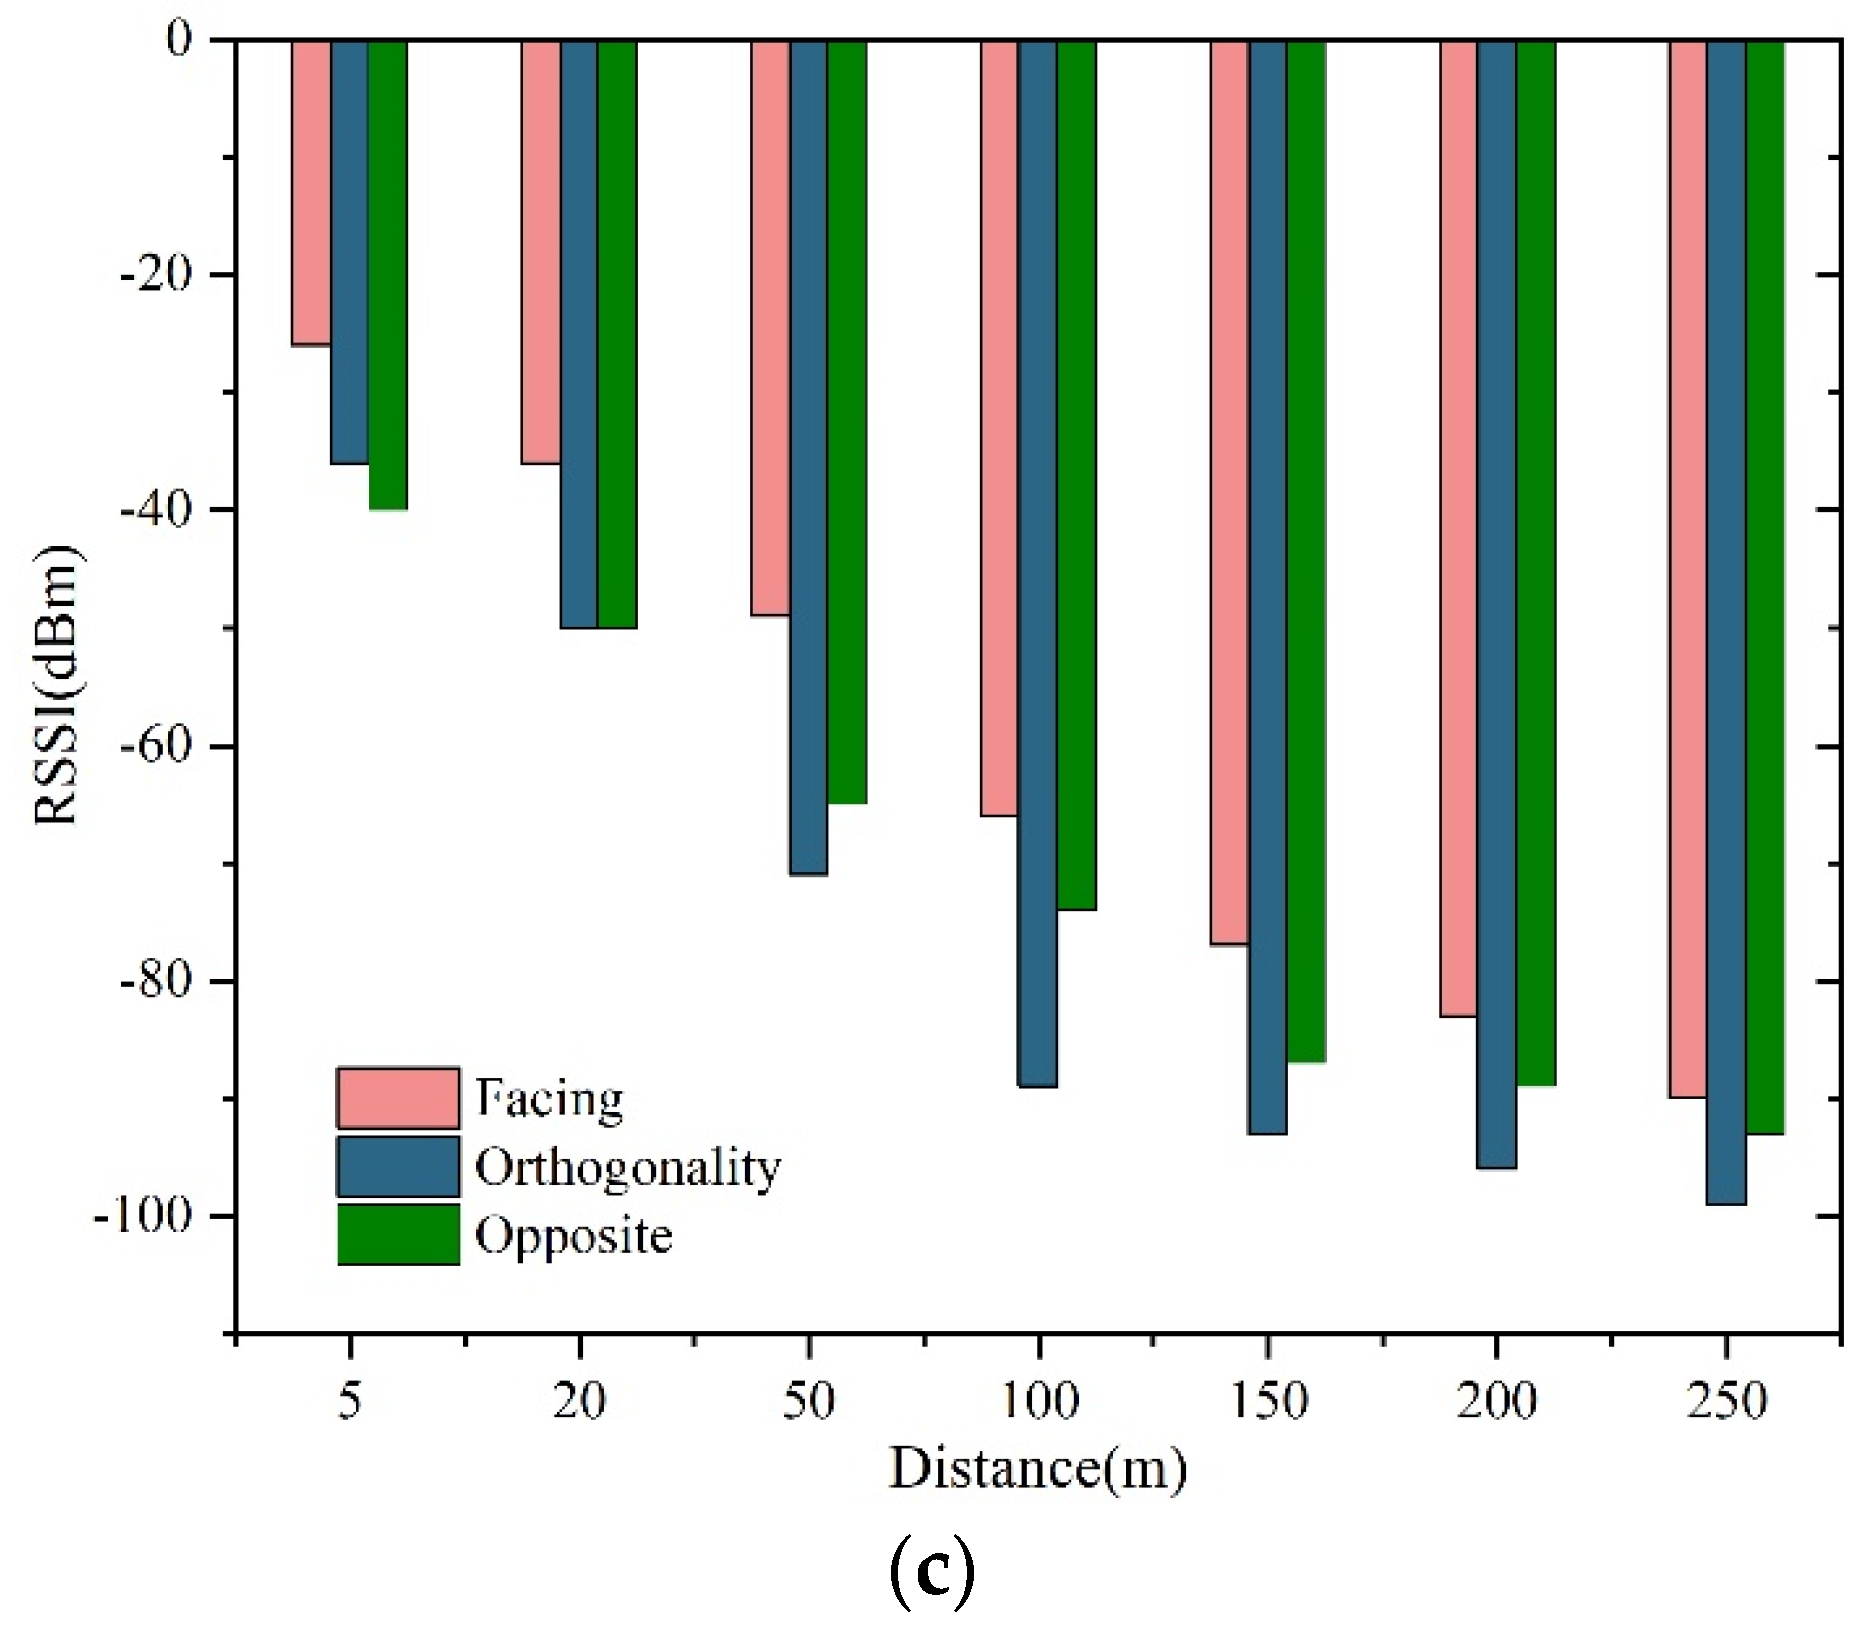
3.3. Testing and Evaluation

To verify the performance of the proposed combined positioning scheme, tests were conducted in an open coastal area to evaluate the positioning accuracy of the GPS module. Three GPS modules were tested at five different locations, with positioning repeated every 5 s for ten trials at each point. To address potential discrepancies between the GCJ-02 coordinate system (required by national regulations for map providers) and the standard WGS-84 coordinate system used by GPS, the global version of Google Maps with WGS-84 satellite imagery was utilized as the reference for positioning error analysis. The GPS data were compared with actual satellite map locations using Google Maps. The results, as shown in Table 1, reveal a maximum positioning error of about 38.1 m and an average error of about 6.3 m.
Next, the radio direction-finding distance was tested in an open coastal area to simulate real-world conditions. The test equipment and environment are depicted in Figure 10a,b. The beacon was connected to a battery, and the receiver was tuned to the beacon’s transmission frequency. The received signal strength indication (RSSI) of the radio receiver was recorded at various orientations as the receiver approached the beacon, as shown in Figure 10c. The results show that, as the receiver neared the beacon, the RSSI value increased. When the distance between the beacon and receiver exceeded 250 m, the RSSI variation became minimal, approaching noise levels, which is considered the maximum effective range for radio direction-finding.
Based on the experimental results, which include a maximum GPS error of 38.1 m and a maximum radio direction-finding distance of 250 m, the workflow for the combined positioning and recovery method designed in this paper can be effectively implemented. Initially, the GPS module provides positioning within a range of 50 m. Subsequently, radio direction-finding assists in accurately approaching the target for tag body recovery.

4. Experiment

4.1. Tag System Construction

After soldering and testing for basic functionality, and to ensure the electrical isolation of the tag circuit and antenna from water, the entire assembly was encapsulated in epoxy resin. Once the tag circuit and antenna were sealed, the tag system was assembled according to the structure diagram shown in Figure 11. The tag float’s outer shell was machined to the required dimensions and shape, while all resin components of the tag system were fabricated using photopolymer resin technology. The batteries within the resin shell were installed in parallel and encapsulated in epoxy resin for underwater electrical isolation. Connections between different structural components of the tag were secured with M3 screws. Four nylon pillars were pre-embedded on the front of the encapsulated tag circuit to connect it with the shell, and two nylon pillars were pre-embedded on the back to connect with the release structure.

4.2. System Performance Test

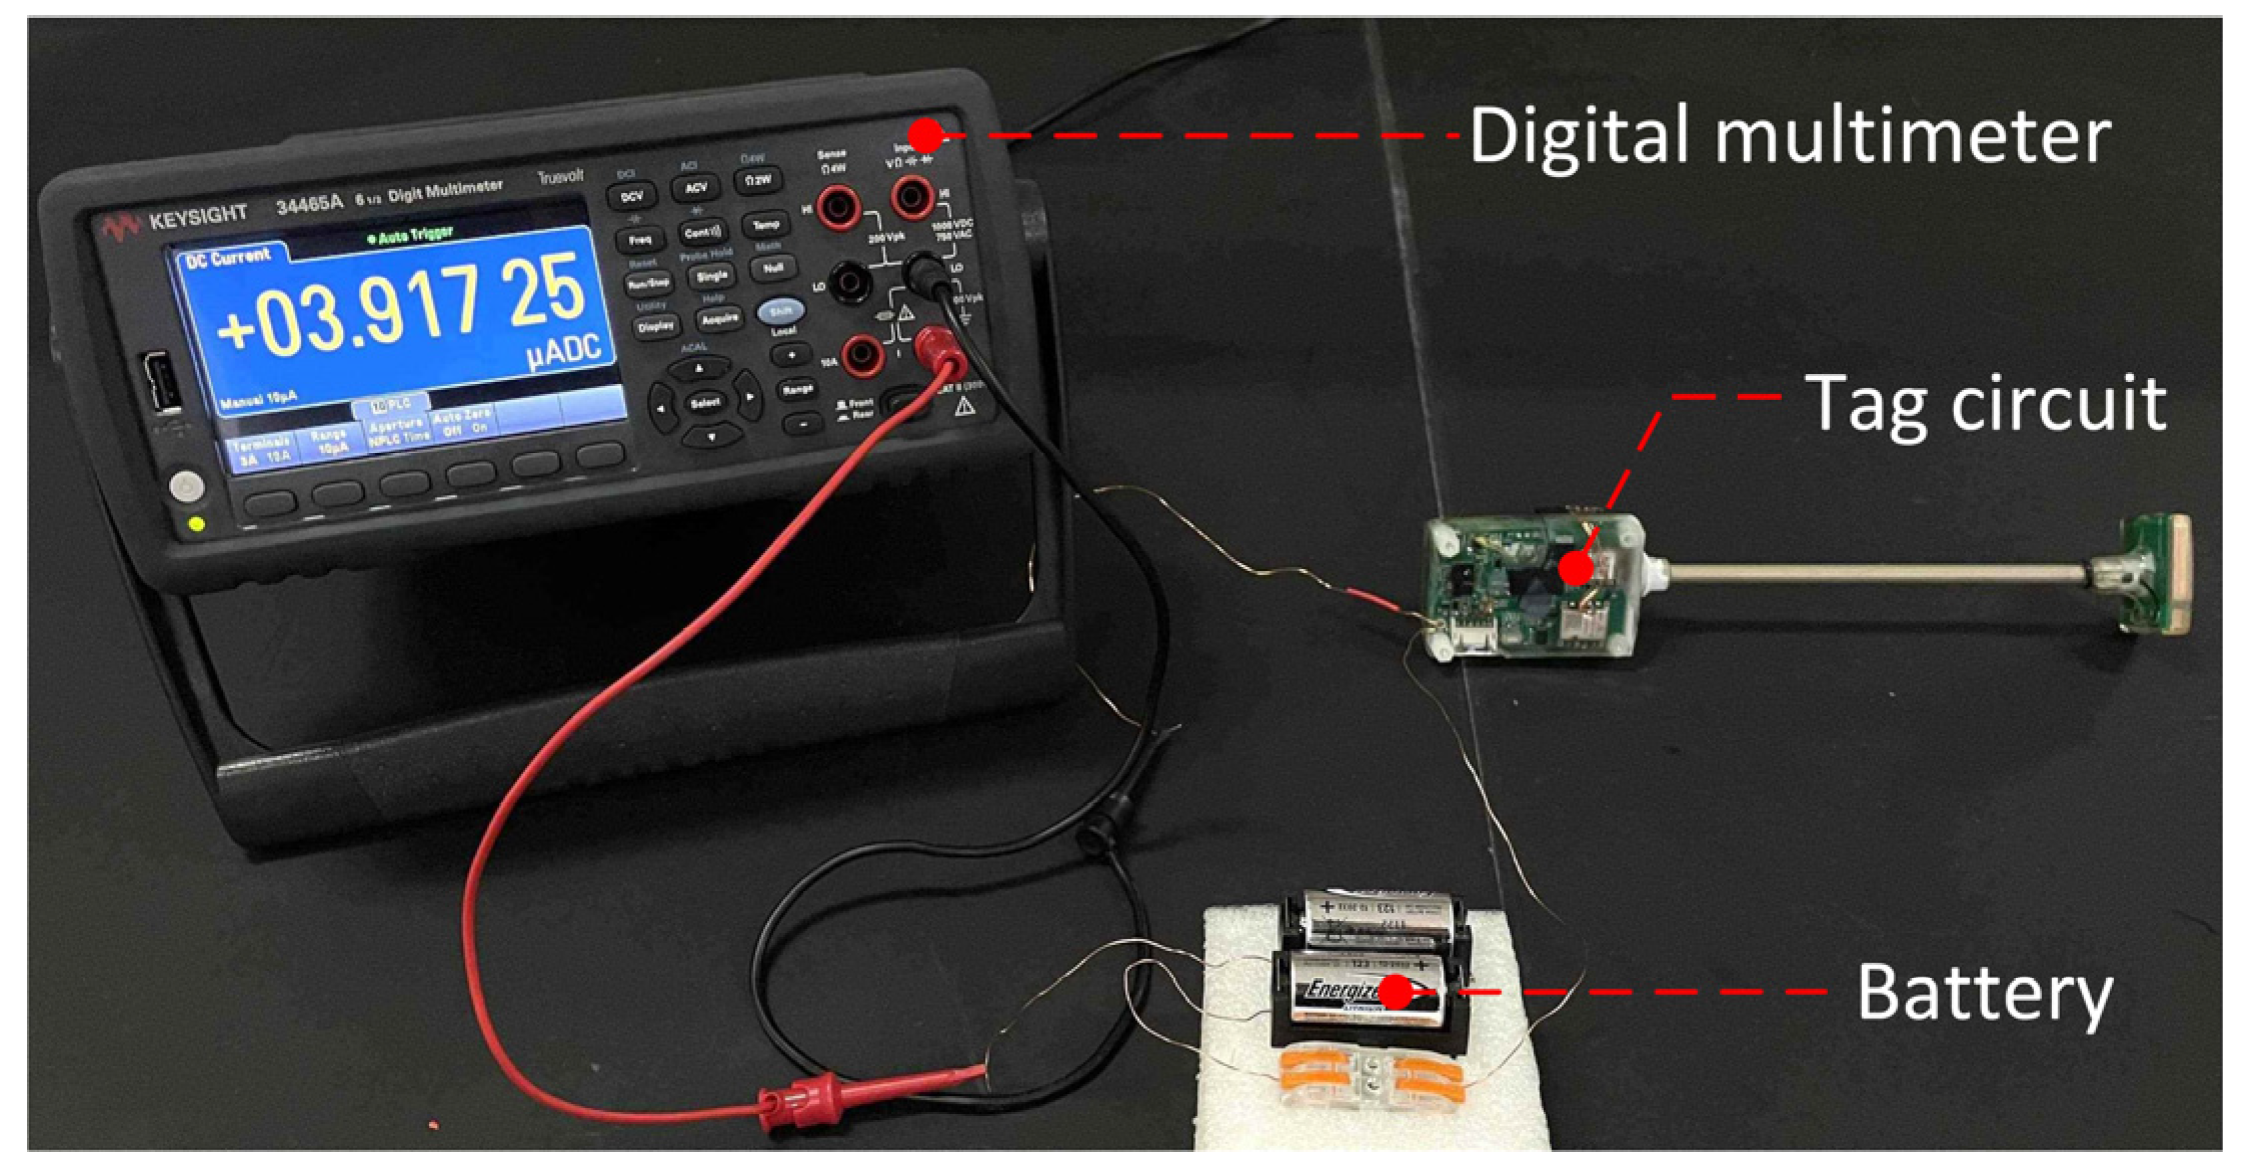
4.2.1. Power Consumption Test

To ensure the system can complete data acquisition, storage, release, separation, and combined positioning within the designated operational time, low-power design strategies were applied throughout all circuit sections and embedded software. This section presents actual power consumption measurements and verification across various operational processes.
In practical applications, the system utilizes two series-connected lithium manganese batteries for power supply, which remain consistent during the power consumption test. The positive and negative terminals of the battery are connected, and a 6.5-digit digital multimeter is connected in series with the power supply circuit to measure the current. Upon powering the tag circuit, it first enters low-power sleep mode, with a power consumption of about 3.9 μA, as illustrated in Figure 12.
Subsequently, sending configuration commands through the data transmission line activates the tag circuit into standby mode. At this stage, the main control module transitions from low-power mode to active mode, with a power consumption of about 393.3 μA. This consumption primarily arises from the main control module operating at 2 MHz (about 290 μA) and the RTC (about 100 μA). Sending the start command via a serial assistant initiates the data acquisition and storage modules of the tag circuit, resulting in a measured power consumption of 12.7 mA.
After the set data acquisition time is reached, the tag circuit enters the release separation phase, during which the large capacitor is charged. Power consumption peaks at 66 mA and then decreases to about 2 mA after 20 s, as shown in Figure 13a. Following release, the system transitions to the combined positioning recovery phase, which includes GPS, Iridium communication, and radio beacon positioning. The radio beacon transmits signals every 2 s, with a transmission power consumption of 45 mA for 232 ms and an idle system power consumption of 590 μA, as illustrated in Figure 13b.
During GPS operation, the power consumption is steady at 29.5 mA, and the typical cold start time is under 1 min. For Iridium communication, power consumption fluctuates with its operational state: standby power is 38.2 mA, while transmission peaks at 1.4 A for a very short duration (about 10 ms). Sending a message requires around 2 min under medium or better signal quality conditions.
The chosen battery has a capacity of about 1550 mAh. Based on the system design requirements, this capacity must support 3 days of data acquisition and storage, two release operations, over 30 GPS position acquisitions, more than 200 Iridium communications, and over 6 h of radio positioning. The calculated power consumption, detailed in Table 2, totals 1223.7 mAh, which is below the battery capacity. Therefore, the low-power circuit and embedded software meet the system design requirements.

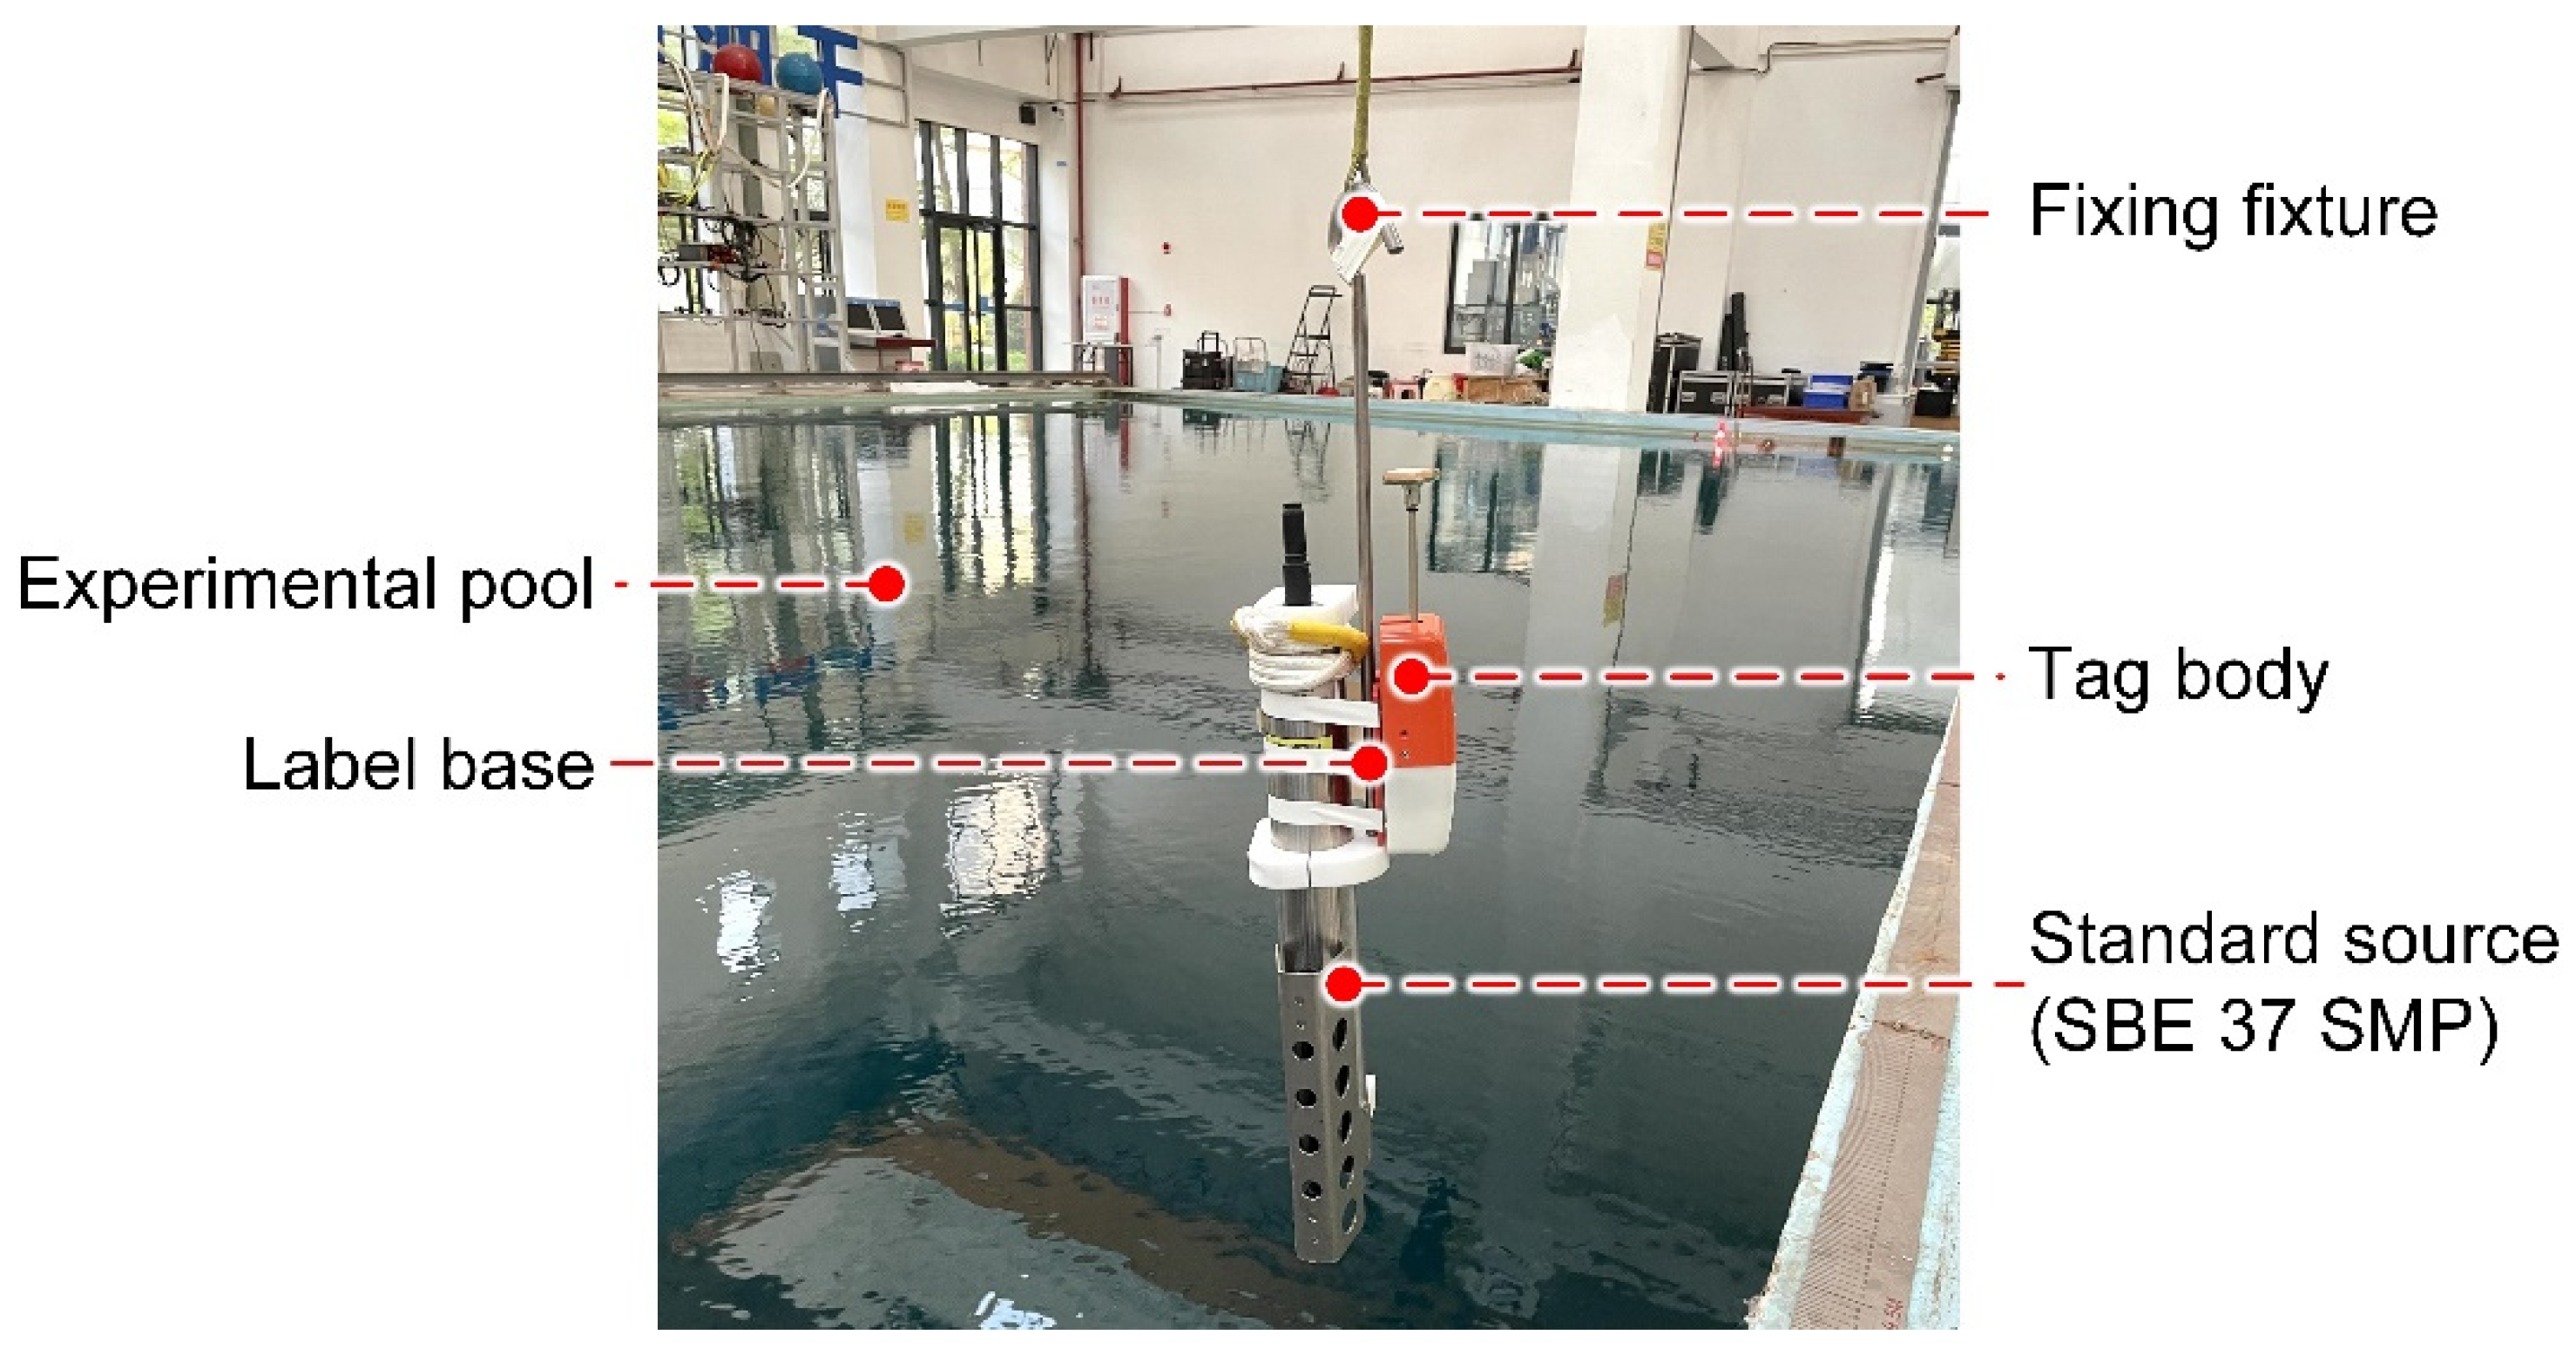
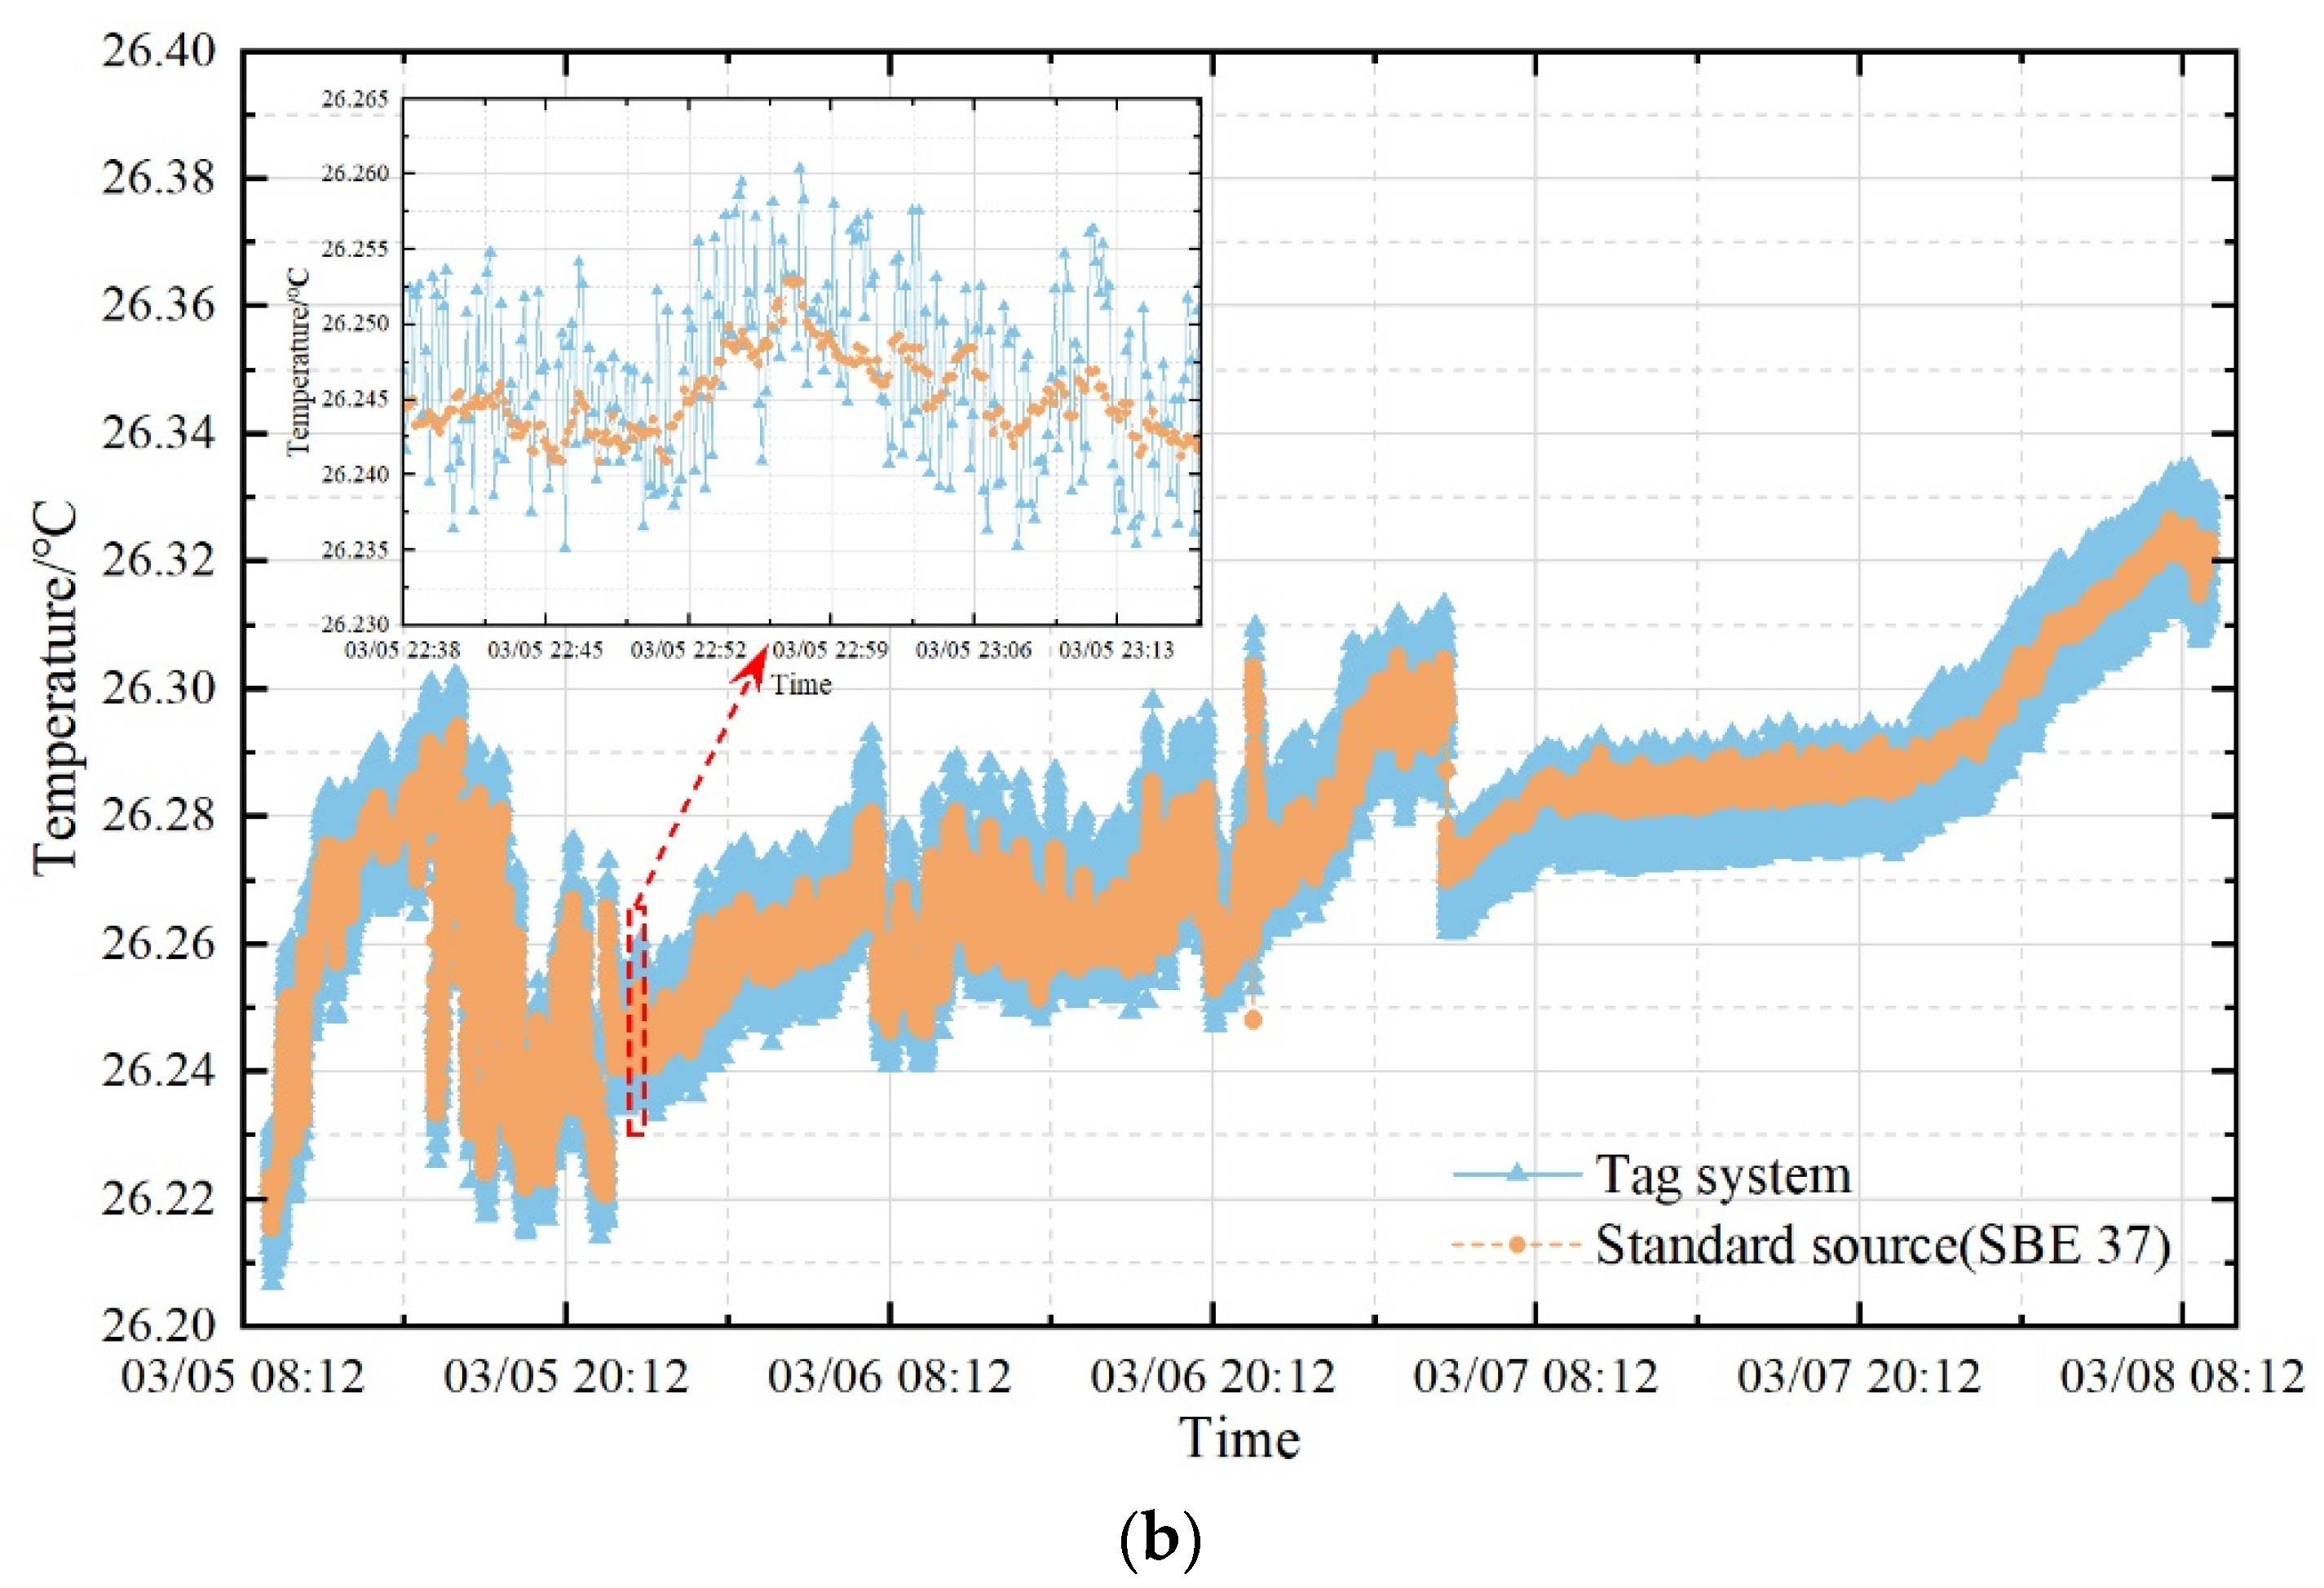
4.2.2. Temperature Performance Test

To assess the accuracy and consistency of temperature measurements, the tag system’s temperature sensor was tested in a laboratory constant-temperature water bath. This evaluation compared the tag system’s temperature readings at various points with those from a standard reference temperature sensor to determine sampling error. The results, detailed in Table 3, show a maximum error of 0.0086 °C, which satisfies the temperature acquisition accuracy requirements of the tag system.

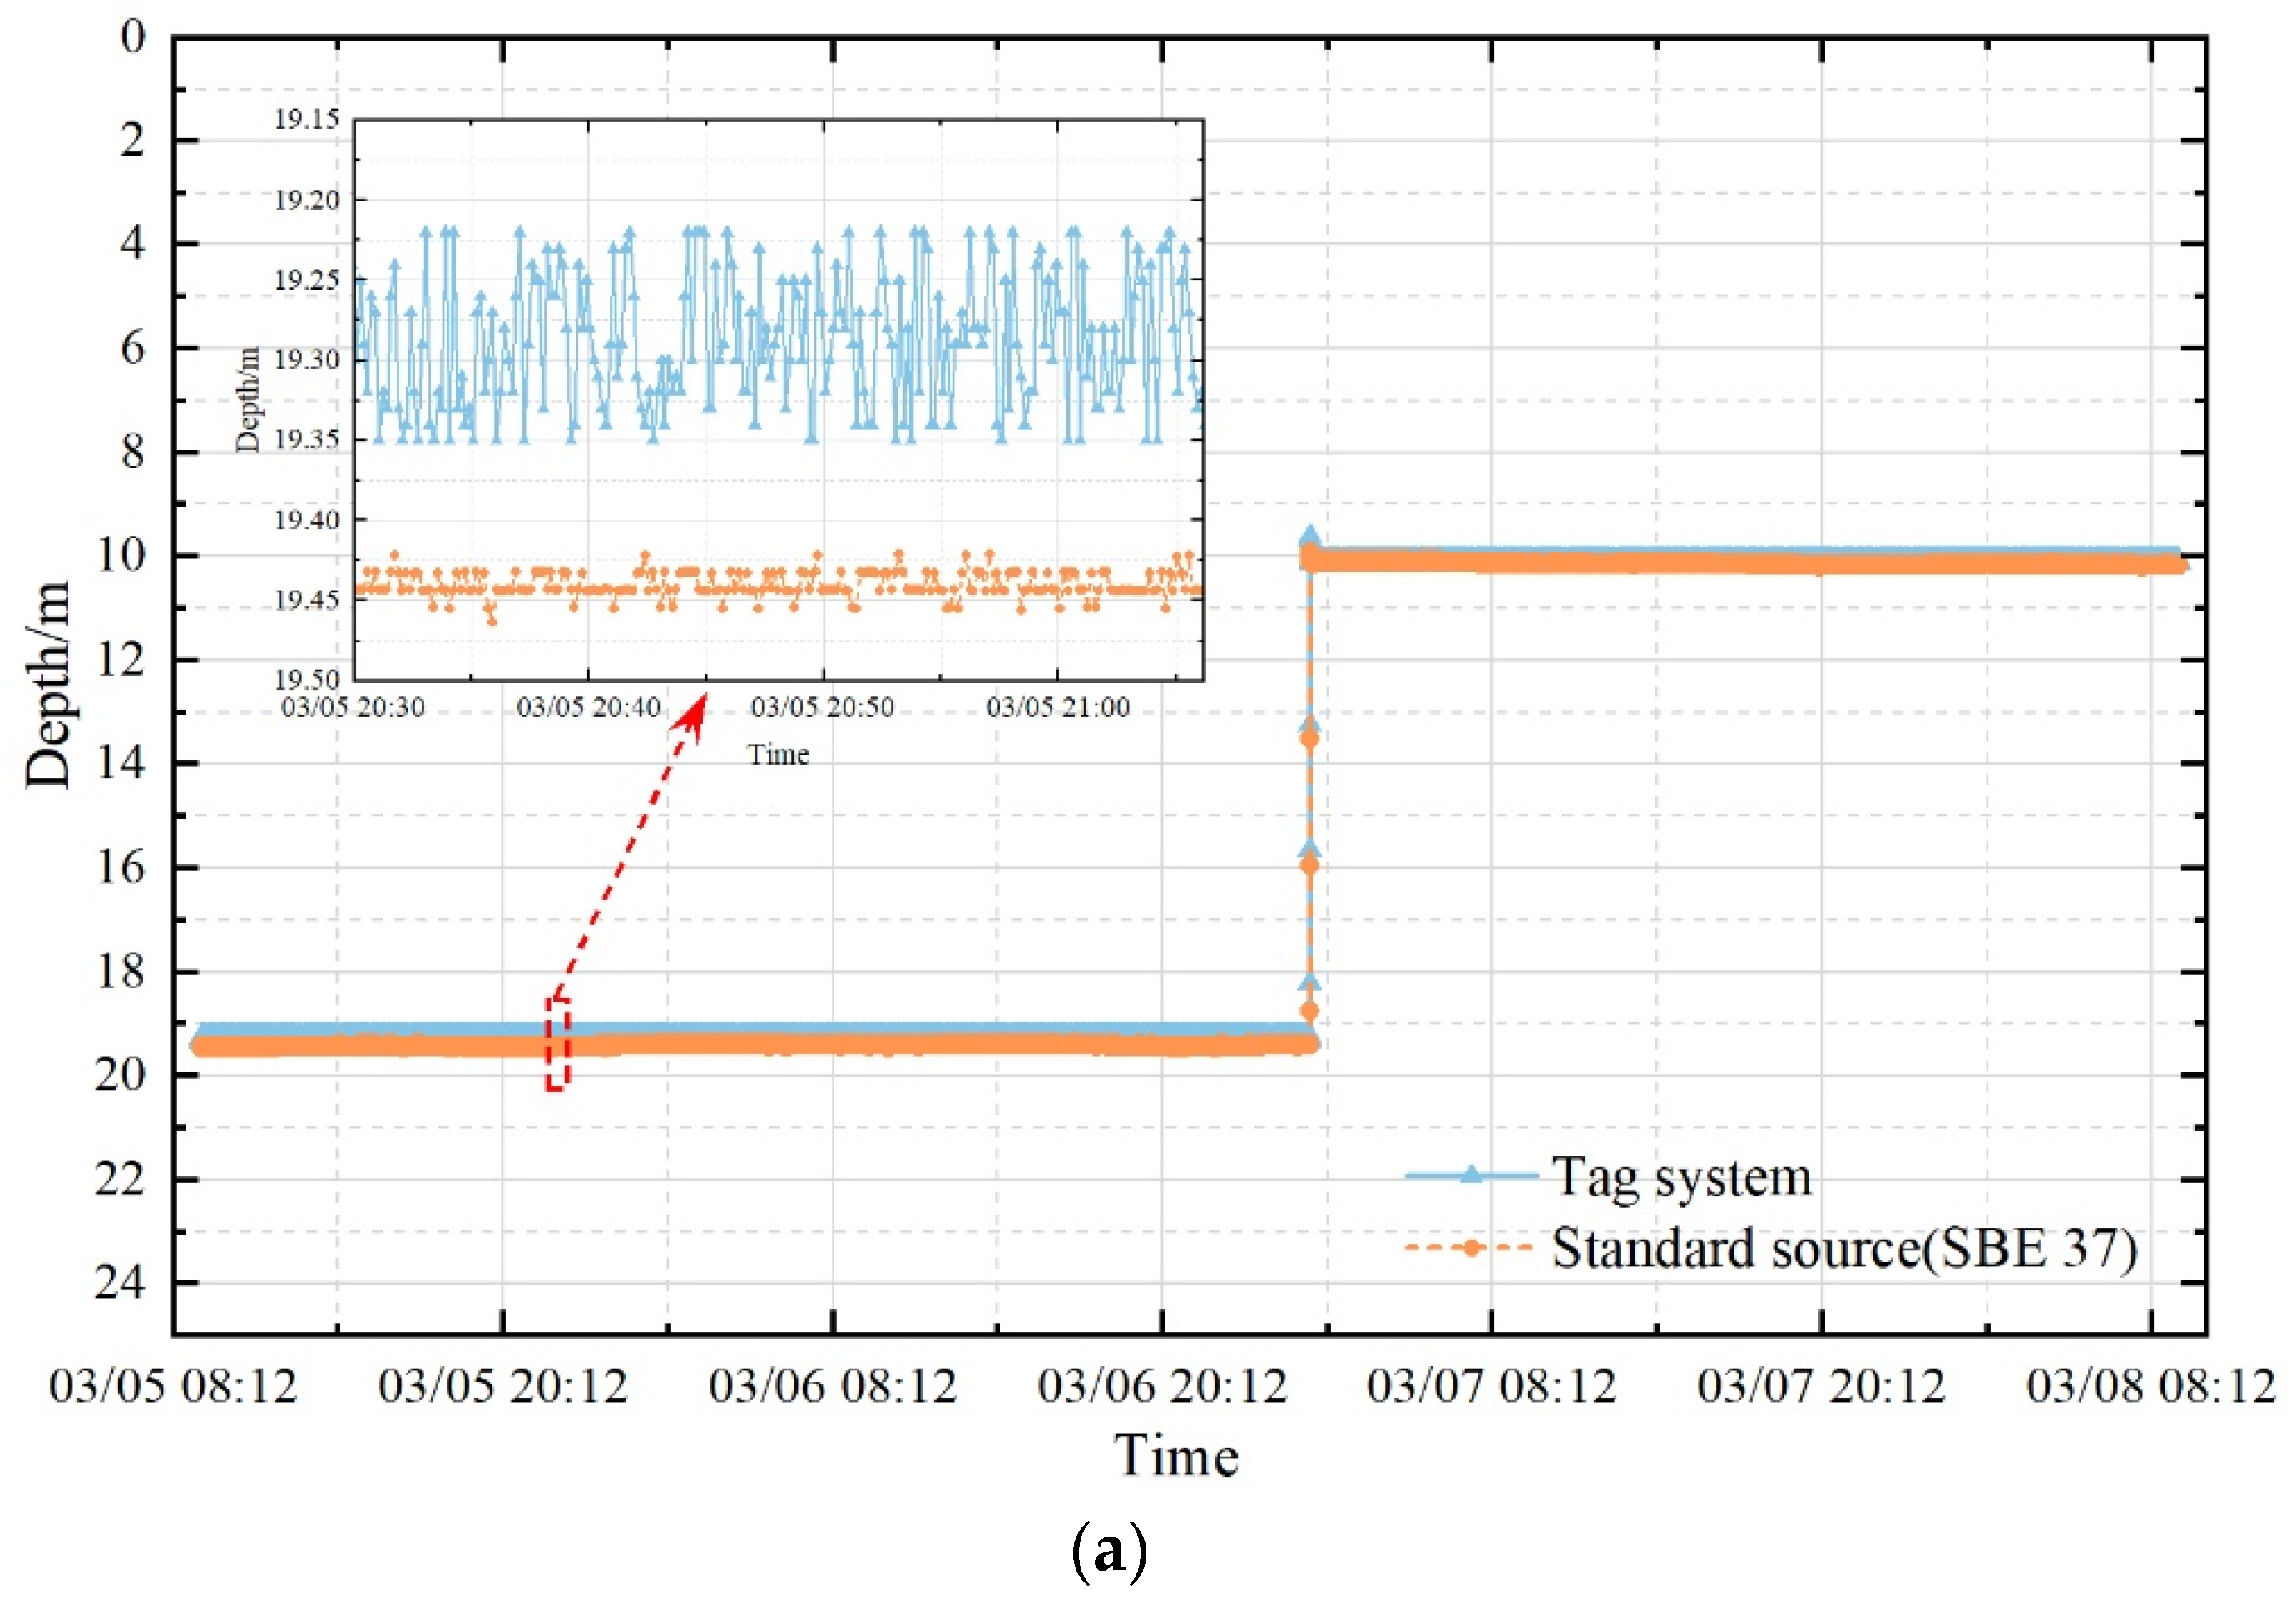
4.2.3. Pressure Performance Test

To evaluate the accuracy and consistency of the pressure measurements, the pressure sensor was tested for full-scale error using a laboratory piston gauge. The pressure data from the tag were compared with those from a standard reference under various pressure conditions, and the sampling error was calculated. The results, presented in Table 4, indicate a maximum full-scale error of 0.42%, which is within the ±0.5% accuracy requirement, thus meeting the pressure measurement standards of the behavioral record tag system.

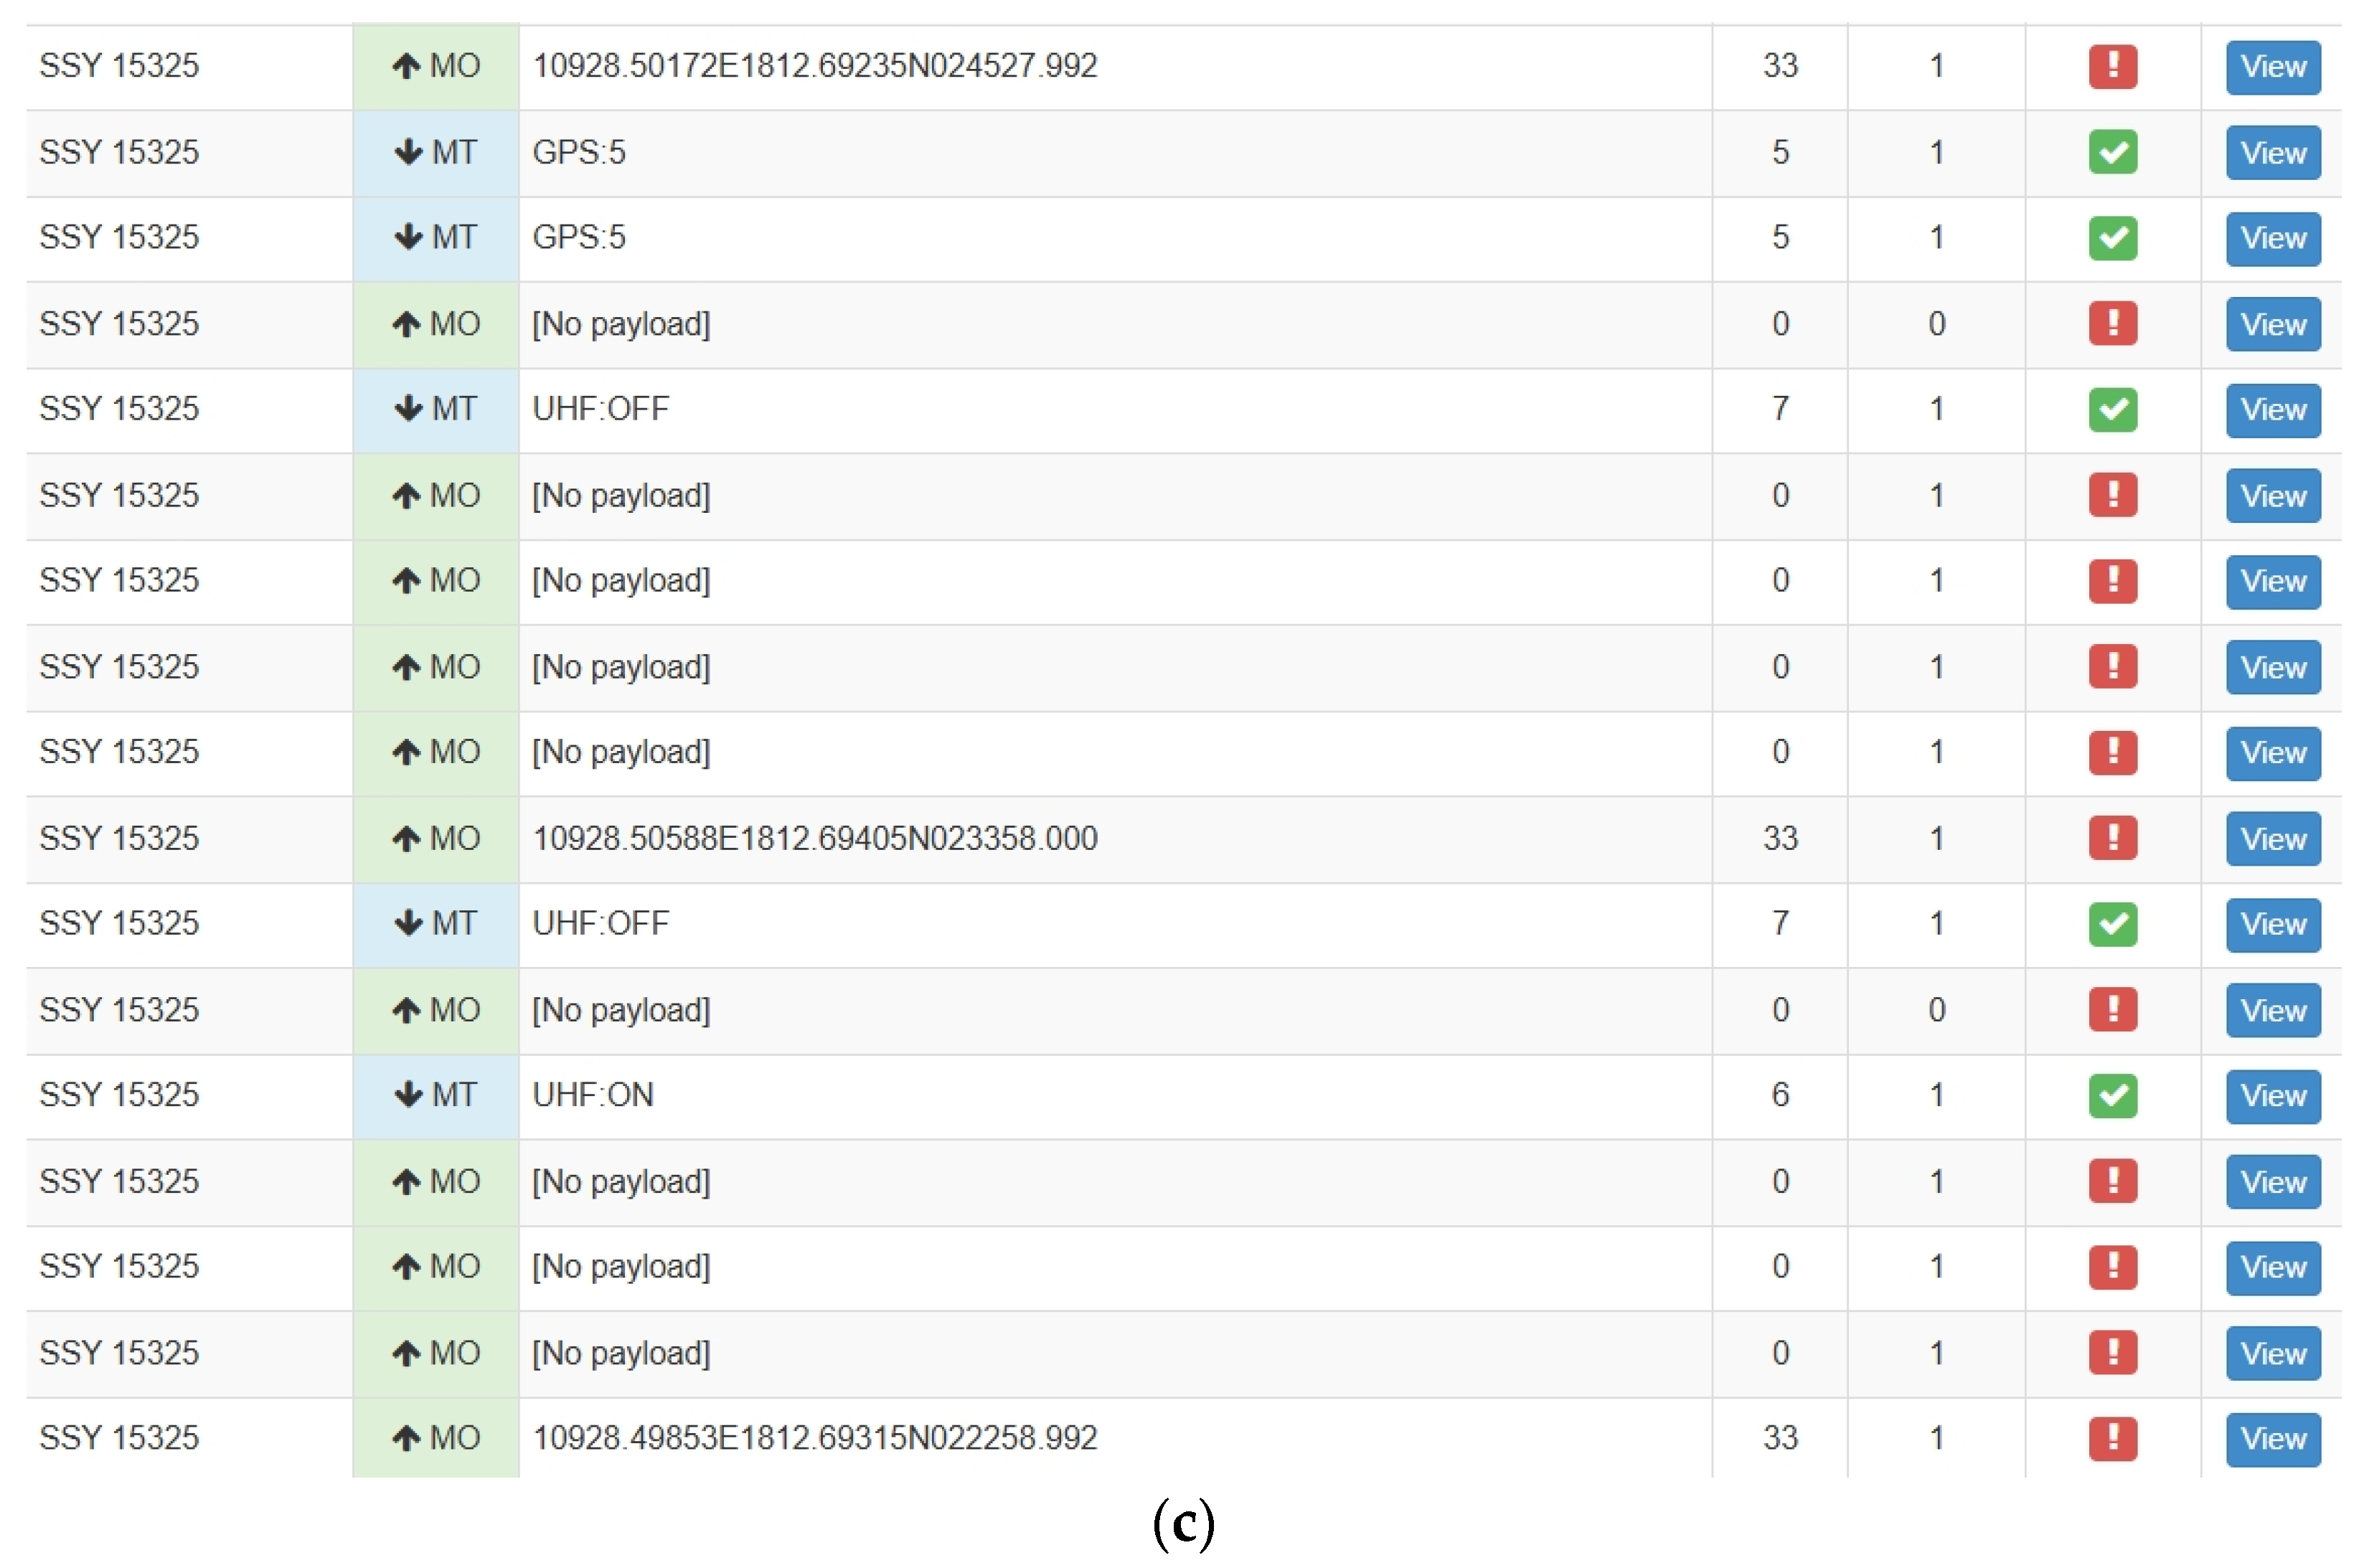
4.2.4. Iridium Communication Test

Iridium communication is essential for the tag’s combined positioning and recovery. After assembling the prototype, the communication times, success rates, and bidirectional communication functions of the Iridium system were tested. On a clear day, the tag was assembled, placed in nearshore seawater, and tethered by a thin line to prevent excessive drifting. The test environment is illustrated in Figure 14, and the results are summarized in Table 5.

4.3. Submersion Trajectory Reconstruction Testing

The tag circuit was secured to a carbon fiber extendable rod using 3 M tape, as depicted in Figure 15a. The system’s clock was synchronized via a serial assistant on a computer for subsequent data filtering. The sampling time was configured, and the start sampling command was issued. The operator then maneuvered the rod to trace a semicircular trajectory in a pool, as illustrated in Figure 15b.
The results of the submersion trajectory reconstruction are shown in Figure 16. The experimental data reveal some deviation in the final plotted trajectory compared to the actual semicircular motion, particularly at the bottom of the semicircle, where depth changes are minimal, resulting in noticeable errors in the NE plane distance. Nevertheless, the tag system accurately captured the motion during significant depth changes, such as diving and surfacing.

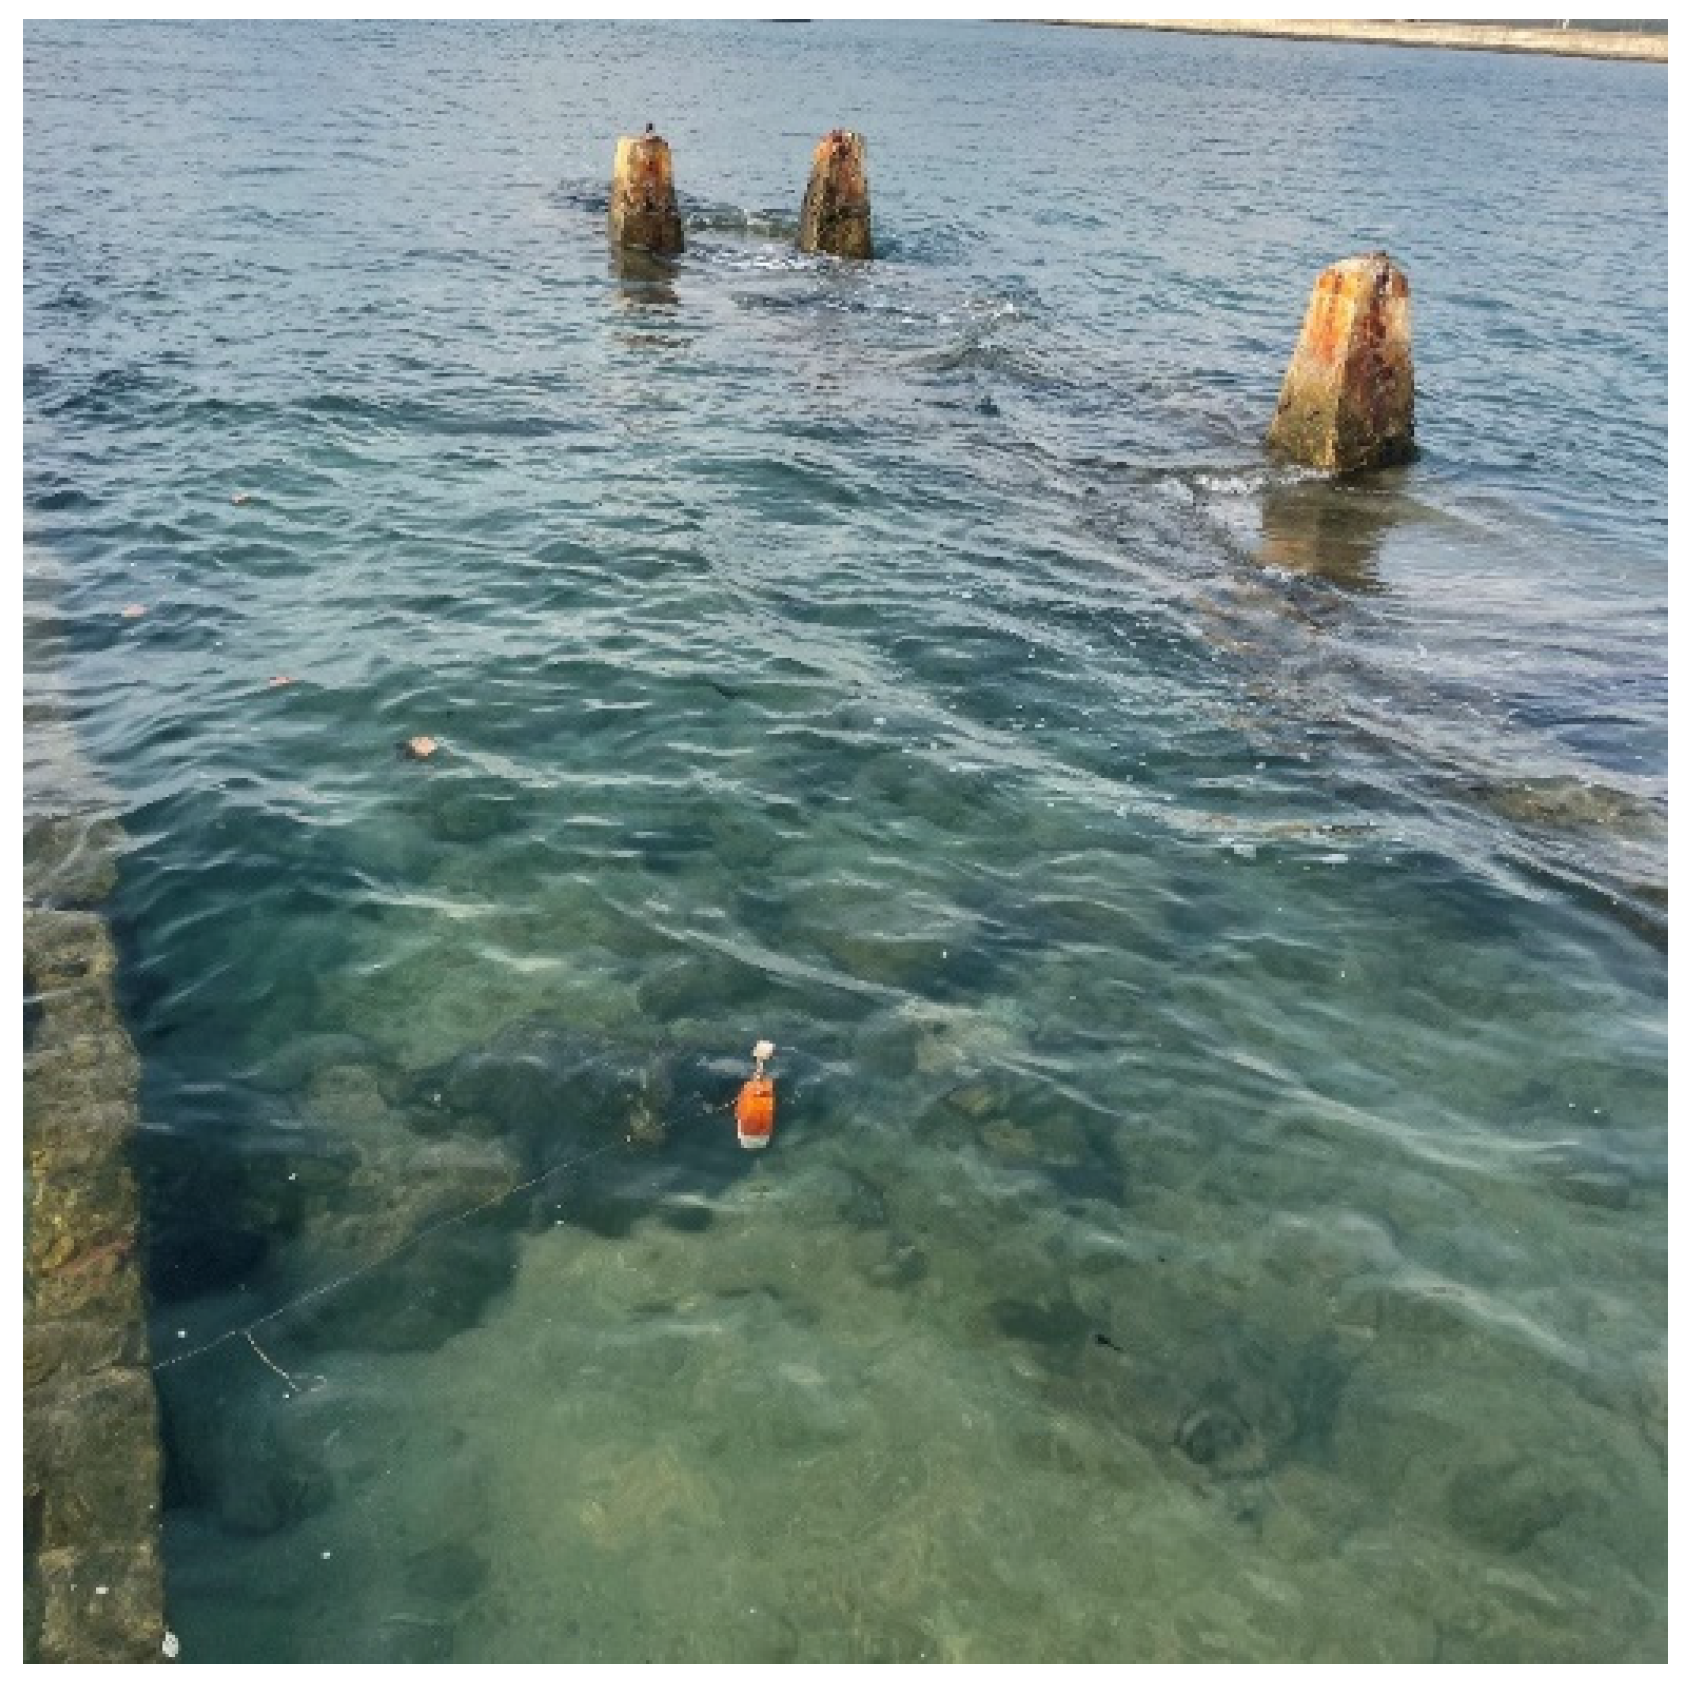
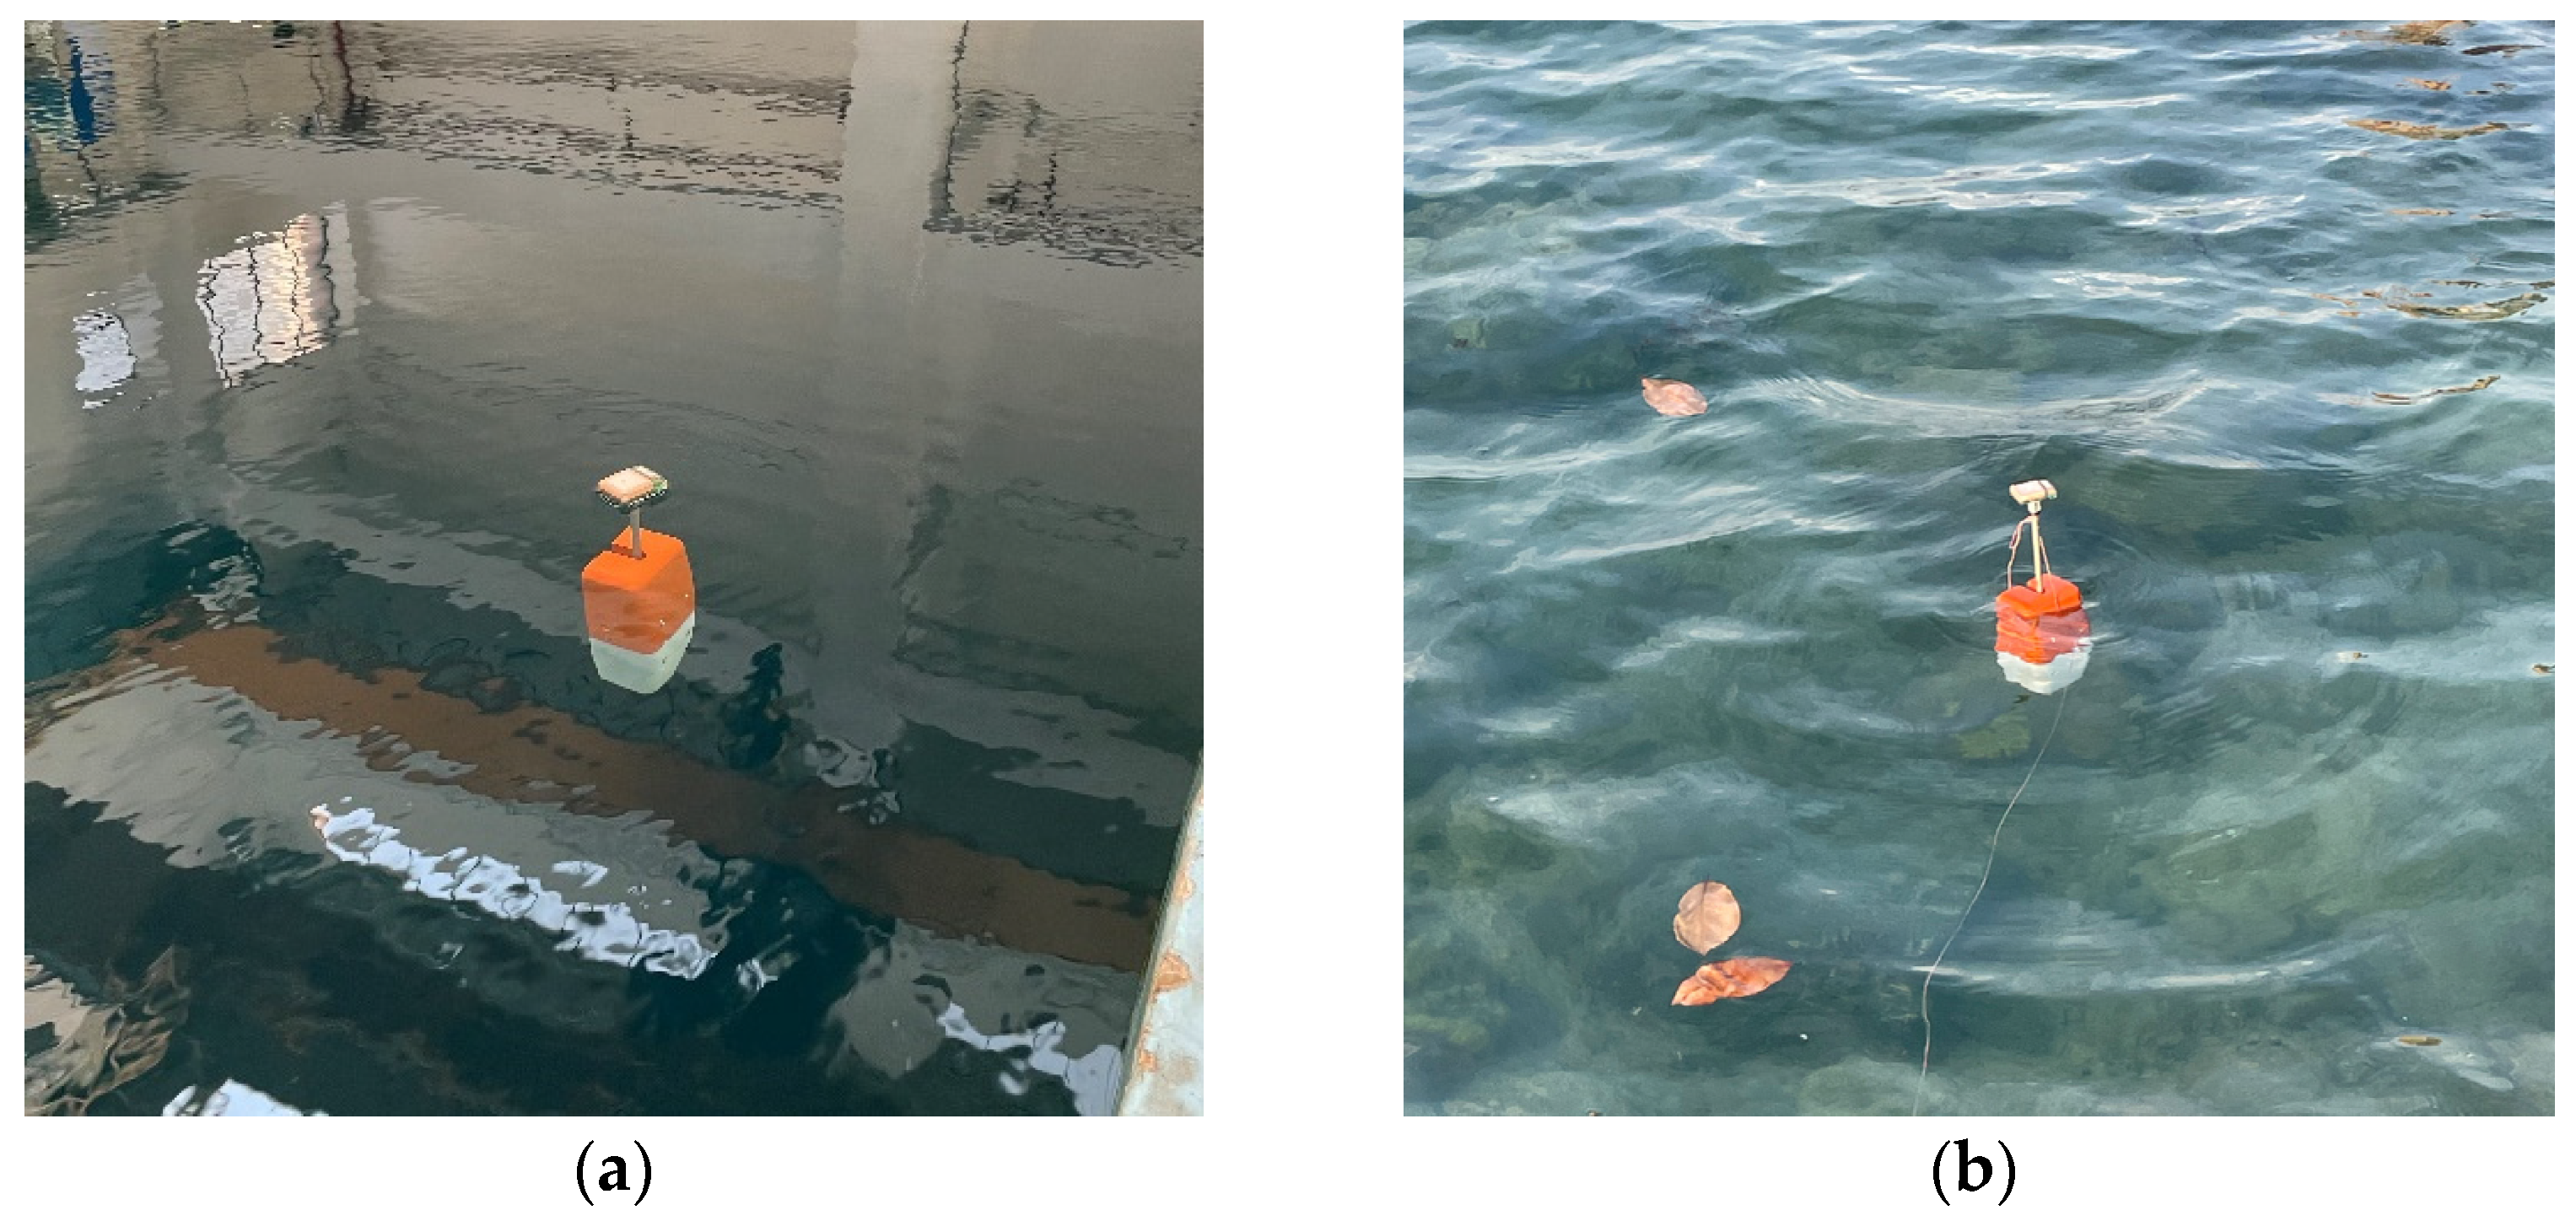
4.4. Pool and Nearshore Experiments

To further validate the data accuracy and operational stability of the behavioral recording tag system, comprehensive workflow experiments were conducted in both a laboratory pool and nearshore seawater, as shown in Figure 17. The dimensions of the pool used for testing were 22 m in length, 10 m in width, and 20 m in depth.
During the experiment, the standard source SBE 37 was first secured with a clamp, connected at the top with a Kevlar rope, and set to self-contained mode with a sampling rate of 0.1 Hz. The tag base was then attached to the clamp using 3 M white tape, as depicted in Figure 18. Serial communication was employed to configure the tag circuit to sample temperature and depth data at a frequency of 1 Hz, and the MIMU at 30 Hz, with a total sampling duration of 3 days, as per system design specifications. The test apparatus was submerged at the bottom of the pool and remained stationary. On the second day, the apparatus was raised to a depth of about 10 m to assess the stability of the temperature and depth sensors at varying depths. At the end of the 3-day period, the tag floated slowly to the surface after release, as shown in Figure 18a. Due to the pool being filled with fresh water, the tag’s height above the water surface was lower than anticipated, with only the antenna slightly visible.
Given that the indoor pool environment could not provide Iridium or GPS signals, the tag was removed from the pool, placed in nearshore seawater, and tethered with a thin line, as shown in Figure 18b. The tag’s height above the water surface increased to about 110 mm, and it maintained a stable posture amidst the waves. GPS information transmitted by the tag was received on the Iridium network website, as illustrated in Figure 18c. Iridium commands were then used to adjust the tag’s sleep time and activate the radio beacon. The radio receiver was tuned to the beacon’s transmission frequency, successfully detecting the beacon’s short “beep” signals. Standing more than 200 m away onshore, the tag’s direction was clearly identified, with the RSSI value increasing as the receiver approached the tag, confirming the effectiveness and reliability of the tag’s recovery process.
Finally, the tag was retrieved, and the data collected from the tag system and the standard source (SBE 37) were analyzed and compared, as depicted in Figure 19a. To ensure the temporal alignment of the data with varying sampling rates, the tag system’s 1 Hz temperature and depth data were averaged every 10 s, and the processed results were saved. A high degree of consistency was observed when the processed data were compared with the standard source data. The maximum depth error was 0.31 m, with the tag system generally measuring at slightly lower depths, likely because the tag pressure sensor was positioned about 30 cm higher than the standard source pressure sensor during the setup. As shown in Figure 19b, the temperature measurements exhibited strong consistency, with a maximum error of 0.009 °C, meeting the system design requirements.
The marine animal behavior recording tag system proposed in this study was compared with mainstream biologging tags, summarized in Table 6. Although the number of sensors in the proposed system still has room for improvement compared to commercial systems, the measurement accuracy of the temperature and pressure sensors in this system demonstrates a significant advantage. Moreover, the compact size of the proposed tag system minimizes its impact on the animals when attached. Most importantly, the innovative combined positioning and recovery module designed in this study facilitates quick and efficient tag retrieval, significantly increasing the recovery success rate and greatly reducing the retrieval burden on researchers.

5. Conclusions

Biological recording tags are vital for analyzing marine animal behavior. This research introduces a new marine animal behavior recording tag system aimed at addressing the high time investment and low recovery rates of conventional tags. The system incorporates temperature, pressure, and MIMU sensors within a compact design, with data stored in onboard memory for future retrieval. It features a novel combined positioning and recovery approach, which employs GPS for initial location tracking and radio direction-finding technology for supplementary positioning and recovery. This method extends the tag’s recovery window to 7 days and facilitates quick and efficient recovery, greatly enhancing system reliability.
Experimental results showed that the system’s temperature accuracy is within 0.01 °C, while pressure measurements have a full-scale error of less than ±0.5%. The system’s power consumption, communication capabilities, and release–separation module align with design expectations. Tests conducted in nearshore environments validated the successful transmission of GPS data to the shore station, confirmed the functionality of the radio beacon, and allowed clear direction-finding of the tag within 200 m. These findings support the effectiveness of the combined positioning and recovery method. This work provides significant contributions to the design of archival behavioral recording tags and offers valuable advancements for marine animal behavior research and tag recovery processes.
In the future, the research of this paper will focus on the following aspects:
(1) Further optimization of the tag’s structure and circuit design to reduce power consumption.
(2) While the current tests of the tag system’s workflow were conducted in controlled environments such as pools and nearshore areas, future experiments will involve deploying the tag on marine animals in real-world sea trials.
This will enable the labeling system to test and resolve potential problems that arise during actual use, ultimately increasing the practical value of the biologic labeling system.

Author Contributions

Conceptualization, C.T., D.X., S.Z. and C.S.; formal analysis, C.T. and D.X.; investigation, P.L., C.W. and C.S.; methodology, Y.S., P.L., Z.W. and C.S.; project administration, C.T.; resources, S.Z. and C.S.; software, S.S., P.L. and Z.S.; supervision, D.X., C.W. and S.Z.; validation, Z.W., Y.S., C.W. and Z.S.; visualization, S.S., Y.S., Z.W. and Z.S.; writing—original draft preparation, S.S. and C.T.; writing—review and editing, C.T. All authors have read and agreed to the published version of the manuscript.

Funding

This research was funded by the Science and Technology Talents Innovation Project in Hainan Province (KJRC2023C06).

Institutional Review Board Statement

Not applicable.

Informed Consent Statement

Not applicable.

Data Availability Statement

The data presented in this study are available in this article (tables and figures).

Acknowledgments

We thank the Institute of Deep-Sea Science and Engineering, Chinese Academy of Sciences, for providing hydrostatic pressure testing and sea trial opportunities.

Conflicts of Interest

The authors declare no conflicts of interest.

References

  1. Shillinger, G.L.; Bailey, H.; Bograd, S.J.; Hazen, E.L.; Hamann, M.; Gaspar, P.; Godley, B.J.; Wilson, R.P.; Spotila, J.R. Tagging through the stages: Technical and ecological challenges in observing life histories through biologging. Mar. Ecol. Prog. Ser. 2012, 457, 165–170. [Google Scholar] [CrossRef]
  2. Chung, H.; Lee, J.; Lee, W.Y. A Review: Marine Bio-logging of Animal Behaviour and Ocean Environments. Ocean. Sci J 2021, 56, 117–131. [Google Scholar] [CrossRef]
  3. Lennox, R.J.; Engler-Palma, C.; Kowarski, K.; Filous, A.; Whitlock, R.; Cooke, S.J.; Auger-Méthé, M. Optimizing marine spatial plans with animal tracking data. Can. J. Fish. Aquat. Sci. 2019, 76, 497–509. [Google Scholar] [CrossRef]
  4. Dong, L.; Liu, M.; Lin, W.; Li, S. First Suction Cup Tagging on a Small and Coastal Form Bryde’s Whale (Balaenoptera edeni edeni) in China to Investigate Its Dive Profiles and Foraging Behaviours. J. Mar. Sci. Eng. 2022, 10, 1422. [Google Scholar] [CrossRef]
  5. Rutz, C.; Hays, G.C. New frontiers in biologging science. Biol. Lett. 2009, 5, 289–292. [Google Scholar] [CrossRef] [PubMed]
  6. Wiley, D.N.; Zadra, C.J.; Friedlaender, A.S.; Parks, S.E.; Pensarosa, A.; Rogan, A.; Shorter, K.A.; Urbán, J.; Kerr, I. Deployment of biologging tags on free swimming large whales using uncrewed aerial systems. R. Soc. Open Sci. 2023, 10, 221376. [Google Scholar] [CrossRef]
  7. Martínez-Ramírez, L.; Bentes, L.; Dias, A.; Erzini, K.; Gandra, M.; Kraft, S.; Winkler, A.C.; Abecasis, D. Tagging mortality in acoustic telemetry studies: Insights from a multispecies analysis. J. Fish Biol. 2024, 1, 11. [Google Scholar] [CrossRef] [PubMed]
  8. Jackson, G.D.; O’Dor, R.K.; Andrade, Y. First tests of hybrid acoustic/archival tags on squid and cuttlefish. Mar. Freshw. Res. 2005, 56, 425–430. [Google Scholar] [CrossRef]
  9. MacGregor, K.A.; Lavoie, M.-F.; Robinson, S.M.C.; Simard, E.; McKindsey, C.W. Lab and field evaluation of tagging methods for the use of acoustic telemetry to observe sea urchin movement behaviour at ecologically relevant spatio-temporal scales. Anim. Biotelemetry 2023, 11, 3. [Google Scholar] [CrossRef]
  10. Goldbogen, J.A.; Cade, D.E.; Boersma, A.T.; Calambokidis, J.; Kahane-Rapport, S.R.; Segre, P.S.; Stimpert, A.K.; Friedlaender, A.S. Using Digital Tags with Integrated Video and Inertial Sensors to Study Moving Morphology and Associated Function in Large Aquatic Vertebrates. Anat. Rec.-Adv. Integr. Anat. Evol. Biol. 2017, 300, 1935–1941. [Google Scholar] [CrossRef]
  11. Boehme, L.; Lovell, P.; Biuw, M.; Roquet, F.; Nicholson, J.; Thorpe, S.E.; Meredith, M.P.; Fedak, M. Technical Note: Animal-borne CTD-Satellite Relay Data Loggers for real-time oceanographic data collection. Ocean. Sci. 2009, 5, 685–695. [Google Scholar] [CrossRef]
  12. Fedak, M.A. The impact of animal platforms on polar ocean observation. Deep.-Sea Res. Part Ii-Top. Stud. Oceanogr. 2013, 88–89, 7–13. [Google Scholar] [CrossRef]
  13. Deng, Z.D.; Carlson, T.J.; Li, H.; Xiao, J.; Myjak, M.J.; Lu, J.; Martinez, J.J.; Woodley, C.M.; Weiland, M.A.; Eppard, M.B. An injectable acoustic transmitter for juvenile salmon. Sci. Rep. 2015, 5, 8111. [Google Scholar] [CrossRef] [PubMed]
  14. Zhang, H.; Dai, Y.; Yang, S.; Wang, X.; Liu, G.; Chen, X. Vertical movement characteristics of tuna (Thunnus albacares) in Pacific Ocean determined using pop-up satellite archival tags. Trans. Chin. Soc. Agric. Eng. 2014, 30, 196–203. [Google Scholar]
  15. Geng, Z.; Feng, G.-P.; Zhao, F.; Zhang, T.; Yang, G.; Zhuang, P. The application of ultrasonic telemetry in the study of spawning ground of Eriocheir sinensis. Chin. J. Ecol. 2018, 37, 3795–3801. [Google Scholar]
  16. Liu, M.; Lin, W.; Lin, M.; Liu, B.; Dong, L.; Zhang, P.; Yang, Z.; Wang, K.; Dai, L.; Li, S. The First Attempt of Satellite Tracking on Occurrence and Migration of Bryde’s Whale (Balaenoptera edeni) in the Beibu Gulf. J. Mar. Sci. Eng. 2021, 9, 796. [Google Scholar] [CrossRef]
  17. O’Sullivan, J.; Lowe, C.G.; Sosa-Nishizaki, O.; Jorgensen, S.J.; Anderson, J.M.; Farrugia, T.J.; García-Rodríguez, E.; Lyons, K.; McKinzie, M.K.; Oñate-González, E.C.; et al. A biologging database of juvenile white sharks from the northeast Pacific. Sci. Data 2022, 9, 142. [Google Scholar] [CrossRef] [PubMed]
  18. Skubel, R.A.; Wilson, K.; Papastamatiou, Y.P.; Verkamp, H.J.; Sulikowski, J.A.; Benetti, D.; Hammerschlag, N. A scalable, satellite-transmitted data product for monitoring high-activity events in mobile aquatic animals. Anim. Biotelemetry 2020, 8, 34. [Google Scholar] [CrossRef]
  19. Goossens, J.; Woillez, M.; LeBris, A.; Verhelst, P.; Moens, T.; Torreele, E.; Reubens, J. Acoustic and archival technologies join forces: A combination tag. Methods Ecol. Evol. 2023, 14, 860–866. [Google Scholar] [CrossRef]
  20. McKenna, J.E.; Sethi, S.A.; Scholten, G.M.; Kraus, J.; Chalupnicki, M. Acoustic tag retention and tagging mortality of juvenile cisco Coregonus artedi. J. Great Lakes Res. 2021, 47, 937–942. [Google Scholar] [CrossRef]
  21. Kume, M.; Takagi, J.; Dantsuji, Y.; Ito, T.; Yamashita, Y.; Mitamura, H.; Wada, T. Tagging of age-0 flatfish with acoustic transmitters: Comparison of internal implantation versus external attachment. Environ. Biol. Fishes 2023, 106, 2011–2019. [Google Scholar] [CrossRef]
  22. Ma, F.; Lu, T.; Zhang, H. Design of Beidou and Iridium dual-mode communication system for smart float. Transducer Microsyst. Technol. 2021, 40, 107–110. [Google Scholar]
  23. Kennedy, D.; Cullen, E.; McNulty, R.; Gaffney, M.; Walsh, M.; O’Flynn, B. Marine Inertial Measurement Units: Communication, Capabilities, and Challenges. Mar. Technol. Soc. J. 2015, 49, 56–63. [Google Scholar] [CrossRef]
  24. Hao, X.; Tanaka, S.; Masuda, A.; Nakamura, J.; Sudoh, K.; Maenaka, K.; Takao, H.; Higuchi, K. Application of Silicon on Nothing Structure for Developing a Novel Capacitive Absolute Pressure Sensor. IEEE Sens. J. 2014, 14, 808–815. [Google Scholar] [CrossRef]
  25. Weaver, S.J.; Westphal, M.F.; Taylor, E.N. Technology wish lists and the significance of temperature-sensing wildlife telemetry. Anim. Biotelemetry 2021, 9, 29. [Google Scholar] [CrossRef]
  26. Gaspar, P.; Georges, J.-Y.; Fossette, S.; Lenoble, A.; Ferraroli, S.; Le Maho, Y. Marine animal behaviour: Neglecting ocean currents can lead us up the wrong track. Proc. R. Soc. B-Biol. Sci. 2006, 273, 2697–2702. [Google Scholar] [CrossRef] [PubMed]
  27. Liu, Y.; Tan, N.; Xiao, X.; Xia, J.; Hu, W.; Ding, Y. Design and UVM Verification of an RTC Subsystem with Temperature Compensation. In Proceedings of the 2021 6th International Conference on Integrated Circuits and Microsystems (Icicm 2021), Nanjing, China, 22–24 October 2021; IEEE: Picsataway, NJ, USA, 2021; pp. 384–389. [Google Scholar] [CrossRef]
  28. Chi, Y.; Zheng, Z. A Design of Real-Time Clock for Wireless Communication SoC in Smart Grid. In Proceedings of the 14th International Conference on Wireless Communications, Networking and Mobile Computing (Wicom 2018), Chongqing, China, 18–20 September 2018; Destech Publications Inc.: Lancaster, PA, USA, 2018; 306, pp. 331–340. [Google Scholar]
  29. Meynecke, J.-O.; Liebsch, N. Asset Tracking Whales-First Deployment of a Custom-Made GPS/GSM Suction Cup Tag on Migrating Humpback Whales. J. Mar. Sci. Eng. 2021, 9, 597. [Google Scholar] [CrossRef]
  30. Wu, Z.; Mao, M.; Xiong, J.; Zhao, Z.; Yuan, K. Dynamic Phase Comparison Planar Direction-Finding Algorithm on Satellite Radio Receiver. Appl. Sci. -Basel 2024, 14, 3400. [Google Scholar] [CrossRef]
Figure 1. Marine animal behavior recording tag system. (a) System structure image; (b) prototype of the tag system.
Jmse 12 02292 g001
Figure 2. System hardware architecture.
Jmse 12 02292 g002
Figure 3. Ripple test of DC–DC buck chip.
Jmse 12 02292 g003
Figure 4. The circuit schematic image of the data acquisition module.
Jmse 12 02292 g004
Figure 5. The circuit schematic image of the release module.
Jmse 12 02292 g005
Figure 6. Embedded software architecture image.
Jmse 12 02292 g006
Figure 7. System workflow.
Jmse 12 02292 g007
Figure 8. Combined positioning and recovery workflow.
Jmse 12 02292 g008
Figure 9. The circuit schematic image of the combined positioning and recovery module.
Jmse 12 02292 g009
Figure 10. Radio direction-finding test. (a) Radio direction-finding equipment; (b) radio direction-finding environment; (c) relationship between distance and RSSI.
Jmse 12 02292 g010aJmse 12 02292 g010b
Figure 11. The attitude of the label body in seawater.
Jmse 12 02292 g011
Figure 12. System power test environment.
Jmse 12 02292 g012
Figure 13. System power consumption. (a) Release separation power consumption; (b) release separation power consumption.
Jmse 12 02292 g013
Figure 14. Iridium communication test environment.
Jmse 12 02292 g014
Figure 15. Underwater trajectory reconstruction test environment. (a) Fixed tag system; (b) trajectory flow.
Jmse 12 02292 g015
Figure 16. Reconstruction of submersion trajectory and time.
Jmse 12 02292 g016
Figure 17. Experimental environment of pool.
Jmse 12 02292 g017
Figure 18. Nearshore Experiments. (a) The tag floats to the surface; (b) the tag is in nearshore water; (c) the Iridium website message.
Jmse 12 02292 g018aJmse 12 02292 g018b
Figure 19. Temperature and depth data comparison results. (a) Depth data; (b) temperature data.
Jmse 12 02292 g019aJmse 12 02292 g019b
Table 1. The results of the GPS positioning error test.
IDModule NumberMaximum Error (m)Mean Error (m)
AGPS-00120.77.8
GPS-00238.16.5
GPS-00314.64.6
BGPS-00314.64.6
GPS-00314.64.6
GPS-00314.64.6
CGPS-00115.86.5
GPS-00214.56.7
GPS-0038.34.9
DGPS-00121.56.3
GPS-0029.44.5
GPS-00321.06.4
EGPS-00125.77.8
GPS-00212.76.3
GPS-00331.57.8
Table 2. The results of the power consumption test.
SleepStandbyData
Acquisition Storage
Release
Capacitance Charging
GPSIridium
Communication
RadiolocationTotal
Working
current
3.9 μA393.3 μA12.7 mA66 mA29.5 mA38.2 mA45 mA
Total
duration
168 h24 h72 h0.011 h0.5 h6.67 h0.643 h
Total power consumption0.7 mAh9.4 mAh914.4 mAh0.7 mAh14.8 mAh254.8 mAh28.9 mAh1223.7 mAh
Table 3. The results of the temperature performance test.
Standard Source (°C)System Temperature (°C)Indication Error (°C)
35.002335.00520.0029
30.004229.9956−0.0086
25.000224.9961−0.0041
19.996320.00360.0073
14.997814.9918−0.0060
9.996810.00390.0071
1.00181.00680.0050
Table 4. The results of the pressure performance test.
Standard Pressure Value
(mbar)
Sensor Probe Pressure Value
(mbar)
Indication Error
(mbar)
Percentage Error
(%)
491527360.12
50375056190.06
11,68611,656300.10
15,12315,16340−0.13
20,09520,01976−0.25
25,22325,29875−0.25
30,11130,2371260.42
Table 5. The results of the Iridium communication test.
Test ContentData Index
Iridium send times261
Number of successful sends222
Iridium communication success rate85.1%
GPS acquisition times37
Charge floating range5.9–5.2 V
Table 6. Comparison of different biologging tags.
SourceSensor type and Measurement AccuracyBody Size (mm)Recovery Mode
MiniPAT
(Wildlife Computers Inc.
Redmond, WA, USA)
temperature (±0.1 °C),
pressure (±1% FS),
light intensity (<5 × 10⁻² W·cm−2),
acceleration (±0.15 g)
118 × 38 × 38Argos + radio beacon
SPLASH-F
(Wildlife Computers Inc.)
temperature (±0.1 °C),
pressure (±1.25% FS),
dry and wet sensors,
Fastloc GPS
-Unrecyclable
CATS
(CATS Inc., Tokyo, Japan)
temperature, pressure, camera, MIMU, light intensity, Fastloc GPS245 × 90 × 50Argos + radio beacon
DTAG-3
(WHOI, Falmouth, MA, USA)
pressure, acceleration, magnetic field strength, hydrophone171 × 102 × 58Argos + radio beacon
This papertemperature (±0.1 °C),
pressure (±0.5% FS),
MIMU
160 × 70 × 53GPS + Iridium communication + radio beacon
Disclaimer/Publisher’s Note: The statements, opinions and data contained in all publications are solely those of the individual author(s) and contributor(s) and not of MDPI and/or the editor(s). MDPI and/or the editor(s) disclaim responsibility for any injury to people or property resulting from any ideas, methods, instructions or products referred to in the content.

