
Quantitative Assessment of the Impact of Port Construction on the Surrounding Mudflat Topography Based on Remote Sensing—A Case Study of Binhai Port in Jiangsu Province


Abstract
:1. Introduction
2. Study Area and Dataset
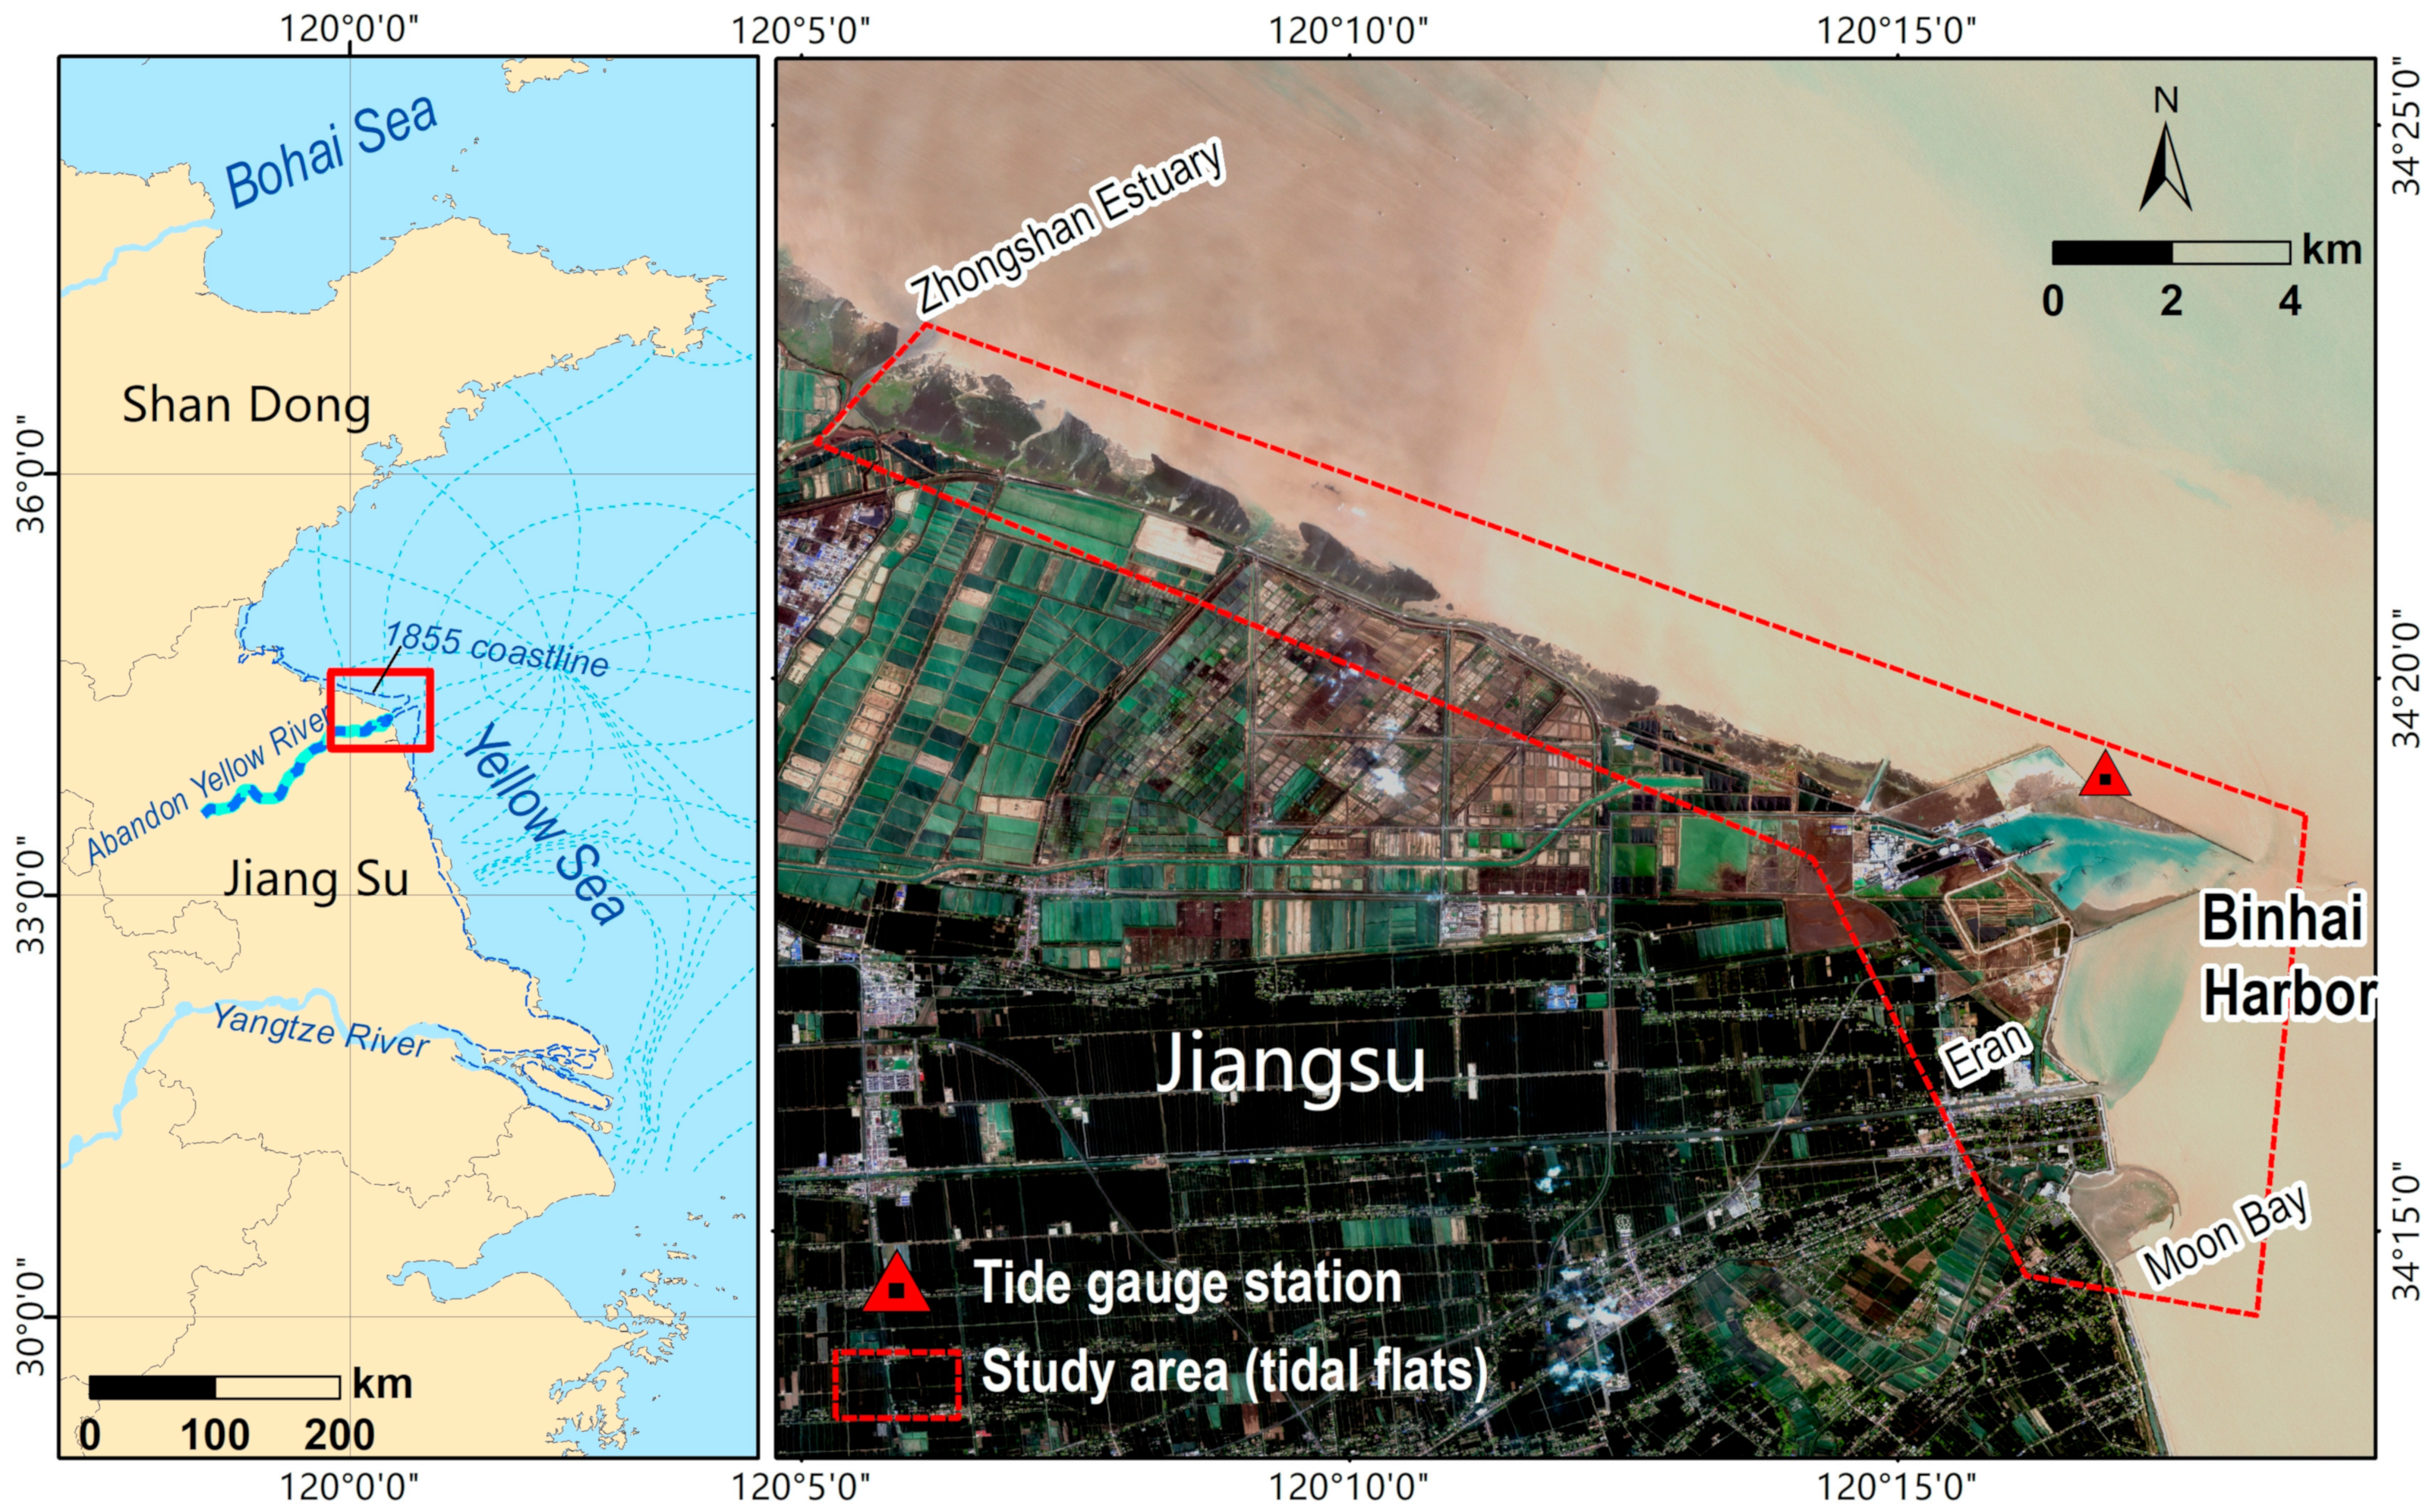
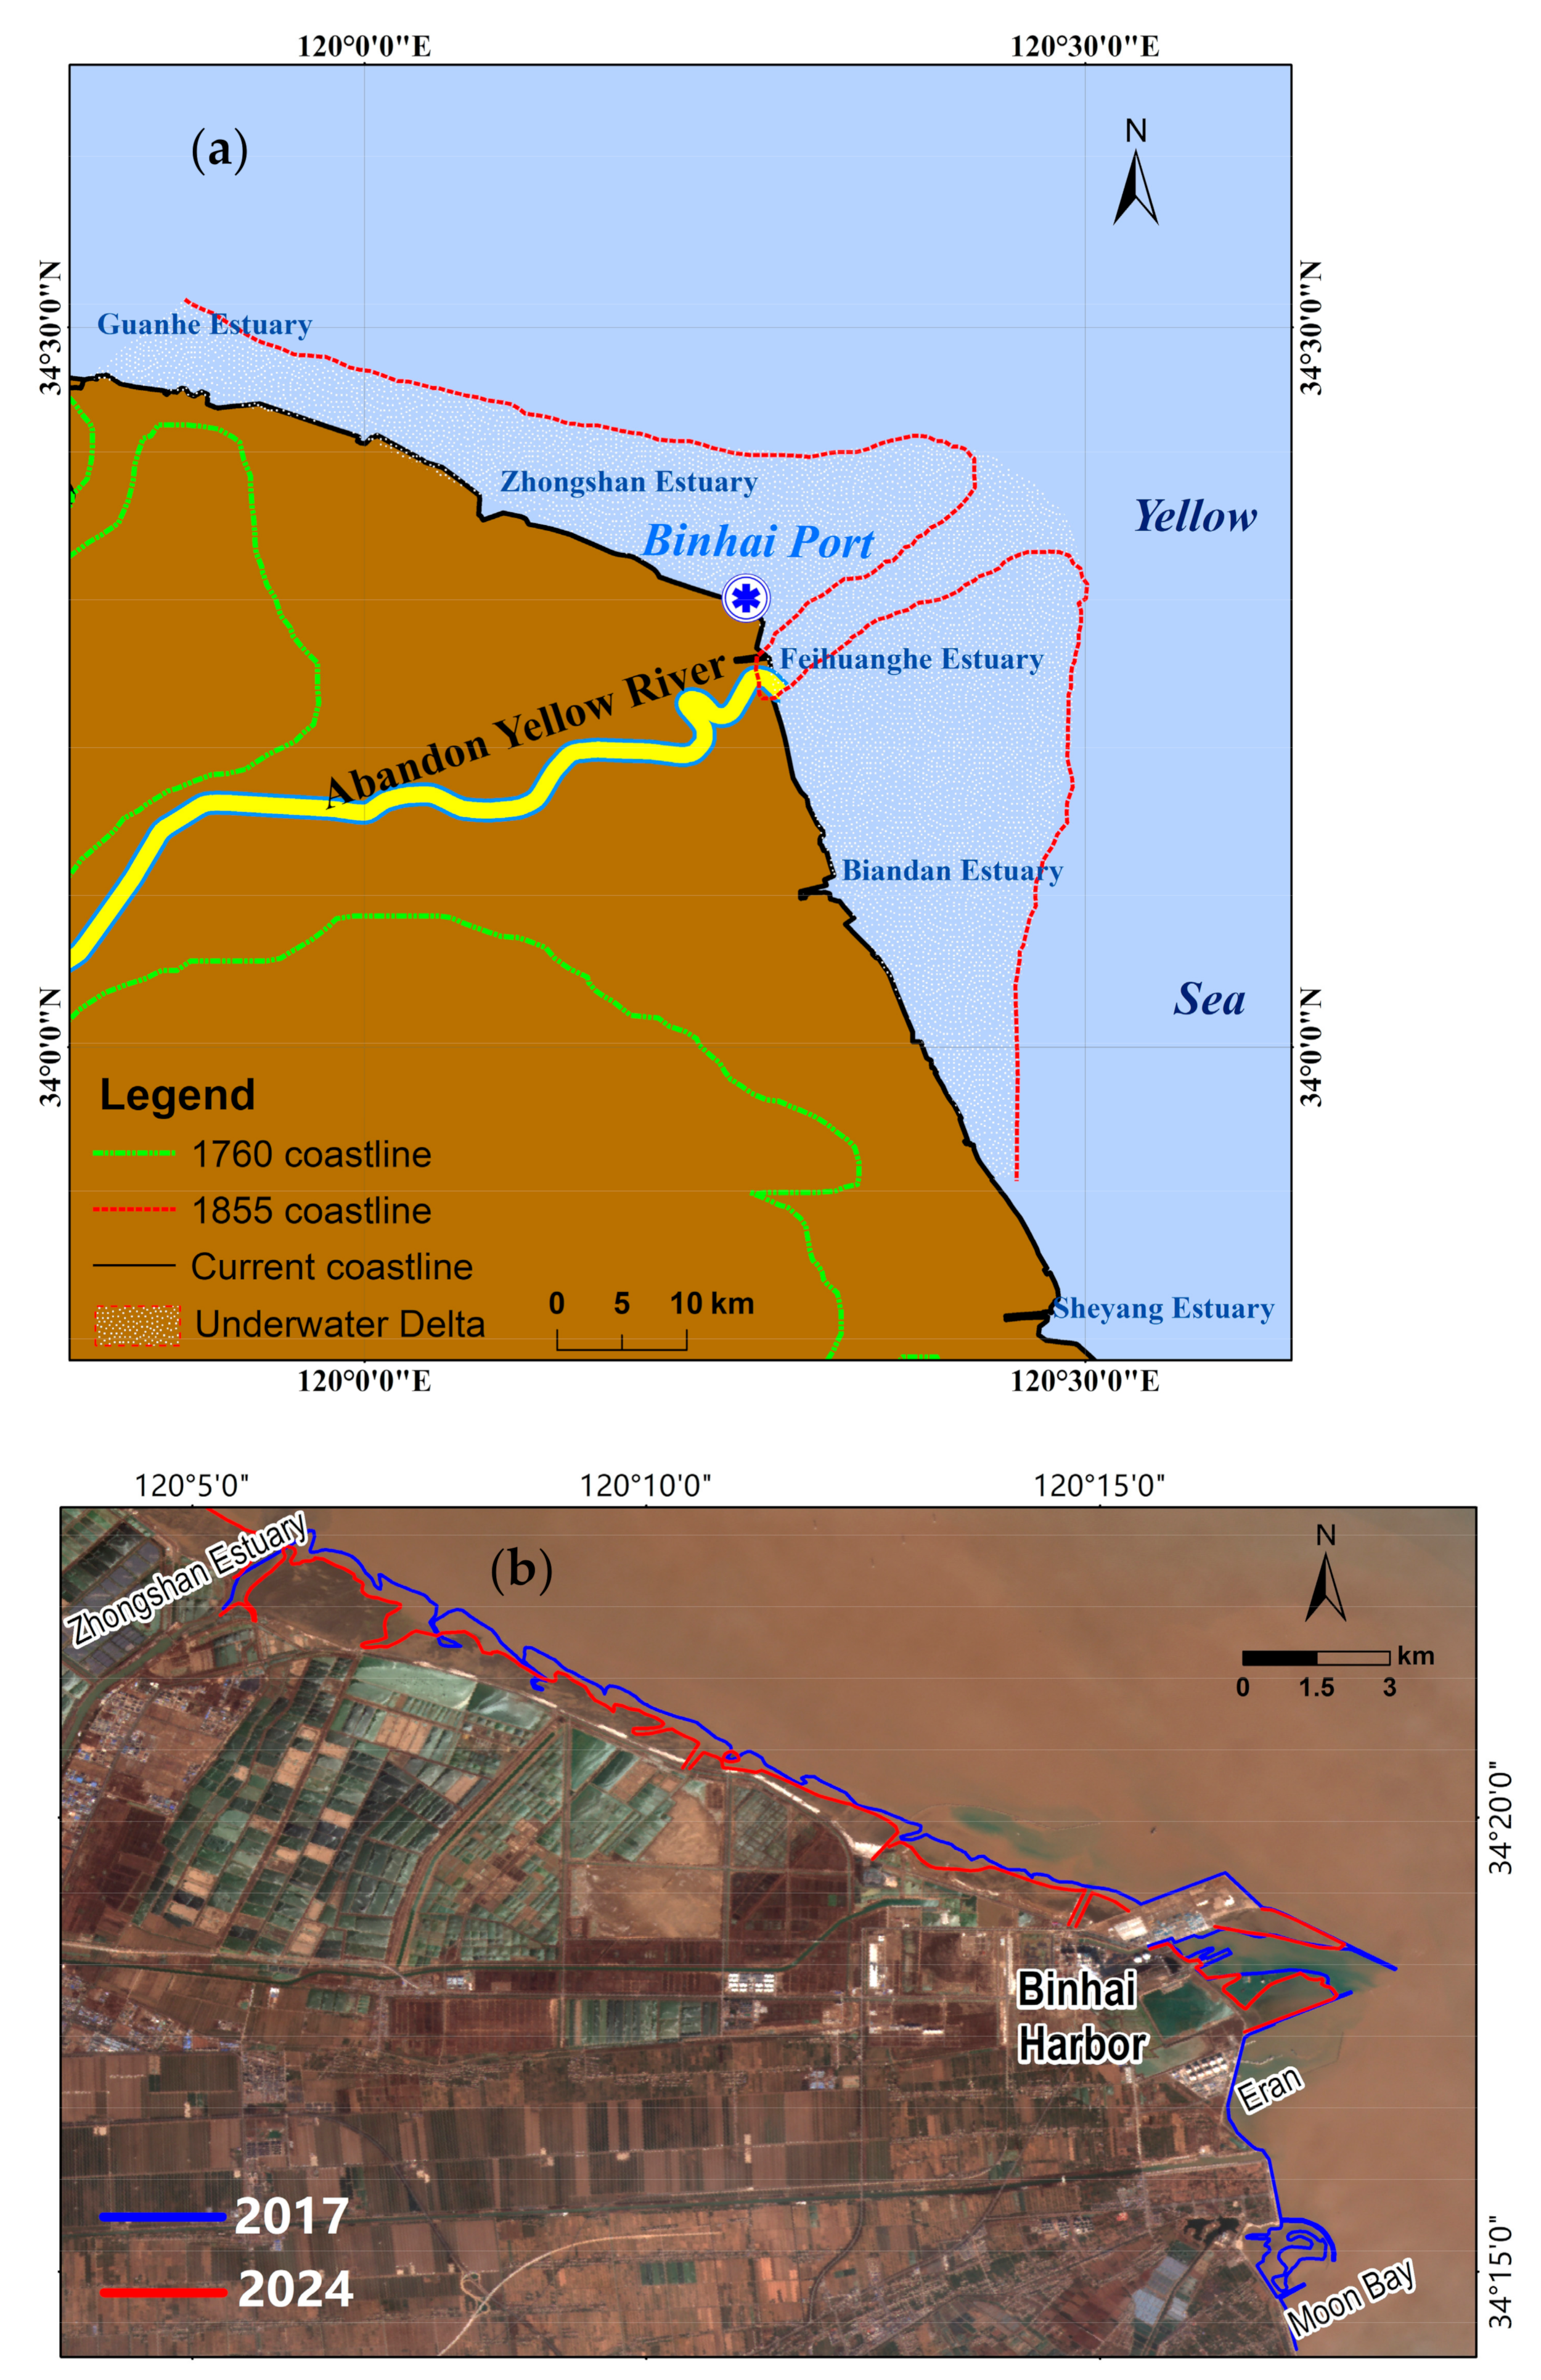
2.1. Study Area
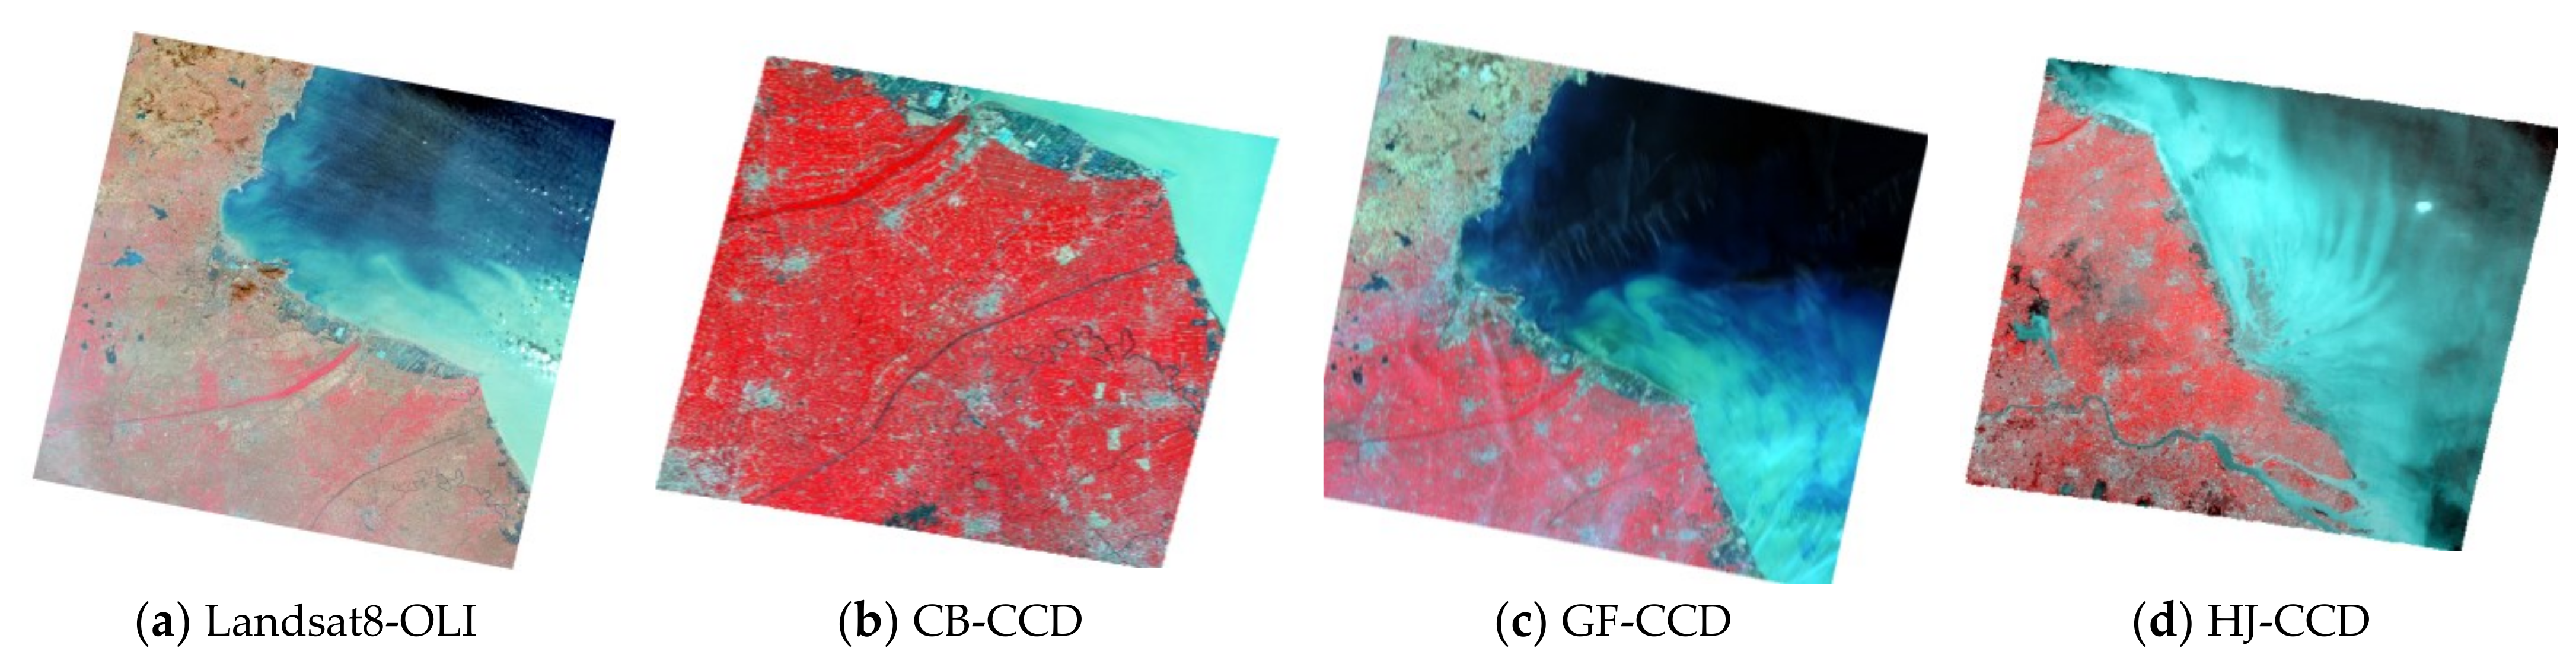
2.2. Dataset
3. Methods
3.1. The Waterline Method
3.1.1. Waterline Extraction from Remote Sensing Images
3.1.2. Elevation Assignment and DEM Construction
3.2. Quantitative Analysis of Geomorphologic Evolution
4. Results
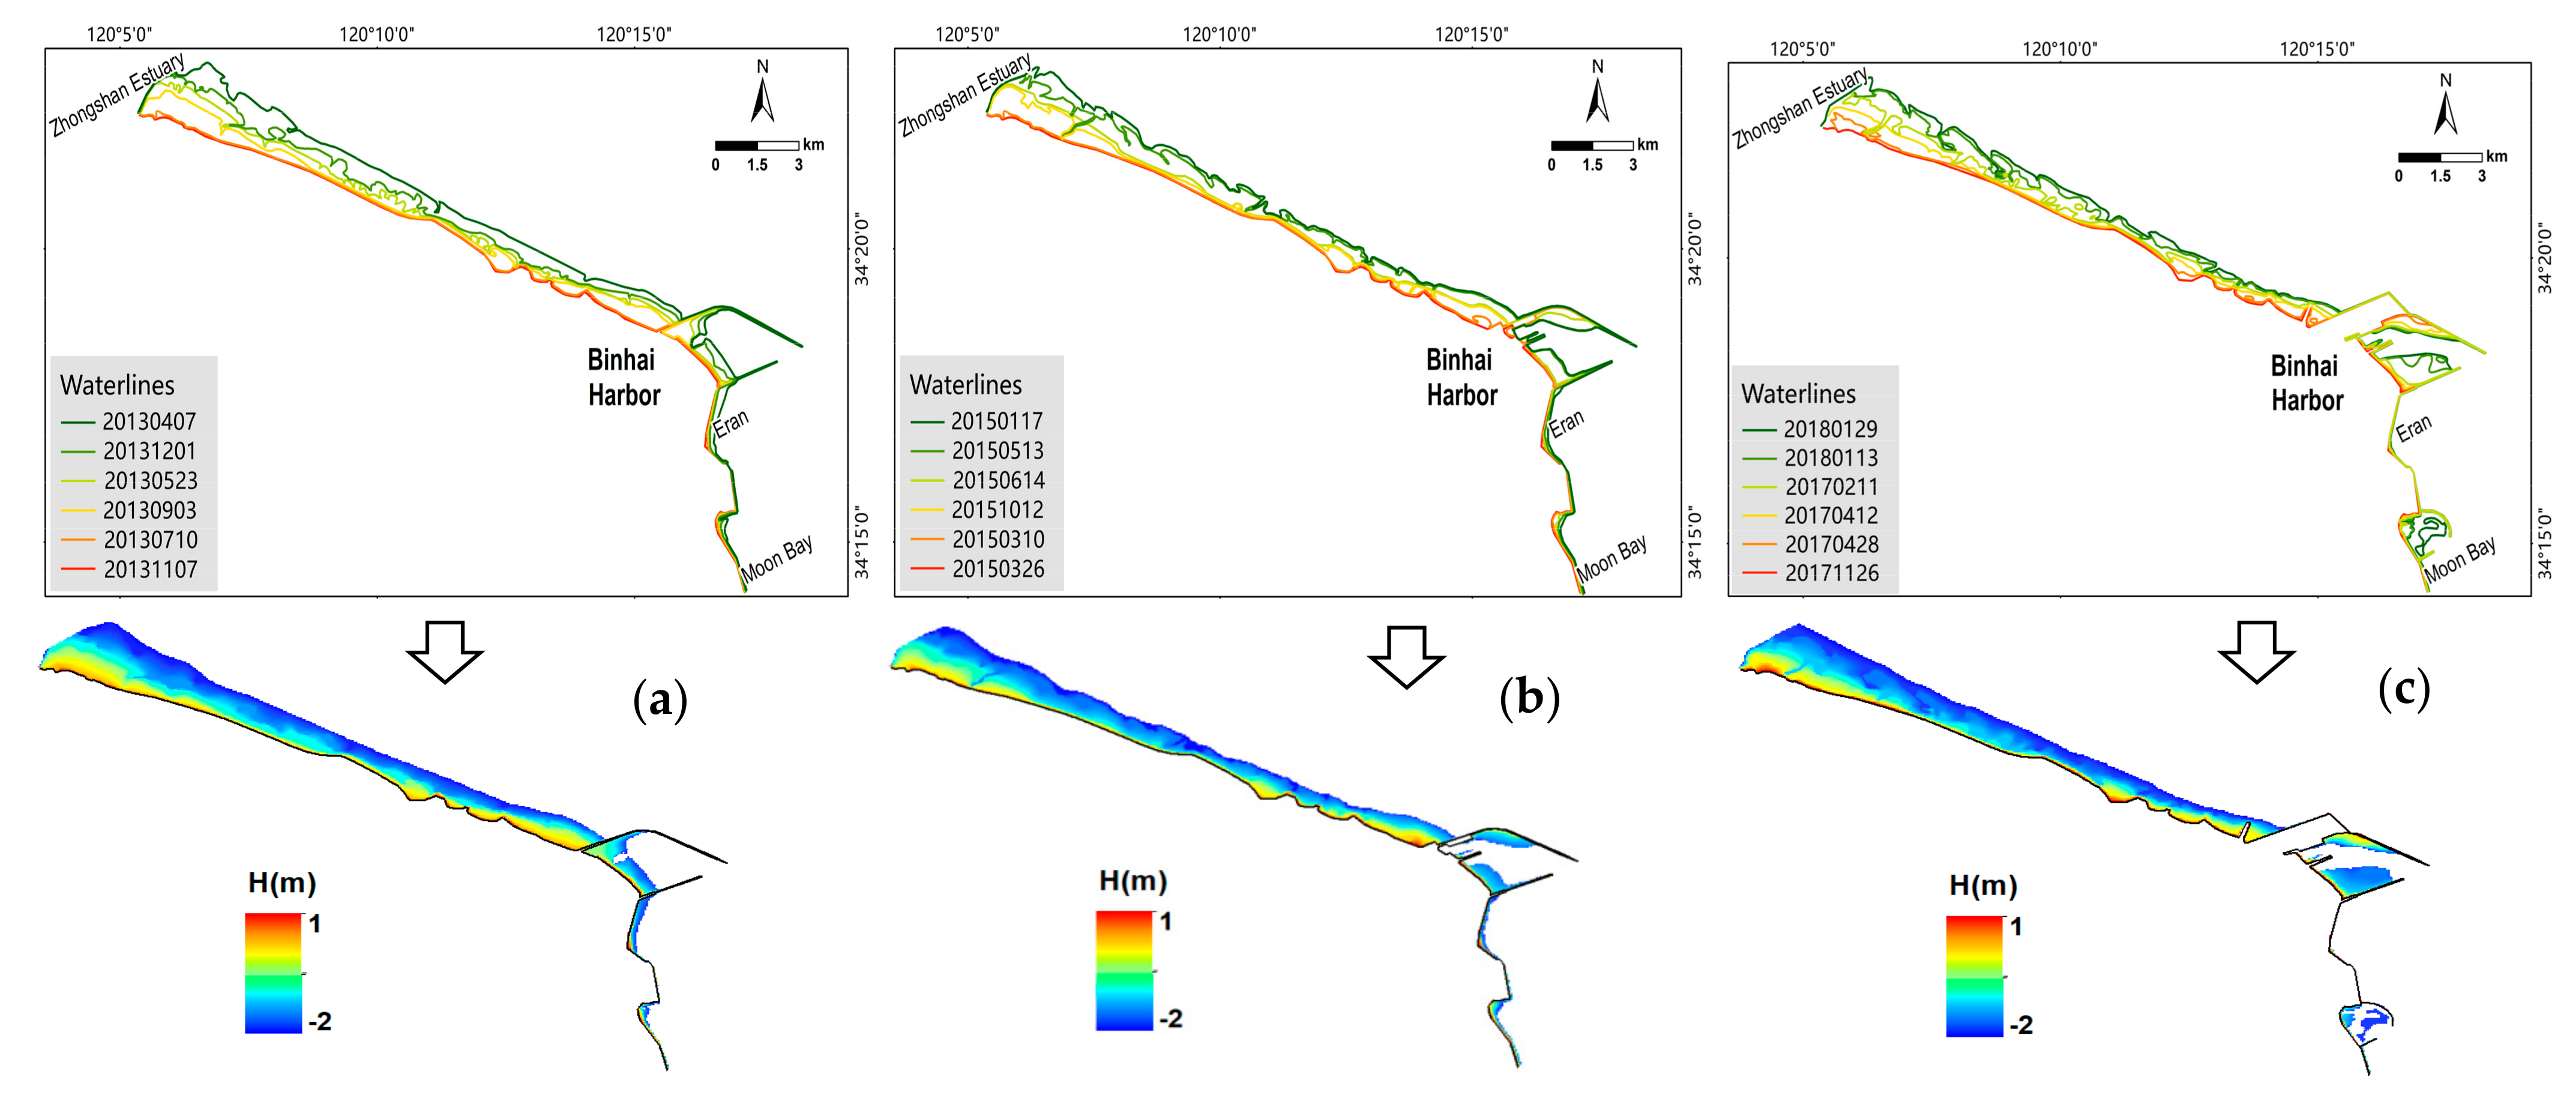
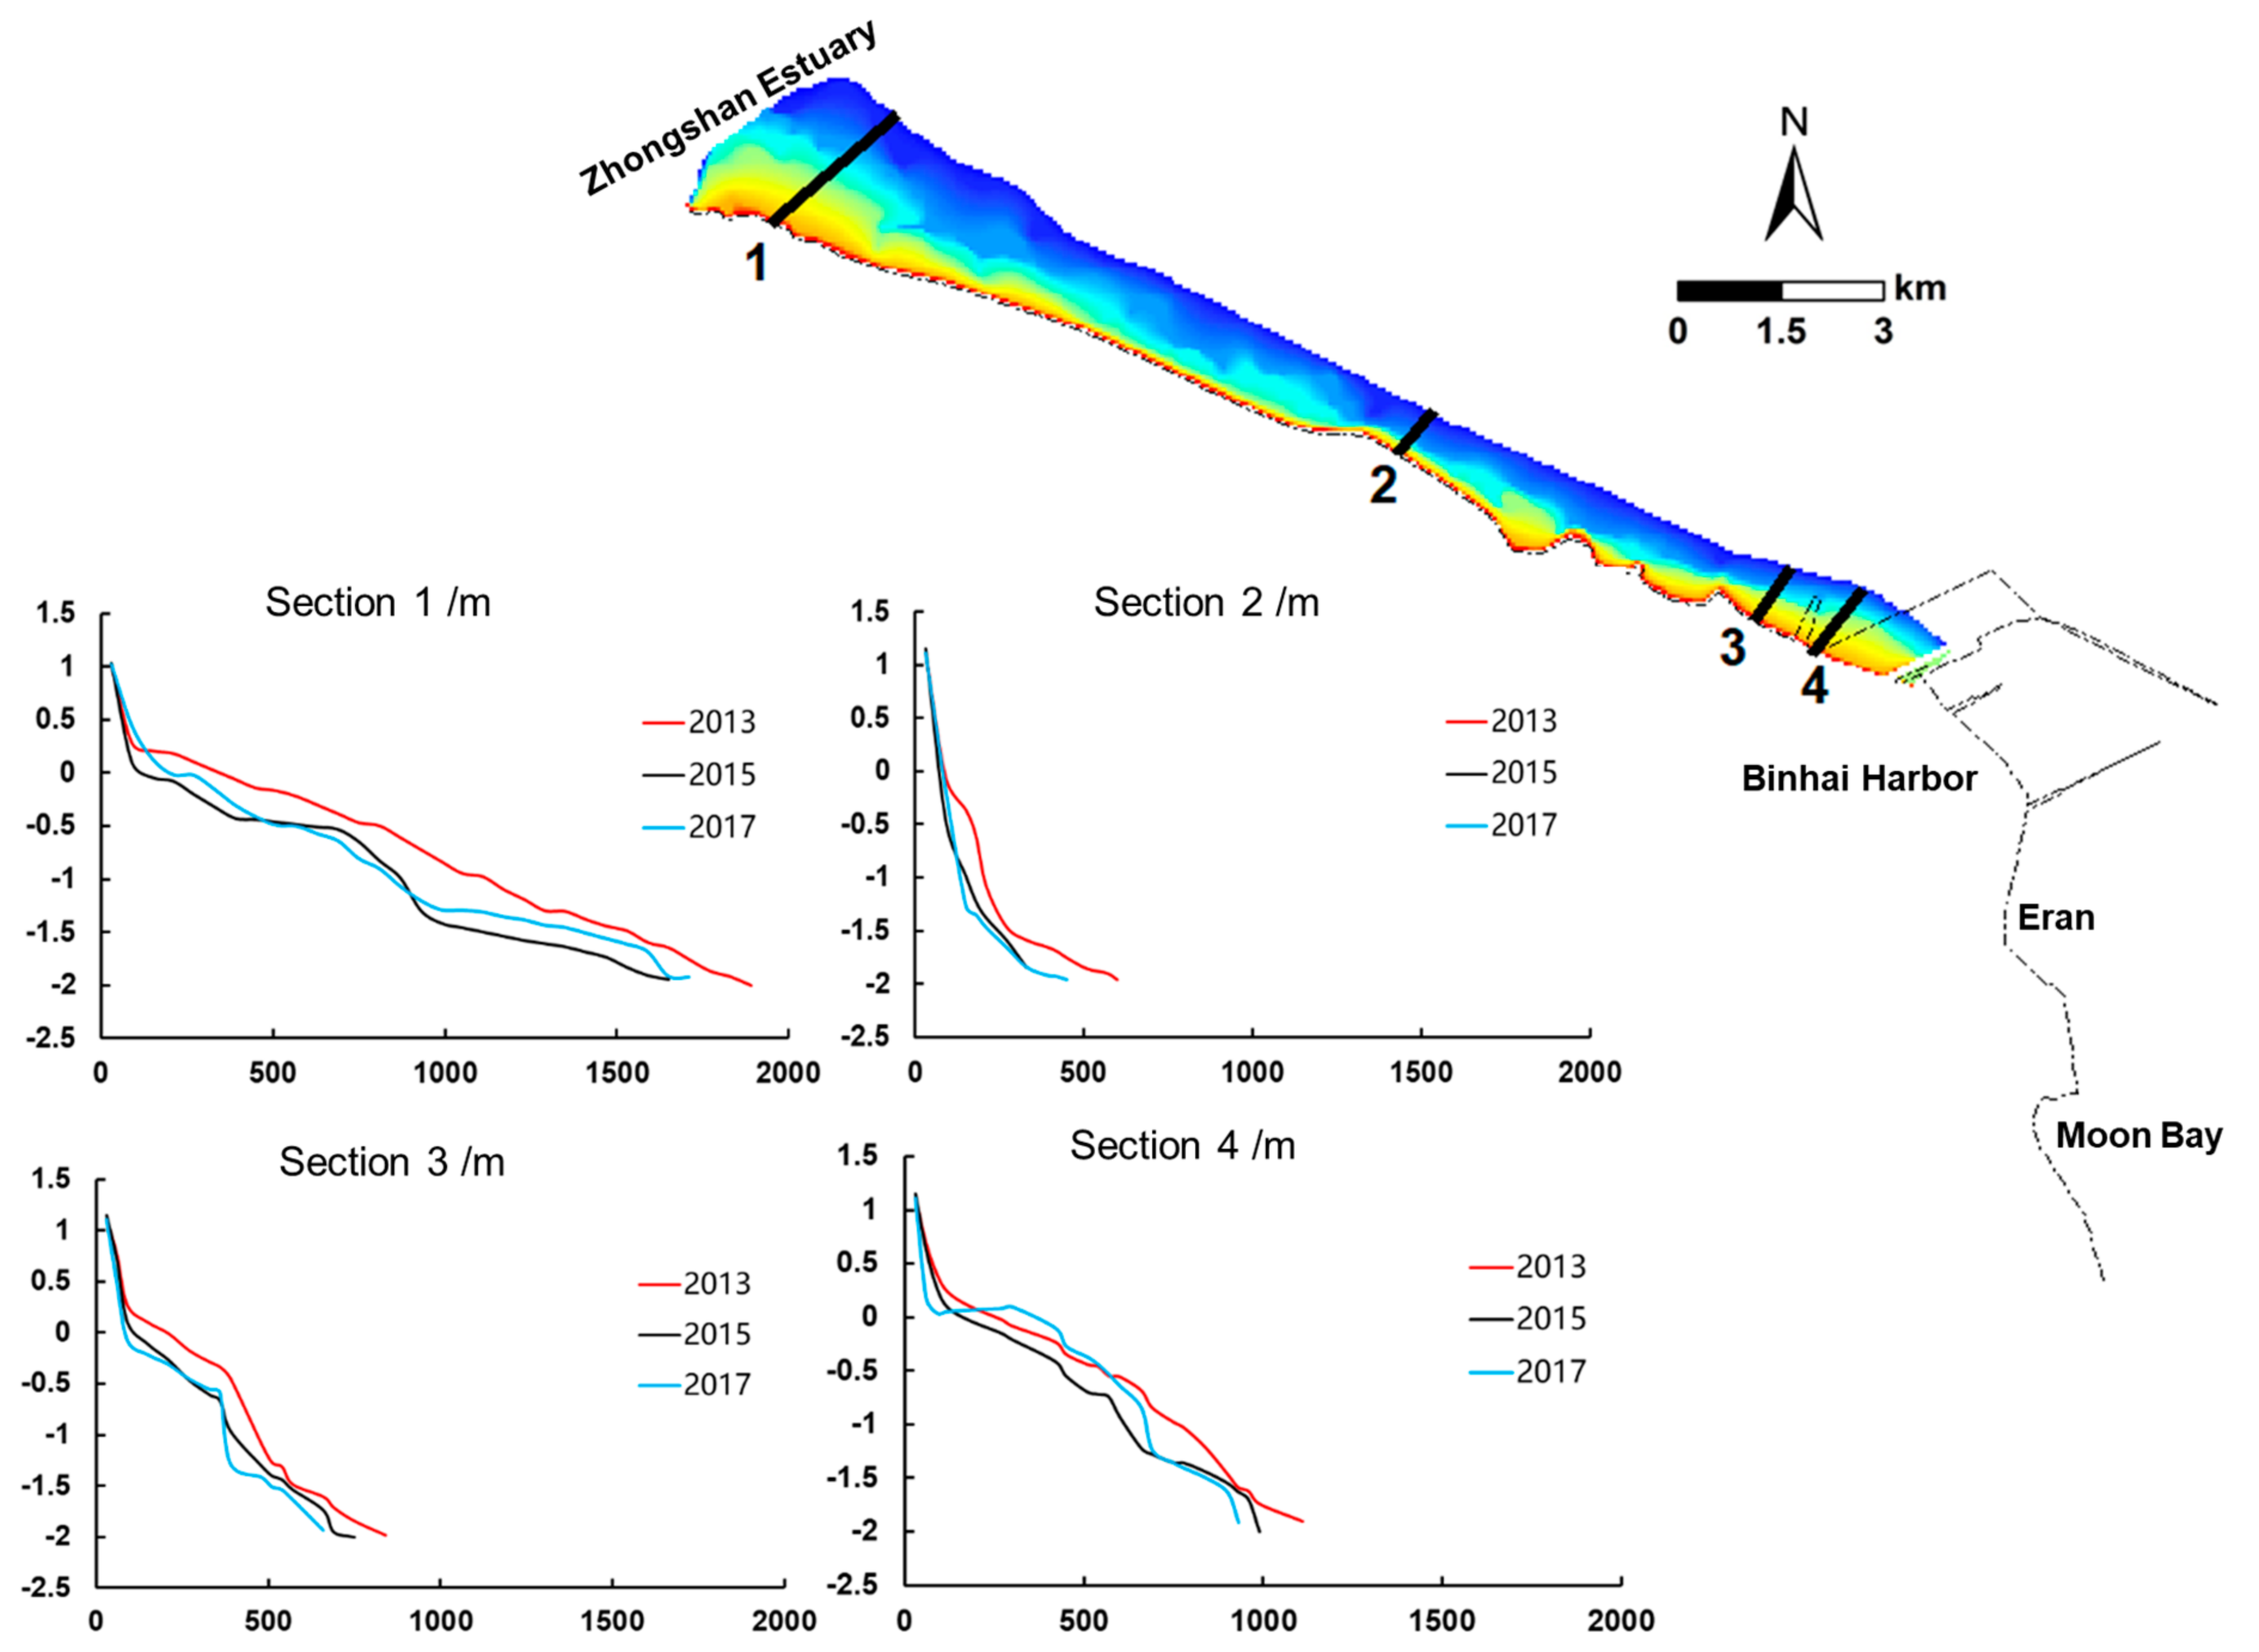
4.1. DEMs of Tidal Flats
4.2. Geomorphologic Evolution of Exposed Tidal Flat
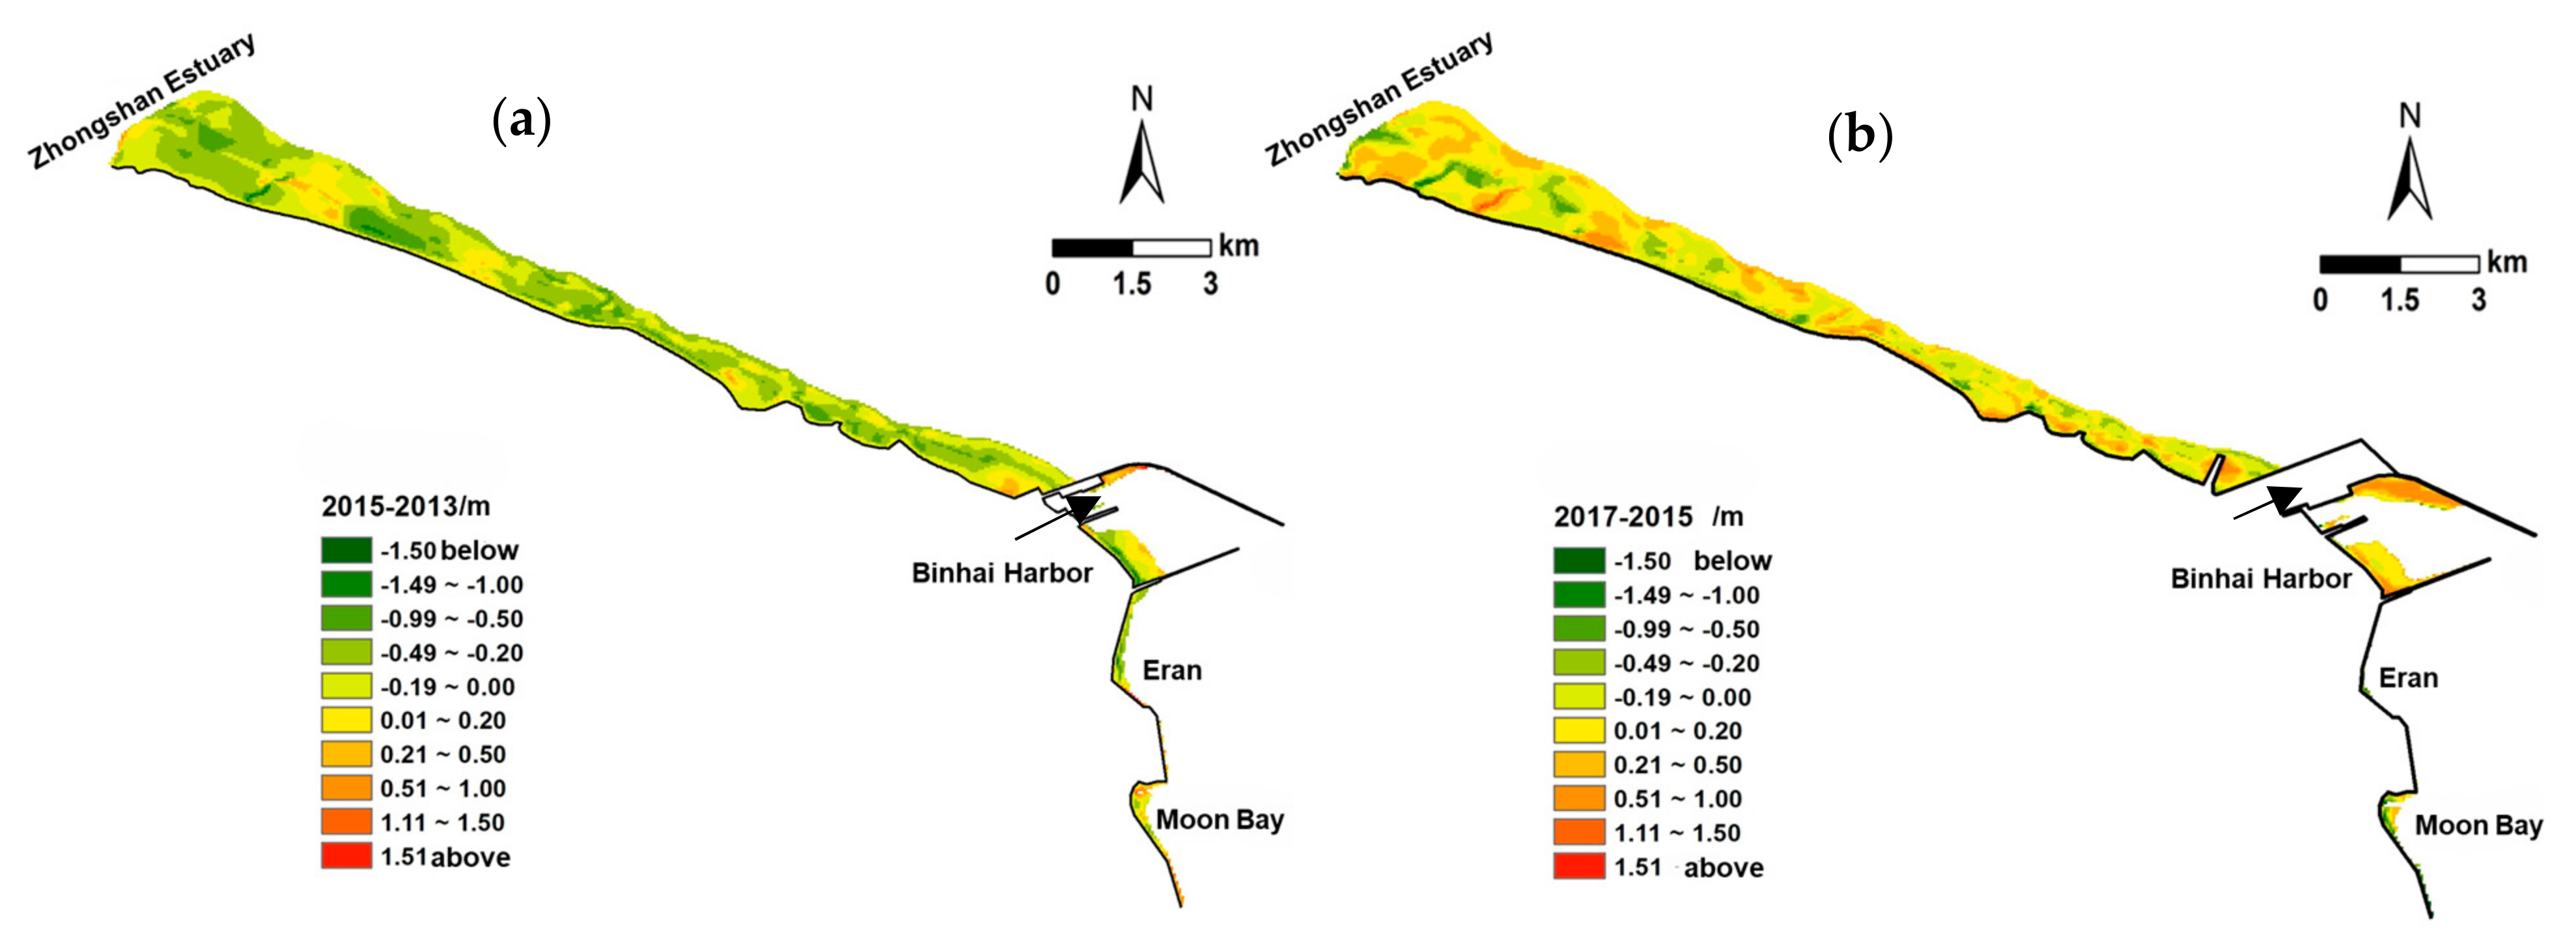
4.2.1. Erosion–Deposition Distribution
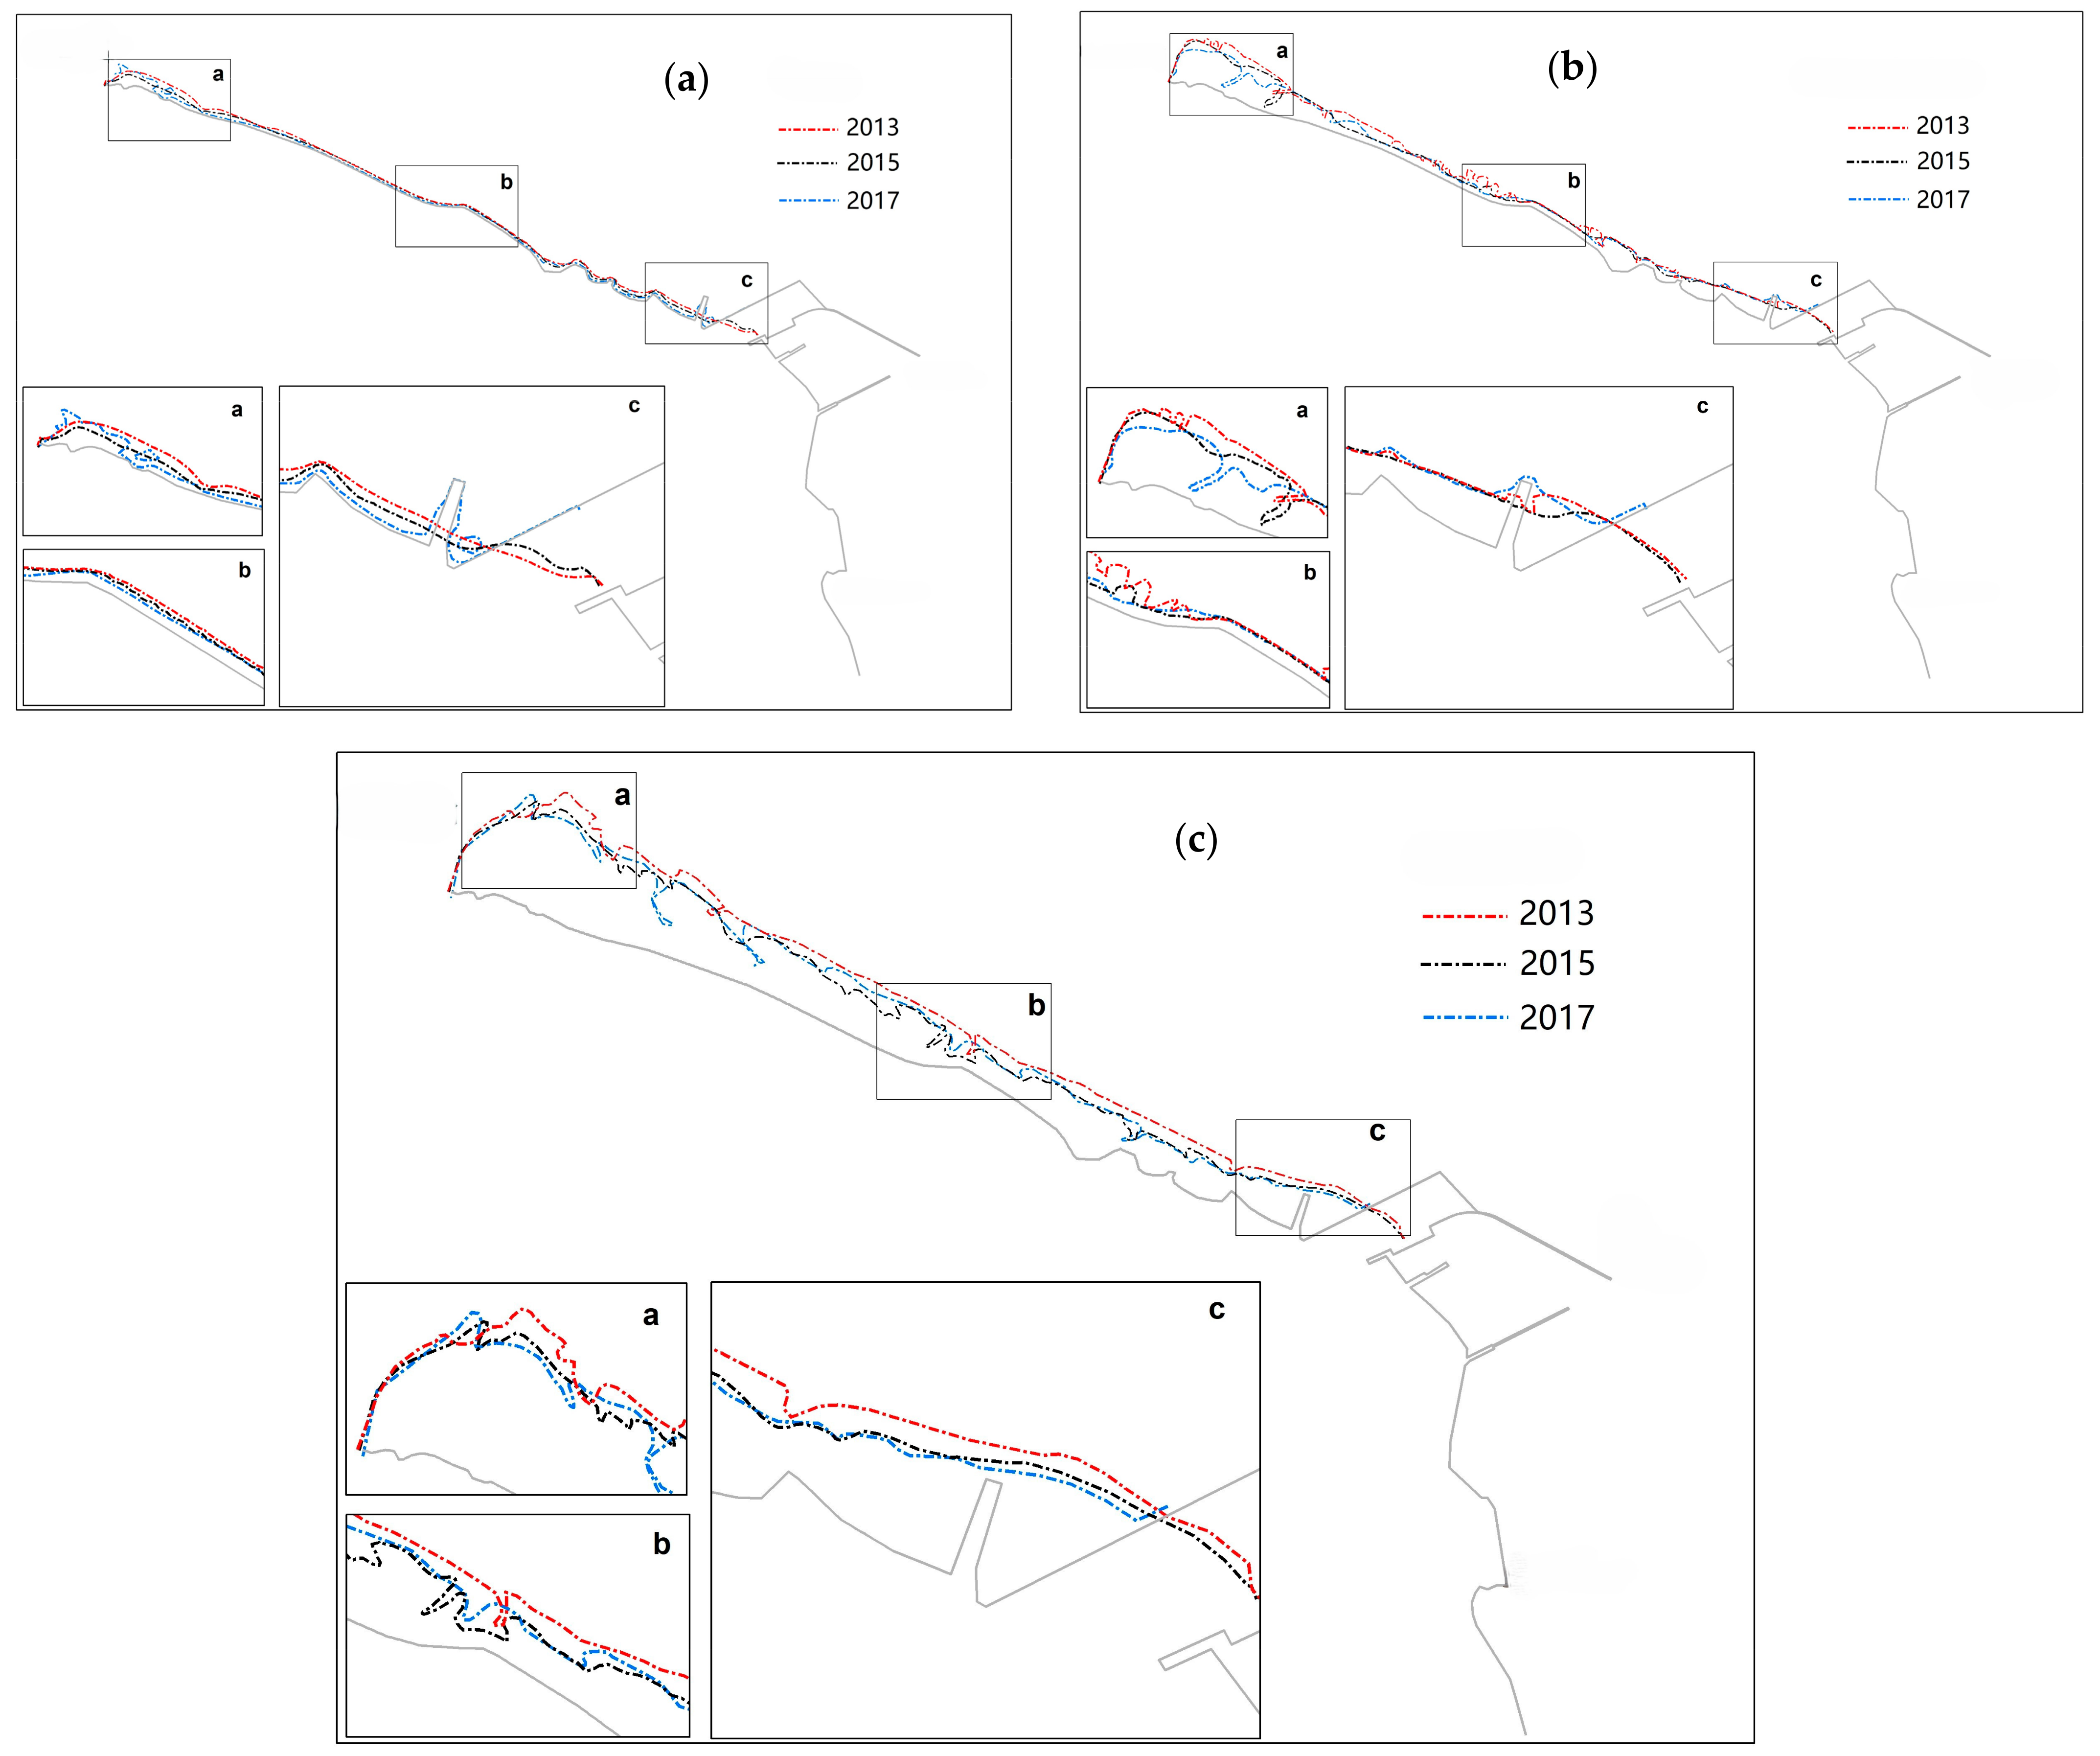
4.2.2. Changes in the North Coast
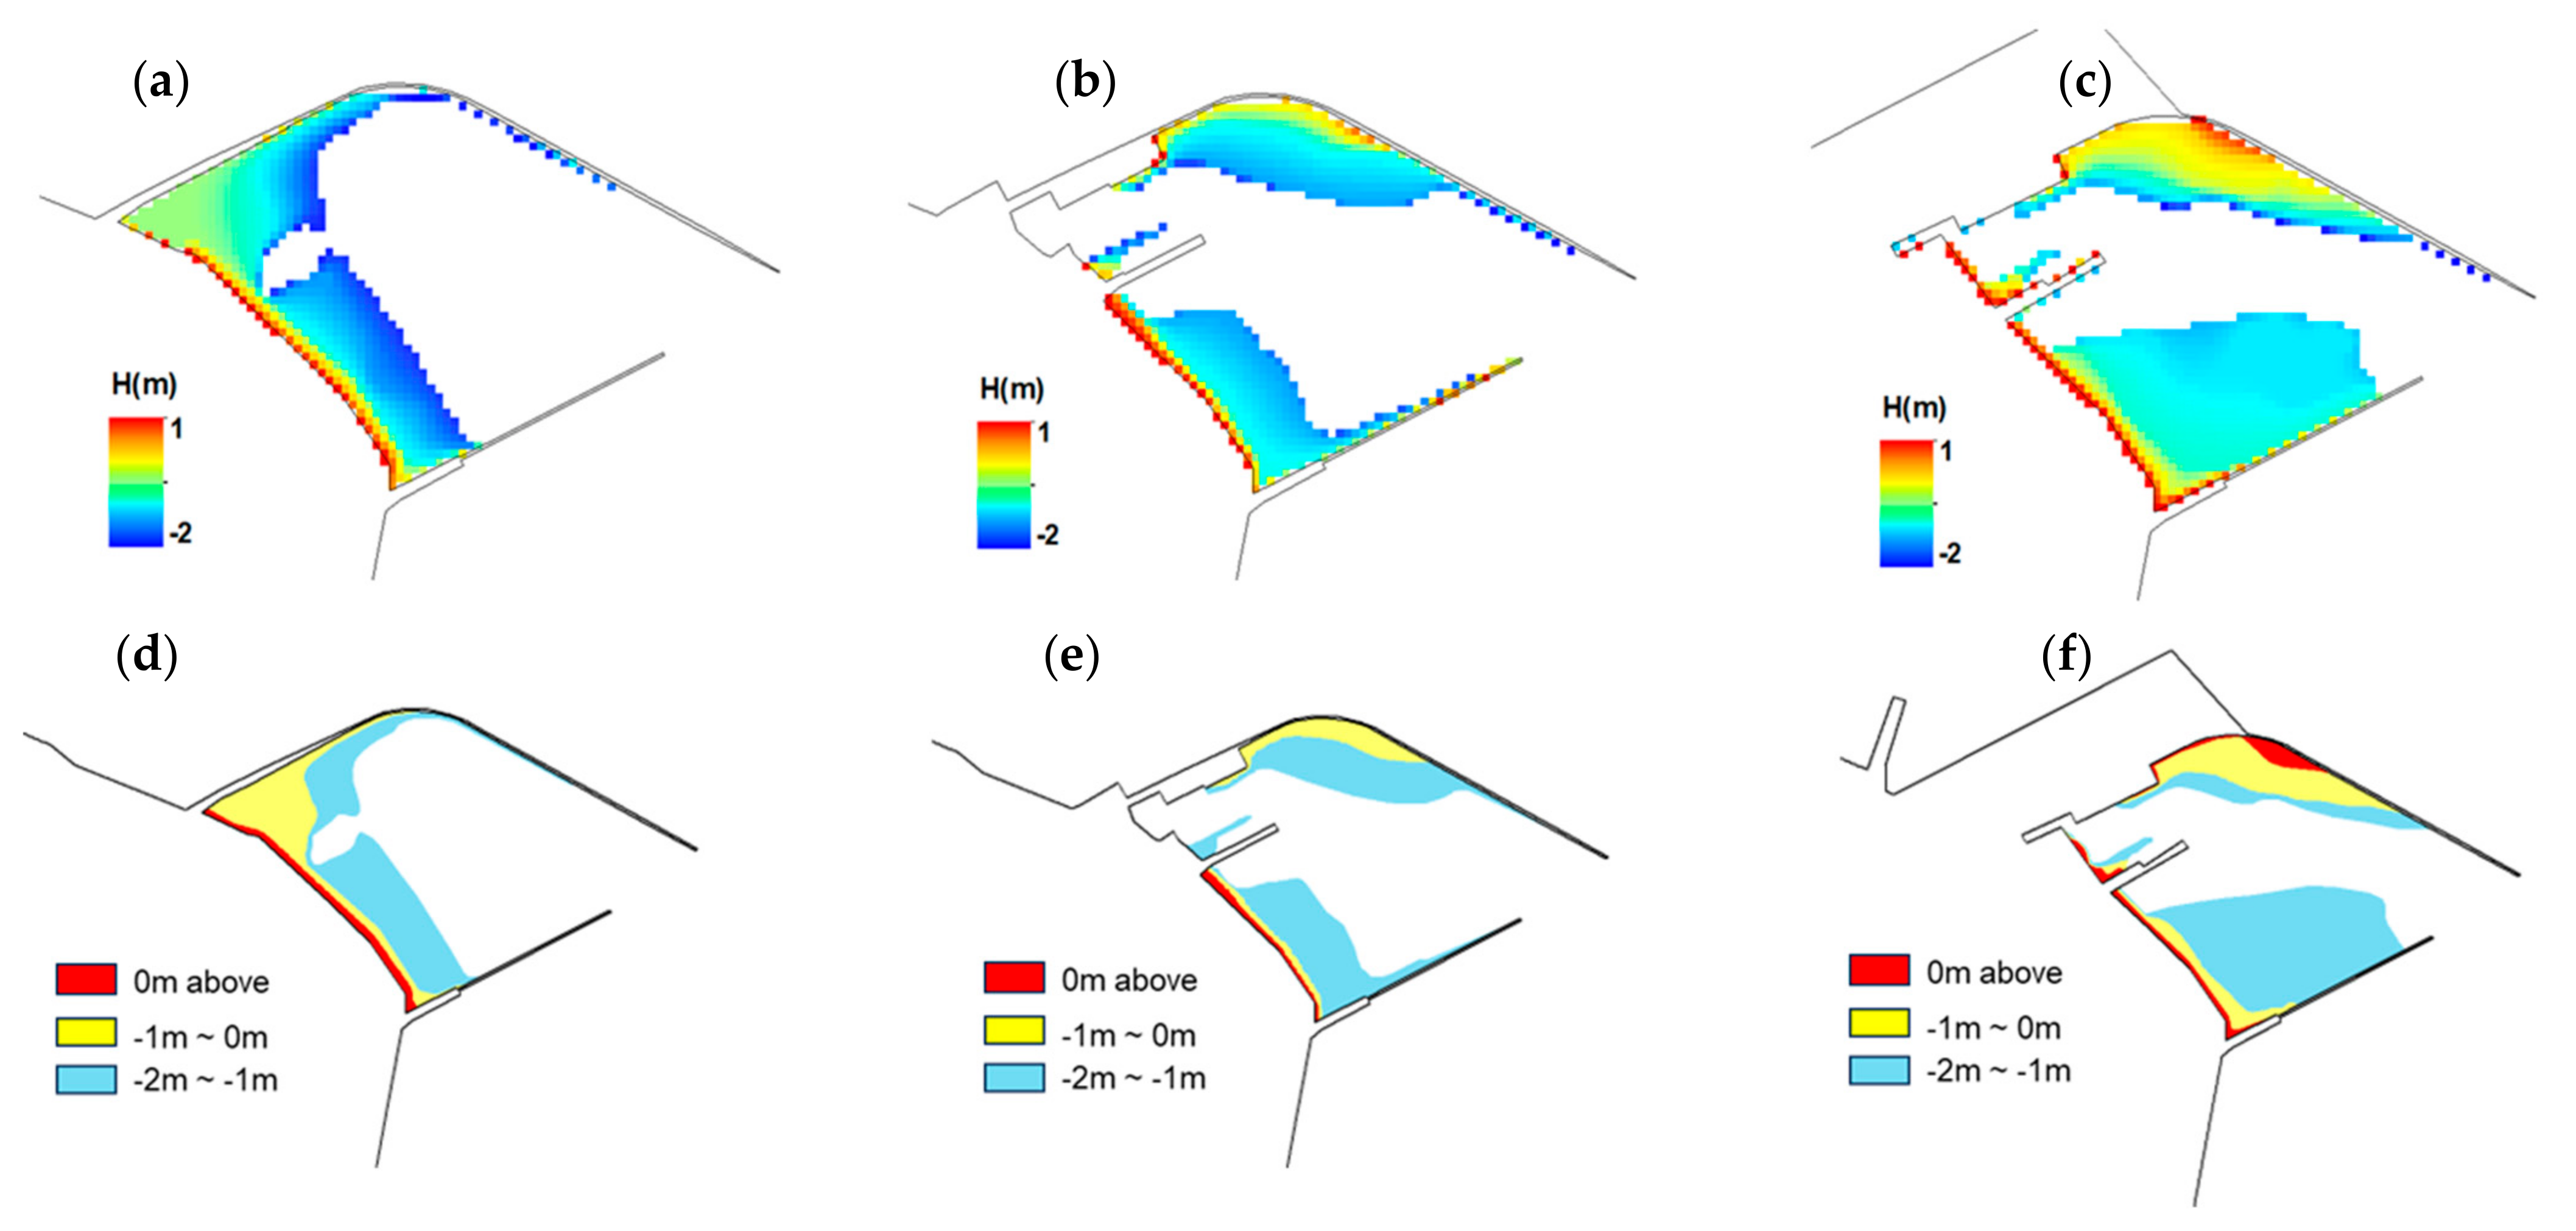
4.2.3. Changes in Tidal Flats Inside These Breakwaters
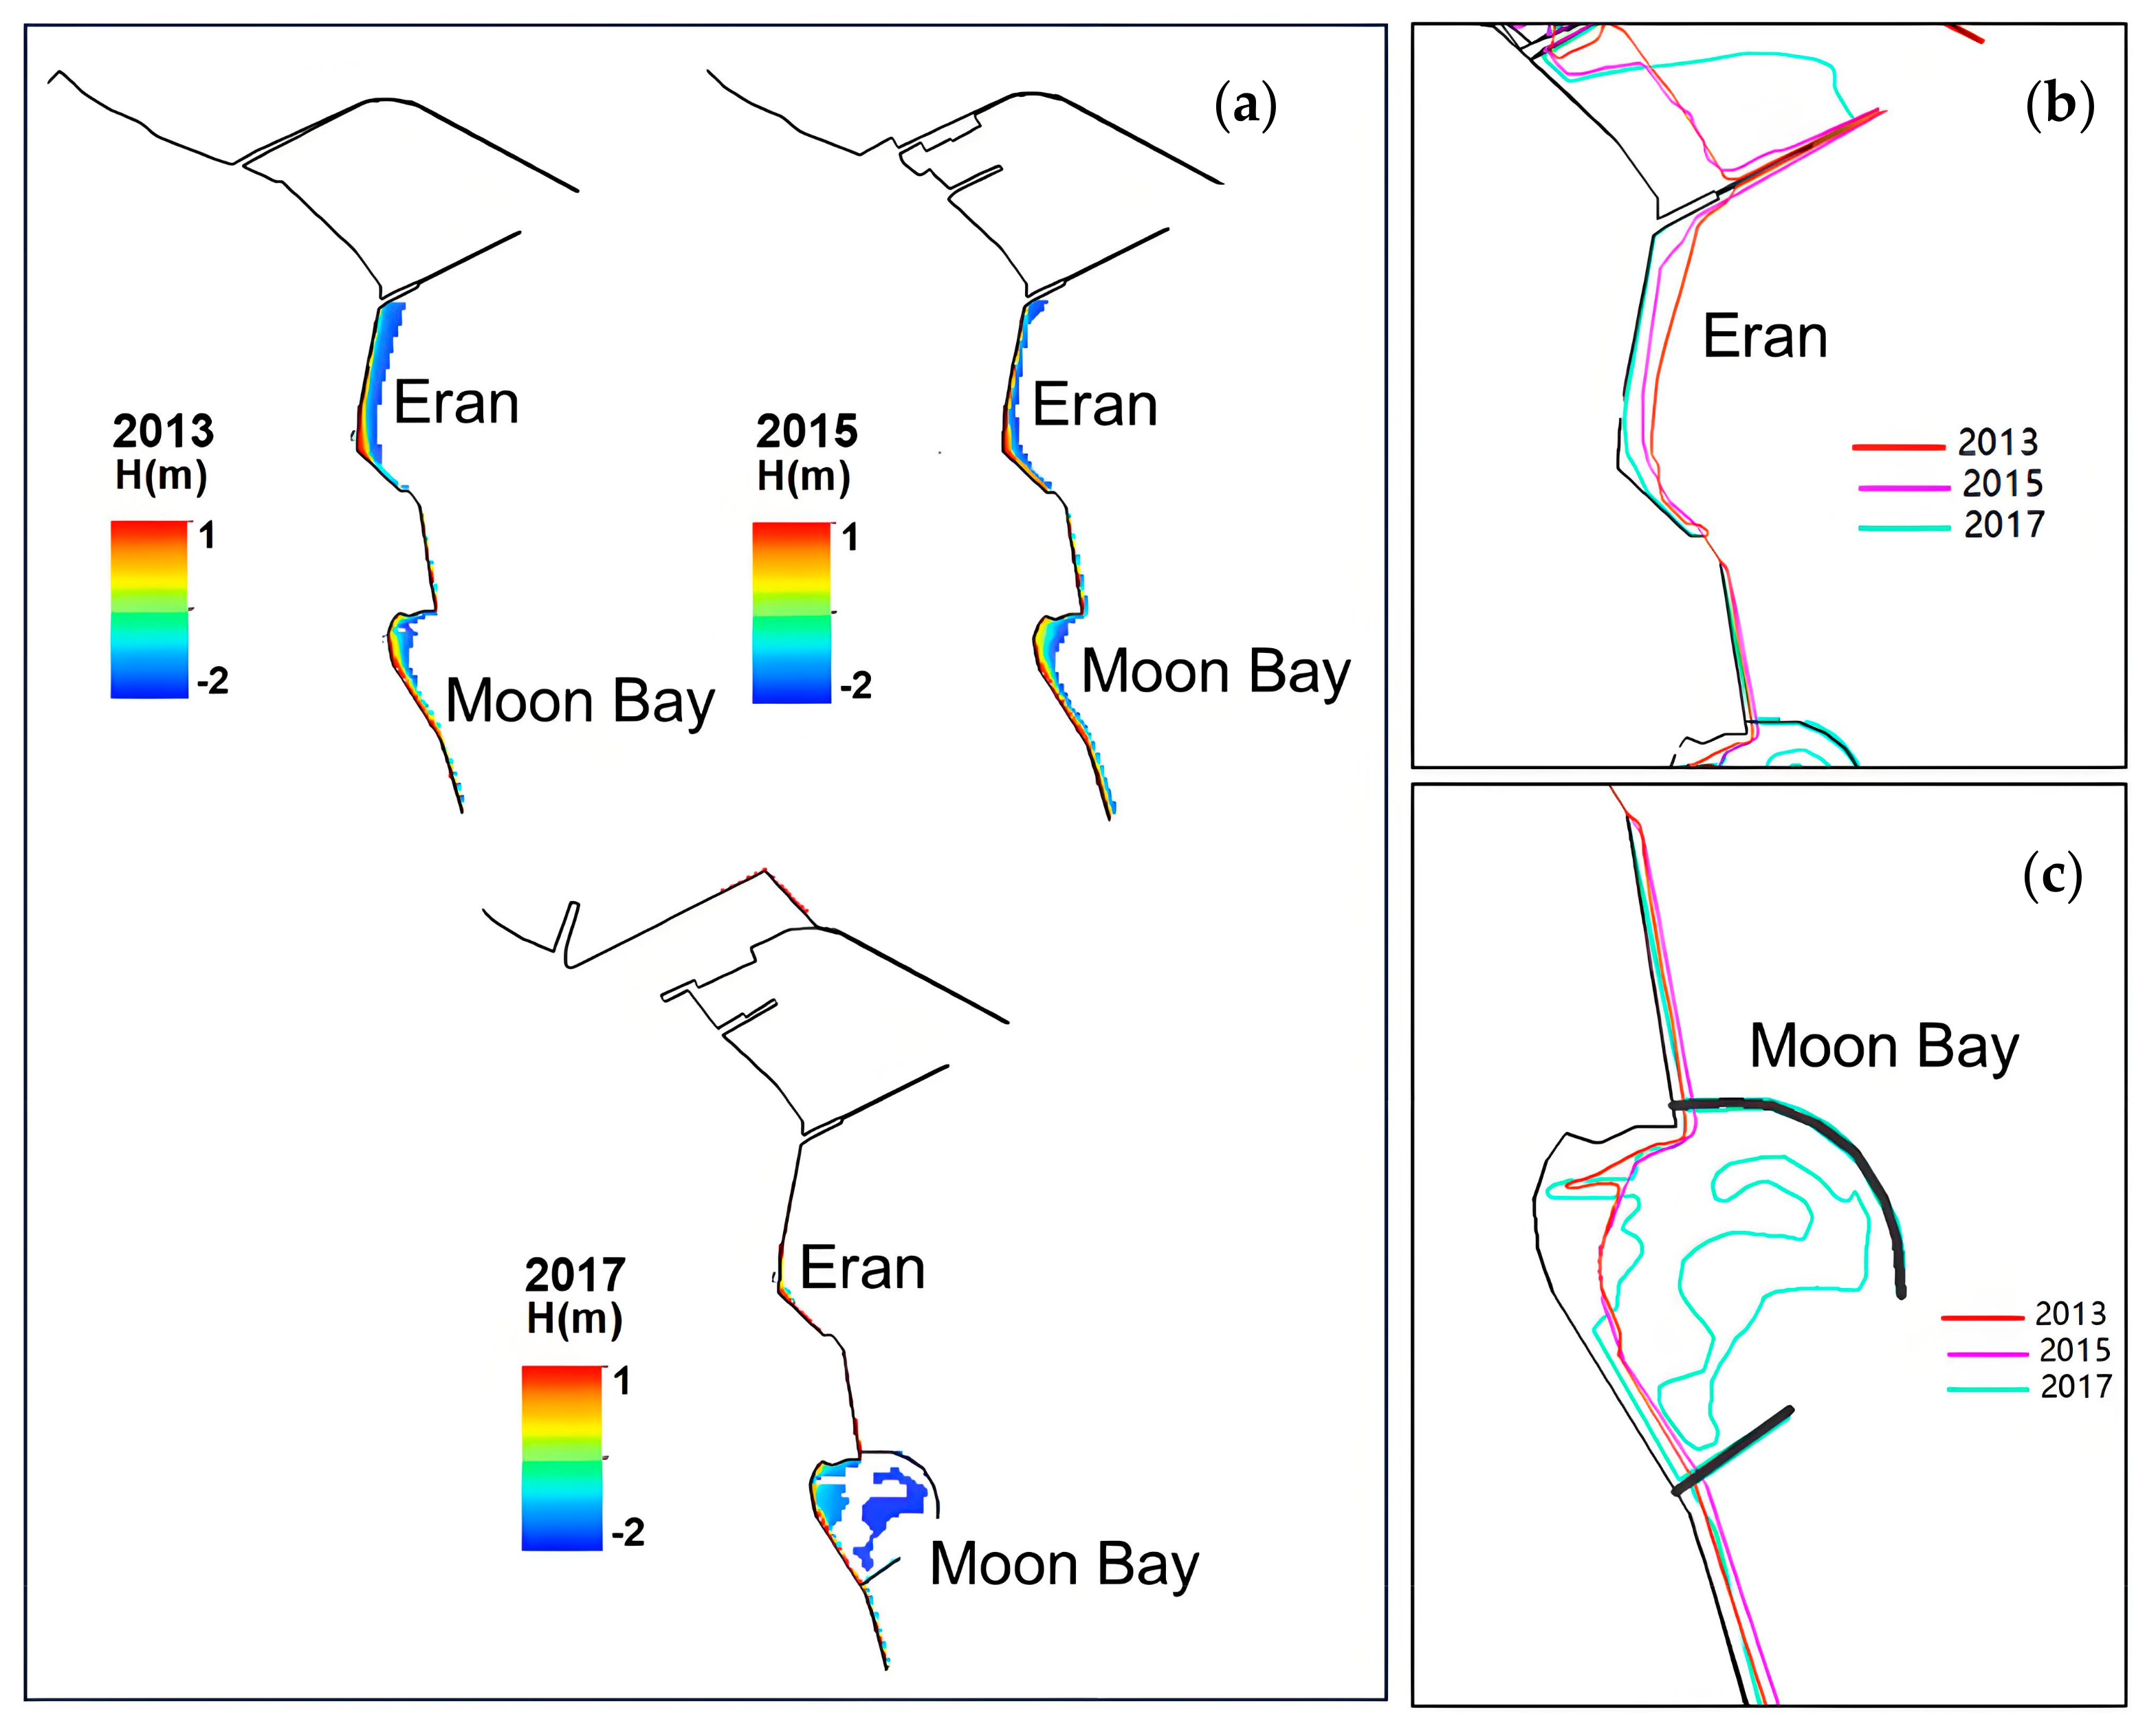
4.2.4. Changes in the South Coast
5. Discussion
5.1. Causes and Future Trends in Tidal Flat Geomorphology
5.2. Limitations for the Geomorphic Evolutionary Analysis of the Tidal Flats
6. Conclusions
Author Contributions
Funding
Data Availability Statement
Acknowledgments
Conflicts of Interest
References
- Murray, N.J.; Phinn, S.R.; DeWitt, M.; Ferrari, R.; Johnston, R.; Lyons, M.B.; Clinton, N.; Thau, D.; Fuller, R.A. The global distribution and trajectory of tidal flats. Nature 2019, 565, 222–225. [Google Scholar] [CrossRef] [PubMed]
- Tognin, D.; D’Alpaos, A.; Marani, M.; Carniello, L. Marsh resilience to sea-level rise reduced by storm-surge barriers in the Venice Lagoon. Nat. Geosci. 2021, 14, 906–911. [Google Scholar] [CrossRef]
- Warrick, J.A.; Buscombe, D.; Vos, K.; Bryan, K.R.; Castelle, B.J.; Cooper, J.A.G.; Harley, M.D.; Jackson, D.W.T.; Ludka, B.C.; Masselink, G.; et al. Coastal shoreline change assessments at global scales. Nat. Commun. 2024, 15, 2316. [Google Scholar] [CrossRef] [PubMed]
- Saha, R.C. Chattogram Port: A dedicated service institution to evolve the country boldly. Marit. Technol. Res. 2023, 5, 258294. [Google Scholar] [CrossRef]
- Taljaard, S.; Slinger, J.H.; Arabi, S.; Weerts, S.P.; Vreugdenhil, H. The natural environment in port development: A ‘green handbrake’ or an equal partner? Ocean. Coast. Manag. 2020, 199, 105390. [Google Scholar] [CrossRef]
- Iwasaki, K.; Nanko, K.; Nakata, Y.; Masaka, K.; Shinohara, Y.; Nitta, K.; Mizunaga, H. Port construction alters dune topography and coastal forest growth: A study on forest decline due to coastal erosion. Ecol. Eng. 2022, 180, 106640. [Google Scholar] [CrossRef]
- Foti, G.; Barbaro, G.; Barillà, G.C.; Mancuso, P. Shoreline Changes Due to the Construction of Ports: Case Study—Calabria (Italy). J. Mar. Sci. Eng. 2023, 11, 2382. [Google Scholar] [CrossRef]
- Rodríguez-Santalla, I.; Roca, M.; Martinez-Clavel, B.; Pablo, M.; Moreno-Blasco, L.; Blázquez, A.M. Coastal changes between the harbours of Castellón and Sagunto (Spain) from the mid-twentieth century to present. Reg. Stud. Mar. Sci. 2021, 46, 101905. [Google Scholar] [CrossRef]
- Qu, K.C.; Chen, K.F.; Wang, N.R.; Zheng, J.H.; Lu, P.D. Geomorphological processes following the construction of an offshore artificial island in the radial sand ridges of the South Yellow Sea. Coast. Eng. 2024, 192, 104545. [Google Scholar] [CrossRef]
- Agarwala, N.; Saengsupavanich, C. Oceanic Environmental Impact in Seaports. Oceans 2023, 4, 360–380. [Google Scholar] [CrossRef]
- Li, L.; Wang, X.H.; Williams, D.; Sidhu, H.; Song, D. Numerical study of the effects of mangrove areas and tidal flats on tides: A case study of Darwin Harbour, Australia. J. Geophys. Res.-Oceans. 2012, 117, C06011. [Google Scholar] [CrossRef]
- Kang, Y.; Lei, J.; Wang, M.J.; Li, G.P.; Ding, X.R. Topographic evolution of tidal flats based on remote sensing: An example in Jiangsu coast, Southern Yellow Sea. Front. Mar. Sci. 2023, 10, 1163302. [Google Scholar] [CrossRef]
- Gong, Z.; Jin, C.; Zhang, C.; Zhou, Z.; Zhang, Q.; Li, H. Temporal and spatial morphological variations along a cross-shore intertidal profile, Jiangsu, China. Cont. Shelf. Res. 2017, 144, 1–9. [Google Scholar] [CrossRef]
- Tseng, K.H.; Kuo, C.Y.; Lin, T.H.; Huang, Z.C.; Lin, Y.C.; Liao, W.H.; Chen, C.F. Reconstruction of time-varying tidal flat topography using optical remote sensing imageries. ISPRS. J. Photogramm. 2017, 131, 92–103. [Google Scholar] [CrossRef]
- Zhang, H.; Wang, L.; Zhao, Y.; Cao, J.; Xu, M. Application of airborne LiDAR measurements to the topographic survey of the tidal flats of the Northern Jiangsu radial sand ridges in the Southern Yellow Sea. Front. Mar. Sci. 2022, 9, 871156. [Google Scholar] [CrossRef]
- Choi, C.; Kim, D. Optimum baseline of a single-pass In-SAR system to generate the best DEM in tidal flats. IEEE J.-Stars 2018, 11, 919–929. [Google Scholar] [CrossRef]
- Xu, N.; Ma, Y.; Yang, J.; Wang, X.; Wang, Y.; Xu, R. Deriving Tidal Flat Topography Using ICESat-2 Laser Altimetry and Sentinel-2 Imagery. Geophys. Res. Lett. 2022, 49, e2021GL096813. [Google Scholar] [CrossRef]
- Li, H.; Gong, Z.; Dai, W.; Lu, C.; Zhang, X.; Cybele, S.; Guo, H. Feasibility of Elevation Mapping in Muddy Tidal Flats by Remotely Sensed Moisture (RSM) Method. J. Coast. Res. 2018, 85, 291–295. [Google Scholar] [CrossRef]
- Mason, D.C.; Davenport, I.J.; Robinson, G.J.; Flather, R.A.; McCartney, B.S. Construction of an inter-tidal digital elevation model by the ‘Water-Line’ Method. Geophys. Res. Lett. 1995, 22, 3187–3190. [Google Scholar] [CrossRef]
- Mason, D.C.; Scott, T.R.; Dance, S.L. Remote sensing of intertidal morphological change in Morecambe Bay, U.K., between 1991 and 2007. Estuar. Coast. Shelf Sci. 2010, 87, 487–496. [Google Scholar] [CrossRef]
- Ryu, J.H.; Kim, C.H.; Lee, Y.K.; Won, J.S.; Chun, S.S.; Lee, S. Detecting the intertidal morphologic change using satellite data. Estuar. Coast. Shelf Sci. 2008, 78, 623–632. [Google Scholar] [CrossRef]
- Kang, Y.; Ding, X.; Xu, F.; Zhang, C.; Ge, X. Topographic mapping on large-scale tidal flats with an iterative approach on the waterline method. Estuar. Coast. Shelf Sci. 2017, 190, 11–22. [Google Scholar] [CrossRef]
- Wang, Y.; Liu, Y.; Jin, S.; Sun, C.; Wei, X. Evolution of the topography of tidal flats and sandbanks along the Jiangsu coast from 1973 to 2016 observed from satellites. ISPRS. J. Photogramm. 2019, 150, 27–43. [Google Scholar] [CrossRef]
- Liu, Y.; Li, M.; Zhou, M.; Yang, K.; Mao, L. Quantitative Analysis of the Waterline Method for Topographical Mapping of Tidal Flats: A Case Study in the Dongsha Sandbank, China. Remote Sens. 2013, 5, 6138–6158. [Google Scholar] [CrossRef]
- Choi, J.K.; Ryu, J.H.; Lee, Y.K.; Yoo, H.R.; Han, J.W.; Chang, H.K. Quantitative estimation of intertidal sediment characteristics using remote sensing and GIS. Estuar. Coast. Shelf Sci. 2010, 88, 125–134. [Google Scholar] [CrossRef]
- Tong, S.S.; Deroin, J.P.; Pham, T.L. An optimal waterline approach for studying tidal flat morphological changes using remote sensing data: A case of the northern coast of Vietnam. Estuar. Coast. Shelf Sci. 2020, 236, 106613. [Google Scholar] [CrossRef]
- Yang, X.; Zhu, Z.; Qiu, S.; Kroeger, K.D.; Zhu, Z.; Covington, S. Detection and characterization of coastal tidal wetland change in the northeastern US using Landsat time series. Remote Sens. Environ. 2022, 276, 113047. [Google Scholar] [CrossRef]
- Henrico, I.; Bezuidenhout, J. Determining the change in the bathymetry of Saldanha Bay due to the harbour construction in the seventies. S. Afr. J. Geomat. 2020, 9, 236–249. [Google Scholar] [CrossRef]
- Sun, Z.; Niu, X. Variation Tendency of Coastline under Natural and Anthropogenic Disturbance around the Abandoned Yellow River Delta in 1984–2019. Remote Sens. 2021, 13, 3391. [Google Scholar] [CrossRef]
- Wang, Y.; Aubrey, D.G. The characteristics of the China coastline. Cont. Shelf Res. 1987, 7, 329–349. [Google Scholar] [CrossRef]
- Tao, J.; Wang, Z.B.; Zhou, Z.; Xu, F.; Stive, M.J.F. A Morphodynamic Modeling Study on the Formation of the Large-cale Radial Sand Ridges in the Southern Yellow Sea. J. Geophys. Res.-Earth 2019, 124, 1742–1761. [Google Scholar] [CrossRef]
- Zhang, L.; Chen, S.; Yi, L. The sediment source and transport trends around the abandoned Yellow River delta, China. Mar. Georesour. Geotechnol. 2016, 34, 440–449. [Google Scholar] [CrossRef]
- Su, M.; Yao, P.; Wang, Z.B.; Zhang, C.K.; Stive, M.J. Exploratory morphodynamic modeling of the evolution of the Jiangsu coast, China, since 1855: Contributions of old Yellow River-derived sediment. Mar. Geol. 2016, 390, 306–320. [Google Scholar] [CrossRef]
- Li, Y.; Zhao, Y.; Xu, W.; Liu, N.; Xu, M. Quantitative provenance study of sediments in the coastal tidal flats of central Jiangsu based on grain-size End-Member analysis. Front. Mar. Sci. 2023, 10, 1322899. [Google Scholar] [CrossRef]
- Qin, W.R. Study on the Extraction of the Water Bodies from Remote Sensing Image Using ENVI Software—Applied to the River Environmental Protection in Qinzhou. In Applied Mechanics and Materials; Trans Tech Publications, Ltd.: Stafa-Zurich, Switzerland, 2013; Volume 416–417, pp. 1200–1204. [Google Scholar] [CrossRef]
- Hutchinson, M.F.; Xu, T.; Stein, J.A. Recent progress in the ANUDEM elevation gridding procedure. Geomorphometry 2011, 19–22. [Google Scholar]
- Djumali, Z.; Melin, M.; Maricar, F.; Gaffar, F. Pemodelan Potensi Erosi dan Sedimentasi di sub das Lekopancing Kab: Maros dengan Aplikasi Arcgis 10.5. Kohesi J. Sains Dan Teknol. 2023, 1, 100–110. [Google Scholar]
- Zhang, R.S.; Lu, L.Y.; Wang, Y.H. The mechanism and trend of coastal erosion of Jiangsu Province in China. Geogr. Res. 2002, 21, 469–478, (in Chinese with an English abstract). [Google Scholar]
- Kang, Y.; He, J.; Wang, B.; Lei, J.; Wang, Z.; Ding, X. Geomorphic Evolution of Radial Sand Ridges in the South Yellow Sea Observed from Satellites. Remote Sens. 2022, 14, 287. [Google Scholar] [CrossRef]
- Shen, F.; Zhou, Y.; Li, J.; He, Q.; Verhoef, W. Remotely sensed variability of the suspended sediment concentration and its response to decreased river discharge in the Yangtze estuary and adjacent coast. Cont. Shelf Res. 2013, 69, 52–61. [Google Scholar] [CrossRef]
- Zhang, D.S.; Zhang, J.L.; Zhang, C.K.; Wang, Z. Tidal currents develop-storm surges destroy tidal currents restore–A preliminary explanation for the dynamic mechanism of formation and evolution of radiate sand ridges in Yellow Sea. Sci. China Ser. D Earth Sci. 1998, 28, 394–402, (in Chinese with an English abstract). [Google Scholar]
- Kuai, Y.; Aarninkhof, S.; Wang, Z.B. Diagnostic modeling of the shoreline variation along the Jiangsu Coast, China. Geomorphology 2023, 425, 108581. [Google Scholar] [CrossRef]
- Xing, F.; Wang, Y.P.; Wang, H.V. Tidal hydrodynamics and fine-grained sediment transport on the radial sand ridge system in the southern Yellow Sea. Mar. Geol. 2012, 291, 192–210. [Google Scholar] [CrossRef]
- Chen, K.; Zheng, J.; Zhang, C.; Wang, N.; Zhou, C. The evolution characteristics of main waterways and their control mechanism in the radial sand ridges of the southern Yellow Sea. Acta Oceanol. Sin. 2017, 36, 91–98. [Google Scholar] [CrossRef]
- Xu, F.; Tao, J.; Zhou, Z.; Coco, G.; Zhang, C. Mechanisms underlying the regional morphological differences between the northern and southern radial sand ridges along the Jiangsu Coast, China. Mar. Geol. 2016, 371, 1–17. [Google Scholar] [CrossRef]
- Zhu, S.; Gao, S.; Li, M.; Wang, Y.P. Evolution modeling and protection scheme for tidal flats under natural change and human pressure, central Jiangsu coast. Earth’s Future 2024, 12, e2023EF003913. [Google Scholar] [CrossRef]
- Gao, S. Geomorphology and sedimentology of tidal flats. In Coastal Wetlands; Elsevier: Amsterdam, The Netherlands, 2019; pp. 359–381. [Google Scholar] [CrossRef]
- Zhou, L.; Liu, J.; Saito, Y.; Zhang, Z.; Chu, H.; Hu, G. Coastal erosion as a major sediment supplier to continental shelves: EXAMPLE from the abandoned Old Huanghe (Yellow River) delta. Cont. Shelf Res. 2014, 82, 43–59. [Google Scholar] [CrossRef]
- Saengsupavanich, C.; Yun, L.S.; Lee, L.H.; Sanitwong-Na-Ayutthaya, S. Intertidal intercepted sediment at jetties along the Gulf of Thailand. Front. Mar. Sci. 2022, 9, 970592. [Google Scholar] [CrossRef]
- Zhang, C.K.; Yang, Y.Z.; Tao, J.F. Suspended sediment fluxes in the radial sand ridge field of South Yellow Sea. J. Coast. Res. 2013, 65, 624–629. [Google Scholar] [CrossRef]
- Salameh, E.; Frappart, F.; Desroches, D.; Turki, I.; Carbonne, D.; Laignel, B. Monitoring intertidal topography using the future SWOT (Surface Water and Ocean Topography) mission. Remote Sens. Appl. Soc. Environ. 2021, 23, 100578. [Google Scholar] [CrossRef]
- Chen, C.; Tian, B.; Wu, W.; Duan, Y.; Zhou, Y.; Zhang, C. UAV Photogrammetry in Intertidal Mudflats: Accuracy, Efficiency, and Potential for Integration with Satellite Imagery. Remote Sens. 2023, 15, 1814. [Google Scholar] [CrossRef]
- Pinton, D.; Canestrelli, A.; Wilkinson, B.; Ifju, P.; Ortega, A. Estimating Ground Elevation and Vegetation Characteristics in Coastal Salt Marshes Using UAV-Based LiDAR and Digital Aerial Photogrammetry. Remote Sens. 2021, 13, 4506. [Google Scholar] [CrossRef]


| Year | Satellites | Date | Time | Tide Level/m (Tide Station) |
|---|---|---|---|---|
| 2017 | Landsat8 | 2017/11/26 | 10:36 | 1.11 |
| CB | 2017/04/28 | 10:53 | −0.02 | |
| GF-1 | 2017/04/12 | 11:15 | −0.59 | |
| Landsat8 | 2017/02/11 | 10:36 | −1.29 | |
| CB | 2018/01/13 | 10:47 | −1.64 | |
| Landsat8 | 2018/01/29 | 10:36 | −1.91 | |
| 2015 | Landsat8 | 2015/03/26 | 10:36 | 1.15 |
| Landsat8 | 2015/03/10 | 10:36 | 0.16 | |
| Landsat8 | 2015/10/12 | 10:36 | −0.77 | |
| Landsat8 | 2015/06/14 | 10:35 | −1.2 | |
| Landsat8 | 2015/05/13 | 10:35 | −1.65 | |
| GF-1 | 2015/01/17 | 11:02 | −2.07 | |
| 2013 | Landsat8 | 2013/11/07 | 10:32 | 1.13 |
| Landsat8 | 2013/07/10 | 10:38 | 0.31 | |
| GF-1 | 2013/09/03 | 11:15 | −0.51 | |
| Landsat8 | 2013/05/23 | 10:38 | −1.02 | |
| Landsat8 | 2013/12/01 | 10:38 | −1.48 | |
| HJ-1 | 2013/04/07 | 10:21 | −2.00 |
| Year | Total Above −2 m | −2 m~−1 m | −1 m~0 m | Total Above 0 m |
|---|---|---|---|---|
| 2013 | 1.72 | 1.03 | 0.54 | 0.15 |
| 2015 | 1.69 | 1.31 | 0.31 | 0.07 |
| 2017 | 2.55 | 1.70 | 0.64 | 0.21 |
Disclaimer/Publisher’s Note: The statements, opinions and data contained in all publications are solely those of the individual author(s) and contributor(s) and not of MDPI and/or the editor(s). MDPI and/or the editor(s) disclaim responsibility for any injury to people or property resulting from any ideas, methods, instructions or products referred to in the content. |
© 2024 by the authors. Licensee MDPI, Basel, Switzerland. This article is an open access article distributed under the terms and conditions of the Creative Commons Attribution (CC BY) license (https://creativecommons.org/licenses/by/4.0/).
Share and Cite
Chen, B.; Chen, Z.; Song, C.; Pang, X.; Liu, P.; Kang, Y. Quantitative Assessment of the Impact of Port Construction on the Surrounding Mudflat Topography Based on Remote Sensing—A Case Study of Binhai Port in Jiangsu Province. J. Mar. Sci. Eng. 2024, 12, 2290. https://doi.org/10.3390/jmse12122290
Chen B, Chen Z, Song C, Pang X, Liu P, Kang Y. Quantitative Assessment of the Impact of Port Construction on the Surrounding Mudflat Topography Based on Remote Sensing—A Case Study of Binhai Port in Jiangsu Province. Journal of Marine Science and Engineering. 2024; 12(12):2290. https://doi.org/10.3390/jmse12122290
Chicago/Turabian StyleChen, Binbin, Zhengdong Chen, Chuping Song, Xiaodong Pang, Peixun Liu, and Yanyan Kang. 2024. "Quantitative Assessment of the Impact of Port Construction on the Surrounding Mudflat Topography Based on Remote Sensing—A Case Study of Binhai Port in Jiangsu Province" Journal of Marine Science and Engineering 12, no. 12: 2290. https://doi.org/10.3390/jmse12122290
APA StyleChen, B., Chen, Z., Song, C., Pang, X., Liu, P., & Kang, Y. (2024). Quantitative Assessment of the Impact of Port Construction on the Surrounding Mudflat Topography Based on Remote Sensing—A Case Study of Binhai Port in Jiangsu Province. Journal of Marine Science and Engineering, 12(12), 2290. https://doi.org/10.3390/jmse12122290