
A Novel 10 MW Floating Wind Turbine Platform—SparFloat: Conceptual Design and Dynamic Response Analysis


Abstract
1. Introduction
2. Solution Method and Verification
2.1. Aerodynamic Load
2.2. Hydrodynamic Load
2.3. Mooring Load
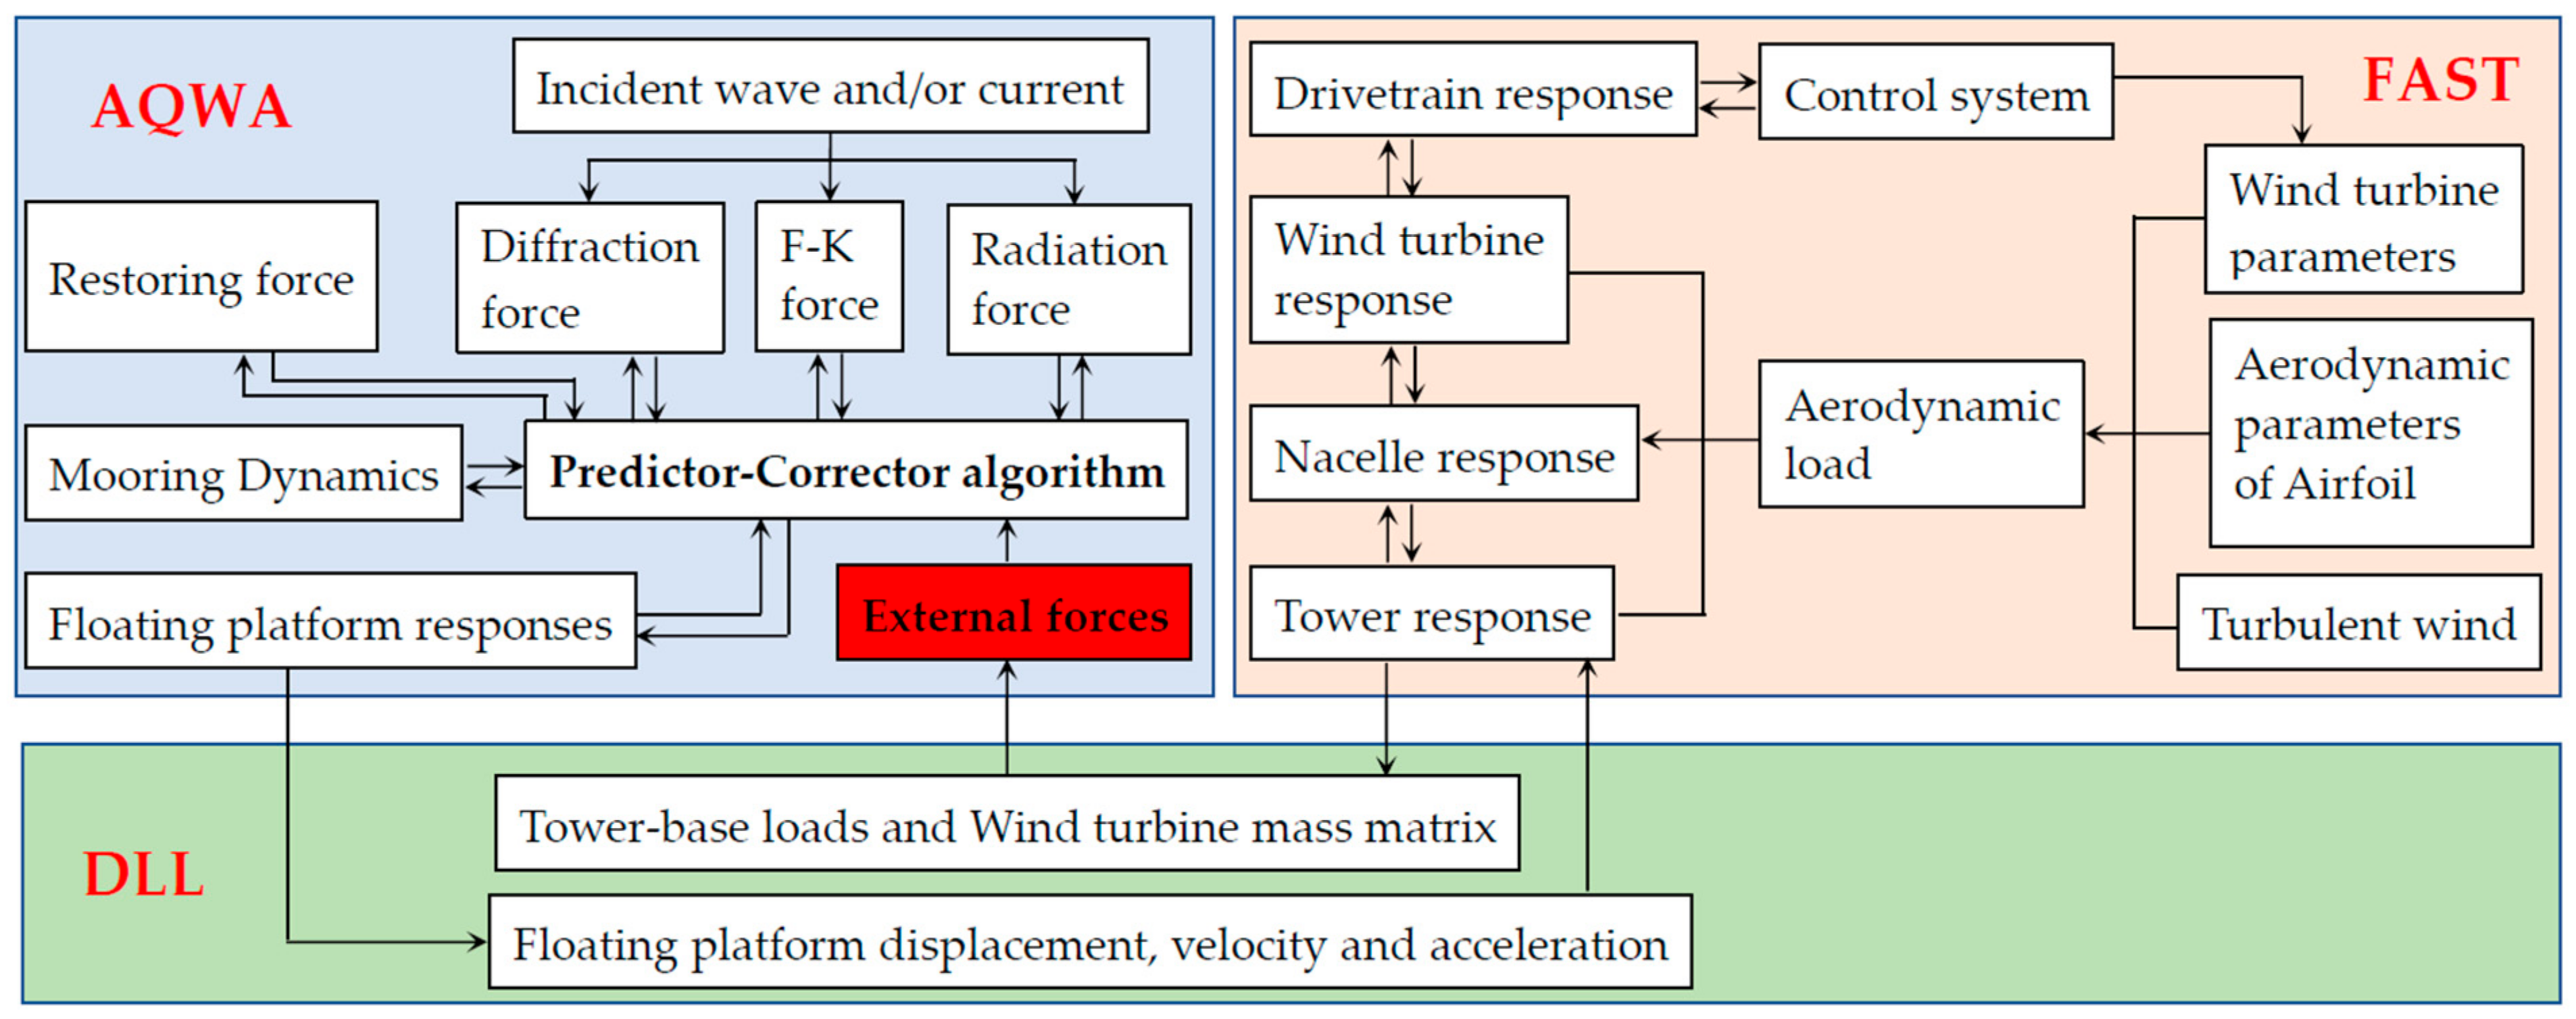
2.4. Coupling Framework F2A
2.5. Verification of F2A
3. Design Considerations
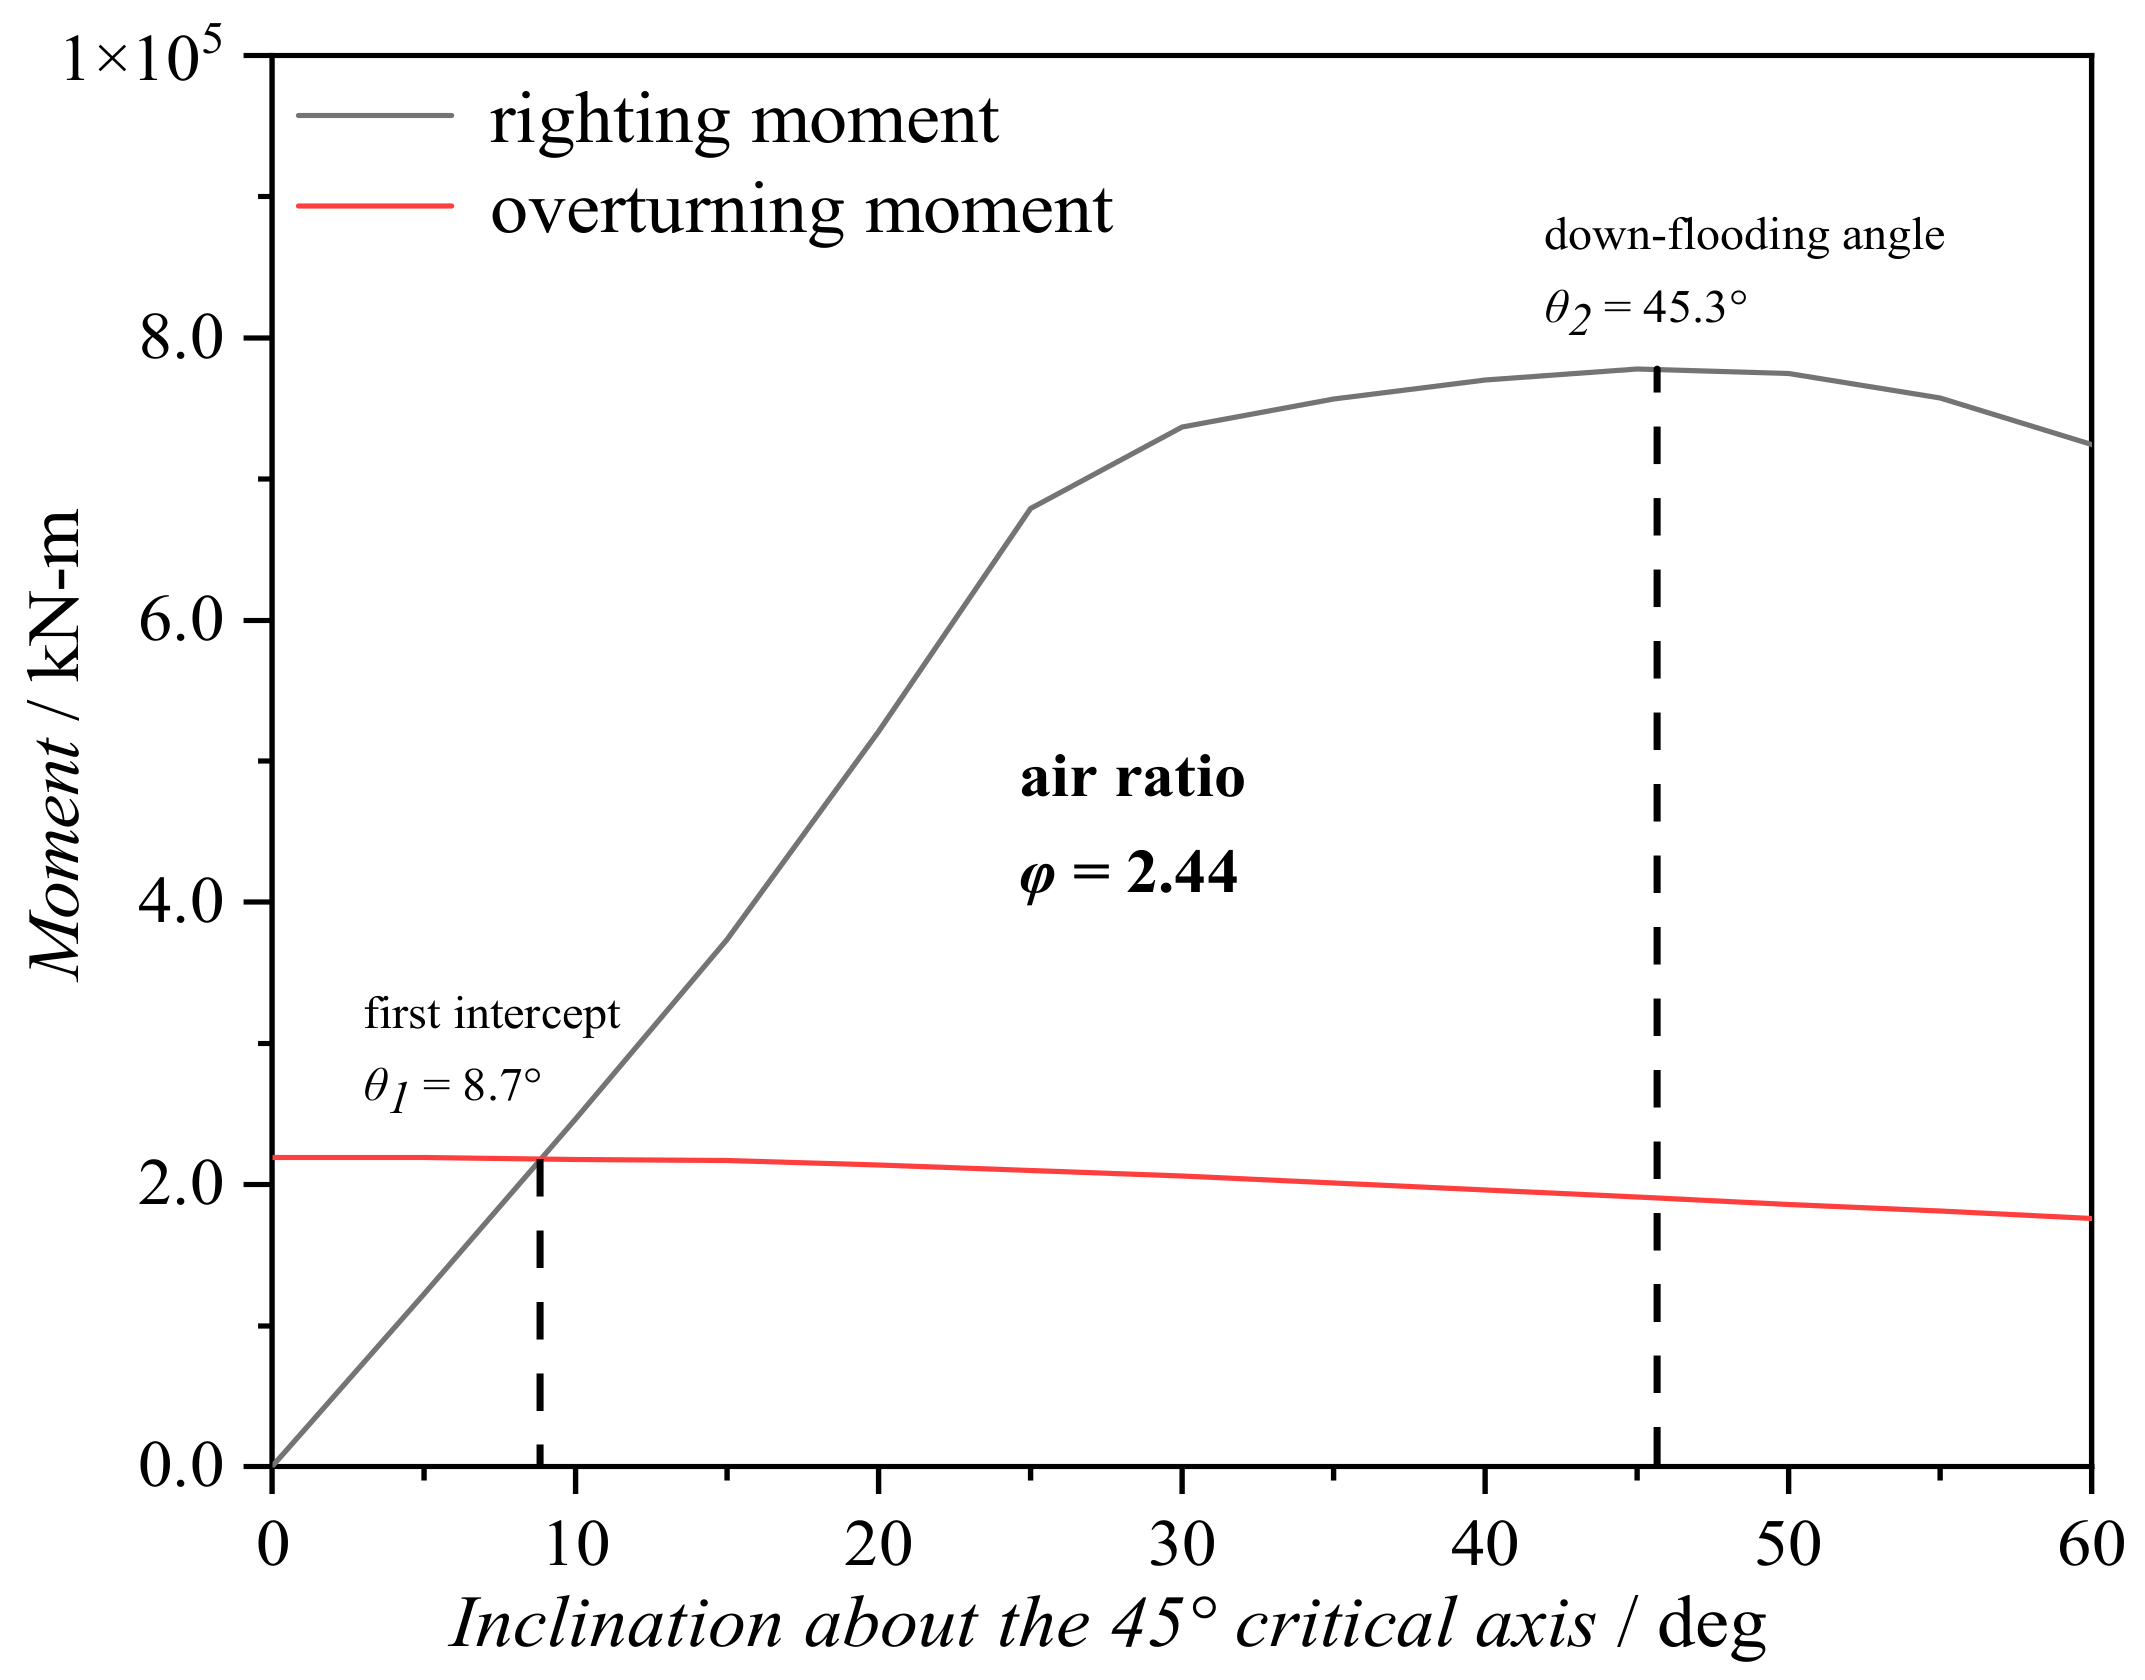
3.1. Intact Stability Verification Method
3.2. Viscous Drag Correction
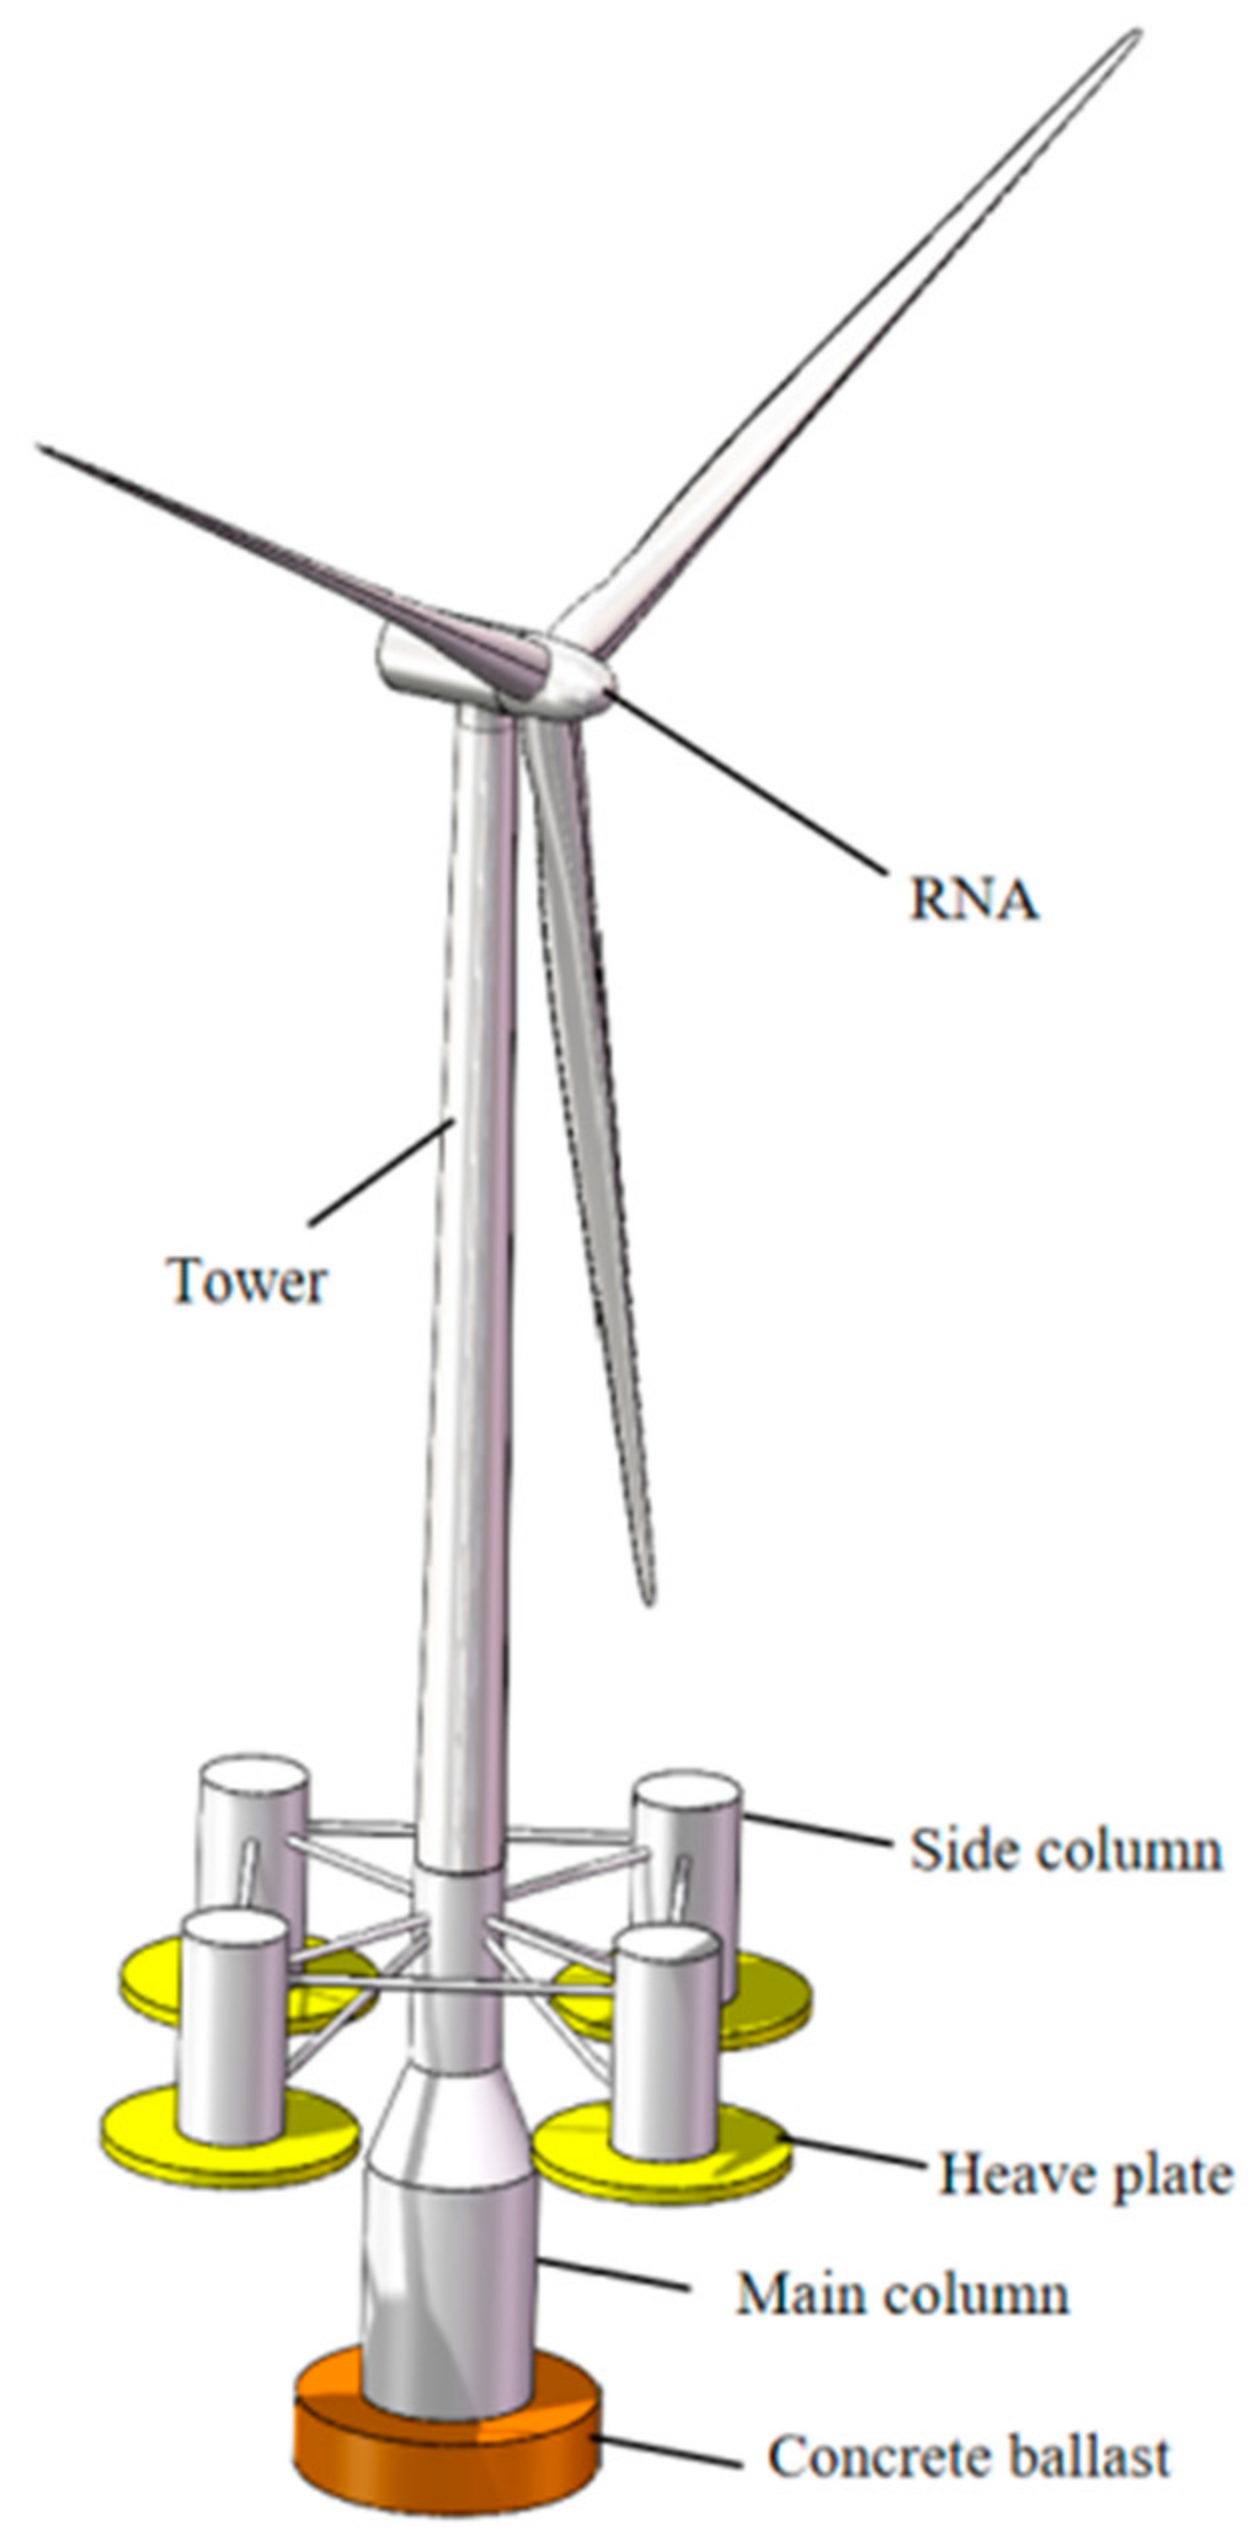
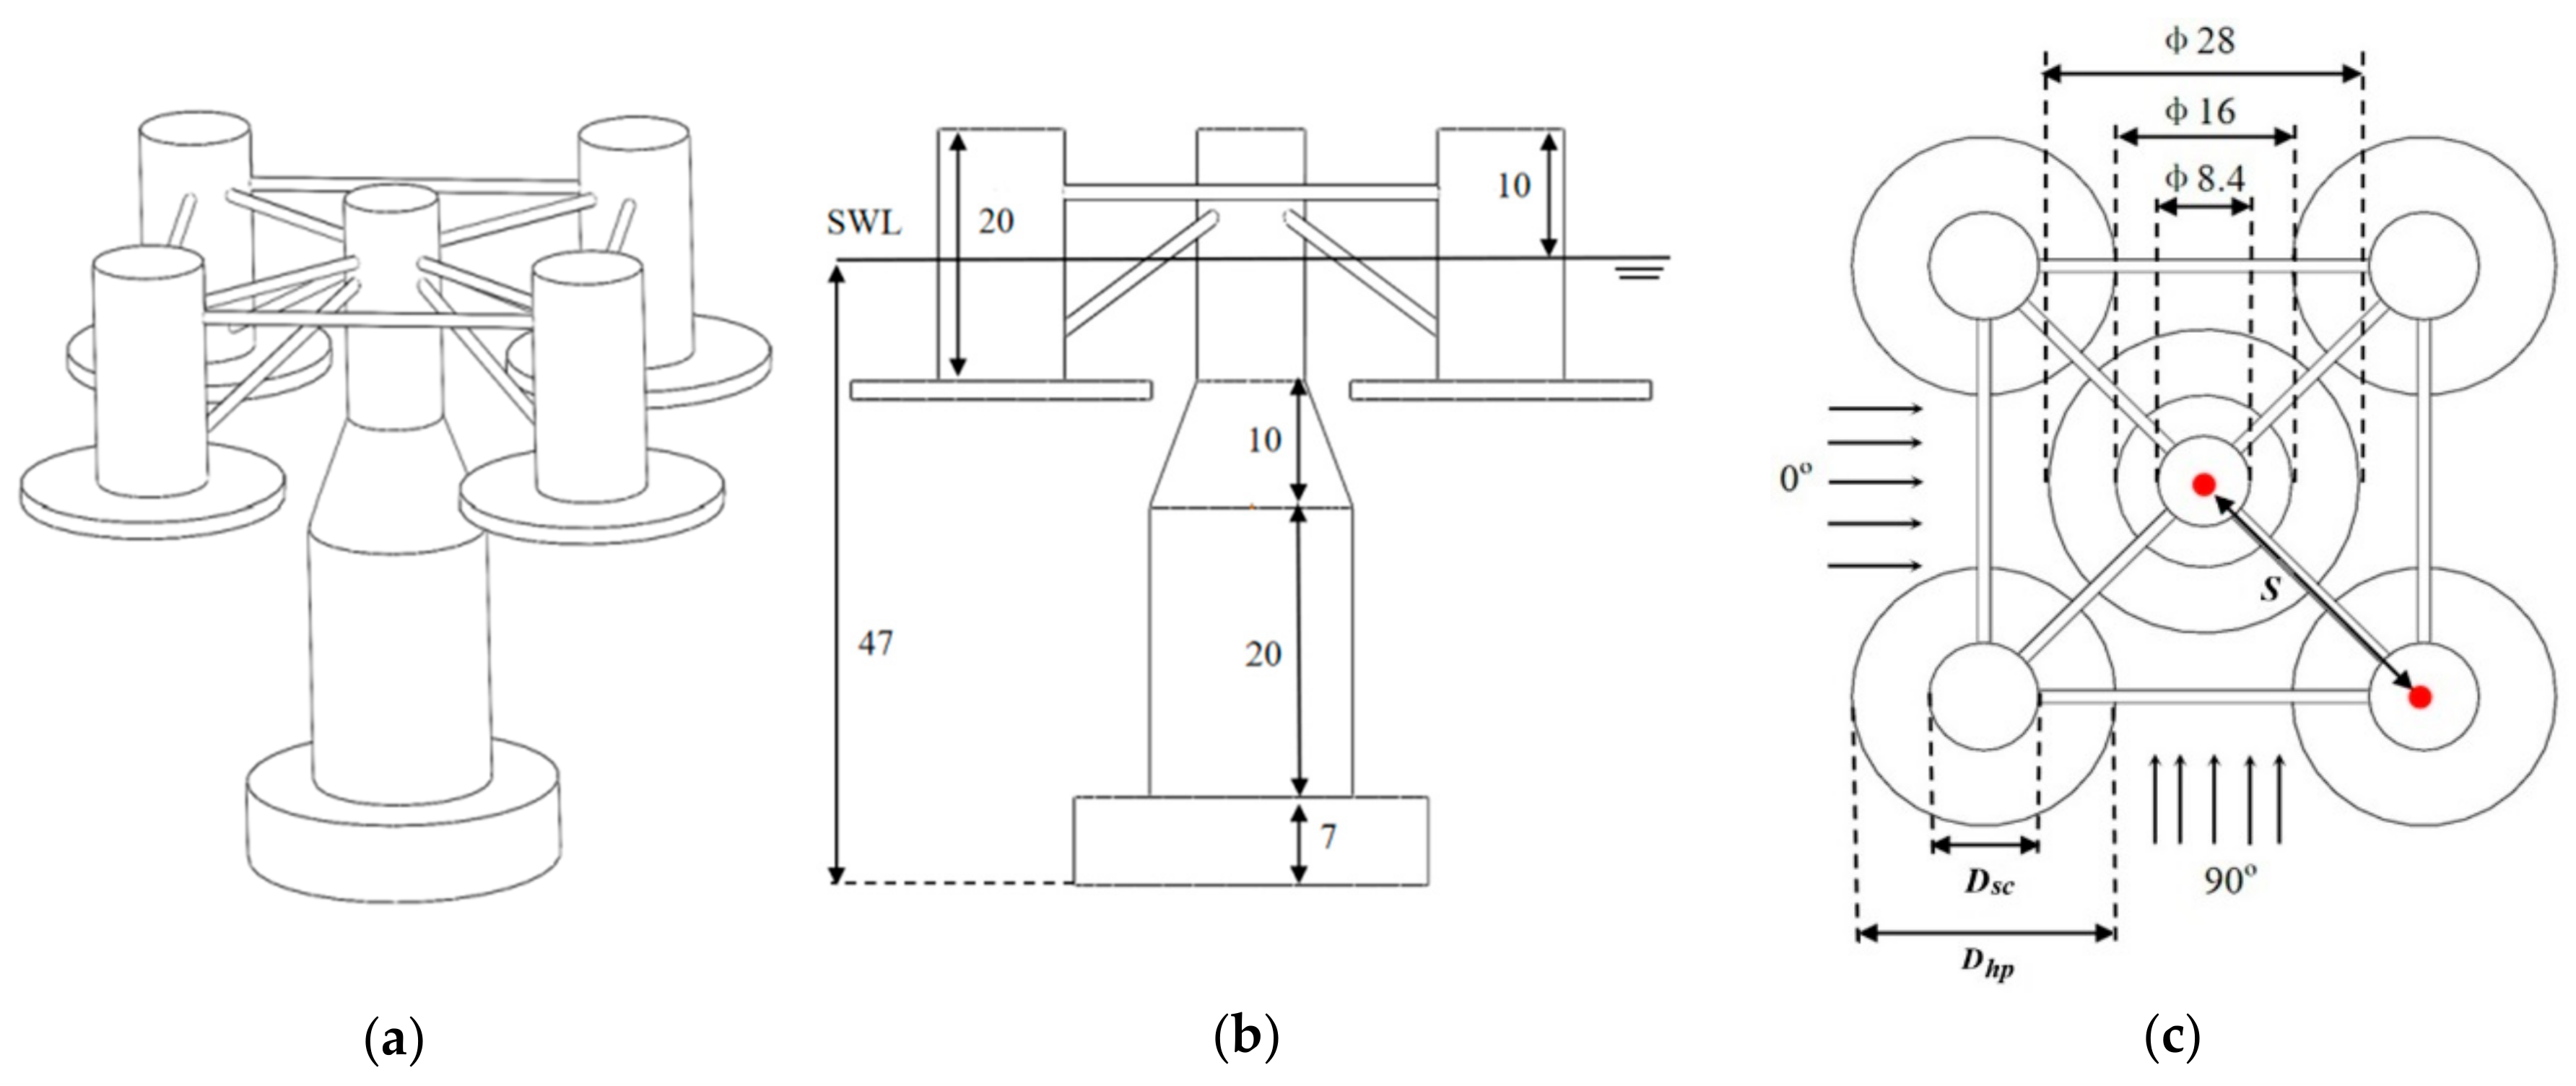
3.3. Conceptual Design of SparFloat Model
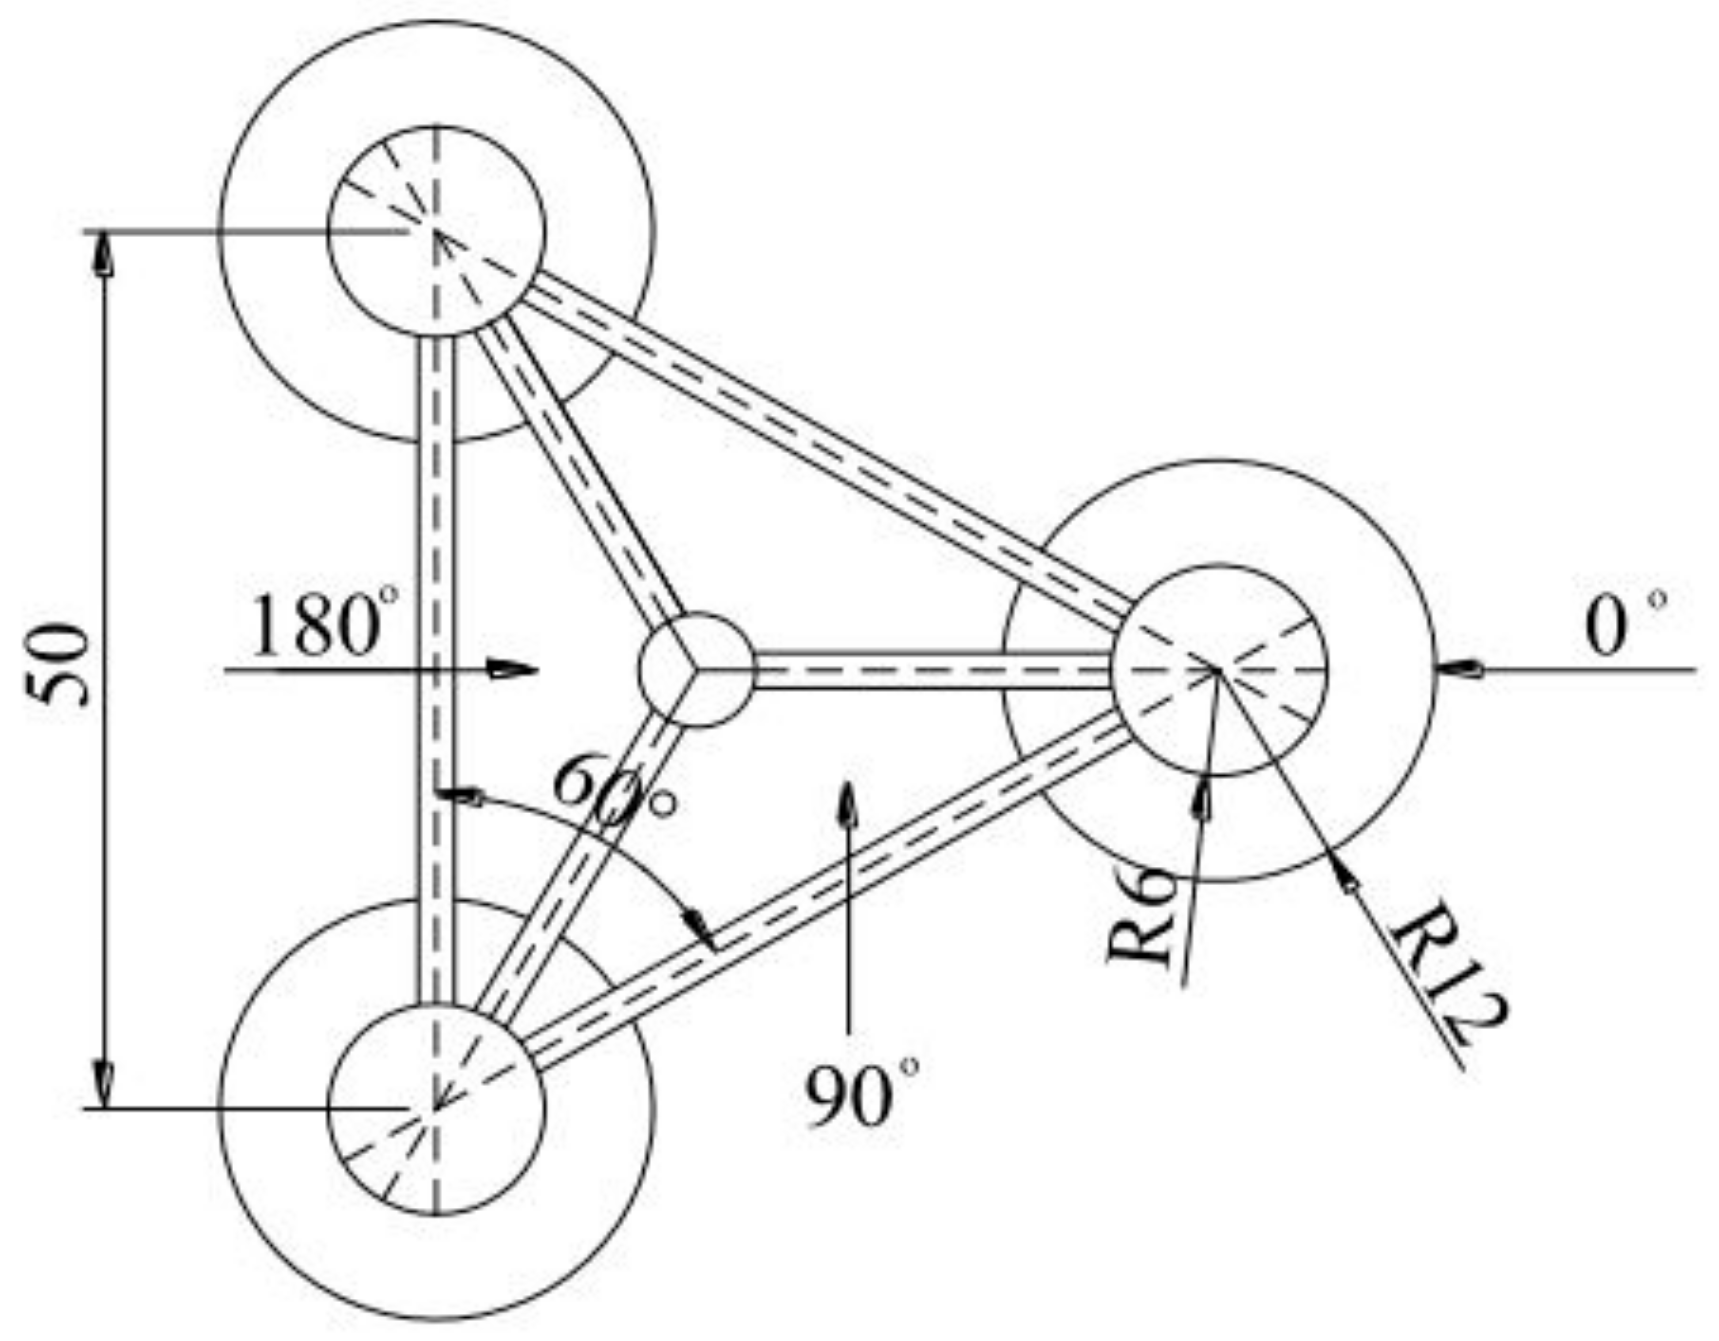
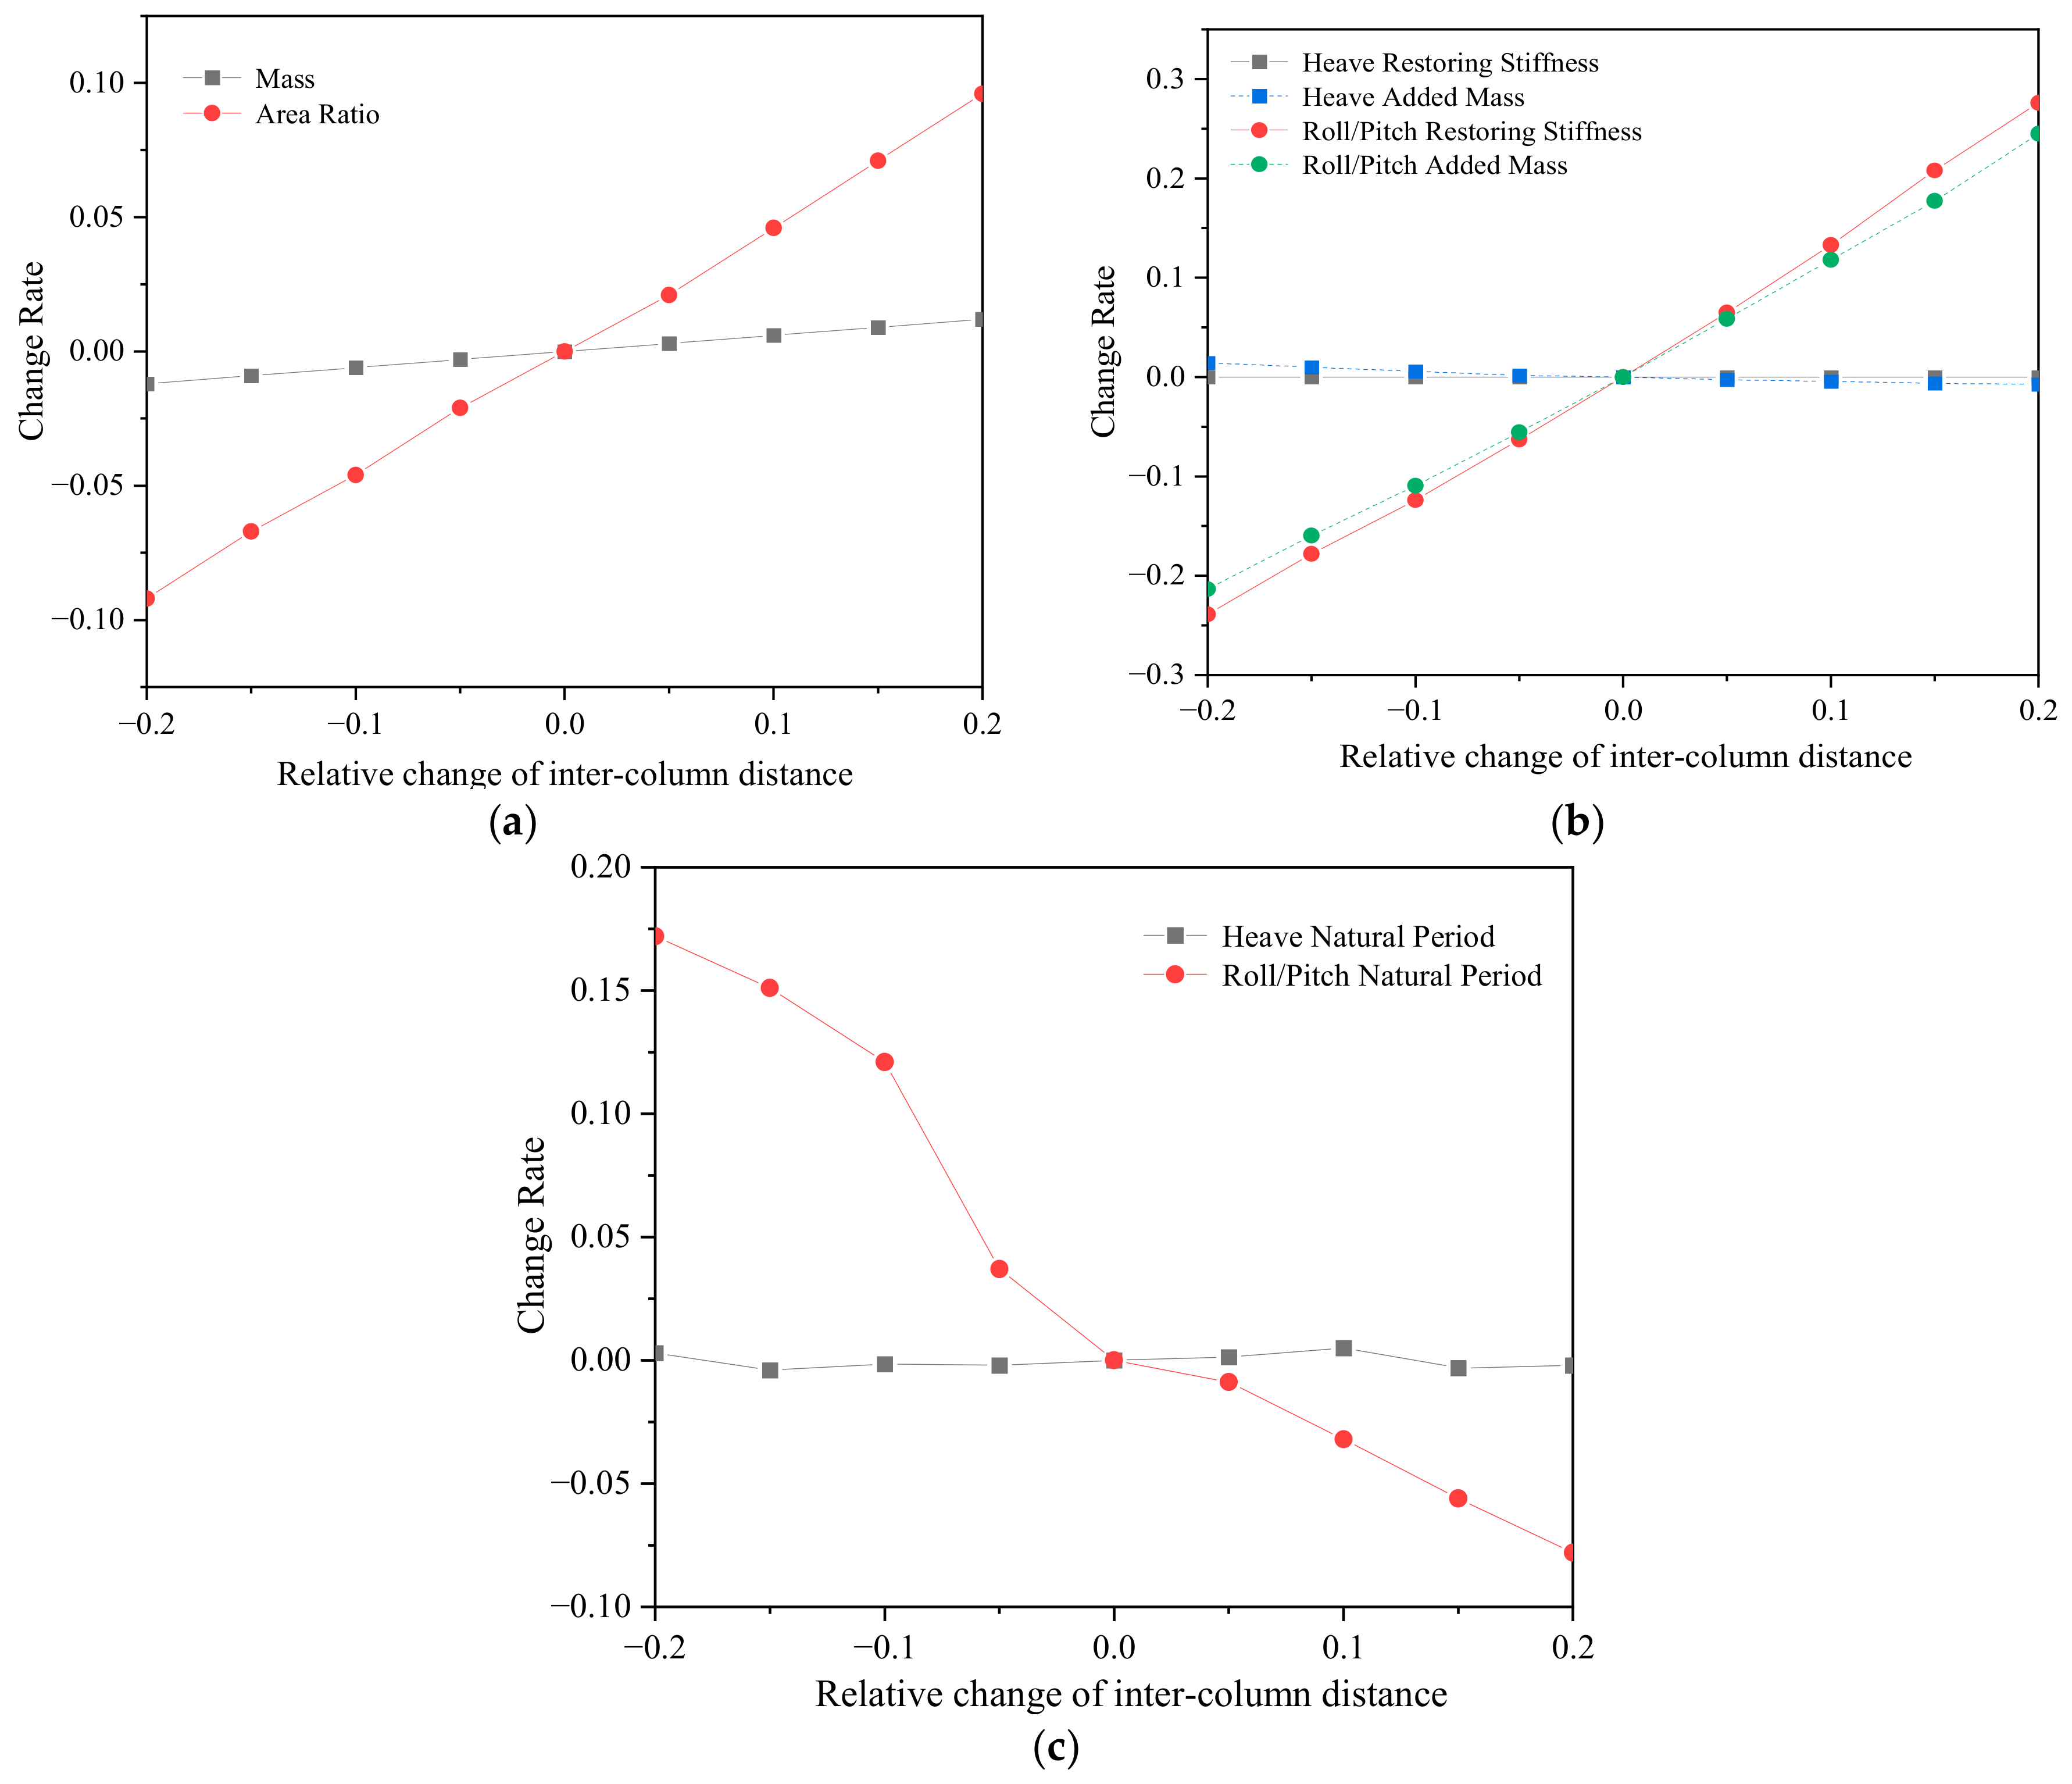
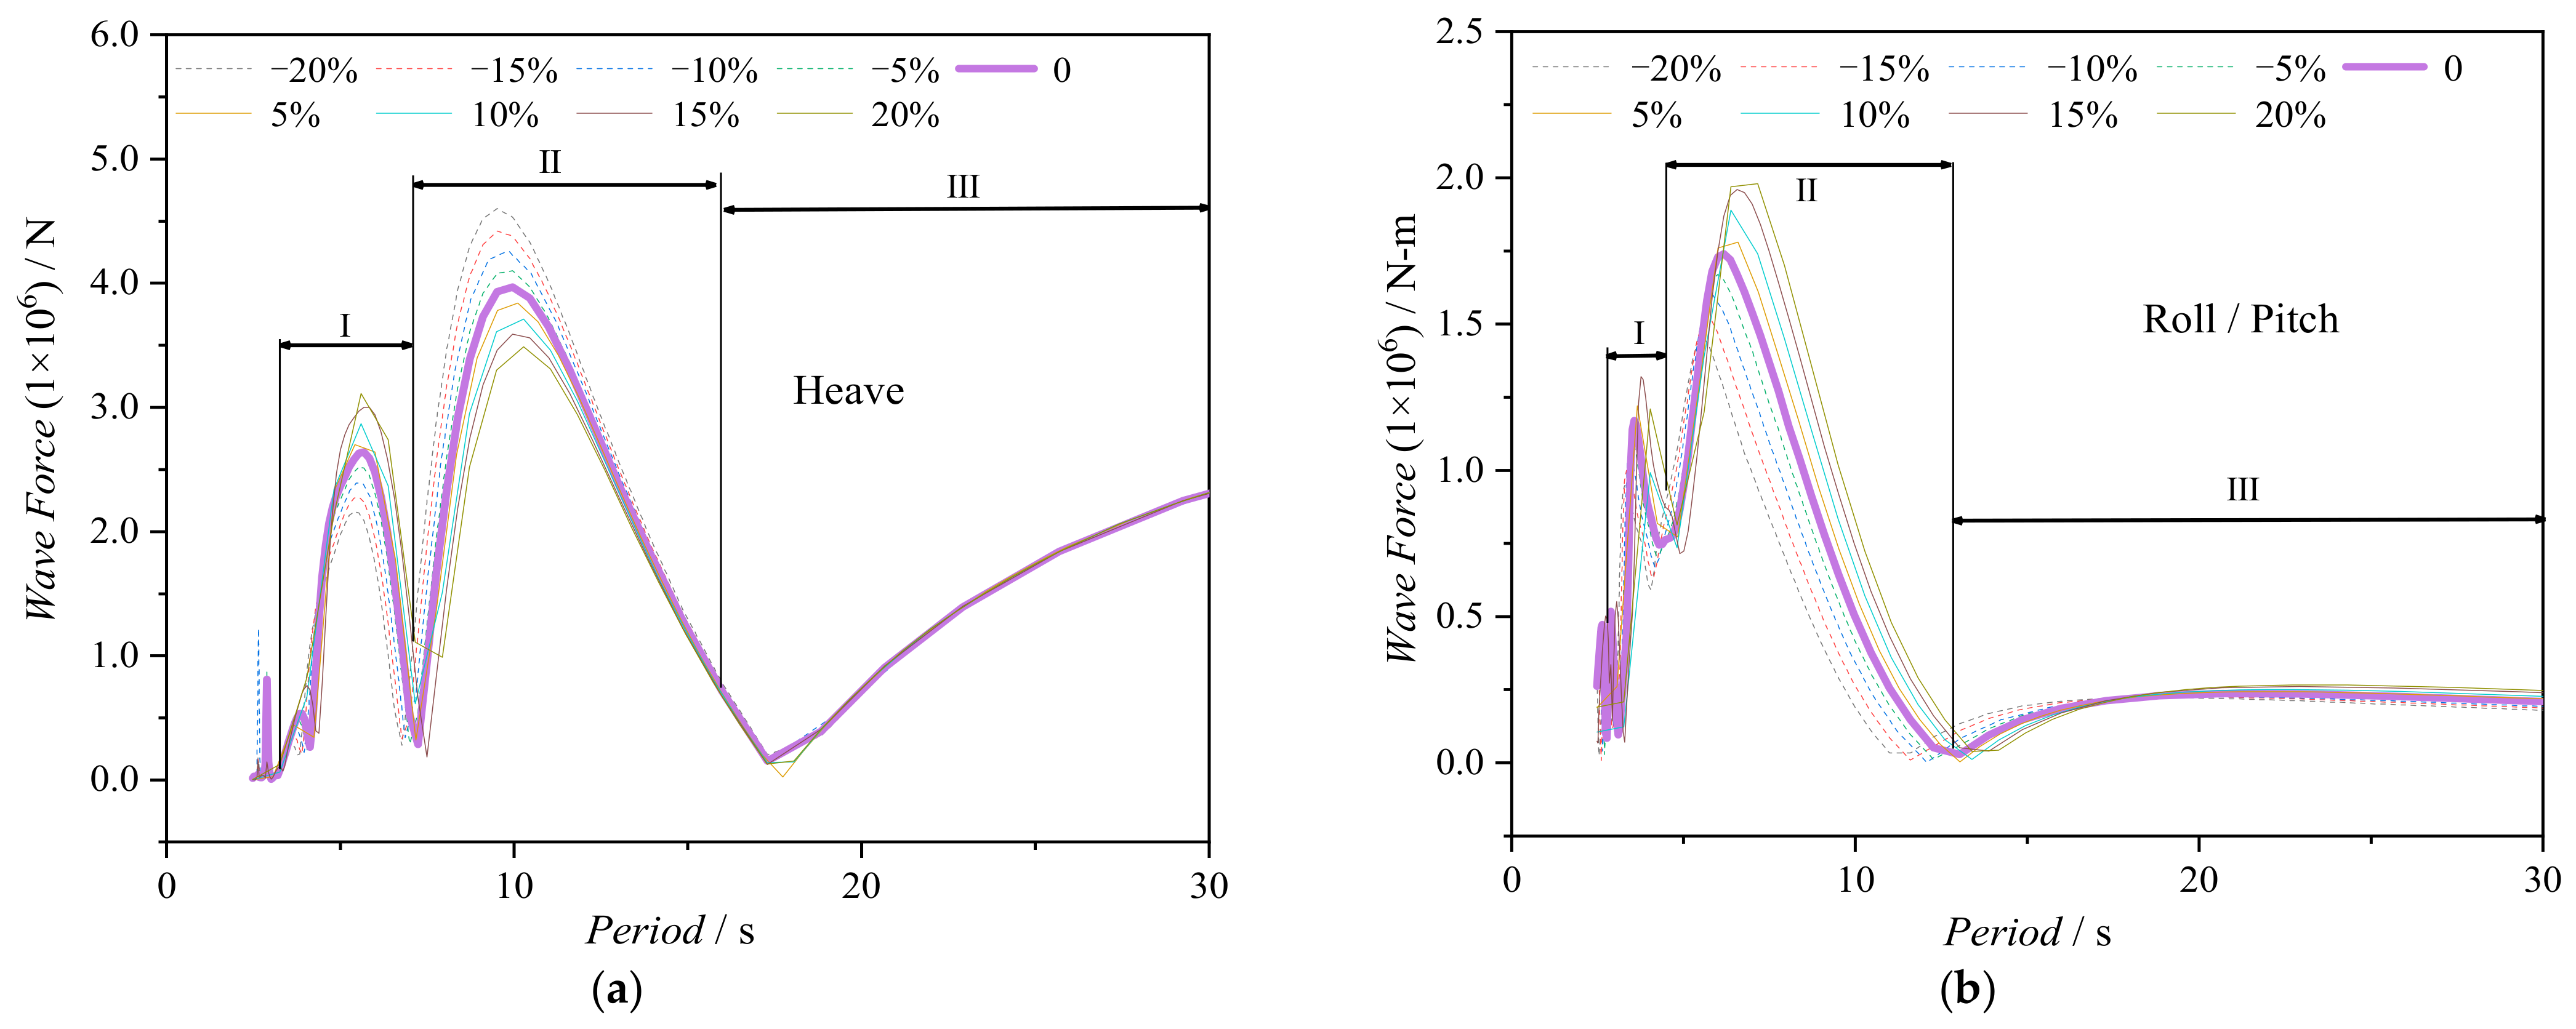
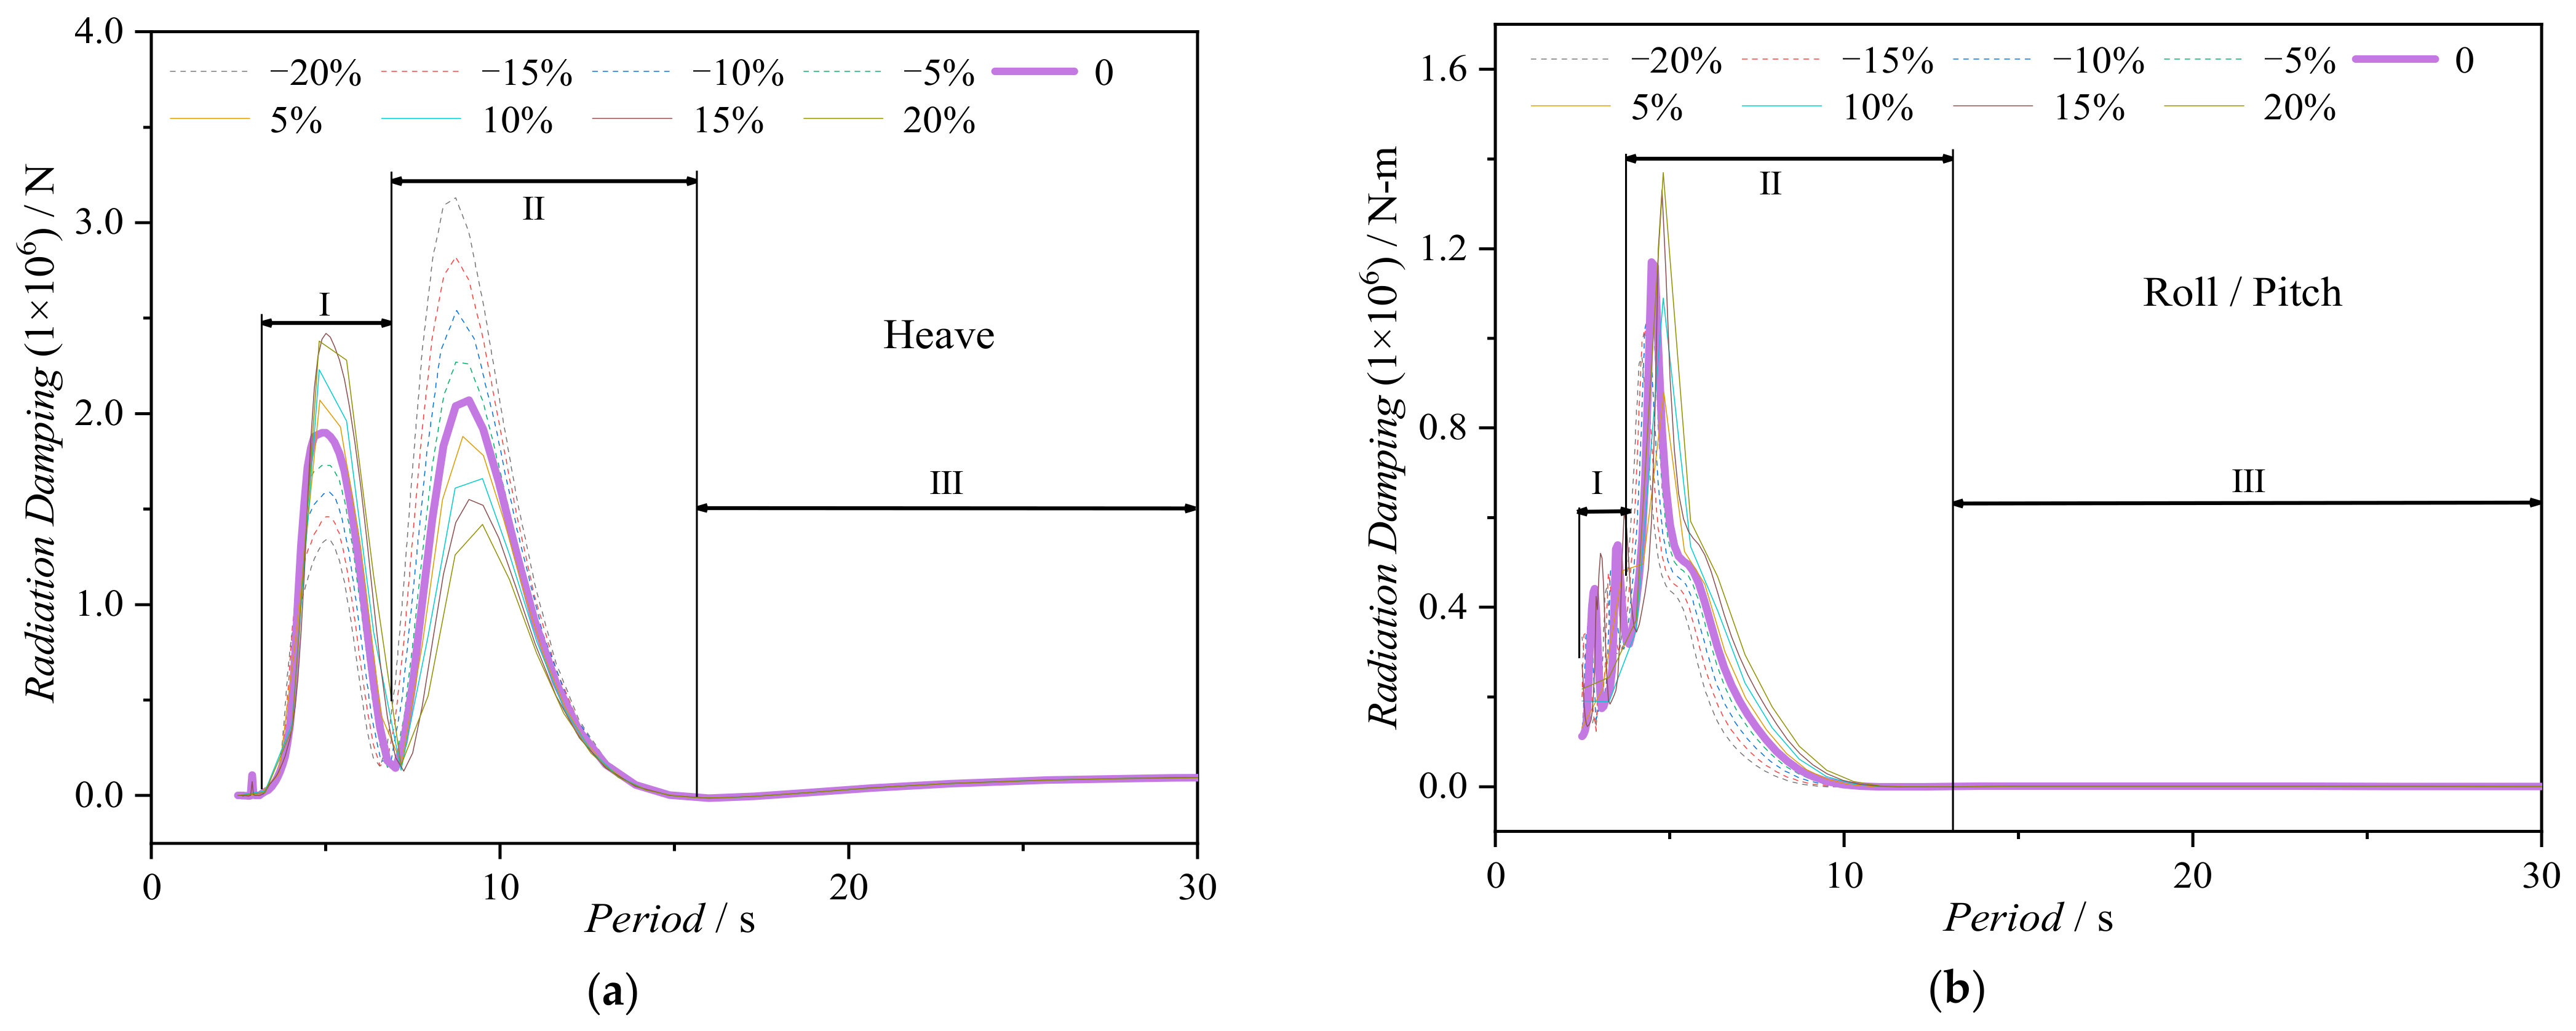
3.4. Influence of Inter-Column Distance ()
3.5. Influence of Side Column Diameter ()
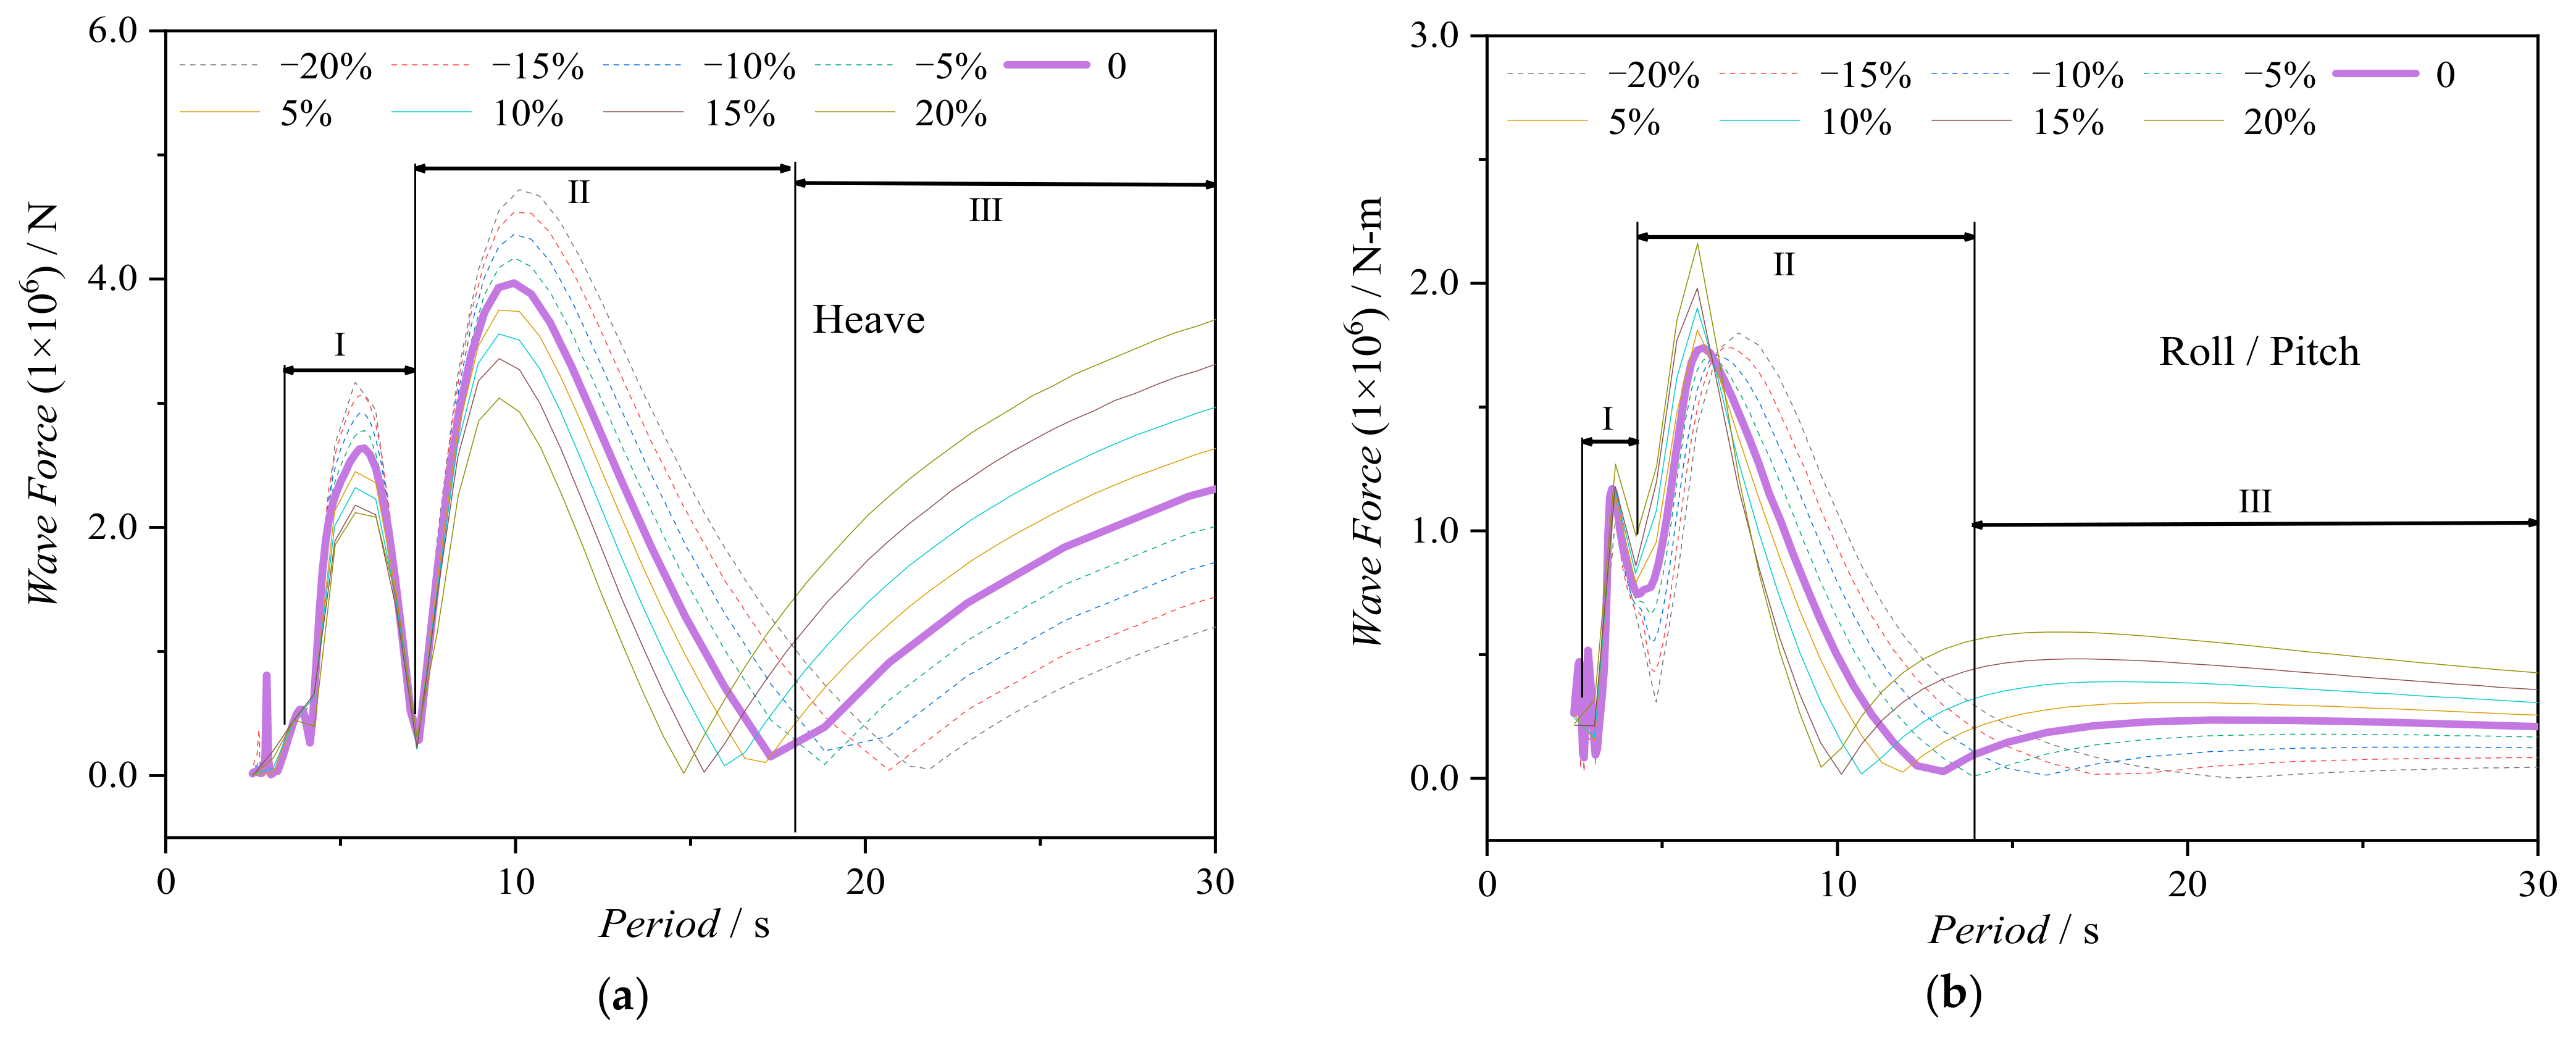
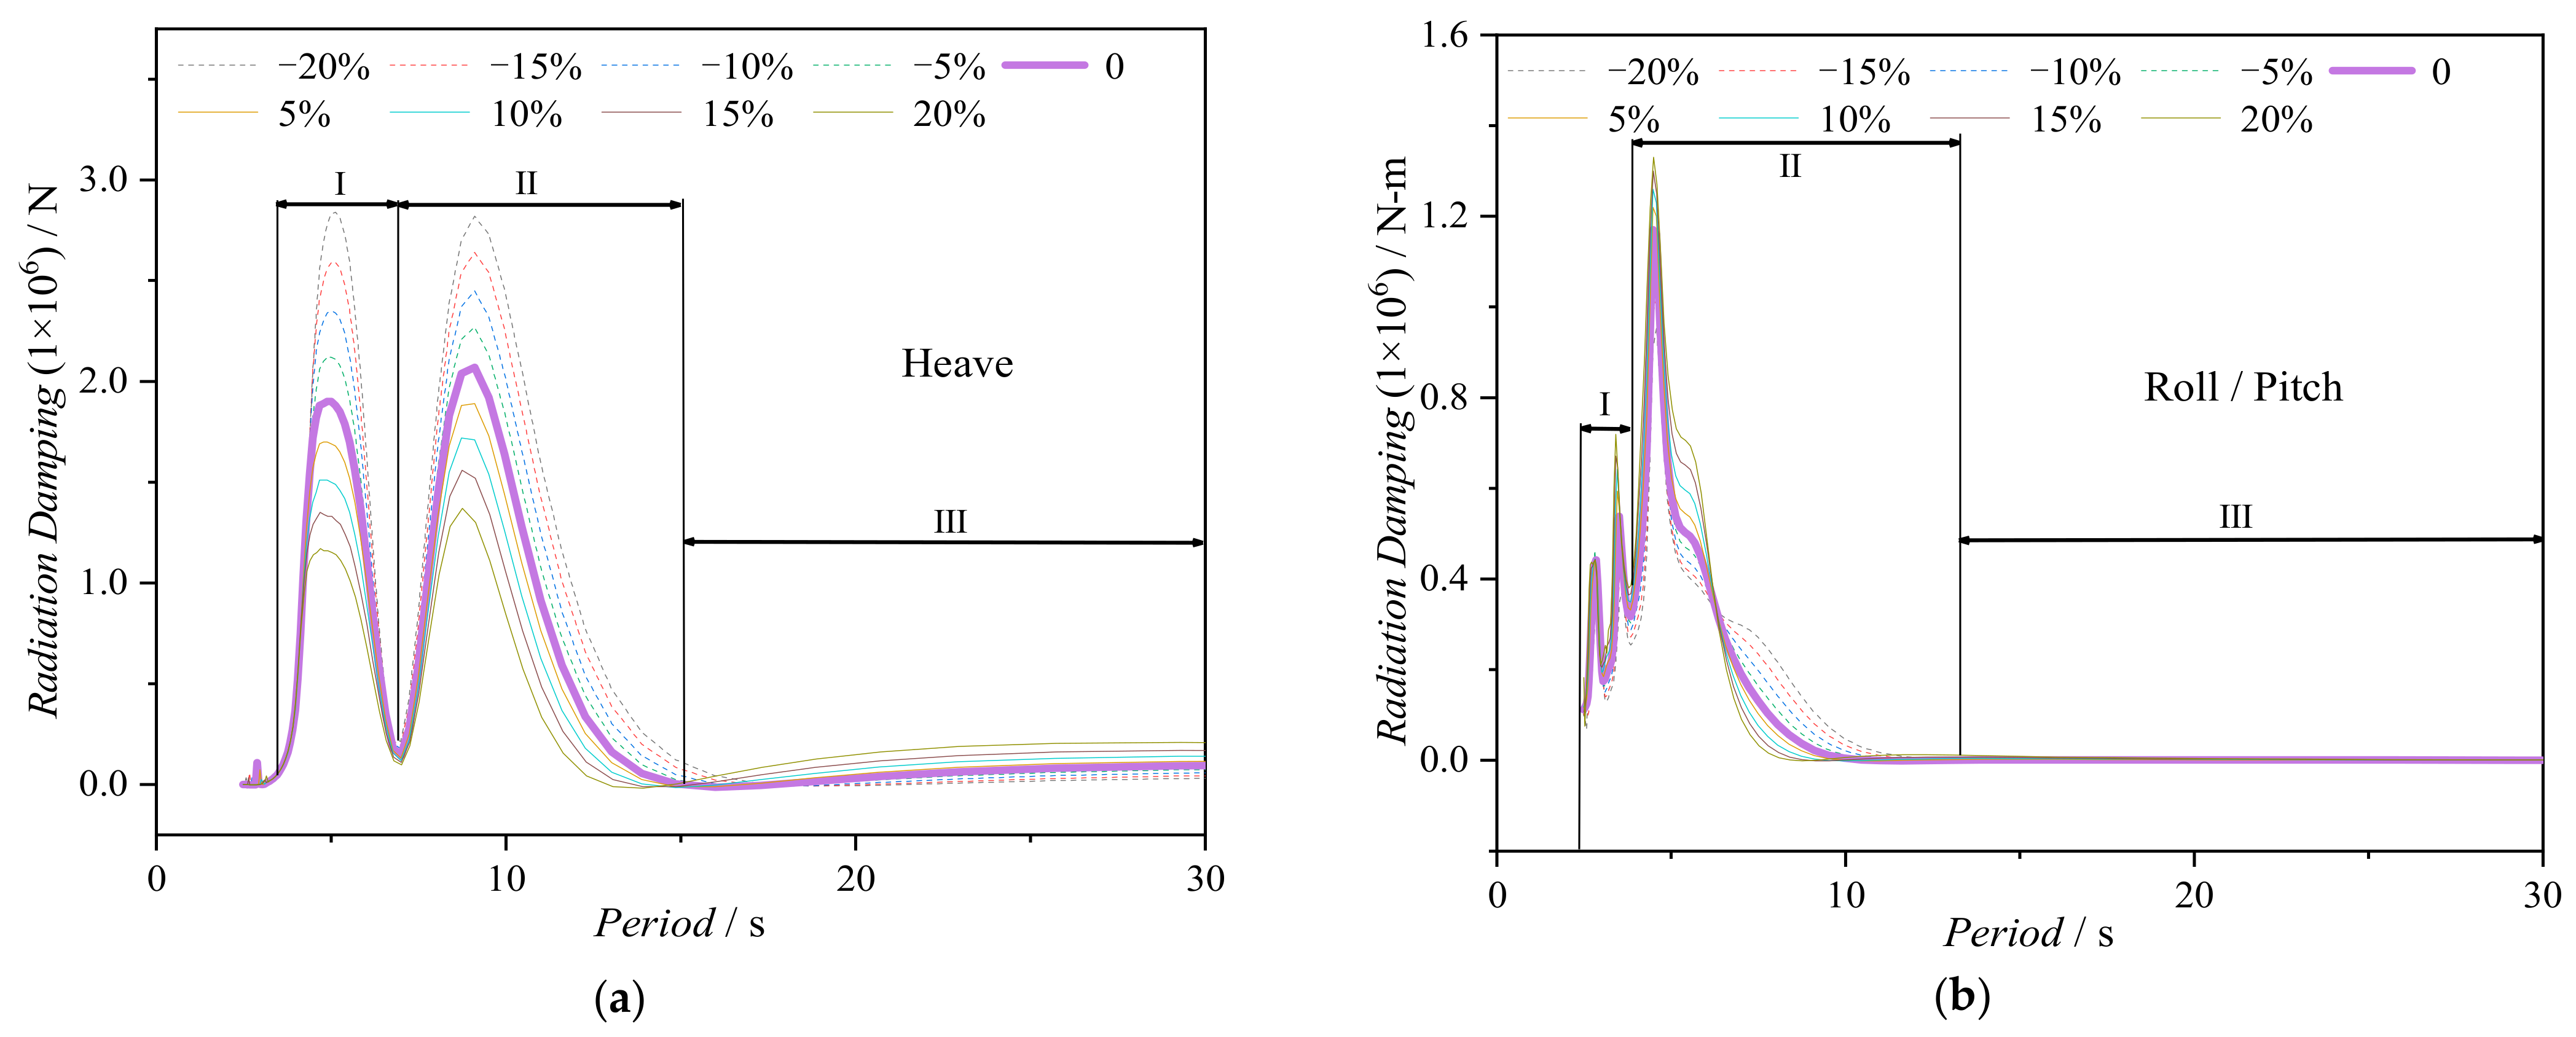
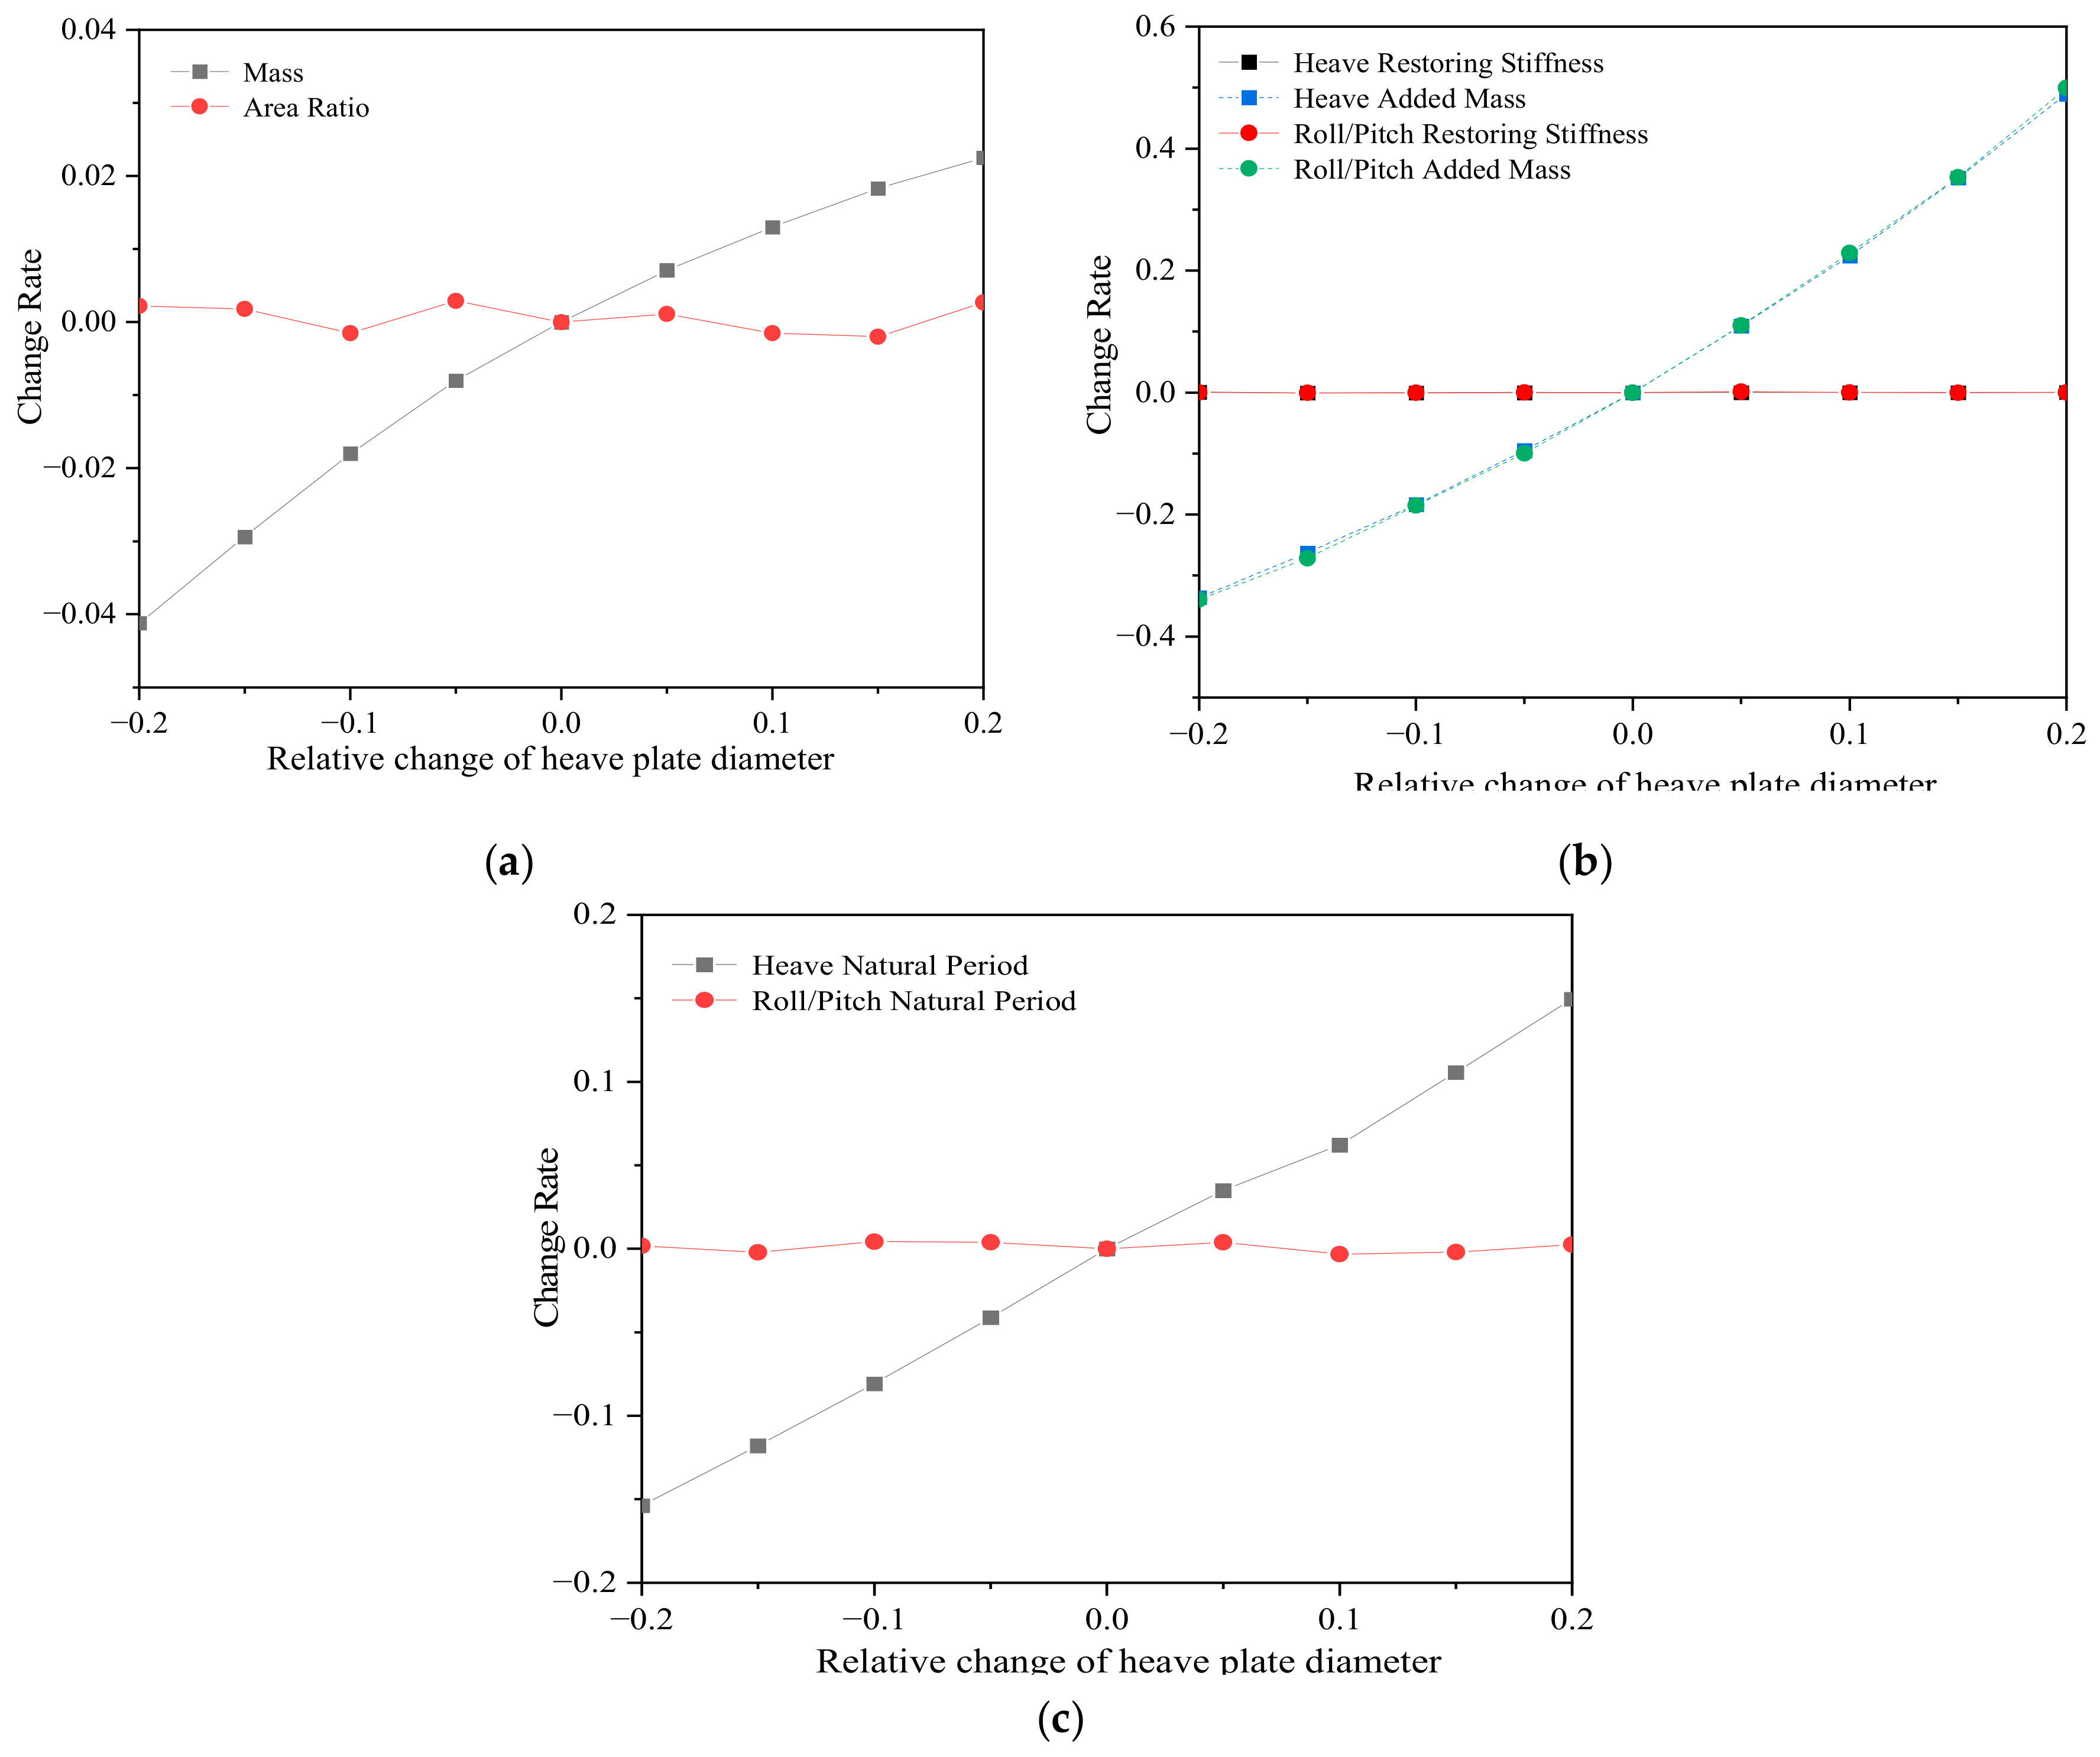
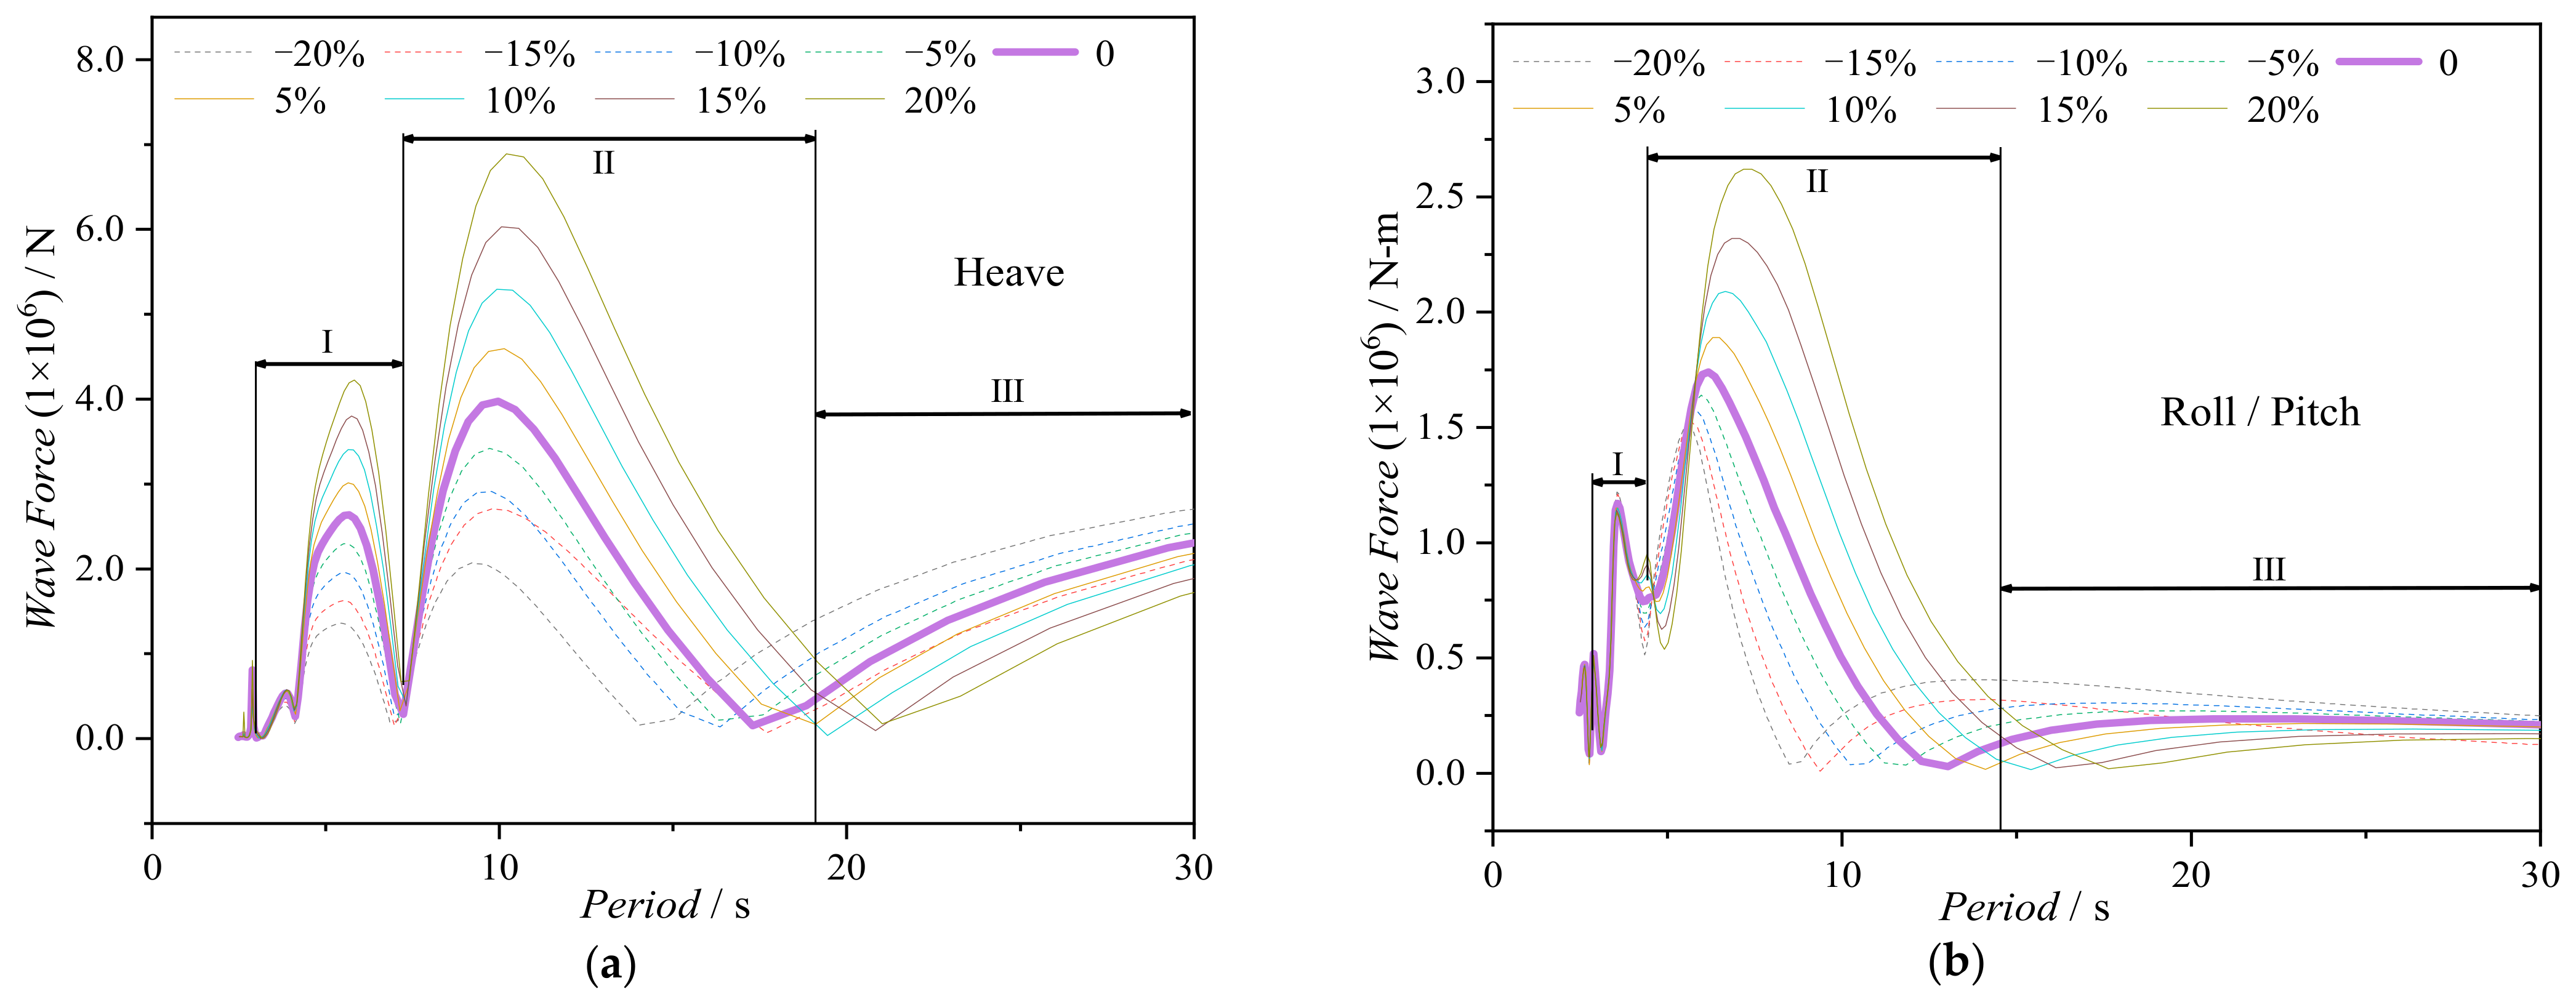
3.6. Influence of Heave Plate Diameter ()
3.7. Results Analysis and Model Optimization
4. Time Domain Results and Analysis
4.1. Environmental Conditions
4.2. Design of Mooring System
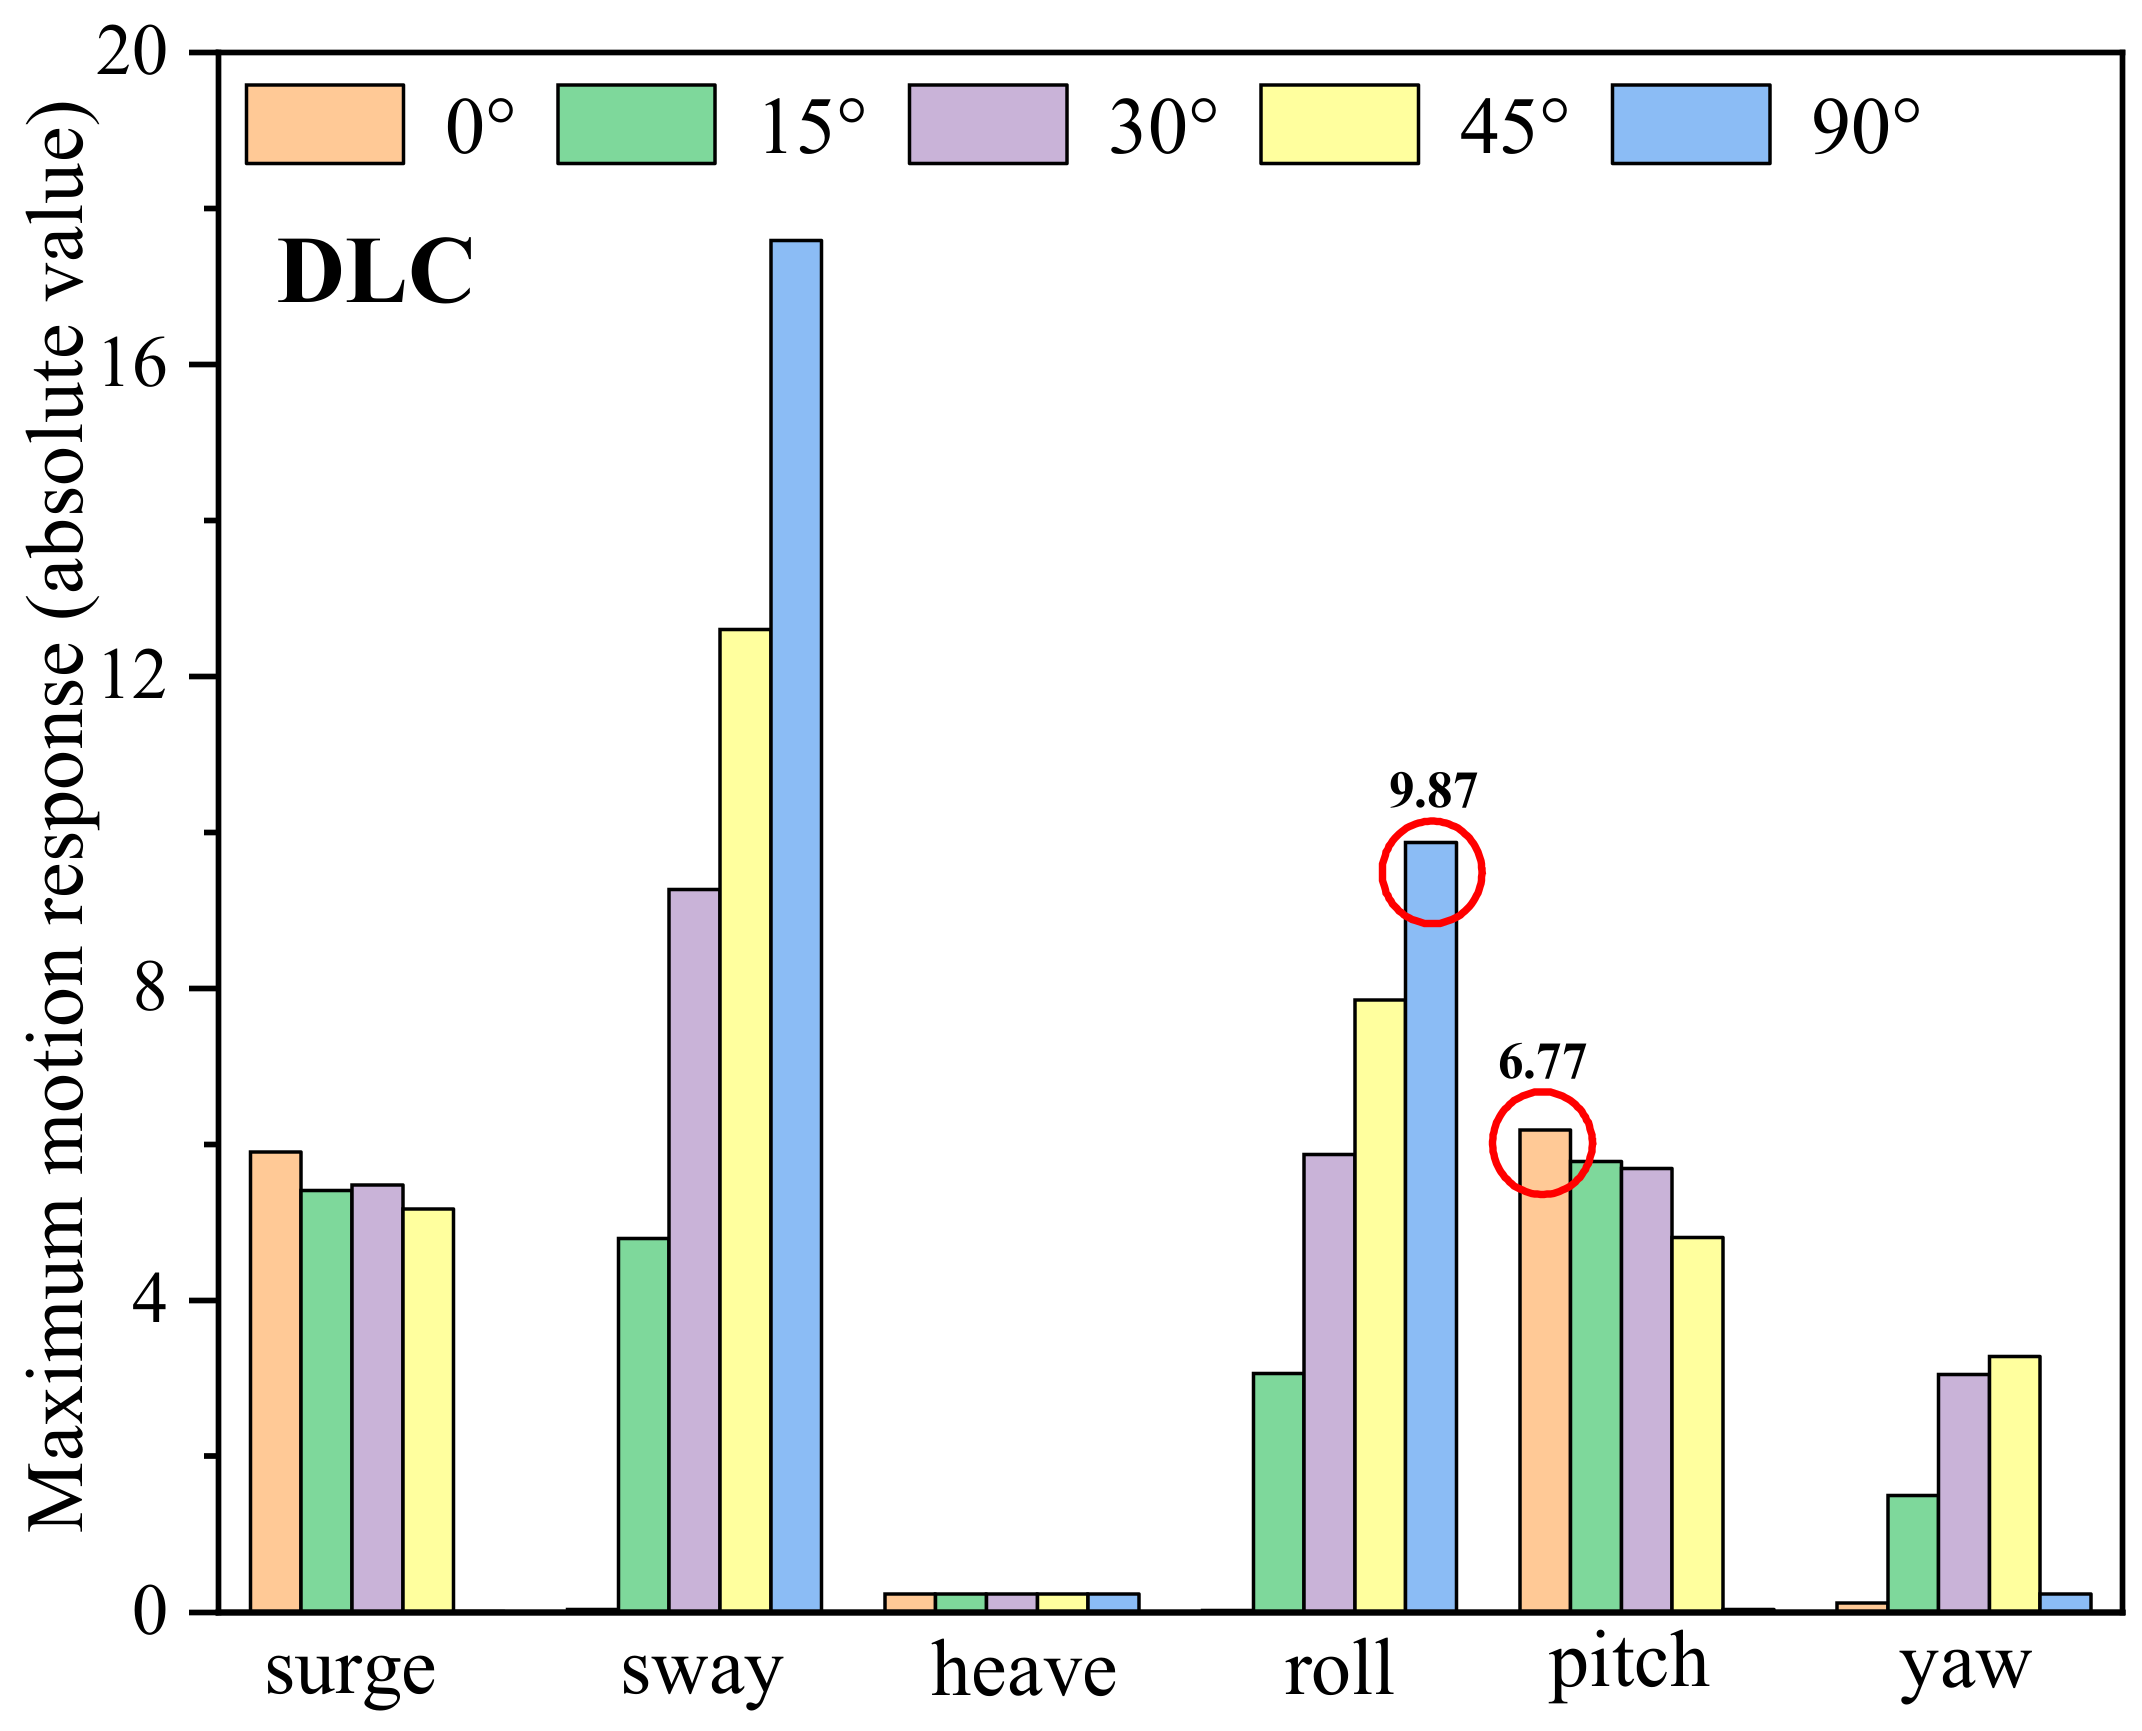
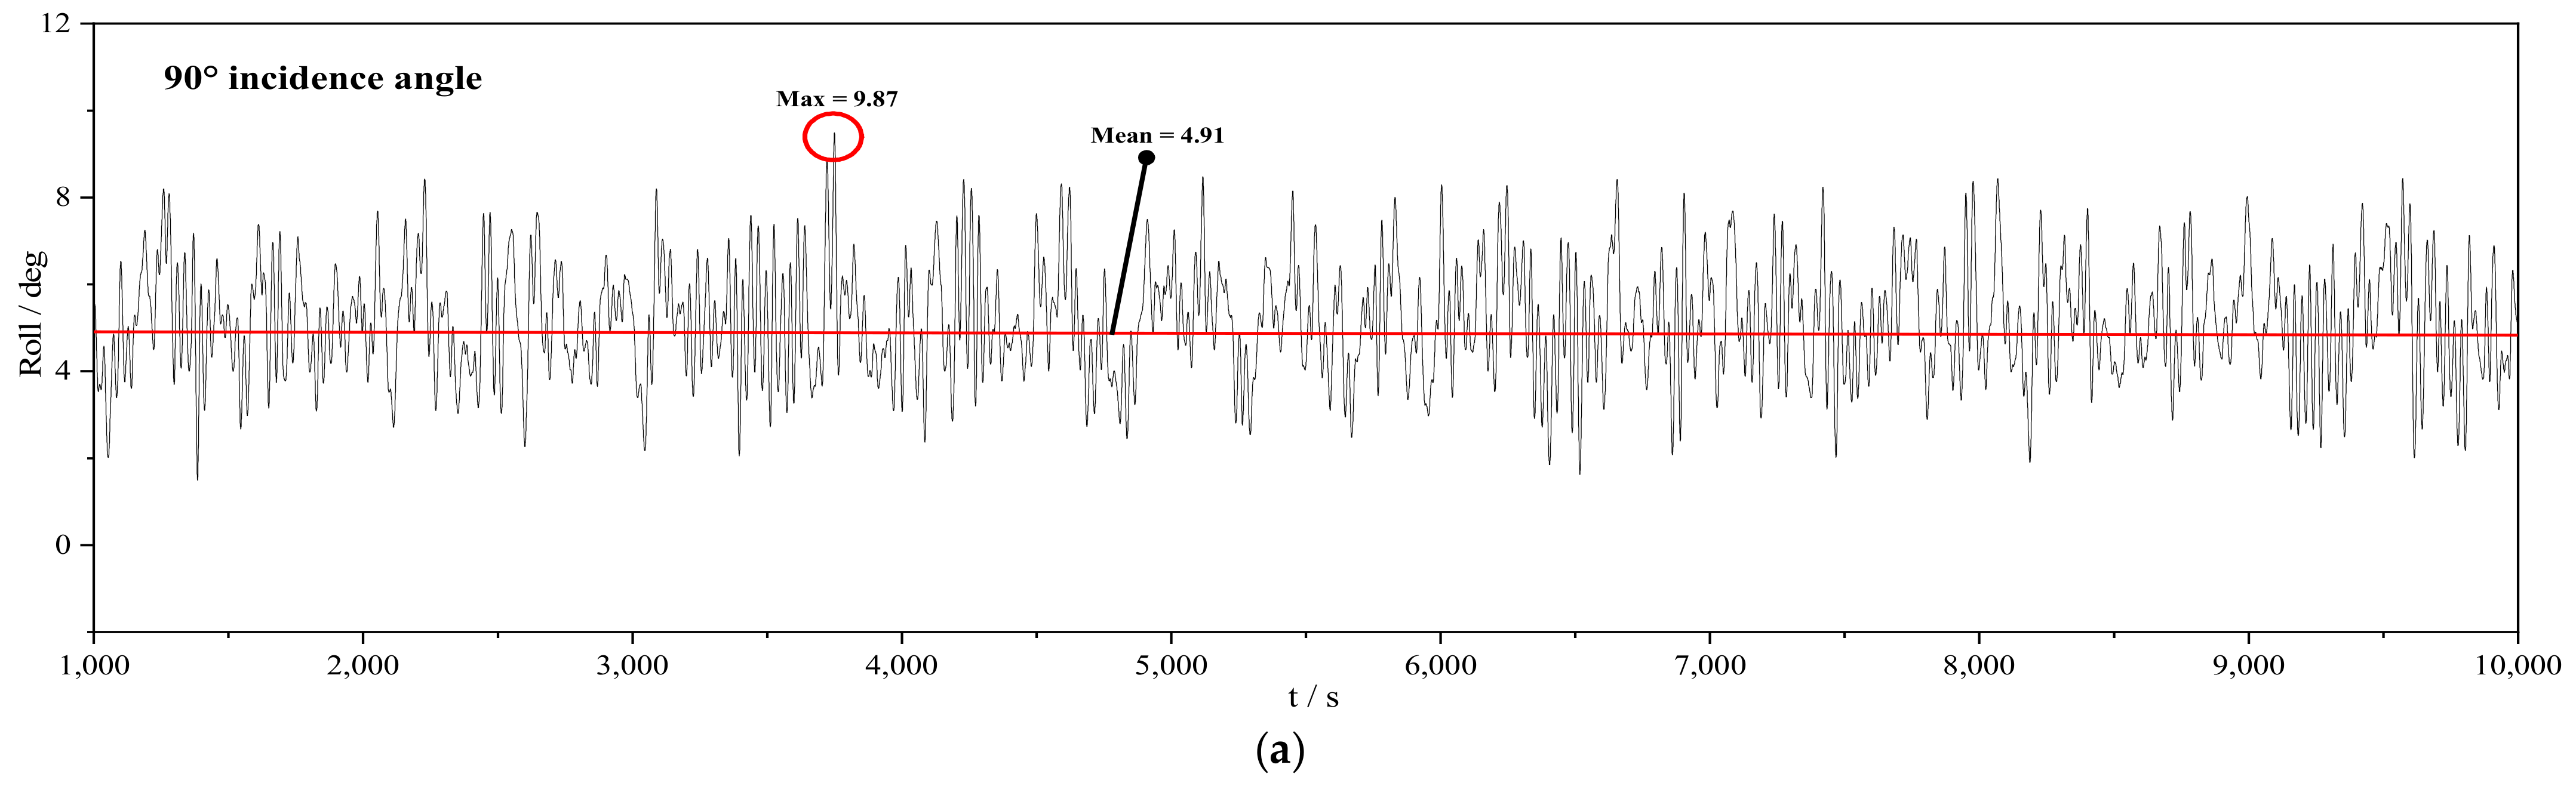
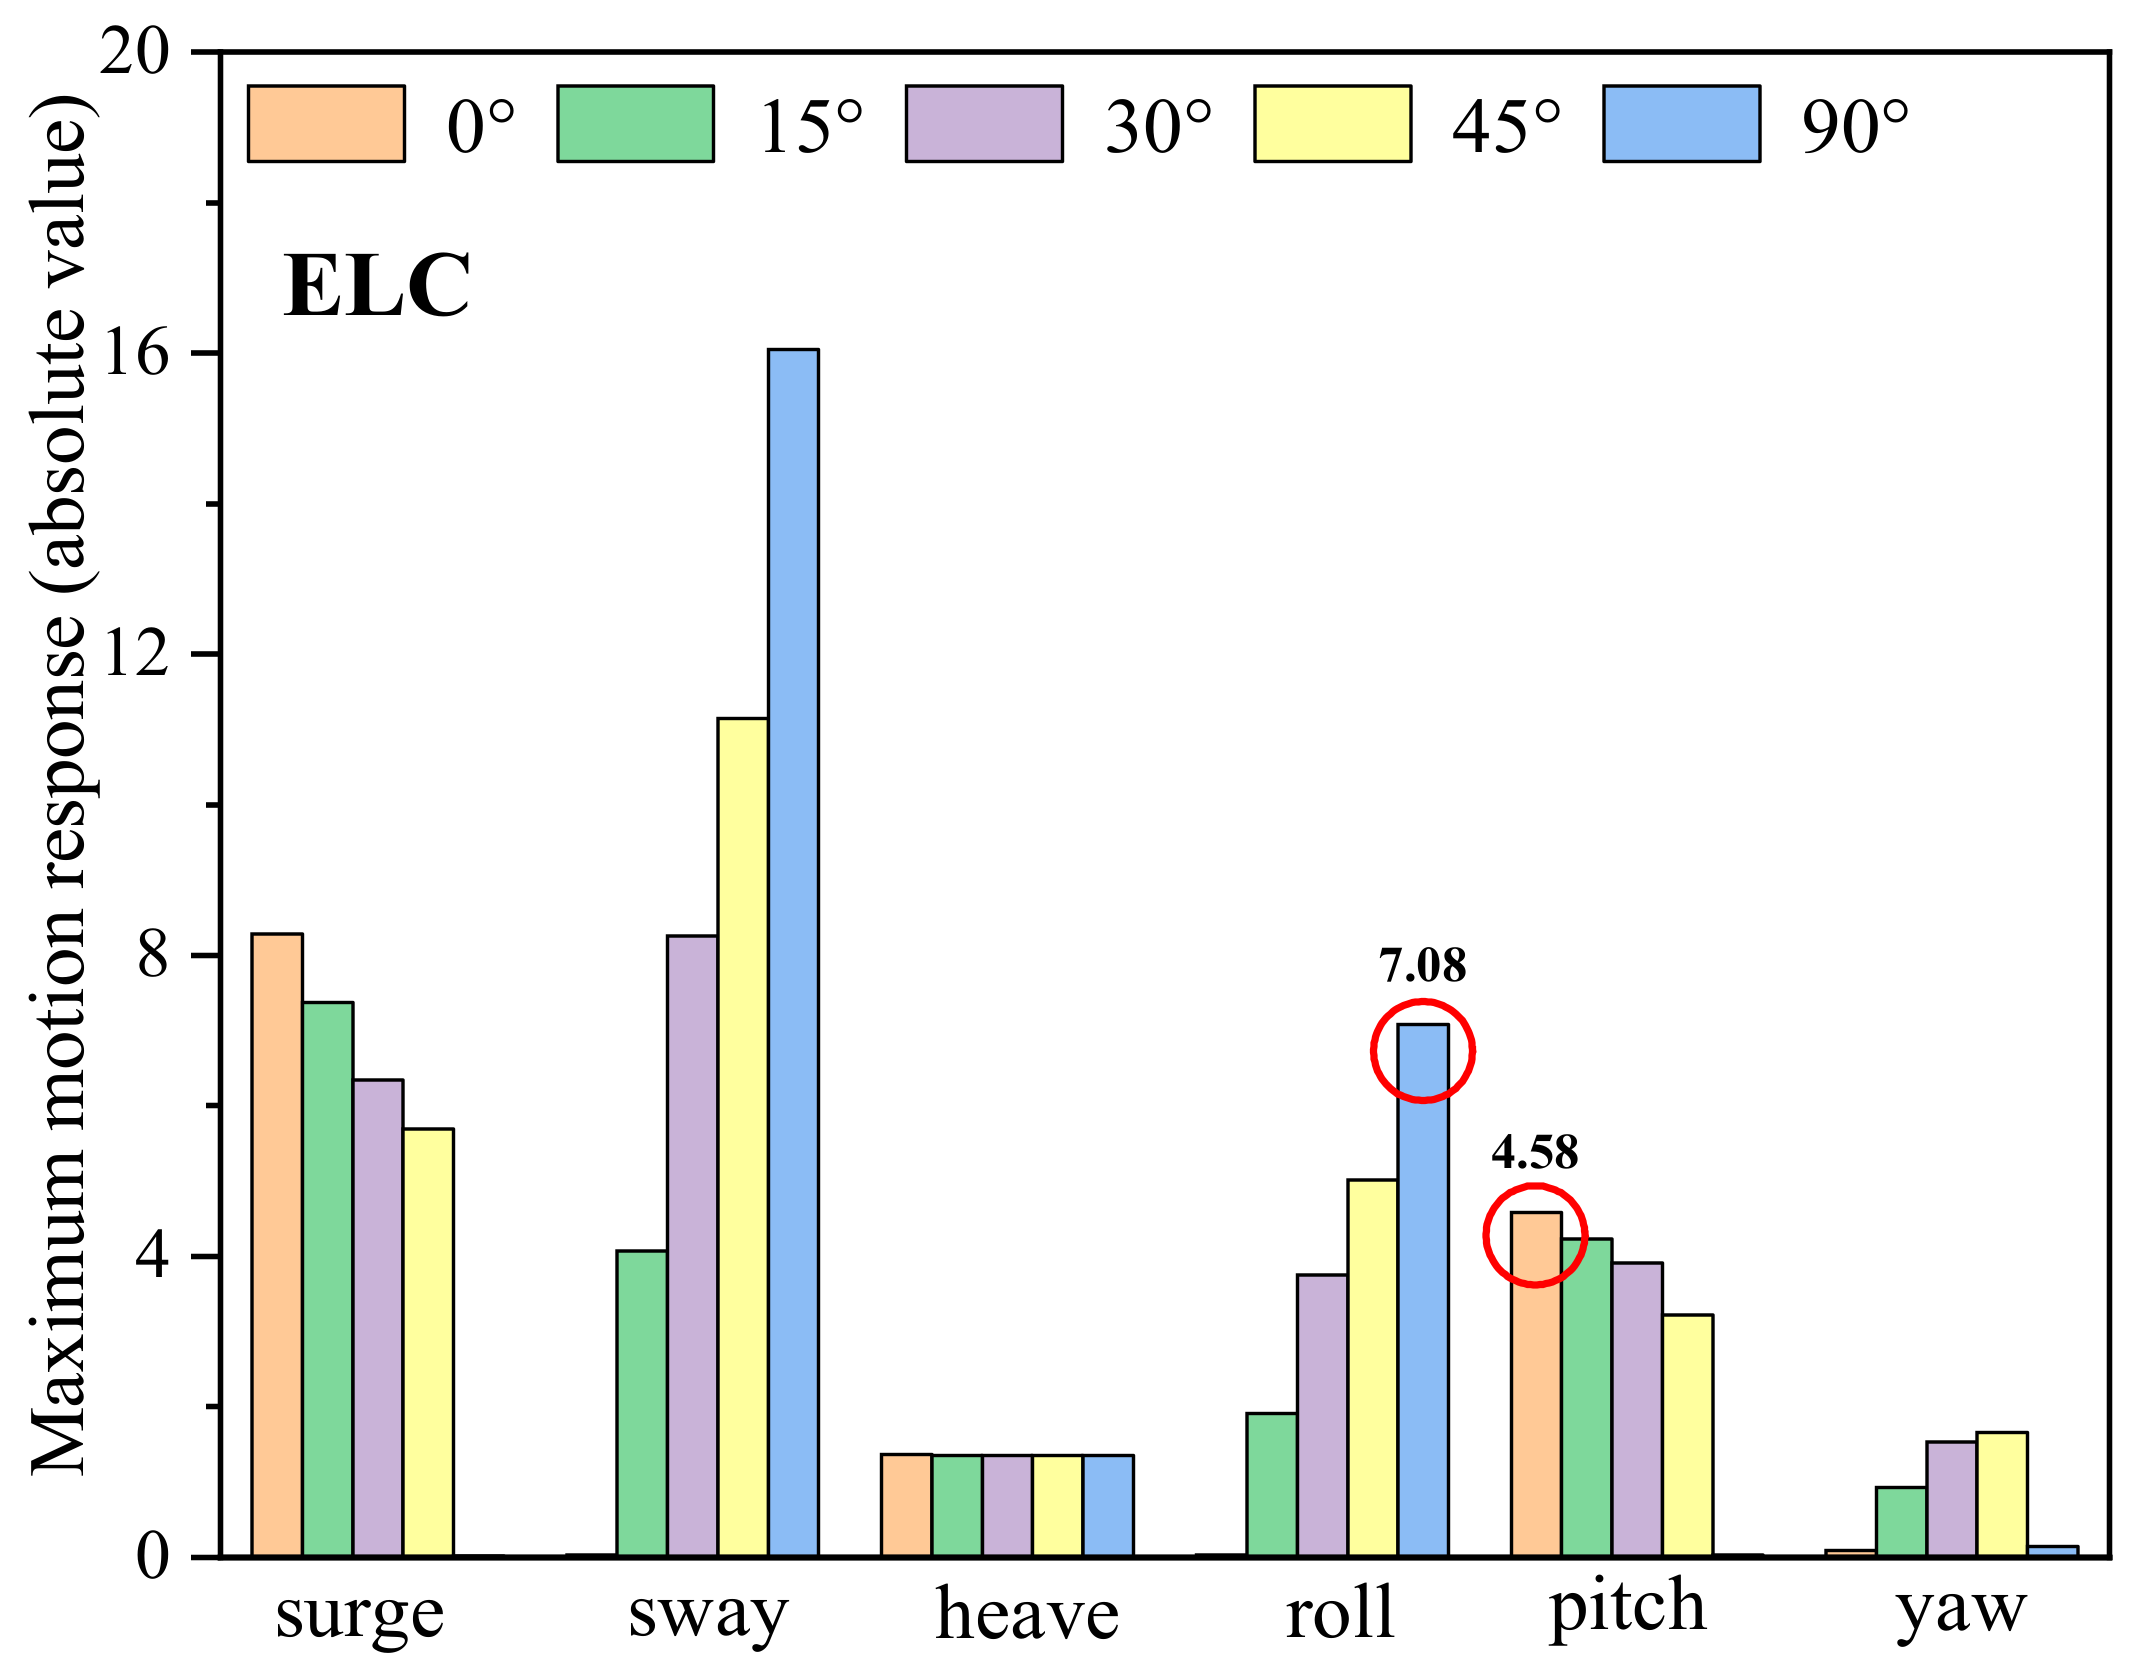
4.3. Analysis of Dynamic Response
4.4. Analysis of Mooring Tension
5. Conclusions
- (1)
- The stability and seakeeping performances of the platform are significantly affected by the platform’s restoring stiffness and mass. With an increase in the restoring stiffness, stability improves but seakeeping worsens. The mass of the platform has a significant impact on both aspects, whereas the impact of added mass is relatively minor. Notably, the seakeeping is affected not only by the restoring stiffness and mass, but also by external environmental loads.
- (2)
- The inter-column distance significantly impacts the platform’s dynamic response. A 5% increase in the column distance enhances the platform stability by about 2.5% and decreases the natural period of roll/pitch motion by 3–8%. The diameters of the side column and the heave plate also influence the platform dynamics. An increase of 5% in the side column diameter enhances the platform stability by 8.7%, and decreases the natural period of roll/pitch motion by 6%. As the heave plate diameter increases, the natural period of heave motion rises, but that of roll/pitch motion remains constant. This is because the roll/pitch natural periods are primarily governed by the restoring stiffness, and the added mass has a negligible effect on the roll/pitch periods due to its minimal contribution to the platform’s rotational inertia.
- (3)
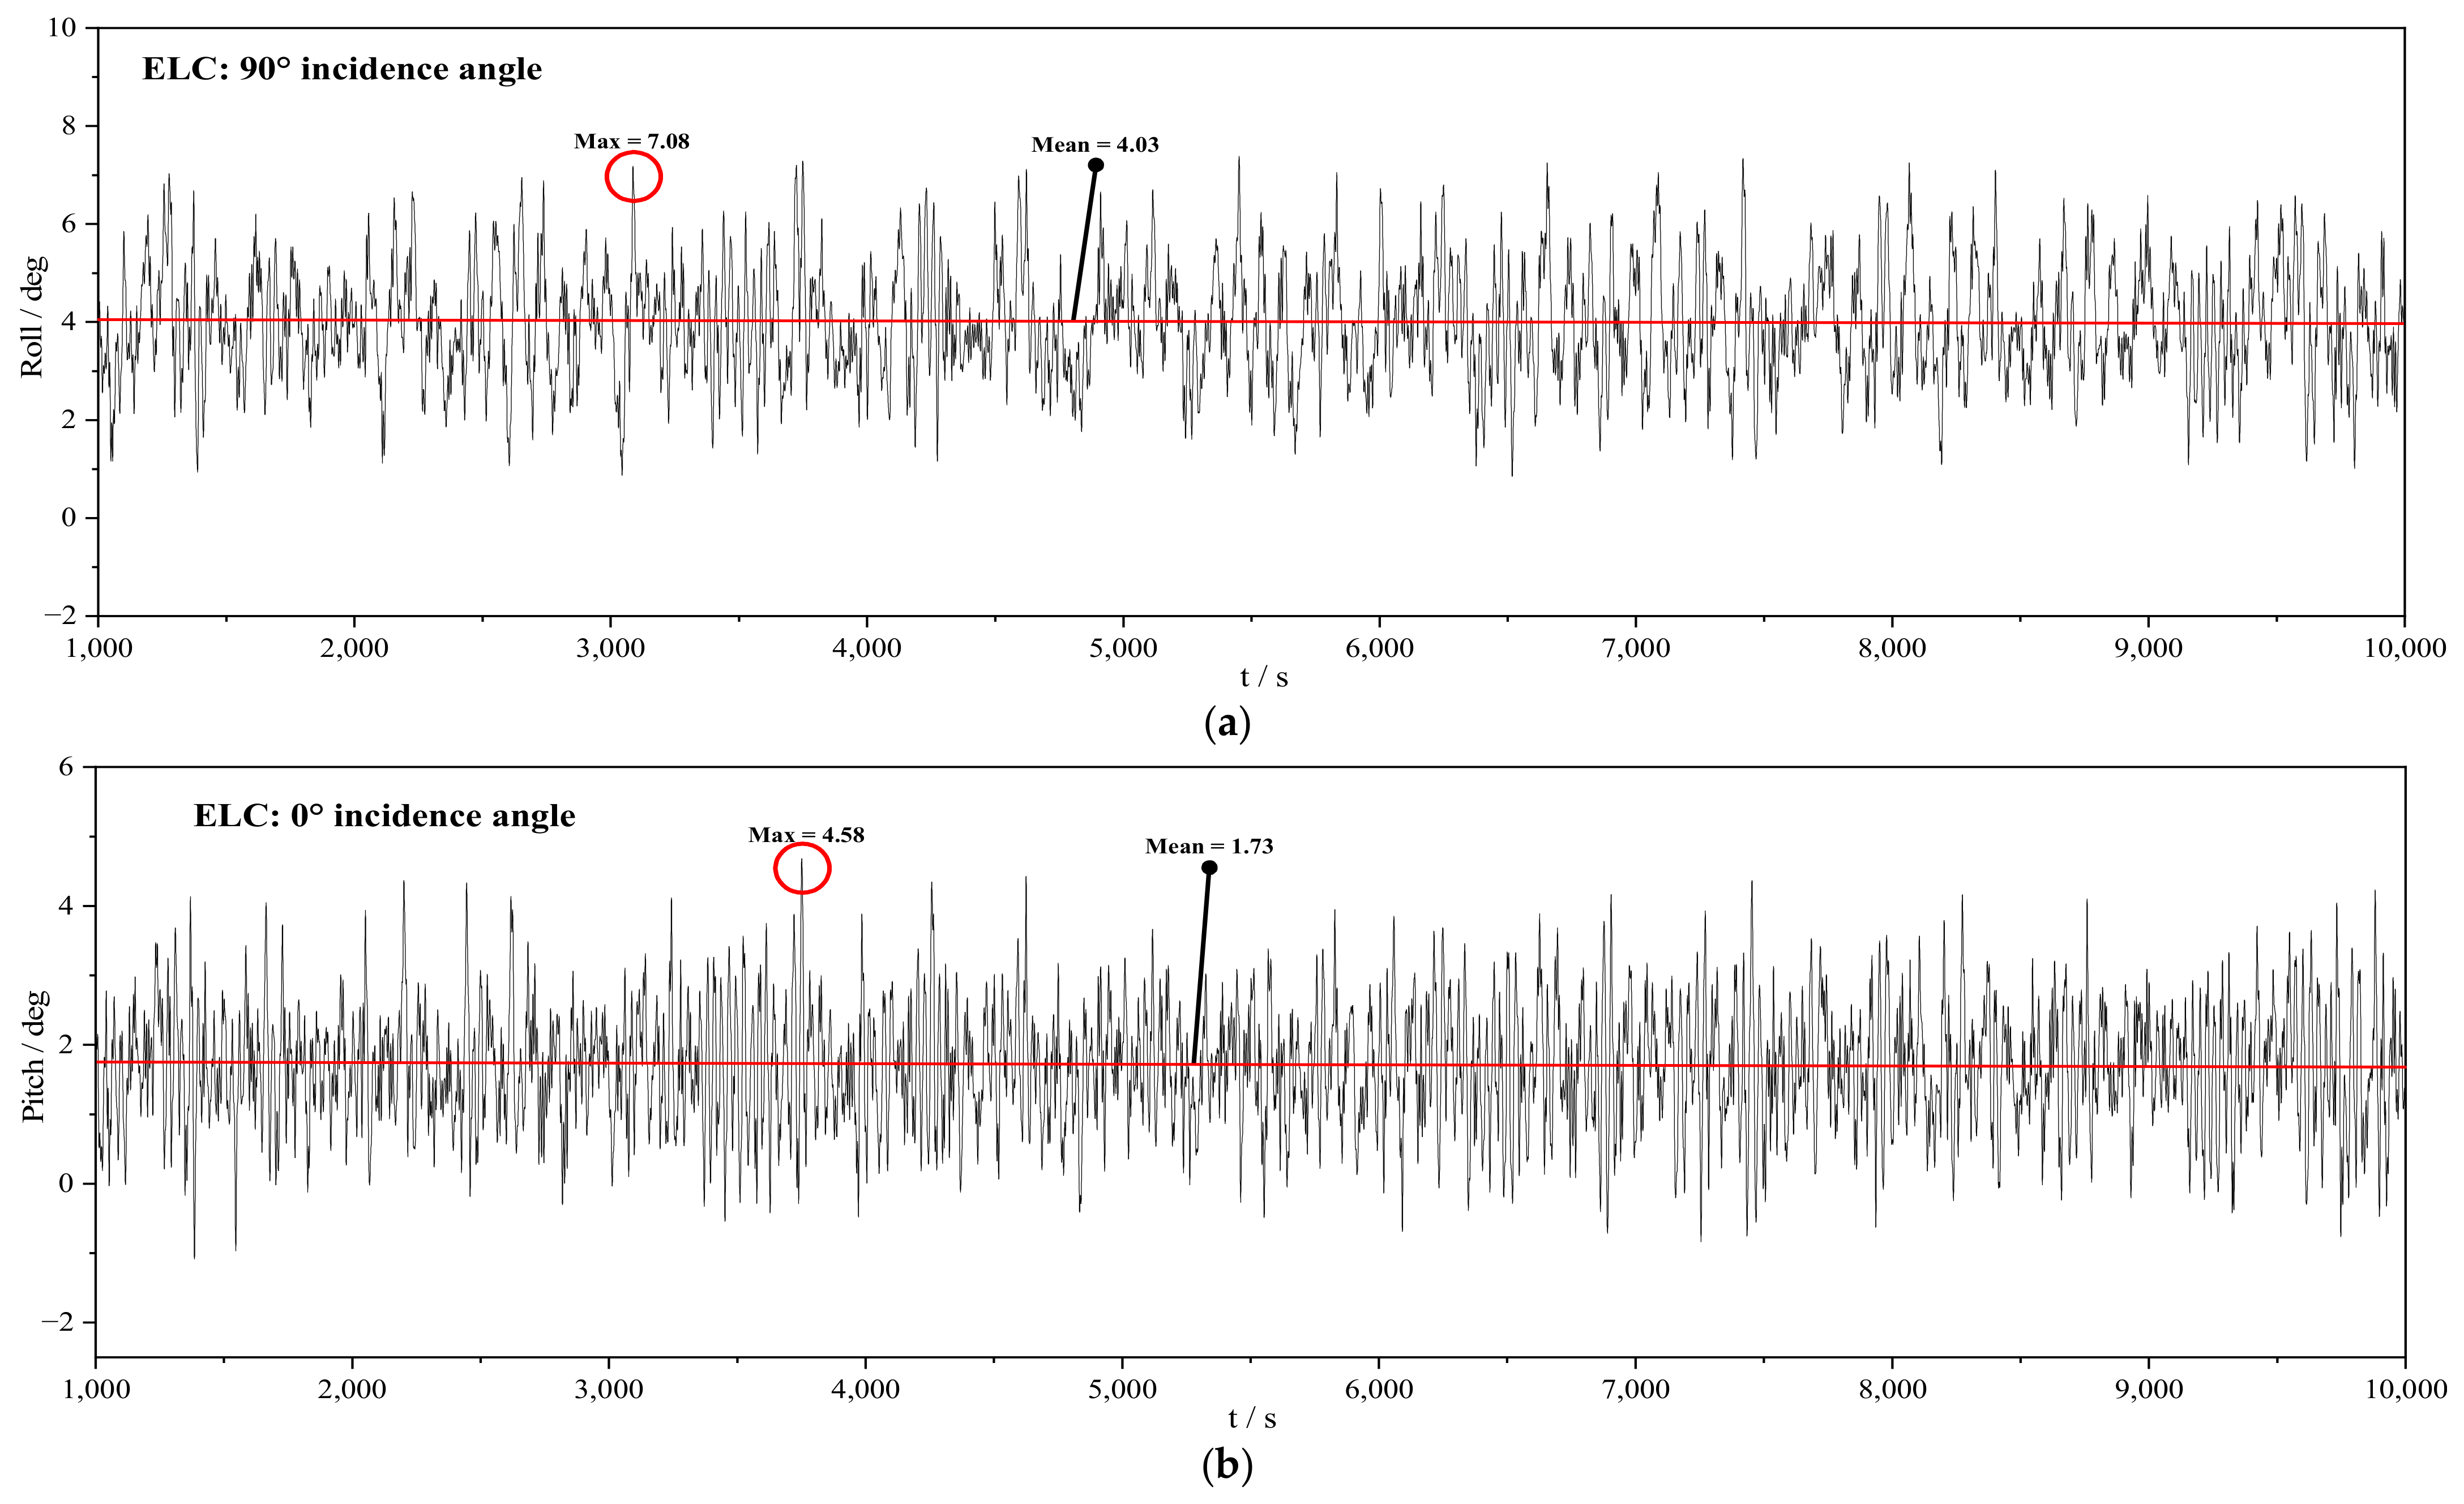
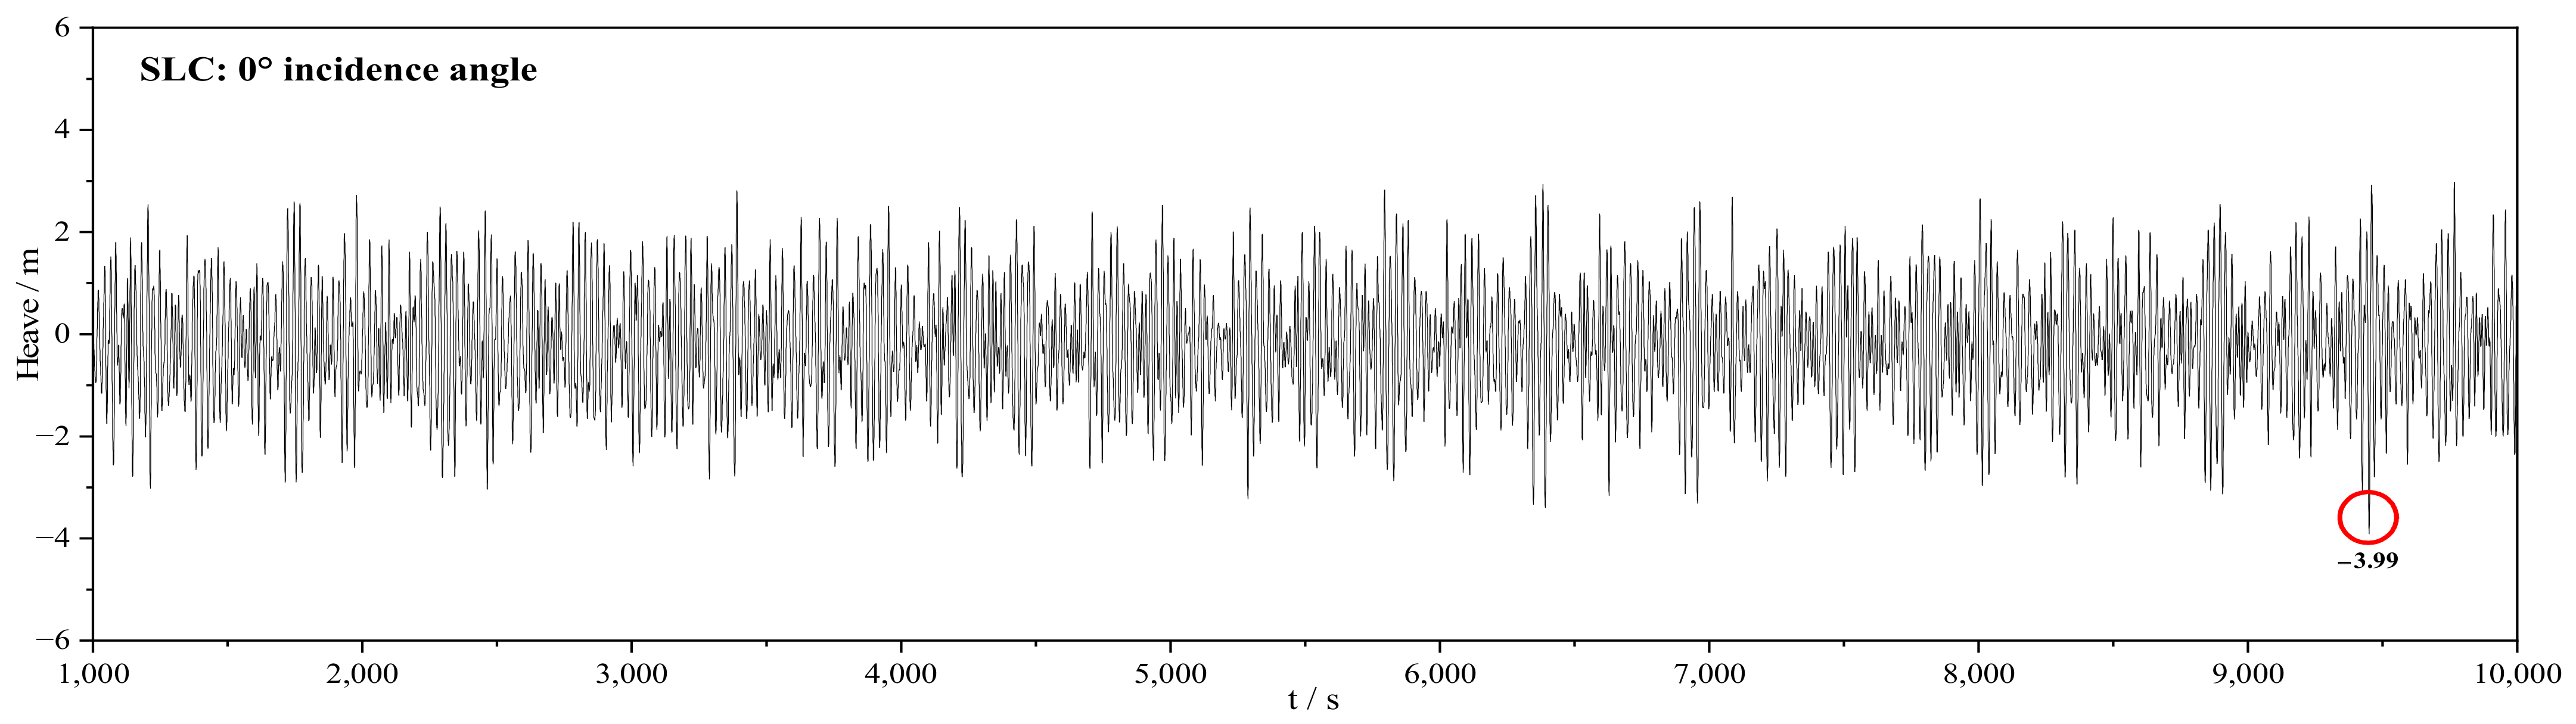
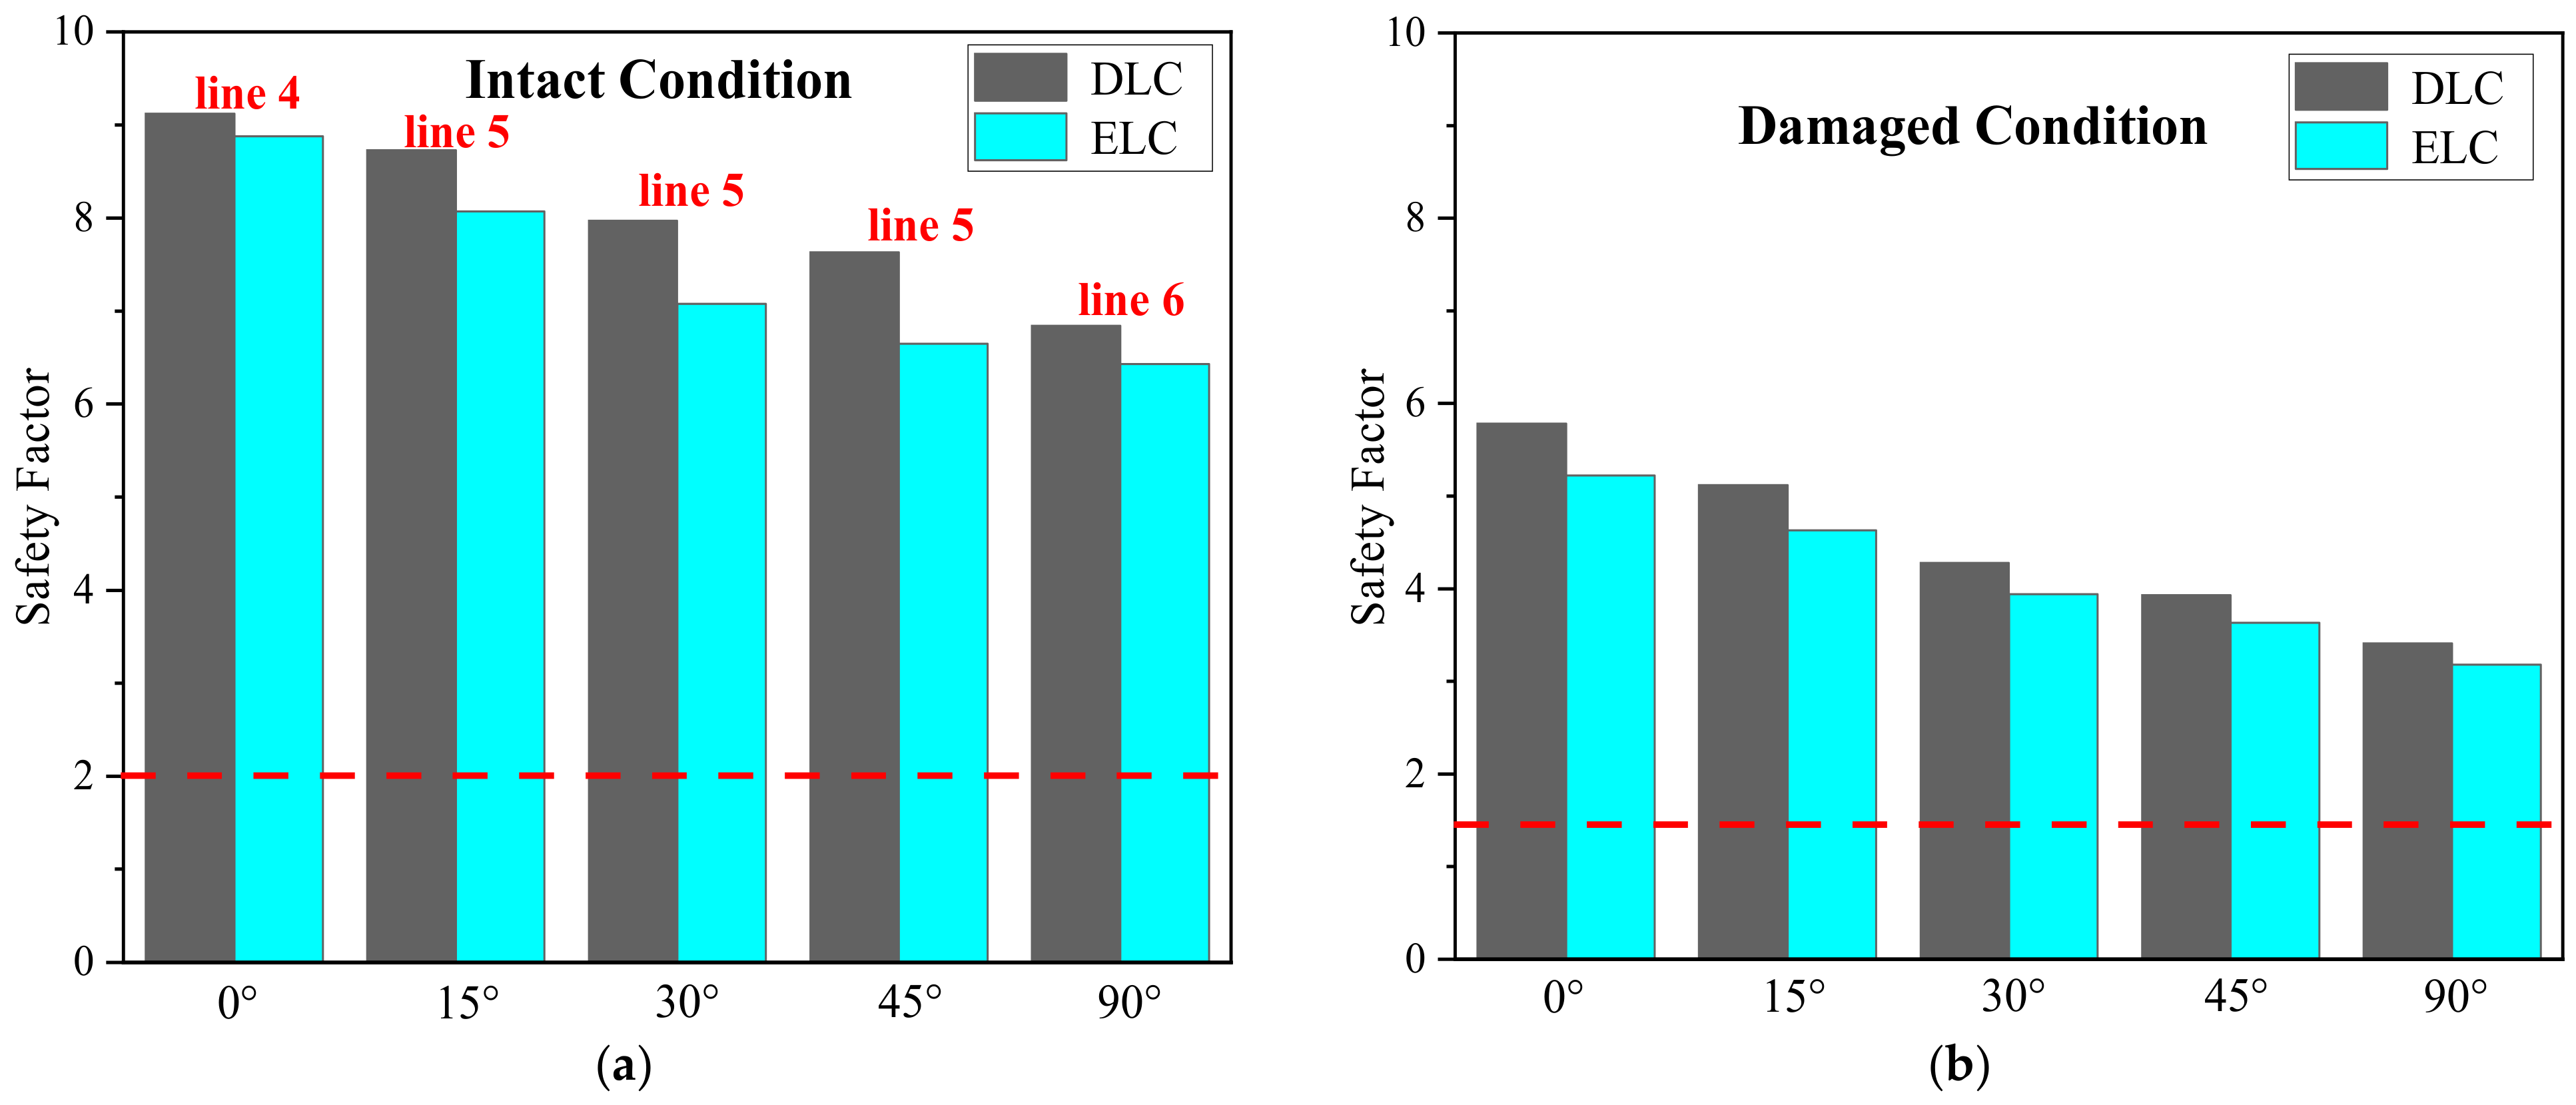
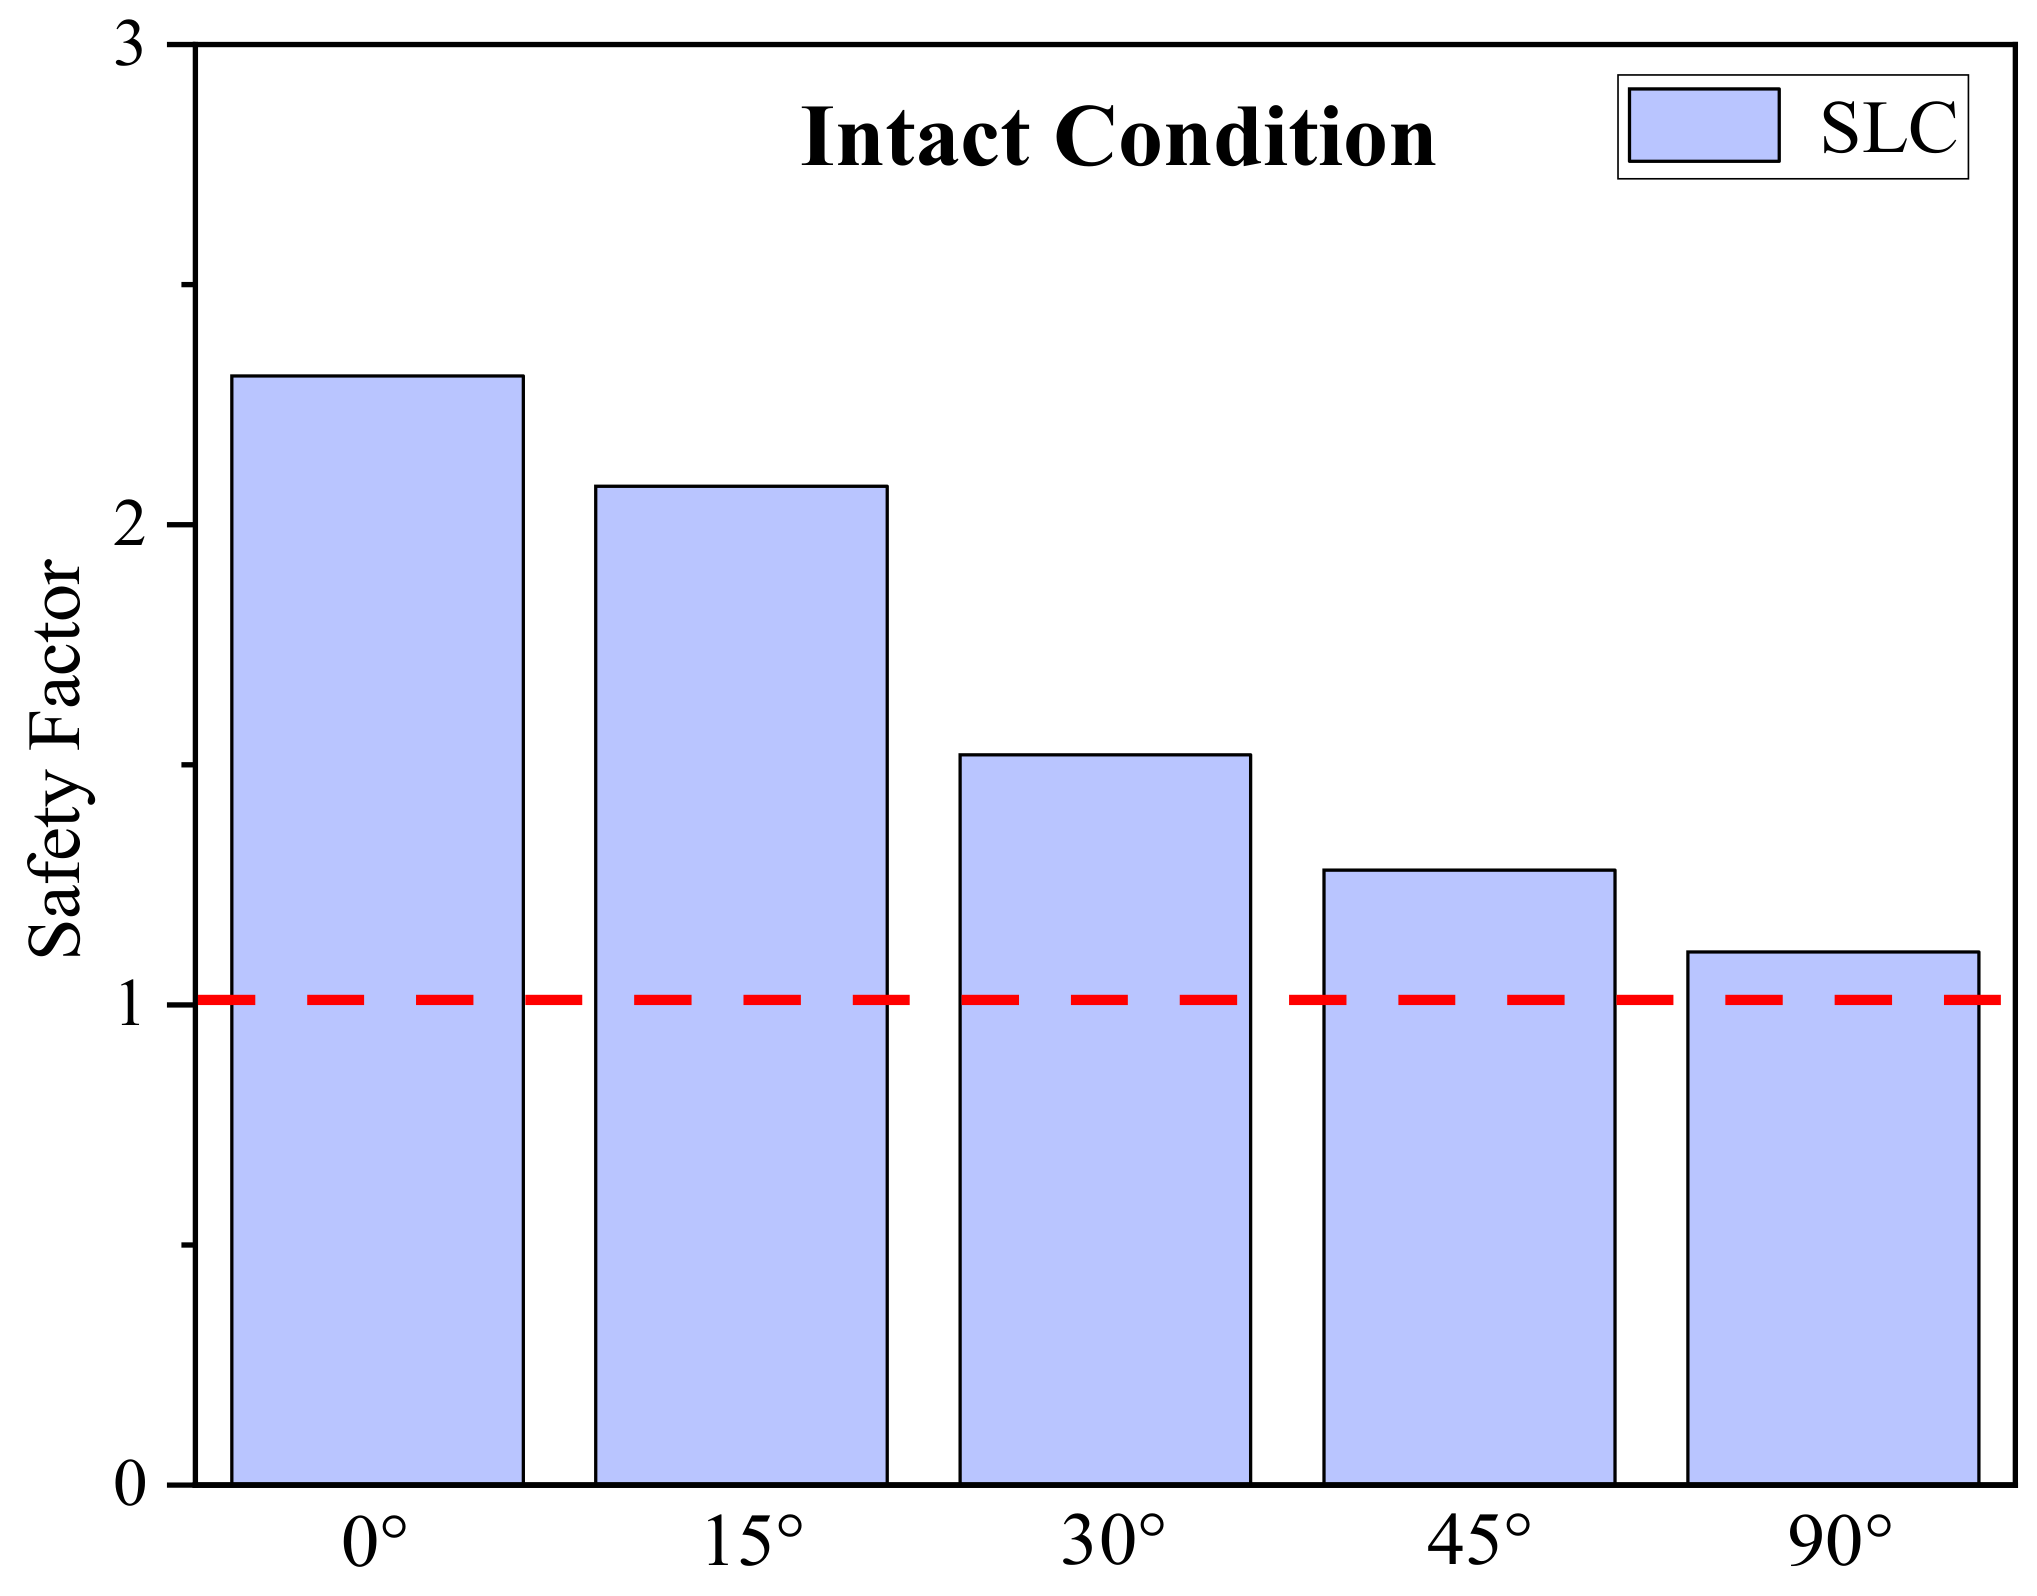
- Fully coupled time domain simulations are conducted on the optimized SparFloat model. The results demonstrate that the platform’s motion responses meet classification rules under all conditions, with the heave motion remaining consistently conservative. Furthermore, the mooring force analysis aligns with the classification rules, with a sufficient safety margin for DLC and ELC, but with a slight safety margin for the SLC condition.
Author Contributions
Funding
Institutional Review Board Statement
Informed Consent Statement
Data Availability Statement
Conflicts of Interest
References
- Global Wind Report 2024. Available online: https://gwec.net/wp-content/uploads/2024/04/GWR-2024_digital-version_final-1.pdf (accessed on 15 November 2024).
- Atcheson, M.; Garrad, A.; Cradden, L.; Henderson, A.; Matha, D.; Nichols, J.; Roddier, D.; Sandberg, J. Floating Offshore Wind Energy; Springer: Berlin/Heidelberg, Germany, 2016. [Google Scholar]
- Díaz, H.; Serna, J.; Nieto, J.; Guedes Soares, C. Market Needs, Opportunities and Barriers for the Floating Wind Industry. J. Mar. Sci. Eng. 2022, 10, 934. [Google Scholar] [CrossRef]
- Otter, A.; Murphy, J.; Pakrashi, V.; Robertson, A.; Desmond, C. A review of modelling techniques for floating offshore wind turbines. Wind Energy 2022, 25, 831–857. [Google Scholar] [CrossRef]
- Fukushima FORWARD Project. Available online: https://www.mhi.com/news/130628en.html (accessed on 15 November 2024).
- Zhang, H.; Wang, H.; Cai, X.; Xie, J.; Wang, Y.; Zhang, N. Research on the Dynamic Performance of a Novel Floating Offshore Wind Turbine Considering the Fully-Coupled-Effect of the System. J. Mar. Sci. Eng. 2022, 10, 341. [Google Scholar] [CrossRef]
- Bai, H.; Zhang, M.; Yuan, W.; Xu, K. Conceptual design, parameter optimization and performance investigation of a 10MW semi-submersible floating wind turbine in shallow water. Ocean Eng. 2023, 281, 114895. [Google Scholar] [CrossRef]
- Cao, Q.; Xiao, L.; Guo, X.; Liu, M. Second-order responses of a conceptual semi-submersible 10 MW wind turbine using full quadratic transfer functions. Renew. Energy 2020, 153, 653–668. [Google Scholar] [CrossRef]
- Yao, Y.; Ning, D.; Deng, S.; Mayon, R.; Qin, M. Hydrodynamic investigation on floating offshore wind turbine platform integrated with porous shell. Energies 2023, 16, 4376. [Google Scholar] [CrossRef]
- Zhao, H.; Wu, X.; Zhou, Z. Exploring motion stability of a novel semi-submersible platform for offshore wind turbines. Energies 2024, 17, 2313. [Google Scholar] [CrossRef]
- Subbulakshmi, A.; Verma, M.; Keerthana, M.; Sasmal, S.; Harikrishna, P.; Kapuria, S. Recent advances in experimental and numerical methods for dynamic analysis of floating offshore wind turbines—An integrated review. Renew. Sustain. Energy Rev. 2022, 164, 112525. [Google Scholar] [CrossRef]
- Xu, S.; Xue, Y.; Zhao, W.; Wan, D. A review of high-fidelity Computational Fluid Dynamics for floating offshore wind turbines. J. Mar. Sci. Eng. 2022, 10, 1357. [Google Scholar] [CrossRef]
- Asim, T.; Islam, S.; Hemmati, A.; Khalid, M. A review of recent advancements in offshore wind turbine technology. Energies 2022, 15, 579. [Google Scholar] [CrossRef]
- Zhou, B.; Zhang, Z.; Li, G.; Yang, D.; Santos, M. Review of key technologies for offshore floating wind power generation. Energies 2023, 16, 710. [Google Scholar] [CrossRef]
- Chen, J.; Liu, Z.; Song, Y.; Peng, Y.; Li, J. Experimental study on dynamic responses of a spar-type floating offshore wind turbine. Renew. Energy 2022, 196, 560–578. [Google Scholar] [CrossRef]
- Ha, Y.-J.; Ahn, H.; Park, S.; Park, J.-Y.; Kim, K.-H. Development of hybrid model test technique for performance evaluation of a 10 MW class floating offshore wind turbine considering asymmetrical thrust. Ocean Eng. 2023, 272, 113783. [Google Scholar] [CrossRef]
- Mei, X.; Xiong, M. Effects of second-order hydrodynamics on the dynamic responses and fatigue damage of a 15 mw floating offshore wind turbine. J. Mar. Sci. Eng. 2021, 9, 1232. [Google Scholar] [CrossRef]
- Zhao, Z.; Wang, W.; Shi, W.; Li, X. Effects of second-order hydrodynamics on an ultra-large semi-submersible floating offshore wind turbine. Structures 2020, 28, 2260–2275. [Google Scholar] [CrossRef]
- Yang, Y.; Bashir, M.; Michailides, C.; Li, C.; Wang, J. Development and application of an aero-hydro-servo-elastic coupling framework for analysis of floating offshore wind turbines. Renew. Energy 2020, 161, 606–625. [Google Scholar] [CrossRef]
- Yang, Y.; Bashir, M.; Wang, J.; Michailides, C.; Loughney, S.; Armin, M.; Hernández, S.; Urbano, J.; Li, C. Wind-wave coupling effects on the fatigue damage of tendons for a 10 MW multi-body floating wind turbine. Ocean Eng. 2020, 217, 107909. [Google Scholar] [CrossRef]
- Shen, Y.; Liu, C.; Pan, W.; Li, Y.; Wang, X. Design and Fully Coupled Dynamic Response Analysis of a New Floating Offshore Wind Platform. J. Mar. Sci. Eng. 2023, 11, 1368. [Google Scholar] [CrossRef]
- Bashetty, S.; Ozcelik, S. Review on dynamics of offshore floating wind turbine platforms. Energies 2021, 14, 6026. [Google Scholar] [CrossRef]
- Jonkman, J.M. Loads Analysis of a Floating Offshore Wind Turbine Using Fully Coupled Simulation; National Renewable Energy Laboratory (NREL): Golden, CO, USA, 2007.
- Faltinsen, O. Sea Loads on Ships and Offshore Structures; Cambridge University Press: Cambridge, UK, 1993; Volume 1. [Google Scholar]
- ANSYS. AQWA Theory Manual; ANSYS: Canonsburg, PA, USA, 2022; Release R2. [Google Scholar]
- Morison, J.R.; Johnson, J.W.; Schaaf, S.A. The force exerted by surface waves on piles. J. Pet. Technol. 1950, 2, 149–154. [Google Scholar] [CrossRef]
- Chrolenko, M.O. Dynamic Analysis and Design of Mooring Lines. Master’s Thesis, Norwegian University of Science and Technology, Trondheim, Norway, 2013. [Google Scholar]
- Wang, L.; Guo, Z.; Yuan, F. Quasi-static three-dimensional analysis of suction anchor mooring system. Ocean Eng. 2010, 37, 1127–1138. [Google Scholar] [CrossRef]
- American Bureau of Shipping. Guide for Building and Classing Floating Offshore Wind Turbines, 2020; pp. 1–184. Available online: https://ww2.eagle.org/content/dam/eagle/rules-and-guides/current/offshore/195-guide-for-building-and-classing-floating-offshore-wind-turbines/195-fowt-guide-jan24.pdf (accessed on 8 December 2024).
- Jonkman, J.M.; Buhl, M.L., Jr. FAST User’s Guide; Report No. NREL/TP-500-38230; National Renewable Energy Laboratory (NREL): Golden, CO, USA, 2005.
- Robertson, A.; Jonkman, J.; Masciola, M.; Song, H.; Goupee, A.; Coulling, A.; Luan, C. Definition of the Semi-Submersible Floating System for Phase II of OC4; Report No. NREL/TP-5000-60601; National Renewable Energy Laboratory (NREL): Golden, CO, USA, 2014.
- Kim, H.C.; Kim, M.H. Comparison of simulated platform dynamics in steady/dynamic winds and irregular waves for OC4 semi-submersible 5MW wind-turbine against DeepCwind model-test results. Ocean Syst. Eng. 2016, 6, 1–21. [Google Scholar] [CrossRef]
- DNVGL-ST-0019; Floating Wind Turbine Structures. DNV: Oslo, Norway, 2009.
- Collu, M.; Maggi, A.; Gualeni, P.; Rizzo, C.M.; Brennan, F. Stability requirements for floating offshore wind turbine (FOWT) during assembly and temporary phases: Overview and application. Ocean Eng. 2014, 84, 164–175. [Google Scholar] [CrossRef]
- Jonkman, J.; Butterfield, S.; Musial, W.; Scott, G. Definition of a 5-MW Reference Wind Turbine for Offshore System Development; Report No. NREL/TP-500-38060; National Renewable Energy Laboratory (NREL): Golden, CO, USA, 2009.
- Bak, C.; Zahle, F.; Bitsche, R.; Kim, T.; Yde, A.; Henriksen, L.C.; Hansen, M.H.; Blasques, J.P.A.A.; Gaunaa, M.; Natarajan, A. The DTU 10-MW Reference Wind Turbine. In Proceedings of the Danish Wind Power Research 2013, Trinity, Fredericia, Denmark, 27–28 May 2013. Sound/Visual Production (Digital). [Google Scholar]
- China Classification Society. Rules for Classification of Mobile Offshore Units. 2020. Available online: https://www.ccs.org.cn/ccswzen/specialDetail?id=202207280220290500 (accessed on 1 July 2020).
- Ghigo, A.; Cottura, L.; Caradonna, R.; Bracco, G.; Mattiazzo, G. Platform optimization and cost analysis in a floating offshore wind farm. J. Mar. Sci. Eng. 2020, 8, 835. [Google Scholar] [CrossRef]
- Wen, Y.; Wang, W.; Liu, H.; Mao, L.; Mi, H.; Wang, W.; Zhang, G. A shape optimization method of a specified point absorber wave energy converter for the South China Sea. Energies 2018, 11, 2645. [Google Scholar] [CrossRef]


| Loading Condition | Analysis Method | Design Condition of Mooring System | Safety Factor |
|---|---|---|---|
| Design load cases | DAM | Intact | 1.67 |
| Damaged condition with one broken line | 1.05 | ||
| QSAM | Intact | 2.00 | |
| Damaged condition with one broken line | 1.43 | ||
| Survival load cases | DAM | Intact | 1.05 |
| QSAM |
| Conditions | Wind Speed (m/s) | Significant Wave Height (m) | Spectral Peak Period (s) | Peak Factor |
|---|---|---|---|---|
| Test | 16.11 | 7.1 | 12.1 | 2.2 |
| DOF Motion | Test Results | Numerical Results | Relative Error | |
|---|---|---|---|---|
| Surge/m | max | 14.1 | 12.288 | 12.8% |
| min | 1.53 | 1.912 | 24% | |
| mean | 5.9 | 5.837 | 1.06% | |
| Pitch/° | max | 2.17 | 1.864 | 14% |
| min | 2.16 | 1.95 | 9.7% | |
| mean | 0.071 | 0.078 | 9.8% | |
| Heave/m | max | 4.9 | 4.463 | 8.9% |
| min | 1.17 | 0.945 | 18.8% | |
| mean | 1.87 | 1.792 | 4.1% | |
| Parameter | DTU 10 MW |
|---|---|
| Rated wind speed | 11.4 m/s |
| Cut-in wind speed | 4.0 m/s |
| Cut-out wind speed | 25.0 m/s |
| Rotor diameter | 178.3 m |
| Minimum rotor speed | 6.0 rpm |
| Maximum rotor speed | 9.6 rpm |
| Parameter | Tower |
|---|---|
| Height of tower top above SWL | 119.0 m |
| Diameter of tower top | 5.5 m |
| Diameter of tower base | 8.3 m |
| Tower mass | 451.0 t |
| Height of center of mass above SWL | 61.0 m |
| Displacement | Steel Usage | Draft | HCG (From Waterline) | Ixx | Iyy | Izz |
|---|---|---|---|---|---|---|
| 16,111 t | 4280.7 t | 47 m | −26.8 m | 2.72 × 10¹⁰ kg·m2 | 2.72 × 10¹⁰ kg·m2 | 3.63 × 10⁹ kg·m2 |
| Platform Motion | Hydrostatic Stiffness | Natural Period |
|---|---|---|
| Heave | 3,704,153 N/m | 25.75 s |
| Roll/Pitch | 23,935,082 N·m/° | 33.94 s |
| Environmental Condition | Significant Wave Height | Peak Wave Period | Wind Speed | Incident Angle |
|---|---|---|---|---|
| DLC | 0.5 m | 4.5 s | 11.4 m/s | 0°~45°, 90° |
| ELC | 7.3 m | 11.1 s | 28.6 m/s | 0°~45°, 90° |
| SLC | 12.1 m | 17 s | 51.4 m/s | 0°~45°, 90° |
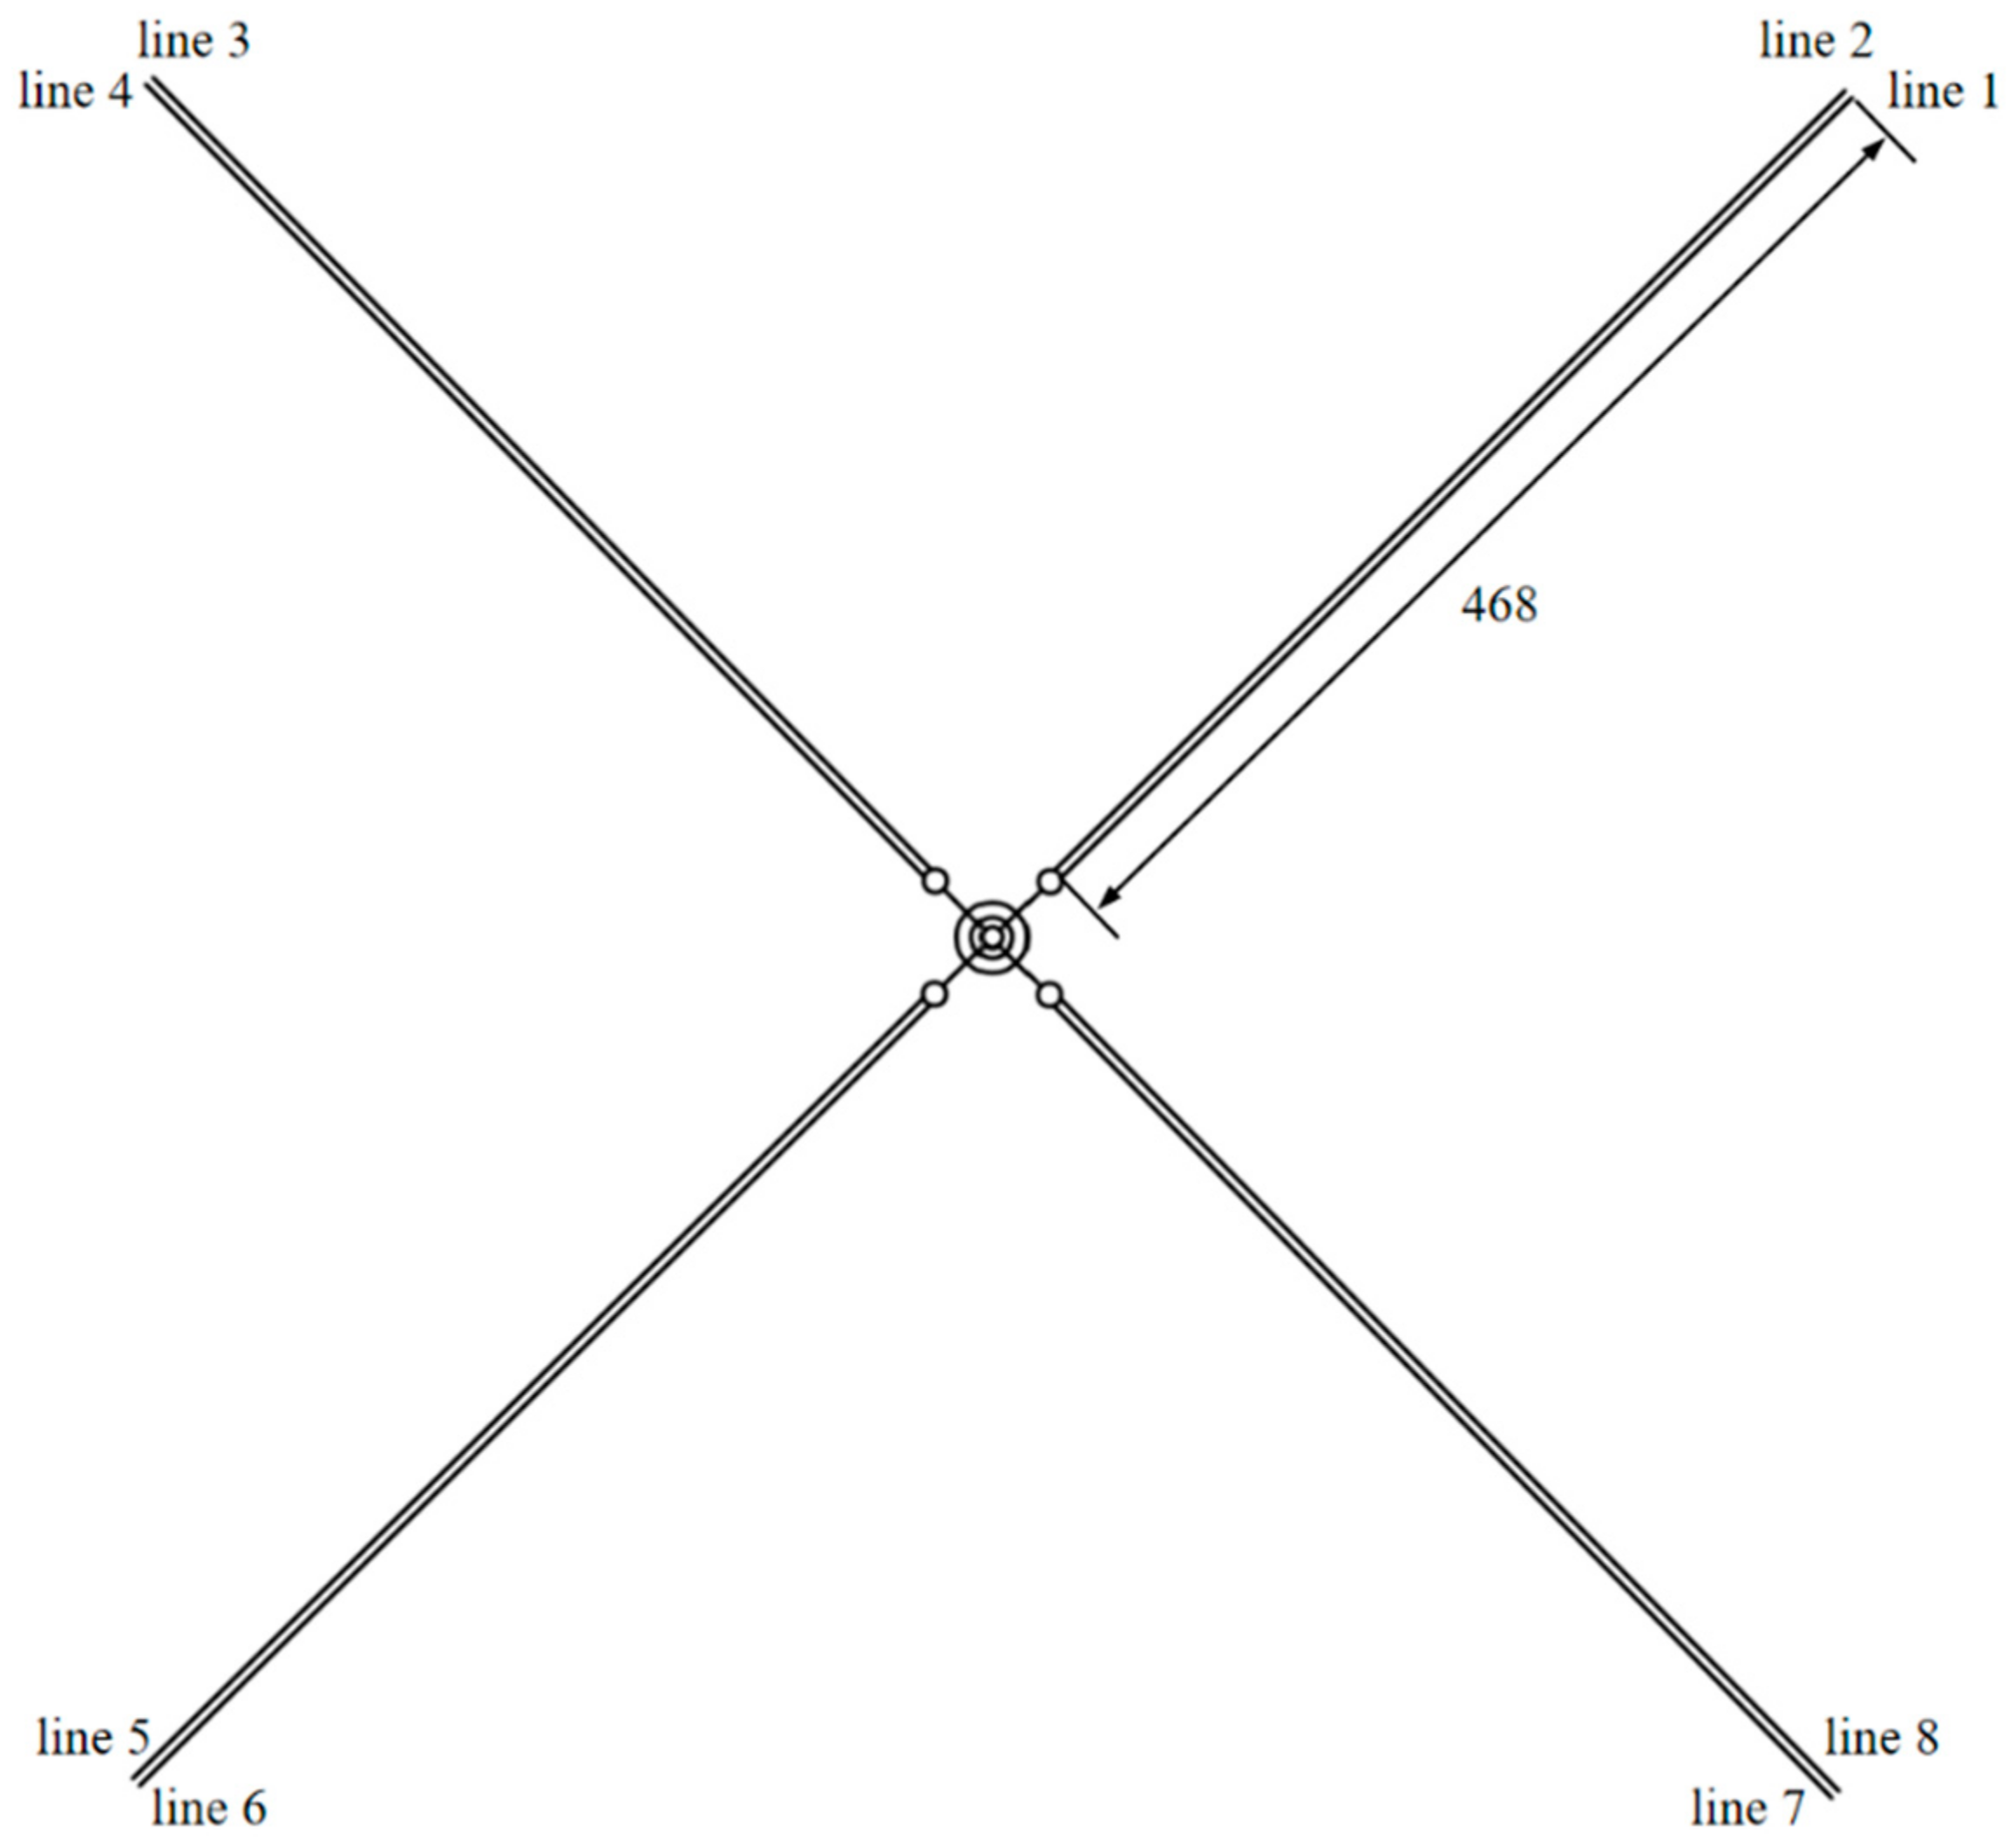
| Mooring Parameters | Value |
|---|---|
| Number of mooring lines | 8 |
| Depth to anchors below SWL | 60 m |
| Depth to fairleads above SWL | 5 m |
| Unstretched mooring line length | 468 m |
| Equivalent mooring line diameter | 0.116 m |
| Wet weight | 296 kg/m |
| Axial stiffness | 5.98 × 10⁸ N |
| Breaking strength | 9.4 × 10⁶ N |
Disclaimer/Publisher’s Note: The statements, opinions and data contained in all publications are solely those of the individual author(s) and contributor(s) and not of MDPI and/or the editor(s). MDPI and/or the editor(s) disclaim responsibility for any injury to people or property resulting from any ideas, methods, instructions or products referred to in the content. |
© 2024 by the authors. Licensee MDPI, Basel, Switzerland. This article is an open access article distributed under the terms and conditions of the Creative Commons Attribution (CC BY) license (https://creativecommons.org/licenses/by/4.0/).
Share and Cite
Shen, Y.; Liu, J.; Yan, X.; Liu, H.; Li, Y.; Wang, X. A Novel 10 MW Floating Wind Turbine Platform—SparFloat: Conceptual Design and Dynamic Response Analysis. J. Mar. Sci. Eng. 2024, 12, 2278. https://doi.org/10.3390/jmse12122278
Shen Y, Liu J, Yan X, Liu H, Li Y, Wang X. A Novel 10 MW Floating Wind Turbine Platform—SparFloat: Conceptual Design and Dynamic Response Analysis. Journal of Marine Science and Engineering. 2024; 12(12):2278. https://doi.org/10.3390/jmse12122278
Chicago/Turabian StyleShen, Yong, Jian Liu, Xingchun Yan, Huaxing Liu, Yajie Li, and Xikun Wang. 2024. "A Novel 10 MW Floating Wind Turbine Platform—SparFloat: Conceptual Design and Dynamic Response Analysis" Journal of Marine Science and Engineering 12, no. 12: 2278. https://doi.org/10.3390/jmse12122278
APA StyleShen, Y., Liu, J., Yan, X., Liu, H., Li, Y., & Wang, X. (2024). A Novel 10 MW Floating Wind Turbine Platform—SparFloat: Conceptual Design and Dynamic Response Analysis. Journal of Marine Science and Engineering, 12(12), 2278. https://doi.org/10.3390/jmse12122278