
One-Way CFD/FEM Analysis of a Fish Cage in Current Conditions


Abstract
1. Introduction
2. Numerical Approach
2.1. Governing Equations
- Continuity equation:
- Momentum equation:
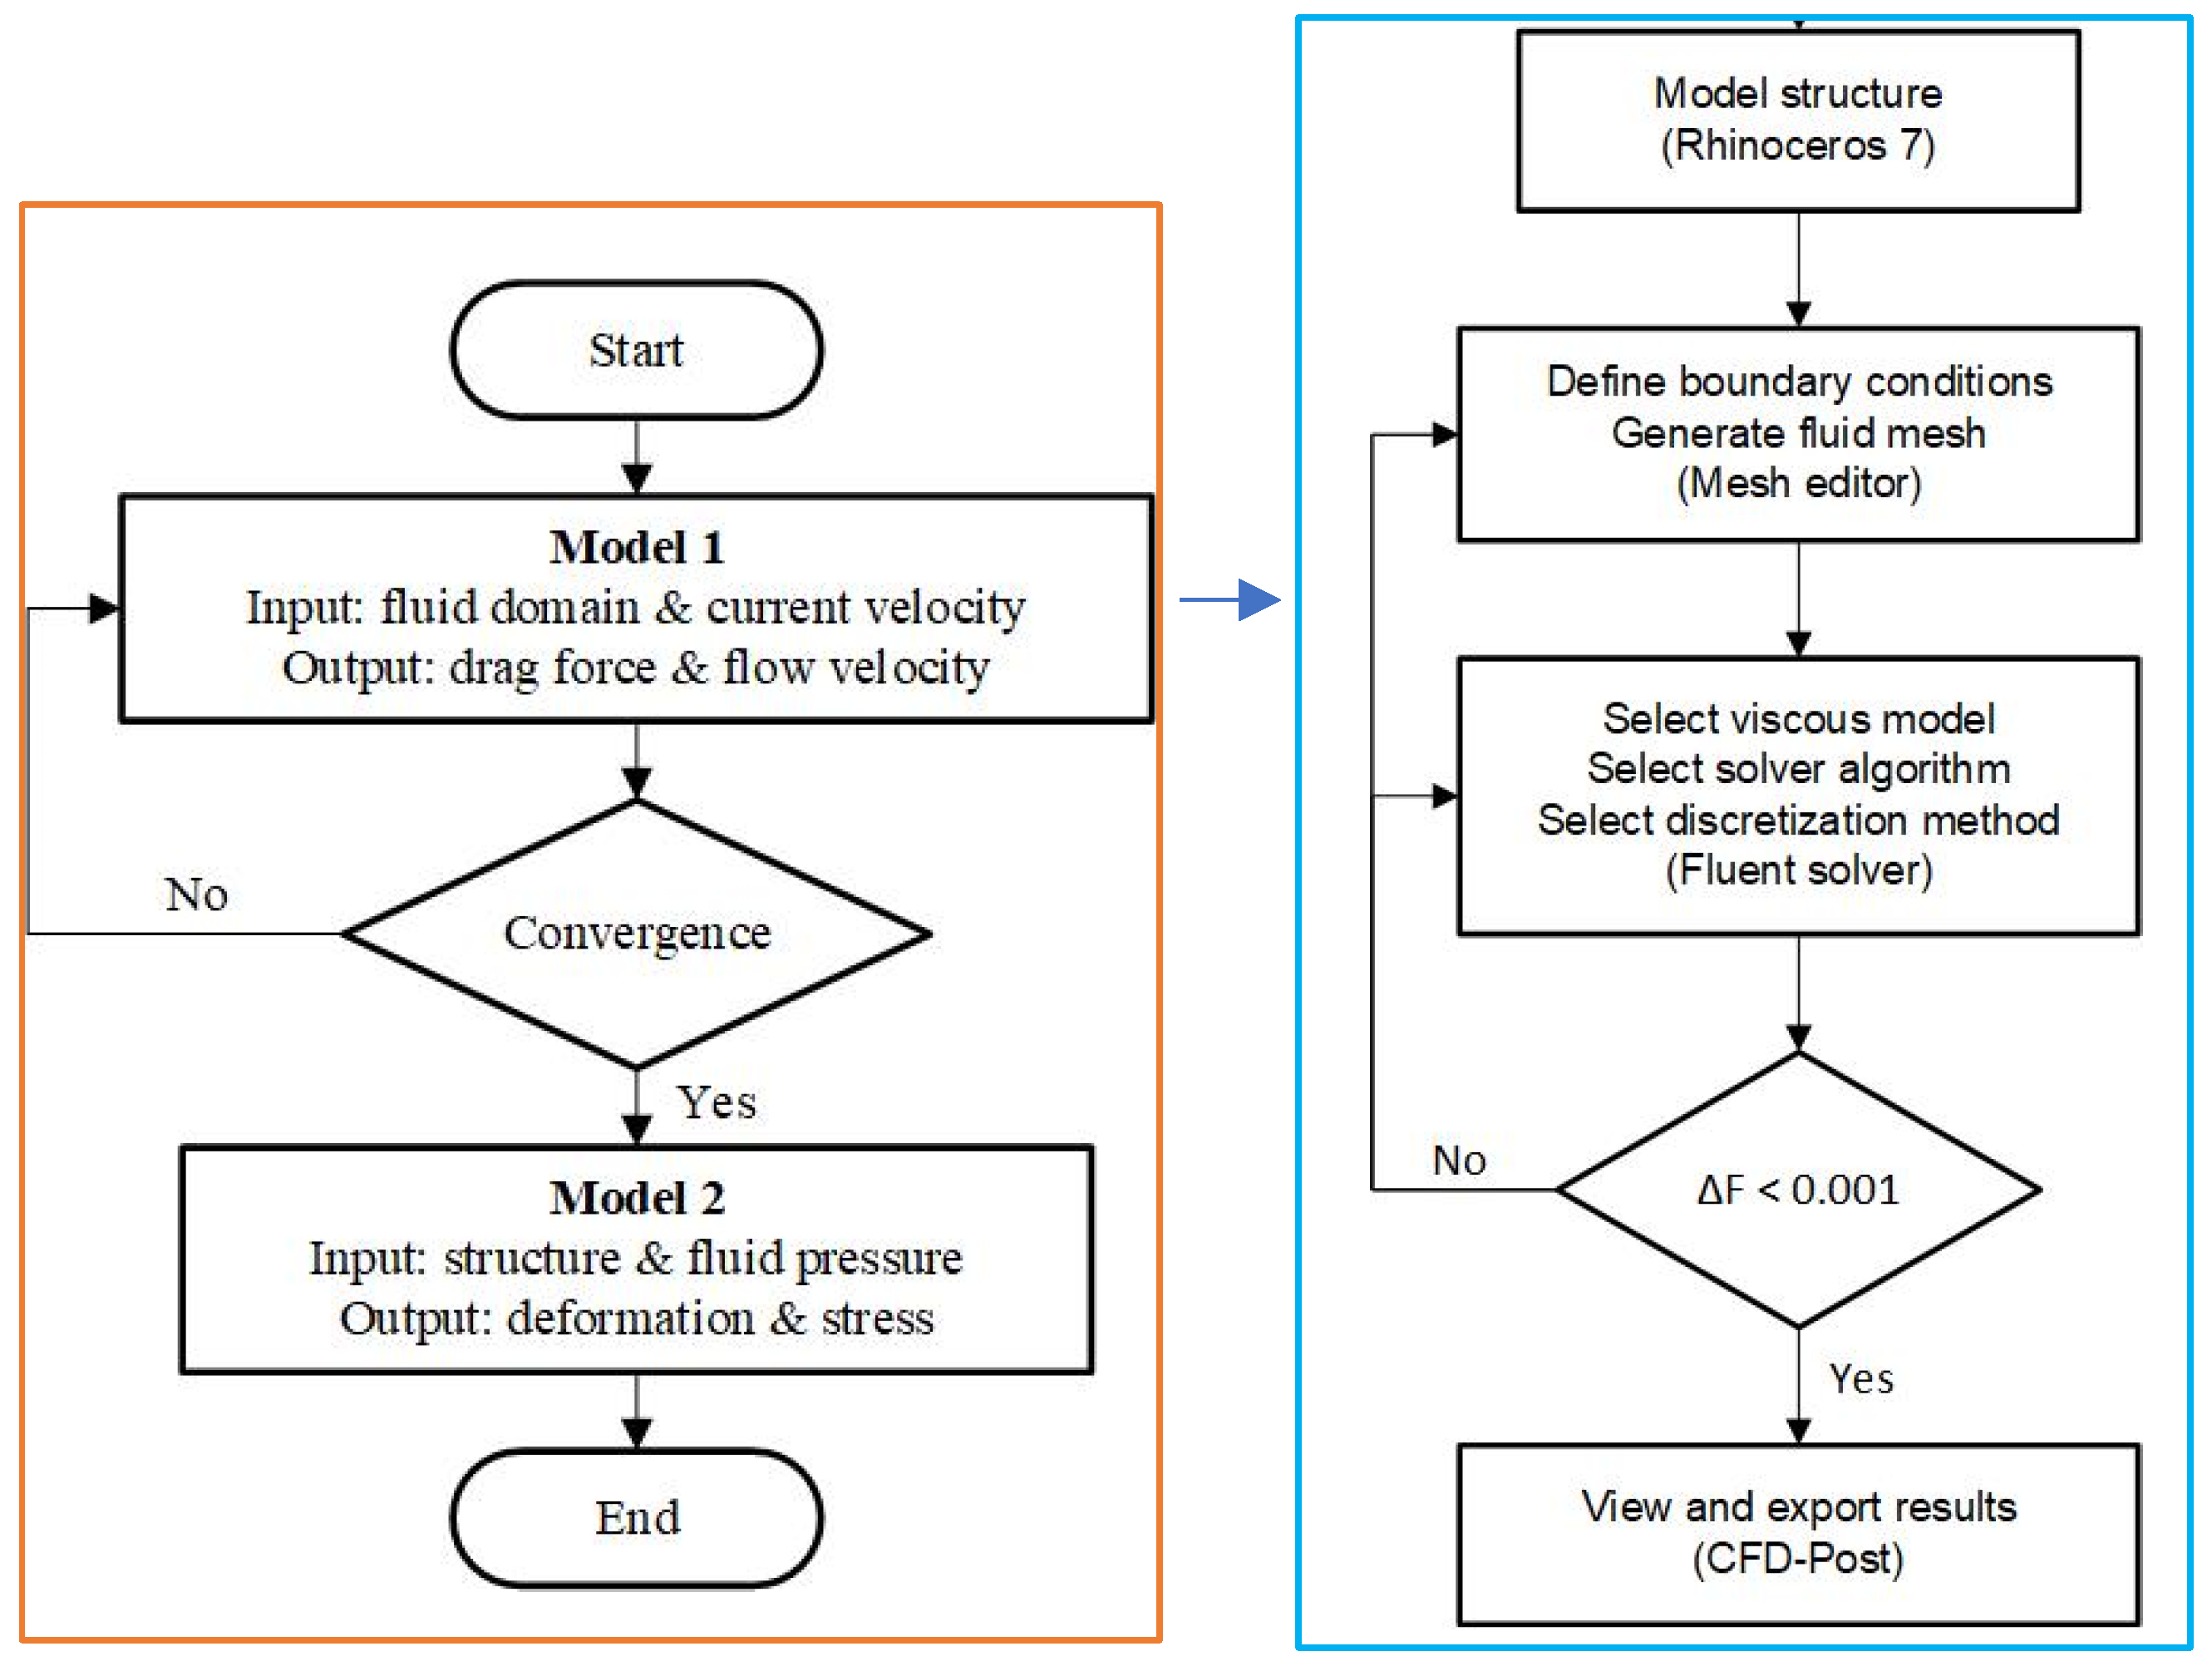
2.2. Numerical Model
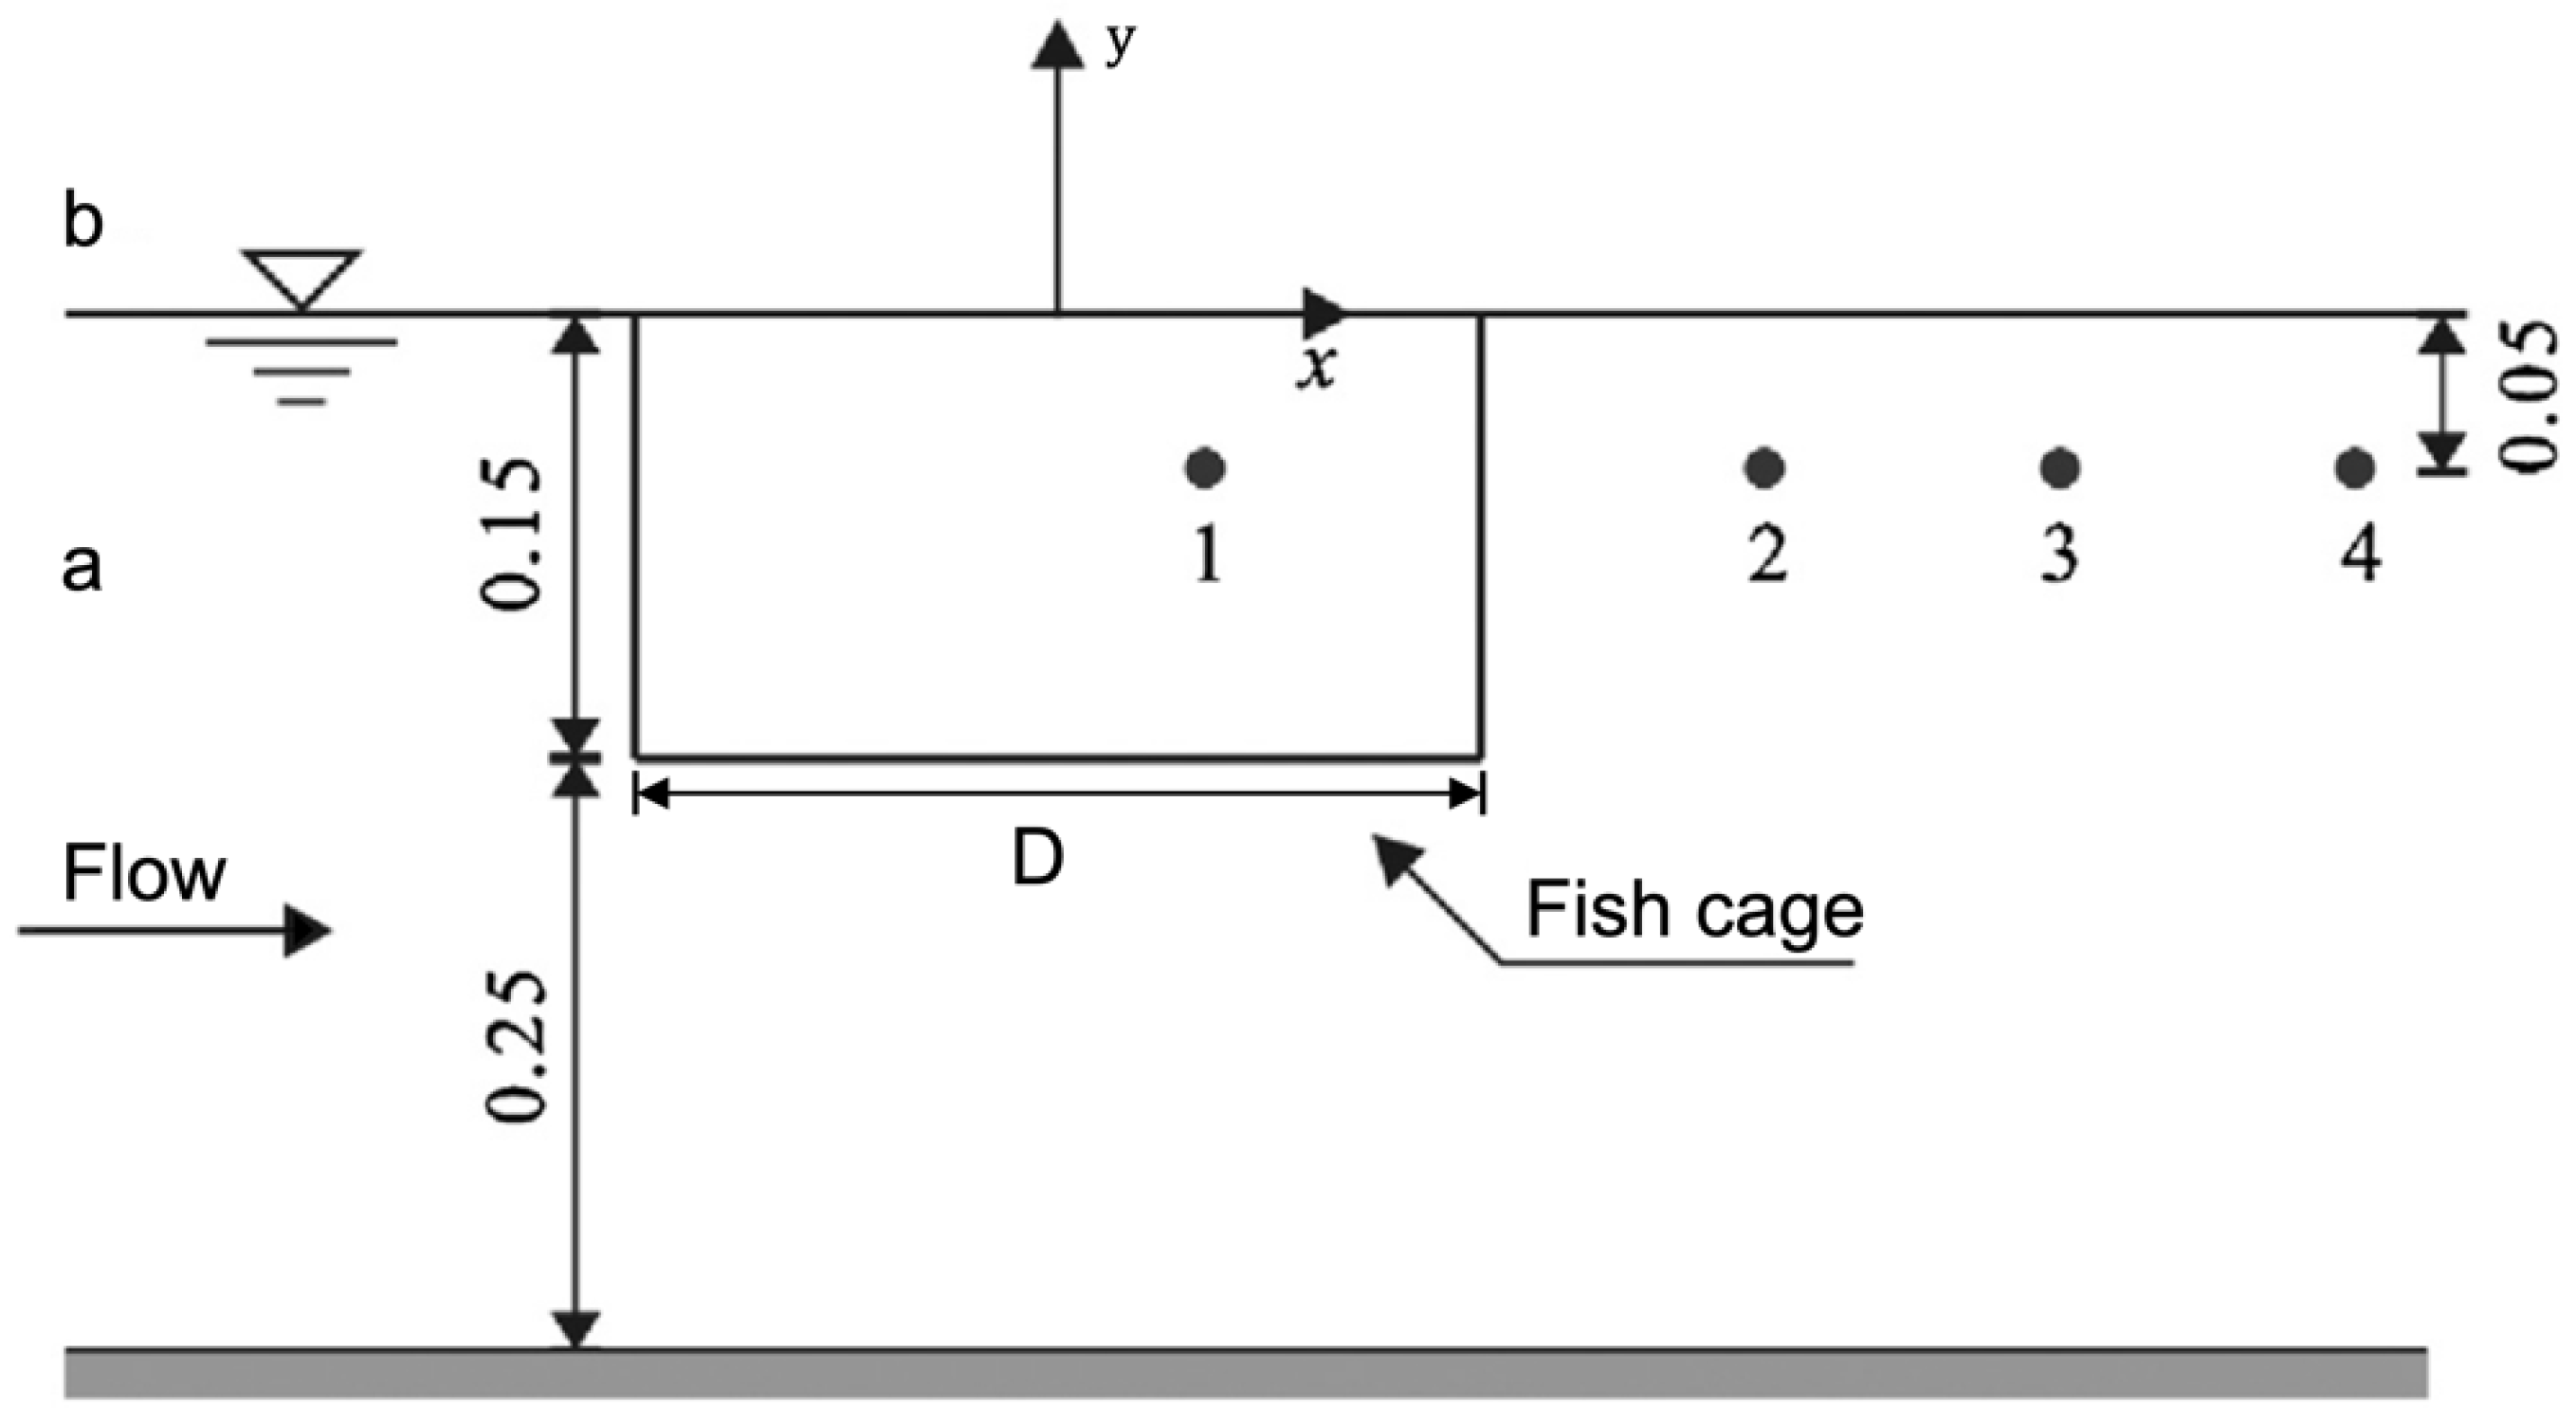
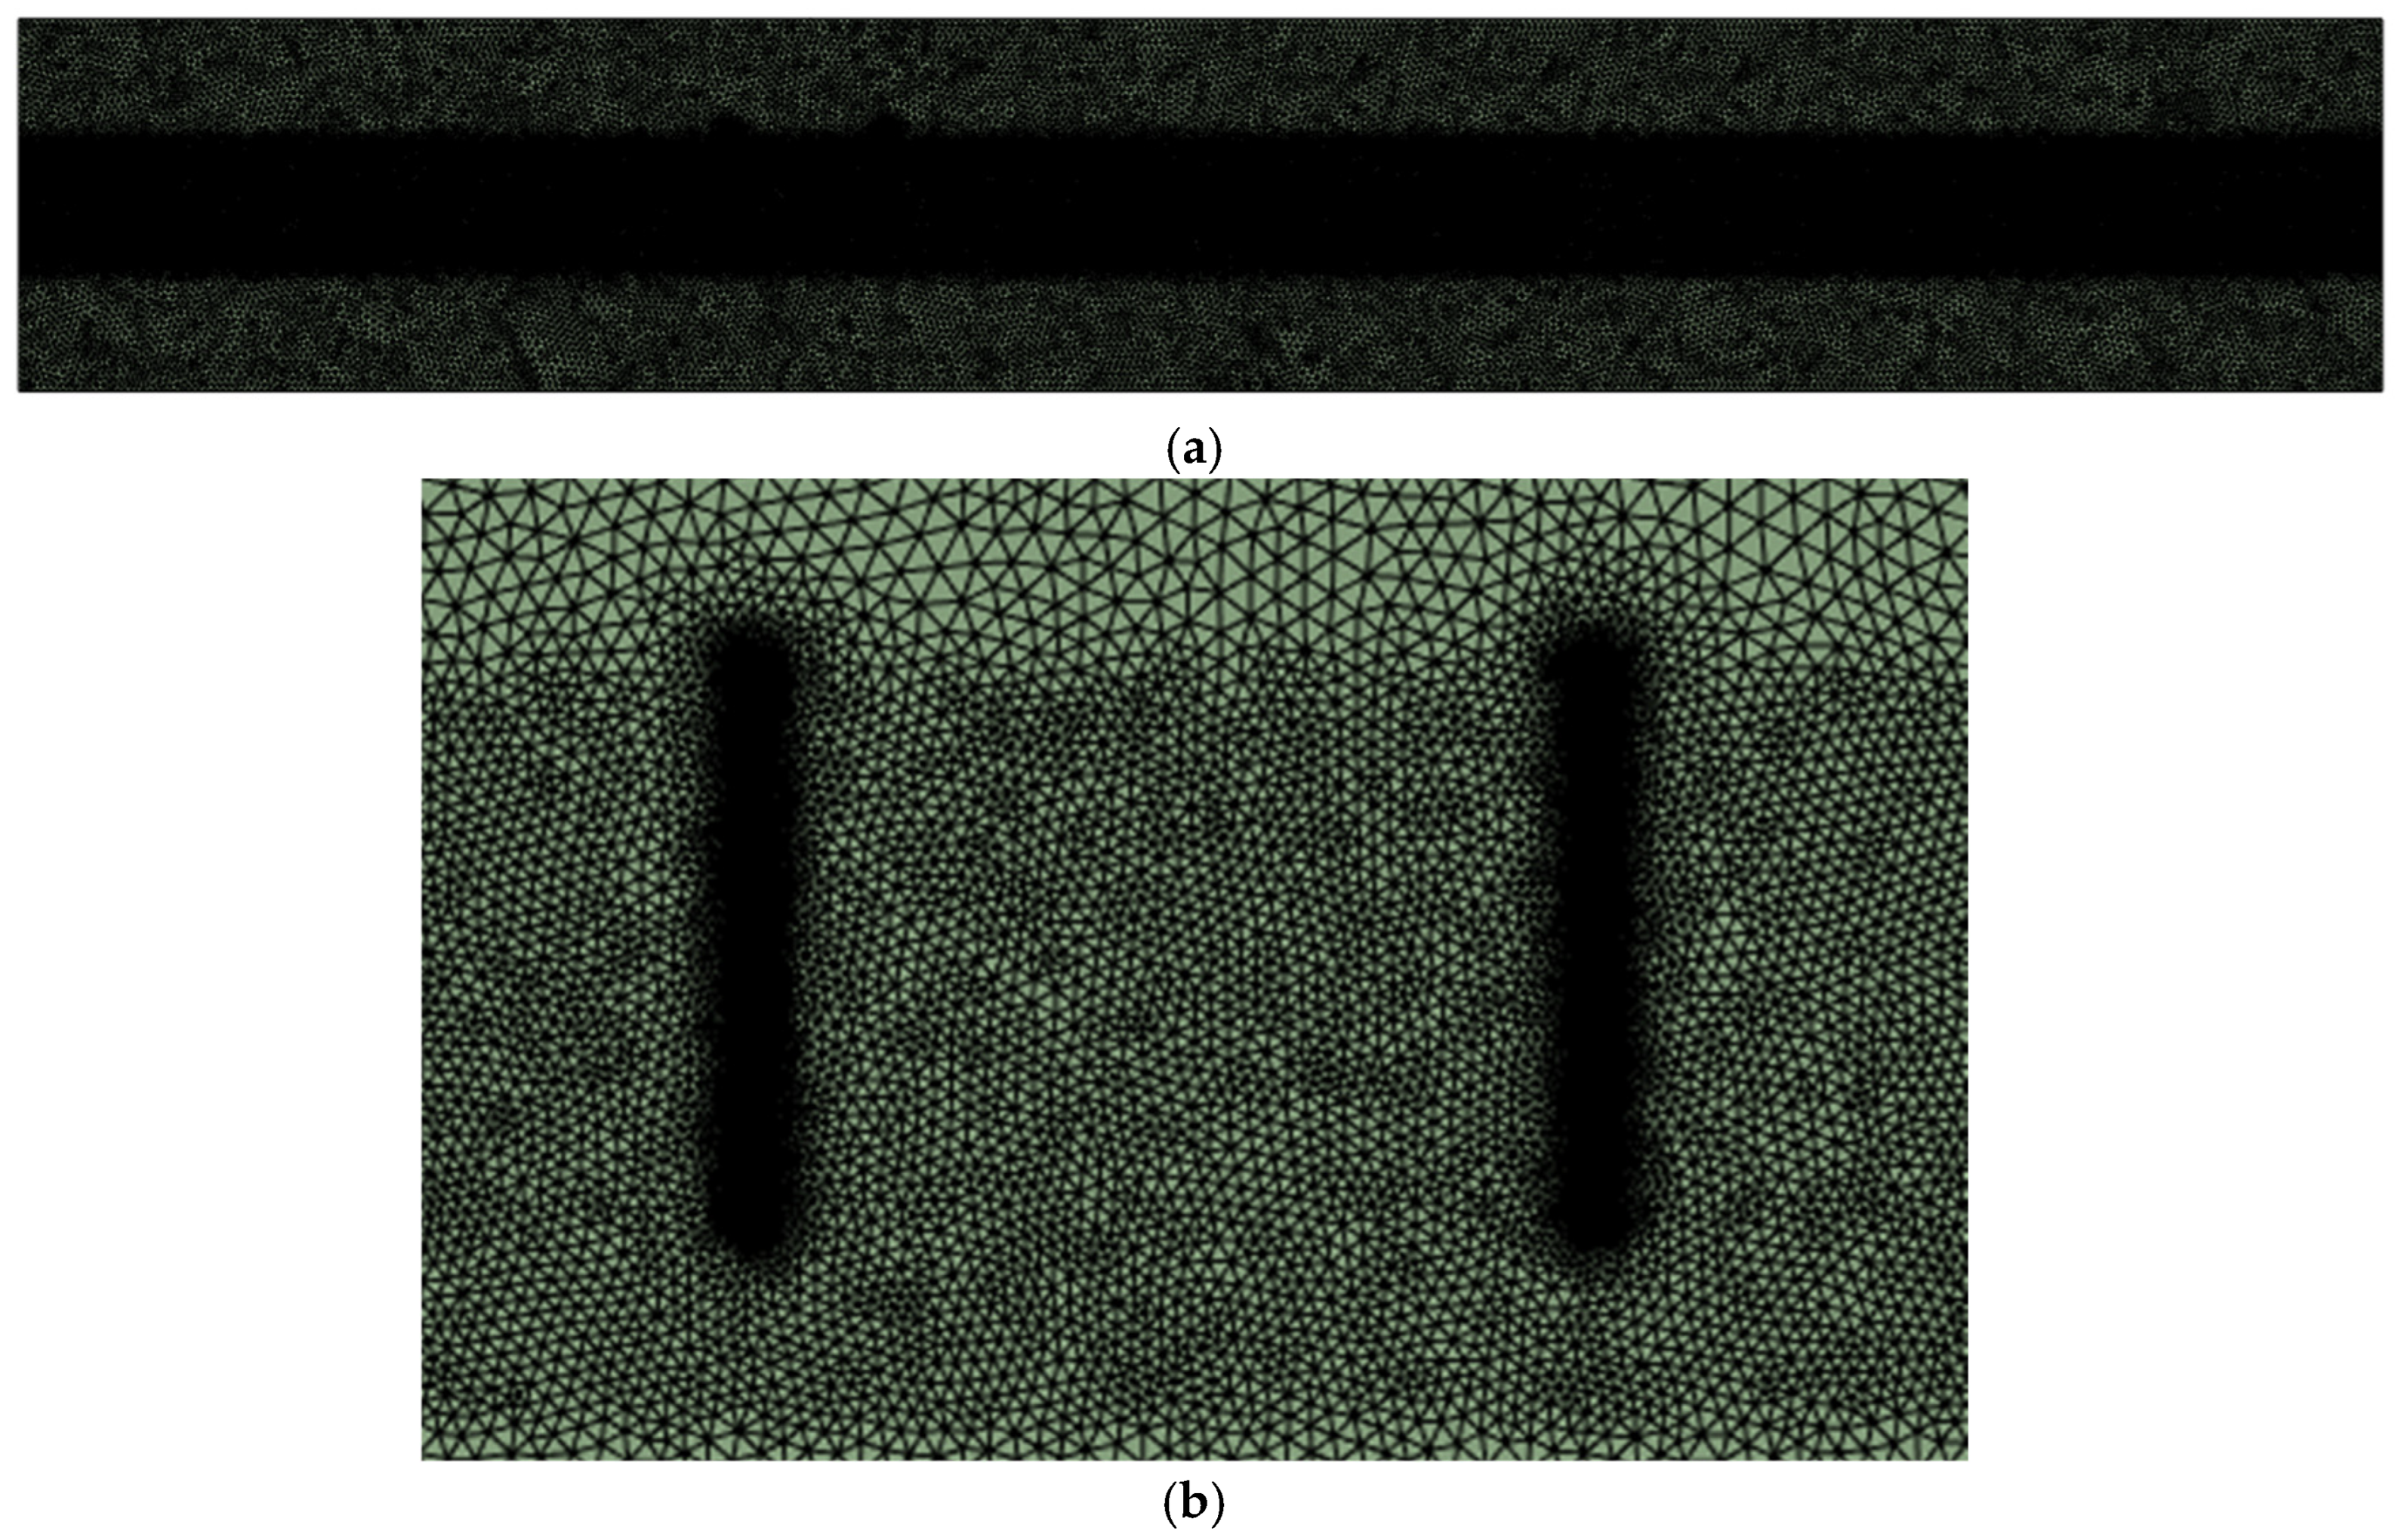
2.2.1. Numerical Setup for Fluid Solver
2.2.2. Structural Model
3. Results and Discussions
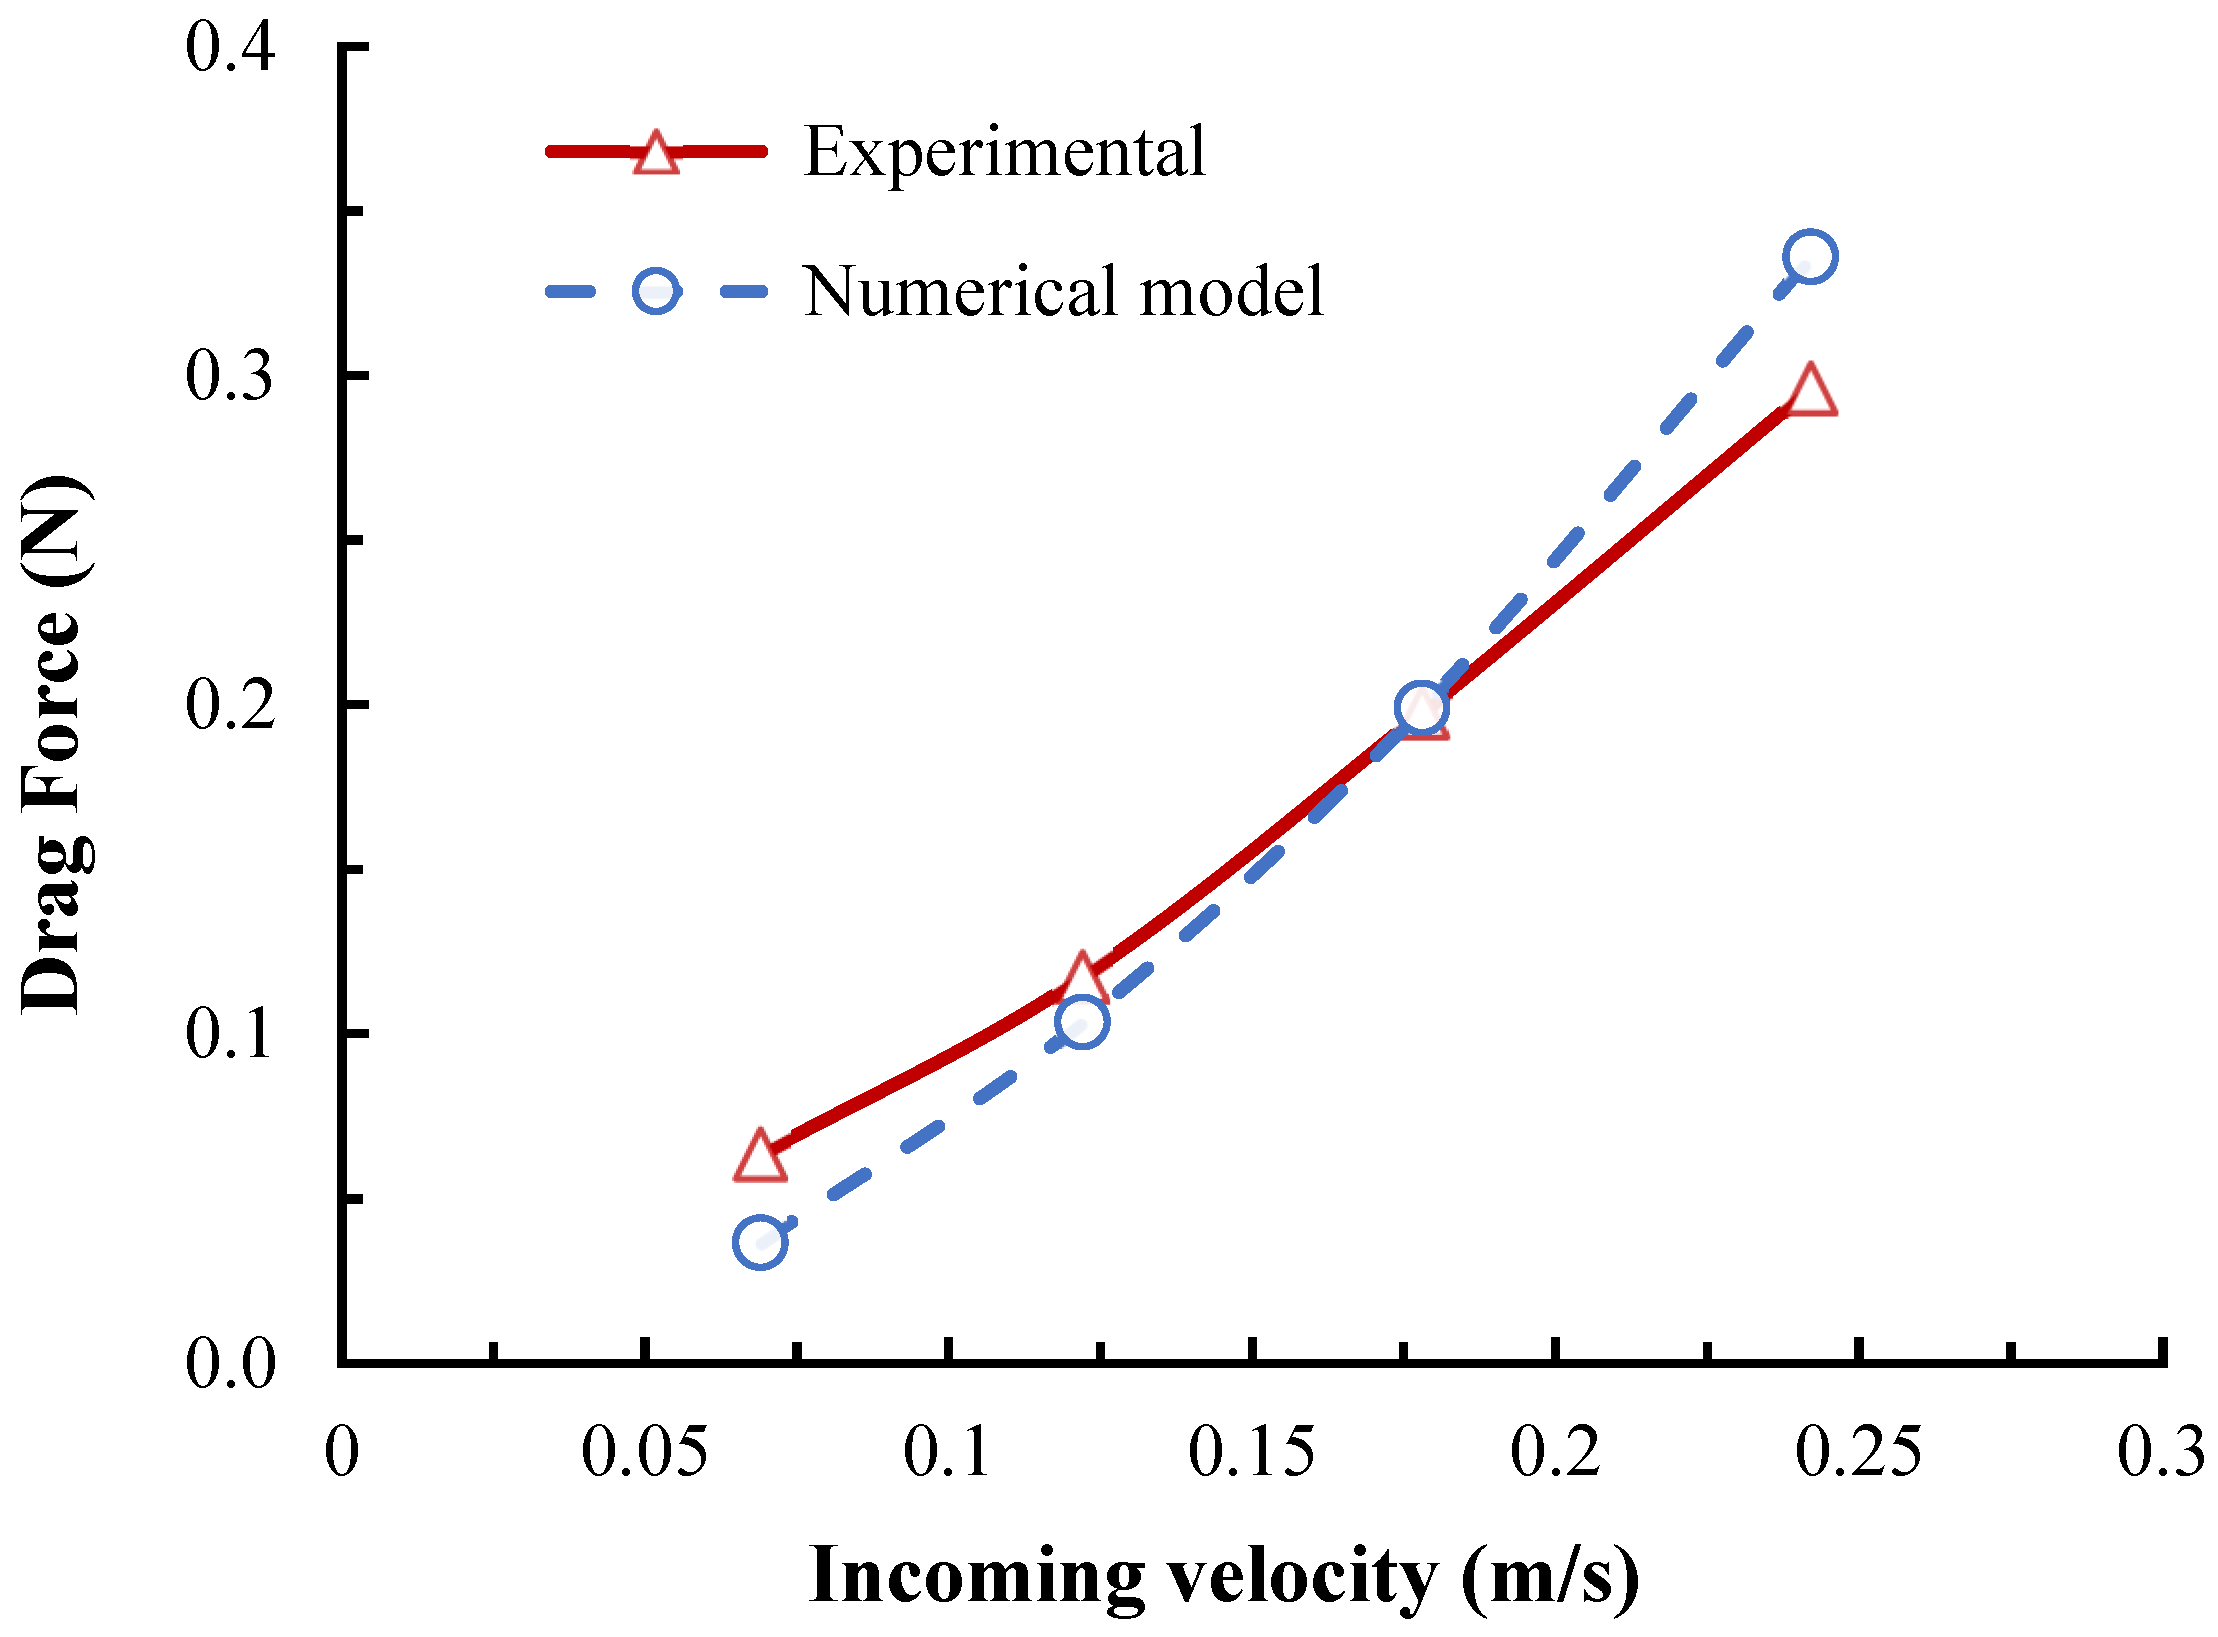
3.1. Drag Force
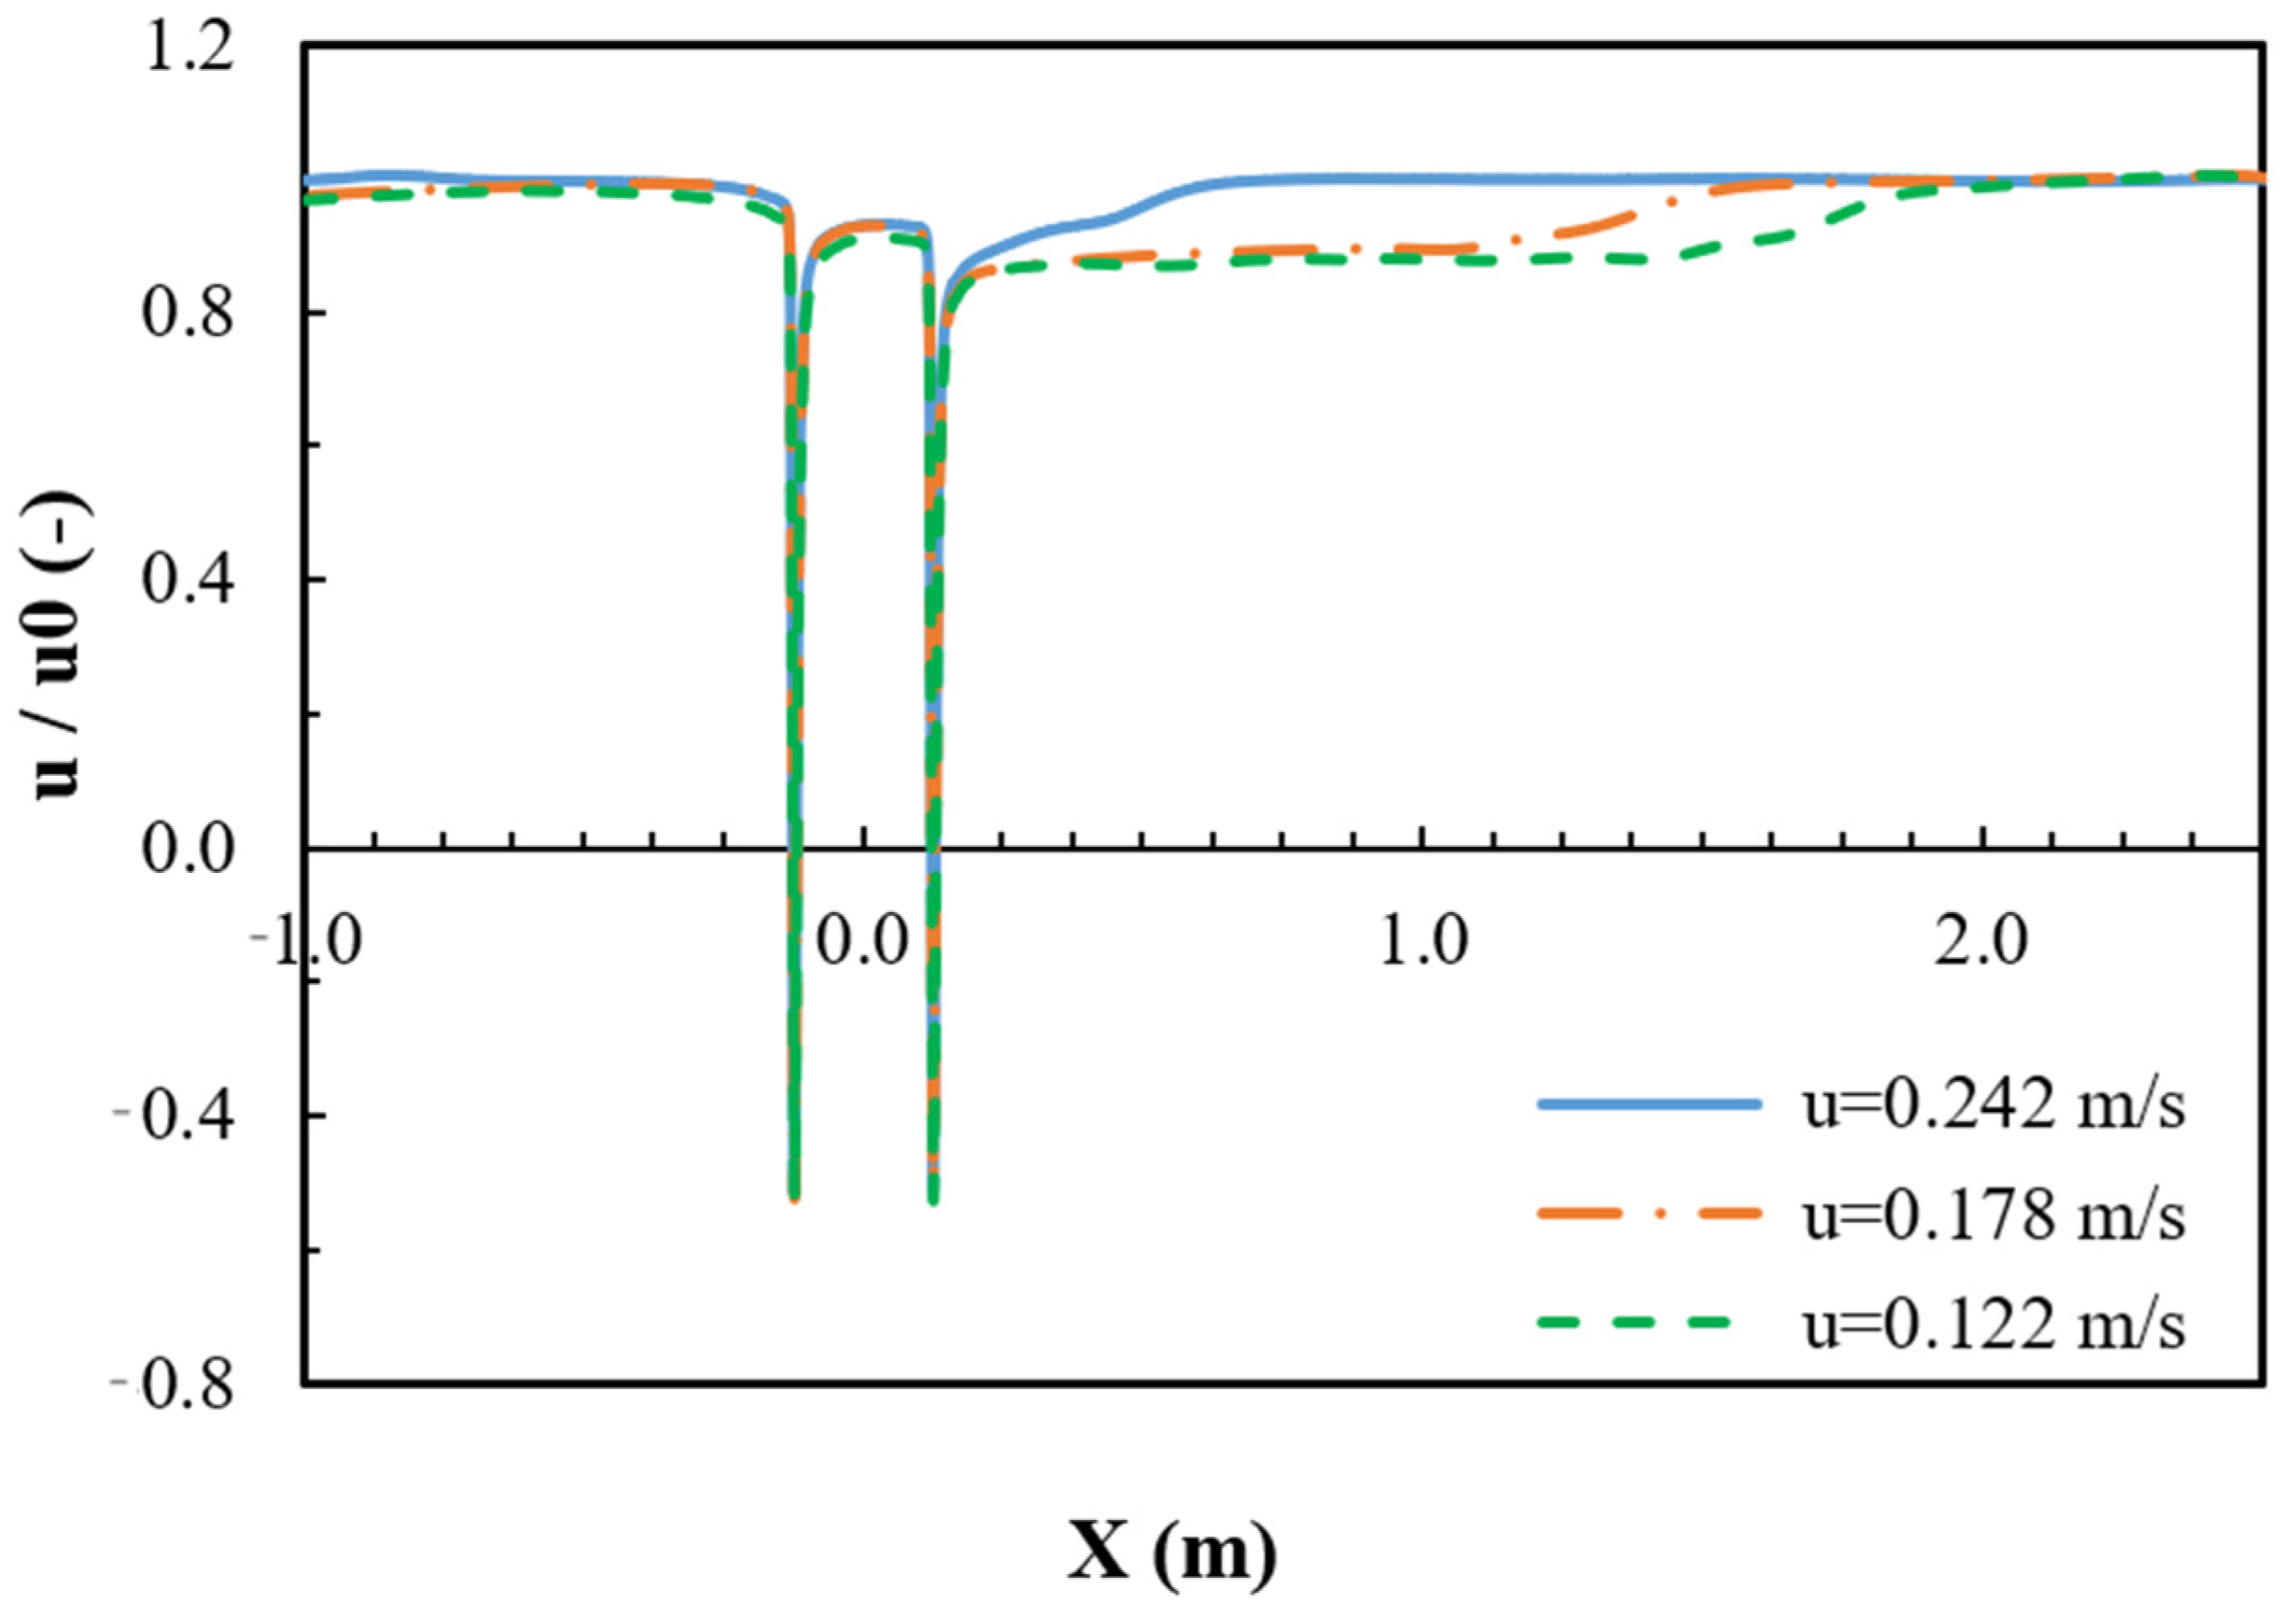
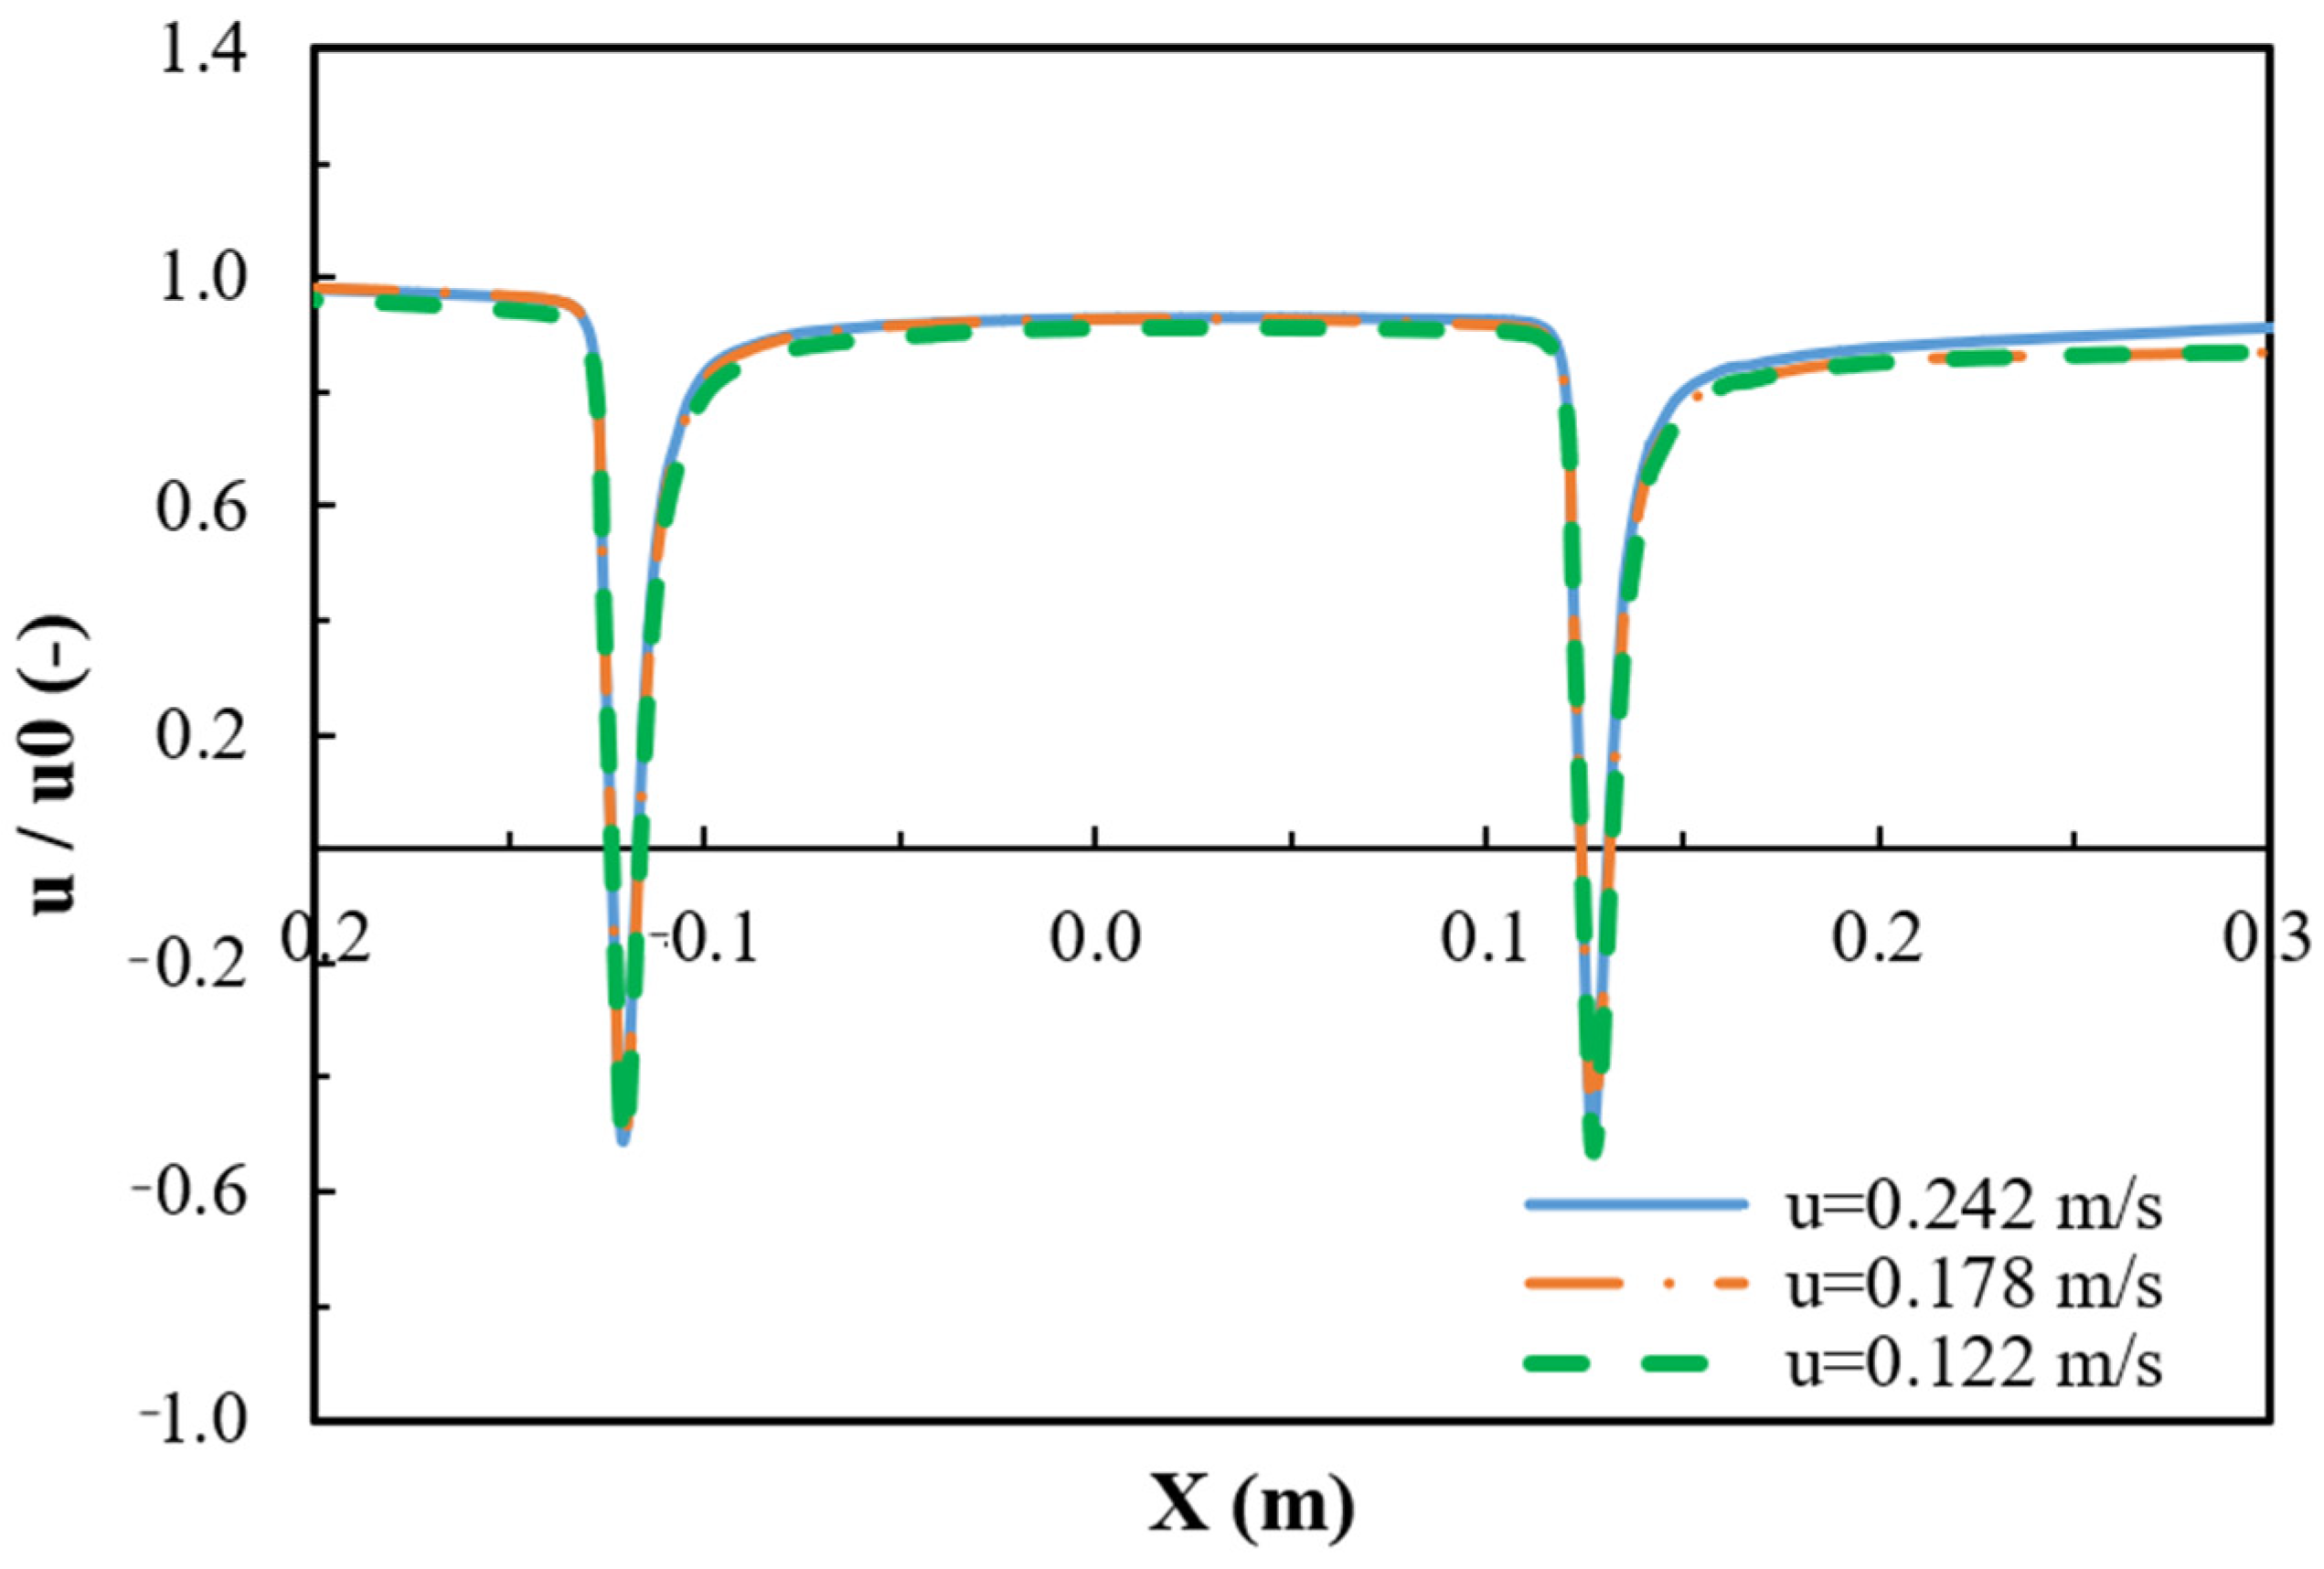
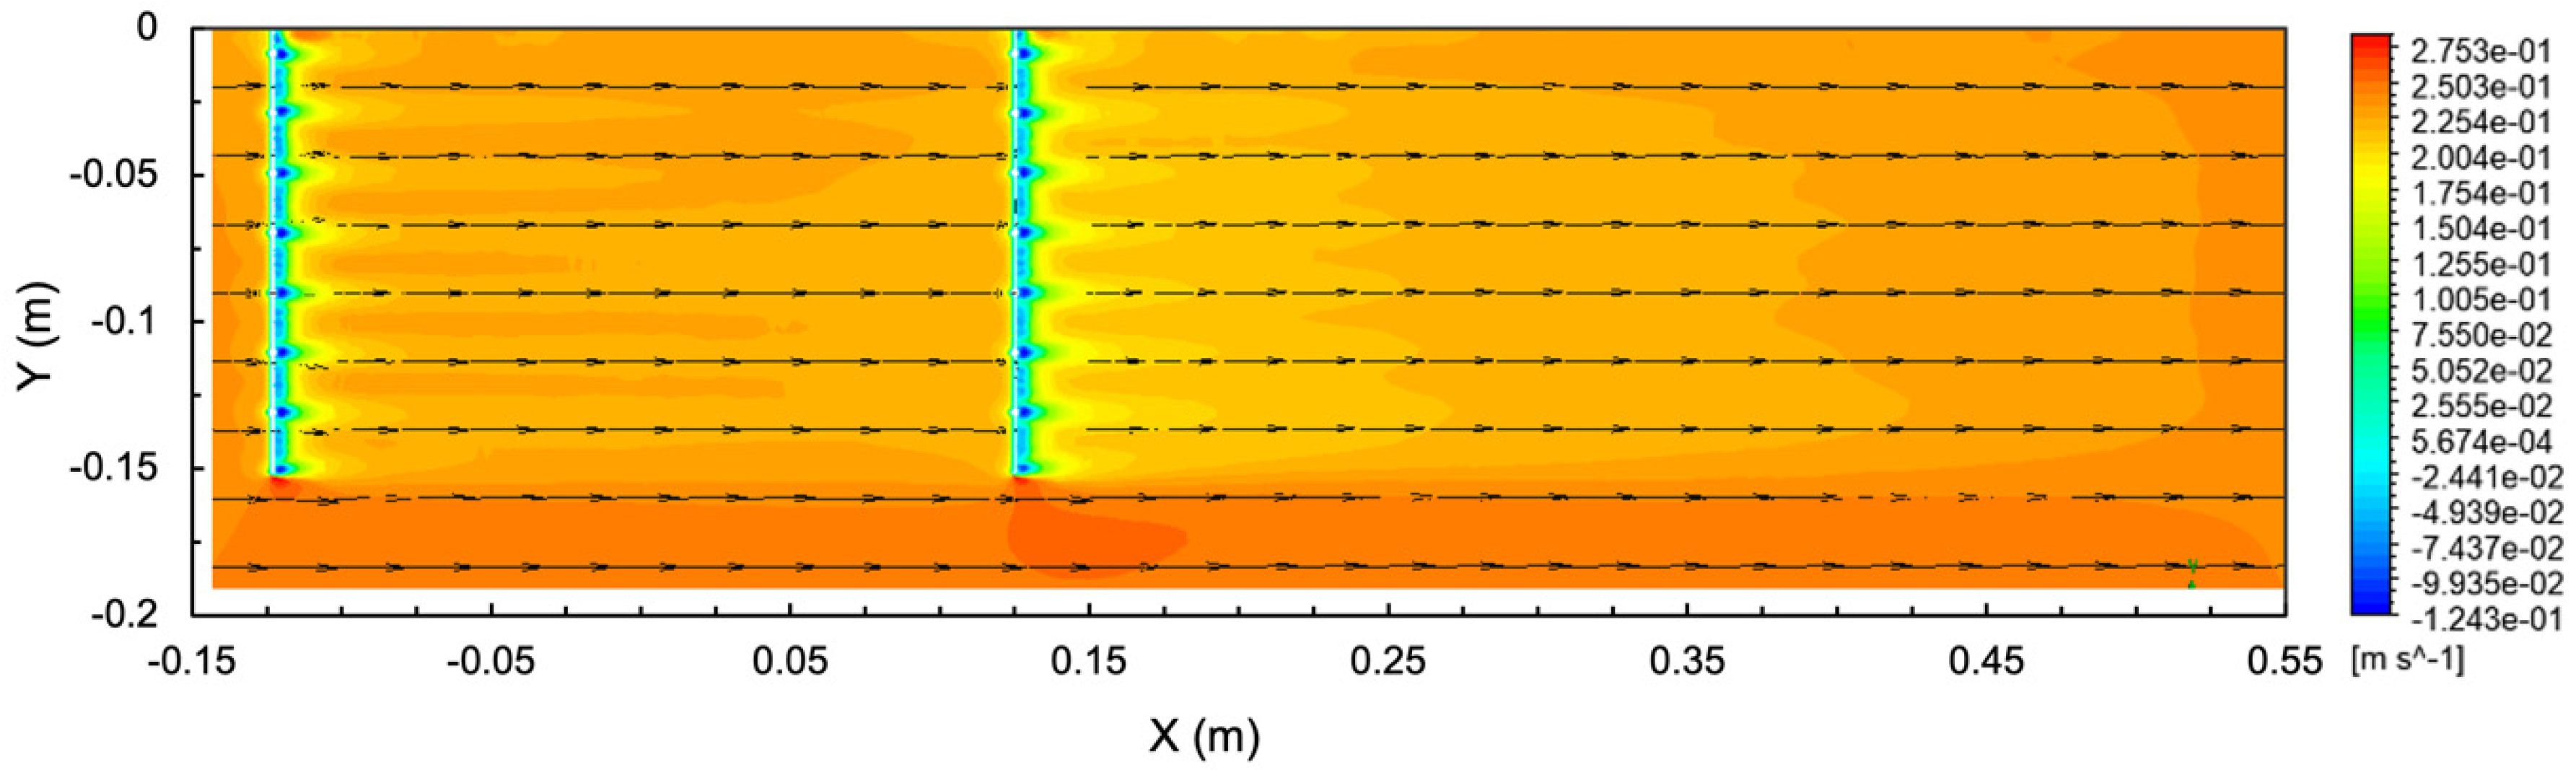
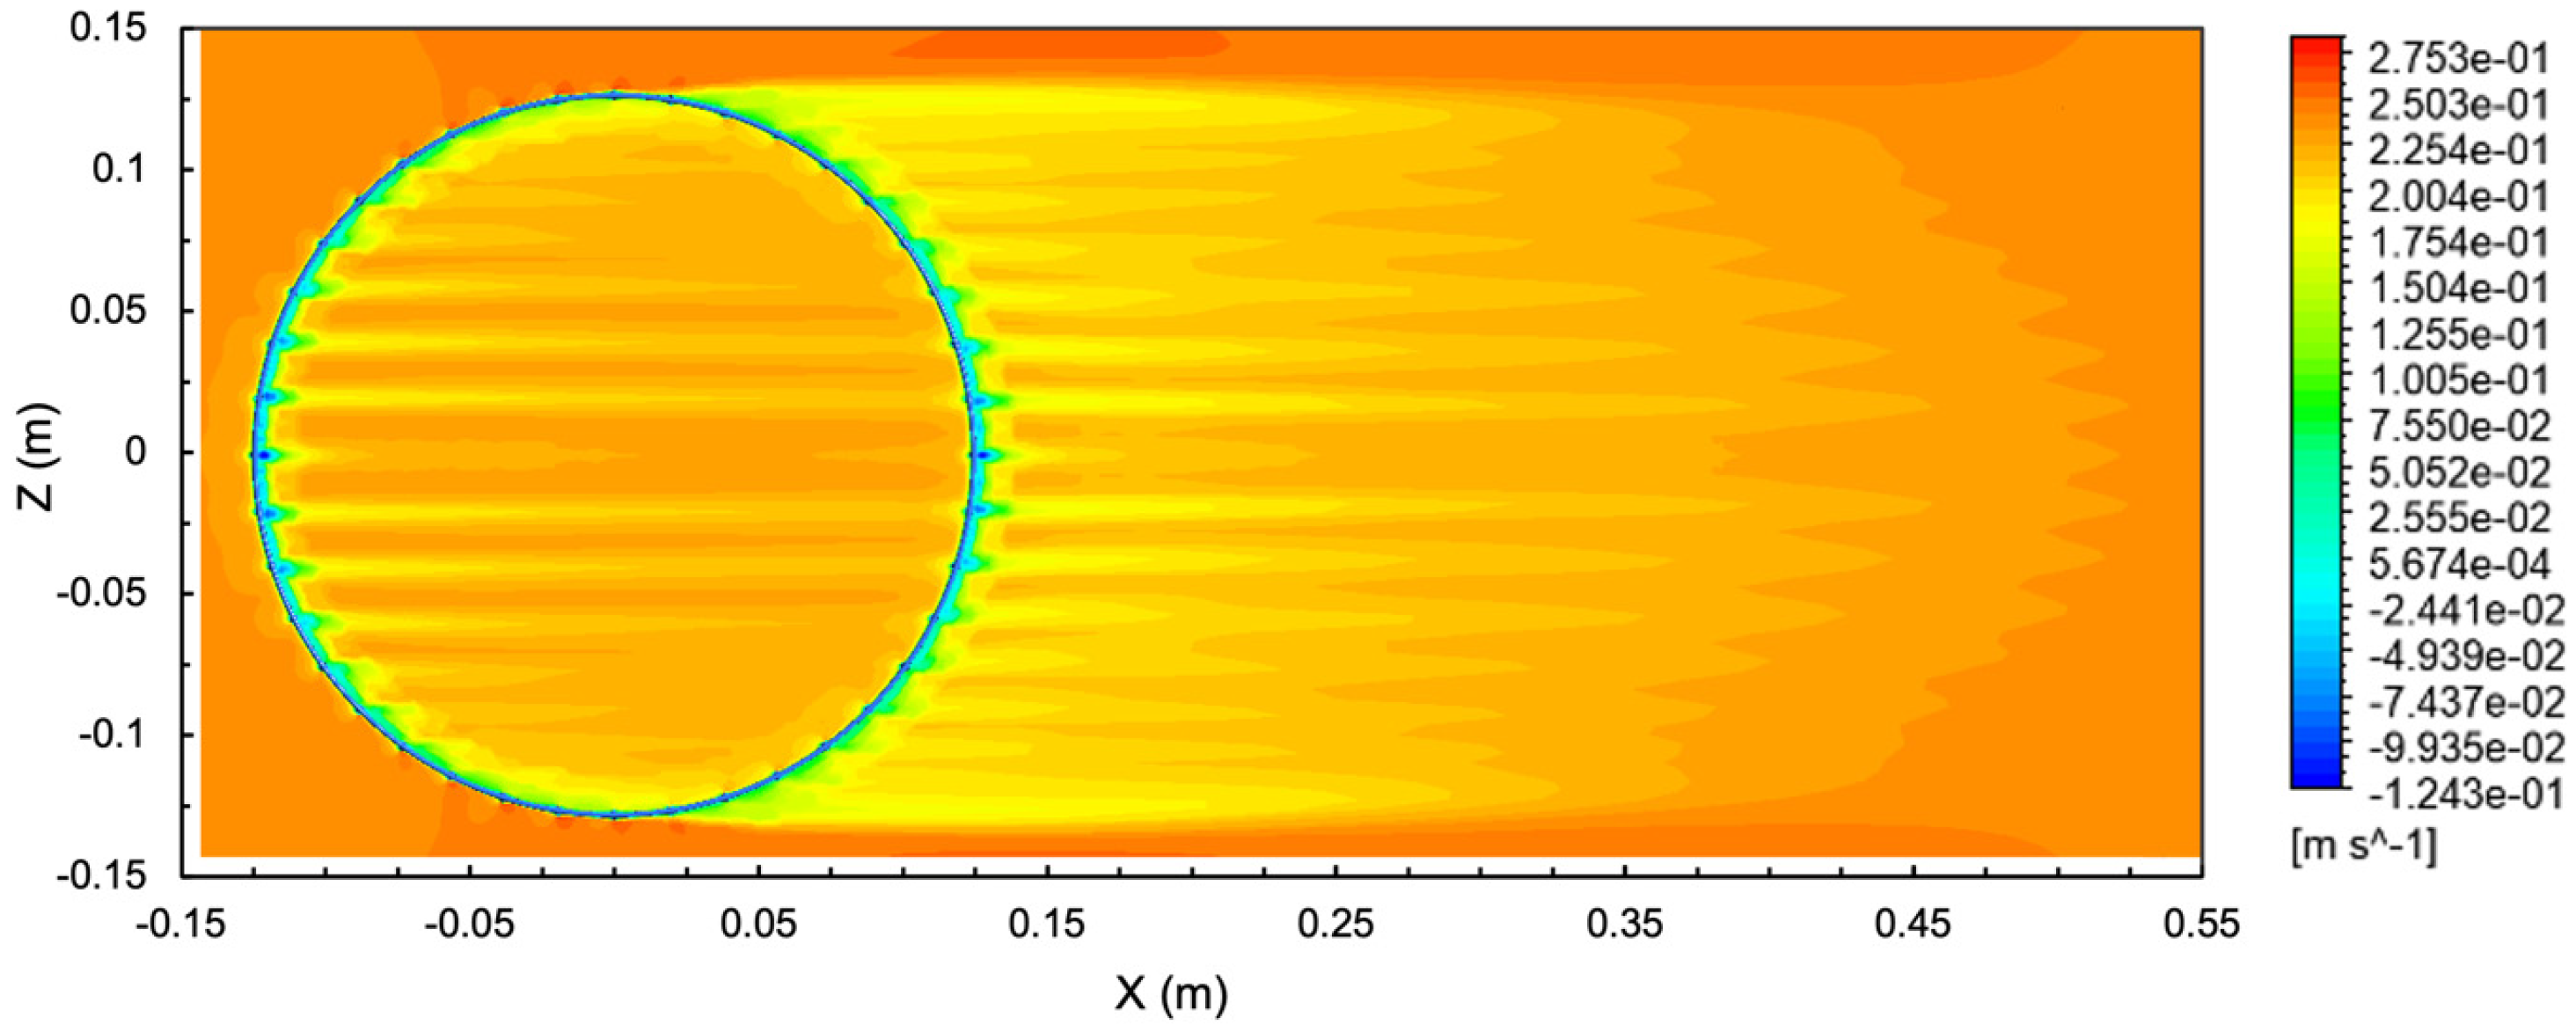
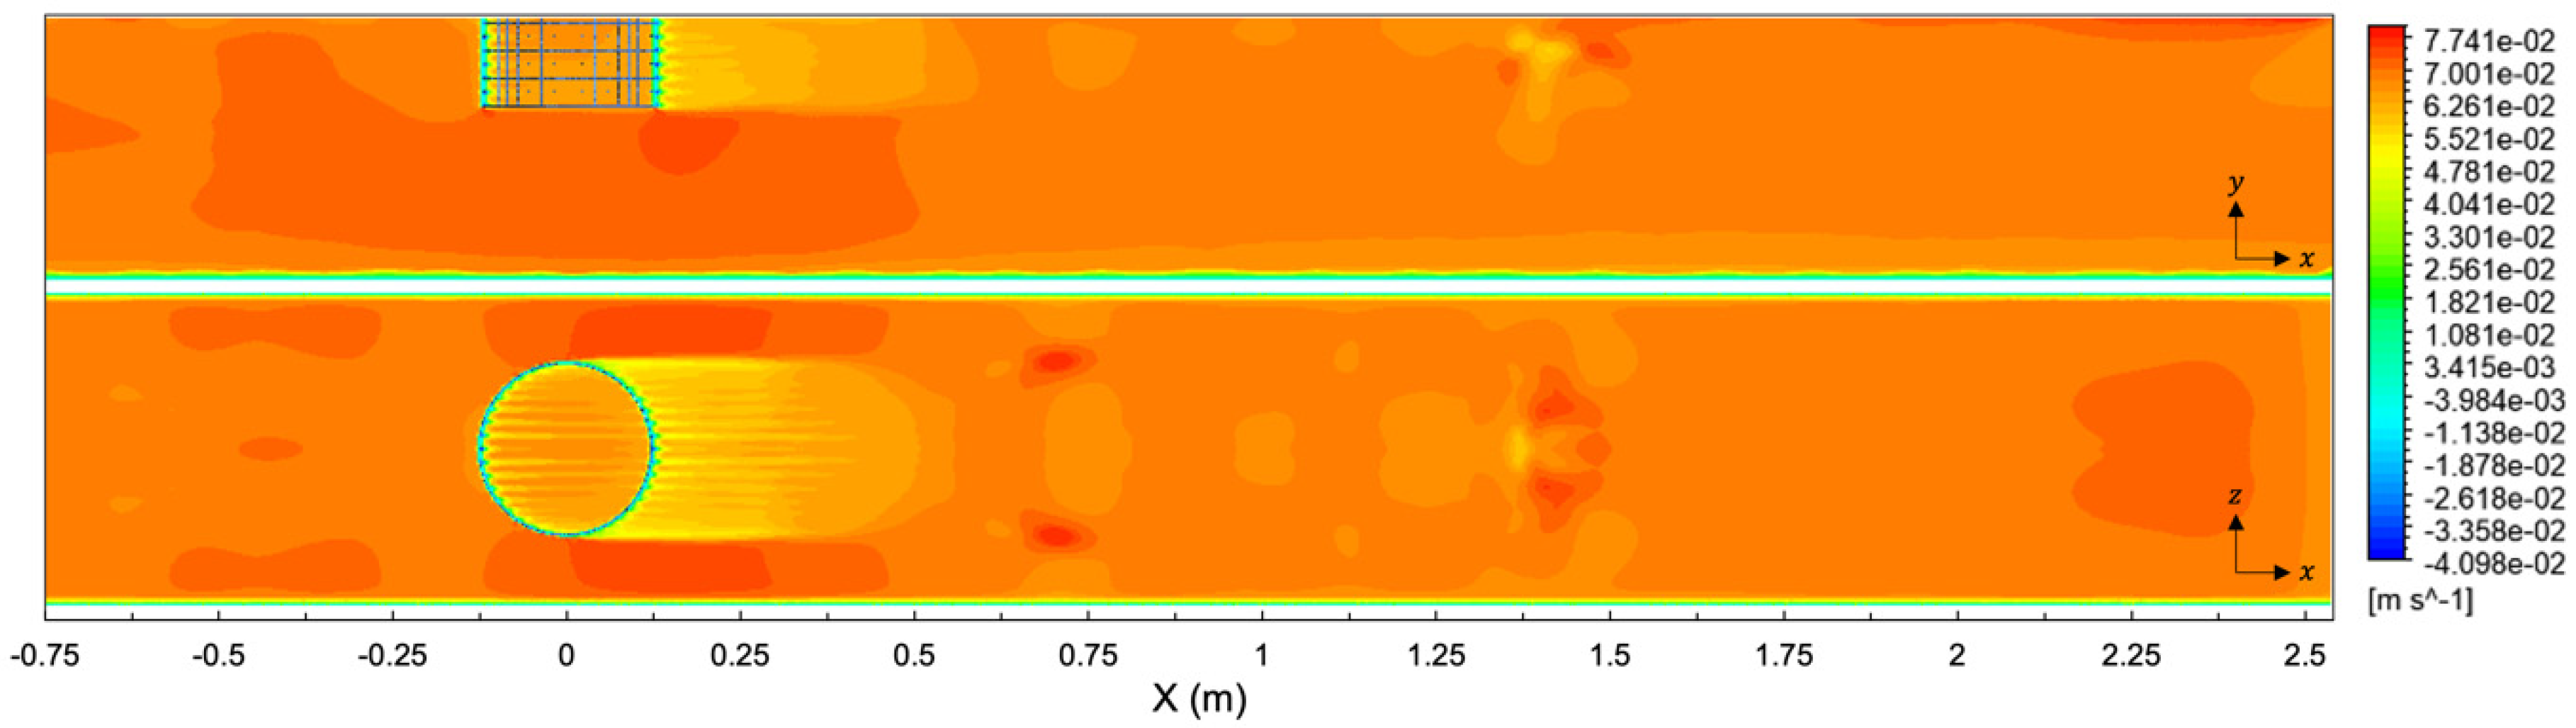
3.2. Flow Velocity
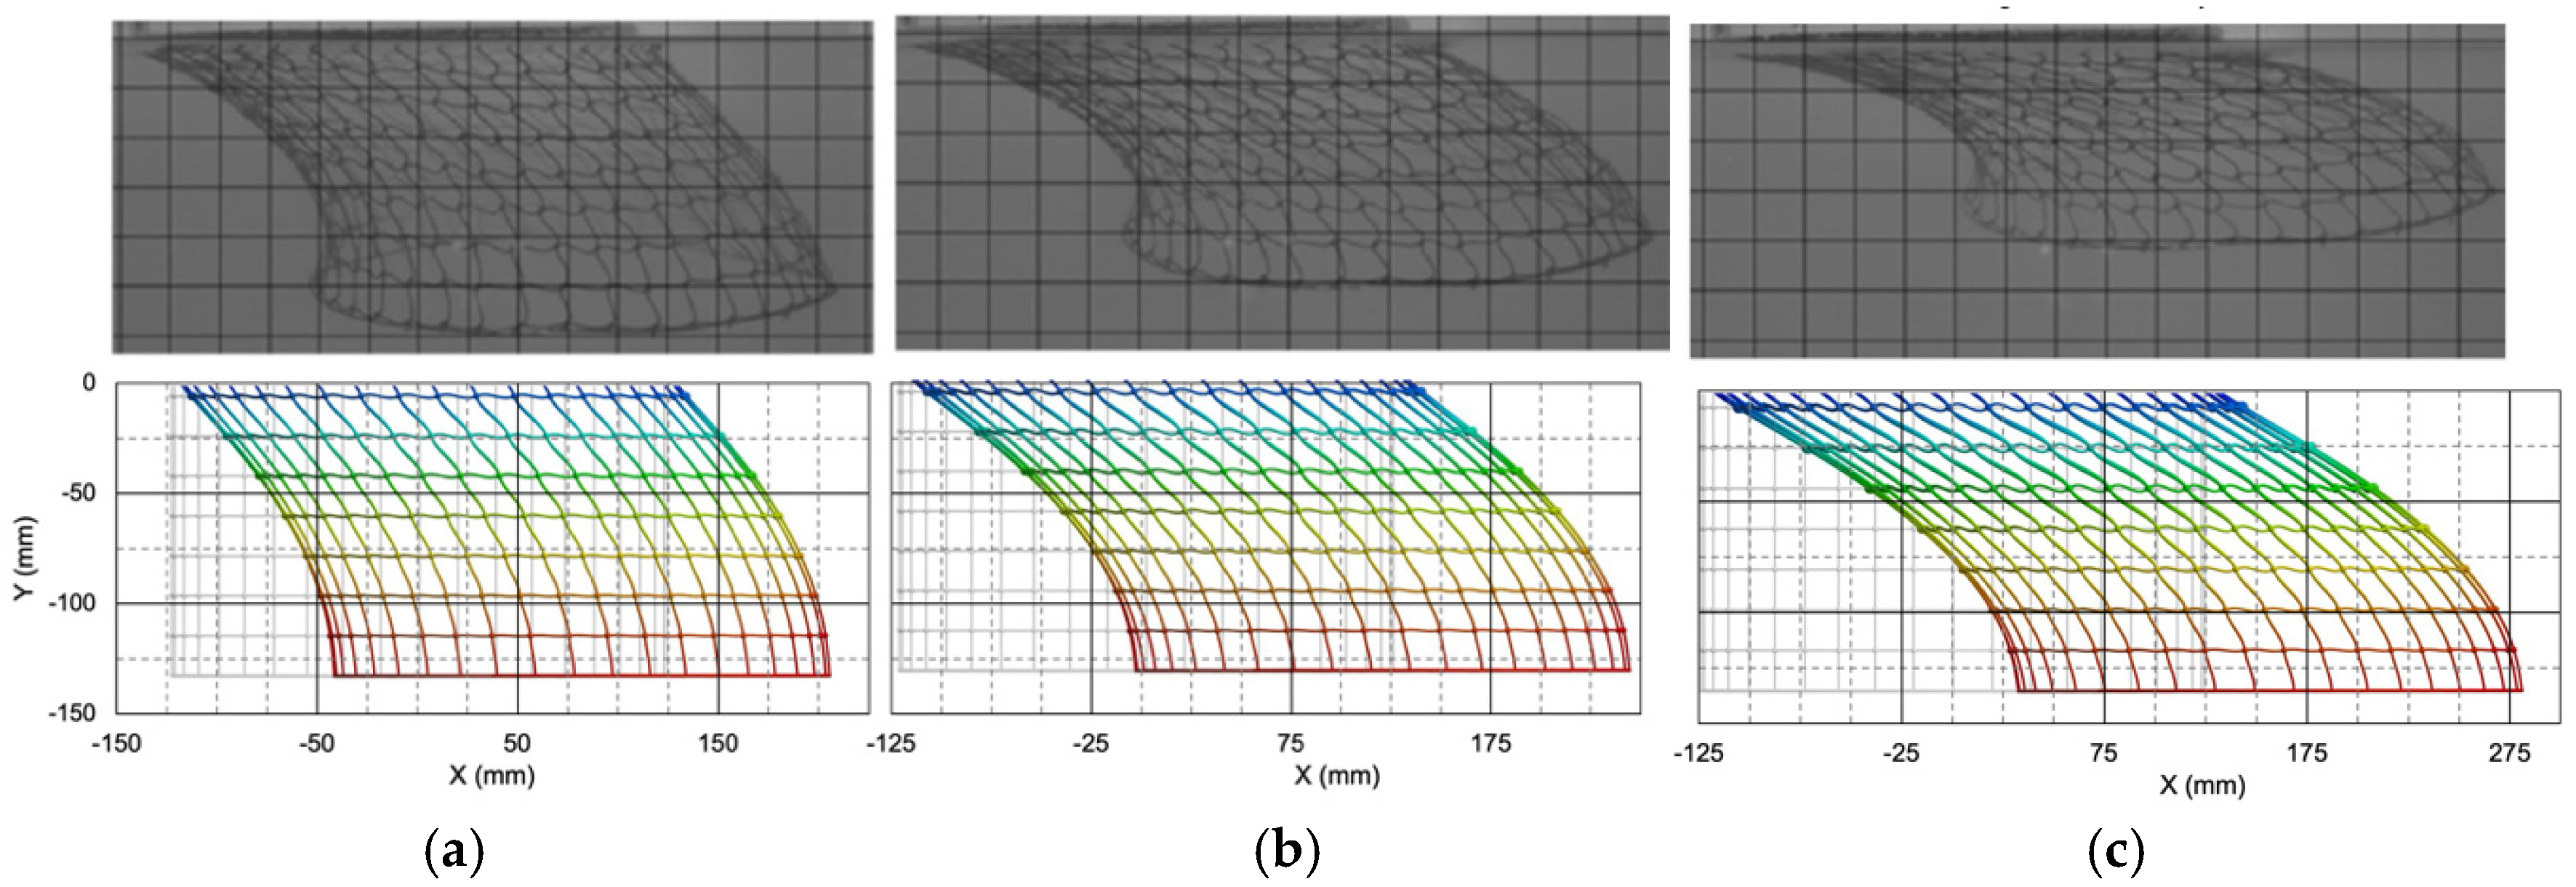
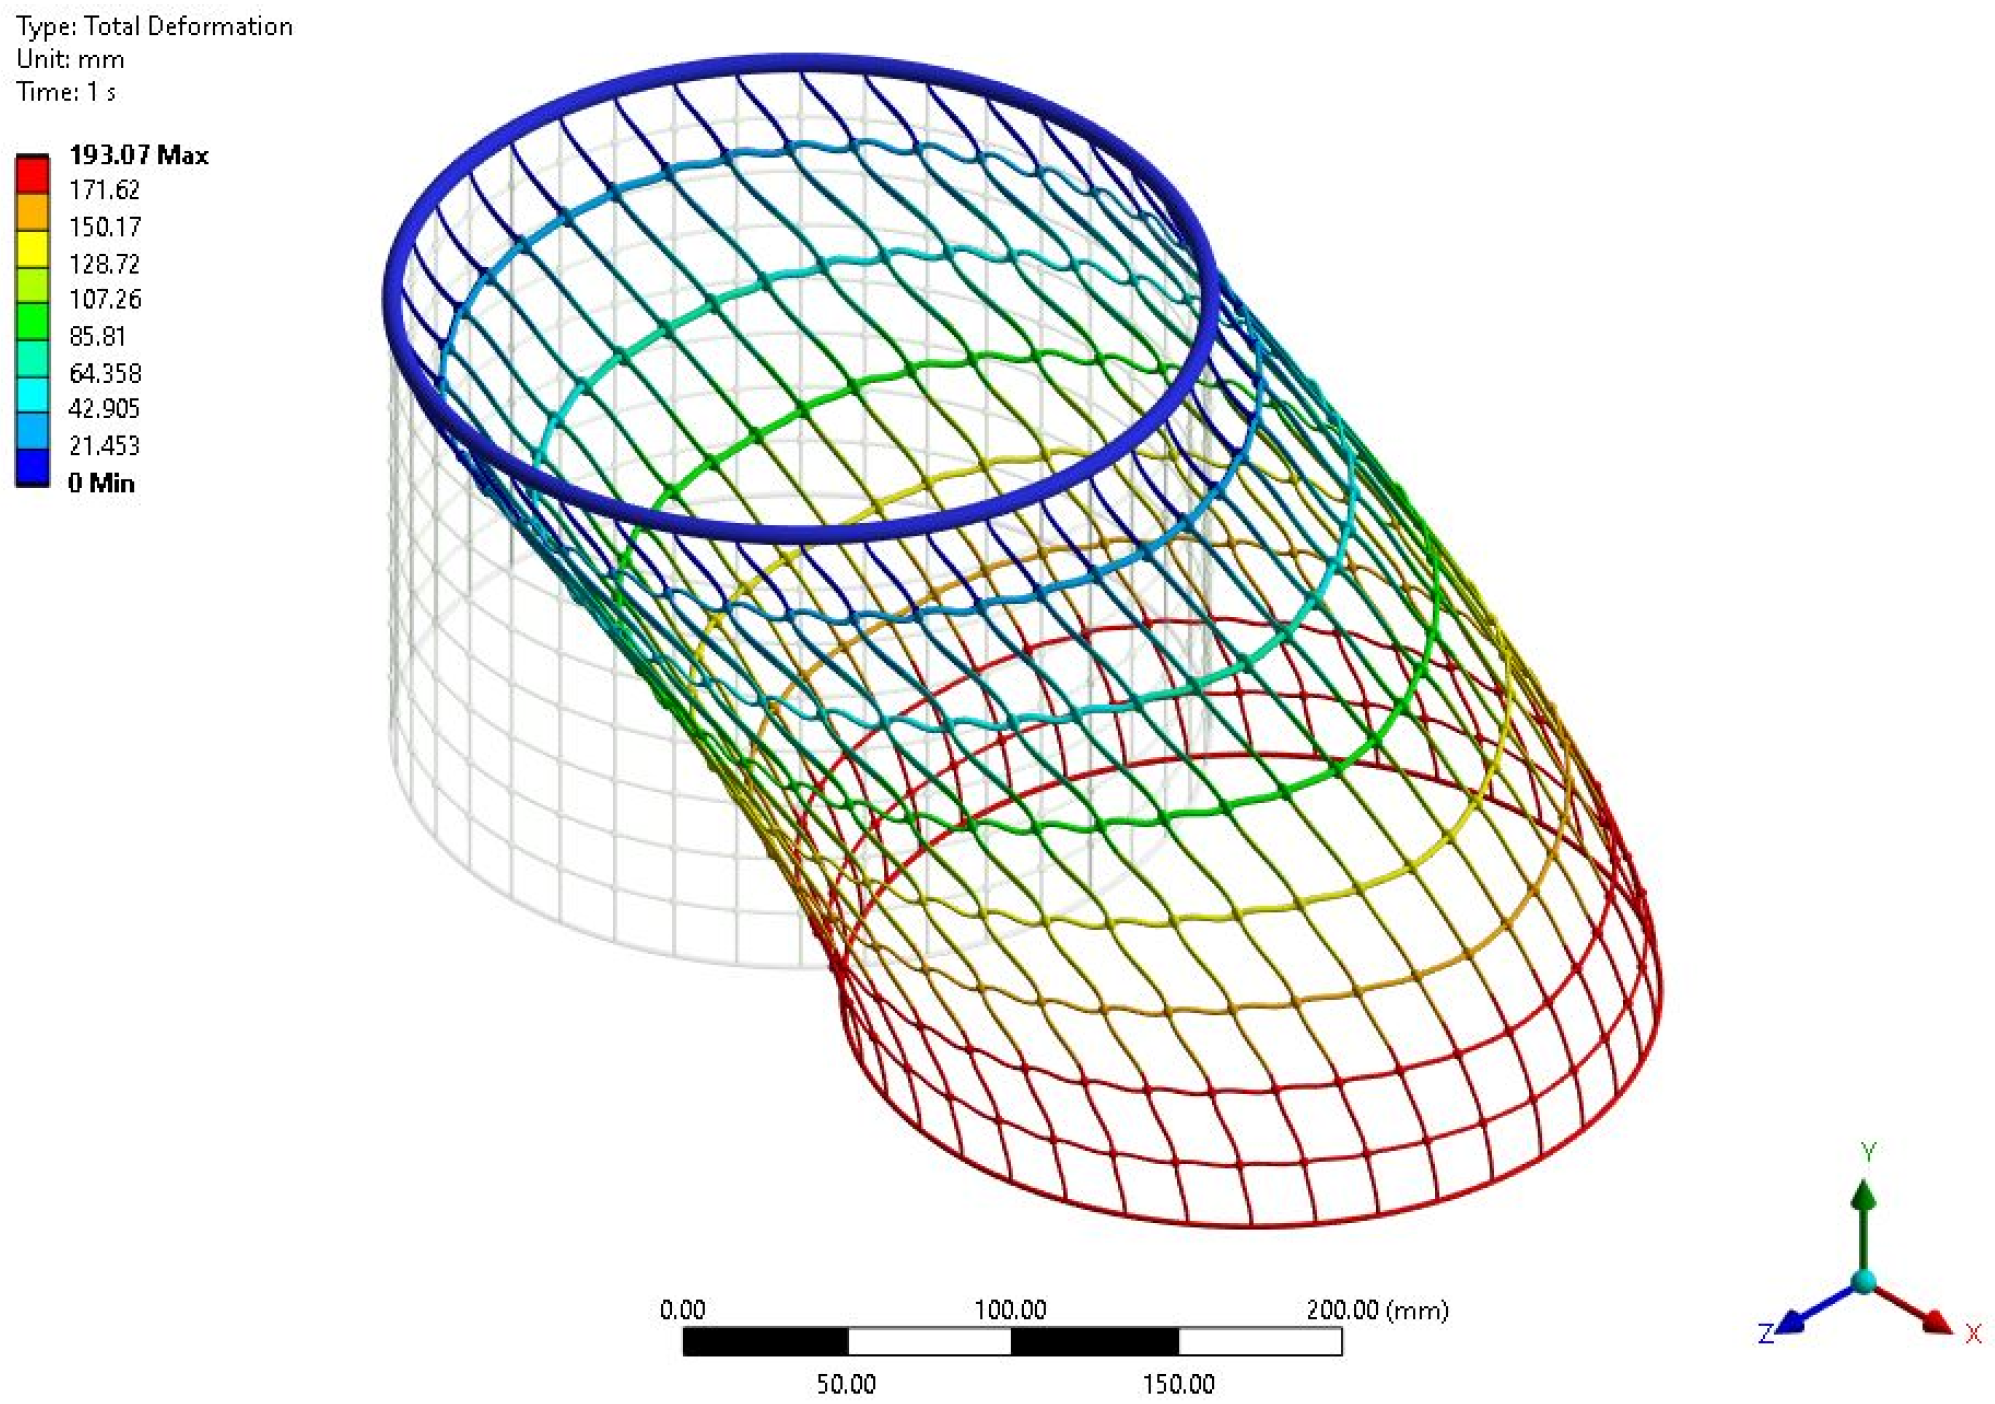
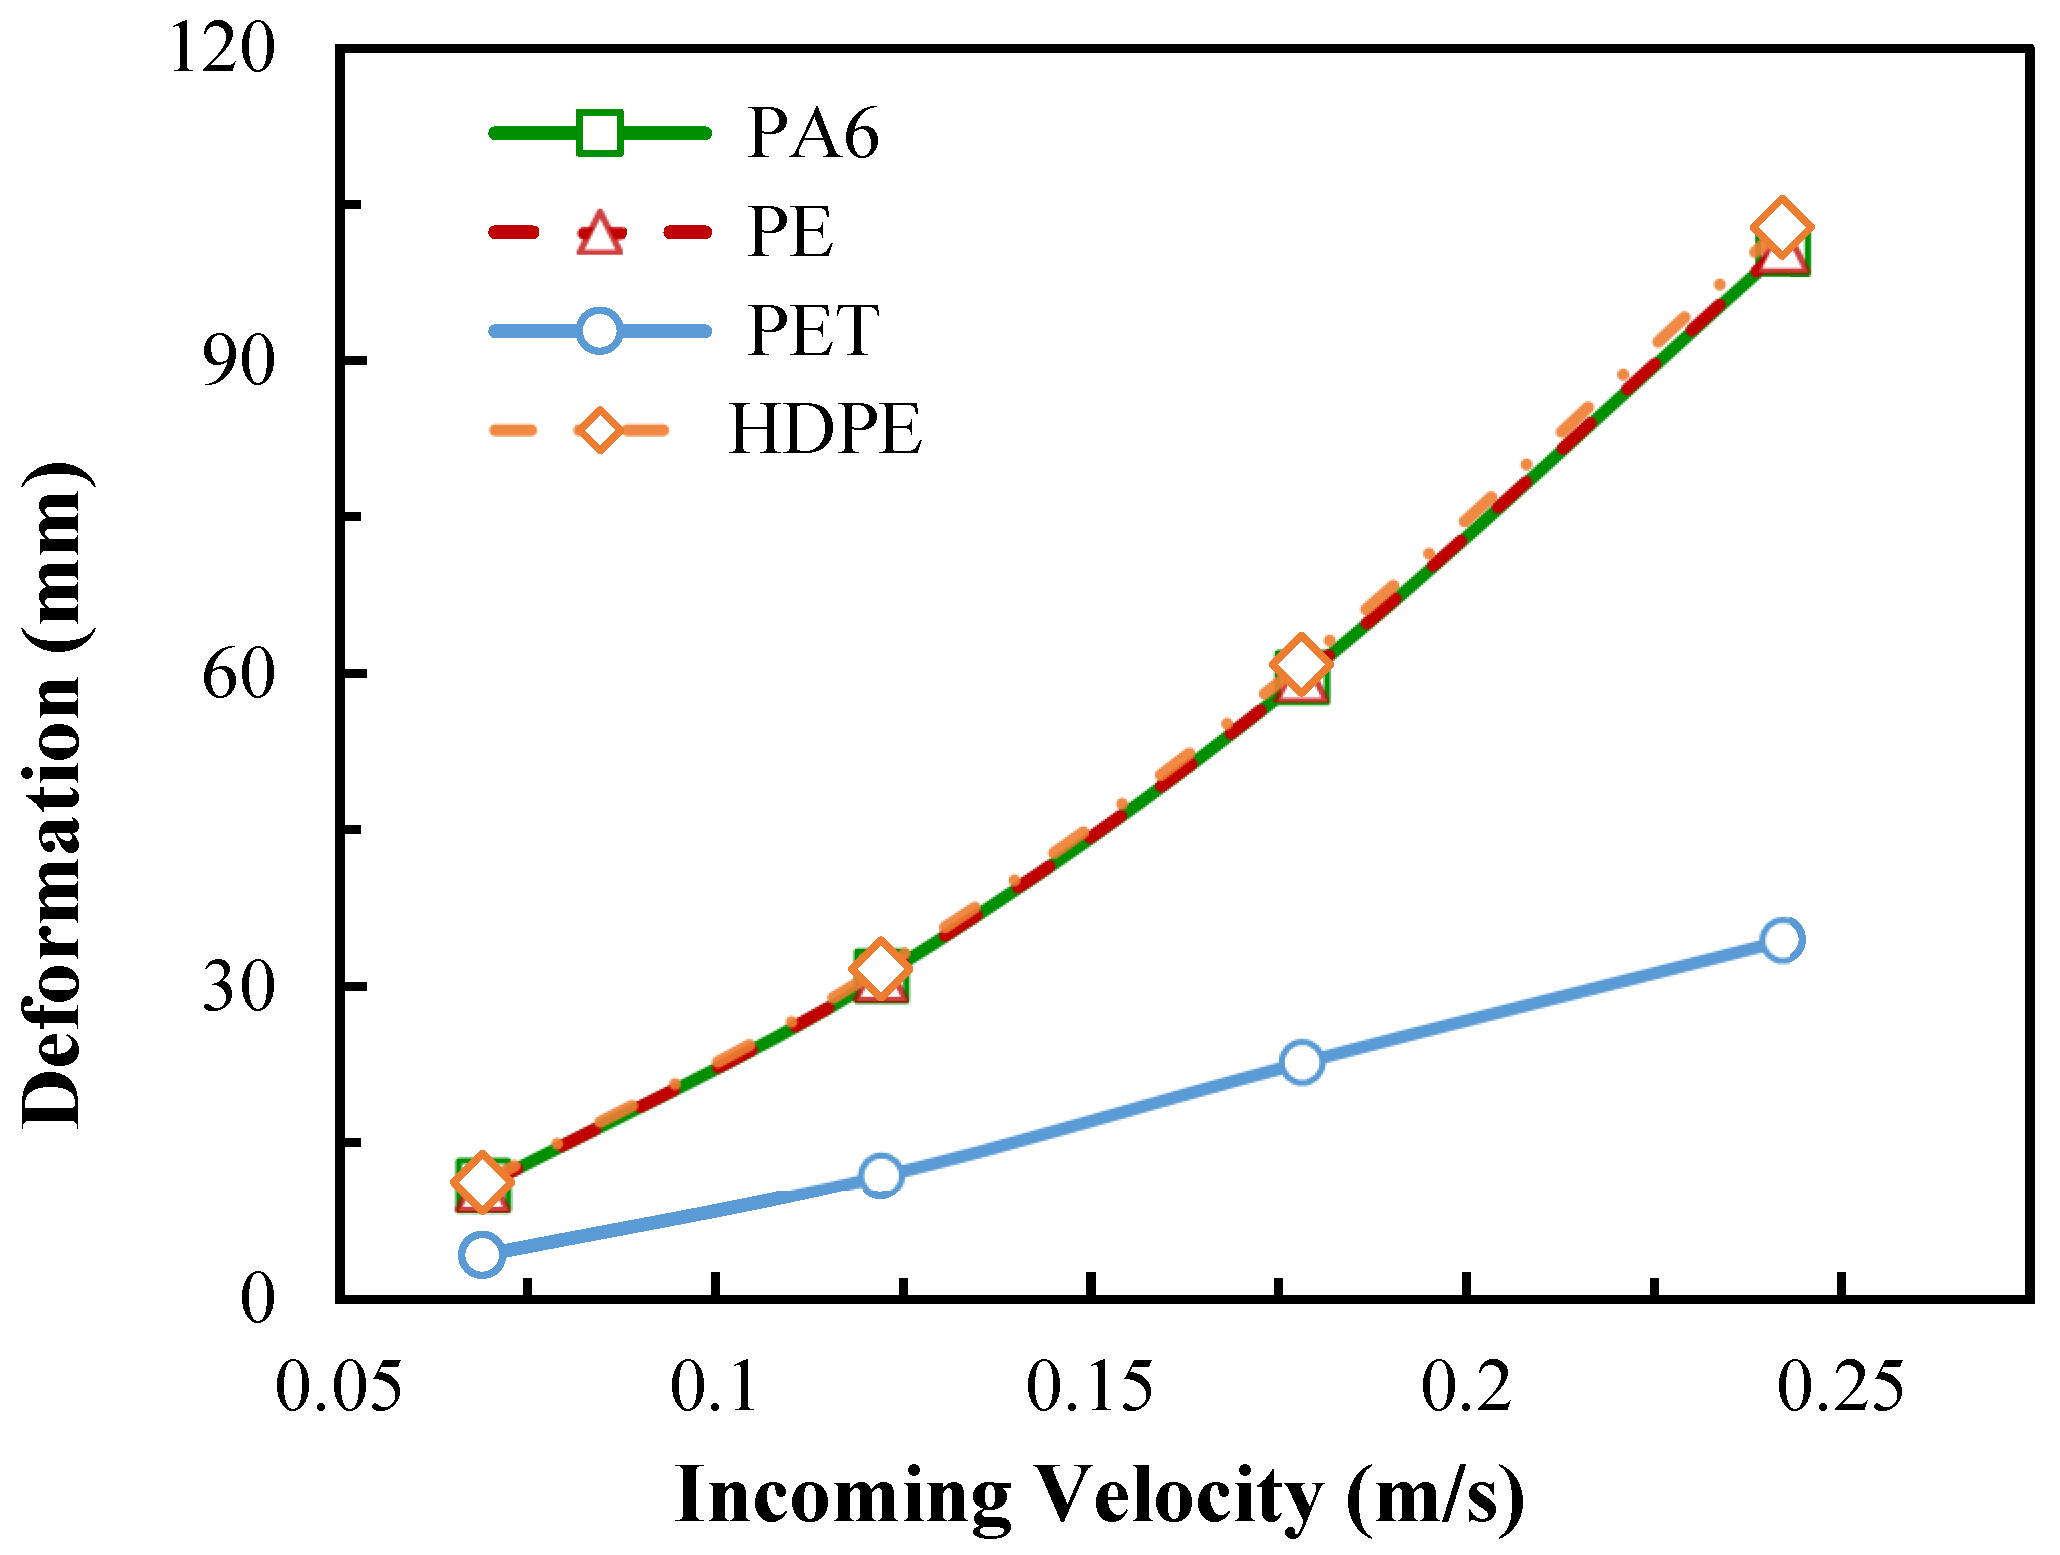
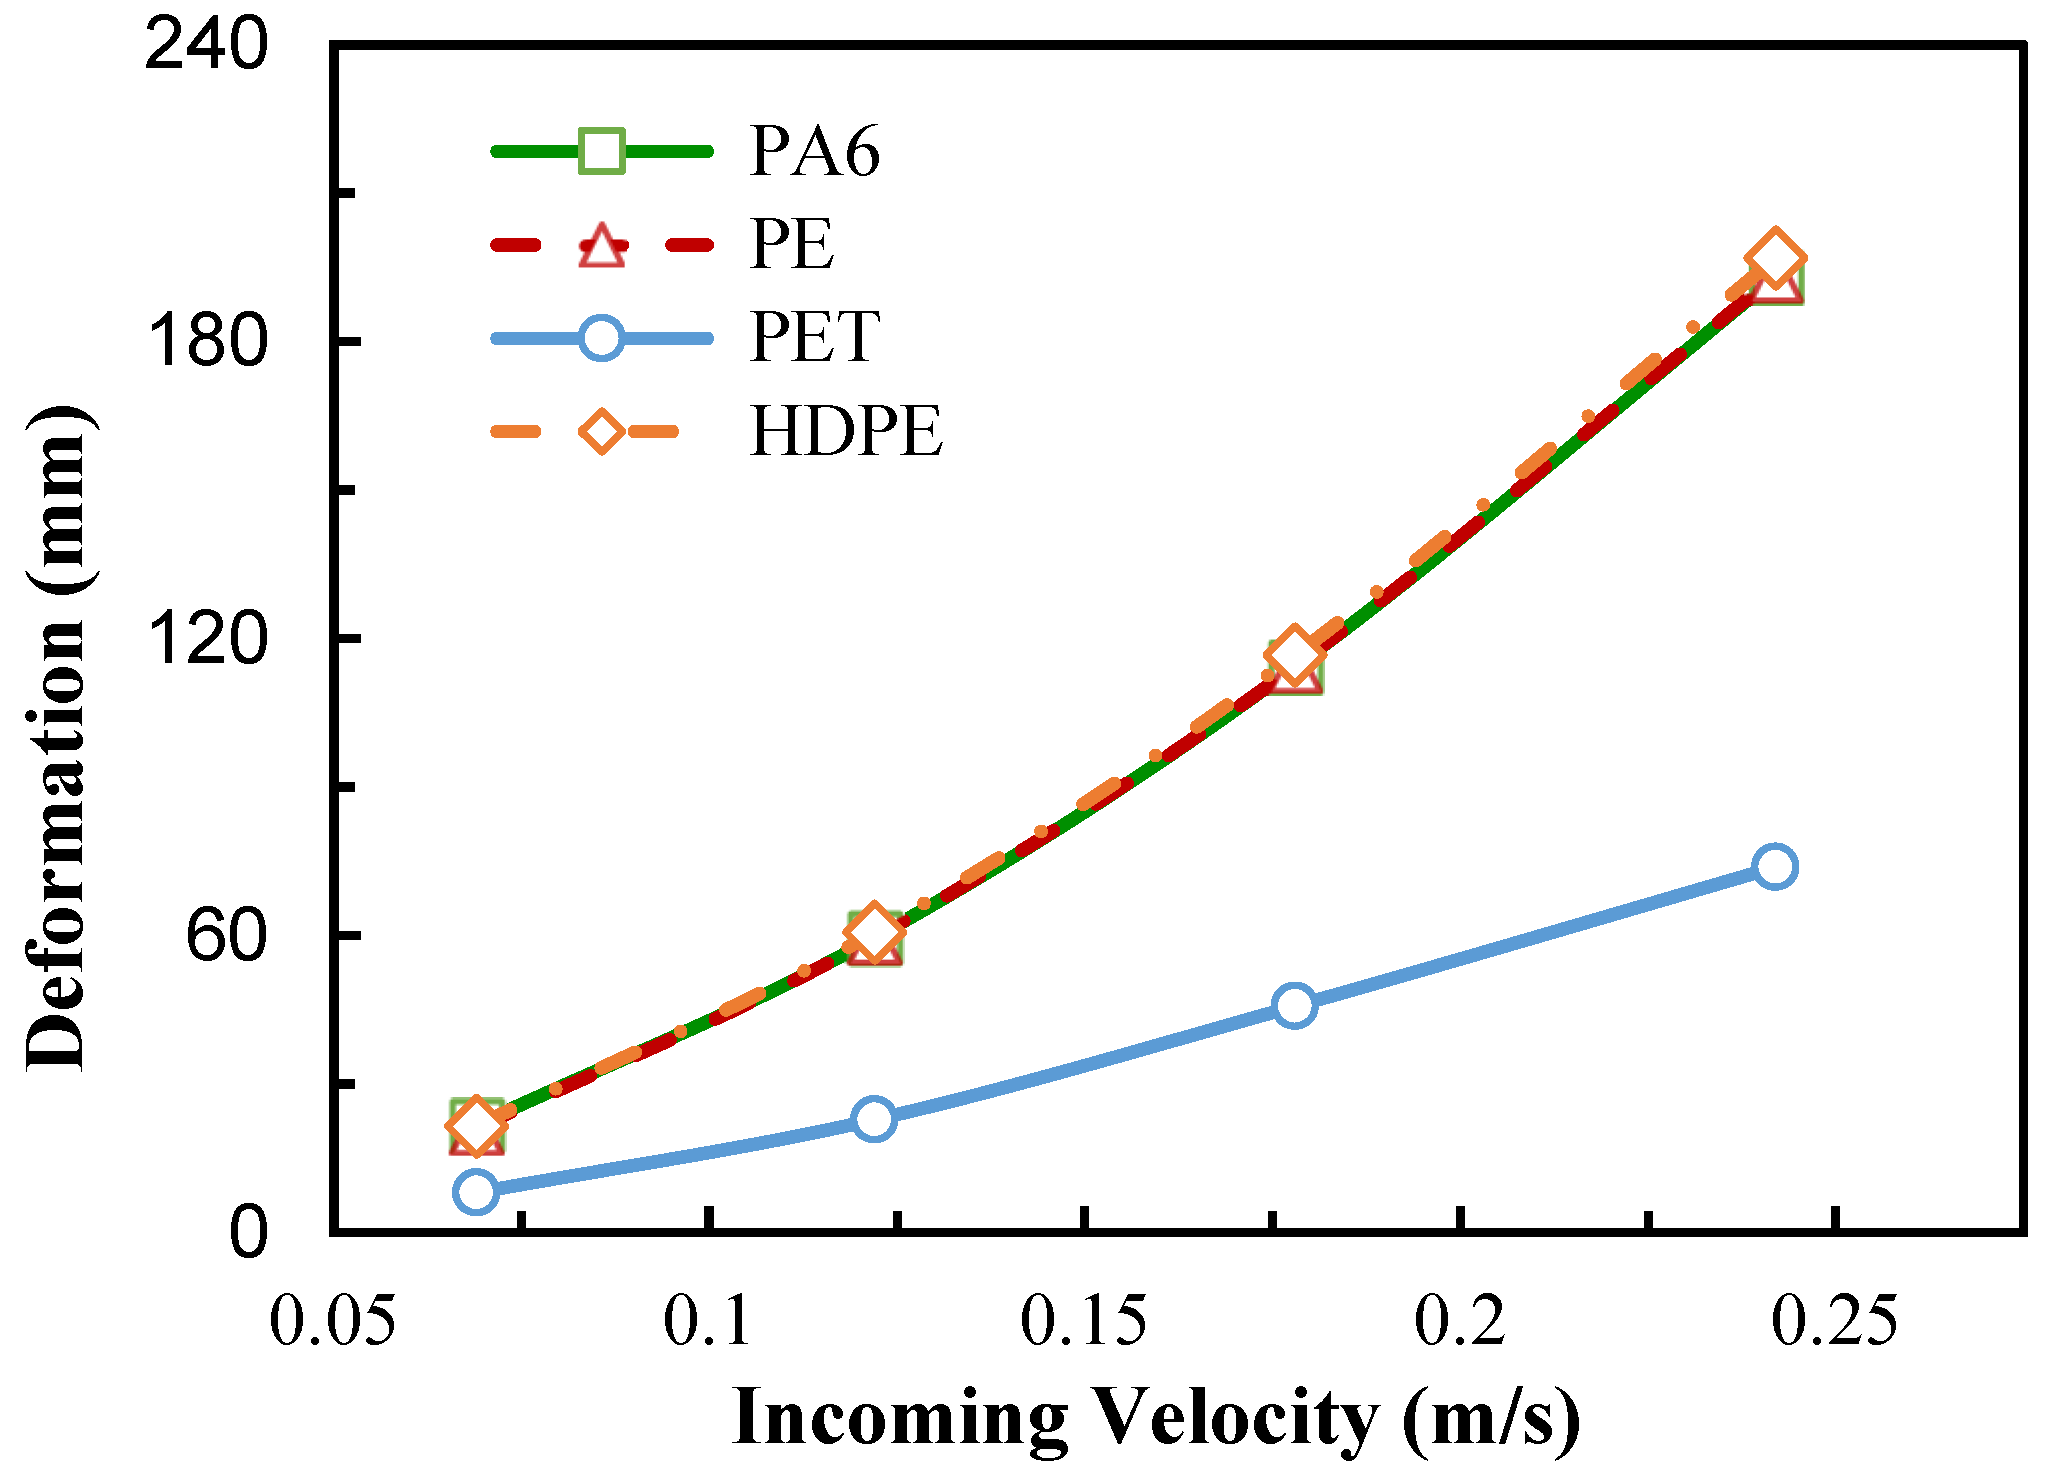
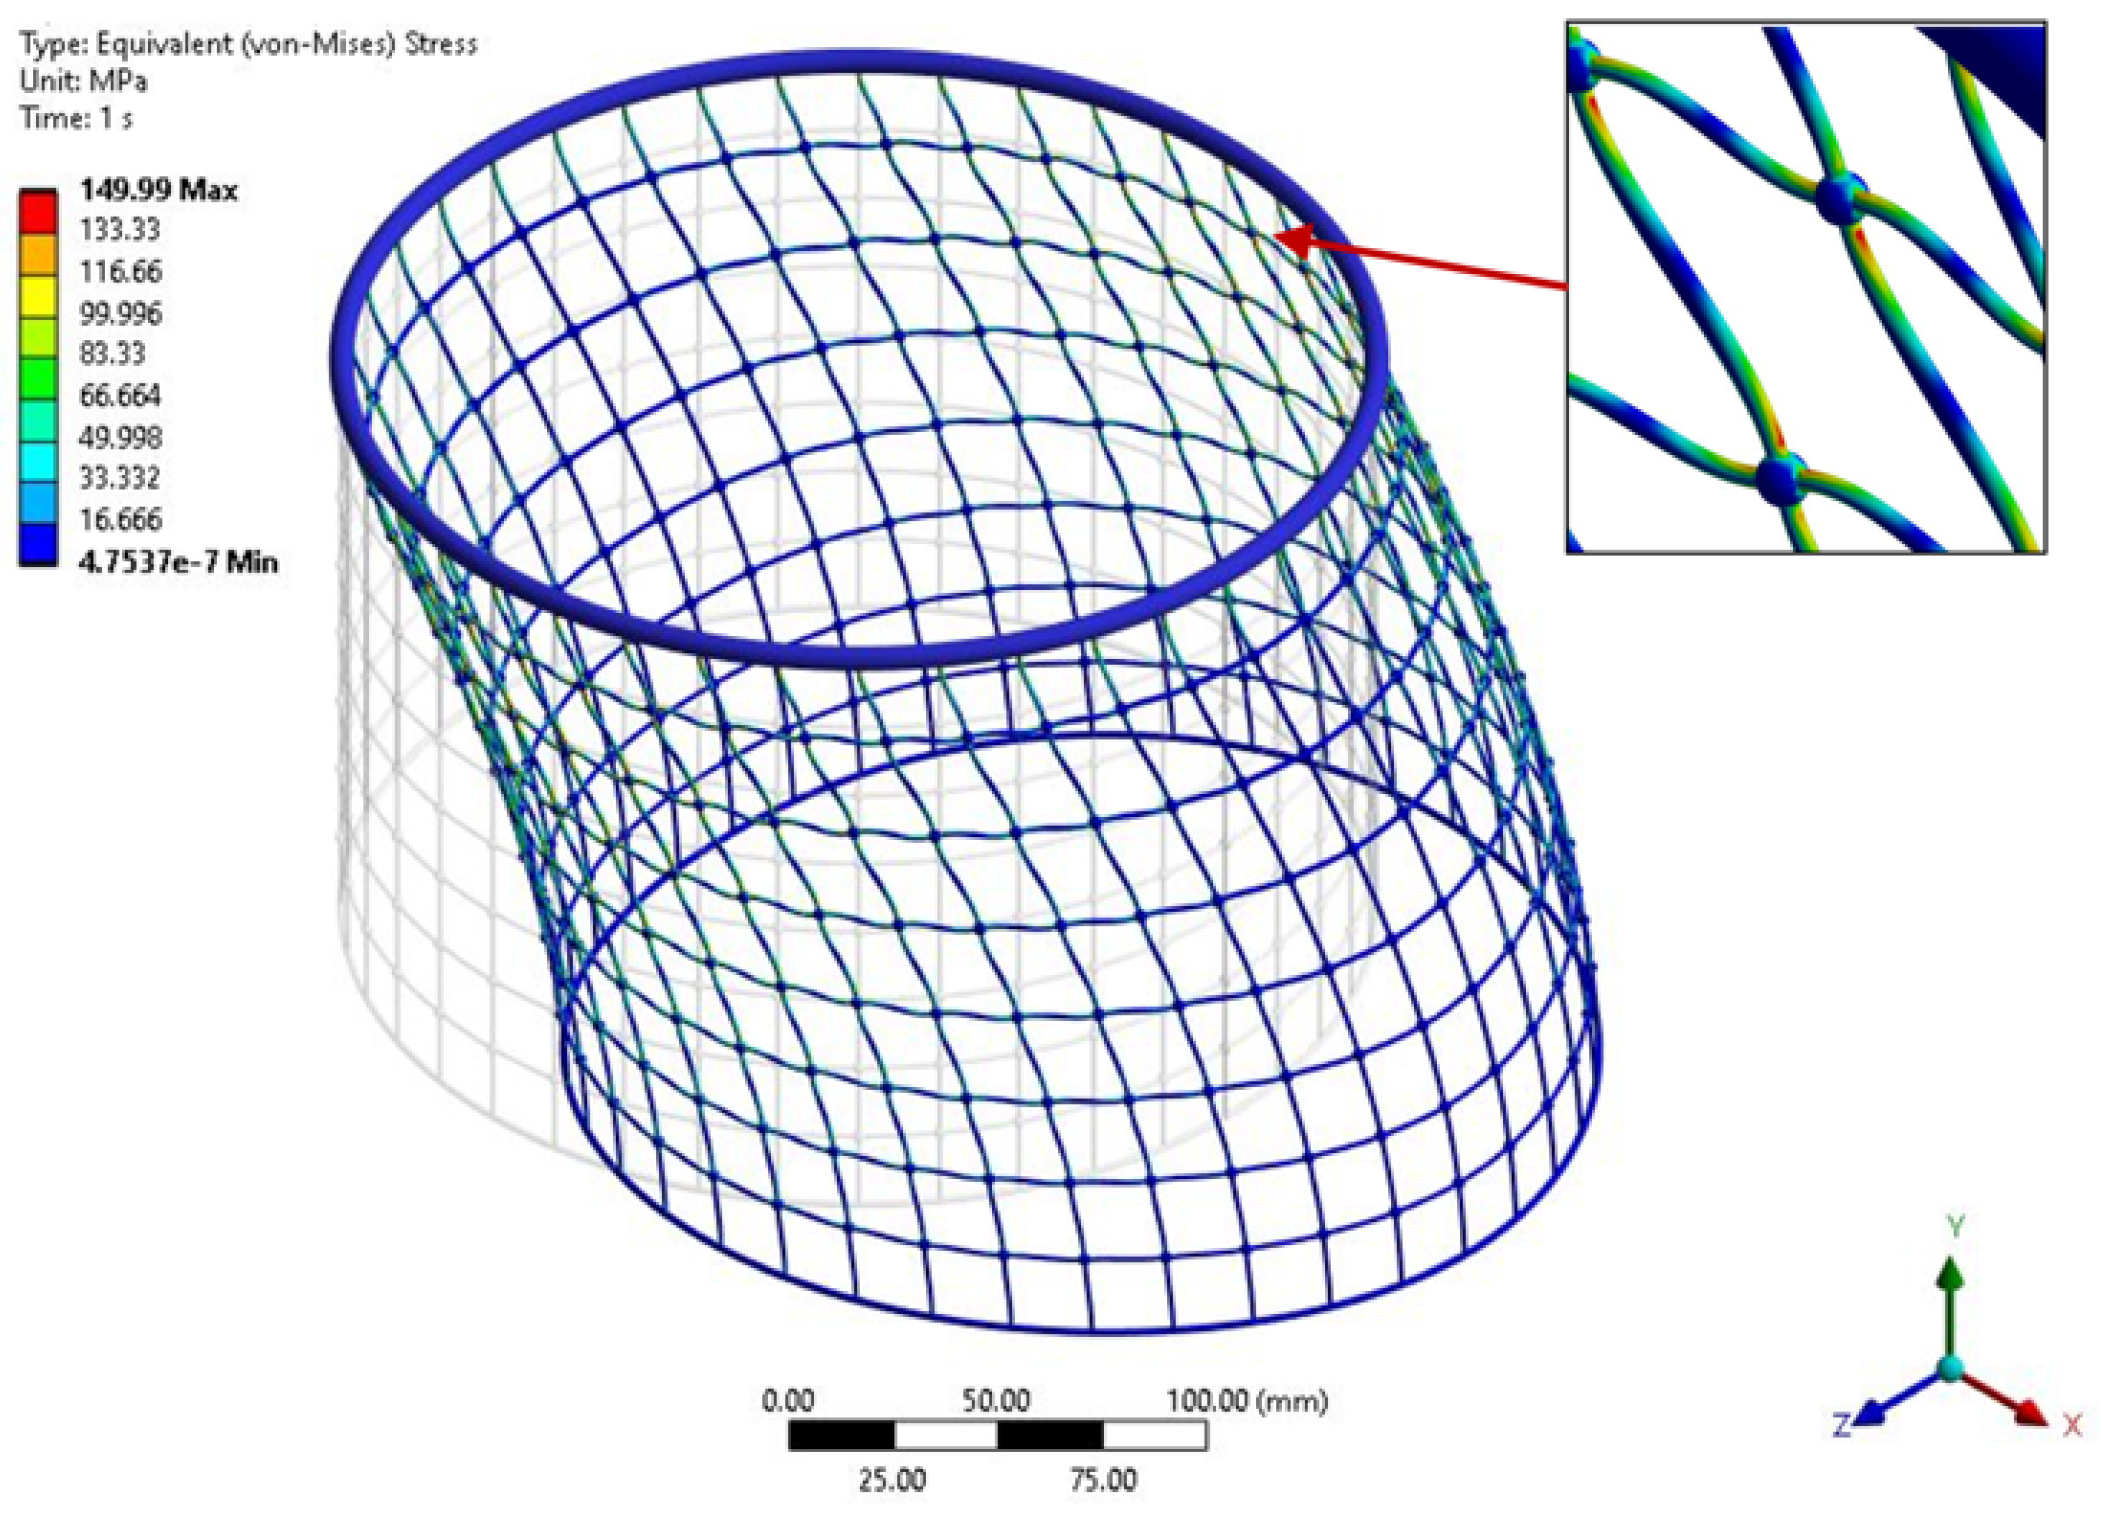
3.3. Deformation and Stress
4. Conclusions
Author Contributions
Funding
Institutional Review Board Statement
Informed Consent Statement
Data Availability Statement
Conflicts of Interest
References
- Xu, Z.; Qin, H. Fluid-structure interactions of cage based aquaculture: From structures to organisms. Ocean Eng. 2020, 217, 107961. [Google Scholar] [CrossRef]
- Zhao, Y.P.; Gui, F.; Xu, T.J.; Chen, X.F.; Cui, Y. Numerical analysis of dynamic behavior of a box-shaped net cage in pure waves and current. Appl. Ocean Res. 2013, 39, 158–167. [Google Scholar] [CrossRef]
- Tsarau, A.; Kristiansen, D. Application of FhSim for the analysis of environmental loads on a complete fish-farm system. In MARINE VIII: Proceedings of the VIII International Conference on Computational Methods in Marine Engineering, Göteborg, Sweden, 13–15 May 2019; CIMNE: Barcelona, Spain, 2019; pp. 271–284. [Google Scholar]
- Shaik, A.S.; Thuvanismail, N.; Vijayakumar, M.; Kumar, P. Numerical Investigation on Different Configurations of Offshore Fish Cages in Submerged Conditions Subjected to Regular Waves. J. Mar. Sci. Appl. 2023, 22, 445–455. [Google Scholar] [CrossRef]
- Zhang, X.; Fu, F.; Guo, J.; Qin, H.; Sun, Q.; Hu, Z. Numerical Simulation and On-Site Measurement of Dynamic Response of Flexible Marine Aquaculture Cages. J. Mar. Sci. Eng. 2024, 12, 1625. [Google Scholar] [CrossRef]
- Fredriksson, D.W.; Swift, M.R.; Irish, J.D.; Tsukrov, I.; Celikkol, B. Fish cage and mooring system dynamics using physical and numerical models with field measurements. Aquac. Eng. 2003, 27, 117–146. [Google Scholar] [CrossRef]
- Liu, Z.; Mohapatra, S.C.; Guedes Soares, C. Finite Element Analysis of the Effect of Currents on the Dynamics of a Moored Flexible Cylindrical Net Cage. JMSE 2021, 9, 159. [Google Scholar] [CrossRef]
- Tang, H.J.; Yang, R.Y.; Yao, H.C. Experimental and numerical investigations of a mooring line failure of an aquaculture net cage subjected to currents. Ocean. Eng. 2021, 238, 109707. [Google Scholar] [CrossRef]
- Dong, S.; Park, S.; Kitazawa, D.; Zhou, J.; Yoshida, T.; Li, Q. Model tests and full-scale sea trials for drag force and deformation of a marine aquaculture net cage. Ocean Eng. 2021, 240, 109941. [Google Scholar] [CrossRef]
- Nobakht-Kolur, F.; Zeinoddini, M.; Ghalebi, A. Hydrodynamic forces in marine-fouled floating aquaculture cages: Physical modelling under irregular waves. J. Fluids Struct. 2021, 105, 103331. [Google Scholar] [CrossRef]
- Liu, Z.; Guedes Soares, C. Experimental study of the behaviour of a circular gravity cage in linear waves. Aquac. Eng. 2022, 99, 102291. [Google Scholar] [CrossRef]
- Gansel, L.; Oppedal, F.; Birkevold, J.; Tuene, S. Drag forces and deformation of aquaculture cages-Full-scale towing tests in the field. Aquac. Eng. 2018, 81, 46–56. [Google Scholar] [CrossRef]
- Bi, C.W.; Zhao, Y.P.; Dong, G.H.; Xu, T.J.; Gui, F.K. Numerical simulation of the interaction between flow and flexible nets. J. Fluids Struct. 2014, 45, 180–201. [Google Scholar] [CrossRef]
- Chen, H.; Christensen, E.D. Development of a numerical model for fluid-structure interaction analysis of flow through and around an aquaculture net cage. Ocean Eng. 2017, 142, 597–615. [Google Scholar] [CrossRef]
- Ma, C.; Xie, S.; Bi, C.W.; Zhao, Y.P. Nonlinear dynamic analysis of aquaculture platforms in irregular waves based on Hilbert–Huang transform. J. Fluids Struct. 2023, 117, 103831. [Google Scholar] [CrossRef]
- Bui, C.M.; Ho, T.X.; Khieu, L.H. Numerical study of a flow over and through offshore fish cages. Ocean. Eng. 2020, 201, 107140. [Google Scholar] [CrossRef]
- Bi, C.W.; Zhao, Y.P.; Dong, G.H.; Zheng, Y.N.; Gui, F.K. A numerical analysis on the hydrodynamic characteristics of net cages using coupled fluid–structure interaction model. Aquac. Eng. 2014, 59, 1–12. [Google Scholar] [CrossRef]
- Cheng, H.; Aydemir, O.; Ong, M.C. Numerical Investigations on Wake Effects of Fish Cages. J. Offshore Mech. Arct. Eng. 2024, 146, 061301. [Google Scholar] [CrossRef]
- Aydemir, O.; Cheng, H.; Ong, M.C. A comparative study of two fish farm layouts under pure current conditions. Appl. Ocean Res. 2024, 148, 104025. [Google Scholar] [CrossRef]
- Cheng, H. Study on the Anti-Current Characteristics of a New Type Gravity Fish Cage and Design Optimising. Master Thesis, Ocean University of China, Qingdao, China, 2017. [Google Scholar]
- Faltinsen, O.M.; Shen, Y. Wave and Current Effects on Floating Fish Farms: Keynote Contribution for the International Workshop on Wave Loads and Motions of Ships and Offshore Structures, Harbin, China, 5–7 November, 2017. J. Mar. Sci. Appl. 2018, 17, 284–296. [Google Scholar] [CrossRef]
- Liu, Z.; Guedes Soares, C. Experimental and numerical studies on the effect of the reinforced tubes on the drag forces of a gravity cage system. Ocean Eng. 2024, 311, 118780. [Google Scholar] [CrossRef]
- Hu, K.; Fu, S.; Xu, Y.; Ma, L.; Chen, Y. Hydrodynamic response of multiple fish cages under wave loads. In International Conference on Offshore Mechanics and Arctic Engineering, San Francisco, CA, USA, 8–13 June 2014; American Society of Mechanical Engineers: Houston, TX, USA, 2014; Volume 45493, p. V007T05A013. [Google Scholar]
- Chen, Z.; Jiao, J.; Wang, Q.; Wang, S. CFD-FEM simulation of slamming loads on wedge structure with stiffeners considering hydroelasticity effects. J. Mar. Sci. Eng. 2022, 10, 1591. [Google Scholar] [CrossRef]
- Lin, H.; Luan, H.; Uzdin, A.M.; Zhang, S.; Wei, L.; Yang, L. A CFD-FEA coupled model for simulating dynamic response of offshore jacket platform under earthquake considering wind, wave, current and aftershock loads. Ocean. Eng. 2024, 300, 117481. [Google Scholar] [CrossRef]
- Luo, W.; Liu, W.; Chen, S.; Zou, Q.; Song, X. Development and Application of an FSI Model for Floating VAWT by Coupling CFD and FEA. J. Mar. Sci. Eng. 2024, 12, 683. [Google Scholar] [CrossRef]
- Balash, C.; Colbourne, B.; Bose, N.; Raman-Nair, W. Aquaculture Net Drag Force and Added Mass. Aquac. Eng. 2009, 41, 14–21. [Google Scholar] [CrossRef]
- Bi, C.W.; Zhao, Y.P.; Dong, G.H.; Wu, Z.M.; Zhang, Y.; Xu, T.J. Drag on and flow through the hydroid-fouled nets in currents. Ocean Eng. 2018, 161, 195–204. [Google Scholar] [CrossRef]
- Lader, P.; Dempster, T.; Fredheim, A.; Jensen, Ø. Current induced net deformations in full-scale sea-cages for Atlantic salmon (Salmo salar). Aquac. Eng. 2008, 38, 52–65. [Google Scholar] [CrossRef]
- Liu, L.; Kinoshita, T.; Wan, R.; Bao, W.; Itakura, H. Experimental investigation and analysis of hydrodynamic characteristics of a net panel oscillating in water. Ocean Eng. 2012, 47, 19–29. [Google Scholar] [CrossRef]
- Xu, T.J.; Dong, G.H.; Tang, M.F.; Liu, J.; Guo, W.J. Experimental analysis of hydrodynamic forces on net panel in extreme waves. Appl. Ocean Res. 2021, 107, 102495. [Google Scholar] [CrossRef]


| Items | Parameter | Value | Unit |
|---|---|---|---|
| Top Ring | Diameter | 254 | mm |
| Bar Diameter | 6.0 | mm | |
| Material | Steel | ||
| Cylindrical net | Height | 160 | mm |
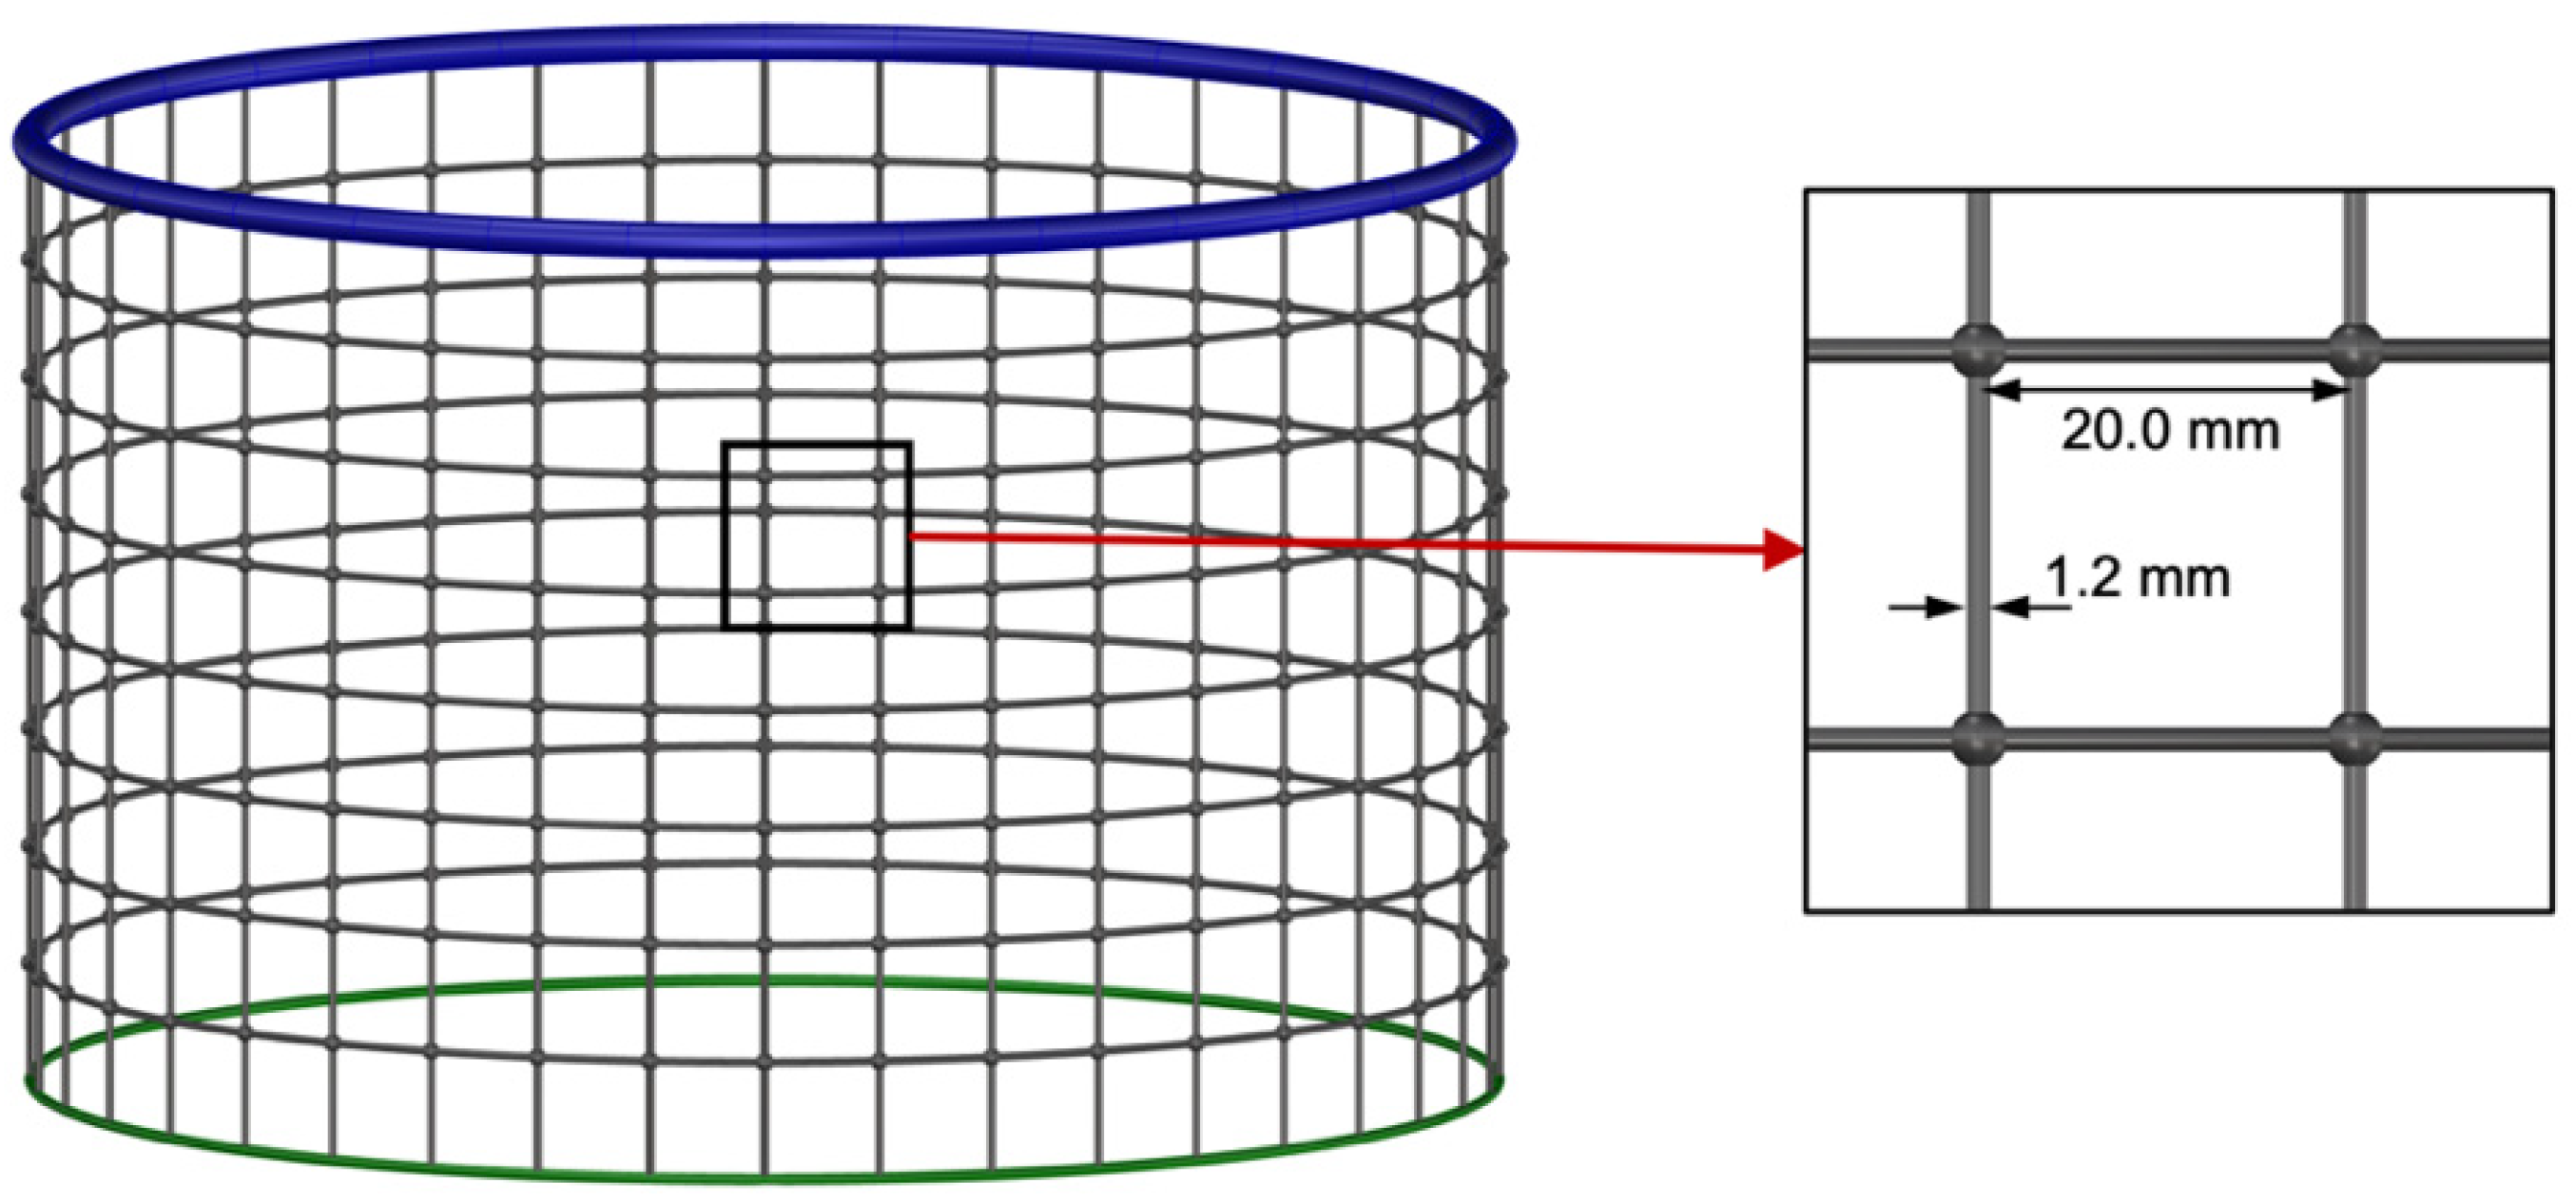
| Mesh size | 20.0 | mm | |
| Twine diameter | 1.2 | mm | |
| Knot | 3.0 | mm | |
| Material | Polyamide | ||
| Bottom ring | Diameter | 254 | mm |
| Mass in air | 8.0 | g | |
| Bar diameter | 1.0 | mm | |
| Material | Stainless steel |
| Parameter | Value |
|---|---|
| Net element size | 0.2 mm |
| Collar element size | 0.5 mm |
| Body of Influence | 5.0 mm |
| Domain element size | 10.0 mm |
| Pinch Tolerance | 0.05 mm |
| Skewness | >0.80675 |
| Orthogonal quality | <0.17498 |
| Nodes | 8,095,423 |
| Elements | 45,963,529 |
| CPU time b | 50 h |
| Material | Density [kg/m3] | Young Modulus [MPa] | Poisson Ration | Yield Stress [MPa] |
|---|---|---|---|---|
| PA6 | 1140 | 1111 | 0.3499 | 43.13 |
| PE | 950 | 1100 | 0.4200 | 25.00 |
| HDPE | 958.5 | 1080 | 0.4183 | 28.39 |
| PET | 1339 | 2898 | 0.3887 | 52.44 |
Disclaimer/Publisher’s Note: The statements, opinions and data contained in all publications are solely those of the individual author(s) and contributor(s) and not of MDPI and/or the editor(s). MDPI and/or the editor(s) disclaim responsibility for any injury to people or property resulting from any ideas, methods, instructions or products referred to in the content. |
© 2024 by the authors. Licensee MDPI, Basel, Switzerland. This article is an open access article distributed under the terms and conditions of the Creative Commons Attribution (CC BY) license (https://creativecommons.org/licenses/by/4.0/).
Share and Cite
Viegas, M.D.; Wang, S.; Guedes Soares, C. One-Way CFD/FEM Analysis of a Fish Cage in Current Conditions. J. Mar. Sci. Eng. 2024, 12, 2268. https://doi.org/10.3390/jmse12122268
Viegas MD, Wang S, Guedes Soares C. One-Way CFD/FEM Analysis of a Fish Cage in Current Conditions. Journal of Marine Science and Engineering. 2024; 12(12):2268. https://doi.org/10.3390/jmse12122268
Chicago/Turabian StyleViegas, Mariana D., Shan Wang, and C. Guedes Soares. 2024. "One-Way CFD/FEM Analysis of a Fish Cage in Current Conditions" Journal of Marine Science and Engineering 12, no. 12: 2268. https://doi.org/10.3390/jmse12122268
APA StyleViegas, M. D., Wang, S., & Guedes Soares, C. (2024). One-Way CFD/FEM Analysis of a Fish Cage in Current Conditions. Journal of Marine Science and Engineering, 12(12), 2268. https://doi.org/10.3390/jmse12122268