Article

Interannual and Seasonal Variability of CO2 Parameters in the Tropical Atlantic Ocean

by
Frederic Bonou
1,2,3,*,
A. Nathanael Dossa
2,3,
Adeola M. Dahunsi
3,4 and
Zacharie Sohou
2
1
Laboratory of Physics and Applications (LPA), National University of Sciences, Technology, Engineering and Mathematics of Abomey (UNSTIM), PBOX 72, Natitingou, Benin
2
Laboratory of Marine and Coastal Hydrology, Institute of Fisheries and Oceanographic Research of Benin, Cotonou 03 PBX 1665, Benin
3
International Chair in Mathematical Physics and Applications (ICMPA—UNESCO CHAIR), University of Abomey-Calavi, 072 PBOX 50, Abomey-Calavi, Benin
4
Alfred Wegener Institute for Polar and Marine Research, 27570 Bremerhaven, Germany
*
Author to whom correspondence should be addressed.
J. Mar. Sci. Eng. 2024, 12(12), 2248; https://doi.org/10.3390/jmse12122248
Submission received: 15 September 2024 / Revised: 25 November 2024 / Accepted: 4 December 2024 / Published: 6 December 2024
(This article belongs to the Section Chemical Oceanography)

Abstract

:
This study examined the carbon cycling dynamics in the tropical Atlantic Ocean from 1985 to 2023, focusing on factors influencing the surface partial pressure of CO2 (pCO2), freshwater input, total alkalinity (ALK), total dissolved carbon (TCO2), and pH levels. The time series data revealed significant trends, with average pCO2 concentrations rising from approximately 350 μatm in the early 1990s to over 400 μatm by 2023. The TCO2 levels increased from about 2000 μmol/kg to 2200 μmol/kg, while ALK rose from approximately 2300 μmol/kg to 2500 μmol/kg. This increase highlights the ocean’s role as a carbon sink, particularly in areas with high biological productivity and upwelling where TCO2 also rose. This study employed Empirical Orthogonal Functions (EOFs) to identify variability modes and understand spatial patterns of pCO2. Freshwater dynamics significantly affect TCO2 concentrations, particularly in coastal regions, where pH can shift from 8.2 to 7.9, exacerbating acidification. Rising sea surface temperatures have been linked to elevated pCO2 values. These findings support the need for ongoing monitoring and effective management strategies to mitigate the impacts of climate change and ensure the sustainability of marine resources. This study documented the long-term trends in tropical Atlantic CO2 parameters linked to the North Atlantic Oscillation (NAO) and Atlantic Multidecadal Oscillation (AMO).

1. Introduction

The ocean significantly influences the cycling of carbon and helps regulate atmospheric CO2 levels over time. It is estimated that about 30% of the CO2 produced by human activities in recent decades has been absorbed by the ocean [1,2,3].
The tropical Atlantic Ocean plays a crucial role in the global carbon cycle, serving as both a source and a sink for atmospheric carbon dioxide (CO2) [4]. The tropical Atlantic Ocean is a dynamic and complex region, where the carbon cycle exhibits significant seasonal and interannual variability [5].
Understanding the spatio-temporal dynamics of CO2 parameters in the tropical Atlantic is crucial for accurately quantifying air–sea CO2 fluxes and predicting their impacts related to climate change. Parameters such as surface ocean partial pressure of CO2 (pCO2), total alkalinity (ALK), total inorganic carbon (TCO2), pH, and the interface air–sea CO2 flux (FGCO2) have shown significant variability on both seasonal and interannual timescales, driven by physical, chemical, and biological processes [4]. The study conducted in [6] provides valuable insights into the distribution of carbon dioxide (CO2) parameters in the western tropical Atlantic Ocean. By analyzing data from 35 cruises in the region, the authors revealed spatial variability in ALK and total TCO2, influenced by factors such as the Amazon River plume and equatorial upwelling. The comparative study conducted in [7] examined the total alkalinity and total inorganic carbon concentrations in tropical coastal regions of the tropical Atlantic, highlighting the significant differences in these parameters across various locations. Their results show the importance of understanding coastal carbon dynamics, which are crucial for effective marine conservation and management strategies in the context of climate change.
In terms of seasonal timescales, previous findings have shown distinct patterns in CO2 flux in the tropical Atlantic Ocean. During the winter (December to February), the region is generally a source of CO2 for the atmosphere, while during the spring (March to May) months and summer (June to August) months, it can act as both a source and a sink. The autumn (September to November) is typically characterized by the region being a net sink for atmospheric CO2. These seasonal variations in FGCO2 have been linked to changes in pCO2, ALK, and TCO2, which are influenced by factors such as upwelling, biological productivity, and air–sea gas exchange [4,8].
In terms of interannual variability, studies have shown that in the tropical Atlantic Ocean, there are significant year-to-year changes in CO2 parameters, which are often associated with large-scale climate modes, such as the Atlantic Niño. For example, during Atlantic Niño events, which are characterized by warmer sea surface temperatures (SSTs) in the eastern equatorial Atlantic, the region can experience enhanced CO2 outgassing due to reduced upwelling and changes in surface ocean carbonate chemistry [9,10]. Conversely, during Atlantic Niña events, the tropical Atlantic can act as a stronger sink for atmospheric CO2.
During the boreal spring and summer months, the tropical Atlantic is generally a net source of CO2 for the atmosphere [8]. This outgassing is primarily driven by the upwelling of CO2-rich subsurface waters, which is enhanced by the trade wind system [11,12]. In contrast, the region acts as a net sink for atmospheric CO2 during the rainy season (June–November), as the Amazon River discharge stimulates enhanced biological productivity and drawdown of CO2 [9]. The tropical Atlantic’s carbon cycle also exhibits significant interannual variability, often driven by large-scale climate modes such as the El Niño–Southern Oscillation (ENSO) and the Atlantic Multidecadal Oscillation (AMO). For example, the 2009 Pacific El Niño event led to a pronounced increase in CO2 outgassing in the tropical Atlantic during the February–May period of 2010, due to the teleconnections between the Pacific and Atlantic basins [13].
The SST in the tropical Atlantic is also important. It is dominated by the annual cycle, with maximum temperatures occurring in boreal spring and minimum temperatures in winter. The equatorial region is particularly warm, often exceeding 27 °C. SST anomalies are frequent and can significantly impact rainfall in South America and West Africa. The dominant winds in this region are the northeast and southeast trade winds, which play a crucial role in forming SST anomalies and influencing ocean circulation. Atmospheric pressure is affected by the North Atlantic High, which moves toward the equator during the dry season and retreats northward during the wet season [14].
Air–sea interactions in the tropical Atlantic are characterized by positive feedback between SST anomalies and trade winds [15]. This feedback amplifies anomalies and contributes to interannual variability. Heat fluxes between the ocean and atmosphere are significant, with horizontal heat flux convergence playing a dominant role in forming SST anomalies. The tropical Atlantic is a region of high biological productivity, particularly in equatorial upwelling systems and along the eastern coasts of South America and Africa. Oceanic and climatic variations affect nutrient availability and primary productivity [16]. Additionally, the authors of [10] found that the tropical Atlantic region is characterized by a stronger correlation between pCO2 and SST, suggesting that temperature-driven solubility changes played a more significant role in controlling the region’s CO2 dynamics compared to biological processes. Furthermore, the authors of [17] reported that the Atlantic Ocean’s carbon sink strength fluctuated considerably on interannual timescales, with the tropical Atlantic exhibiting the most pronounced variability, driven by a combination of ENSO-induced changes in ocean circulation and wind patterns, as well as the influence of the AMO on ocean biogeochemistry.
The oceanic circulation in this region is mainly dominated by equatorial currents and eastern boundary currents, such as the Guinea Current and the Canary Current. These currents play a crucial role in heat and nutrient distribution [18]. Additionally, oceanic eddies like the Caribbean Sea eddy and the northeastern tropical Atlantic eddy are also present and influence local ocean dynamics. The surface ocean circulation in the tropical Atlantic is a complex system influenced by various factors, including trade winds, seasonal variability, and interactions with the atmosphere. The North Brazil Current (NBC) flows northwestward along the Brazilian coast and retroflects into the open ocean, contributing to the formation of the North Equatorial Current. The South Equatorial Current (SEC) is a dominant current that flows westward along the equator. It branches into the North Brazil Current (NBC) and the North Equatorial Countercurrent (NECC) [14,18]. The North Equatorial Countercurrent (NECC) flows eastward between the SEC and the North Equatorial Current, playing a crucial role in the equatorial current system [18]. The Tropical Atlantic Observing System comprises several key components, including the PIRATA array, which has been instrumental in advancing our understanding of the region’s climate dynamics [19].
The overarching objective of this study was to investigate the interannual and seasonal variability of the CO2 parameters ALK, TCO2, pCO2, pH, and FGCO2 in the tropical Atlantic Ocean. The study also explored the relationships between these CO2 parameters and other oceanographic variables (physical ocean variables and climate modes) in the tropical Atlantic Ocean.

2. Materials and Methods

2.1. Area of Study

The study area is located at 30° S to 30° N latitude and 70° W to 20° E longitude, covering a significant portion of the tropical Atlantic Ocean. This region is characterized by a diverse range of climatic and oceanographic conditions. Figure 1 shows the distribution of the elevation with bathymetry from the 2024 version of GEBCO [20] overlaid with the main ocean circulation in the tropical Atlantic Ocean.
The primary dataset for this study was obtained from the Surface Ocean CO2 Atlas (SOCAT) database, which provides a comprehensive collection of pCO2, ALK, TCO2, pH and FGCO2 observations from 1985 to 2022. From the SOCAT dataset, the Global Ocean Surface Carbon [11,12] data were used to analyze the variability of these CO2 parameters in the tropical Atlantic Ocean. These CO2 data were obtained using reconstructed CO2 data from [21] that were reconstructed from data in [22]. The available surface ocean CO2 observations from the SOCAT data were compiled from several oceanographic cruises and underwent quality control. This product represents Level 4 monthly data reconstructed for surface ocean parameters, pCO2, air–sea CO2 fluxes, pH, ALK, and TCO2. The data are available on a 0.25° × 0.25° regular grid. The product was derived using an ensemble-based forward feed neural network approach, incorporating in situ data from the Surface Ocean CO2 Atlas (SOCAT) database. FGCO2 was computed based on the air–sea pCO2 gradient and wind speed dependence following the protocol in [23]. Total surface ocean pH and dissolved inorganic carbon were subsequently calculated using the CO2sys speciation software (https://www.ncei.noaa.gov/access/ocean-carbon-acidification-data-system/oceans/CO2SYS/co2rprt.html, accessed on 23 November 2024) in the primary data of the SOCAT database.
The sea surface temperature and sea surface salinity were extracted from the EN4 dataset with a spatial resolution of 1° × 1° in longitude and latitude. These data cover the period from 1985 to 2022. The EN4 dataset is a comprehensive collection of global ocean surface and subsurface temperature and salinity measurements covering the period from 1900 to the present day [24,25]. These data are organized monthly and are combined with data from several observational datasets that were collected using autonomous floats, oceanographic surveys, and historical archives.
The Global Ocean Biogeochemistry Hindcast, hosted by the Copernicus Marine Service (CMEMS), provides comprehensive 3D biogeochemical fields dating back to 1993, with a spatial resolution of 0.25° and 75 vertical depth levels. Utilizing the PISCES biogeochemical model on the NEMO platform, wind, chlorophyll-a, and net primary production data were obtained from the CMEMS database. These datasets are from GLOBAL_REANALYSIS_BIO_001_029. These data were extracted on a monthly timescale for the available period, from 1993 to 2022 [26].
The climate mode indices, such as the North Atlantic Oscillation (NAO), play a crucial role in understanding atmospheric dynamics. The NAO is characterized by fluctuations in sea level pressure differences between Lisbon, Portugal, and Reykjavik, Iceland, significantly influencing the winter weather patterns and climate variability over the North Atlantic region. In addition, the Atlantic Multidecadal Oscillation (AMO) represents long-term variations in sea surface temperatures in the North Atlantic, which can have profound effects on regional and global climate conditions over decades. Another important climate mode is the El Niño–Southern Oscillation (ENSO), marked by periodic variations in ocean temperatures and atmospheric conditions in the equatorial Pacific, affecting climate patterns worldwide, including precipitation and temperature anomalies [27,28,29]. NAO, AMO, and ENSO data were extracted from the National Center for Atmospheric Research (NCAR) database for the period from 1985 to 2022.

2.2. Methods

The seasonal variability map of each CO2 parameter (pCO2, FGCO2, pCO2, ALK, and TCO2) was obtained by calculating the average of the monthly mean for a specific period: winter (December to February), spring (March to May), summer (June to August), and autumn (September to November). These data were then used to generate seasonal spatial distribution maps for pCO2, FGCO2, SSS, and SST across the tropical Atlantic region with a spatial resolution of 0.25° × 0.25°. The interannual variability of the CO2 parameters (pCO2, TCO2, FGCO2, and pH) in Figure 2 was obtained by calculating the yearly mean of each CO2 parameter for each year from 1985 to 2022.
The Empirical Orthogonal Function (EOF) was used to decompose each CO2 parameter as well as SST and SSS based on the protocol in [30]. The EOF (Empirical Orthogonal Function) tool available on MATLAB Central simplifies the application of spatio-temporal principal component analysis to 3D datasets, such as climate data. It automatically reshapes the input data and performs EOF analysis, providing eigenvalues, EOFs (calculated using Equation (2)), principal components (PCs) (calculated using Equation (3)), and explained variance. Using this tool can save time and effort compared to manual data reshaping and EOF analysis, particularly for large datasets. The EOF analysis was conducted to identify dominant modes of variability in the CO2 parameters (pCO2, ALK, FGCO2, and TCO2) and other related variables. EOF analysis is particularly useful for understanding spatial patterns and temporal dynamics in multivariate datasets. Monthly data from 1985 to 2022 for each parameter were organized into a three-dimensional array with the dimensions corresponding to time, latitude, and longitude.
The calculation of covariance matrix C was performed using the spatially averaged anomalies of the data, as shown in Equation (2):
C = 1 N 1 t = 1 N ( X t X ¯ ) ( X t X ¯ ) T
where X t represents the data matrix at time t, X ¯ is the mean state, and N is the number of time steps.
The covariance matrix is then decomposed into its eigenvalues and eigenvectors:
C . E i = λ i E i
where E i is the eigenvectors (EOFs) and λ i   is the corresponding eigenvalues that indicate the amount of variance explained by each mode.
The principal components (PCs), which represent the time series associated with each EOF were calculated using Equation (2):
P C i = X t T E i
This relationship allows us to reconstruct the original data using the EOFs and their corresponding PCs.
The resulting EOFs and PCs were normalized to facilitate comparison across different parameters. Each EOF represents a spatial pattern of variability, while the associated PC represents the amount of variance explained by a particular mode.
After the seasonal analysis, all the variables were detrended and deseasonalized before applying the EOF methods to the interannual data. The detrending and deseasonalizing of the data prior to the EOF analysis ensures that the identified modes focus on the interannual timescales, allowing for a more detailed investigation of the underlying climate processes and their potential drivers within the tropical Atlantic Ocean.
We followed the methodology outlined in [31] to test the significance of the Empirical Orthogonal Functions (EOFs), eigenvalues, and principal components (PCs) using Monte Carlo simulations and bootstrap methods, as described in [32]. We generated 1000 random datasets that matched the size and structure of the original data (excluding NaN values) to establish significance thresholds for explained variances at the 95th percentile. Significant EOFs were identified by comparing the original explained variances to these thresholds. Additionally, we calculated confidence intervals for the explained variances and PCs through resampling with replacement. The MATLAB code for this analysis is provided in the Supplementary Materials, enabling replication of our methods. This approach enhances the reliability and credibility of our findings.
To visualize the relationships between the CO2 parameters and climate indices, a correlation matrix was constructed and analyzed using the corrplot package in R. The initial step involved calculating the correlation matrix using the cor() function, which quantifies the linear associations between the selected variables. Subsequently, a statistical significance test was conducted on the correlation coefficients using the cor.mtest() function, which resulted in a matrix of p-values (testRes$p). This matrix indicates the significance of each correlation coefficient, providing insight into the reliability of the observed relationships. The correlation matrix calculation was applied to the first two dominant principal components of each CO2 parameter, allowing for a focused examination of the relationships within the data according to [33].

3. Results

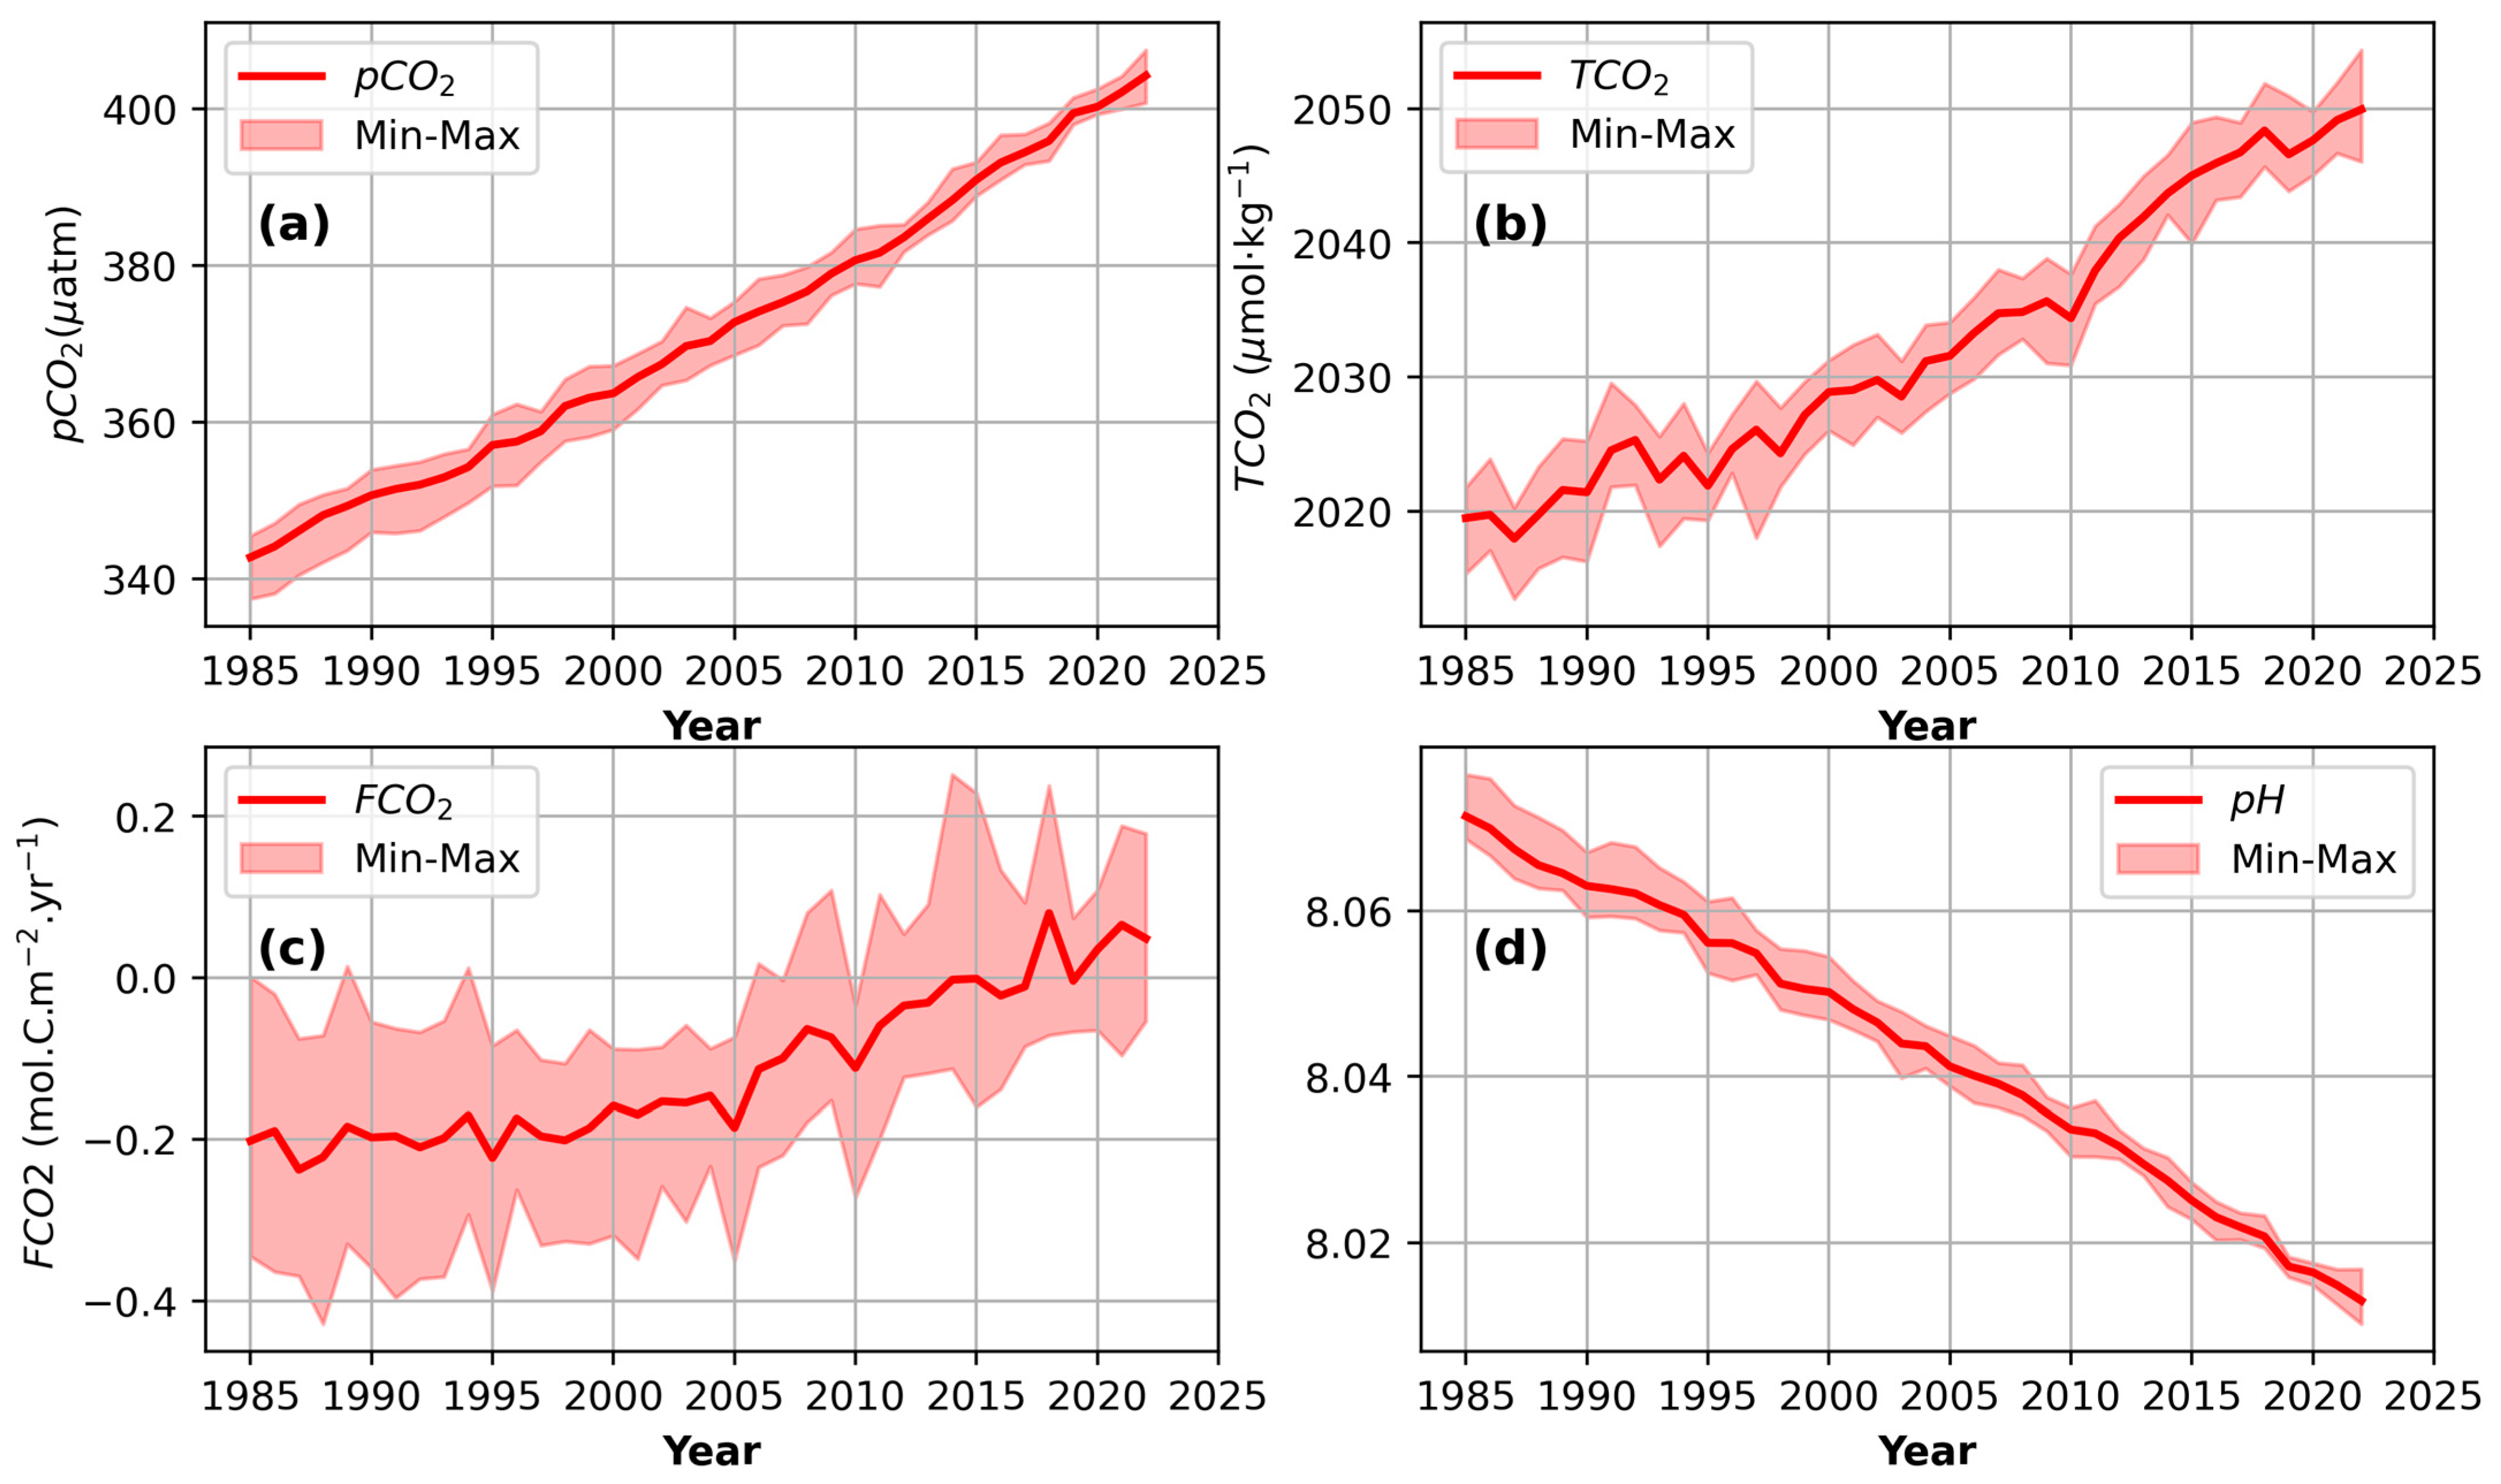
3.1. Time Series of CO2 Parameters

Figure 2 shows the time series of the CO2 parameters related to carbon dynamics and ocean acidification from 1985 to 2022. Each figure shows the yearly mean with a shaded region representing the range between the minimum and maximum values over each year. As previously indicated in the methodology section, this variation in CO2 was calculated by determining the yearly average over the period of 1985 to 2022 in the tropical Atlantic Ocean. In Figure 2a, the interannual variability of pCO2 was characterized by an increased upward trend, from 340 to above 400 μatm over the years, indicating an increase in the CO2 concentration in the ocean. The shaded area in this timeseries reflects the variability, showing the minimum and maximum values during this period, which illustrates the range of fluctuations in the ocean surface pCO2 concentration. Figure 2b shows the time series of the yearly variation in TCO2, measured in micromoles; similar to pCO2, TCO2 showed a gradual increase over time, suggesting a consistent rise in the total inorganic carbon concentration in the tropical Atlantic Ocean from 1800 to above 2050 μmol·kg−1. In Figure 2c, the yearly variability in FGCO2 is presented, measured in moles per square centimeter per year (mol·C·m⁻2·yr⁻1). The data indicate a slight positive trend in FGCO2, suggesting that the ocean’s capacity to absorb CO2 may be increasing, with the values fluctuating between −0.4 and 0.2 mol·C·m⁻2·yr⁻1. The shaded region indicates the variability in CO2 flux, emphasizing occasional peaks and troughs over the years. Figure 2d illustrates the yearly variation in ocean pH over the same period. A clear downward trend in pH was observed, indicating ocean acidification due to increasing CO2 levels. Lower pH values suggest a more acidic ocean environment, which can have detrimental effects on marine life. The shaded area shows the range of pH values, illustrating the extent of the variation over the years. Figure 2 highlights the significant trends in ocean chemistry related to carbon dynamics, including rising pCO2 and TCO2 levels, a slight increase in CO2 flux, and a decline in ocean pH. These variations highlight the impact of anthropogenic CO2 emissions on ocean health and emphasize the ongoing issue of ocean acidification.

3.2. Mean State of Carbon Parameters

Figure 3 presents the spatial distribution of the four CO2 parameters in the tropical Atlantic over the period from 1985 to 2022. The mean variation was estimated from the monthly data. Figure 3a shows the gradient of pCO2 values from south to north, with important values of pCO2 concentrations located in the southern part of this region. Higher pCO2 concentrations were particularly evident around the equator and in certain coastal areas, suggesting significant sources of CO2 in these regions. Figure 3b shows the FGCO2 (mol·C·m⁻2·yr⁻1) data, which illustrate the net exchange of CO2 between the ocean and the atmosphere. The color gradient ranges from blue, indicating CO2 uptake, to red, indicating CO2 release. Some areas showed negative flux values, suggesting that the ocean was absorbing CO2, while others showed positive values, indicating a release into the atmosphere. In Figure 3c, ALK is displayed in micromoles per kilogram (μmol·kg⁻1). The map shows varying alkalinity levels, with red colors representing a higher alkalinity. This parameter is crucial for understanding the ocean’s capacity to buffer changes in acidity, which is influenced by both biological and chemical processes. Figure 3d illustrates the total CO2 (TCO2) levels, also measured in micromoles per kilogram (μmol·kg⁻1). The distribution indicates higher and lower TCO2 concentrations in certain regions, likely influenced by biological activity and ocean circulation patterns.

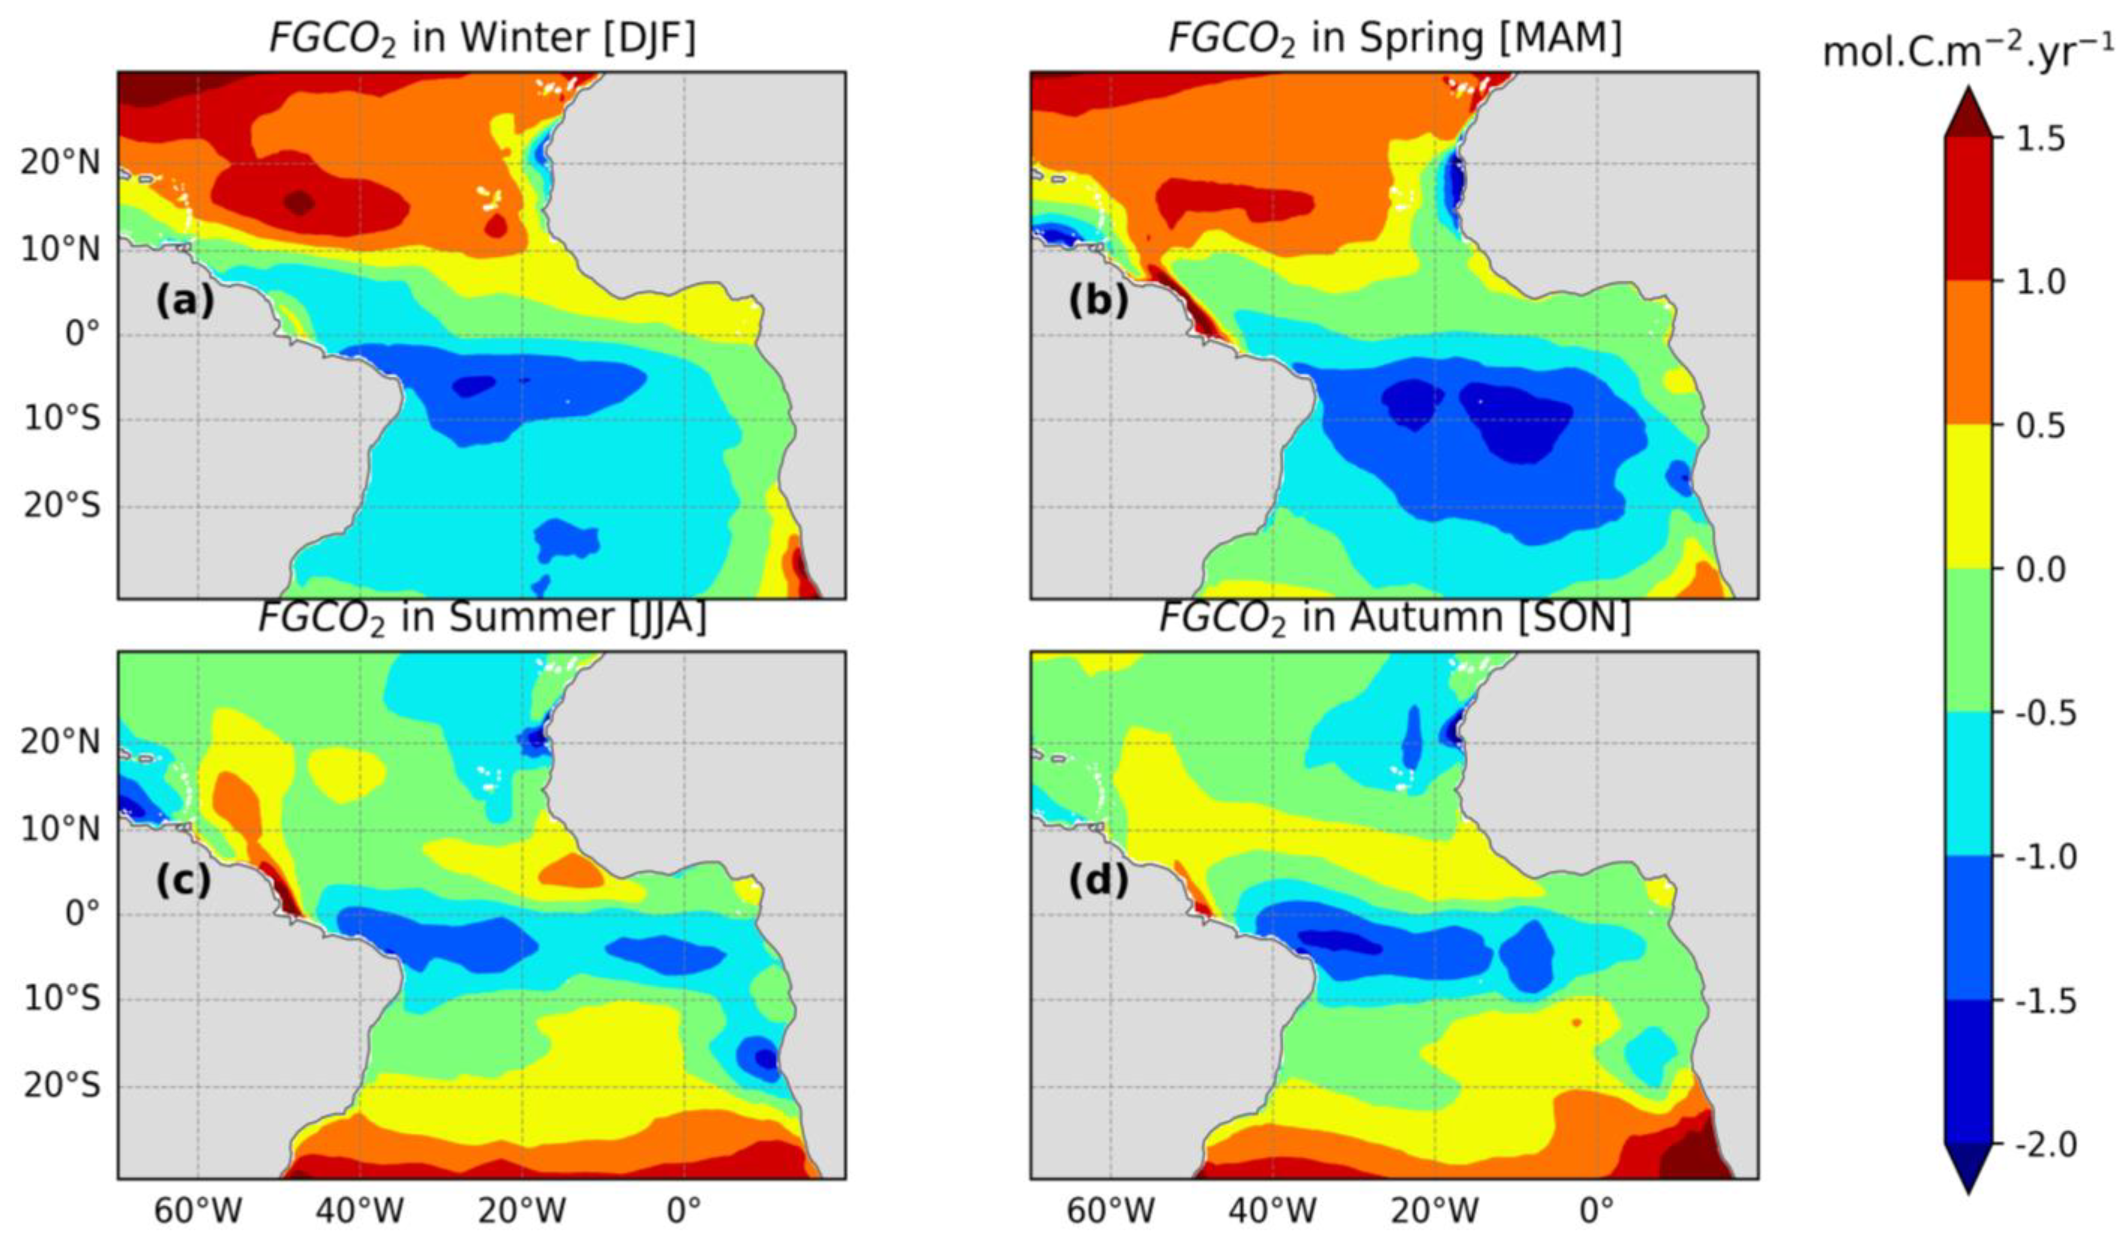
3.3. Seasonal Variability of FGCO2

The seasonal FGCO2 maps were estimated from monthly data selected over specific months from 1985 to 2022. Otherwise, the data were statistically examined in seasonal periods. Seasonal averages were computed by selecting the relevant months for each season (winter, spring, summer, and autumn), as defined previously in the methodology section, and then averaging the monthly data over those selected months. The seasonal patterns of FGCO2 in the tropical Atlantic Ocean exhibited notable spatio-temporal variability, as evidenced by our analysis. During the winter months (December to February), the northern part of the equatorial region showed a strong positive FGCO2, with values reaching up to 1.5 mol·C·m−2·yr−1, indicating a net flux of CO2 from the ocean to the atmosphere, while the southern part of the tropical Atlantic showed a mix of positive and negative FGCO2 values ranging from −1.5 to 0.5 mol·C·m−2·yr−1, suggesting both outgassing and uptake of atmospheric CO2 (Figure 4a). In spring (March to May), the positive FGCO2 signal remained across much of the northern part of the tropical Atlantic, with the highest values exceeding 1.0 mol·C·m−2·yr−1, while the southern region was characterized by negative values and lower values compared to the previous seasons (Figure 4b). The summer months (June to August) were characterized by a more complex pattern, with the equatorial region showing a mix of positive and negative FGCO2 values ranging from −1.5 to 0.5 mol·C·m−2·yr−1, while the northern tropical Atlantic was dominated by negative values, down to −1.0 mol·C·m−2·yr−1, implying a net flux of atmospheric CO2 into the ocean (Figure 4c). Finally, the autumn period (September to November) presented a return to a predominantly positive FGCO2 signal in the equatorial region, with values up to 1.0 mol·C·m−2·yr−1, while the northern tropical Atlantic exhibited a mix of positive and negative fluxes, ranging from −0.5 to 0.5 mol·C·m−2·yr−1 (Figure 4d). These seasonal variations in CO2 exchange are driven by a combination of physical, chemical, and biological processes that modulate the carbon cycle in this dynamic oceanic region.

3.4. Seasonal Variability of pCO2

The seasonal patterns of pCO2 were assessed similarly to the method described for FGCO2 using monthly data spanning from 1985 to 2022. Figure 5 presents the seasonal variability of pCO2 in the tropical Atlantic Ocean during the different seasons. During the winter months (December to February), the southern part of this region showed values exceeding 400 μatm in some areas (Figure 5a). In contrast, the northern tropical Atlantic showed a mixture of positive and negative pCO2 values, ranging from around 375 μatm to 385 μatm, suggesting both outgassing and uptake of atmospheric CO2. In the spring (March to May), the region of high pCO2 expanded across much of the tropical Atlantic, with the equatorial upwelling zone displaying the highest values (over 400 μatm) (Figure 5b). The summer months (June to August) presented a more complex pCO2 distribution, with the equatorial region exhibiting a mix of high and low values, ranging from around 360 μatm to 395 μatm (Figure 5c). The northern tropical Atlantic, on the other hand, was dominated by lower pCO2 values, down to 370 μatm, indicating a potential for increased uptake of atmospheric CO2 by the ocean. Finally, in the autumn (September to November), the pCO2 pattern in the tropical Atlantic resembled that of the winter, with the equatorial region showing the highest values, up to 400 μatm, and the northern tropical Atlantic displaying a mix of positive and negative pCO2 values ranging from 365 μatm to 375 μatm (Figure 5d).

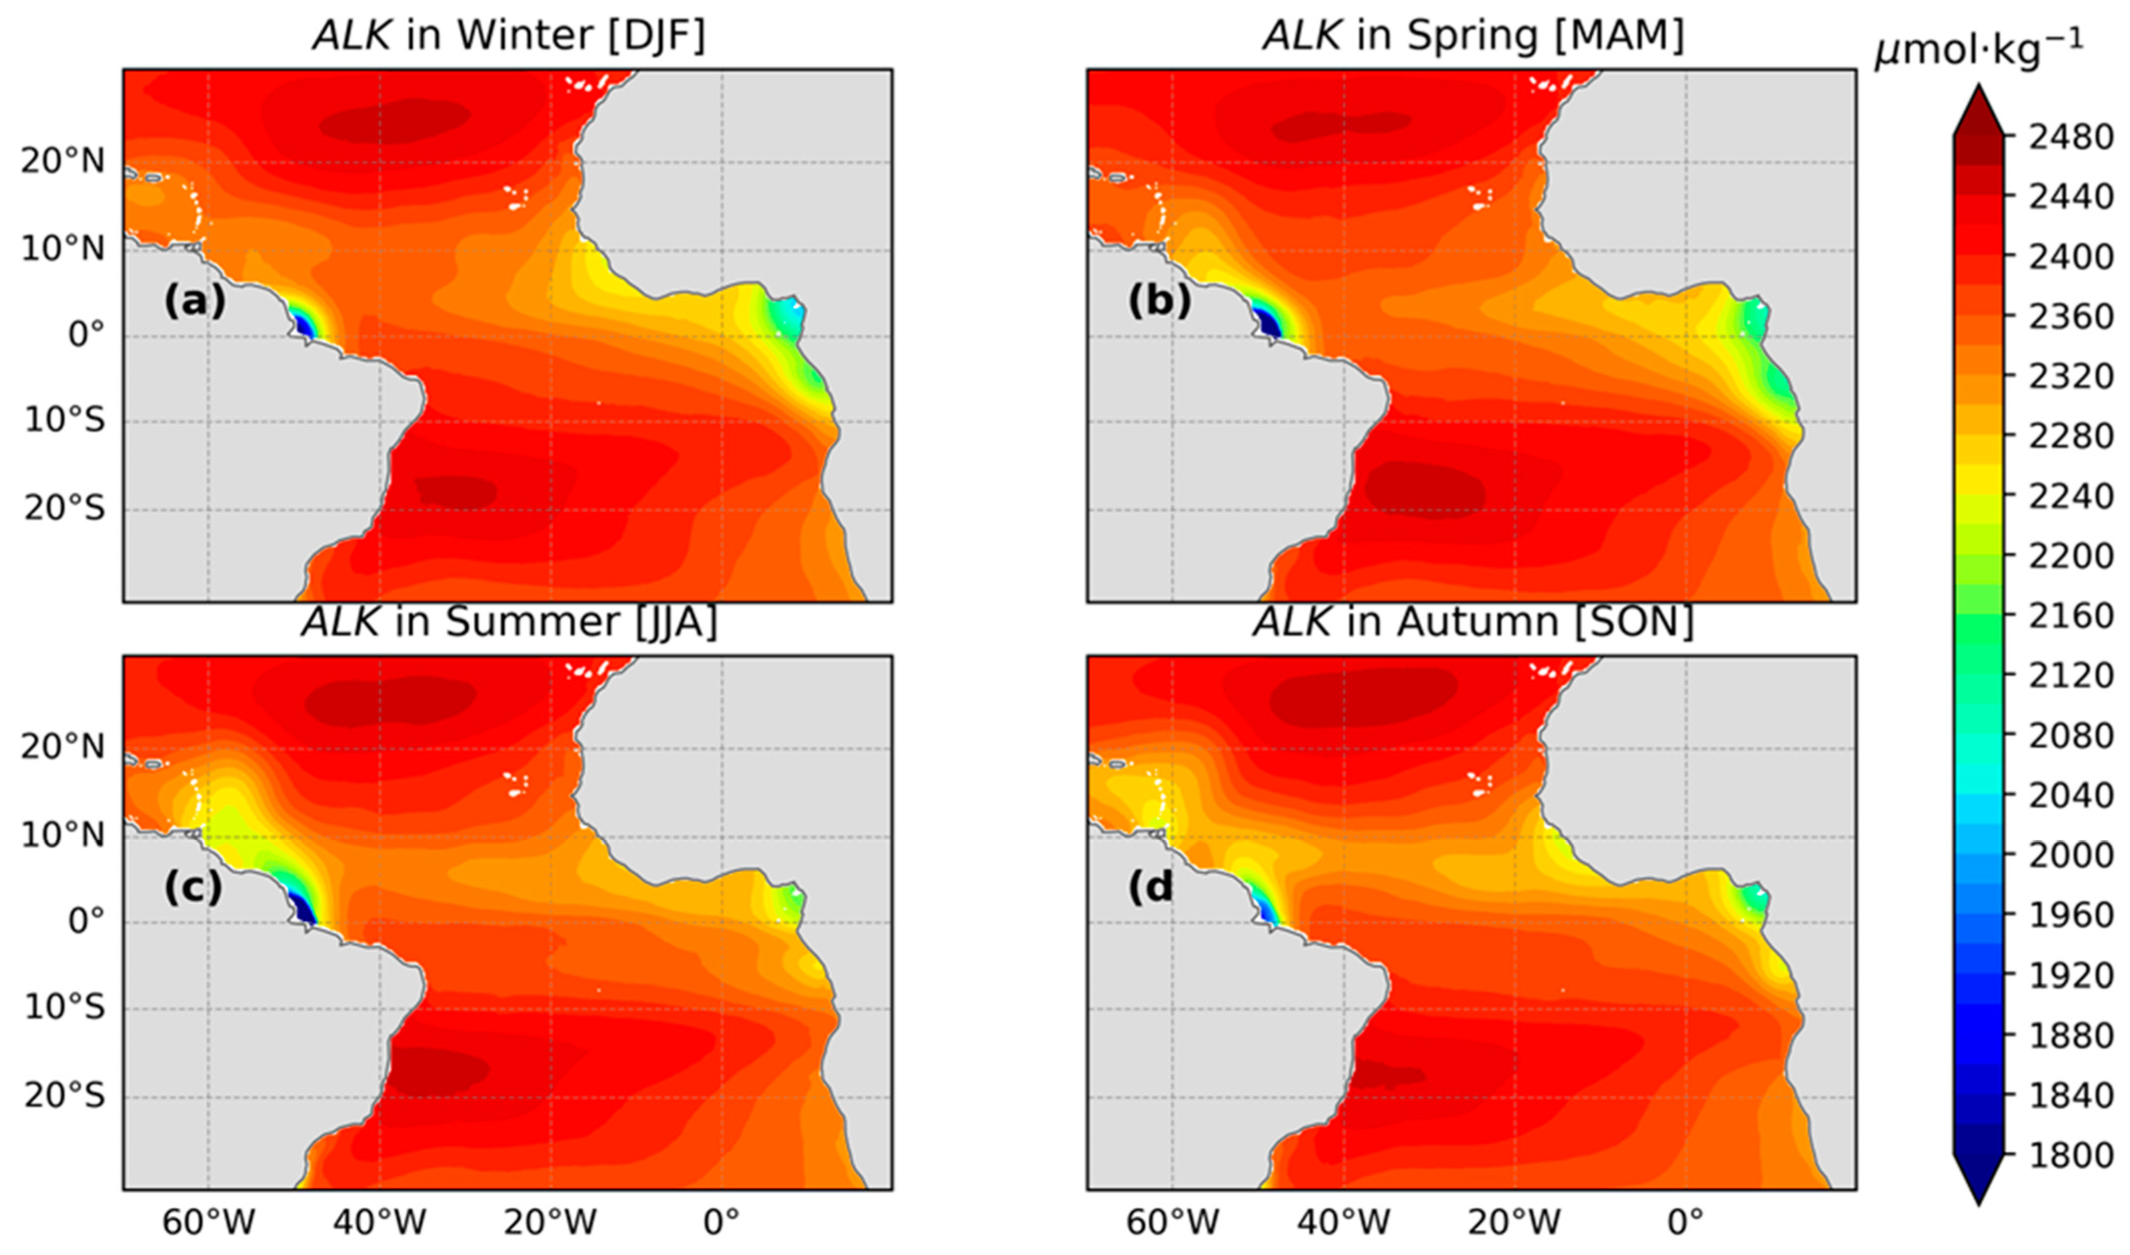
3.5. Seasonal Variability of Total Alkalinity (ALK)

The seasonal variations in ALK were estimated following the previous methodology described for FGCO2 based on the monthly data spanning from 1985 to 2022. During the winter months (December to February), the equatorial region showed very high ALK values, exceeding 2440 μmol/kg, indicating a strong influence of upwelling and mixing processes that bring deep, alkaline waters to the surface (Figure 6a). In contrast, the northern tropical Atlantic showed a mix of high and low ALK, ranging from around 2000 μmol/kg to 2200 μmol/kg. In the spring (March to May), the region of elevated ALK expanded across much of the tropical Atlantic, with the equatorial upwelling zone displaying the highest values (over 2440 μmol/kg) (Figure 6b). This pattern is likely driven by the continued influence of upwelling and biological processes during this season. The summer months (June to August) presented a more complex ALK distribution, with the equatorial region exhibiting a mix of high and low values, ranging from around 1920 μmol/kg to 2200 μmol/kg (Figure 6c). The northern tropical Atlantic, on the other hand, was dominated by lower ALK values, down to 1960 μmol/kg, potentially indicating increased biological uptake and/or reduced upwelling influence. Finally, in the autumn (September to November), the ALK pattern in the tropical Atlantic resembled that of the winter, with the equatorial region showing the highest values, up to 2200 μmol/kg, and the northern tropical Atlantic displaying a mix of high and low ALK, ranging from 2000 μmol/kg to 2120 μmol/kg (Figure 6d). These seasonal variations in the ALK distribution highlight the complex interplay of physical, chemical, and biological processes that shape the carbonate system in the tropical Atlantic Ocean, with the equatorial upwelling region playing a particularly important role in modulating the basin-scale patterns.

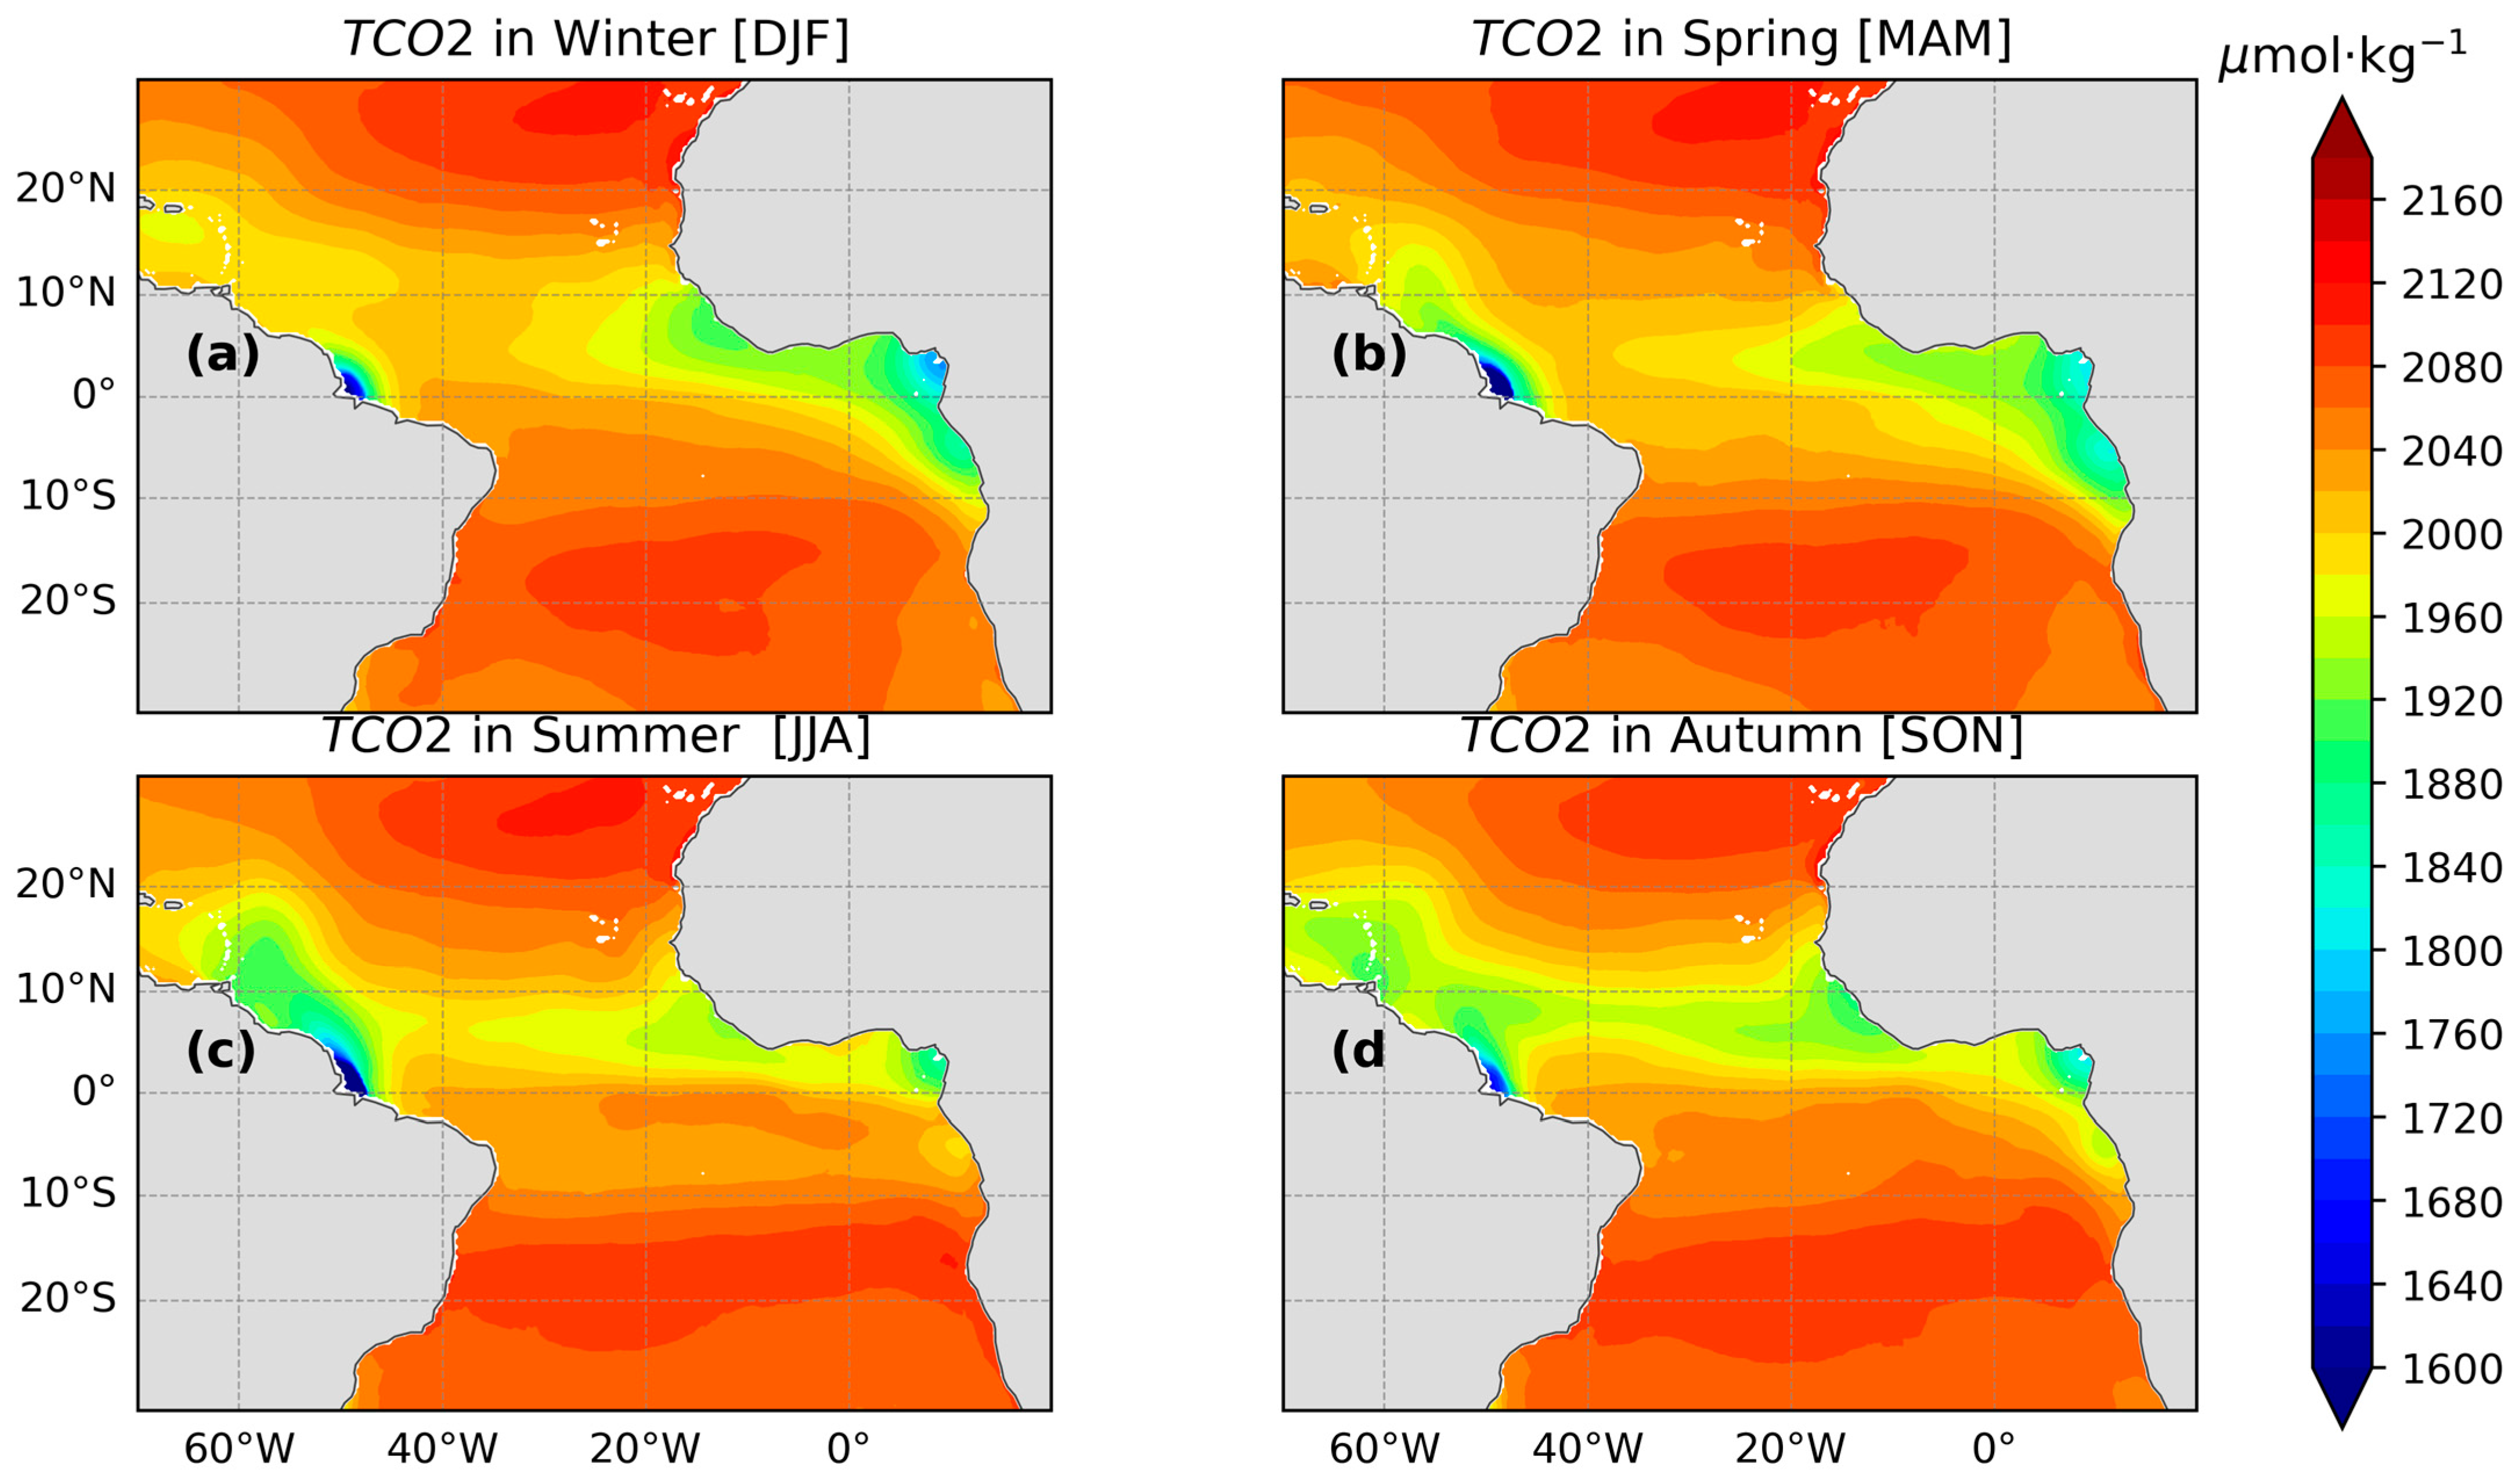
3.6. Seasonal Variability of Total Inorganic Carbon TCO2

The seasonal variability in TCO2 was assessed by employing the previous method that was applied for FGCO2, relying on monthly data covering the period from 1985 to 2022. During the winter months (December to February), the equatorial region showed very high TCO2 values, exceeding 2120 μmol/kg (Figure 7a). In contrast, the central equatorial region displayed a mix of high and low TCO2 values, ranging from around 1920 μmol/kg to 2080 μmol/kg. In the spring (March to May), the region of elevated TCO2 expanded across much of the tropical Atlantic, with the equatorial upwelling zone displaying relatively lower values (Figure 7b). This pattern is likely driven by the continued influence of upwelling and biological processes during this season. The summer months (June to August) presented a more complex TCO2 distribution, with the equatorial region exhibiting a mix of high and low values, ranging from around 1680 μmol/kg to 2000 μmol/kg (Figure 7c). The northern tropical Atlantic, on the other hand, was dominated by lower TCO2 values, down to 1720 μmol/kg. Finally, in the autumn (September to November), the TCO2 pattern in the tropical Atlantic resembled that of the winter, with the equatorial region showing the highest values, up to 2040 μmol/kg, and the northern tropical Atlantic displaying a mix of high and low TCO2 values, ranging from 1800 μmol/kg to 1960 μmol/kg (Figure 7d). The regions near the African and Brazilian coasts were mostly characterized by the lowest values, indicating the influence of rivers (Congo, Niger, and Amazon rivers) on carbon parameters. The seasonal variability of pH, Chl-a, NPP, and wind are provided in the Supplementary Materials.
Figure 8 shows the intricate linkages between the CO2 parameters in the tropical Atlantic Ocean through the normalized principal component (PC) that was computed separately for each variable. The seasonal patterns observed in the principal components reveal the interactions among the different factors. The CO2 parameters, including the normalized PCs of pCO2 and FGCO2, showed synchronized peaks during the mid-year months. This suggests a strong coupling between the pCO2 in the surface ocean and the air–sea flux of CO2. Similarly, the normalized PC of TCO2 showed a more gradual increase throughout the year, reflecting the accumulated effects of ongoing biological and chemical processes. The seasonal pattern of the sea surface temperature (SST), with a mid-year peak, closely matched the trends observed in pCO2, TCO2, and FGCO2. This suggests that temperature plays a significant role in controlling the solubility of CO2 in seawater and influencing biological productivity, which in turn affects the CO2 parameters. The similar seasonal variability in chlorophyll (CHL) and net primary production (NPP) to that of the CO2 parameters indicates a strong coupling between biological activity and carbon cycling. Increased biological productivity during the warmer months likely contributes to the observed mid-year peaks in pCO2 and FGCO2. The wind parameter also exhibited a seasonal pattern, with some peaks throughout the year. These fluctuations in wind patterns may influence the air–sea exchange of CO2, affecting the FGCO2 component and contributing to the overall dynamics of the carbon cycle. The relatively stable behavior of ALK throughout the year, in contrast to the seasonal variations in sea surface salinity (SSS), suggests ALK’s importance in maintaining the overall chemical equilibrium in the ocean. ALK plays a crucial role in buffering changes in ocean acidity, which can be influenced by the absorption and release of CO2, while the more complex pattern in SSS indicates its influence on the chemical equilibria in seawater, affecting the behavior of CO2 and its components.

3.7. Interannual Variability of CO2 Parameters and Climate Indices in the Tropical Atlantic Ocean

Figure 9 shows the spatial distribution of the Empirical Orthogonal Function (EOF) modes and the associated principal component (PC) time series for the CO2 parameters, SST, and SSS in the tropical Atlantic Ocean. The analysis was conducted on detrended and deseasonalized data to focus on the interannual variability within this region. The left sub-figures display the normalized spatial EOF patterns, which represent the dominant modes of variability across the tropical Atlantic basin. The percentage values at the top of each map indicate the fraction of the total variance explained by the respective EOF mode. The right sub-figures show the normalized PC time series associated with the corresponding EOF spatial patterns. These time series capture the temporal evolution of the dominant spatial structures and provide insights into the interannual fluctuations of the ocean climate parameters within the tropical Atlantic.
The EOF1 mode for pCO2 explains 20.43% of the total variance in the tropical Atlantic and exhibited a distinct spatial pattern, with positive anomalies in the equatorial region and negative anomalies in the surrounding the western areas, mainly in the Gulf of Guinea (Figure 9a). The associated normalized PC1 time series displayed pronounced interannual variations, which may be linked to regional climate phenomena and ocean–atmosphere interactions. The EOF1 mode for air–sea CO2 flux (FGCO2) explains 17.36% of the total variance in the tropical Atlantic region (Figure 9c). The spatial pattern exhibited a clear structure, with positive anomalies in the southern part of the equatorial zone and negative anomalies in the surrounding areas and northern part. The normalized PC1 time series demonstrated the pronounced interannual fluctuations of FGCO2 in this region, which may be linked to regional climate phenomena and ocean–atmosphere interactions. The EOF1 mode for TCO2 explains 10.84% of the total variance (Figure 9e). The spatial pattern revealed a distinct structure with positive anomalies near the Brazilian coastal zone and extending to the equatorial region and negative anomalies in the Gulf of Guinea. The normalized PC1 time series demonstrated significant interannual fluctuations. The EOF1 mode for total alkalinity (ALK) explains 8.4% of the variance. The spatial pattern showed a regional structure with negative anomalies distributed across the tropical Atlantic basin except for the western tropical Atlantic zone mainly within the Amazon plume (Figure 9g). The normalized PC1 time series also captured the interannual variability of this parameter. The EOF1 mode for sea surface salinity (SSS) accounted for 21.15% of the total variance (Figure 9i). The spatial pattern exhibited a coherent structure, with negative anomalies distributed across the region. The normalized PC1 time series demonstrated the interannual fluctuations in SSS. The EOF1 mode for sea surface temperature (SST) explains 9.48% of the variance. The spatial pattern showed a distinct structure, with positive anomalies distributed across the tropical Atlantic (Figure 9k). The normalized PC1 time series captured the interannual variability of SST in this region.

4. Discussion

The correlation matrix map obtained according to the protocol in [33] revealed several key relationships between the CO2 parameters and the climate indices. The color of each cell represents the strength and direction of the correlation between the corresponding variables. The darker shades of blue indicate a stronger positive correlation, while the darker shades of red indicate a stronger negative correlation. The white cells represent no significant correlation between the variables. The matrix is arranged in a specific order, with the variables are placed so that similar variables are clustered together. The rectangles around the variables provide a visual separation between them. It is also important that all the EOFs, PCs, and percentage of variance modes used in Figure 10 are statistically significant at the 95% level based on the statistical test described above in the methodology section, as proposed in [31,32].
NINO3.4 (ENSO) showed a moderate negative correlation with FGCO2_PC2 (principal component of second mode for FGCO2; this applies to the rest of the variables, and PC1 refers to the first principal component for the specific variable) and PCO2_PC2, suggesting that El Niño conditions are associated with a lower CO2 flux and partial pressure of CO2. The AMO continued to exhibit a moderate positive correlation with FGCO2_PC2 and PCO2_PC2, indicating that the warm phase of the AMO is linked to a higher CO2 flux and partial pressure of CO2. The NAO maintained a weak negative correlation with FGCO2_PC1, PCO2_PC2, and TCO2_PC1, implying that the positive phase of the NAO may be related to lower values of these CO2-related variables.
The correlation matrix presented in this image provides valuable insights into the complex relationships between the various climate modes and CO2-related parameters. One key finding is the moderate negative correlation between the NINO3.4 index, which tracks the El Niño–Southern Oscillation (ENSO) phenomenon, and FGCO2_PC2 as well as PCO2_PC2. This suggests that during El Niño events, when NINO3.4 values are higher, there is a tendency for a lower CO2 flux and partial pressure of CO2 in the regions represented by the data. This inverse relationship implies that the climate variability associated with El Niño can influence the carbon cycle dynamics in the study area. Another notable observation is the moderate positive correlation between the Atlantic Multidecadal Oscillation (AMO) index and both FGCO2_PC2 and PCO2_PC2. This indicates that during the warm phase of the AMO, when AMO values are higher, there is a tendency for an increased CO2 flux and partial pressure of CO2. The positive correlation between the AMO and these CO2 parameters suggests that long-term climate variability in the Atlantic basin, as captured by the AMO, can impact the carbon cycle in the regions or systems under consideration.
The correlation matrix also reveals a weak negative correlation between the North Atlantic Oscillation (NAO) index and FGCO2_PC1, PCO2_PC2, and TCO2_PC1. This implies that the positive phase of the NAO, characterized by higher NAO values, was associated with lower values of these CO2-related variables. The influence of the NAO, a prominent mode of climate variability in the North Atlantic region, appears to be linked to the CO2 dynamics represented by these principal components.
These findings highlight the complex interactions between large-scale climate modes and the carbon cycle, underscoring the importance of understanding these linkages to improve our knowledge of the drivers and mechanisms underlying the spatial and temporal variations in CO2 fluxes and concentrations. Further research and integration of these climate–carbon cycle relationships can contribute to more accurate modeling, prediction, and management of the global carbon system, especially in the context of ongoing climate change and its impacts.
The findings presented in Figure 2 provide critical insights into the time series data of the CO2 parameters related to carbon dynamics and ocean acidification in the tropical Atlantic Ocean from 1985 to 2022. The observed trends align with global observations reported in the literature, underscoring the regional manifestation of broader climate change impacts. The clear upward trend in pCO2 levels documented in Figure 2a corroborates previous studies that have reported rising pCO2 levels due to increased atmospheric CO2 from human activities [34]. The shaded area reflecting the variability in pCO2 levels emphasizes that fluctuations have occurred, but the overall trajectory is consistent with the broader patterns of climate change. This trend was further reinforced by the gradual increase in TCO2 shown in Figure 2b, which indicated rising total inorganic carbon levels in the ocean. This is a critical finding, as it highlights the ocean’s role as a significant carbon sink, having absorbed approximately 30% of anthropogenic CO2 emissions [3].
Interestingly, the change in FGCO2 presented in Figure 2c showed a slight positive trend, suggesting that the ocean’s capacity to absorb CO2 may be increasing in the tropical Atlantic region. However, the values fluctuated around zero, indicating the dynamic balance between CO2 absorption and release. This observation is consistent with the seasonal and interannual variability in CO2 fluxes noted in previous studies [35], highlighting the complex and ever-changing nature of the ocean’s carbon cycle. The most concerning finding is the clear downward trend in ocean pH over the same period, as illustrated in Figure 2d. This indicates significant ocean acidification as a direct consequence of rising CO2 levels, posing serious risks to marine ecosystems, particularly calcifying organisms such as corals and shellfish. This trend aligns with the broader scientific consensus on the detrimental effects of ocean acidification on marine biodiversity and ecosystem services. The decreasing pH values suggest a more acidic ocean environment, which can have cascading impacts on the productivity and resilience of the tropical Atlantic’s marine communities.
The spatial and seasonal variability of CO2 parameters in the tropical Atlantic Ocean provide significant insights into the dynamics of carbon cycling in this critical region. Figure 3 highlights the complex interactions between physical, chemical, and biological processes that govern the carbon cycle in this dynamic region. In the tropical Atlantic, the seasonal patterns of pCO2 reveal significant fluctuations influenced by various processes. During winter (December to February), high pCO2 values exceeding 400 μatm in the equatorial region indicate a net flux of CO2 from the ocean to the atmosphere. This observation aligns with previous research [34], which identified similar seasonal outgassing driven by reduced biological productivity and cooler temperatures. The gradient of positive and negative pCO2 values in the northern tropical Atlantic suggests a balance of CO2 uptake and release. This reflects the complex dynamics of the carbon cycle in this region. As spring (March to May) arrives, the expansion of high pCO2 values across the tropical Atlantic, particularly in the equatorial upwelling zone, suggests that enhanced biological and physical processes facilitate the release of CO2. This pattern corroborates the findings in [36], which noted that increased nutrient availability during this period stimulates primary productivity, thereby influencing CO2 dynamics. The summer months (June to August) presented a more complex distribution, with the equatorial region exhibiting both high and low pCO2 values. The observed range indicates that while some areas are still releasing CO2, others may be absorbing it, particularly in the northern tropical Atlantic, where the lower pCO2 values suggest increased uptake. This aligns with the study in [37], which highlighted the role of temperature and biological activity in modulating CO2 exchange. In autumn (September to November), the re-emergence of high pCO2 values in the equatorial region indicates a return to conditions similar to winter, reinforcing the seasonal cycle of CO2 exchange. This cyclical pattern underscores the importance of continuous monitoring to understand the broader implications for carbon cycling in a changing climate. These seasonal patterns are significant because they highlight the dynamic nature of the carbon cycle and the various factors influencing CO2 changes in the tropical Atlantic.
The seasonal variability of total alkalinity (ALK) exhibited a similar narrative, with extremely high values (exceeding 2440 μmol/kg) in the equatorial region during winter, driven by upwelling and mixing processes. These findings are consistent with those of previous studies emphasizing the upwelling of alkaline waters as a critical driver of ALK distribution [38]. The mix of high and low ALK values in the northern tropical Atlantic suggests that biological processes may also play a role in modulating alkalinity. In spring, the expansion of elevated ALK values across the region is indicative of sustained upwelling and biological activity, which contribute to the carbonate system’s dynamics. The summer months, characterized by a more complex distribution, show a decline in alkalinity in the northern tropical Atlantic. This potentially reflects increased biological uptake of carbonate ions [39]. The autumn pattern, resembling the winter conditions, highlights the stability of high ALK values in the equatorial region. The cyclical nature of ALK emphasizes its role in buffering ocean acidity, which is crucial for maintaining marine ecosystem health, particularly in light of ongoing ocean acidification. The patterns of the total inorganic carbon (TCO2) levels closely followed those of pCO2 and ALK. High TCO2 values during winter (exceeding 2120 μmol/kg) indicate the influence of upwelling, which brings carbon-rich waters to the surface. This aligns with the findings in [40], which discussed the significance of deep-water contributions to surface carbon levels. As spring progressed, elevated TCO2 levels continued to expand, reflecting the ongoing influence of biological and physical processes. The summer months displayed a decline in TCO2 values in the northern tropical Atlantic, suggesting increased biological uptake and reduced upwelling influences. This seasonal variability illustrates the dynamic nature of the carbon cycle in response to environmental changes, as noted in [41]. The return to high TCO2 values in the autumn reinforces the cyclical patterns observed in the other parameters, underscoring the interconnectedness of physical, chemical, and biological processes in regulating the carbon dynamics in the tropical Atlantic.
The results presented in Figure 8 highlight the seasonal variability of the CO2 parameters and their relationships with sea surface temperature (SST) and sea surface salinity (SSS) in the tropical Atlantic region. The strong seasonal dynamics observed in the normalized partial pressure of CO2 (pCO2) and its flux (FGCO2) underscore the significant role that biological processes may play in modulating CO2 levels throughout the year. Mode 1 for pCO2, which accounted for 86.18% of the variability, suggests that seasonal factors, particularly temperature, heavily influence CO2 dynamics. This aligns with findings in [42,43,44,45], which noted that increased temperatures enhance biological productivity, subsequently affecting CO2 concentrations in ocean waters. Similarly, the flux of CO2 (FGCO2), which has a Mode 1 variability of 84.60%, highlights how the ocean acts as both a source and sink of CO2, depending on the seasonal conditions. The peak in mid-year aligns with the notion that warmer temperatures and increased biological activity during this period lead to greater CO2 release into the atmosphere. Understanding these dynamics is crucial for predicting CO2 exchange processes in a changing climate, as the ocean’s capacity to absorb CO2 decreases with higher temperatures [41]. The total CO2 (TCO2) levels, with a Mode 1 variability of 62.66%, exhibited a more gradual increase throughout the year, suggesting a continuous accumulation of CO2 influenced by biological and chemical processes. This observation is consistent with the concept that TCO2 levels reflect long-term changes in carbon cycling, including inputs from terrestrial runoff and organic matter decomposition [39].
The relationships observed in the correlation matrix are consistent with those of previous studies on the linkages between climate modes and surface CO2 dynamics in the tropical Atlantic Ocean. For example, one study [13] examined the influence of ENSO and the AMO on the pCO2 in the tropical Atlantic Ocean. In ref. [13], it was found that during El Niño events, the tropical Atlantic region experienced a decrease in pCO2, which is in line with the negative correlation between NINO3.4 and PCO2_PC2 observed in the provided correlation matrix. The authors attributed this to the reduced upwelling and increased stratification associated with El Niño conditions, leading to a reduction in the supply of CO2-rich waters to the surface. Regarding the positive correlation between the AMO and the CO2-related variables (FGCO2_PC2 and PCO2_PC2), similar findings have been reported in another study [46]. They demonstrated that the warm phase of the AMO in the tropical Atlantic was linked to higher sea surface pCO2 levels, which could be related to enhanced biological productivity and increased CO2 outgassing during this climatic regime [46]. These studies provide a useful context for interpreting the climate–carbon cycle linkages observed in the provided correlation matrix, specifically within the tropical Atlantic Ocean region.

5. Conclusions

The analysis of carbon dynamics in the tropical Atlantic Ocean over the period from 1985 to 2022 revealed critical insights into the interplay between various oceanographic factors, with a particular focus on time series data related to pCO2, FCO2, TCO2, and pH levels. The time series data exhibited notable trends in pCO2, highlighting periods of increasing concentrations that correlate with rising atmospheric CO2 levels. The CO2 parameters in the tropical Atlantic Ocean were also affected by biological productivity and strong upwelling, where TCO2 concentrations also rose, reinforcing the ocean’s role as a significant carbon sink. The application of Empirical Orthogonal Functions (EOFs) provides valuable insights into the spatial patterns of pCO2 and related variables. This statistical approach highlights the dominant modes of variability and helps to elucidate the underlying processes driving changes in ocean chemistry. Overall, the findings emphasize the importance of monitoring pH and TCO2 alongside pCO2 to gain a comprehensive understanding of ocean acidification processes.
The relationships of CO2 parameters with other variables illustrate the complex dynamics that govern oceanic carbon levels in the tropical Atlantic. The ongoing changes in ocean chemistry necessitate continuous research and monitoring to inform effective management strategies. These strategies are essential for mitigating the impacts of climate change and ocean acidification, ultimately aiming to preserve marine ecosystems and ensure the sustainability of ocean resources. Understanding these intricate relationships will be vital for responding to future environmental challenges and safeguarding ocean health. The seasonal variability of pCO2, TALK, and TCO2 in the tropical Atlantic Ocean highlights the complex interplay of the processes that shape the carbon cycle. These findings emphasize the importance of understanding these dynamics in the context of climate change and ocean acidification, which pose significant threats to marine ecosystems. The findings underscore the importance of understanding the spatio-temporal variability of CO2 dynamics in the tropical Atlantic. The monitoring of CO2 is essential to unraveling the complexities of these interactions and their implications for carbon cycling in the context of ongoing climate change. The figure highlights significant trends in ocean chemistry related to carbon dynamics, including rising pCO2 and TCO2 levels, a slight increase in CO2 flux, and a decline in ocean pH. These changes underscore the profound impact of anthropogenic CO2 emissions on ocean health and emphasize the ongoing issue of ocean acidification. The shaded areas provide valuable context for understanding the variability in these measurements, illustrating the range of fluctuations in each parameter over time.
The correlation matrix underscores the significant relationships between climate modes and CO2-related parameters in the tropical Atlantic Ocean. Notably, the negative correlation with NINO3.4 suggests that El Niño events may lead to a reduced CO2 flux and partial pressure, while the positive correlation with the AMO indicates that its warm phase is associated with increased CO2 levels. These findings highlight the complex inter-relationships between climate variability and the carbon cycle, emphasizing the need for further research to understand these dynamics in the context of ongoing climate change.

Supplementary Materials

The following supporting information can be downloaded at: https://www.mdpi.com/article/10.3390/jmse12122248/s1.

Author Contributions

Conceptualization, F.B. and Z.S.; data curation, N.D.; formal analysis, F.B. and N.D.; methodology, F.B. and N.D.; supervision, Z.S.; validation, N.D.; writing—original draft, F.B.; writing—review and editing, A.M.D., F.B. and Z.S. All authors have read and agreed to the published version of the manuscript.

Funding

This research received no external funding.

Institutional Review Board Statement

Not applicable.

Informed Consent Statement

Not applicable.

Data Availability Statement

The SOCAT CO2 data for the CO2 parameters are publicly available at https://socat.info/ (accessed on 23 November 2024).

Acknowledgments

We acknowledge the SAOCAT CO2 data contributors and IRHOB for providing technical assistance.

Conflicts of Interest

The authors declare no conflicts of interest.

References

  1. Davila, X.; Gebbie, G.; Brakstad, A.; Lauvset, S.K.; McDonagh, E.L.; Schwinger, J.; Olsen, A. How Is the Ocean Anthropogenic Carbon Reservoir Filled? Glob. Biogeochem. Cycles 2022, 36, e2021GB007055. [Google Scholar] [CrossRef]
  2. Alexander, L.; Allen, S.; Bindoff, N.L.; Breon, F.-M. Climate change 2013: The physical science basis, in contribution of Working Group I (WGI) to the Fifth Assessment Report (AR5) of the Intergovernmental Panel on Climate Change (IPCC). In Climate Change 2013: The Physical Science Basis; Cambridge University Press: Cambridge, UK, 2013. [Google Scholar]
  3. Sabine, C.L.; Feely, R.A.; Gruber, N.; Key, R.M.; Lee, K.; Bullister, J.L.; Wanninkhof, R.; Wong, C.S.; Wallace, D.W.R.; Tilbrook, B.; et al. The Oceanic Sink for Anthropogenic CO2. Science 2004, 305, 367–371. [Google Scholar] [CrossRef] [PubMed]
  4. Lefèvre, N.; Diverrès, D.; Gallois, F. Origin of CO2 undersaturation in the western tropical Atlantic. Tellus B 2010, 62, 595–607. [Google Scholar] [CrossRef]
  5. Chikamoto, M.O.; DiNezio, P. Multi-Century Changes in the Ocean Carbon Cycle Controlled by the Tropical Oceans and the Southern Ocean. Glob. Biogeochem. Cycles 2021, 35, e2021GB007090. [Google Scholar] [CrossRef]
  6. Bonou, F.K.; Noriega, C.; Lefèvre, N.; Araujo, M. Distribution of CO2 parameters in the Western Tropical Atlantic Ocean. Dyn. Atmos. Oceans 2016, 73, 47–60. [Google Scholar] [CrossRef]
  7. Bonou, F.; Medeiros, C.; Noriega, C.; Araujo, M.; Hounsou-Gbo, A.; Lefèvre, N. A comparative study of total alkalinity and total inorganic carbon near tropical Atlantic coastal regions. J. Coast. Conserv. 2022, 26, 31. [Google Scholar] [CrossRef]
  8. Padin, X.A.; Gago, J.; Gilcoto, M.; Alvarez, M.; Pardo, P.C. Air-sea CO2 fluxes in the Atlantic as measured during the FICARAM cruises. Biogeosci. Discuss. 2010, 7, 1587–1606. Available online: www.biogeosciences-discuss.net/6/5589/2009/ (accessed on 23 November 2024). [CrossRef]
  9. Ibánhez, J.S.P.; Flores, M.; Lefèvre, N. Collapse of the tropical and subtropical North Atlantic CO2 sink in boreal spring of 2010. Sci. Rep. 2017, 7, srep41694. [Google Scholar] [CrossRef]
  10. Jiang, L.; Cai, W.; Wanninkhof, R.; Wang, Y.; Lüger, H. Air-sea CO2 fluxes on the U.S. South Atlantic Bight: Spatial and seasonal variability. J. Geophys. Res. Oceans 2008, 113, C07019. [Google Scholar] [CrossRef]
  11. Padin, X.A.; Vázquez-Rodríguez, M.; Castaño, M.; Velo, A.; Alonso-Pérez, F.; Gago, J.; Gilcoto, M.; Álvarez, M.; Pardo, P.C.; de la Paz, M.; et al. Air-Sea CO2 fluxes in the Atlantic as measured during boreal spring and autumn. Biogeosciences 2010, 7, 1587–1606. [Google Scholar] [CrossRef]
  12. Lefèvre, N.; Guillot, A.; Beaumont, L.; Danguy, T. Variability of fCO2 in the Eastern Tropical Atlantic from a moored buoy. J. Geophys. Res. Oceans 2008, 113, C01015. [Google Scholar] [CrossRef]
  13. Lefèvre, N.; Caniaux, G.; Janicot, S.; Gueye, A.K. Increased CO2 outgassing in February-May 2010 in the tropical Atlantic following the 2009 Pacific El Niño. J. Geophys. Res. Oceans 2013, 118, 1645–1657. [Google Scholar] [CrossRef]
  14. GFoltz, G.R.; McPhaden, M.J. Impact of Barrier Layer Thickness on SST in the Central Tropical North Atlantic. J. Clim. 2009, 22, 285. [Google Scholar] [CrossRef]
  15. Frankignoul, C.; Kestenare, E. Air–Sea Interactions in the Tropical Atlantic: A View Based on Lagged Rotated Maximum Covariance Analysis. J. Clim. 2005, 18, 3874–3890. [Google Scholar] [CrossRef]
  16. Brandt, P.; Alory, G.; Awo, F.M.; Dengler, M.; Djakouré, S.; Koungue, R.A.I.; Jouanno, J.; Körner, M.; Roch, M.; Rouault, M. Physical processes and biological productivity in the upwelling regions of the tropical Atlantic. Ocean Sci. 2023, 19, 581–601. [Google Scholar] [CrossRef]
  17. Landschützer, P.; Gruber, N.; Bakker, D.C.E.; Schuster, U. Recent variability of the global ocean carbon sink. Glob. Biogeochem. Cycles 2014, 28, 927–949. [Google Scholar] [CrossRef]
  18. Foltz, G.R.; Brandt, P.; Richter, I.; Rodríguez-Fonseca, B.; Hernandez, F.; Dengler, M.; Rodrigues, R.R.; Schmidt, J.O.; Yu, L.; Lefevre, N.; et al. The Tropical Atlantic Observing System. Front. Mar. Sci. 2019, 6, 206. [Google Scholar] [CrossRef]
  19. Bourlès, B.; Araujo, M.; McPhaden, M.J.; Brandt, P.; Foltz, G.R.; Lumpkin, R.; Giordani, H.; Hernandez, F.; Lefèvre, N.; Nobre, P.; et al. PIRATA: A Sustained Observing System for Tropical Atlantic Climate Research and Forecasting. Earth Space Sci. 2019, 6, 577–616. [Google Scholar] [CrossRef]
  20. GEBCO Bathymetric Compilation Group 2024. GEBCO_2024 Grid. British Oceanographic Data Centre. Available online: https://www.bodc.ac.uk/data/published_data_library/catalogue/10.5285/1c44ce99-0a0d-5f4f-e063-7086abc0ea0f (accessed on 15 September 2024).
  21. Chau, T.T.T.; Gehlen, M.; Chevallier, F. A seamless ensemble-based reconstruction of surface ocean pCO2 and air–sea CO2 fluxes over the global coastal and open oceans. Biogeosciences 2022, 19, 1087–1109. [Google Scholar] [CrossRef]
  22. Bakker, D.C.E.; Pfeil, B.; Landa, C.S.; Metzl, N.; O’Brien, K.M.; Olsen, A.; Smith, K.; Cosca, C.; Harasawa, S.; Jones, S.D.; et al. A multi-decade record of high-quality fCO2 data in version 3 of the Surface Ocean CO2 Atlas (SOCAT). Earth Syst. Sci. Data 2016, 8, 383–413. [Google Scholar] [CrossRef]
  23. Wanninkhof, R. Relationship between wind speed and gas exchange over the ocean revisited. Limnol. Oceanogr. Methods 2014, 12, 351–362. [Google Scholar] [CrossRef]
  24. Cheng, L.; Zhu, J.; Cowley, R.; Boyer, T.; Wijffels, S. Time, Probe Type, and Temperature Variable Bias Corrections to Historical Expendable Bathythermograph Observations. J. Atmos. Ocean. Technol. 2014, 31, 1793–1825. [Google Scholar] [CrossRef]
  25. Levitus, S.; Antonov, J.I.; Boyer, T.P.; Locarnini, R.A.; Garcia, H.E.; Mishonov, A.V. Global ocean heat content 1955–2008 in light of recently revealed instrumentation problems. Geophys. Res. Lett. 2009, 36, L07608. [Google Scholar] [CrossRef]
  26. Copernicus Marine Service (CMEMS). Global Ocean Biogeochemistry Hindcast; CMEMS: Ramonville-Saint-Agne, France, 2024; Available online: http://marine.copernicus.eu/documents/QUID/CMEMS-GLO-QUID-001-029.pdf (accessed on 23 November 2024).
  27. Ding, R.; Nnamchi, H.C.; Yu, J.-Y.; Li, T.; Sun, C.; Li, J.; Tseng, Y.; Li, X.; Xie, F.; Feng, J.; et al. North Atlantic oscillation controls multidecadal changes in the North Tropical Atlantic−Pacific connection. Nat. Commun. 2023, 14, 862. [Google Scholar] [CrossRef] [PubMed]
  28. Schneider, D.P.; Deser, C.; Fasullo, J.; Trenberth, K.E. Climate Data Guide Spurs Discovery and Understanding. Eos Trans. Am. Geophys. Union 2013, 94, 121–122. [Google Scholar] [CrossRef]
  29. Xu, F.; Wang, S.; Li, Y.; Feng, J. Synergistic effects of the winter North Atlantic Oscillation (NAO) and El Niño–Southern Oscillation (ENSO) on dust activities in North China during the following spring. Atmos. Meas. Tech. 2024, 24, 10689–10705. [Google Scholar] [CrossRef]
  30. Greene, C.A.; Thirumalai, K.; Kearney, K.A.; Delgado, J.M.; Schwanghart, W.; Wolfenbarger, N.S.; Thyng, K.M.; Gwyther, D.E.; Gardner, A.S.; Blankenship, D.D. The Climate Data Toolbox for MATLAB. Geochem. Geophys. Geosyst. 2019, 20, 3774–3781. [Google Scholar] [CrossRef]
  31. North, G.R.; Bell, T.L.; Cahalan, R.F.; Moeng, F.J. Sampling Errors in the Estimation of Empirical Orthogonal Functions. Mon. Weather Rev. 1982, 110, 699–706. [Google Scholar] [CrossRef]
  32. Perry, R.; Panigrahi, S.; Bien, J.; Witten, D. Inference on the proportion of variance explained in principal component analysis. arXiv 2024. [Google Scholar] [CrossRef]
  33. Wei, T.; Simko, V.; Levy, M.; Xie, Y.; Jin, Y.; Zemla, J. corrplot: Visualization of a Correlation Matrix. 14 October 2024. Available online: https://cran.r-project.org/web/packages/corrplot/index.html (accessed on 5 November 2024).
  34. Takahashi, T.; Sutherland, S.C.; Wanninkhof, R.; Sweeney, C.; Feely, R.A.; Chipman, D.W.; Hales, B.; Friederich, G.; Chavez, F.; Sabine, C.; et al. Climatological mean and decadal change in surface ocean pCO2, and net sea–air CO2 flux over the global oceans. Deep. Sea Res. Part II Top. Stud. Oceanogr. 2009, 56, 554–577. [Google Scholar] [CrossRef]
  35. Takahashi, T.; Sutherland, S.; Chipman, D.; Goddard, J.; Ho, C.; Newberger, T.; Sweeney, C.; Munro, D. Climatological distributions of pH, pCO2, total CO2, alkalinity, and CaCO3 saturation in the global surface ocean, and temporal changes at selected locations. Mar. Chem. 2014, 164, 95–125. [Google Scholar] [CrossRef]
  36. Schneider, B.; Otto, S. Organic matter mineralization in the deep water of the Gotland Basin (Baltic Sea): Rates and oxidant demand. J. Mar. Syst. 2019, 195, 20–29. [Google Scholar] [CrossRef]
  37. Marinov, I.; Sarmiento, J. The Role of the Oceans in the Global Carbon Cycle: An Overview. In The Ocean Carbon Cycle and Climate; Springer: Dordrecht, The Netherlands, 2004. [Google Scholar] [CrossRef]
  38. Gattuso, J.-P.; Hansson, L. Ocean Acidification; Oxford University Press: Oxford, UK, 2011; Available online: https://academic.oup.com/book/40630 (accessed on 15 September 2024).
  39. Cai, W.-J. Estuarine and Coastal Ocean Carbon Paradox: CO2 Sinks or Sites of Terrestrial Carbon Incineration? Annu. Rev. Mar. Sci. 2011, 3, 123–145. [Google Scholar] [CrossRef] [PubMed]
  40. Doney, S.C.; Fabry, V.J.; Feely, R.; Kleypas, J.A. Ocean acidification: The other CO2 problem. Annu. Rev. Mar. Sci. 2009, 1, 169–192. [Google Scholar] [CrossRef] [PubMed]
  41. Feely, R.; Doney, S.; Cooley, S. Ocean Acidification: Present Conditions and Future Changes in a High-CO2 World. Oceanography 2009, 22, 36–47. [Google Scholar] [CrossRef]
  42. Dahunsi, A.M.; Oyikeke, T.S.; Abdulfatai, M.A.; Afolabi, L.A. Spatio-temporal assessment of the impacts of the trends in physical and biogeochemical parameters on the primary production of the Gulf of Guinea. Heliyon 2023, 9, e13047. [Google Scholar] [CrossRef]
  43. Pérez, V.; Fernández, E.; Marañón, E.; Serret, P.; García-Soto, C. Seasonal and interannual variability of chlorophyll a and primary production in the Equatorial Atlantic: In situ and remote sensing observations. J. Plankton Res. 2005, 27, 189–197. [Google Scholar] [CrossRef]
  44. Grodsky, S.A.; Carton, J.A.; McClain, C.R. Variability of upwelling and chlorophyll in the equatorial Atlantic. Geophys. Res. Lett. 2008, 35, L03610. [Google Scholar] [CrossRef]
  45. Nieto, K.; Mélin, F. Variability of chlorophyll-a concentration in the Gulf of Guinea and its relation to physical oceanographic variables. Prog. Oceanogr. 2017, 151, 97–115. [Google Scholar] [CrossRef]
  46. Fay, A.R.; McKinley, G.A. Global trends in surface ocean pCO2 from in situ data. Glob. Biogeochem. Cycles 2013, 27, 541–557. [Google Scholar] [CrossRef]
Figure 1. Study area with spatial distribution of elevation from GEBCO 2024 [20]; data of main surface ocean circulation in tropical Atlantic. The arrows indicate the ocean surface circulation direction.
Jmse 12 02248 g001
Figure 2. Yearly averages of CO2 parameters from 1985 to 2022. Shaded area shows minimum and maximum values each year for (a) pCO2 (μatm), (b) TCO2 (μmol·kg⁻1), (c) FCO2 (mol·C·m⁻2·yr⁻1), and (d) pH.
Jmse 12 02248 g002
Figure 3. Spatial distribution of average (a) pCO2, (b) FGCO2, (c) total alkalinity (ALK), and (d) total inorganic carbon (TCO2) over the period 1985 to 2022.
Jmse 12 02248 g003
Figure 4. Seasonal variability of FGCO2 during boreal: (a) winter (December–January–February: DJF), (b) spring (March-April-May: MAM), (c) summer (June–July–August: JJA), and (d) autumn (September–October–November: SON).
Jmse 12 02248 g004
Figure 5. Seasonal variability of pCO2 during boreal (a) winter (December–January–February: DJF), (b) spring (March–April–May: MAM), (c) summer (June–July–August: JJA), and (d) autumn (September–October–November: SON).
Jmse 12 02248 g005
Figure 6. Seasonal variability of total alkalinity (ALK) during boreal (a) winter (December–January–February: DJF), (b) spring (March–April–May: MAM), (c) summer (June–July–August: JJA), and (d) autumn (September–October–November: SON).
Jmse 12 02248 g006
Figure 7. Seasonal variability of total inorganic carbon during boreal (a) winter (December–January–February: DJF), (b) spring (March–April–May: MAM), (c) summer (June–July–August: JJA), and (d) autumn (September–October–November: SON).
Jmse 12 02248 g007
Figure 8. Seasonal variability of principal component (PCs) of CO2 parameters (pCO2, TCO2, FGCO2, ALK), SSS, SST, CHL, net primary production, and wind in tropical Atlantic Ocean.
Jmse 12 02248 g008
Figure 9. Spatial patterns of the first Empirical Orthogonal Function (EOF1) and corresponding normalized principal component (PC) time series for various parameters in the tropical Atlantic Ocean.
Jmse 12 02248 g009
Figure 10. Correlation matrix showing the relationships between the climate modes (NINO3.4, AMO, and NAO) and CO2-related parameters (FGCO2, PCO2, and TCO2) in the study region. The colors indicate the strength and direction of correlations, with blue for positive and red for negative. The significant correlations (95% of significance level) highlight the interplay between climate variability and carbon cycle dynamics. The cross means, there is no significance.
Jmse 12 02248 g010
Disclaimer/Publisher’s Note: The statements, opinions and data contained in all publications are solely those of the individual author(s) and contributor(s) and not of MDPI and/or the editor(s). MDPI and/or the editor(s) disclaim responsibility for any injury to people or property resulting from any ideas, methods, instructions or products referred to in the content.

