Article

A Comparative Study on Acoustic Characteristics of Methane and Tetrahydrofuran Hydrate-Bearing Sediments

1
School of Ocean Sciences, China University of Geosciences, Beijing 100083, China
2
Key Laboratory of Gas Hydrate, Ministry of Natural Resources, Qingdao Institute of Marine Geology, Qingdao 266237, China
3
Laboratory for Marine Mineral Resources, Qingdao Marine Science and Technology Center, Qingdao 266237, China
*
Authors to whom correspondence should be addressed.
J. Mar. Sci. Eng. 2024, 12(12), 2239; https://doi.org/10.3390/jmse12122239
Submission received: 11 November 2024 / Revised: 28 November 2024 / Accepted: 3 December 2024 / Published: 5 December 2024
(This article belongs to the Section Geological Oceanography)

Abstract

:
Laboratory acoustic measurements of hydrate-bearing sediments serve as an important reference for the geological interpretation of seismic exploration data. Tetrahydrofuran (THF) hydrates are relatively easy to form with precise control of hydrate saturation, and they overcome the long time it takes for methane in sediments to form hydrate. However, when THF hydrates are used as a substitute for methane hydrate, their acoustic properties yield different results. This study reports the results of a series of laboratory experiments on the formation of methane and THF hydrate in quartz sand and the evaluation of their acoustic properties. It compares the experimental results with the results of calculations from micro-distribution models of the four hydrates using effective medium theory (EMT). Methane hydrate formed by the excess gas method has higher acoustic velocities than THF hydrate at 0–80% saturation, but at 80–100% saturation, the situation reverses, with THF hydrate having a higher wave velocity. The methane hydrate synthesis process follows a mixed micro-distribution, with grain coating predominating at low saturations, the pore-filling mixing mode dominating at medium saturations, and grain coating dominating at high saturations. In addition, THF hydrate has a slow-velocity growth at low saturation and is dominated by a pore-filling model and a load-bearing model at high saturation. We compared our experimental data with a compilation of similar published results to confirm their reliability and support our conclusions. Both hydrate types exhibit distinct micro-distributions across different saturations. Therefore, when testing the elastic characteristics of hydrate sediments, the distinct hydrate synthesis methods and micro-distribution should be considered, especially when using THF hydrate as an alternative to methane hydrate.

1. Introduction

Natural gas hydrate is a solid crystalline substance resembling ice, formed by the combination of natural gas (primarily methane) molecules and water molecules under high-pressure and low-temperature conditions [1,2]. It is predominantly found in submarine sediments at depths exceeding 500 m and in continental permafrost. Due to its abundance and widespread distribution, it is considered a promising potential energy source [3,4]. Hydrate has higher elastic wave parameters than pore fluids, so hydrate deposit layers generally have higher P- and S-wave velocities [5,6,7,8,9]. The exploration of natural gas hydrate reservoirs in offshore seafloor sediments relies heavily on seismic methods, the efficiency of which depends on the correlation between the physical properties of the sediment and the saturation of the gas hydrate. It is difficult to obtain hydrate samples and associated saturation data in the field due to rapid hydrate dissociation at ambient surface temperature and pressure. Therefore, it is necessary to carry out acoustic simulation experiments of hydrate-bearing sediments in the laboratory.
To identify the acoustic response and sensitive factors of hydrate-bearing sediments, a large number of experimental simulations and theoretical modeling studies have been reported [10,11,12,13,14,15,16,17,18,19,20,21]. Priest et al. [10,22] and Sultaniya et al. [23] investigated the acoustic characteristics under different methane hydrate formation processes with “excess gas + quantitative water” and “excess water + quantitative gas”. Different hydrate formation methods produce different pore scale growth modes [24,25,26,27] and differences in the acoustic characteristics of sediments containing these hydrates [28,29,30]. Due to the limited solubility of methane in water and the long time required for hydrate formation, many researchers have used tetrahydrofuran (C4H8O, hereafter THF) hydrate as an analog for methane hydrate [30,31,32,33,34,35,36,37]. THF has the advantages of mixing with water, the ability to form hydrate without high pressure, accurately controllable saturation, and relatively rapid hydrate formation. These advantages help to form relatively uniform hydrate-bearing samples in the laboratory [38,39,40]. However, the difference in polarizability between THF (a polar molecule) and methane (a non-polar molecule) leads to questions about the suitability of THF as a methane substitute in studies of gas hydrate-bearing sediments. Furthermore, differences in the pore size distribution of hydrate formed by THF liquid and methane gas may have a significant impact on the macroscopic properties of gas hydrate-bearing sediments [41].
Laboratory studies on hydrate-bearing sediments have shown that THF can indeed replace methane in acoustic studies of hydrate-bearing sediments, despite differences in the acoustic properties between the two [15,35,42,43]. While the acoustic responses of synthetic hydrate derived from THF and methane have been reported separately, no direct comparison has been made between the two. Therefore, the acoustic differences between these two hydrate types warrant further study. To address this problem in detail, we conducted a series of experiments on these two types of hydrate samples. The samples were synthesized under the same test conditions to study the acoustic characteristics of THF hydrate and methane hydrate sediments, verify the effective medium theory (EMT), and compare the acoustic characteristics of sediments containing the two types of hydrates.

2. Materials and Methods

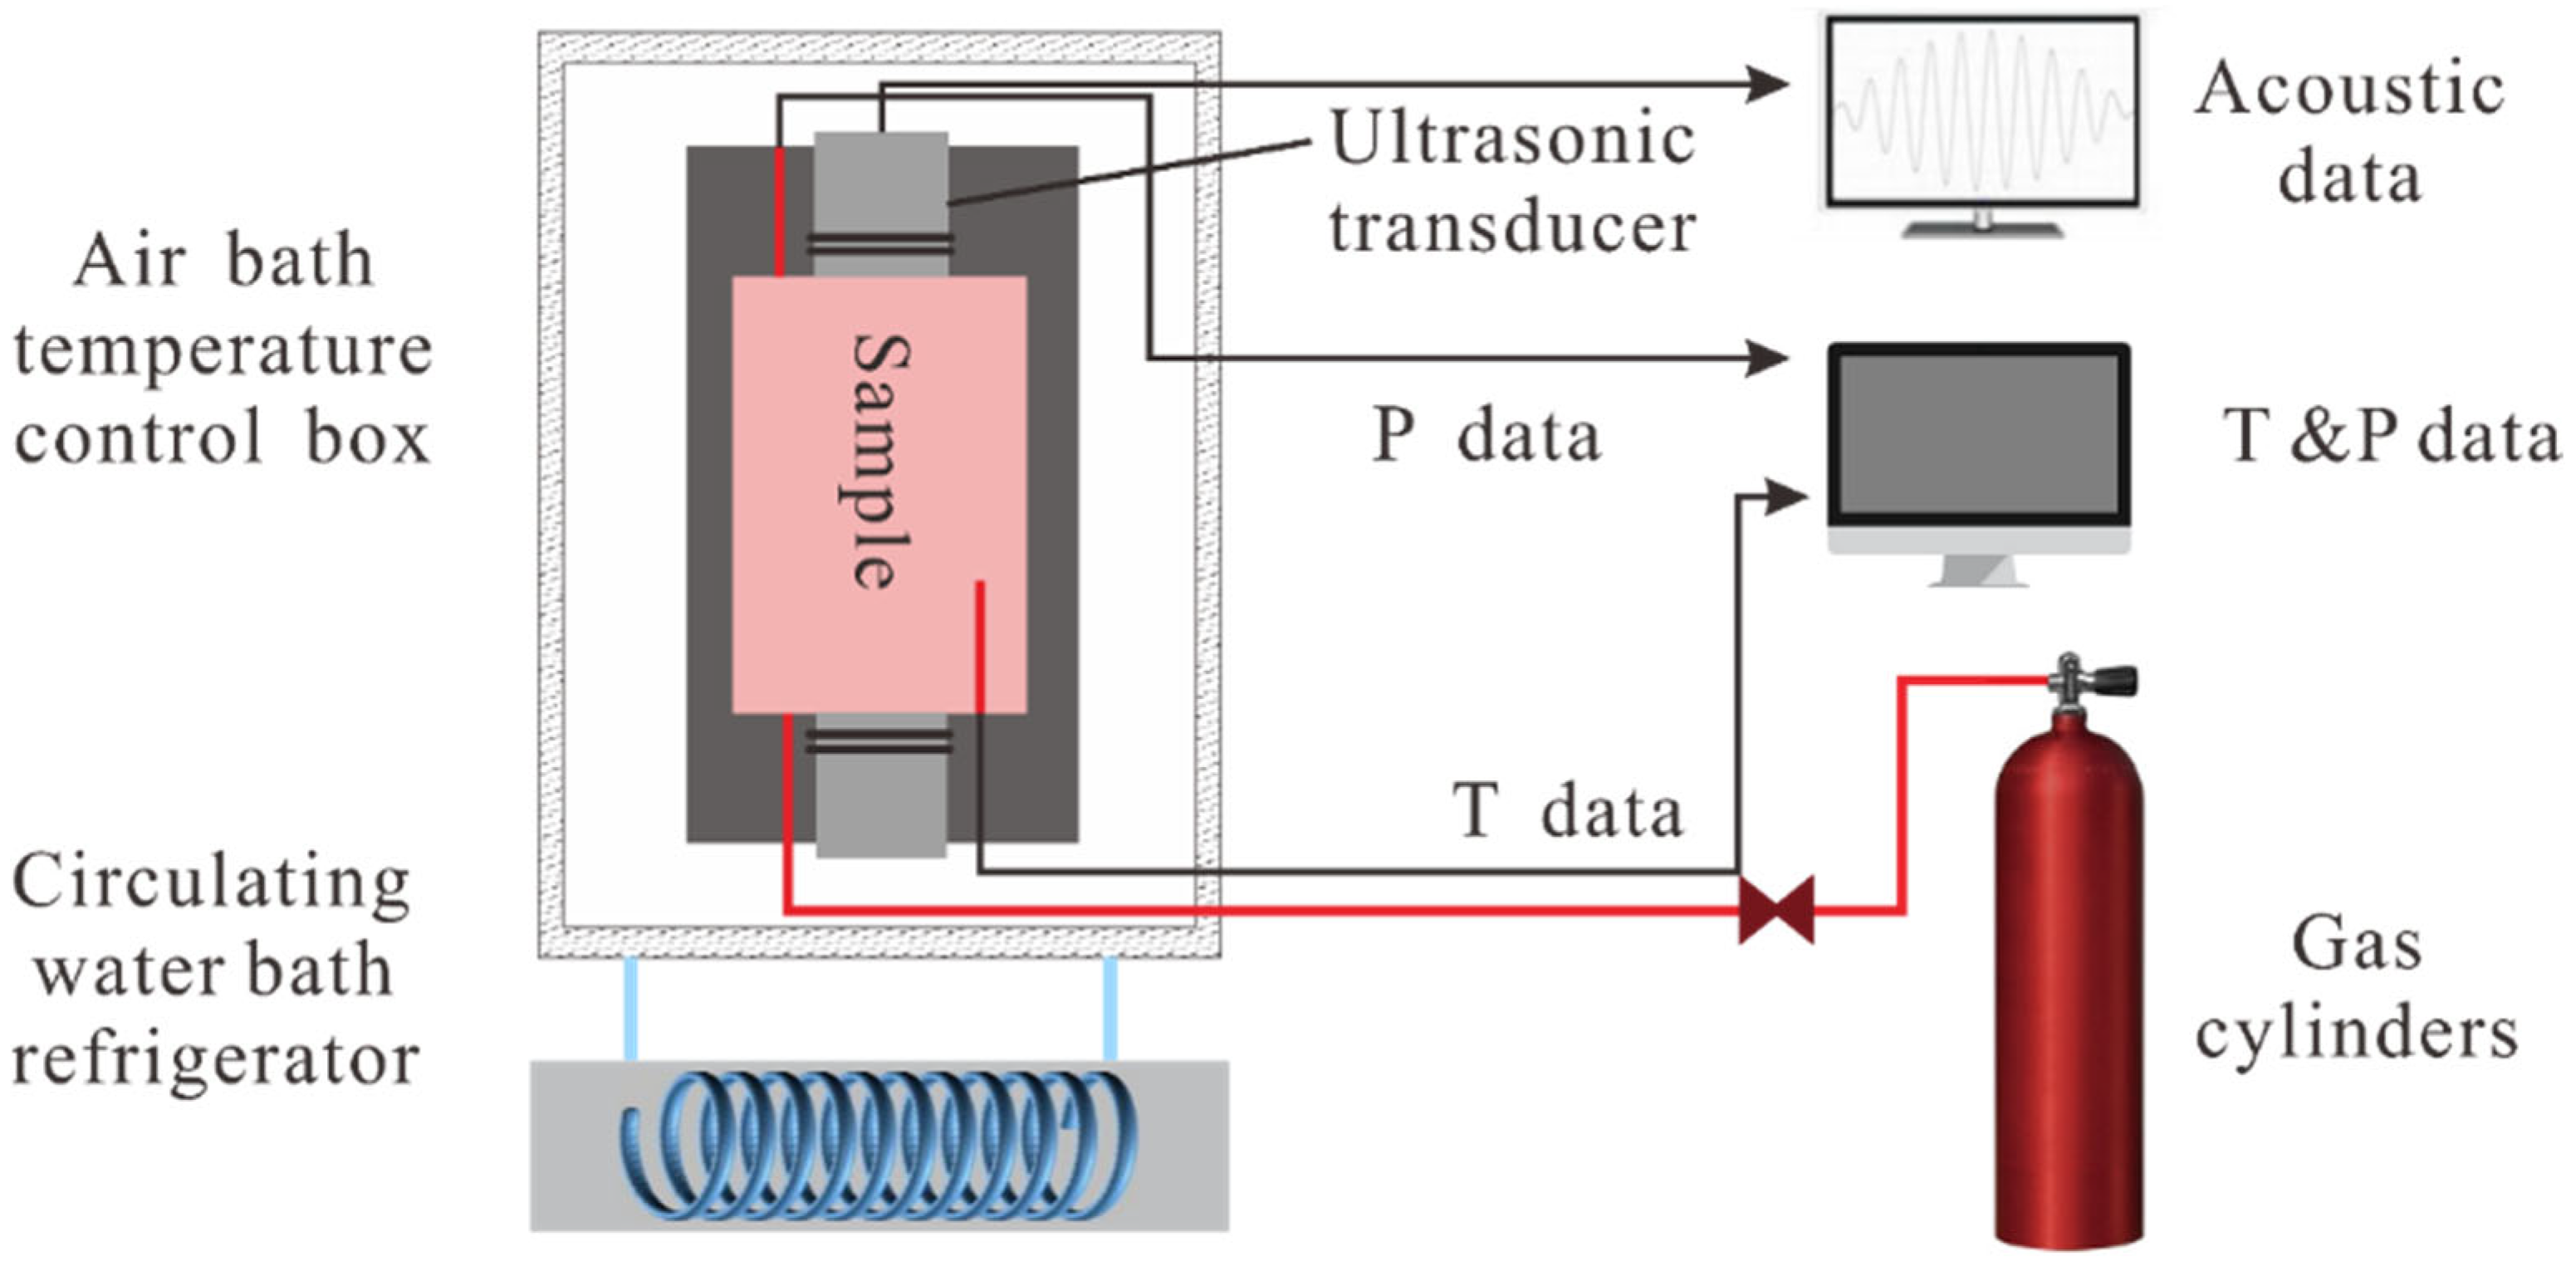
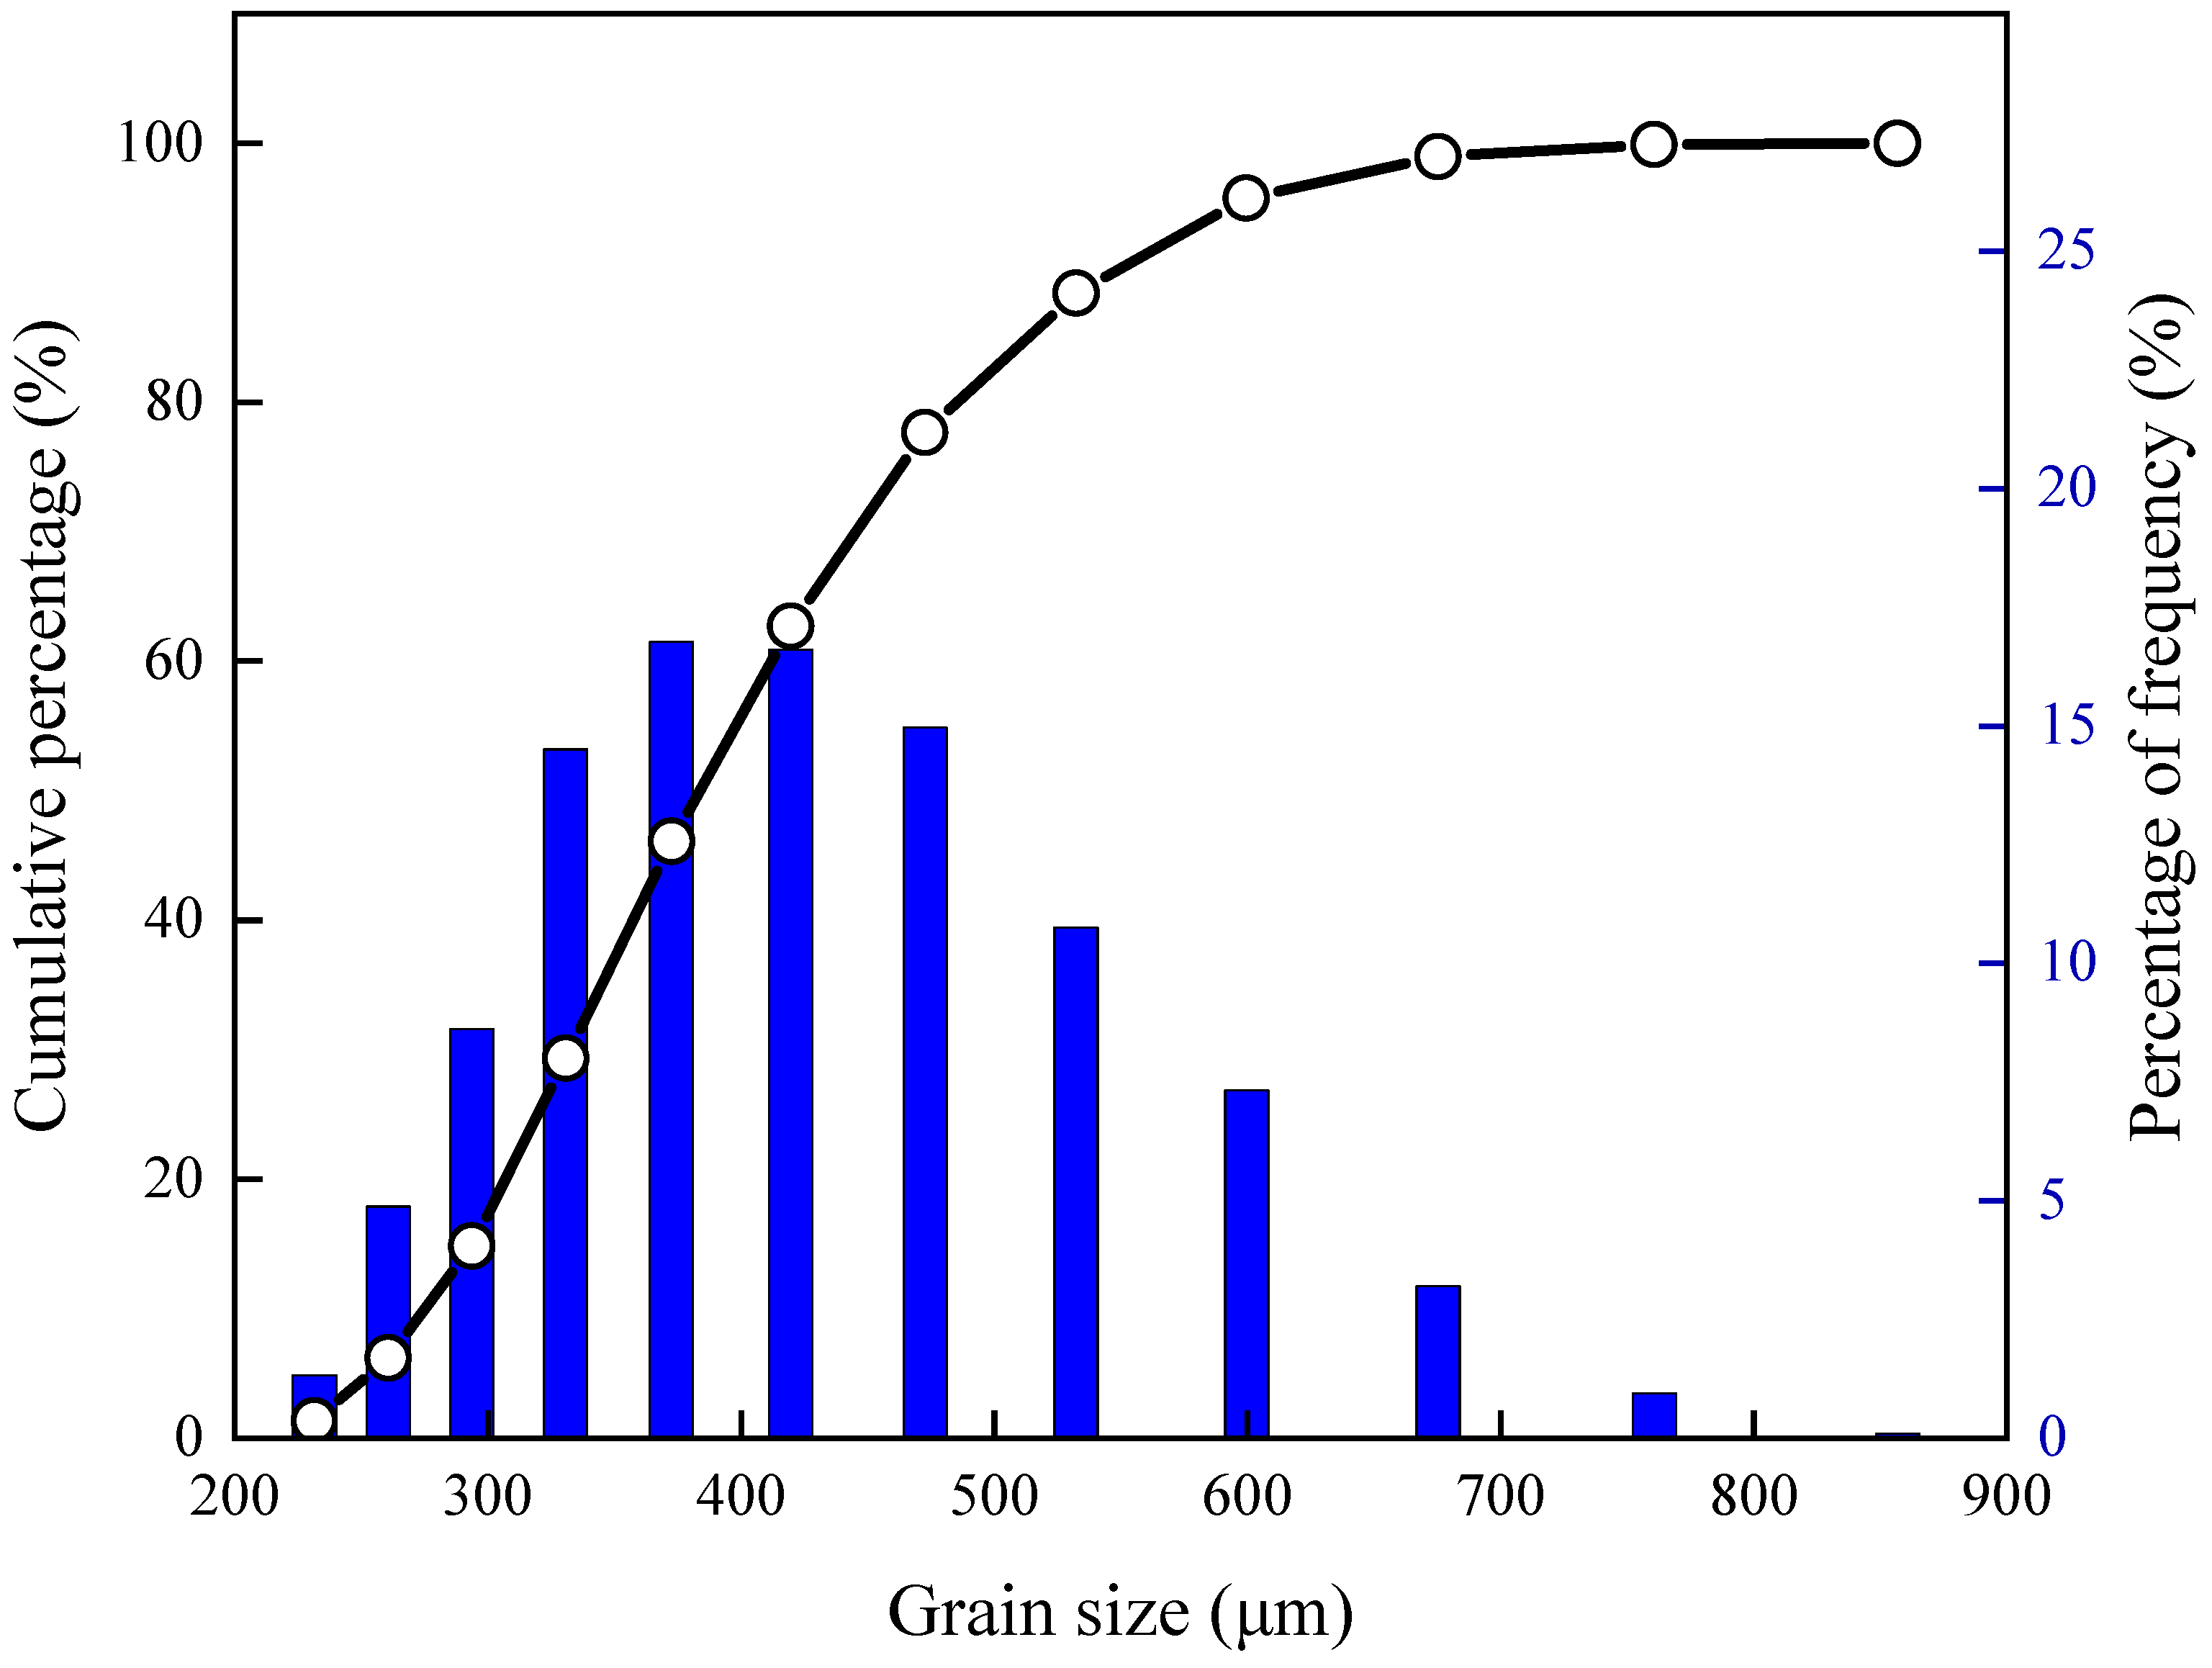
2.1. Experimental Device and Materials

The experimental device used in this study integrates five components: a high-pressure reactor, an acoustic test system, a pressure control system, a cooling system, and a data acquisition system (Figure 1). The high-pressure reactor is a robust vessel whose maximum design pressure is 15 MPa. It consists of upper- and lower-end caps with a central deposit space in the middle. The lower cover is connected to the gas inlet and the upper cover connects to the gas outlet. A pressure sensor with an operational range of 0–35 MPa and a measurement accuracy of approximately 0.01 MPa is attached to the high-pressure supply line, facilitating accurate pressure readings within the reactor. To maintain a constant temperature, the reactor is positioned in an air bath temperature control box connected to a refrigeration system, where the temperature can be varied from −30 °C to room temperature with an accuracy of 0.1 °C. The acoustic test system consists of two ultrasonic transducers and an acoustic data acquisition device, with two transducers located at the top and bottom, near the sediment. The thermocouple temperature sensor has a range of −10–100 °C and a measurement accuracy of about ±0.1 °C. It is positioned at the bottom of the sample in the chamber to precisely measure temperature changes in the sample. The data acquisition system captures and records pressure and temperature changes in the reactor in real time.
Quartz sand, with a particle size range of 230–850 μm and an average particle size of 380 μm, was used as the sediment in this experiment. The particle size distribution is shown in Figure 2. To accelerate the methane hydrate formation process, a prepared 0.03% solution of sodium dodecyl sulfate (SDS) was utilized. The gas-phase materials for the experiments were 99.9% pure CH4 and THF with a purity of 99.99%.

2.2. Experimental Methods

In this study, different hydrate synthesis methods were investigated and two popular hydrate synthesis methods were selected to assess the acoustic properties of THF- and methane hydrate-bearing sediments.
For the methane hydrate, the “quantitative water + excess gas” method was used, in which it was assumed that the water in the reactor was completely converted into methane hydrate after adding sodium dodecyl sulfate (SDS) to promote hydrate formation. The chemical reaction equation is [44] C H 4 + n H 2 O C H 4 · n H 2 O , where n is a reaction coefficient with a value of 5.5–6. We chose a value of 5.75 for this experiment.
The amount of water required to prepare a sample with a given hydrate saturation is determined by the following formula:
V w = 5.75 × M w 5.75 × M w + M g ρ h φ V S h
where Mw and Mg are the molecular weights of water and methane gas, respectively; ρh denotes the hydrate density; and φ, V, and Sh indicate the porosity, volume, and gas hydrate saturation of the samples, respectively.
The formation of THF hydrate can be achieved only at low-temperature conditions, given its water solubility. Thus, once THF hydrate formation is complete, the saturation within hydrate-bearing sediments can be controlled by the ratio of THF and deionized water. The molecular composition of THF hydrate is given as 8C4H8O·136H2O, so 1 mol of THF combined with 17 mol of H2O yields 1 mol of THF hydrate. The volumes of water and THF in the initial state are denoted Vw and VT, and the saturation of THF hydrate in the sediment is SH. After the THF completely reacted to form hydrate, residual water was present in the pores of the sediments. The amount of water that reacts is as follows:
n w = 17 ρ T V T M T
The remaining water volume is
V W = V H M H 17 ρ T V T M T M H ρ w
The saturation of the remaining water is
1 S H = V H M H 17 ρ T V T M T M H / ρ w V H + V T
The volume ratio of water to THF is
V w V T = 4.7683 S H S H
where ρw and ρT are the density of water and THF, respectively, and MH and MT are the molecular weights of water and THF, respectively.
According to the above Formulas (1)–(5), the proportional relationships between methane hydrate and THF hydrate under varying saturation levels of the experimental material were calculated.
The acoustic wave velocity measurement of unconsolidated sediments was based on the pulse transmission method. The ultrasonic transducers independently emitted and received shear and compressional waves, both operating at a frequency of 100 kHz. On identifying the initial wave jump point of the wave, the compressional wave velocity VP and shear wave velocity VS within the sediment sample can be calculated as
V P = L t t 0 P , V S = L t t 0 S
where L is the sample length, t is the travel time of the P and S waves within the hydrate-bearing sediments, and t0P and t0S are the travel time when both detectors are in direct contact, which was calibrated using a standard POM rod.

2.3. Experimental Procedure

The following main steps summarize the experimental procedures for the synthesis of methane hydrate and THF hydrate.
(1)
Sample preparation. First, the methane hydrate was prepared according to the pre-determined ratio, and 0.03% SDS solution was fully mixed with the dried sediment, pressed, and then added to the reactor to secure the lower vessel cover.
(2)
Reactor installation. After adding the specimen, the upper vessel lid was tightened and the gas cylinder, pressure regulation system, and temperature control system were connected.
(3)
Leak detection and vessel cleansing. Slightly overpressured methane gas was injected into the vessel and left to stand for some time while the temperature stabilized. We compared the pressure valve data before and after, and if no change was observed, we determined that no air leakage occurred. The pressure was then discharged, and the vessel was inflated and deflated several times, utilizing high-pressure methane gas to cleanse the interior.
(4)
Pressurization. Methane gas was slowly added to the reactor until the internal pressure reached approximately 8.3 MPa. This state was maintained until the temperature stabilized, ensuring that the methane gas fully infiltrated the sediment.
(5)
The circulating water bath refrigerator and the air bath temperature control box were switched on to set the temperature to 1 °C. The temperature, pressure, and ultrasonic data acquisition software programs were started to initiate data collection.
(6)
THF hydrate can be synthesized simply by controlling the temperature. Since THF is volatile, the sediment and THF solution were added in layers to ensure a solution that was sufficiently mixed with the sediment, and the sediments were cleaned and dried at the end of each experiment.

3. Results

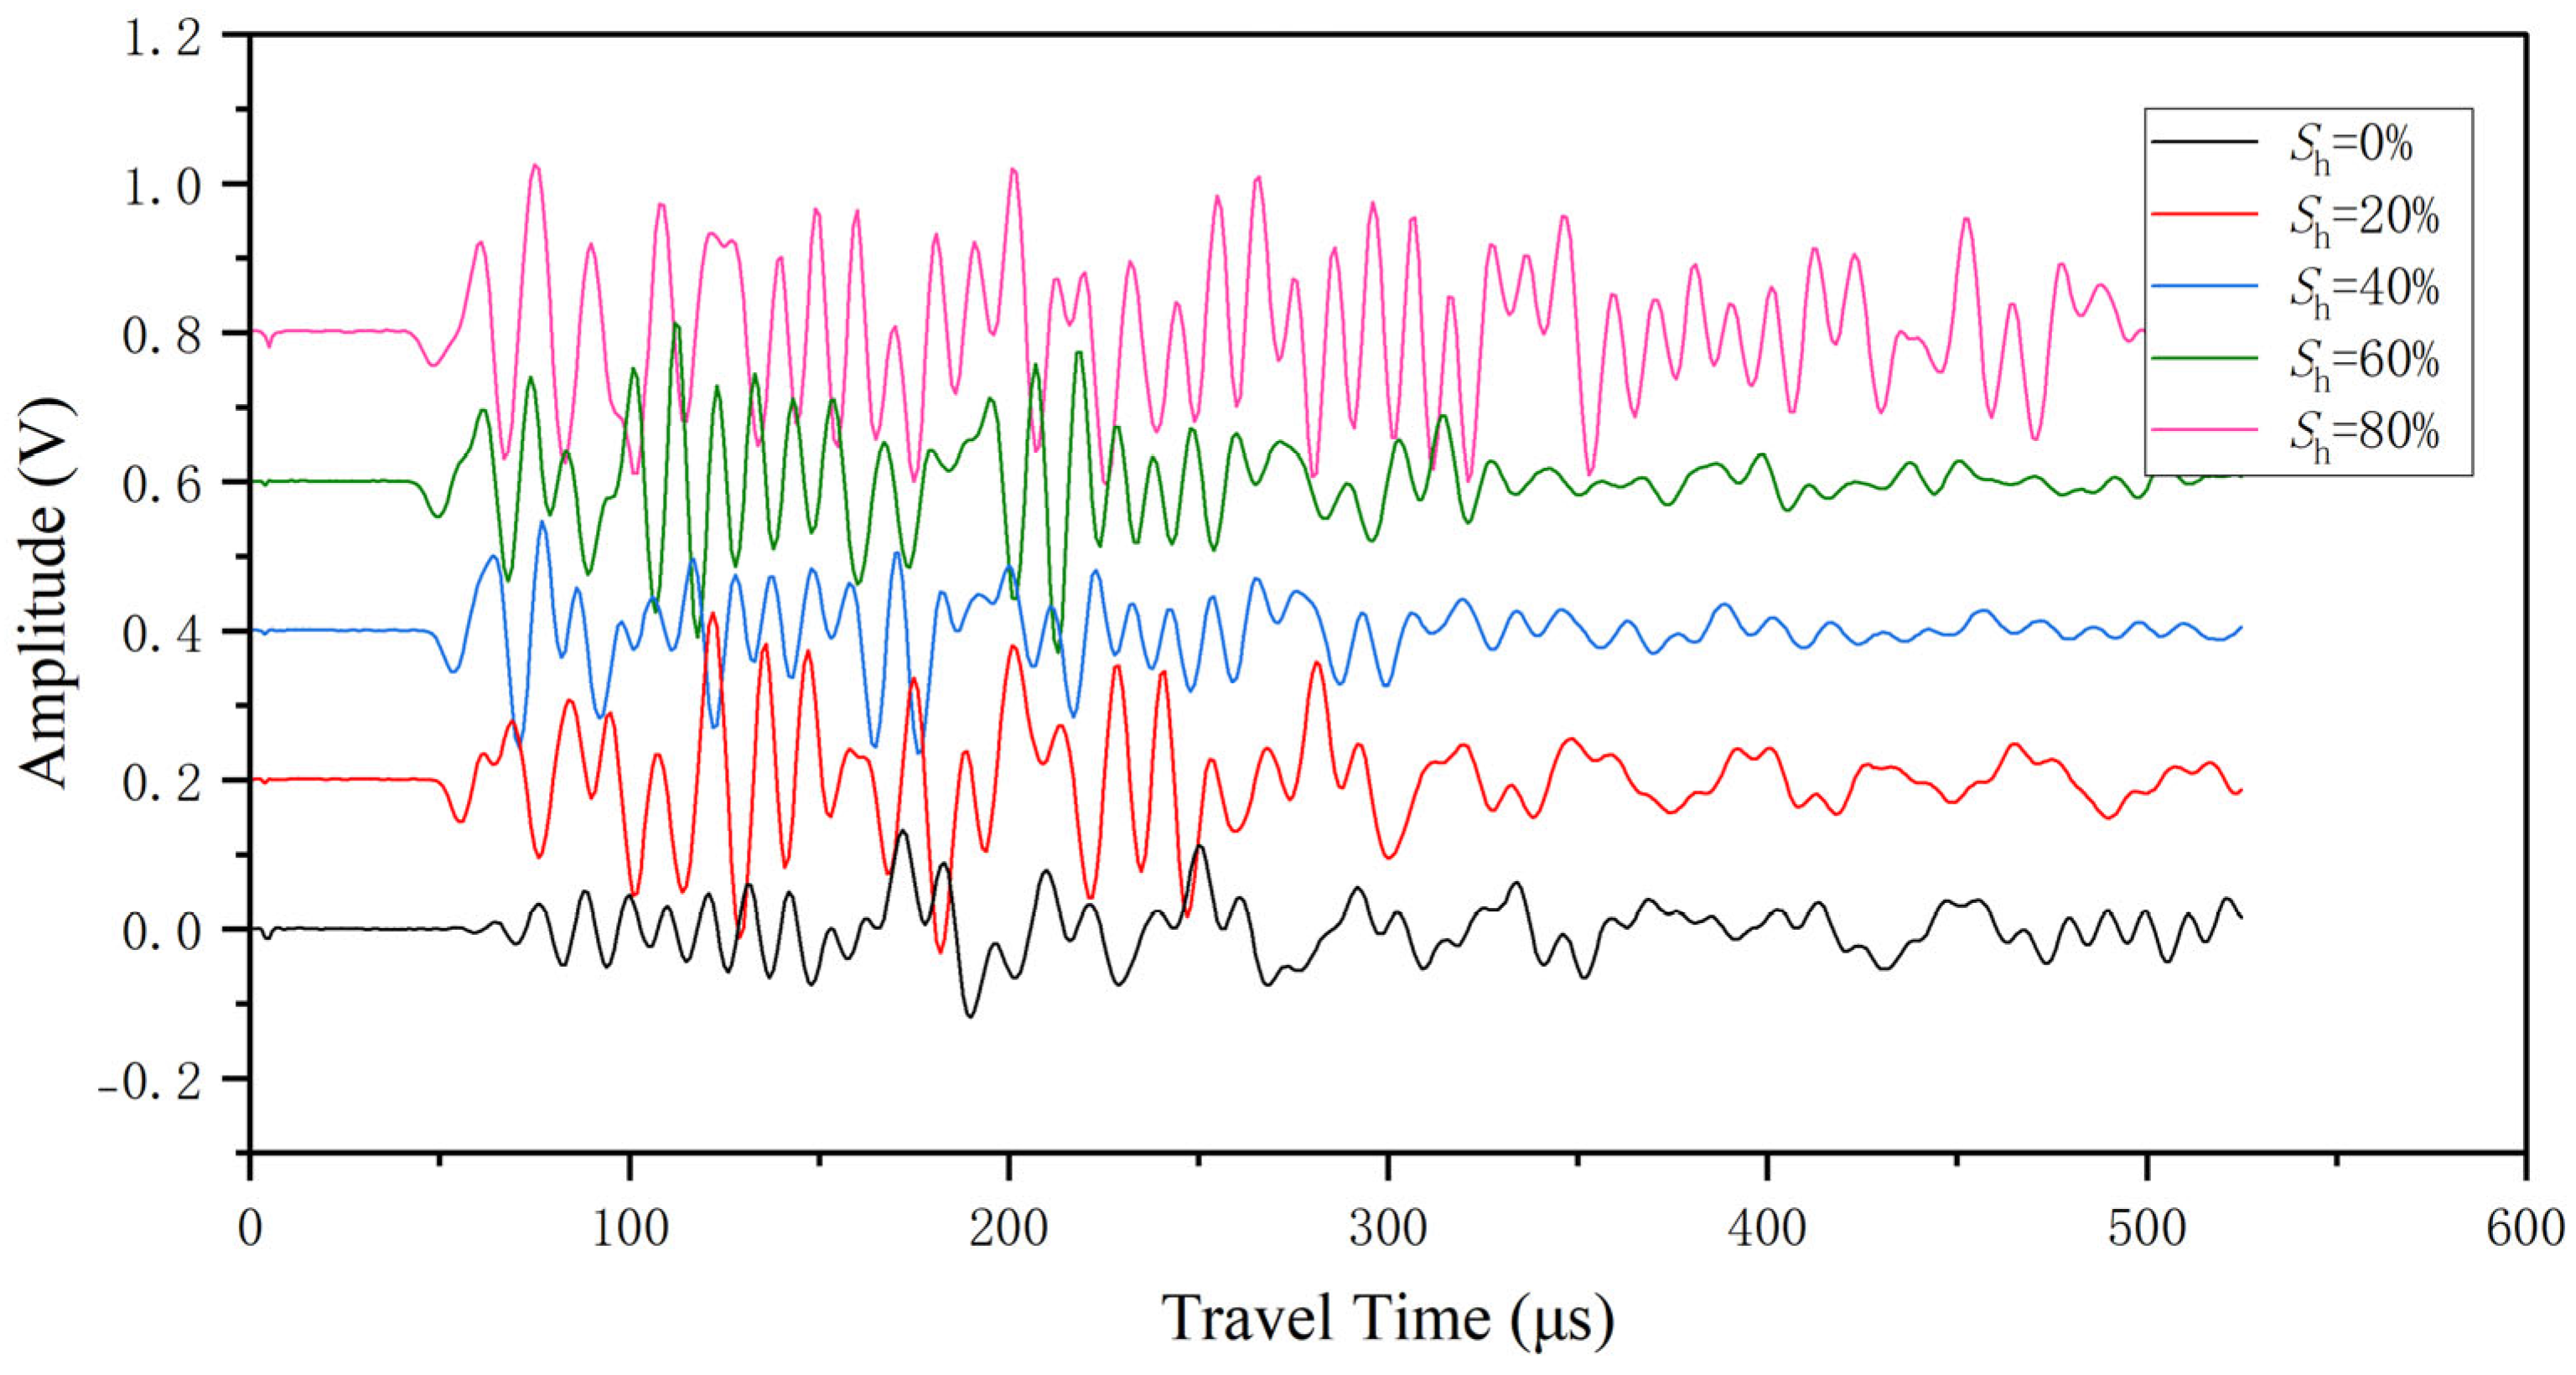
3.1. Wave Velocity of Methane Hydrate-Bearing Sediments

We synthesized methane hydrate using the excess gas method and obtained acoustic velocities at different saturations (Table 1). The hydrate saturation was varied from 0% to 100% in 10% increments. The experiment was conducted for a sufficient duration to ensure stable hydrate synthesis, resulting in pressure stability and wave velocity that remained consistent throughout. The initial pressure of the experiment was approximately 8.3 MPa, and the pore pressures in the final state were all 6.0 MPa. The temperature was set to 1 °C at a specific initial water content. With the formation of methane hydrate, the water in the pores was completely consumed. In the final state, the sample was composed of methane gas, sand, and methane hydrate. Figure 3 shows the P waveforms of methane-bearing hydrate sediment samples at 0%, 20%, 40%, 60%, and 80% saturation. The first jump point of the acoustic wave of the sample with 0% saturation is backward, and the wave velocity is 1540.1 m/s. As saturation increases, the P waveforms have a forward acoustic first-wave jump and show higher wave velocities (Figure 3). The acoustic velocities of samples without and with hydrate are significantly different. The P-wave and S-wave velocity increased by 549.7 m/s and 306.7 m/s from 0% saturation to 10% saturation, respectively (Table 1). As hydrate saturations moved from 0% to 100%, the P-wave velocity increased from 1540.1 m/s to 3508.0 m/s, while the S-wave velocity rose from 606.3 m/s to 1741.7 m/s.

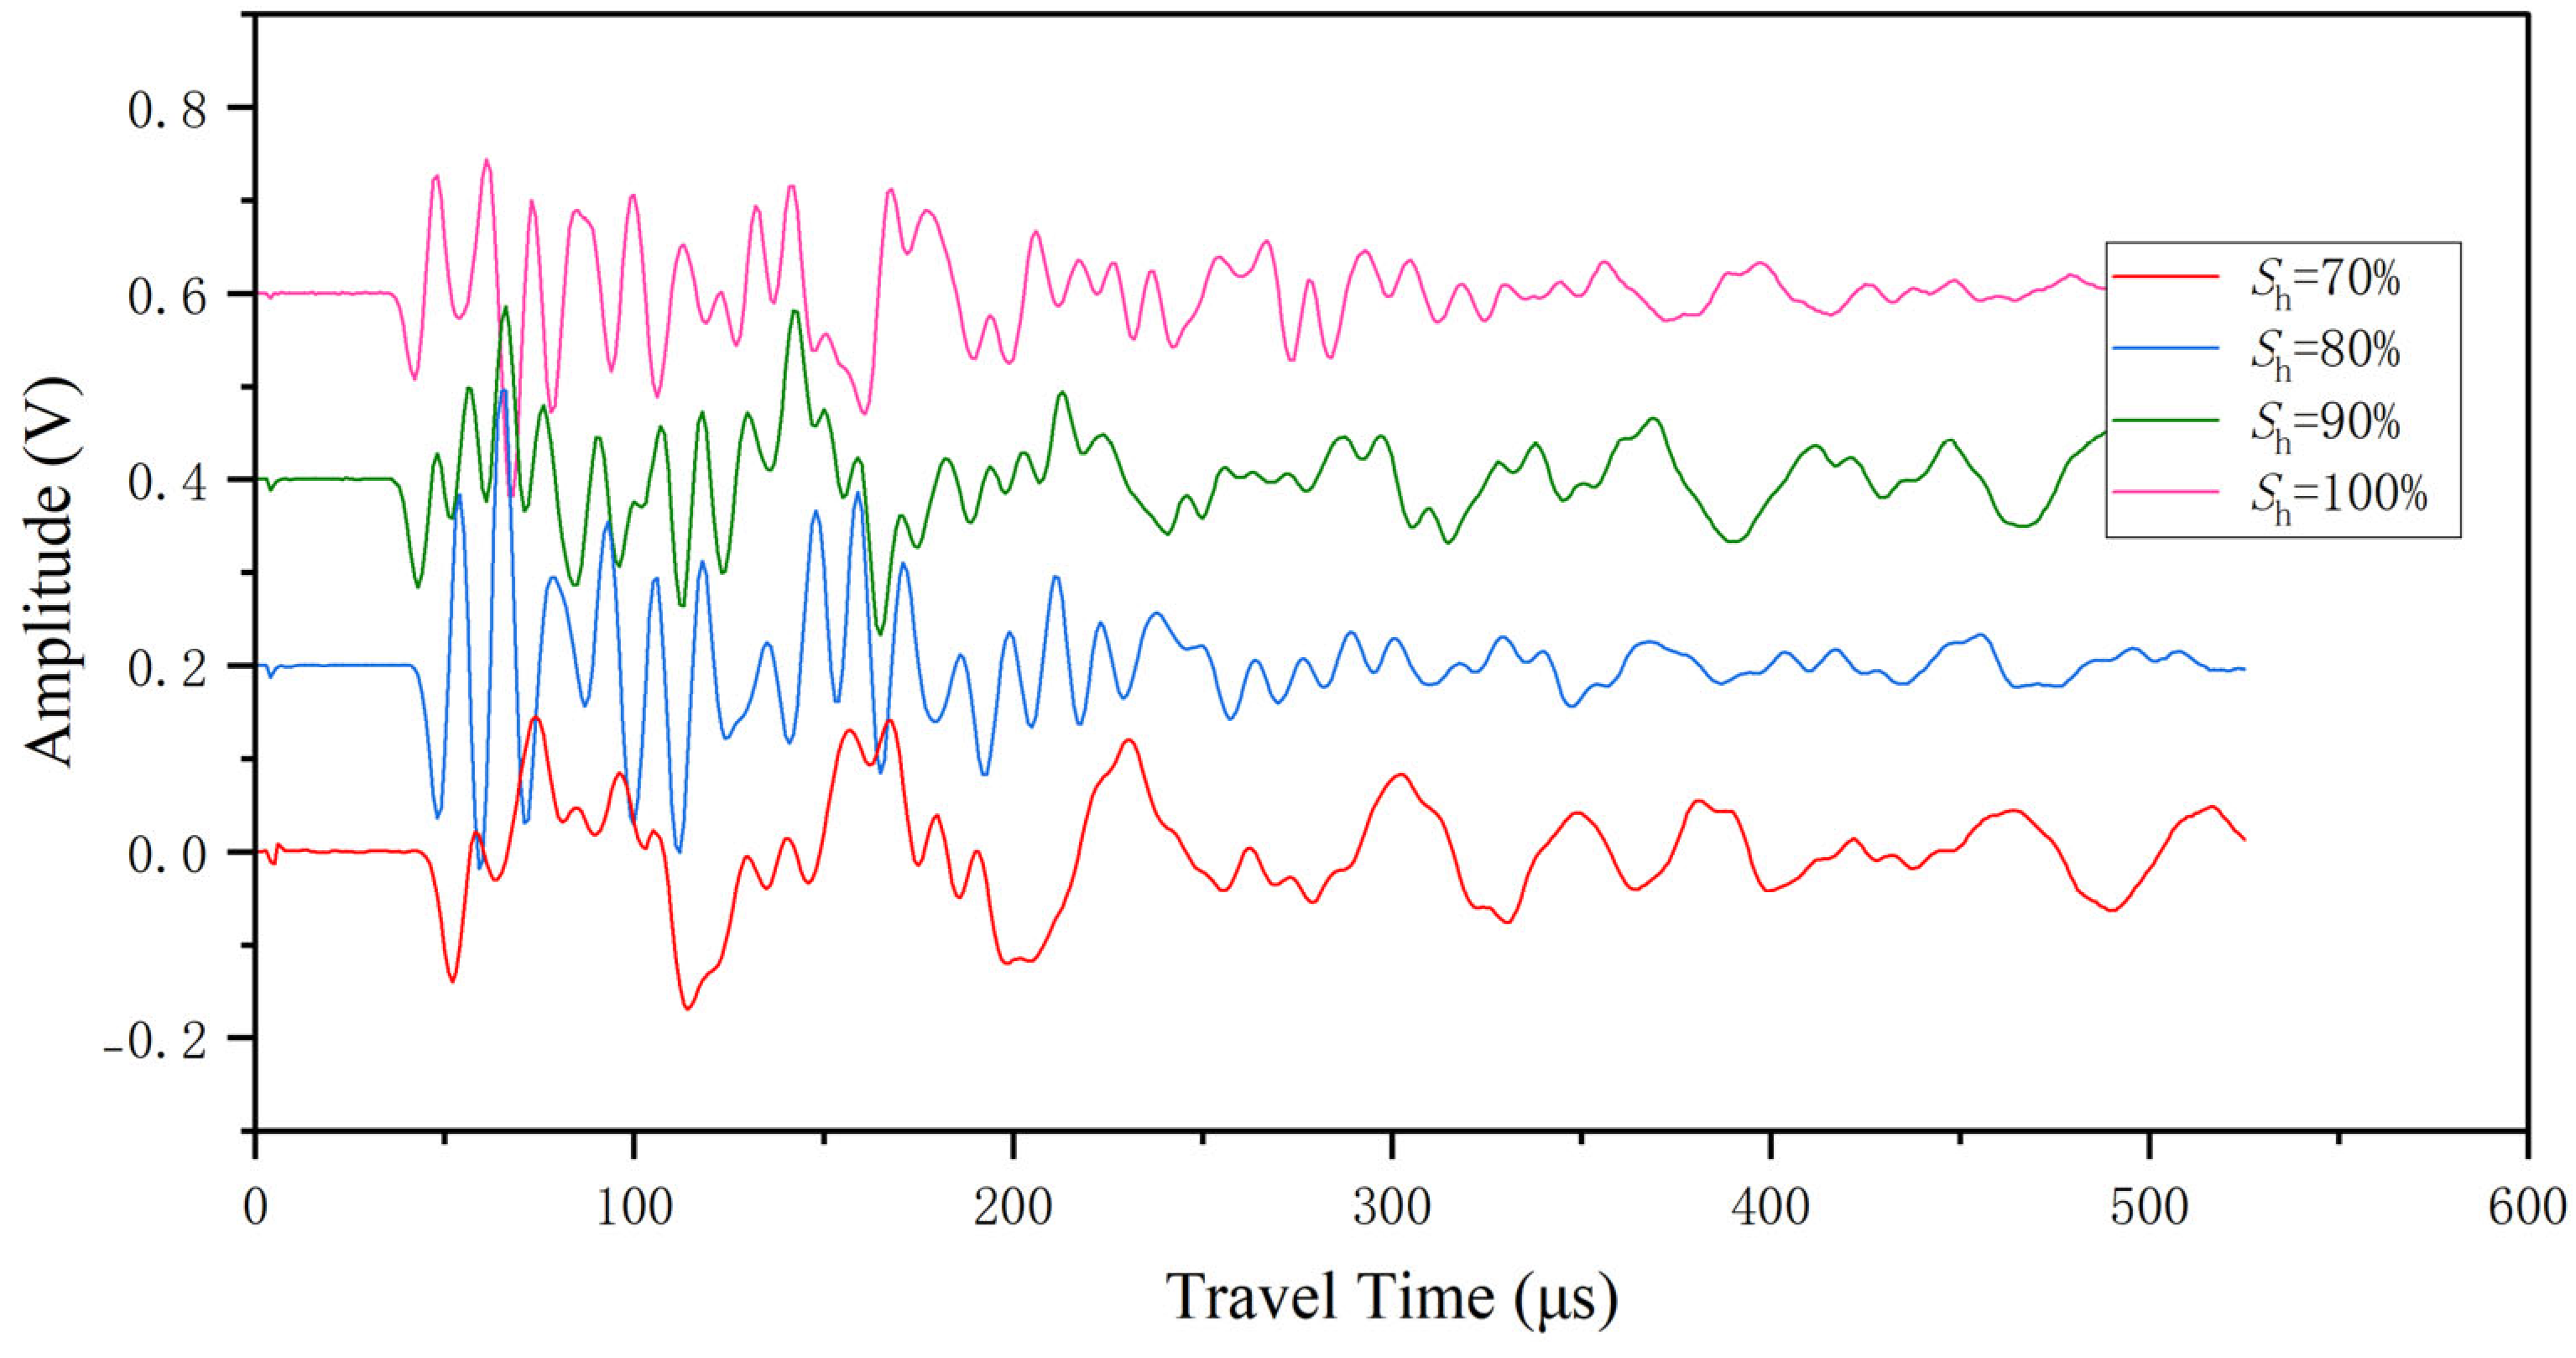
3.2. Wave Velocity of THF Hydrate-Bearing Sediments

Figure 4 shows the waveform of the THF hydrate samples with high saturation. The acoustic travel time exhibits significant variation across samples with varying saturations. The experimental results of the THF hydrate samples are shown in Table 1. The saturation of THF hydrate is controlled by the THF content in the solution, as calculated by Equation (5). In contrast to methane hydrate, synthesizing THF hydrate requires only temperature control under atmospheric pressure. The temperature of the circulating water bath refrigerator was set to 1 °C, which promoted the complete formation of THF hydrate, and the THF hydrate reaction was confirmed by noting changes in the acoustic wave velocity, which signaled the completion of the THF hydrate reaction. In the final state, the THF hydrate-bearing sediments sample consisted of sand, water, and THF hydrate, and this synthesis method is analogous to the excess water method for synthesizing methane hydrate. The acoustic velocity of the THF hydrate sample gradually increased with the saturation, with Vp increasing from 1537.8 m/s to 3805.4 m/s, and Vs increasing from 610.1 m/s to 2105.1 m/s as the saturation changed from 0% to 100%. As hydrate formation began, the P- and S-wave velocities increased. Between 0 and 30% saturation, the P and S waves increased slowly, while between 50 and 100% saturation, we saw significant increases in wave velocities.

4. Discussion

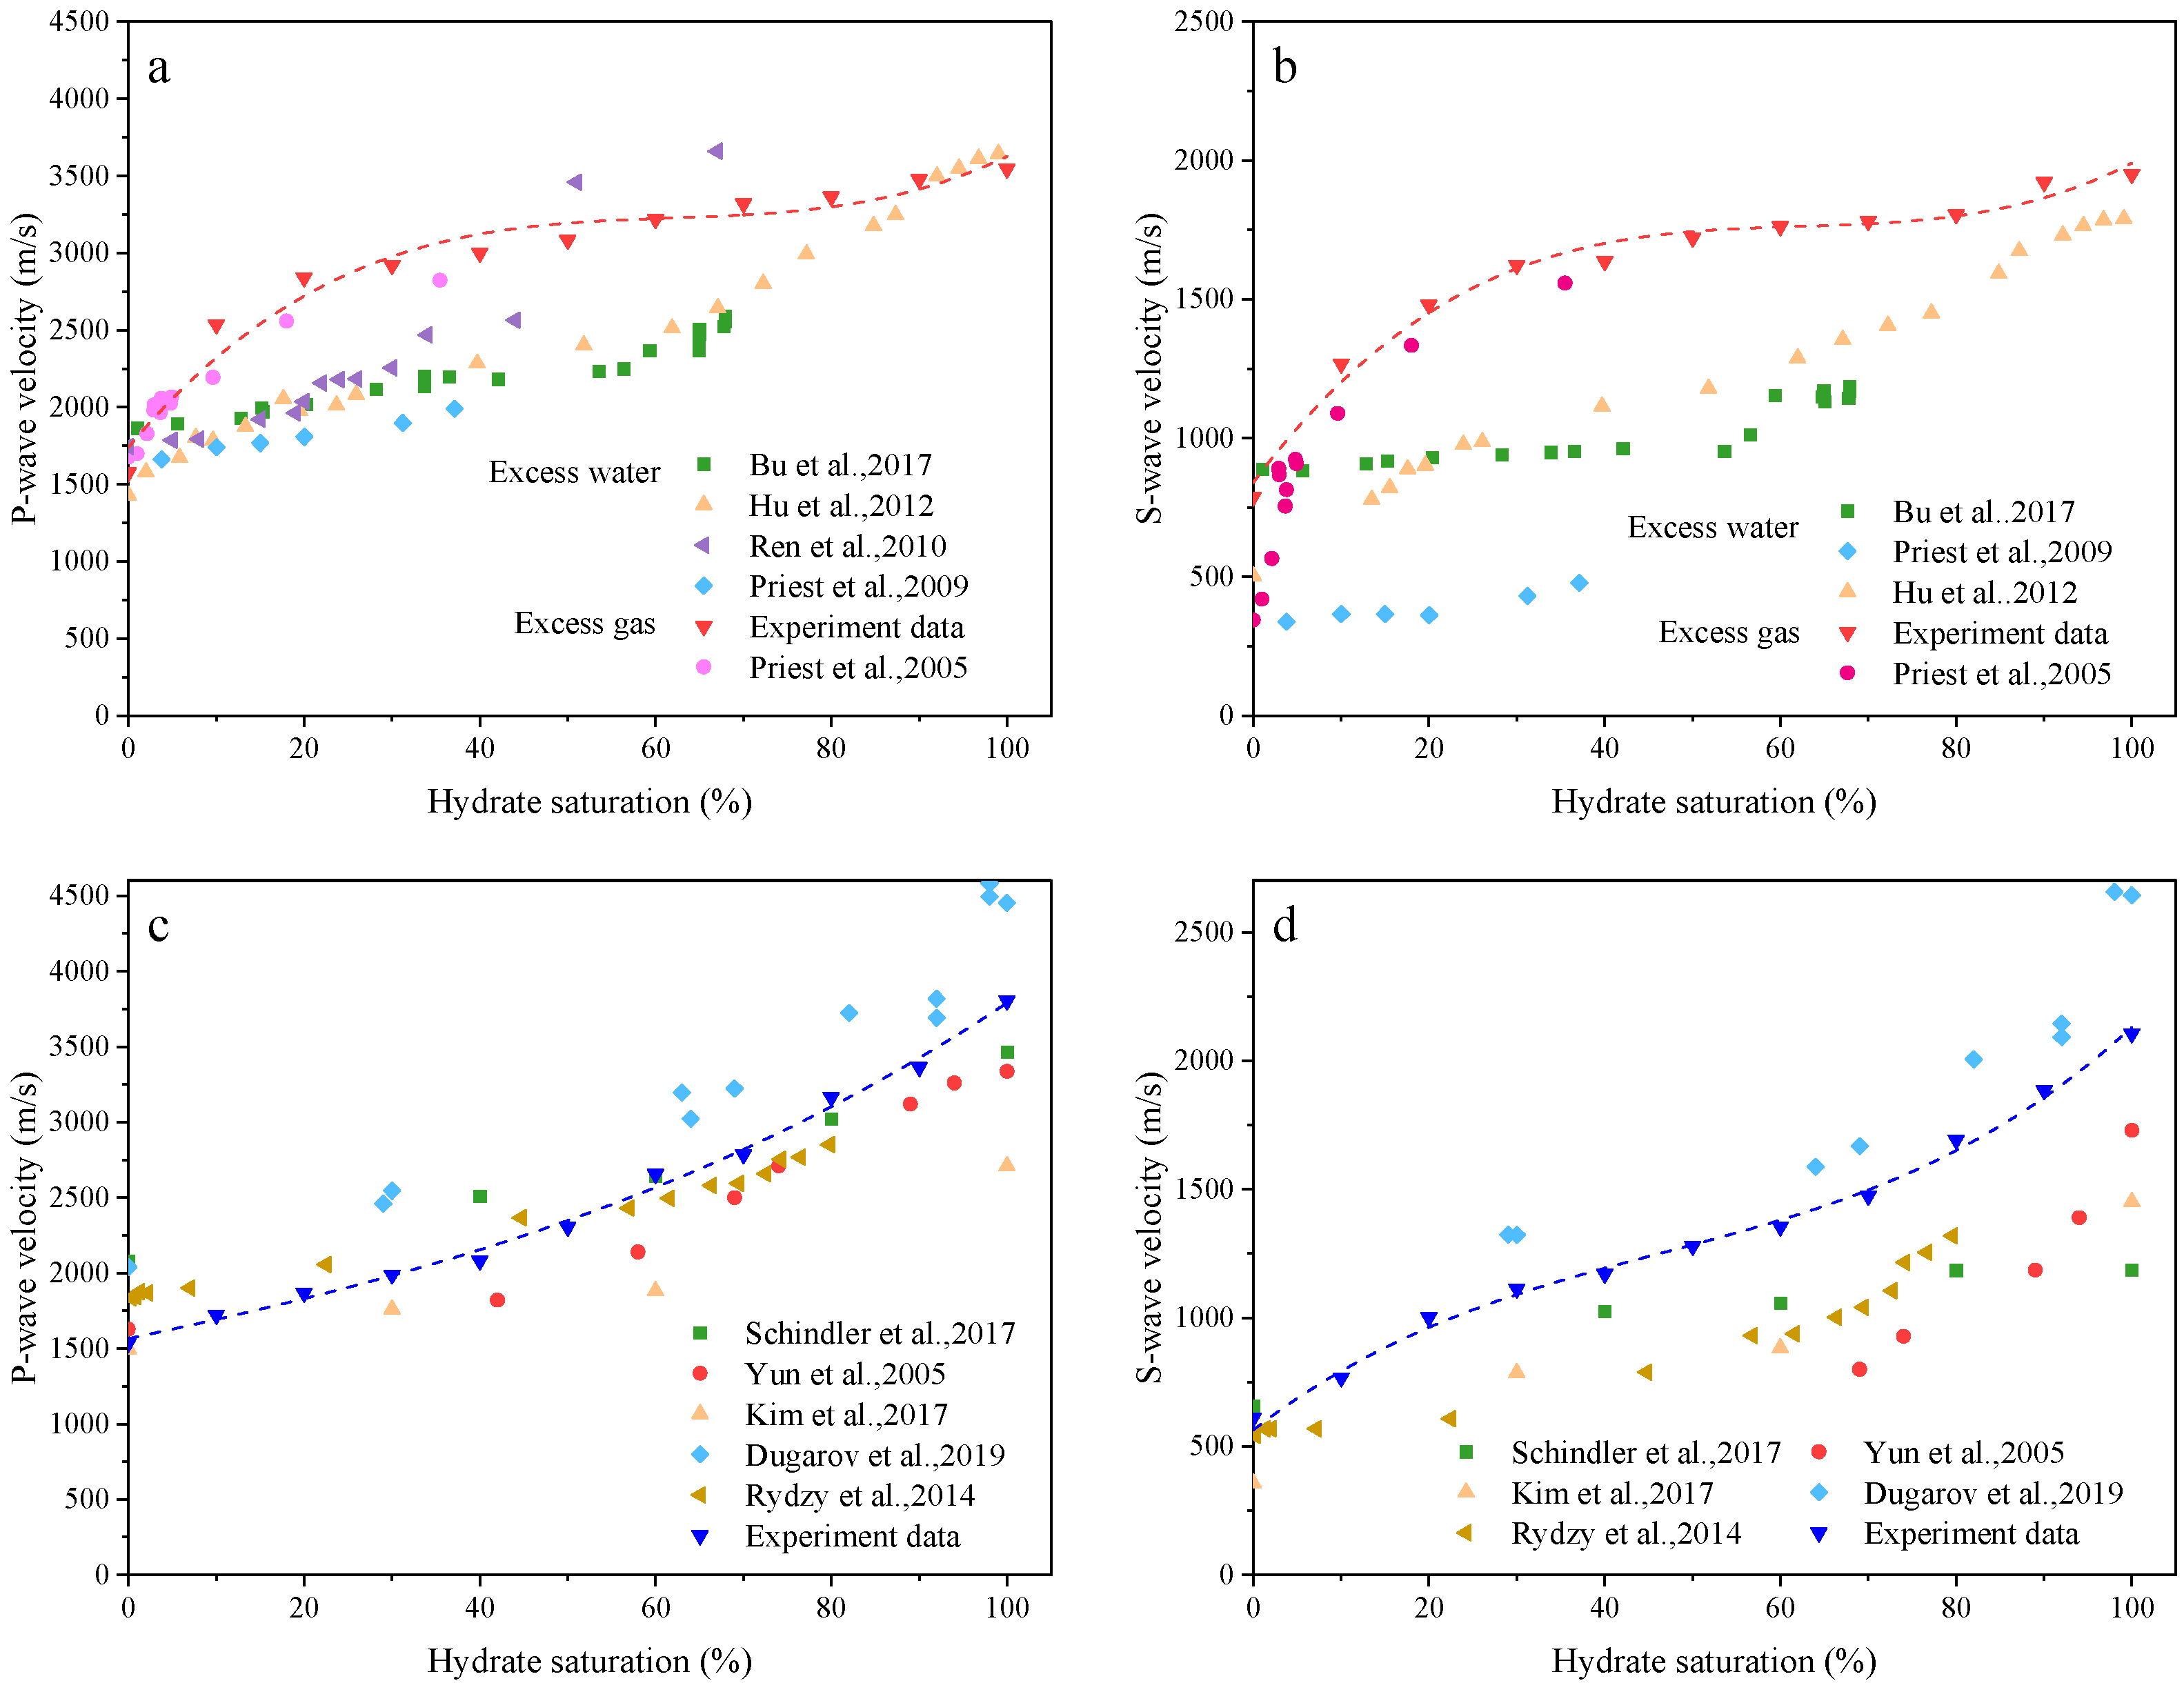
4.1. Velocity Changes with Hydrate Saturation

The acoustic velocities of methane and THF hydrate-bearing sediments at different saturations were obtained using the same experimental apparatus and test methods as shown in Figure 1 and compared with relevant published data. Both P-wave and S-wave velocities increase gradually with increased hydrate saturation, but the acoustic response will be different for different hydrate synthesis methods [20,22]. Two common methane hydrate synthesis methods are compared in Figure 5a,b. The excess water synthesis method has a slow growth rate of P waves and S waves at hydrate saturations between 0% and 60%, and the excess gas method already has high P- and S-wave velocities at lower hydrate saturations. There is almost no difference in acoustic wave velocities between hydrates synthesized by the two methods at hydrate saturations of 90–100%. Differences in the acoustic response of methane hydrate-bearing sediments in excess gas and excess water may be due to differences in the micro-distribution of methane hydrate. The pattern and growth tendency of gas hydrate in pore spaces are not only related to the period of gas hydrate formation but also depend on the pattern of gas (free or dissolved gas) in the liquid phase during hydrate formation [45]. For the water-excess method, the gas is dissolved in water, methane hydrate first forms at the water–gas interface and occupies the pore space, and as hydrate saturation increases, hydrate begins to adhere to the particle surface. For the gas-excess method, the free gas first reacts with the water adhering to the surface of the sand particles, and the hydrate is distributed around the bubbles, allowing the methane hydrate to form a cement between the sand particles at a lower saturation level [28,46]. The elastic modulus of hydrate-bearing sediments is enhanced when the hydrate acts as part of the skeleton so that samples synthesized by the excess gas method have higher P- and S-wave velocities at low saturations. At medium saturation, both methane hydrate synthesis methods show the same gentle growth trend, and at 100% hydrate, the hydrate occupies all the pores and the sonic velocities all reach the same level. Hydrate formation by the excess gas method shows a significant increase at low saturation: at 10% saturation, the P-wave velocity increases by 500 m/s and the S-wave velocity by 300 m/s. Methane hydrate formed by the excess water method grows slowly in velocity at low saturation (Figure 5a,b). For both hydrate formation methods, P- and S-wave velocities grow slowly at medium saturation, but the excess gas method partially cements the sand particles and become part of the sediment skeleton, so the excess gas method also shows high P- and S-wave velocities at medium saturation. When the saturation reaches more than 80%, most of the pore space is occupied by hydrate as shown by the micro-distribution of hydrate, and at this time, the P- and S-wave velocities also converge. The experimental results demonstrated this, in agreement with Priest’s study [10].
A comparison of experimental data for THF hydrate samples from this study with data from other published literature is shown in Figure 5c,d. It can be seen from all the data that there is a clear correspondence between the acoustic wave properties and hydrate content. As hydrate saturation increases, the acoustic wave velocity increases significantly. Our results are consistent with those reported by Schindler et al. [48], Dugarov et al. [33], Rydzy et al. [50], and Yun et al. [31]. While the smooth glass beads utilized by Schindler might result in lower shear wave velocities, the longitudinal wave data remain consistent across studies. We also note that sound velocity measurements in different experimental settings may vary greatly. However, in all data, there is a clear relationship between acoustic characteristics and natural gas hydrate content.

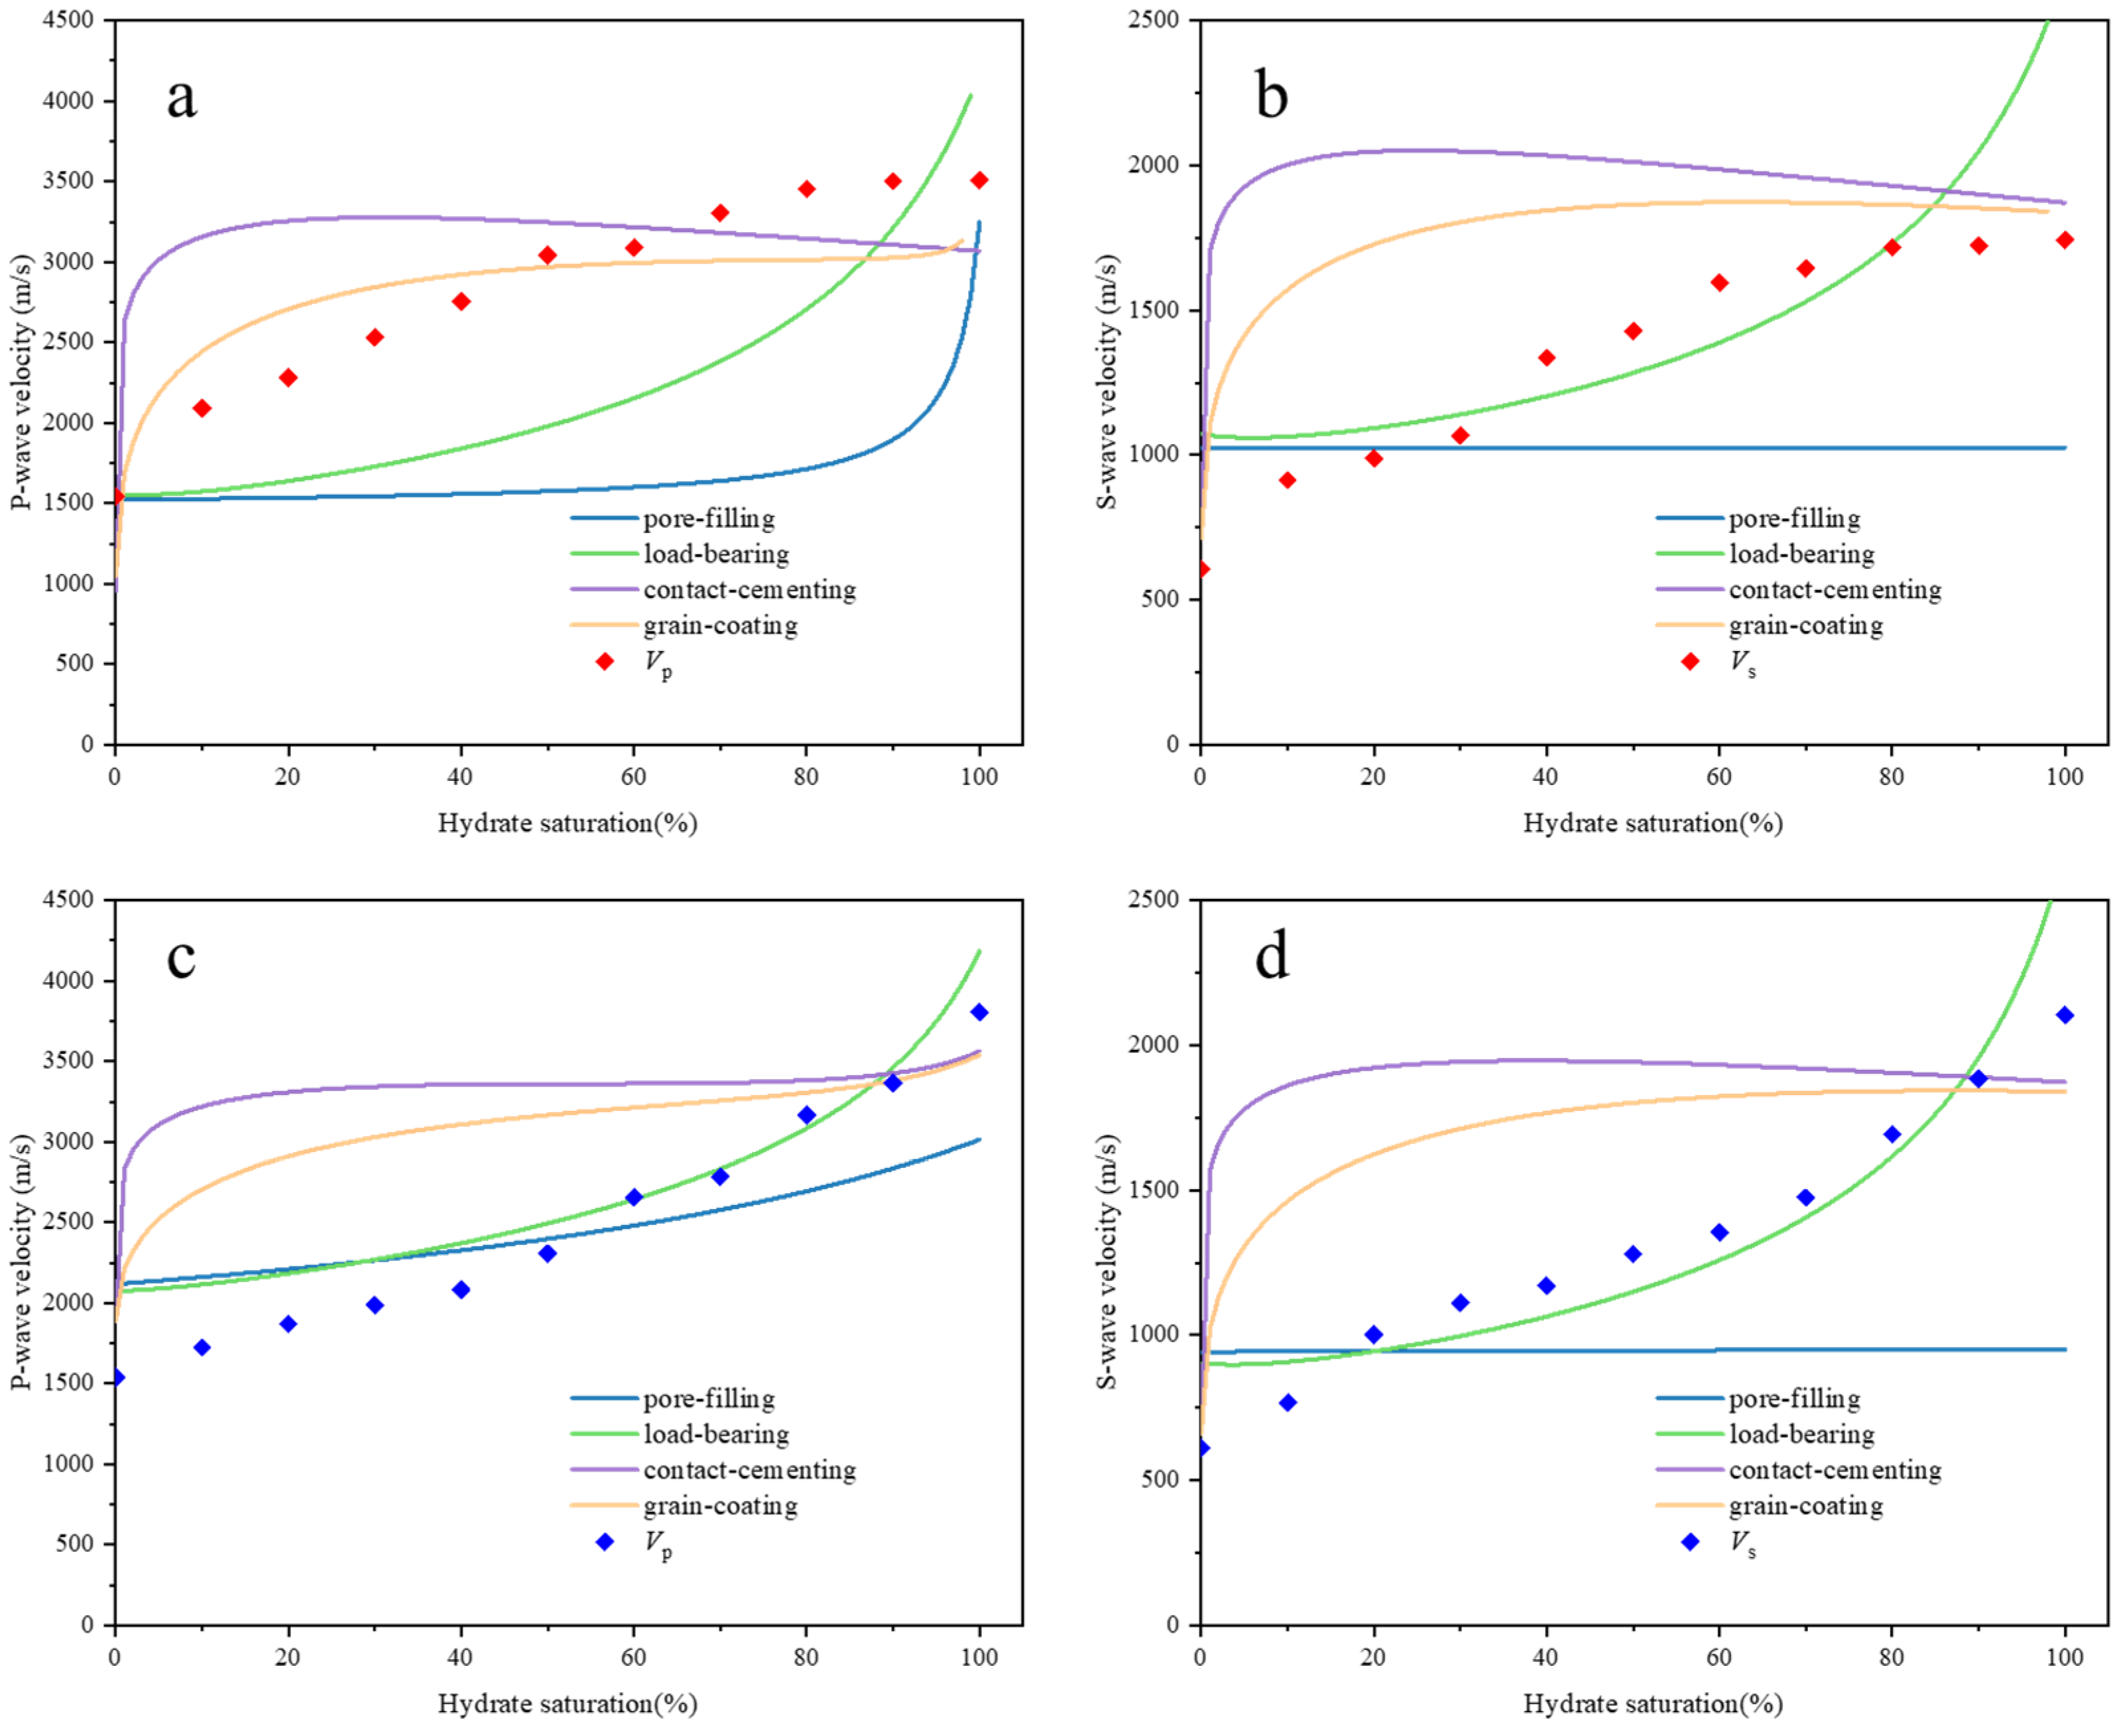
4.2. Validation of Velocity Models

Analysis of the experimental results shows that the wave velocity of methane and THF hydrate-bearing sediments have different responses as saturation changes, with Vp of methane hydrate-bearing sediments increasing at a higher rate than that of THF hydrate-bearing sediments between 0 and 80% saturation, and with the same trend for Vs. A better understanding of how hydrate morphology affects the elastic properties of the host sediments is essential to translate acoustic and seismic information into physical properties accurately.
The effective medium theory assumes that hydrate-filled pores have different morphologies, and formulae are given for the different morphologies in theory [51,52,53], so if the porosity and elastic properties of the components and fractions are known, it is possible to use the above models to estimate hydrate saturation from the measured seismic velocities and, conversely, to predict the type of pore filling in the hydrate-bearing sediments from the experimental data. These models assume different morphologies as shown in Figure 6: Model a: pore-filling, with hydrate in fluid phase as part of pore fluid (Figure 6a); Model b: load-bearing, with hydrate in the void space as part of the solid phase (Figure 6b); Model c: contact-cementing, with hydrate only at grain contacts as cement (Figure 6c); Model d: grain-coating, with hydrate coating grains and partly playing the role of cement at grain contacts (Figure 6d). Different pore-filling morphologies also have different effects on the elastic behavior of the hydrate reservoir [54,55,56,57]. Hydrate in Model a is suspended in the fluid, which slightly increases the bulk modulus of the pore fluid and does not contribute to the shear modulus of the sand pack. For Model b, the hydrate formed acts as part of the sediment framework but has little effect on the compression wave velocity due to the large difference in physical properties between the hydrate and the quartz sand. In contrast, for Models c and d, the hydrate acts as a cement at the particle contact and significantly affects the elastic properties. Thus, at low saturation, it increases the P-wave velocity dramatically (Appendix A).
For the synthesis of methane hydrate using the excess gas method, and assuming that the water is completely consumed, in the final state, the sediment is saturated with methane gas and only contains hydrate, so we should consider an effective model composed of three components: sand, methane hydrate, and gas. Similarly, when THF hydrate synthesis is completed, the sediment becomes saturated with water and contains only three components: sand, THF hydrate, and water. We use the modeling approach described above to illustrate the effect of the micromorphology of methane and THF hydrate in sediments on the acoustic response. The initial porosity is 0.4 and the critical porosity, coordination number, and effective pressure are 0.36, 9, and 6 MPa, respectively. The densities and elastic moduli of the components used as model inputs are listed in Table 2.
For the four models (Figure 7), we compared the calculated results (solid lines) with the experimental results (dots). The pore-filling model assumes that the hydrate is suspended in the pore fluid under iso-stress conditions, and according to the results in Figure 7, the P-wave velocities grow slowly while the S-wave velocities are essentially unchanged, which is inconsistent with the experimental results. The load-bearing model assumes that the hydrate is connected with adjacent grains and reinforces the dry rock framework, which leads to an increase in velocity. In loose sediments with high porosity, this model is only appropriate at high saturation, and in Figure 7a, methane hydrate demonstrates much higher Vp than the model-predicted velocities at 0–80% saturation, and THF hydrate has a better fit at saturations >60%. The contact-cementing model assumes that the hydrate is located at the grain contact, and the grain-coating model assumes that the hydrate coats the surface of the sand grains, so that the acoustic velocity increases rapidly at low saturations, whereas at higher saturations, it predicts relatively constant velocities, as shown in Figure 7. Methane hydrate shows a notable increase in P-and S-wave velocities at saturations <20%, which is consistent with the description of the grain-coating model, as the contact-cementing model exhibits a greater increase in velocity, the acoustic velocity is lower than predicted by the model in the saturations 20–80%, and it is assumed that part of the hydrate is formed in the pore space. And a smoother trend in P-and S-wave velocities occurs at saturations >80%, which is consistent with the model. When saturation is above 80%, the P- and S-wave velocities of methane hydrate are close to the grain-coating model. According to the analysis in Section 4.1 and the results of the model calculations, the micro-distribution of methane hydrate can be divided into three stages. The low saturation is dominated by grain-coating, the medium saturation is dominated by pore-filling, and the high saturation becomes cementation again.

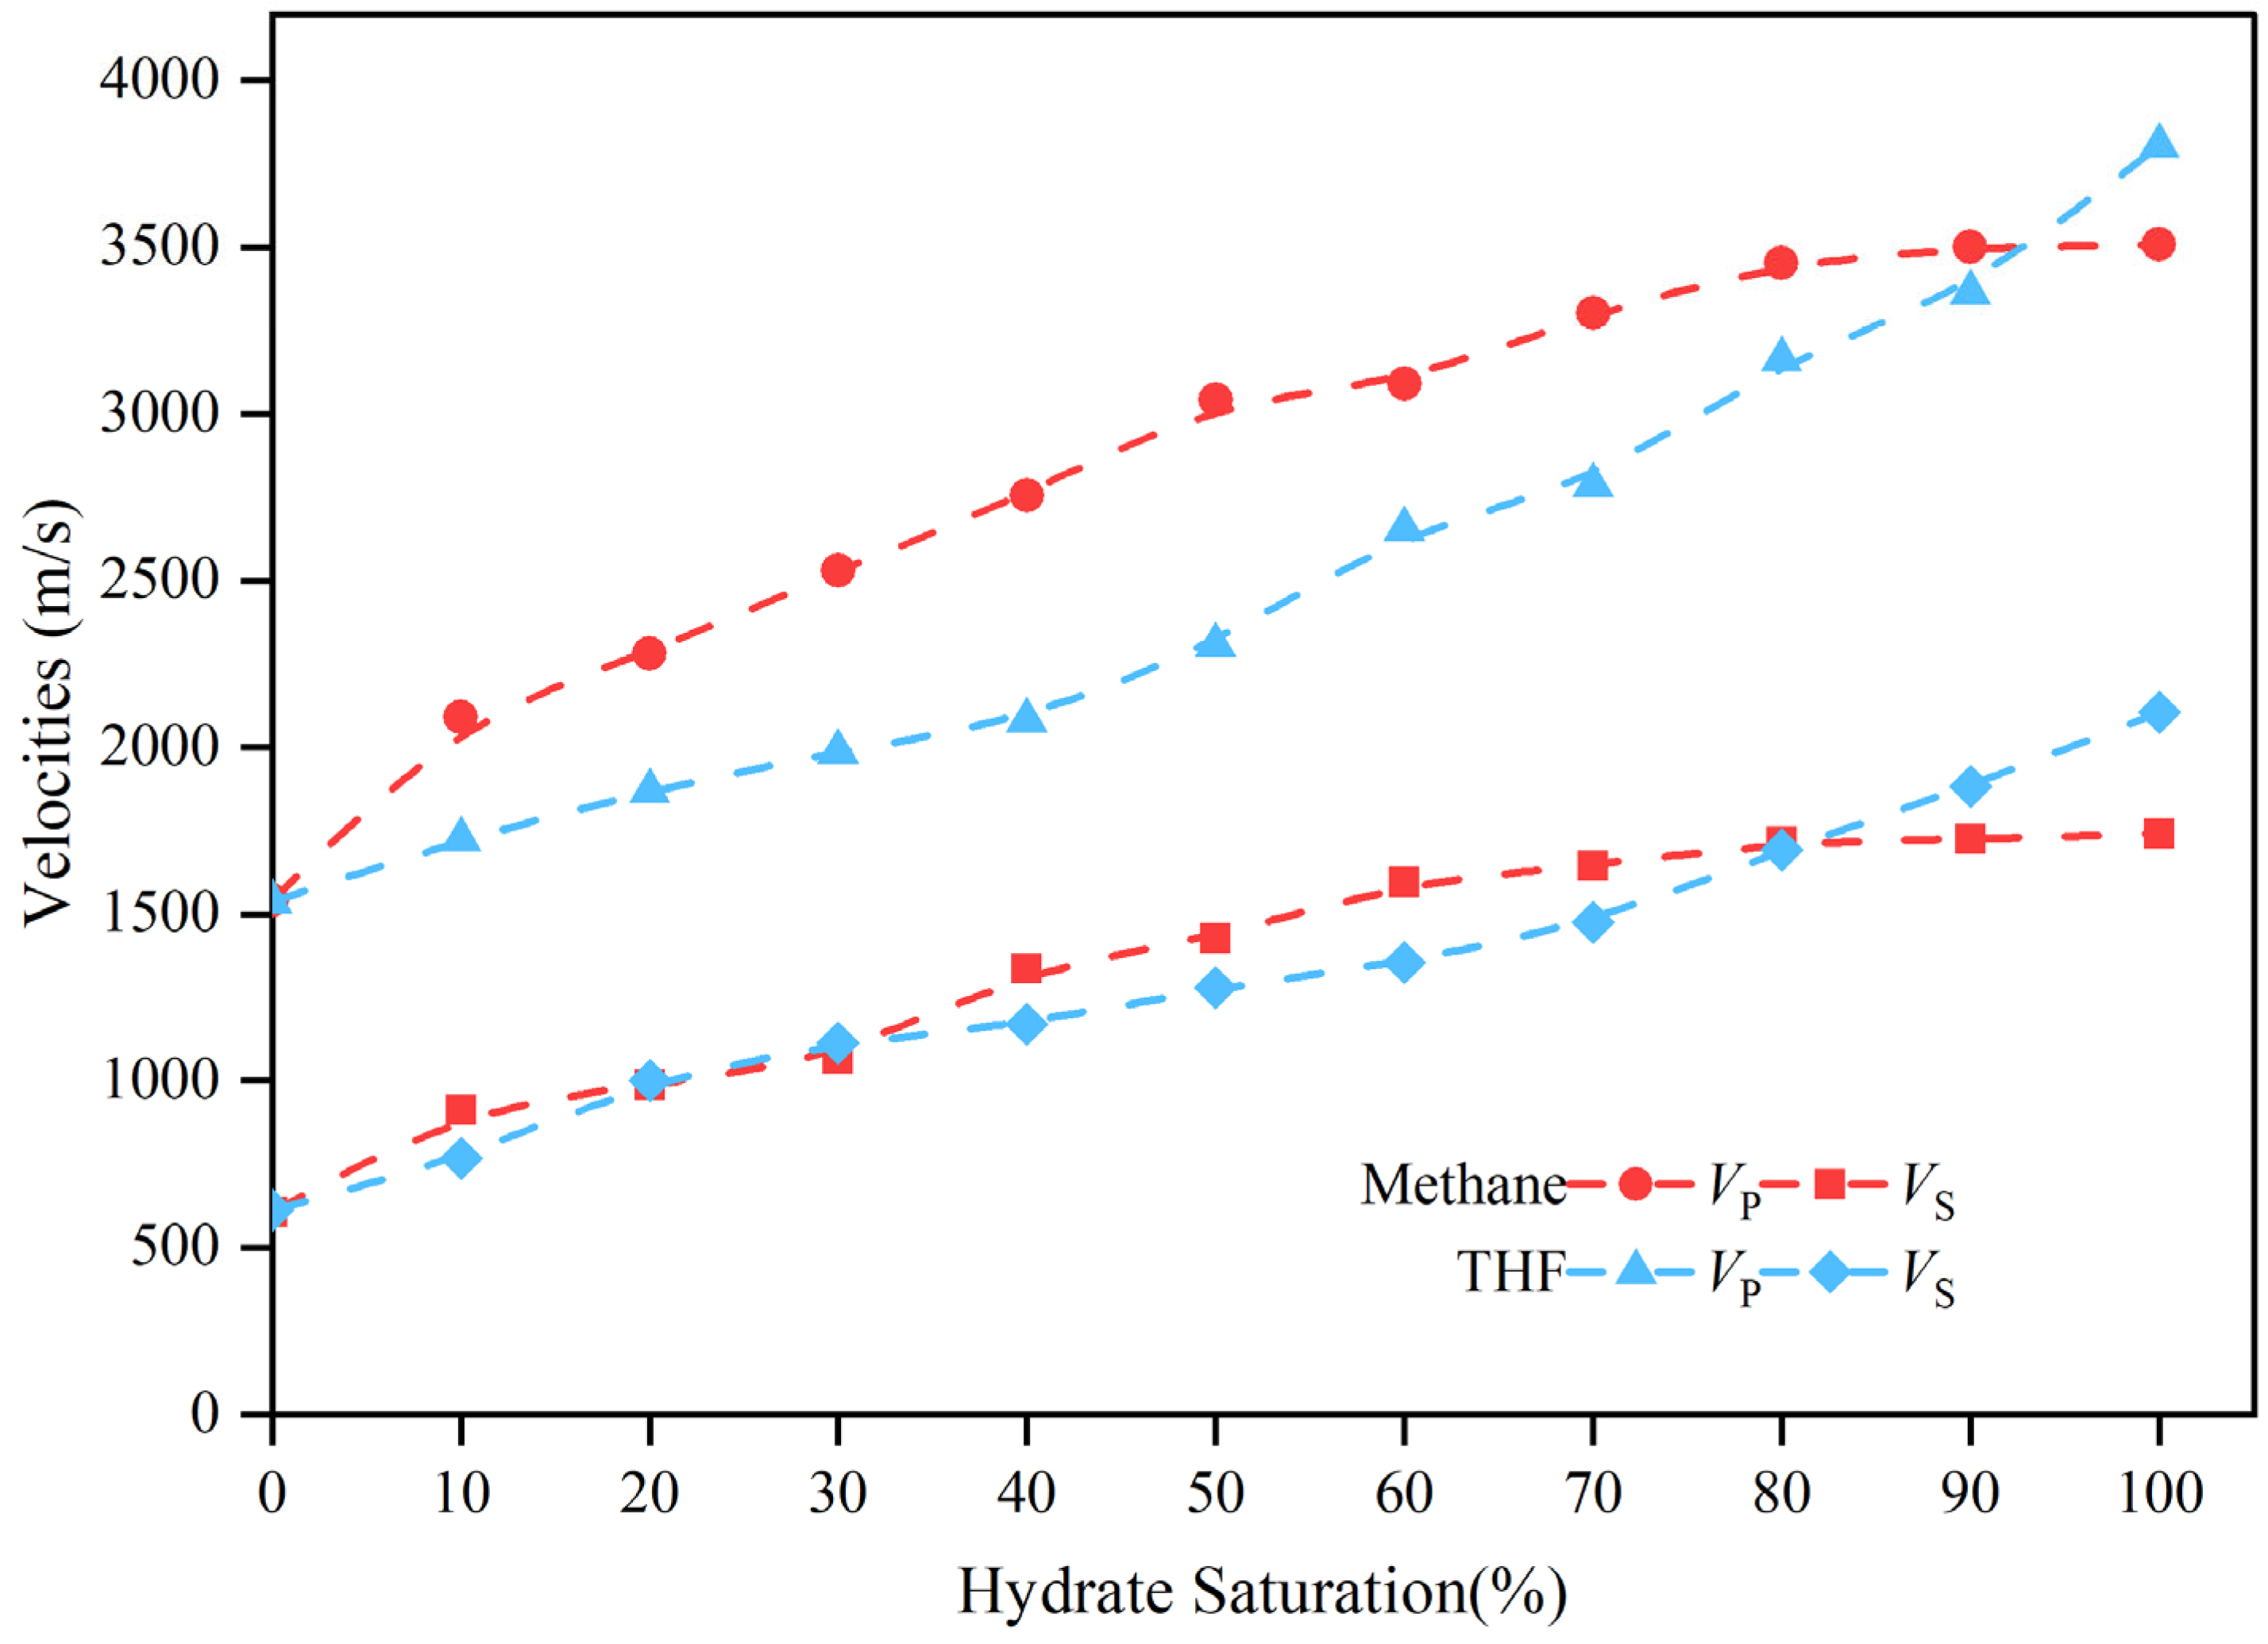
4.3. Acoustic Response Differences of Two Types of Hydrate-Bearing Sediments

Comparing the acoustic wave test results for both types of hydrate-bearing sediments (Figure 8), we see that the P-wave and S-wave velocities of methane hydrate samples are higher than those of THF hydrate samples at 0–70% saturation. However, at 80–100% saturation, the THF hydrate samples exhibit higher velocities for both P waves and S waves compared to methane hydrate samples. According to Lee et al. [41], although THF is a polar molecule, the relatively large molecular size and predominantly non-polar behavior in sediments lead to weaker hydrogen bonding with water. Both methane and THF hydrate have a density of approximately 0.91 g/cm3, while their Young′s moduli are 8.4 GPa and 8.2 GPa, respectively. Therefore, the mechanical properties of methane and THF hydrate should be similar. The above finding suggests that differences in the molecular properties of the guest molecules play a minor role in the differences between THF hydrate-bearing and methane hydrate-bearing sediments. Instead, factors such as the method of hydrate formation in the laboratory and the micro-distribution of hydrate in the pore space are likely to exert more influence on the mechanical properties of hydrate-bearing sediments.
Different hydrate formation methods produce different hydrate morphologies in sediments. Prior research has addressed the acoustic responses of hydrate formed under “excess gas”, “excess water”, and “dissolved gas” supply modes. Through validation using EMT, we conclude that methane hydrate synthesis by the excess gas method is dominated by grain-coating at low saturation, a mixed mode of grain-coating and pore-filling at medium saturation, and grain-coating at high saturation. X-CT imaging has revealed that the excess gas method of synthesizing methane hydrate predominantly forms around bubbles at low hydrate saturation, where the cementation mode dominates and acoustic velocity increases significantly, but at increasing hydrate saturation, hydrate forms in pore-filling or contact mode with a slow increase in acoustic velocity, while the cementation mode dominates at high hydrate saturation [15,60,61]. Observations of the micro-distribution of the two methane hydrate synthesis methods show similar results but different acoustic responses, with our experimental results showing higher Vp and Vs at 10–80% saturation than the experimental results for methane hydrate synthesized with excess water, and consistent acoustic velocities at 90% and 100% saturation, where most of the pores are filled with hydrate.
THF hydrate formed in pores or contact with sediment particles, with the pore-filling model dominating at low saturation and the load-bearing model at high saturation. Our experimental results validated by EMT exhibit similar results. In analogy to methane hydrate, the difference in hydrate micro-distribution at the same saturation leads to a difference in acoustic behavior; at 40% to 60% saturation, methane hydrate has already cemented the matrix particles considerably, whereas THF hydrate has only shifted from pore-filling to load-bearing, with a difference in Vp of ~700 m/s between the two, as seen from the experimental data. These conclusions are consistent with the results using X-CT observed in the literature [27,28,62]. THF hydrate will be partially suspended in the pore fluid, and as saturation increases, there will be partial load-bearing [48].

5. Conclusions

In this study, we conducted an experimental investigation into the acoustic characteristics of two hydrate types, utilizing a custom-built experimental device that integrates in situ hydrate formation with acoustic wave detection. Both methane hydrate and THF hydrate samples, spanning saturations from 0% to 100%, were synthesized using the ‘excess gas’ and ‘excess water’ methods, respectively. We obtained acoustic characteristics throughout the hydrate formation process to compare the acoustic properties of the two hydrate types.
The wave velocities of both THF hydrate samples and methane hydrate samples are different at the same saturation. At 0–70% saturation, the velocity of methane hydrate samples exceeds that of THF hydrate samples. Conversely, for saturations between 80% and 100%, THF hydrate samples exhibit higher velocities. Through verification with the effective medium model, we determined that THF hydrate-bearing sediments are mainly pore-filling at low saturation and the saturation is greater than 50%, which mainly follows the load-bearing model, while methane hydrate-bearing sediments formed by the excess gas method mainly follow the grain-coating model with a mixed micro-distribution. The micro-distribution of hydrate is the main factor affecting the acoustic response difference between the two hydrate samples.
We experimentally investigated the acoustic response of methane hydrate-bearing sediments and THF hydrate synthesized by the excess method and compared it with methane hydrate synthesized using the excess water method. The micro-distribution of the hydrate is found to be an important factor affecting the acoustic response. The experimental data from this study will be useful for geophysical modeling and correspond to different environments where hydrate-bearing sediments are deposited. This has important implications for hydrate exploration and monitoring, especially as the acoustic response varies depending on the synthesis method and saturation.

Author Contributions

Research design, W.Z., Q.B. and G.H.; methodology, Q.B. and Q.M.; experiments, W.Z.; data analysis, W.Z., Z.W., Q.B., T.L. and Y.Z.; writing—original draft preparation, W.Z. and Q.B.; writing—review and editing, W.Z., Q.B. and G.H.; supervision, Q.B. and G.H.; project administration, Q.B. and G.H. All authors have read and agreed to the published version of the manuscript.

Funding

This work was financially supported by the National Natural Science Foundation of China (grant numbers: 42276229, 42376218, 42206232), and Laoshan Laboratory (LSKJ202203503). The supports are gratefully acknowledged with thanks.

Institutional Review Board Statement

Not applicable.

Informed Consent Statement

Not applicable.

Data Availability Statement

The data that support the findings of this paper are available upon request.

Conflicts of Interest

The authors declare no conflicts of interest.

Appendix A. Effective Medium Theory

Model a: As mentioned above, the pore-filling model treats the hydrate as part of the pore fluid (Figure 6a), corresponding to no change in the elastic modulus of the skeleton. The formulas of P-wave velocity Vp, S-wave velocity Vs, and bulk density ρb of hydrate-bearing sediments are as follows:
V P = K sat + 4 3 G sat ρ b , V S = G sat ρ b
ρ b = ( 1 ϕ ) ρ s + ϕ ρ f
where Ksat and Gsat are the bulk and shear moduli of the equivalent medium, ρs, and ρf are the bulk densities of the solid and fluid phases of the rock, respectively, and both densities can be obtained by arithmetically averaging the densities of the components based on the volume percentage of each of their components.
When the sediment is filled with a fluid with a bulk modulus of Kf, the bulk modulus Ksat and the shear modulus Gsat of the sediment can be obtained by the following formula according to the Gassmann equation [63]:
K sat = K s ϕ K dry 1 + ϕ K f K dry / K s + K f 1 ϕ K f + ϕ K s K f K dry / K s ,   G sat = G dry
where Kma is the bulk modulus of the solid phase of the rock, Kdry and Gdry are the bulk and shear moduli of the dry rock, respectively, and Kf is the bulk modulus of the fluid. In Model a, there is hydrate formation in the pore space, so Kf is calculated by the following equation:
K f = 1 S h K w + S h K h 1
where Sh and Kh represent the volume fraction of hydrate in the pore space and the bulk modulus of hydrate, respectively, and Kw is the bulk modulus of water or gas.
In Equation (A3), Kdry and Gdry are calculated as
K dry = ϕ / ϕ c K HM + 4 / 3 G HM + 1 ϕ / ϕ c K ma + 4 / 3 G HM 1 4 3 G H M ,   ϕ < ϕ c ( 1 ϕ ) / ( 1 ϕ c ) K HM + 4 / 3 G HM + ( ϕ ϕ c ) / ( 1 ϕ c ) 4 / 3 G HM 1 4 3 G H M ,   φ φ c
G dry = ϕ / ϕ c G H M + Z + 1 ϕ / ϕ c G + Z 1 Z ,   ϕ < ϕ c ( 1 ϕ ) / ( 1 ϕ c ) G HM + Z + ( ϕ ϕ c ) / ( 1 ϕ c ) Z 1 Z ,   ϕ ϕ c
Z = G HM 6 9 K HM + 8 G HM K HM + 2 G HM
where ϕc is the critical porosity, generally taken as 0.36 to 0.40 [51].
The effective medium theory assumes that the moduli of elasticity of marine sediments are calculated as the weighted average of the modulus of elasticity of dry rock at a critical porosity ϕc and the modulus of elasticity of solid rock at zero porosity or at 1 porosity. The bulk and shear moduli of the dry rock framework at ϕc were calculated using the Hertz–Mindlin contact theory [64]:
K HM = n 2 1 ϕ c 2 G ma 2 18 π 2 1 ν 2 P 1 / 3 ,   G HM = 5 4 ν 5 2 ν 3 n 2 1 ϕ c 2 G ma 2 2 π 2 1 ν 2 P 1 / 3
where KHM and GHM are the moduli of elasticity at the critical porosity, Gma and ν are the shear moduli and Poisson’s ratio of the rock framework, ν = 0.5 ( K ma 2 / 3 G ma ) / ( K ma + G ma / 3 ) and n is the coordination number; in this paper, n = 9 and P is the pressure difference.
Model b is load-bearing, and hydrate is considered to be part of the rock skeleton, which produces two effects: one is to reduce the porosity and the other is to change the bulk and shear moduli of the skeleton. Therefore, based on Model a, the sediment porosity needs to be corrected. At the same time, the Kma and Gma of the sediment should be recalculated from the Voigt–Reuss–Hill (VRH) average:
K ma = 1 2 i = 1 m f i K i + i = 1 m f i / K i 1 ,   G ma = 1 2 i = 1 m f i G i + i = 1 m f i / G i 1
where Ki and Gi are the bulk and shear moduli, respectively, of each component; note that the normalized volume fractions of minerals and gas hydrate should be rewritten to account for the porosity reduction caused by the presence of the load-bearing hydrate. In this paper, the skeleton is composed of two parts, and the volume fraction of sand is f s = 1 ϕ / 1 ϕ + ϕ S h , while the volume fraction of hydrate is f h = ϕ S h / 1 ϕ + ϕ S h .
In addition, there is only water or gas in the sediment pore space, and the density and bulk modulus of the pore fluid are directly substituted by water. Since hydrate formation reduces the porosity, when calculating Kdry and Gdry, attention should be paid to the relationship between the magnitude of porosity ϕr and ϕc, and the appropriate formulas should be selected in Equations (5) and (6).
Models c and d: Drawing from the models proposed by Dvorkin et al. [65], the effective elastic moduli are calculated for a group of identical spheres cemented with hydrate [51]. In this context, when calculating Kdry and Gdry, the following formula is used:
K dry = 1 6 n ( 1 ϕ ) ( K h + 4 3 G h ) S n
G dry = 3 5 K dry + 3 20 n ( 1 ϕ ) G h S τ
where Kdry and Gdry are the bulk and shear moduli of the resultant solid matrix (sand cemented by hydrate), respectively, Kh and Gh are the bulk and shear moduli of the hydrate phase, n is the average number of contacts per grain, and Sn and Sτ are parameters proportional to the pressure of cementation and the number of cemented hydrate; their calculation formulas are as follows:
S n = A n ( Λ n ) α 2 + B n ( Λ n ) α + C n ( Λ n ) A n ( Λ n ) = 0.024153 Λ n 1.3646 B n ( Λ n ) = 0.20405 Λ n 0.89008 C n ( Λ n ) = 0.00024649 Λ n 1.9864 Λ n = 2 G h π G ( 1 ν ) ( 1 ν h ) 1 2 ν h
S τ = A τ ( Λ τ , ν ) α 2 + B τ ( Λ τ , ν ) α + C τ ( Λ τ , ν ) A τ ( Λ τ , ν ) = 10 2 ( 2.26 ν 2 + 2.07 ν + 2.3 ) Λ τ 0.079 ν 2 + 0.1754 ν 1.342 B τ ( Λ τ , ν ) = ( 0.0573 ν 2 + 0.0937 ν + 0.202 ) Λ τ 0.0274 ν 2 + 0.0529 ν 0.8765 C τ ( Λ τ , ν ) = 10 4 ( 9.654 ν 2 + 4.945 ν + 3.1 ) Λ τ 0.01867 ν 2 + 0.4011 ν 1.8186 Λ τ = G h π G
where Gh and νh are the shear modulus and Poisson’s ratio of hydrate, respectively, and G is the shear modulus of sand. α is the ratio of the radius of the cemented part of the hydrate to the radius of the sediment particles.
The parameters Sn and Sτ in Equations (A12) and (A13) describe both the contact-cementing and grain-coating models. The difference between these two models lies only in the values of the parameter α. The contact-cementing model takes the form
α C C = 2 φ h ϕ 0 3 n 1 ϕ 0 0.25
And the grain-coating model α takes the form
α E C = 2 φ h ϕ 0 3 1 ϕ 0 0.5

References

  1. Chong, Z.R.; Yang, S.H.B.; Babu, P.; Linga, P.; Li, X.-S. Review of Natural Gas Hydrates as an Energy Resource: Prospects and Challenges. Appl. Energy 2016, 162, 1633–1652. [Google Scholar] [CrossRef]
  2. Makogon, Y.F.; Holditch, S.A.; Makogon, T.Y. Natural Gas-Hydrates—A Potential Energy Source for the 21st Century. J. Pet. Sci. Eng. 2007, 56, 14–31. [Google Scholar] [CrossRef]
  3. Boswell, R. Is Gas Hydrate Energy Within Reach? Science 2009, 325, 957–958. [Google Scholar] [CrossRef] [PubMed]
  4. Collett, T.; Bahk, J.-J.; Baker, R.; Boswell, R.; Divins, D.; Frye, M.; Goldberg, D.; Husebø, J.; Koh, C.; Malone, M.; et al. Methane Hydrates in Nature—Current Knowledge and Challenges. J. Chem. Eng. Data 2015, 60, 319–329. [Google Scholar] [CrossRef]
  5. Geophysical Characterization of Gas Hydrates; Riedel, M.; Willoughby, E.C.; Chopra, S. (Eds.) Society of Exploration Geophysicists: Houston, TX, USA, 2010; ISBN 978-1-56080-218-1. [Google Scholar]
  6. Waite, W.F.; Santamarina, J.C.; Cortes, D.D.; Dugan, B.; Espinoza, D.N.; Germaine, J.; Jang, J.; Jung, J.W.; Kneafsey, T.J.; Shin, H.; et al. Physical Properties of Hydrate-Bearing Sediments. Rev. Geophys. 2009, 47, RG4003. [Google Scholar] [CrossRef]
  7. Ding, J.; Cheng, Y.; Deng, F.; Yan, C.; Sun, H.; Li, Q.; Song, B. Experimental Study on Dynamic Acoustic Characteristics of Natural Gas Hydrate Sediments at Different Depths. Int. J. Hydrogen Energy 2020, 45, 26877–26889. [Google Scholar] [CrossRef]
  8. Bu, Q.; Hu, G.; Liu, C.; Dong, J.; Xing, T.; Sun, J.; Li, C.; Meng, Q. Effect of Methane Gas on Acoustic Characteristics of Hydrate-Bearing Sediment-Model Analysis and Experimental Verification. J. Ocean Univ. China 2021, 20, 75–86. [Google Scholar] [CrossRef]
  9. Hu, G.-W.; Ye, Y.-G.; Zhang, J.; Diao, S.-B.; Liu, C.-L. Acoustic Properties of Hydrate-Bearing Unconsolidated Sediments Measured by the Bender Element Technique. Chin. J. Geophys. 2012, 55, 635–647. [Google Scholar] [CrossRef]
  10. Priest, J.A.; Best, A.I.; Clayton, C.R.I. A Laboratory Investigation into the Seismic Velocities of Methane Gas Hydrate-Bearing Sand: Seismic Velocity of hydrate-bearing Sand. J. Geophys. Res. Solid Earth 2005, 110, B04102. [Google Scholar] [CrossRef]
  11. Liu, Z.; Ning, F.; Hu, G.; Liu, L.; Liu, C.; Peng, L.; Wang, D.; Hu, W.; Zhang, Z. Characterization of Seismic Wave Velocity and Attenuation and Interpretation of Tetrahydrofuran Hydrate-Bearing Sand Using Resonant Column Testing. Mar. Pet. Geol. 2020, 122, 104620. [Google Scholar] [CrossRef]
  12. Hu, Q.; Li, Y.; Wu, N.; Jiang, Y.; Sun, X.; Wang, H.; Bu, Q.; Hu, G. Influences of Stress State on Compressional Wave Velocity of Sandy Hydrate-Bearing Sediment: Experiments and Modeling. Geoenergy Sci. Eng. 2024, 234, 212683. [Google Scholar] [CrossRef]
  13. Bu, Q.; Hu, G.; Liu, C.; Xing, T.; Li, C.; Meng, Q. Acoustic Characteristics and Micro-Distribution Prediction during Hydrate Dissociation in Sediments from the South China Sea. J. Nat. Gas Sci. Eng. 2019, 65, 135–144. [Google Scholar] [CrossRef]
  14. Chen, J.; Hu, G.; Bu, Q.; Liu, C.; Dong, L.; Wan, Y.; Mao, P.; Guo, Y.; Wang, Z. Elastic Wave Velocities of Hydrate-Bearing Sands Containing Methane Gas Bubbles: Insights from CT-Acoustic Observation and Theoretical Analysis. J. Nat. Gas Sci. Eng. 2021, 88, 103844. [Google Scholar] [CrossRef]
  15. Sahoo, S.K.; Madhusudhan, B.N.; Marín-Moreno, H.; North, L.J.; Ahmed, S.; Falcon-Suarez, I.H.; Minshull, T.A.; Best, A.I. Laboratory Insights Into the Effect of Sediment-Hosted Methane Hydrate Morphology on Elastic Wave Velocity From Time-Lapse 4-D Synchrotron X-Ray Computed Tomography. Geochem. Geophys. Geosyst. 2018, 19, 4502–4521. [Google Scholar] [CrossRef]
  16. Sæther, M.M.; Almenningen, S.; Ersland, G.; Lunde, P. Compressional Wave Phase Velocity Measurements during Hydrate Growth in Partially and Fully Water Saturated Sandstone. Fuel 2022, 324, 124522. [Google Scholar] [CrossRef]
  17. Chen, J.; Hu, G.; Bu, Q.; Wu, N.; Liu, C.; Chen, Q.; Li, C.; Wan, Y.; Wang, Z.; Zhao, W.; et al. Elastic Wave Velocity of Marine Sediments with Free Gas: Insights from CT-Acoustic Observation and Theoretical Analysis. Mar. Pet. Geol. 2023, 150, 106169. [Google Scholar] [CrossRef]
  18. Bu, Q.; Xing, T.; Li, C.; Zhao, J.; Liu, C.; Wang, Z.; Zhao, W.; Kang, J.; Meng, Q.; Hu, G. Effect of Hydrate Microscopic Distribution on Acoustic Characteristics during Hydrate Dissociation: An Insight from Combined Acoustic-CT Detection Study. J. Mar. Sci. Eng. 2022, 10, 1089. [Google Scholar] [CrossRef]
  19. Hu, G.; Ye, Y.; Zhang, J.; Liu, C.; Li, Q. Acoustic Response of Gas Hydrate Formation in Sediments from South China Sea. Mar. Pet. Geol. 2014, 52, 1–8. [Google Scholar] [CrossRef]
  20. Sahoo, S.K.; Best, A.I. The Influence of Gas Hydrate Morphology on Reservoir Permeability and Geophysical Shear Wave Remote Sensing. J. Geophys. Res. Solid Earth 2021, 126, e2021JB022206. [Google Scholar] [CrossRef]
  21. Zhao, J.; Yang, L.; Liu, Y.; Song, Y. Microstructural Characteristics of Natural Gas Hydrates Hosted in Various Sand Sediments. Phys. Chem. Chem. Phys. 2015, 17, 22632–22641. [Google Scholar] [CrossRef]
  22. Priest, J.A.; Rees, E.V.L.; Clayton, C.R.I. Influence of Gas Hydrate Morphology on the Seismic Velocities of Sands. J. Geophys. Res. Solid Earth 2009, 114, 2009JB006284. [Google Scholar] [CrossRef]
  23. Sultaniya, A.K.; Priest, J.A.; Clayton, C.R.I. Measurements of the Changing Wave Velocities of Sand during the Formation and Dissociation of Disseminated Methane Hydrate. J. Geophys. Res. Solid Earth 2015, 120, 778–789. [Google Scholar] [CrossRef]
  24. Marín-Moreno, H.; Sahoo, S.K.; Best, A.I. Theoretical Modeling Insights into Elastic Wave Attenuation Mechanisms in Marine Sediments with Pore-filling Methane Hydrate. J. Geophys. Res. Solid Earth 2017, 122, 1835–1847. [Google Scholar] [CrossRef]
  25. Bu, Q.; Meng, Q.; Dong, J.; Li, C.; Liu, C.; Zhao, J.; Wang, Z.; Zhao, W.; Kang, J.; Hu, G. Integration of Pore-Scale Visualization and an Ultrasonic Test System of Methane Hydrate-Bearing Sediments. Energies 2022, 15, 4938. [Google Scholar] [CrossRef]
  26. Guo, W.; Li, Y.; Jia, R.; Wang, Y.; Tang, G.; Li, X. Experimental Study on Mechanical Properties of Pore-Filling and Fracture-Filling Clayey Silt Hydrate-Bearing Sediments. Energy 2023, 284, 129354. [Google Scholar] [CrossRef]
  27. Lei, L.; Park, T.; Jarvis, K.; Pan, L.; Tepecik, I.; Zhao, Y.; Ge, Z.; Choi, J.-H.; Gai, X.; Galindo-Torres, S.A.; et al. Pore-Scale Observations of Natural Hydrate-Bearing Sediments via Pressure Core Sub-Coring and Micro-CT Scanning. Sci. Rep. 2022, 12, 3471. [Google Scholar] [CrossRef]
  28. Lv, J.; Zhao, J.; Jiang, L.; Liu, Y.; Mu, H. A Review of Micro Computed Tomography Studies on the Gas Hydrate Pore Habits and Seepage Properties in Hydrate Bearing Sediments. J. Nat. Gas Sci. Eng. 2020, 83, 103555. [Google Scholar] [CrossRef]
  29. Liu, T.; Tang, H.; Wu, P.; Wang, H.; Song, Y.; Li, Y. Acoustic Characteristics on Clayey-Silty Sediments of the South China Sea during Methane Hydrate Formation and Dissociation. Energy 2023, 282, 128978. [Google Scholar] [CrossRef]
  30. Sadeq, D.; Alef, K.; Iglauer, S.; Lebedev, M.; Barifcani, A. Compressional Wave Velocity of Hydrate-Bearing Bentheimer Sediments with Varying Pore Fillings. Int. J. Hydrogen Energy 2018, 43, 23193–23200. [Google Scholar] [CrossRef]
  31. Yun, T.S. Compressional and Shear Wave Velocities in Uncemented Sediment Containing Gas Hydrate. Geophys. Res. Lett. 2005, 32, L10609. [Google Scholar] [CrossRef]
  32. Ren, S.R.; Liu, Y.; Liu, Y.; Zhang, W. Acoustic Velocity and Electrical Resistance of Hydrate Bearing Sediments. J. Pet. Sci. Eng. 2010, 70, 52–56. [Google Scholar] [CrossRef]
  33. Dugarov, G.A.; Duchkov, A.A.; Duchkov, A.D.; Drobchik, A.N. Laboratory Validation of Effective Acoustic Velocity Models for Samples Bearing Hydrates of Different Type. J. Nat. Gas Sci. Eng. 2019, 63, 38–46. [Google Scholar] [CrossRef]
  34. Duchkov, A.D.; Dugarov, G.A.; Duchkov, A.A.; Drobchik, A.A. Laboratory Investigations into the Velocities and Attenuation of Ultrasonic Waves in Sand Samples Containing Water/Ice and Methane and Tetrahydrofuran Hydrates. Russ. Geol. Geophys. 2019, 60, 193–203. [Google Scholar] [CrossRef]
  35. Liu, Z.; Kim, J.; Lei, L.; Ning, F.; Dai, S. Tetrahydrofuran Hydrate in Clayey Sediments—Laboratory Formation, Morphology, and Wave Characterization. J. Geophys. Res. Solid Earth 2019, 124, 3307–3319. [Google Scholar] [CrossRef]
  36. Asadi, M.; Peyvandi, K.; Varaminian, F.; Mokarian, Z. Investigation of THF Hydrate Formation Kinetics: Experimental Measurements of Volume Changes. J. Mol. Liq. 2019, 290, 111200. [Google Scholar] [CrossRef]
  37. Chen, B.; Dong, H.; Sun, H.; Wang, P.; Yang, L. Effect of a Weak Electric Field on THF Hydrate Formation: Induction Time and Morphology. J. Pet. Sci. Eng. 2020, 194, 107486. [Google Scholar] [CrossRef]
  38. Hejazi, S.; Pahlavanzadeh, H.; Manteghian, M. Experimental Study and Kinetic Modeling on THF Hydrate Formation under a Static Electric Field. J. Nat. Gas Sci. Eng. 2021, 95, 104162. [Google Scholar] [CrossRef]
  39. Liu, W.; Wang, S.; Yang, M.; Song, Y.; Wang, S.; Zhao, J. Investigation of the Induction Time for THF Hydrate Formation in Porous Media. J. Nat. Gas Sci. Eng. 2015, 24, 357–364. [Google Scholar] [CrossRef]
  40. Strauch, B.; Schicks, J.M.; Luzi-Helbing, M.; Naumann, R.; Herbst, M. The Difference between Aspired and Acquired Hydrate Volumes–A Laboratory Study of THF Hydrate Formation in Dependence on Initial THF:H2O Ratios. J. Chem. Thermodyn. 2018, 117, 193–204. [Google Scholar] [CrossRef]
  41. Lee, J.Y.; Yun, T.S.; Santamarina, J.C.; Ruppel, C. Observations Related to Tetrahydrofuran and Methane Hydrates for Laboratory Studies of Hydrate-Bearing Sediments: Study of hydrate-bearing sediments. Geochem. Geophys. Geosyst. 2007, 8, Q06003. [Google Scholar] [CrossRef]
  42. Konno, Y.; Jin, Y.; Yoneda, J.; Kida, M.; Egawa, K.; Ito, T.; Suzuki, K.; Nagao, J. Effect of Methane Hydrate Morphology on Compressional Wave Velocity of Sandy Sediments: Analysis of Pressure Cores Obtained in the Eastern Nankai Trough. Mar. Pet. Geol. 2015, 66, 425–433. [Google Scholar] [CrossRef]
  43. Li, Y.; Liu, C.; Liao, H.; Lin, D.; Bu, Q.; Liu, Z. Mechanical Properties of the Clayey-Silty Sediment-Natural Gas Hydrate Mixed System. Nat. Gas Ind. B 2021, 8, 154–162. [Google Scholar] [CrossRef]
  44. Yan, C.; Cheng, Y.; Li, M.; Han, Z.; Zhang, H.; Li, Q.; Teng, F.; Ding, J. Mechanical Experiments and Constitutive Model of Natural Gas Hydrate Reservoirs. Int. J. Hydrogen Energy 2017, 42, 19810–19818. [Google Scholar] [CrossRef]
  45. Kou, X.; Li, X.-S.; Wang, Y.; Liu, J.-W.; Chen, Z.-Y. Effects of Gas Occurrence Pattern on Distribution and Morphology Characteristics of Gas Hydrates in Porous Media. Energy 2021, 226, 120401. [Google Scholar] [CrossRef]
  46. Waite, W.F.; Winters, W.J.; Mason, D.H. Methane Hydrate Formation in Partially Water-Saturated Ottawa Sand. Am. Mineral. 2004, 89, 1202–1207. [Google Scholar] [CrossRef]
  47. Bu, Q.T.; Hu, G.W.; Ye, Y.G.; Liu, C.L.; Li, C.F.; Best, A.I.; Wang, J.S. The Elastic Wave Velocity Response of Methane Gas Hydrate Formation in Vertical Gas Migration Systems. J. Geophys. Eng. 2017, 14, 555–569. [Google Scholar] [CrossRef]
  48. Schindler, M.; Batzle, M.L.; Prasad, M. Micro X-Ray Computed Tomography Imaging and Ultrasonic Velocity Measurements in Tetrahydrofuran-hydrate-bearing Sediments. Geophys. Prospect. 2017, 65, 1025–1036. [Google Scholar] [CrossRef]
  49. Kim, J.; Seol, Y.; Dai, S. Waves in THF hydrate-bearing sand. In Proceedings of the 9th International Conference on Gas Hydrates, (ICGH2017), Denver, CO, USA, 25–30 June 2017. [Google Scholar]
  50. Rydzy, M.B. The Effect of Hydrate Formation on the Elastic Properties of Unconsolidated Sediment; Colorado School of Mines: Golden, CO, USA, 2014; ISBN 1-303-69766-1. [Google Scholar]
  51. Dvorkin, J.; Nur, A. Elasticity of High-porosity Sandstones: Theory for Two North Sea Data Sets. Geophysics 1996, 61, 1363–1370. [Google Scholar] [CrossRef]
  52. Helgerud, M.B.; Dvorkin, J.; Nur, A.; Sakai, A.; Collett, T. Elastic-Wave Velocity in Marine Sediments with Gas Hydrates: Effective Medium Modeling. Geophys. Res. Lett. 1999, 26, 2021–2024. [Google Scholar] [CrossRef]
  53. Ecker, C. Seismic Characterization of Methane Hydrate Structures; Stanford University: Stanford, CA, USA, 1998. [Google Scholar]
  54. Ghosh, R.; Ojha, M.; Kumar, P. Review of Rock Physics Theories for Quantifying Gas Hydrate and Associated Uncertainties. J. Asian Earth Sci. 2023, 256, 105828. [Google Scholar] [CrossRef]
  55. Yuan, H.; Han, D.; Wang, Y. A Review of Rock Physical Models for Elastic Properties Characterization of Gas Hydrate Bearing Sediments. J. Pet. Sci. Eng. 2022, 218, 111013. [Google Scholar] [CrossRef]
  56. Pan, H.; Li, H.; Chen, J.; Zhang, Y.; Cai, S.; Huang, Y.; Zheng, Y.; Zhao, Y.; Deng, J. A Unified Contact Cementation Theory for Gas Hydrate Morphology Detection and Saturation Estimation from Elastic-Wave Velocities. Mar. Pet. Geol. 2020, 113, 104146. [Google Scholar] [CrossRef]
  57. Zhu, X.; Liu, T.; Ma, S.; Liu, X.; Li, A. Morphology Identification of Gas Hydrate Based on a Machine Learning Method and Its Applications on Saturation Estimation. Geophys. J. Int. 2023, 234, 1307–1325. [Google Scholar] [CrossRef]
  58. Best, A.I.; Priest, J.A.; Clayton, C.R.I.; Rees, E.V.L. The Effect of Methane Hydrate Morphology and Water Saturation on Seismic Wave Attenuation in Sand under Shallow Sub-Seafloor Conditions. Earth Planet. Sci. Lett. 2013, 368, 78–87. [Google Scholar] [CrossRef]
  59. Mavko, G.; Mukerji, T.; Dvorkin, J. The Rock Physics Handbook, 3rd ed.; Cambridge University Press: Cambridge, UK, 2020; ISBN 978-1-108-33301-6. [Google Scholar]
  60. Abbasi, G.R.; Arif, M.; Isah, A.; Ali, M.; Mahmoud, M.; Hoteit, H.; Keshavarz, A.; Iglauer, S. Gas Hydrate Characterization in Sediments via X-Ray Microcomputed Tomography. Earth-Sci. Rev. 2022, 234, 104233. [Google Scholar] [CrossRef]
  61. Chaouachi, M.; Falenty, A.; Sell, K.; Enzmann, F.; Kersten, M.; Haberthür, D.; Kuhs, W.F. Microstructural Evolution of Gas Hydrates in Sedimentary Matrices Observed with Synchrotron X-Ray Computed Tomographic Microscopy: MICROSTRUCTRE OF GAS HYDRATES. Geochem. Geophys. Geosyst. 2015, 16, 1711–1722. [Google Scholar] [CrossRef]
  62. Jiang, L.; Xu, N.; Liu, Q.; Cheng, Z.; Liu, Y.; Zhao, J. Review of Morphology Studies on Gas Hydrate Formation for Hydrate-Based Technology. Cryst. Growth Des. 2020, 20, 8148–8161. [Google Scholar] [CrossRef]
  63. Gassmann, F. Elastic waves through a packing of spheres. Geophysics 1951, 16, 673–685. [Google Scholar] [CrossRef]
  64. Mindlin, R.D. Compliance of Elastic Bodies in Contact. J. Appl. Mech. 1949, 16, 259–268. [Google Scholar] [CrossRef]
  65. Dvorkin, J.; Nur, A.; Yin, H. Effective Properties of Cemented Granular Materials. Mech. Mater. 1994, 18, 351–366. [Google Scholar] [CrossRef]
Figure 1. Experimental device for gas hydrate formation and acoustic velocity detection. T and P denote the temperature and pressure, respectively.
Jmse 12 02239 g001
Figure 2. Particle size distribution of the sediment. The black curve represents the cumulative distribution of natural sand particle sizes. The blue histogram shows the different distributions of natural sand particle sizes.
Jmse 12 02239 g002
Figure 3. Ultrasonic waveforms of samples with different methane hydrate saturations. A decrease in P-wave arrival times with increasing hydrate saturation can be observed.
Jmse 12 02239 g003
Figure 4. Ultrasonic waveforms of samples with different tetrahydrofuran (THF) hydrate saturations. A decrease in P-wave arrival times with increasing hydrate saturation can be observed.
Jmse 12 02239 g004
Figure 5. Comparison of the methane (a,b) and THF (c,d) hydrate-bearing sediment experimental data in this study with data from published papers [9,10,22,31,32,33,47,48,49,50]. (Lines show data approximation by the 3rd-order polynomials).
Jmse 12 02239 g005
Figure 6. Schematic diagrams of four distinct hydrate morphologies (modified from [56]). (a) Pore-filling; (b) load-bearing; (c) contact-cementing; (d) grain-coating. Blue—matrix grains; white—pore space; yellow—hydrate.
Jmse 12 02239 g006
Figure 7. Comparison of obtained compressional and shear wave velocities in samples bearing methane (a,b) and THF (c,d) hydrate with estimation by EMT.
Jmse 12 02239 g007
Figure 8. Comparison of acoustic velocities of methane and THF hydrate-bearing sediments.
Jmse 12 02239 g008
Table 1. Experimental results for methane and tetrahydrofuran (THF) hydrate samples.
Hydrate
Saturation (%)
Methane Hydrate SamplesTHF Hydrate Samples
Vp (m/s)Vs (m/s)Vp (m/s)Vs (m/s)
01540.1606.31537.8610.1
102089.8913.01723.6767.2
202281.7988.21869.71002.0
302529.11066.21988.41112.4
402755.71336.52081.31170.4
503041.51428.12306.01280.0
603090.01596.32655.41354.1
703303.51644.62785.71474.2
803452.11716.63163.81691.6
903500.71723.83364.61884.1
1003508.01741.73805.42105.1
Table 2. Input parameters for effective medium models [6,41,58,59].
MaterialBulk Modulus (GPa)Shear Modulus (GPa)Density (Kg/m3)
Quartz36.6452650
Water2.1701000
Methane hydrate7.93.3926
THF hydrate7.923.25910
Methane gas0.120230
Disclaimer/Publisher’s Note: The statements, opinions and data contained in all publications are solely those of the individual author(s) and contributor(s) and not of MDPI and/or the editor(s). MDPI and/or the editor(s) disclaim responsibility for any injury to people or property resulting from any ideas, methods, instructions or products referred to in the content.

