
Experimental Compressive Assessment of Different Stiffened Plate Welding Configurations


Abstract
1. Introduction
2. Experimental Compressive Collapse Test Procedure
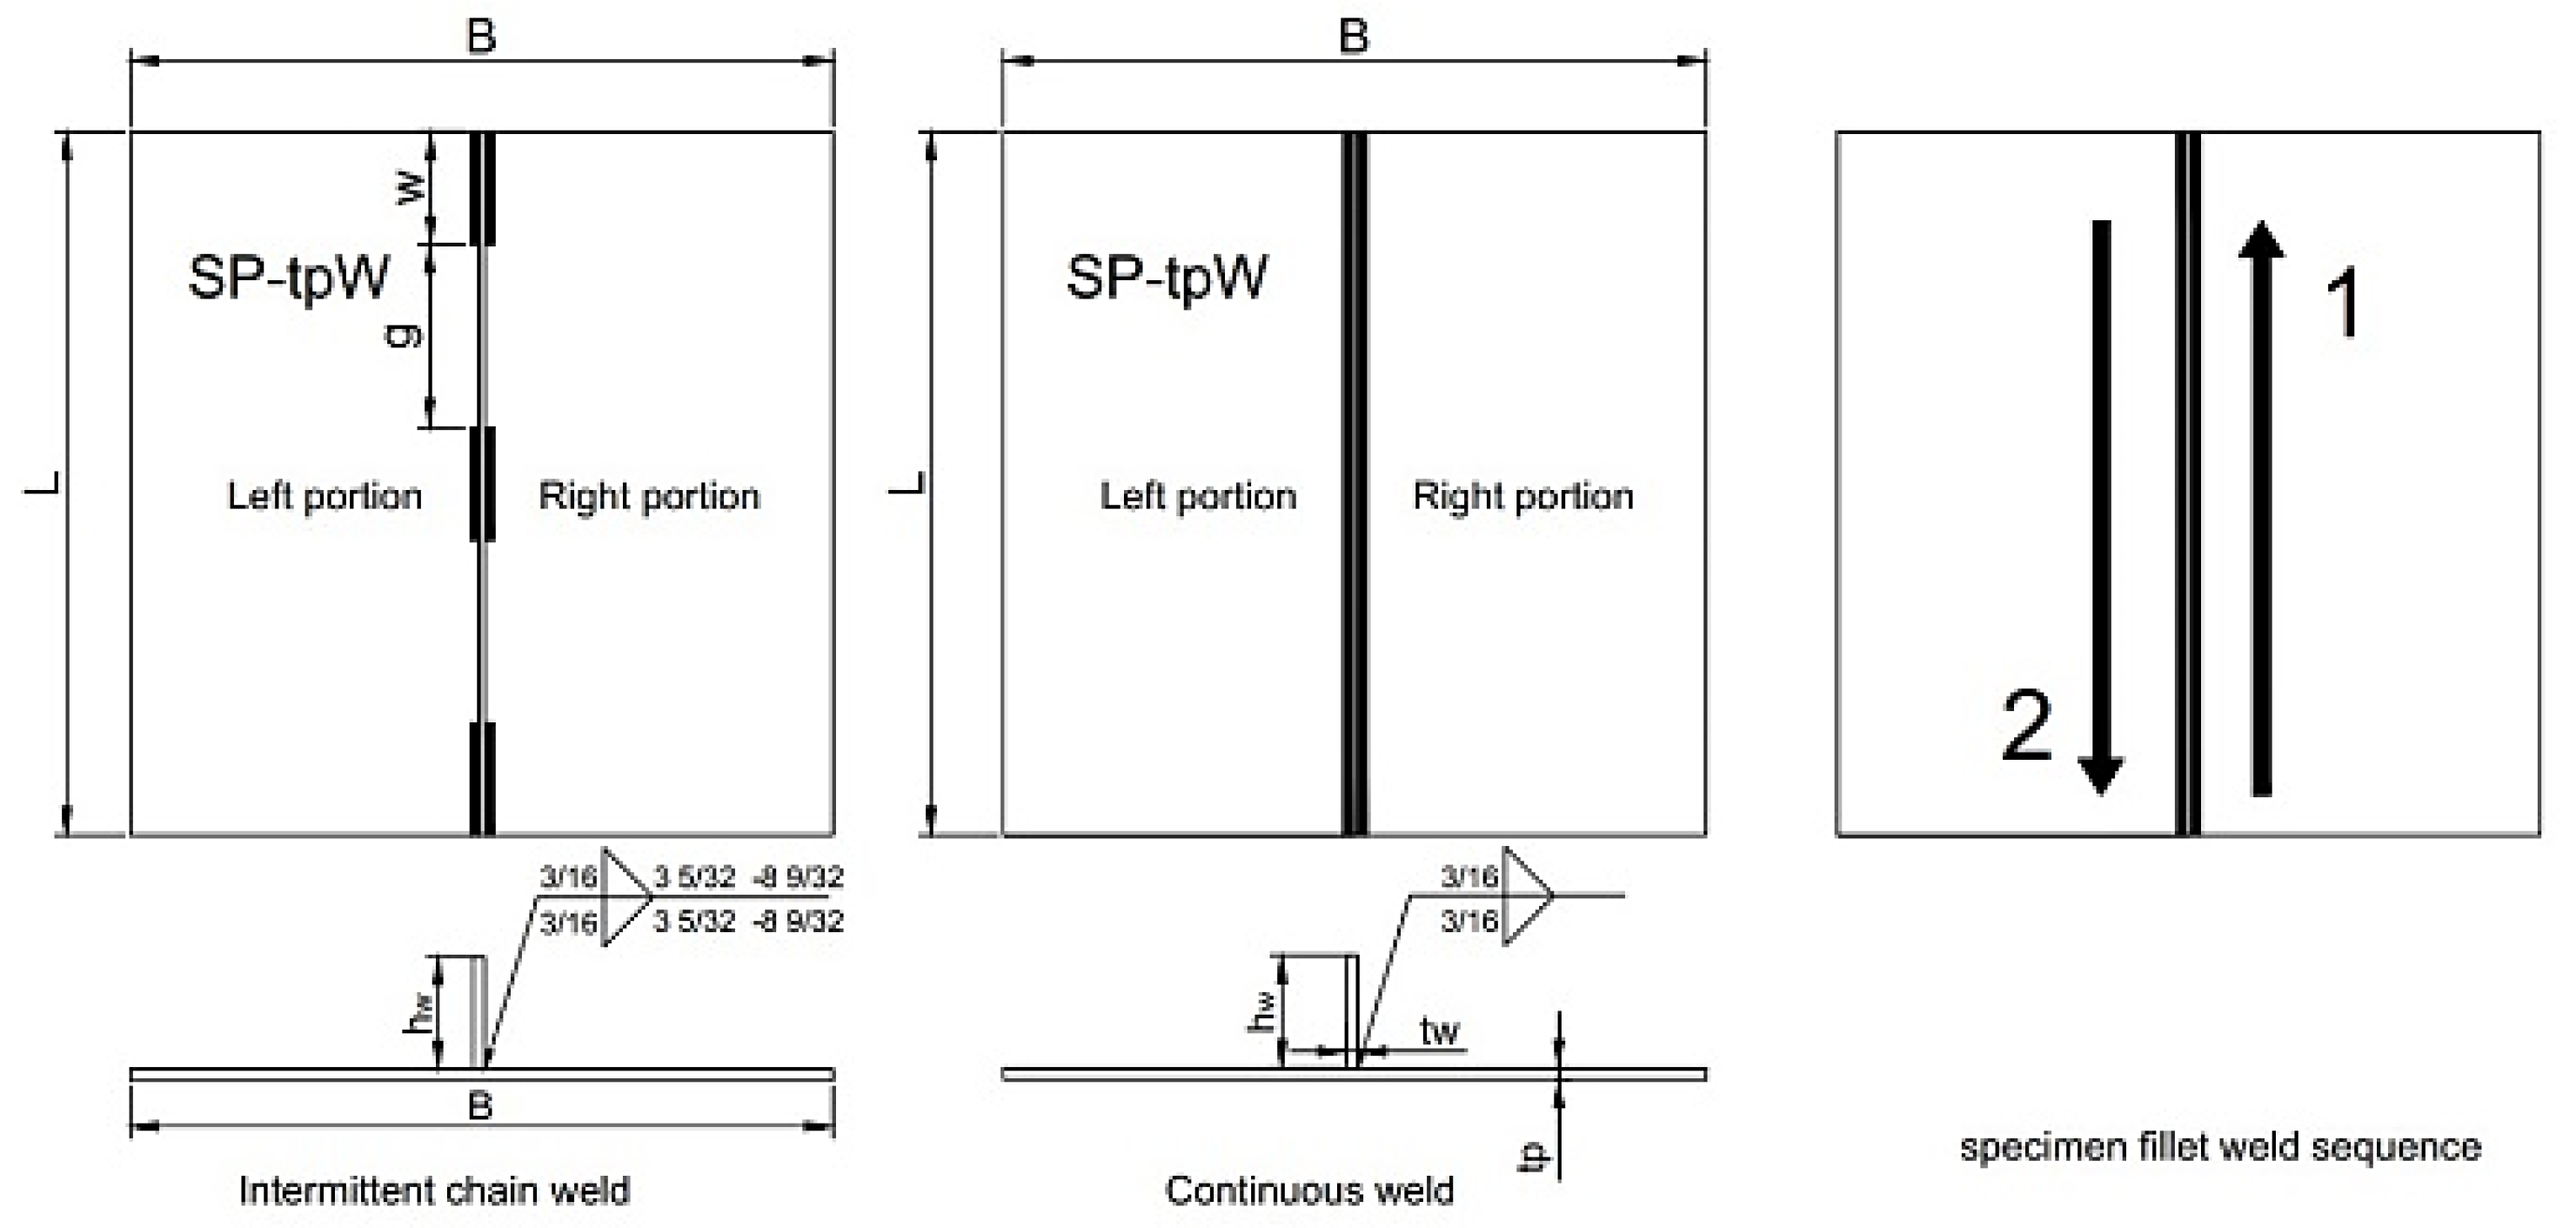
2.1. Material and Specimen Preparation
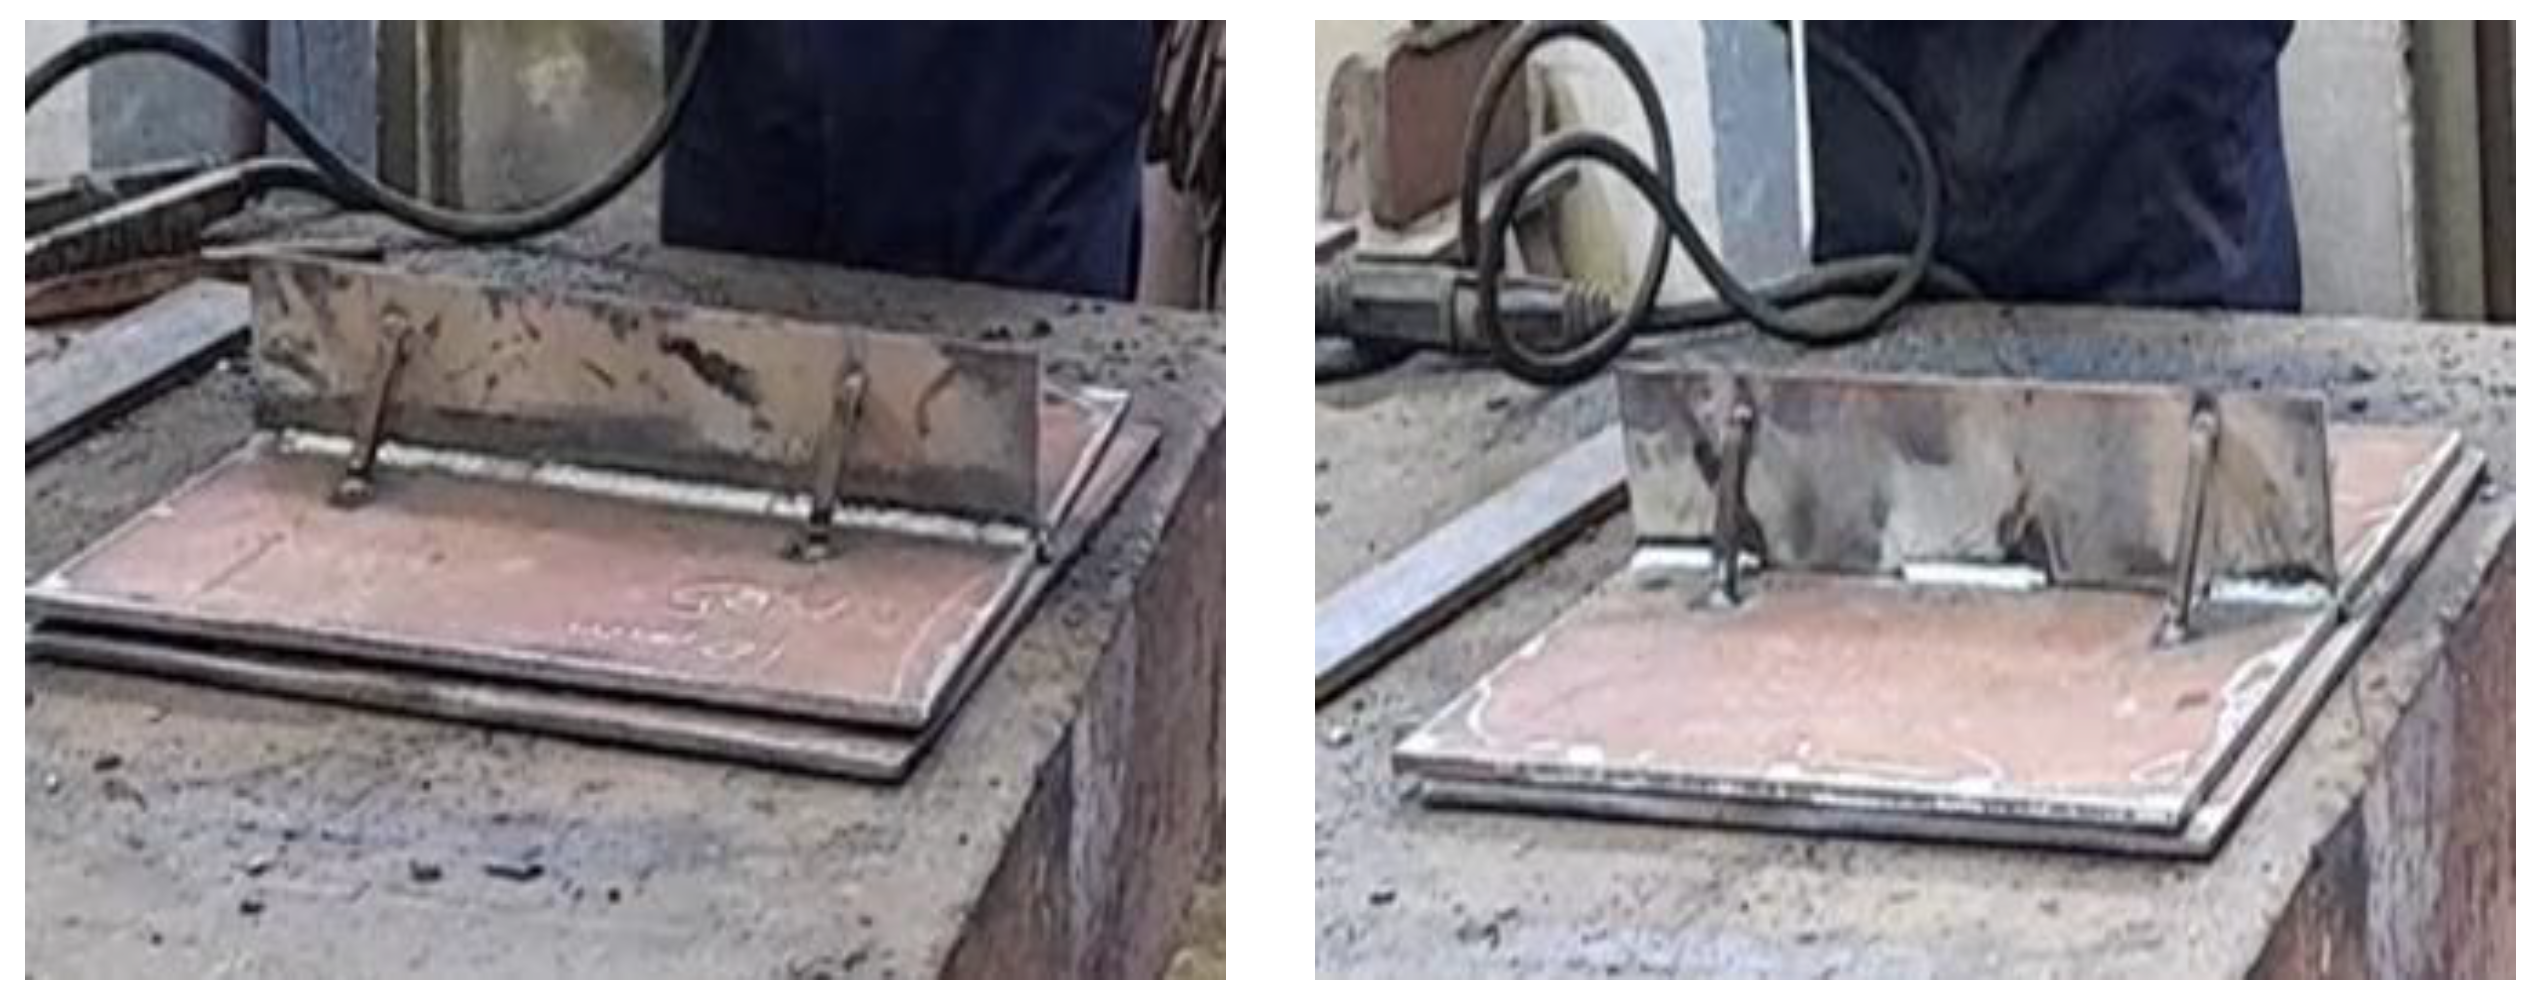
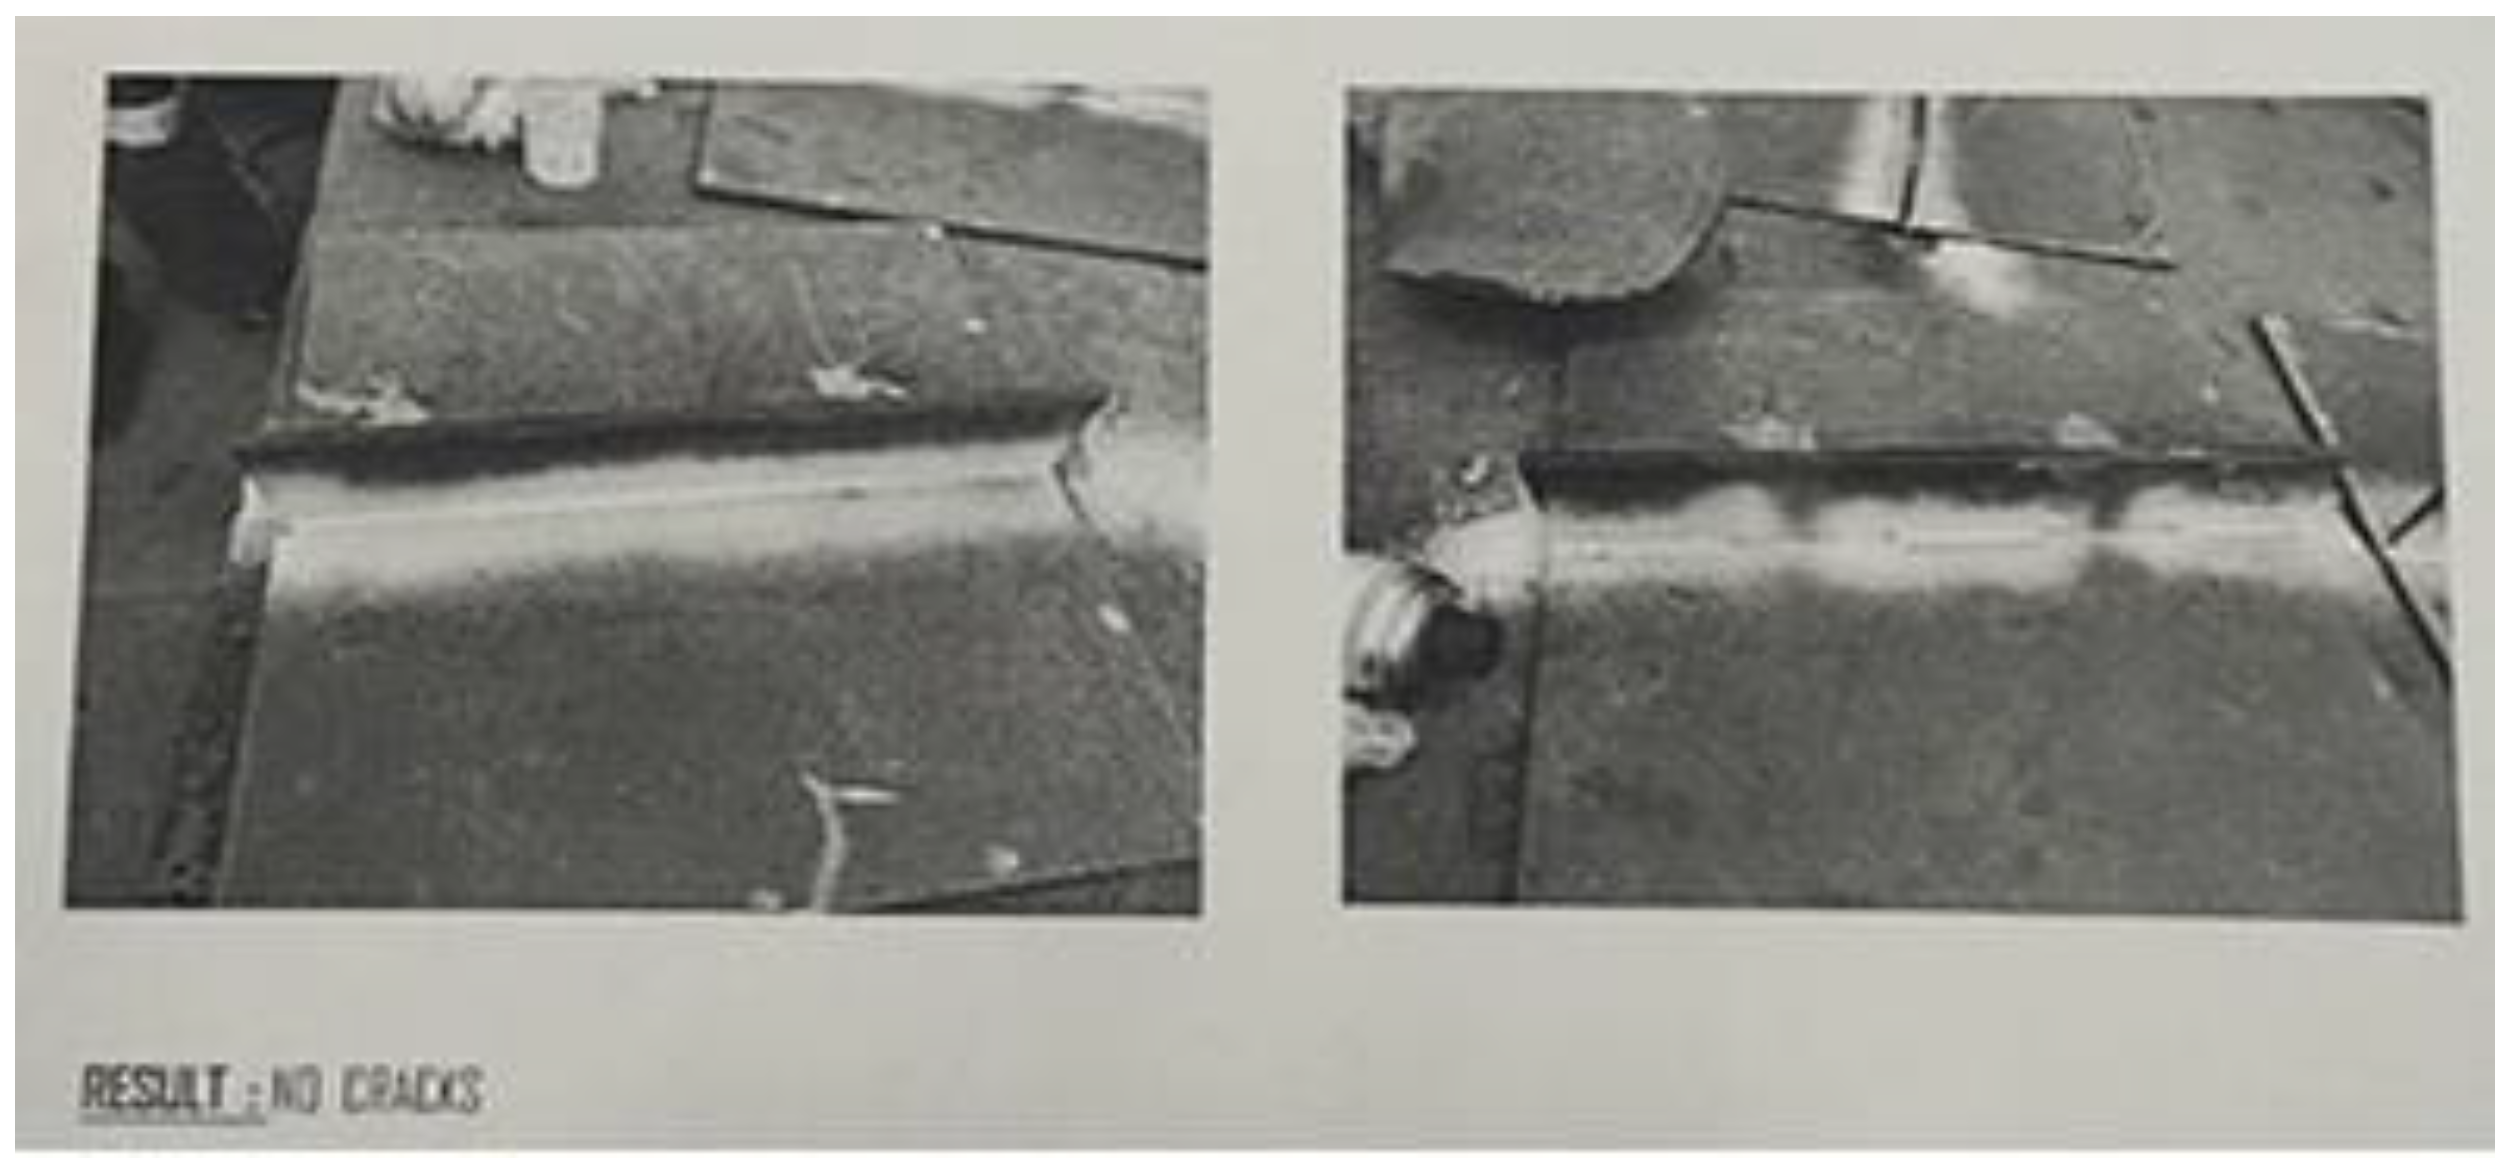
2.2. Welding Procedure
2.3. Static Compressive Test Set-Up
3. Compressive Test Results
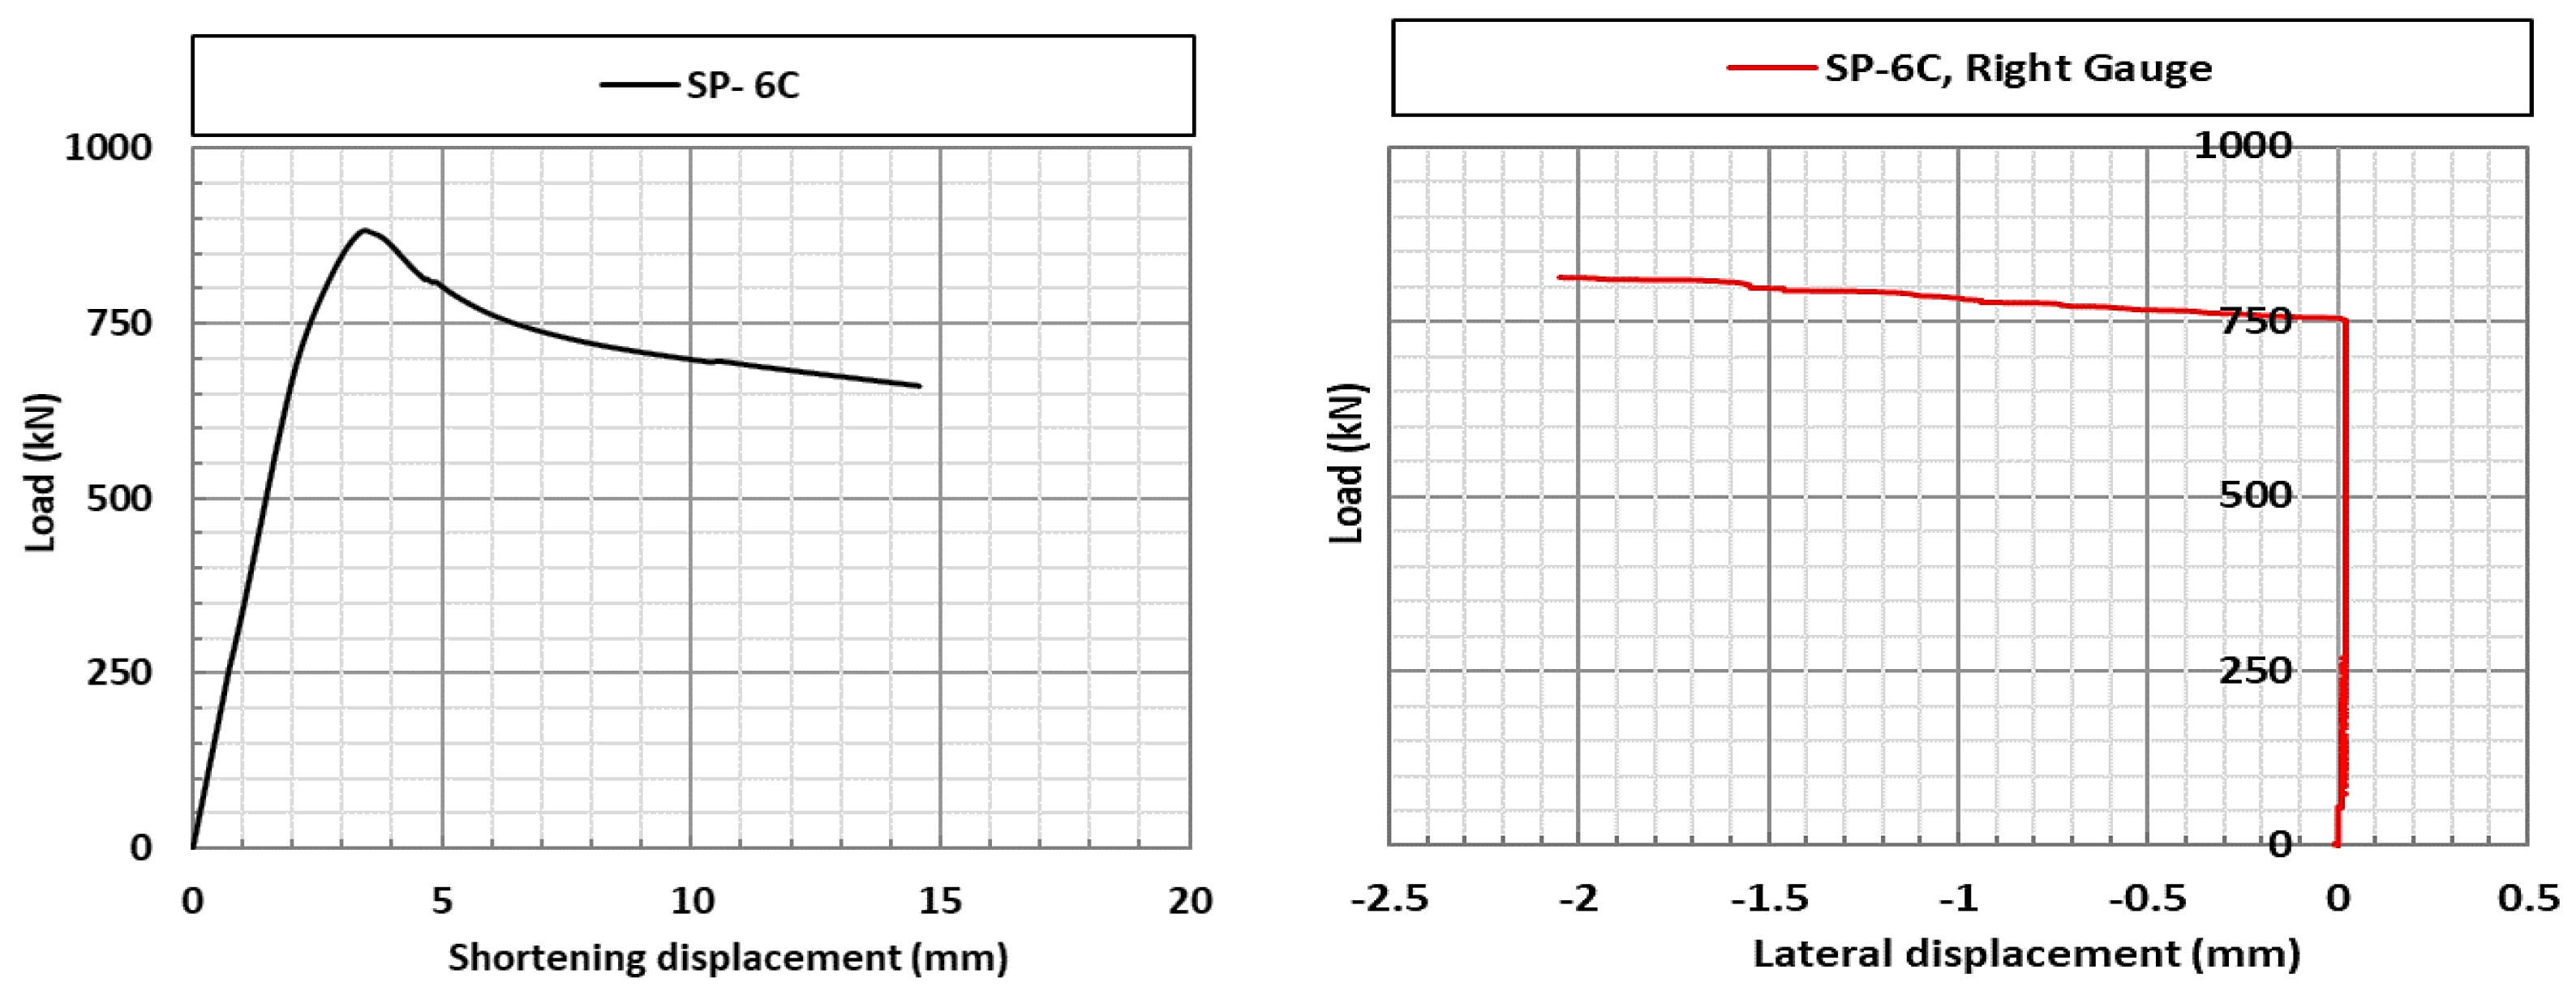
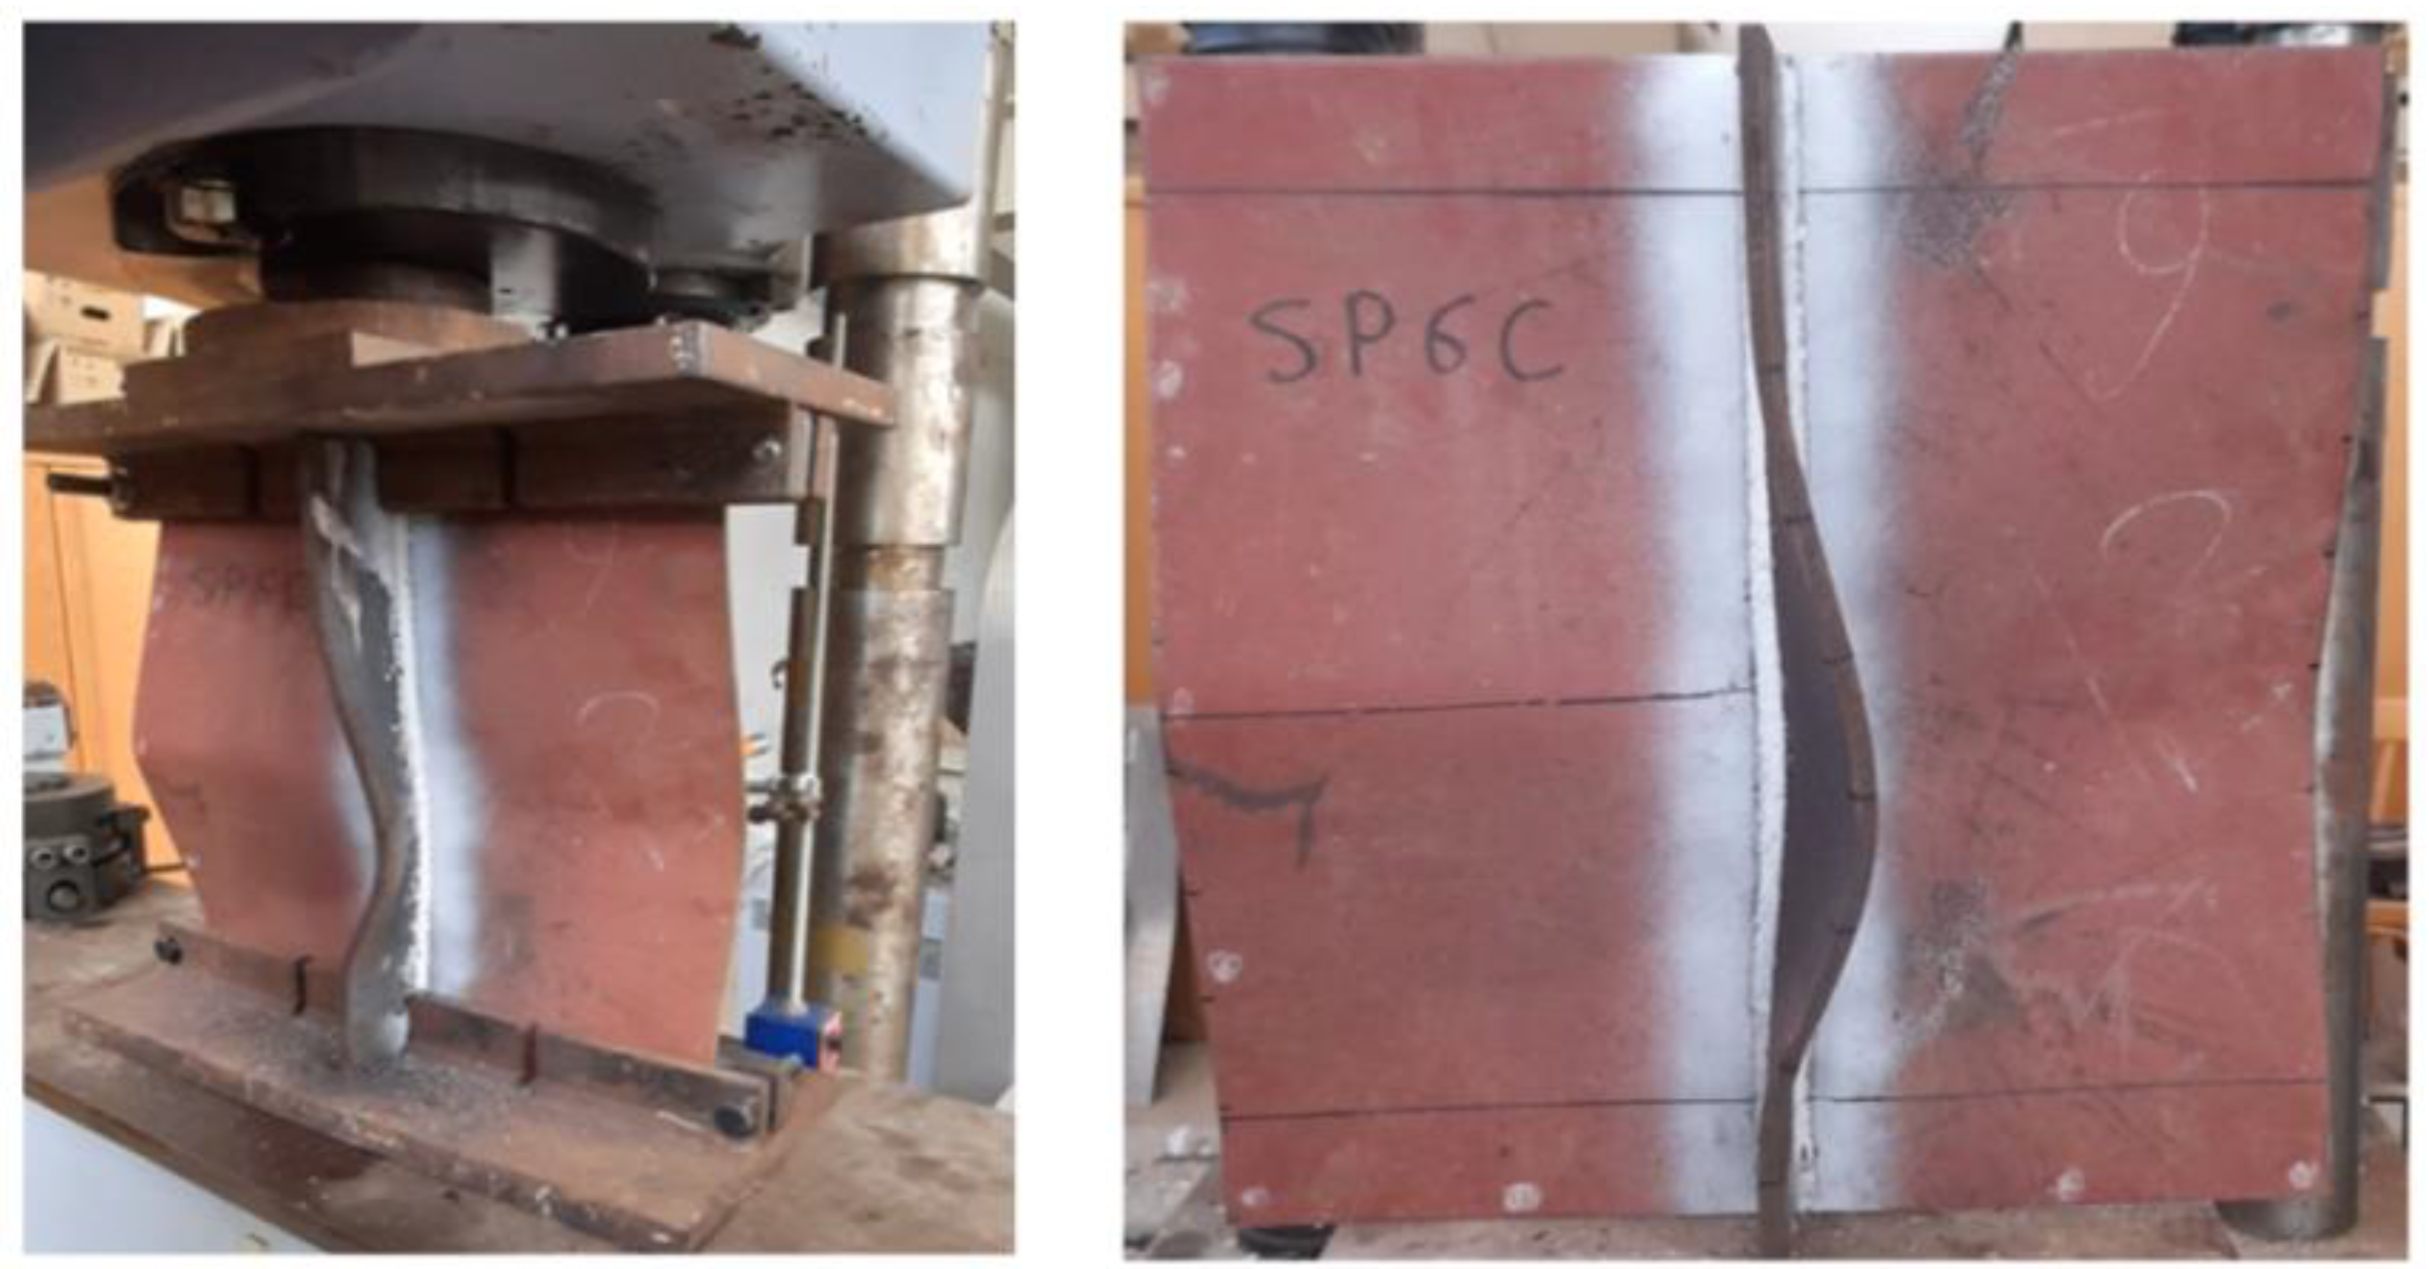
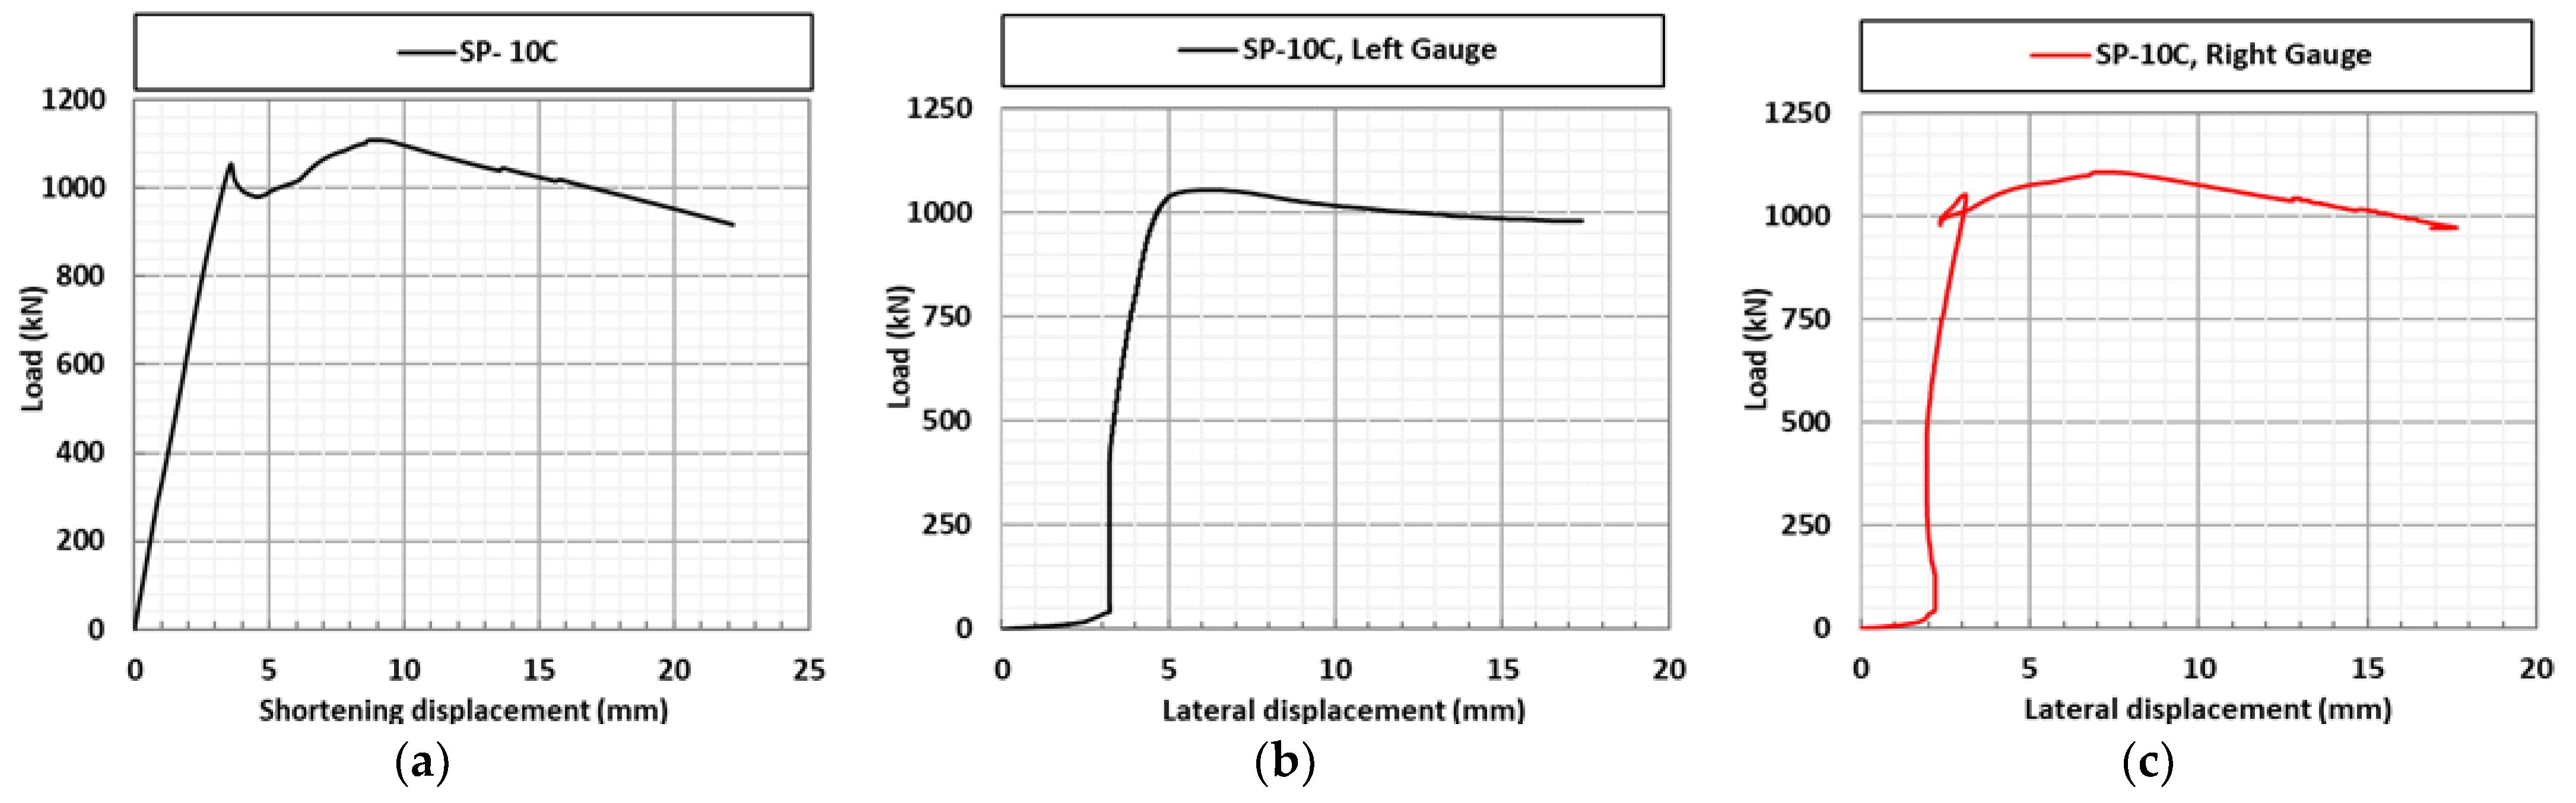
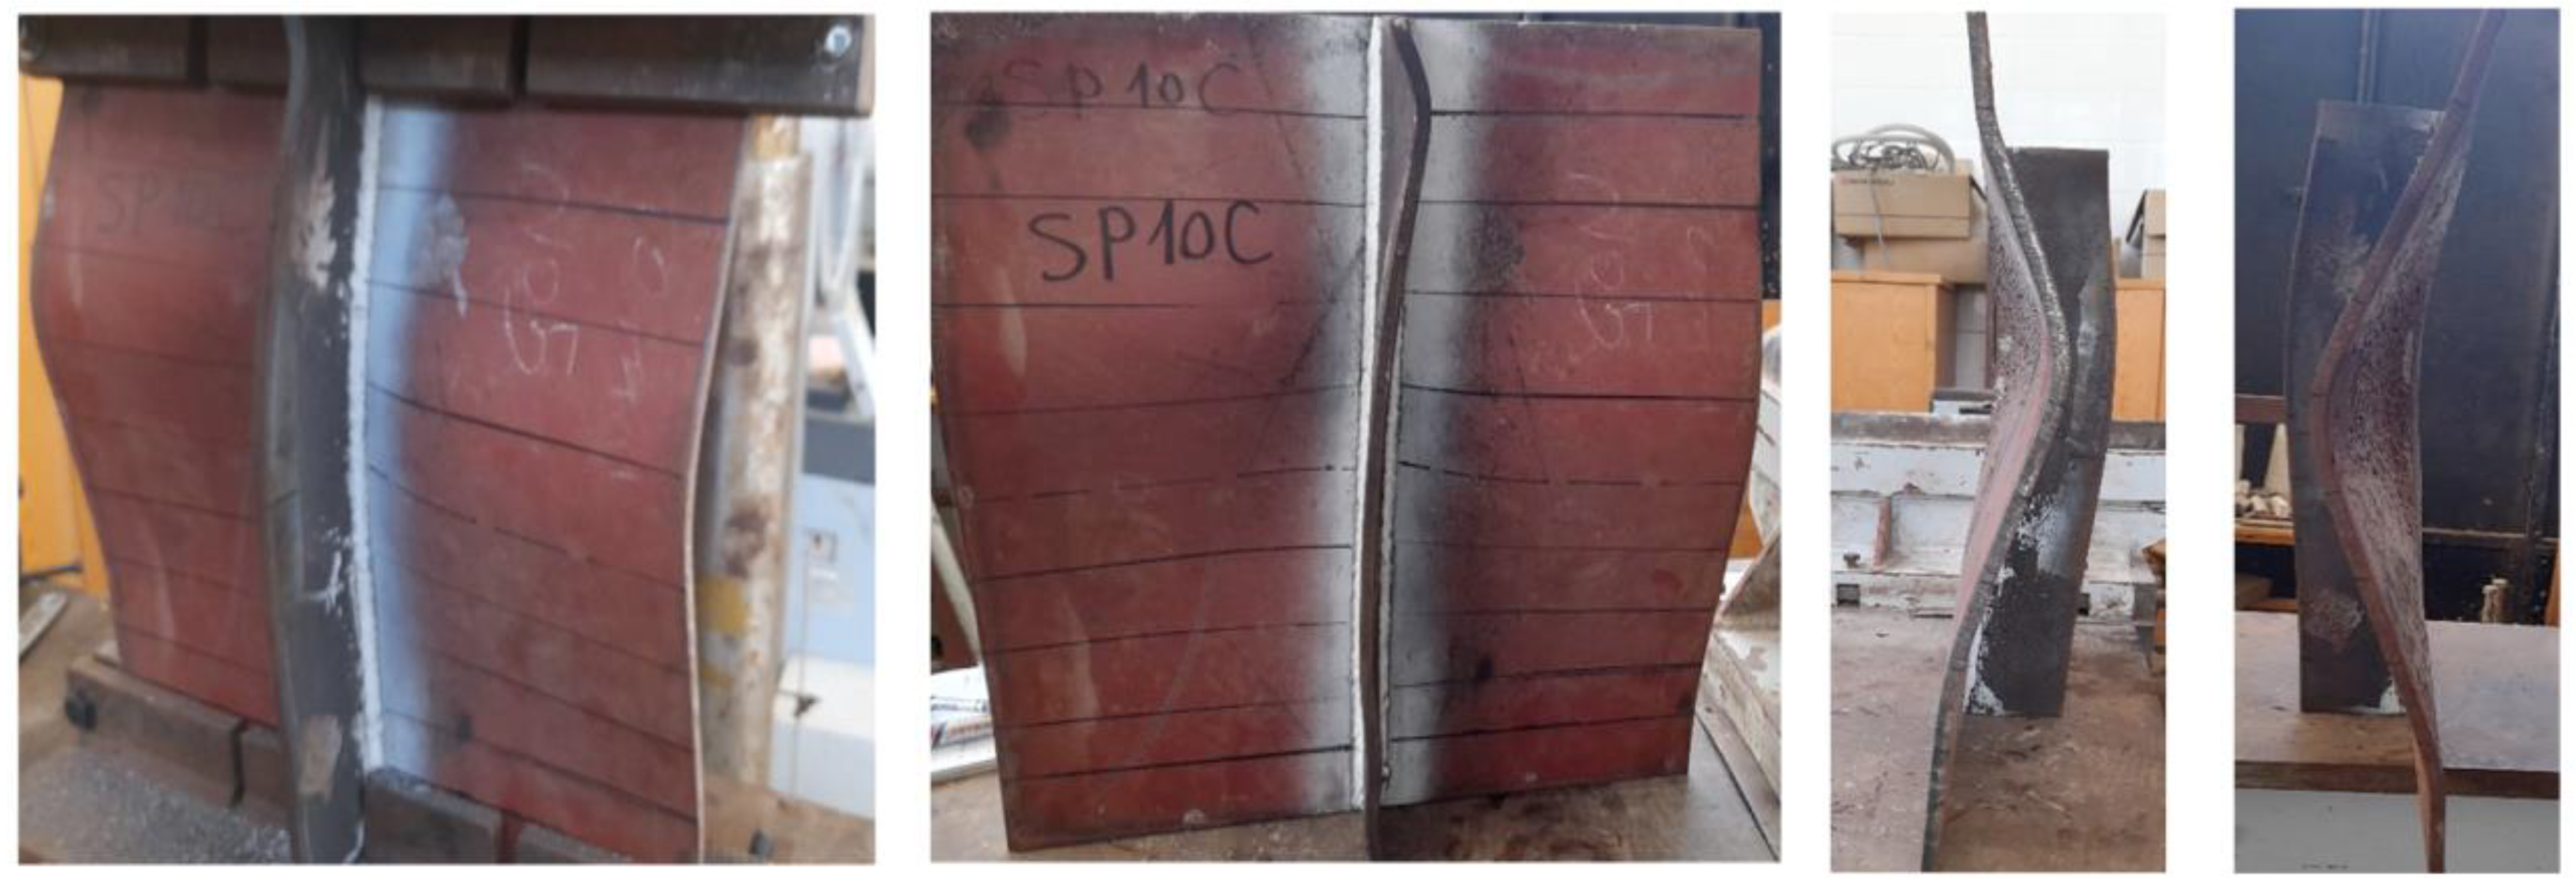
3.1. Group 1 Specimens with Continuous Welding
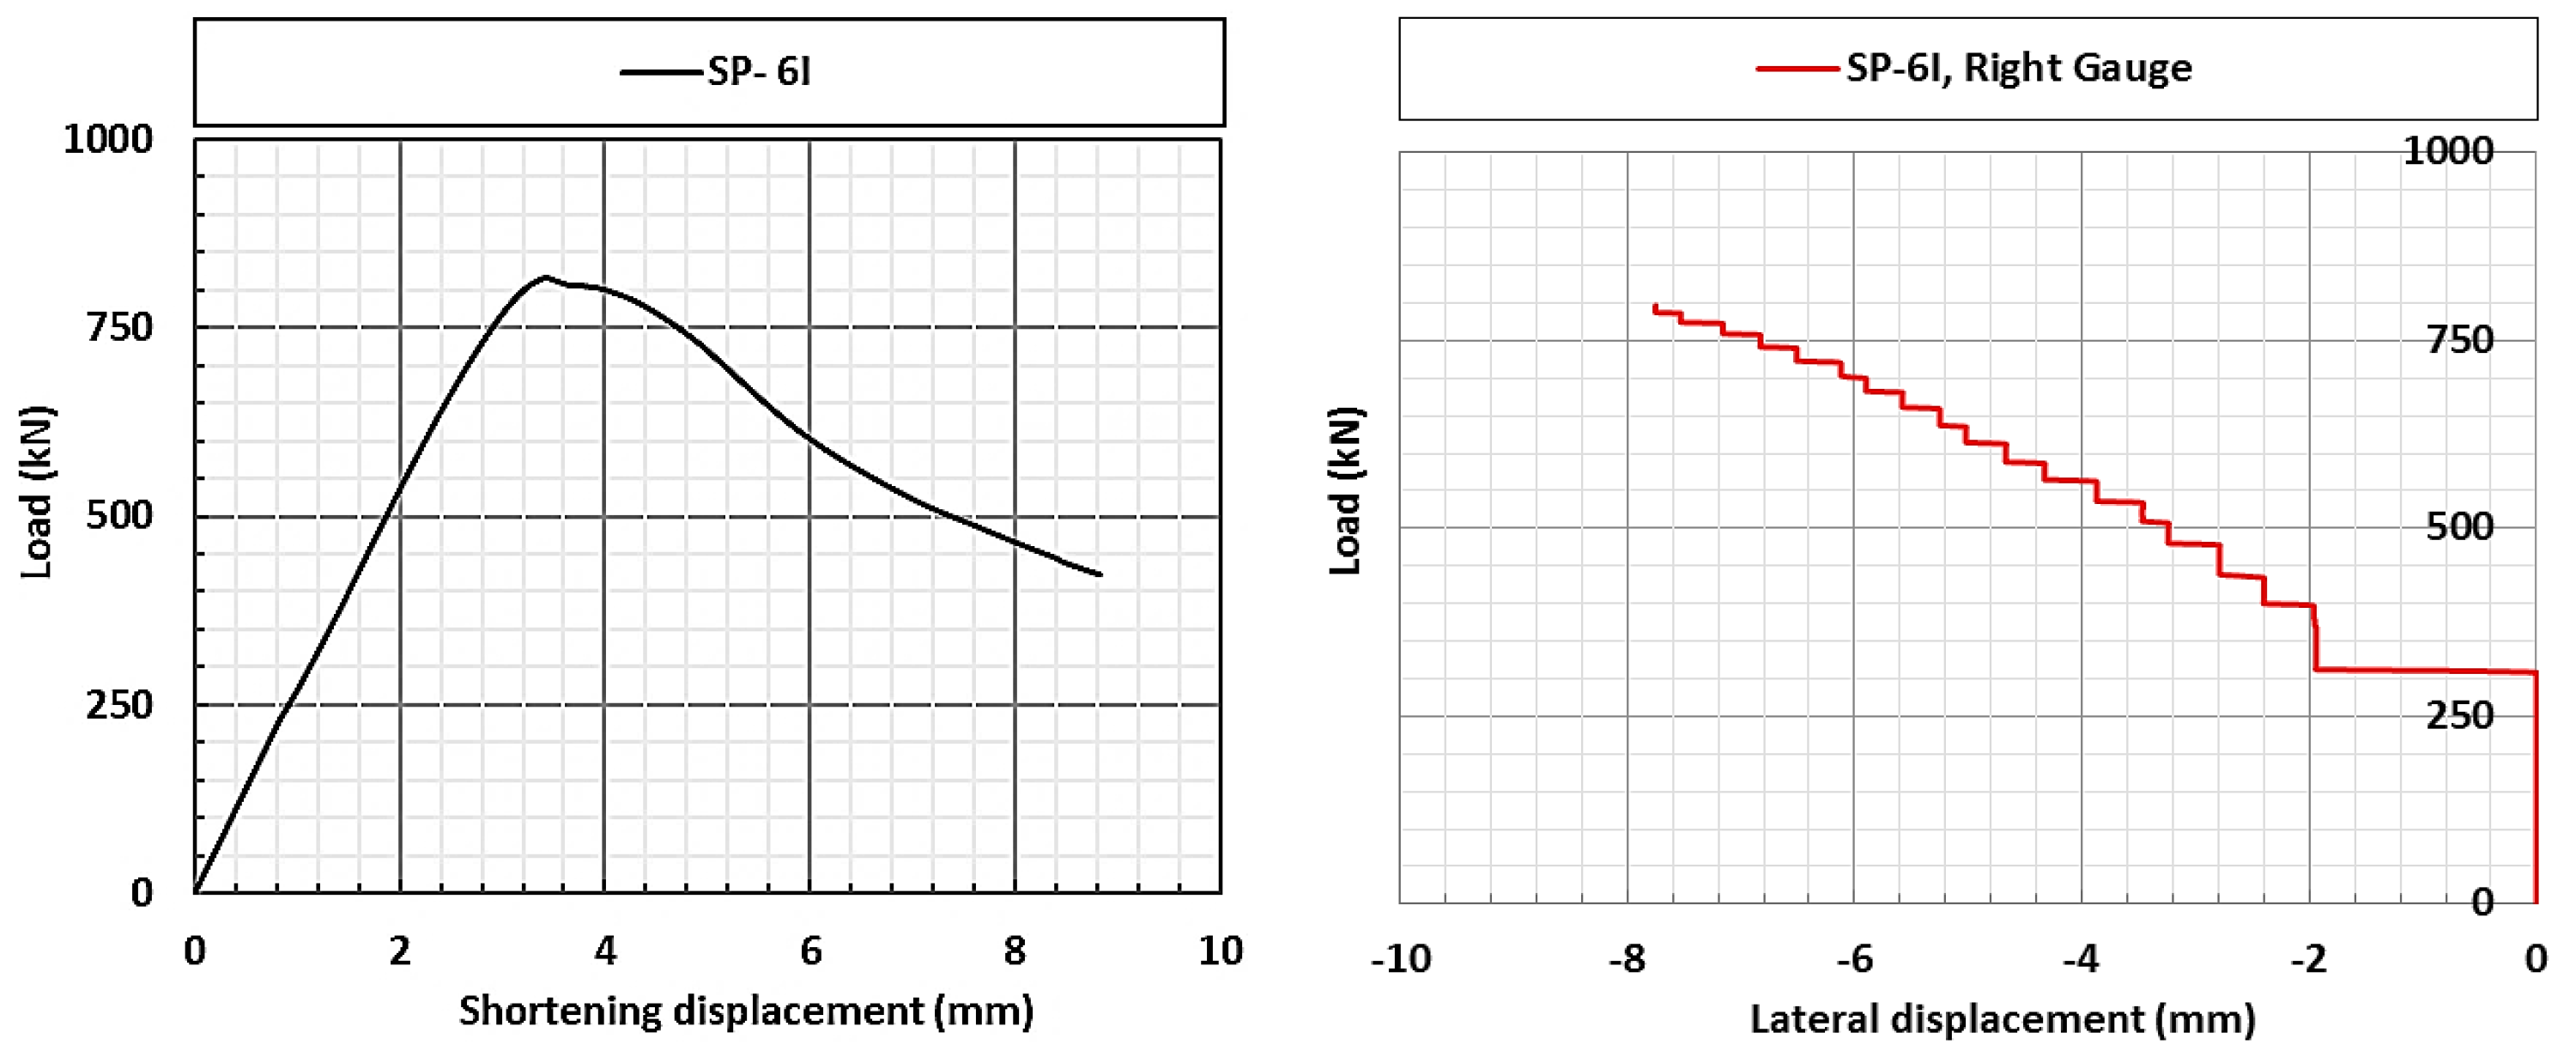
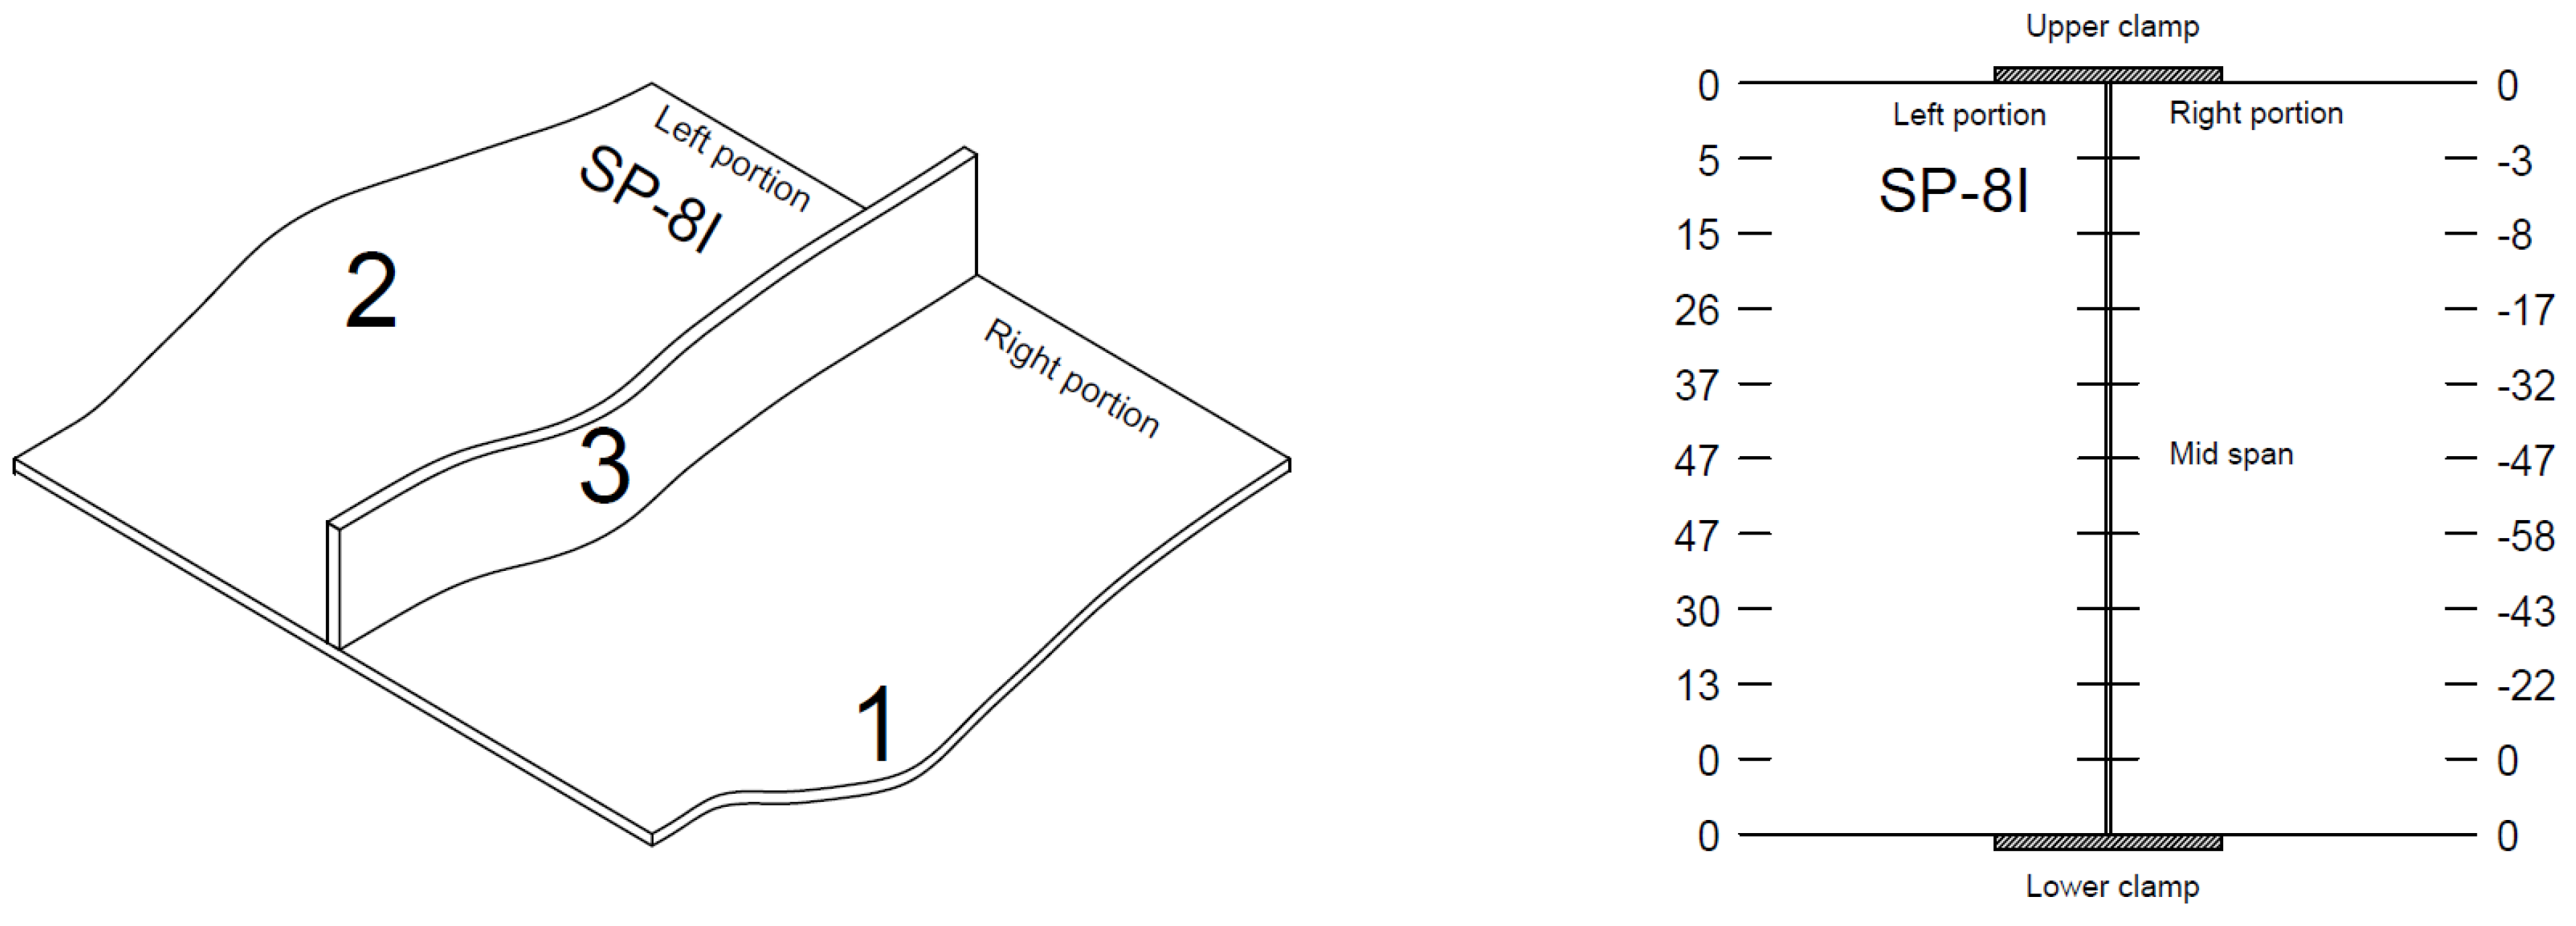
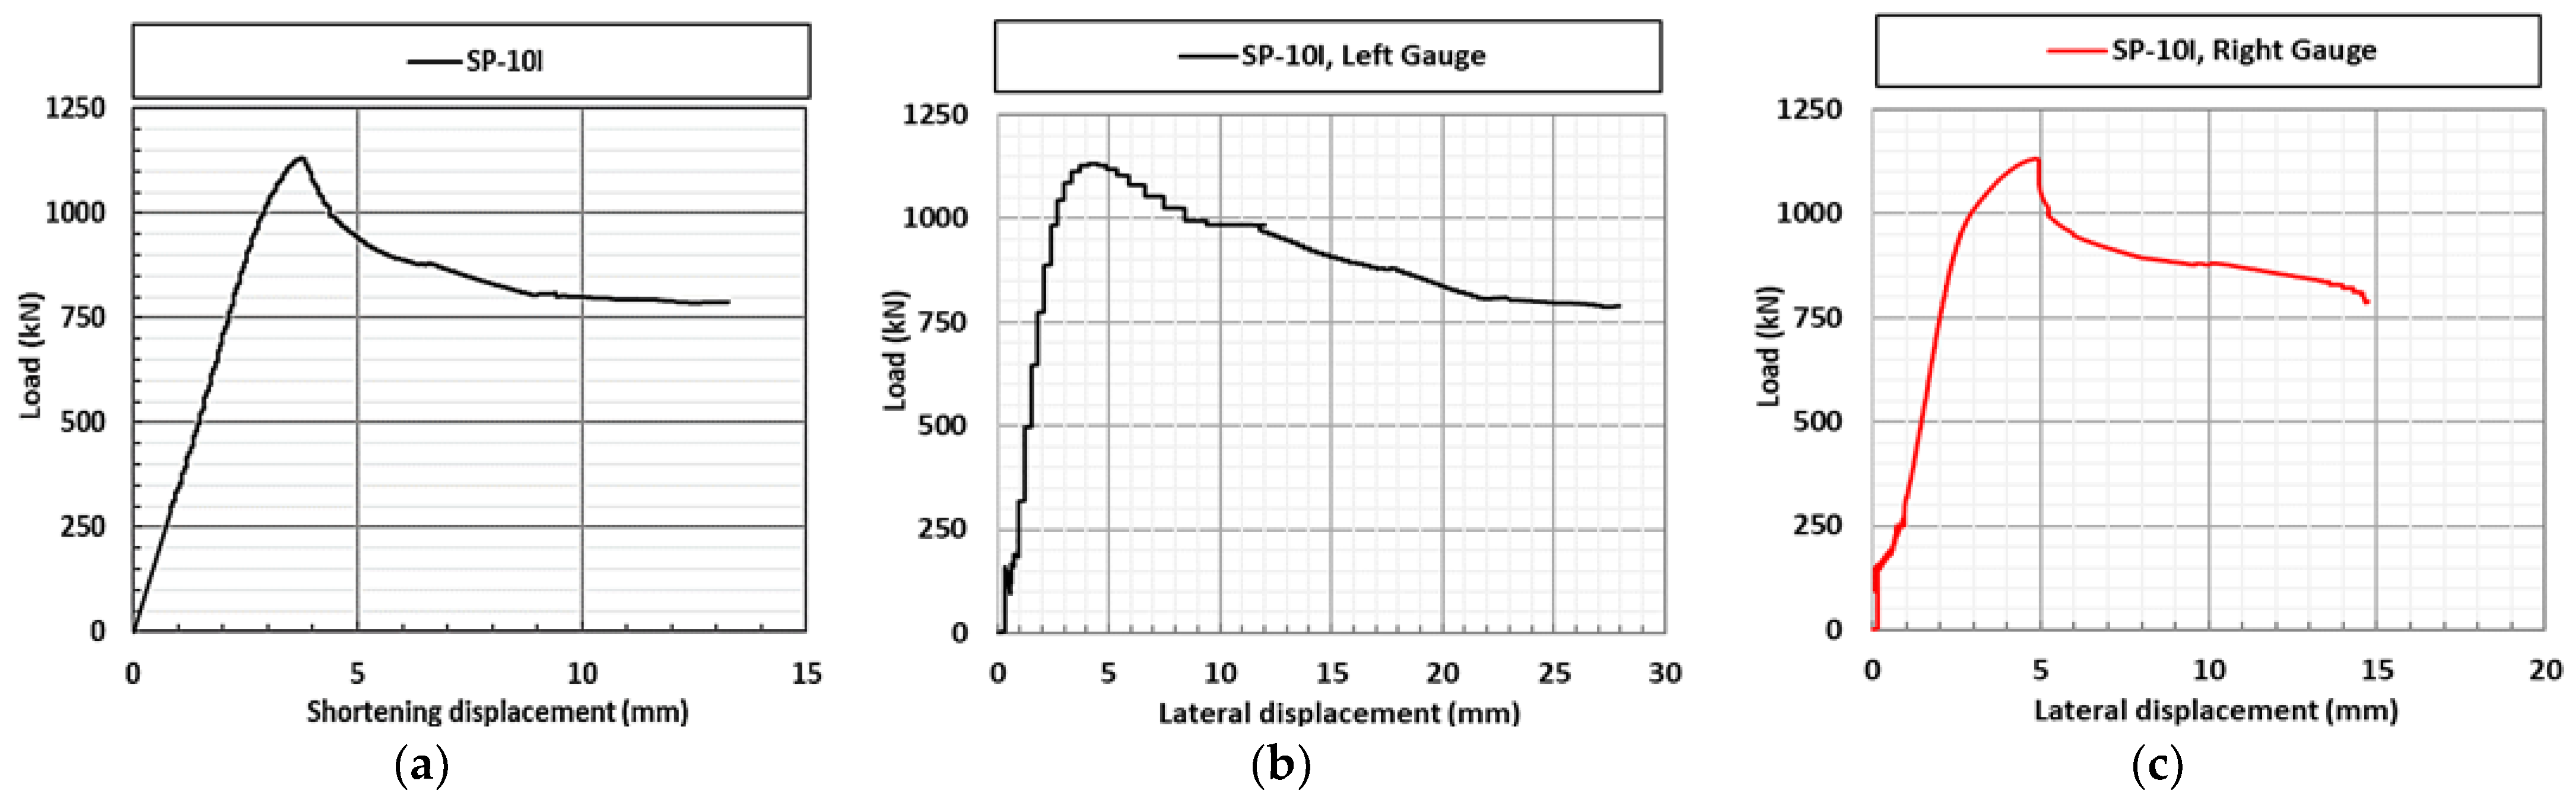
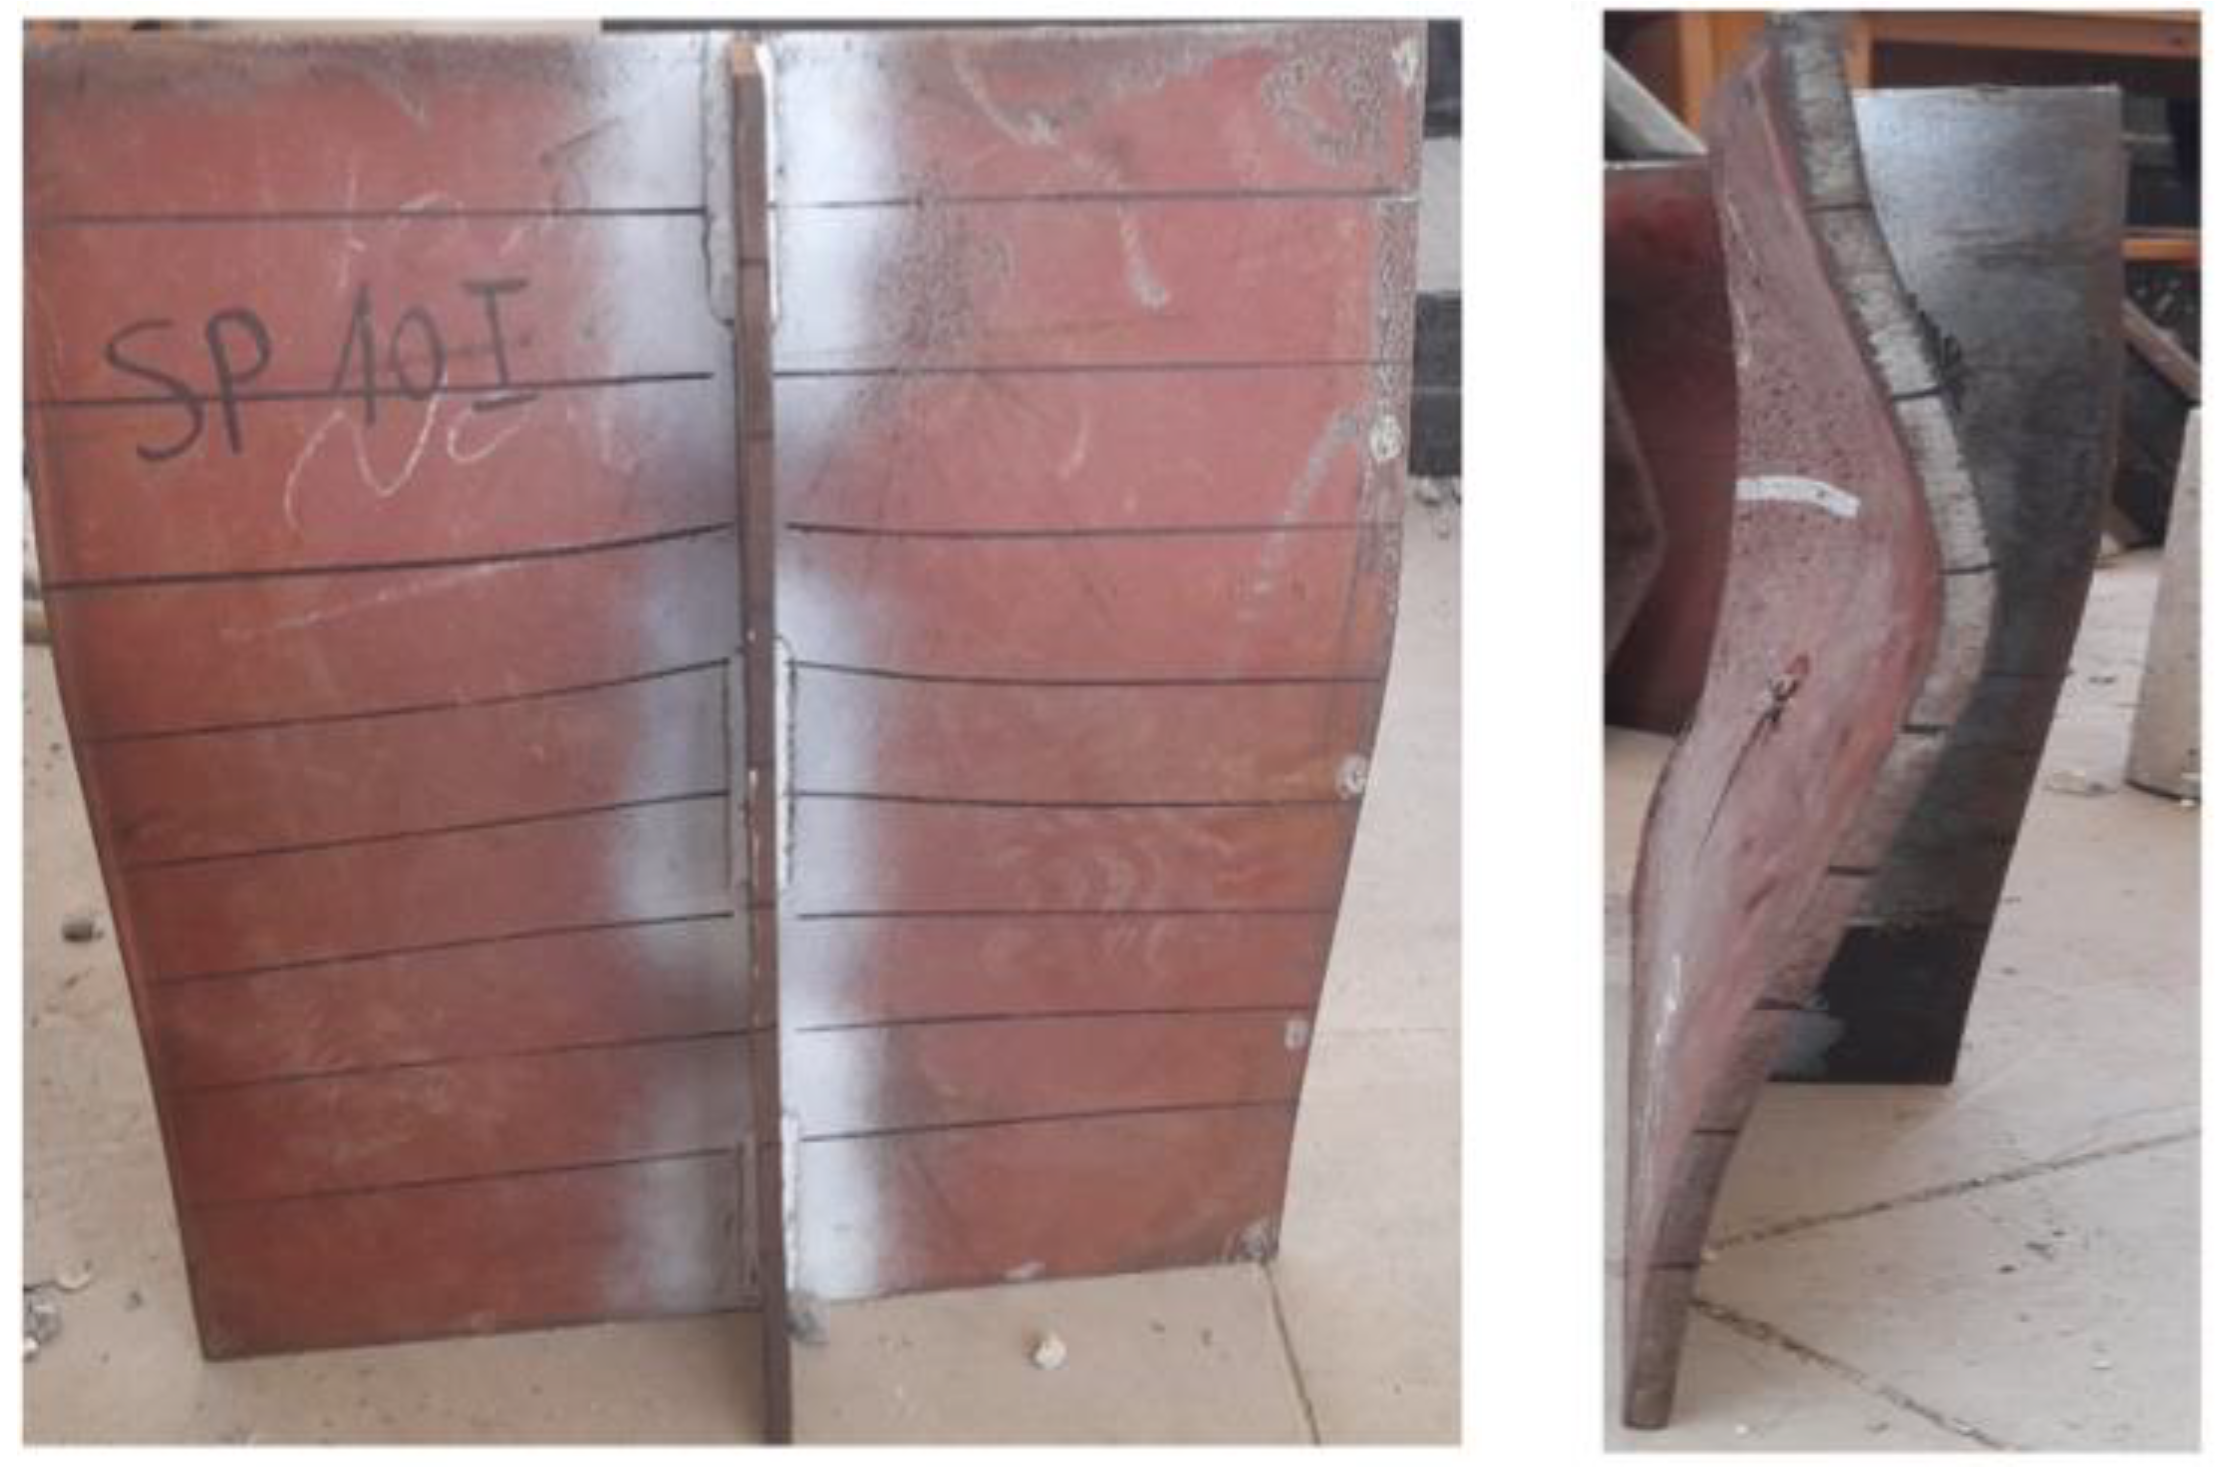
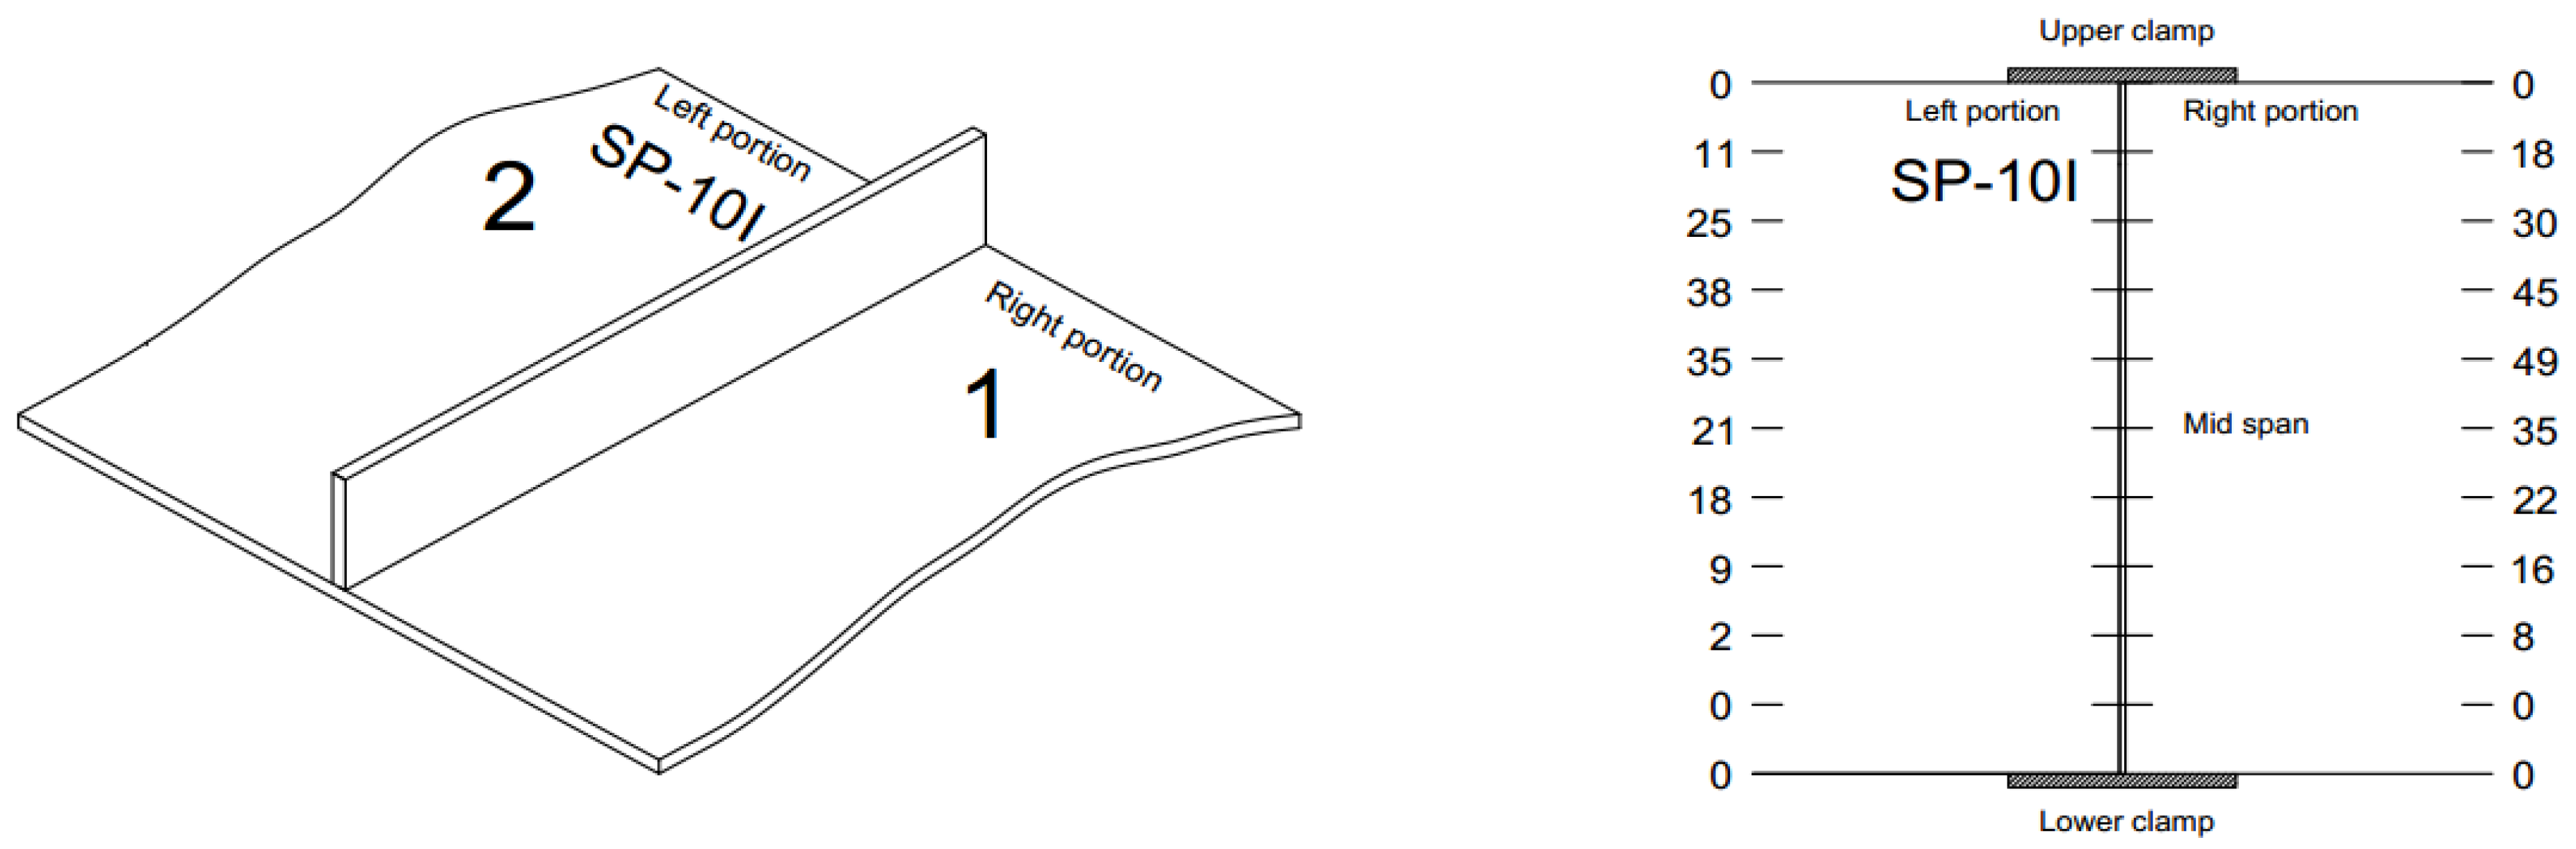
3.2. Group 2 Specimens with Intermittent Chain Welding
4. Discussion and Analysis
5. Conclusions
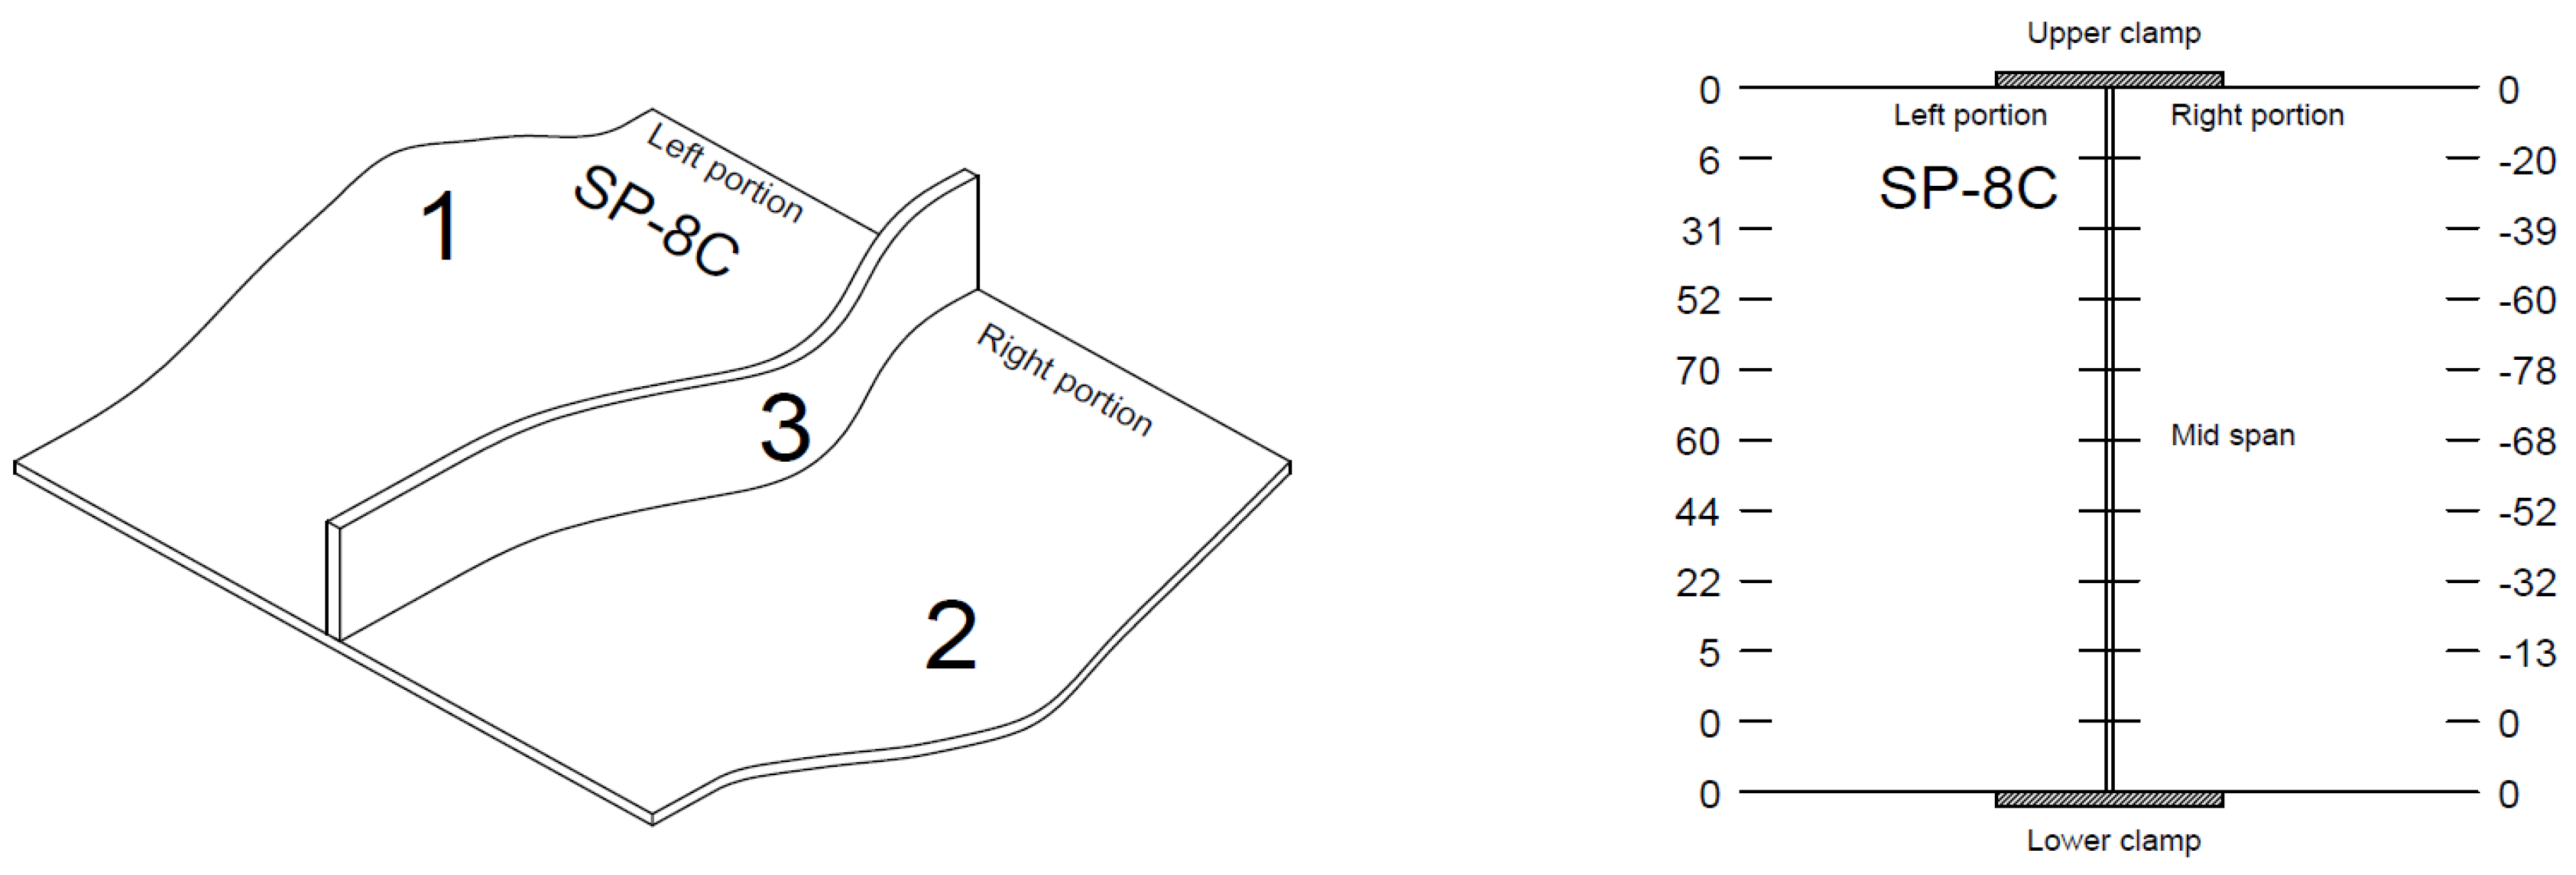
- For specimens with continuous welding, the higher deformation of the plate occurred around ±50 mm of the mid-span of the stiffened plate, while for intermittently welded specimens, the higher deformation is randomly located; this is due to the existing weld gaps that facilitate the occurrence of local buckling at any location as well as the cracks at the weld toe due to excessive deformation near the gaps, which is the opposite for continuously welded specimens.
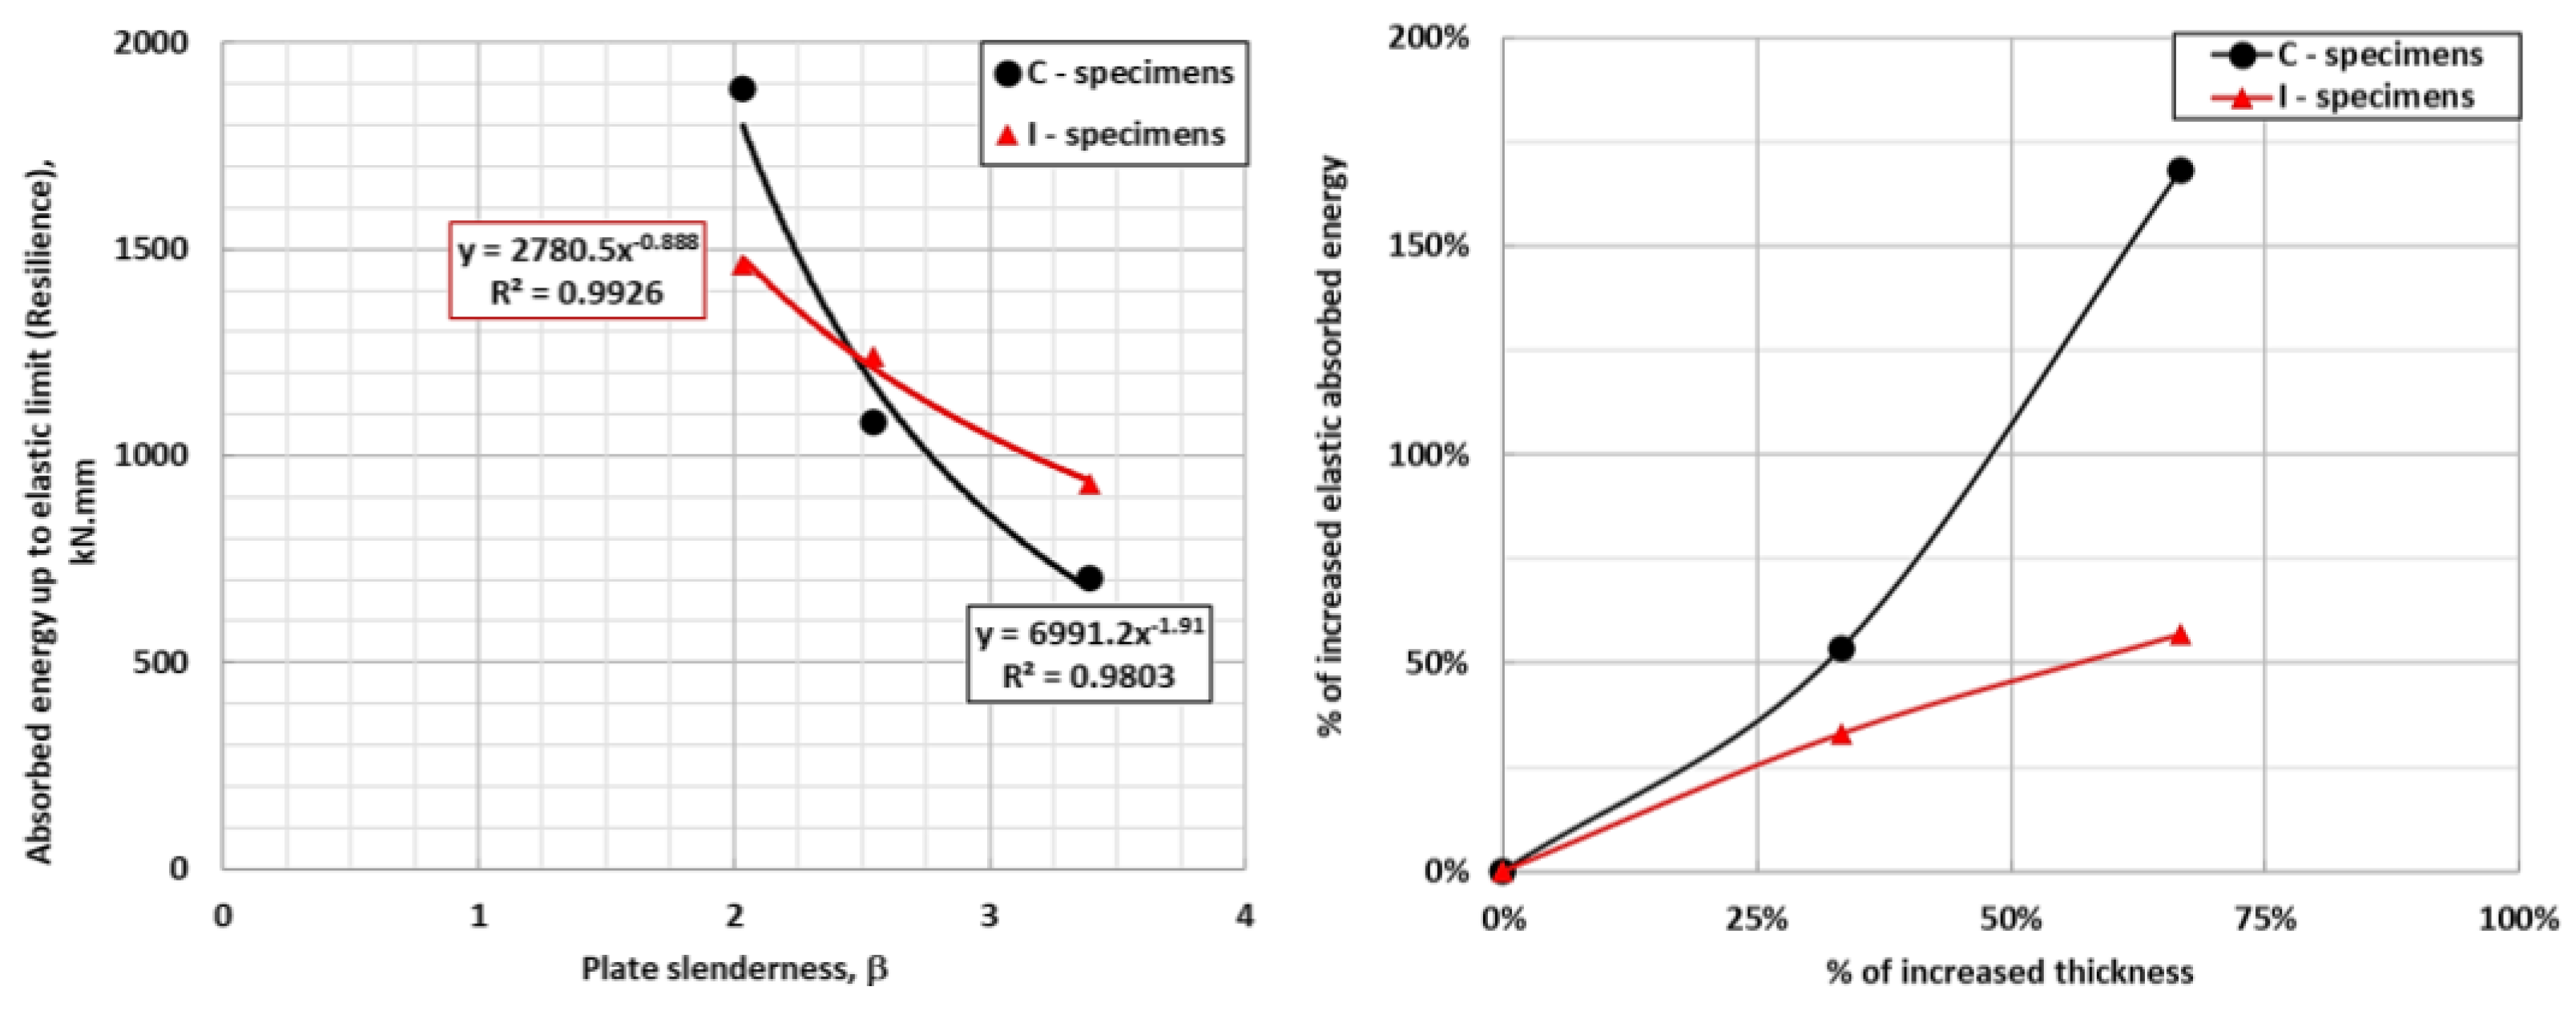
- For both welding configurations, as the plate slenderness decreases, the absorbed energy up to the elastic limit increases nonlinearly. Also, the probability of buckling initiation decreases.
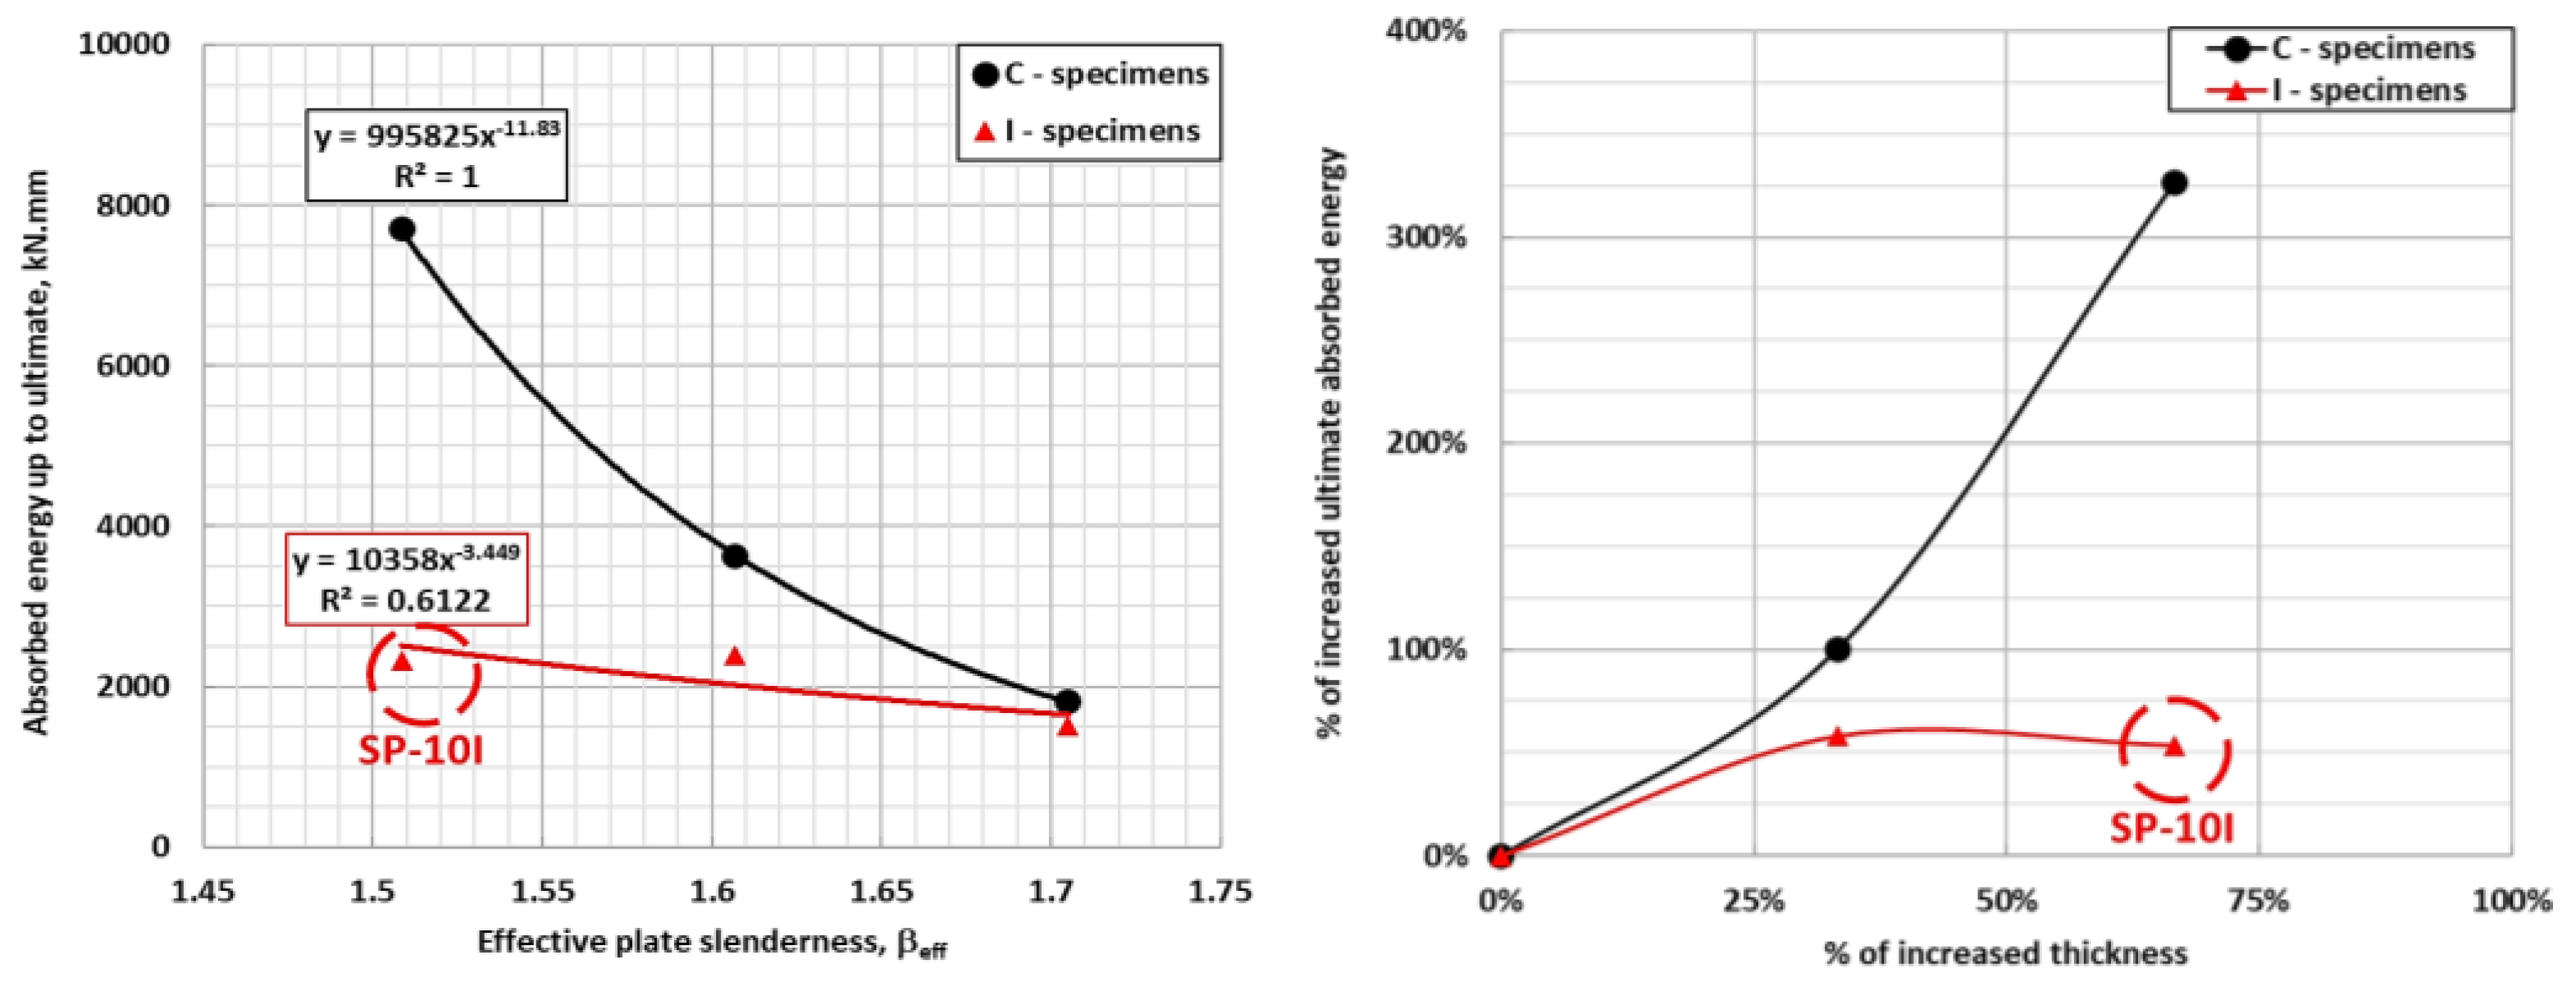
- As the effective plate slenderness decreases, the deviation in the absorbed energy up to the ultimate point between specimens with different welding configurations increases, which reflects the higher absorbed energy for continuously welded specimens than intermittently welded ones.
- Regression formulations are developed for ultimate compressive capacity as a function of plate slenderness for different welding configurations, and more future tests and numerical simulation may be performed to enhance the data fitting.
- For specimens with continuous and intermittent welding, the ability of plate slenderness to dominate the final collapse mode increases as the slenderness decreases.
- A comparison between the experimental results and empirical formulations is performed, showing that the results are comparable according to the imposed boundary conditions and column slenderness limitations.
Author Contributions
Funding
Institutional Review Board Statement
Informed Consent Statement
Data Availability Statement
Acknowledgments
Conflicts of Interest
References
- Fu, G.; Lourenço, M.L.; Duan, M.; Estefen, S.F. Influence of the welding sequence on residual stress and distortion of fillet welded structures. Mar. Struct. 2016, 46, 30–55. [Google Scholar] [CrossRef]
- Fu, G.; Estefen, S.F.; Gurova, T.; Lourenço, M.L. Effect of material model on residual stress and distortion in T-joint welding. Ships Offshore Struct. 2018, 13, 56–64. [Google Scholar] [CrossRef]
- Zhang, Y.; Wang, Y. The influence of welding mechanical boundary condition on the residual stress and distortion of a stiffened-panel. Mar. Struct. 2019, 65, 259–270. [Google Scholar] [CrossRef]
- Yi, M.S.; Noh, S.H.; Lee, D.H.; Seo, D.H.; Paik, J.K. Direct measurements, numerical predictions and simple formula estimations of welding-induced biaxial residual stresses in a full-scale steel stiffened plate structure. Structures 2021, 29, 2094–2105. [Google Scholar] [CrossRef]
- Saad-Eldeen, S.; Mansour, M.; Eltaramsy, M. Distortion Analysis of Steel Stiffened Plates Accounting for Different Welding Configurations. Port-Said Eng. Res. J. 2024, 28, 132–139. [Google Scholar] [CrossRef]
- Faulkner, D. A review of Effective Plating for Use in the Analysis of Stiffened Plating in Bending and Compression. J. Ship Res. 1975, 19, 1–17. [Google Scholar] [CrossRef]
- Guedes Soares, C. Design Equation for the Compressive Strength of Unstiffened Plate Elements with Initial Imperfections. J. Constr. Steel Res. 1988, 9, 287–310. [Google Scholar] [CrossRef]
- Guedes Soares, C. Uncertainty Modelling in Plate Buckling. Struct. Saf. 1988, 5, 17–34. [Google Scholar] [CrossRef]
- Chen, B.; Guedes Soares, C. Effects of plate configurations on the weld induced deformations and strength of fillet-welded plates. Mar. Struct. 2016, 50, 243–259. [Google Scholar] [CrossRef]
- Chen, B.; Guedes Soares, C. Effect of welding sequence on temperature distribution, distortions, and residual stress on stiffened plates. Int. J. Adv. Manuf. Technol. 2016, 86, 3145–3156. [Google Scholar] [CrossRef]
- Paik, J.K.; Thayamballi, A.K. An Empirical Formulation for Predicting Ultimate Compressive Strength of Stiffened Panels. In Proceedings of the 7th International Offshore and Polar Engineering Conference, Honolulu, HI, USA, 25–30 May 1997; pp. 328–338. [Google Scholar]
- Khedmati, M.R.; Rastani, M.; Ghavami, K. Ultimate strength and ductility characteristics of intermittently welded stiffened plates. J. Constr. Steel Res. 2009, 65, 599–610. [Google Scholar] [CrossRef]
- Saad-Eldeen, S.; Garbatov, Y.; Guedes Soares, C. Analysis of Plate Deflections During Ultimate Strength Experiments of Corroded Box Girders. Thin-Walled Struct. 2012, 54, 164–176. [Google Scholar] [CrossRef]
- Tekgoz, M.; Garbatov, Y.; Guedes Soares, C. Ultimate strength assessment of welded stiffened plates. Eng. Struct. 2015, 84, 325–339. [Google Scholar] [CrossRef]
- Zhang, S.; Khan, I. Buckling and Ultimate Capability of Plates and Stiffened Panels in Axial Compression. Mar. Struct. 2009, 22, 791–808. [Google Scholar] [CrossRef]
- Kim, D.K.; Lim, H.L.; Kim, M.S.; Hwang, O.J.; Park, K.S. An empirical formulation for predicting the ultimate strength of stiffened panels subjected to longitudinal compression. Ocean. Eng. 2017, 140, 270–280. [Google Scholar] [CrossRef]
- Kim, D.K.; Lim, H.L.; Yu, S.Y. A technical review on ultimate strength prediction of stiffened panels in axial compression. Ocean. Eng. 2018, 170, 392–406. [Google Scholar] [CrossRef]
- Li, S.; Kim, D.K.; Benson, S. The influence of residual stress on the ultimate strength of longitudinally compressed stiffened panels. Ocean. Eng. 2021, 231, 108839. [Google Scholar] [CrossRef]
- Mun, S.J.; Ri, Y.H. Study on ultimate strength estimation of intermittently welded stiffened plates under uniaxial compression. Mar. Struct. 2022, 84, 103163. [Google Scholar] [CrossRef]
- Tatsumi, A.; Kageyama, Y. Ultimate strength assessment of rectangular plates subjected to in-plane compression using a statistical model of welding initial deflection. Mar. Struct. 2024, 93, 103523. [Google Scholar] [CrossRef]
- Park, S.H.; Yoon, S.H.; Muttaqie, T.; Do, Q.T.; Cho, S.R. Effects of Local Denting and Fracture Damage on the Residual Longitudinal Strength of Box Girders. J. Mar. Sci. Eng. 2023, 11, 76. [Google Scholar] [CrossRef]
- Saad-Eldeen, S.; Garbatov, Y.; Guedes Soares, C. Influence of Weld Toe Shape and Material Models on the Ultimate Strength of a Slightly Corroded Box Girder. In Sustainable Maritime Transportation and Exploitation of Sea Resources; Rizzuto, E., Guedes Soares, C., Eds.; Taylor & Francis Group: London, UK, 2012; pp. 401–409. [Google Scholar]
- Guedes Soares, C.; Kmiecik, M. Infulnce of the boundary condition on the colapse strength of square plates with intial imperfection. In Proceedings of the Marine Technology and Transportation, Szczecin, Poland, 20–22 September 1995; pp. 227–235. [Google Scholar]
- Saad-Eldeen, S.; Garbatov, Y. Experimental and Numerical Analysis of Structural Capacity of Perforated Stiffened Plates. J. Mar. Sci. Eng. 2023, 11, 842. [Google Scholar] [CrossRef]
- Polish Register of Shipping. Rules for Classification and Construction of Small Sea-Going Ships; PRS: Gdańsk, Poland, 2023; Part II, Hull. [Google Scholar]
- IACS UR W33; Non-Destructive Testing of Ship Hull Steel Welds. International Association of Classification Societies: London, UK, 2021.
- ISO 17638; Non-Destructive Testing of Welds-Magnetic Particle Testing. International Organization for Standardization: Vernier, Switzerland, 2016.
- ASTM E9-19; Standard Test Methods of Compression Testing of Metallic Materials at Room Temperature. ASTM International: West Conshohocken, PA, USA, 2019.


| C ×10−2 | Si ×10−2 | Mn ×10−2 | P ×10−3 | S ×10−3 | Al ×10−3 | |
|---|---|---|---|---|---|---|
| Min. | 20 | |||||
| Max. | 21 | 50 | 2.5 × C | 35 | 35 |
| ID | L, mm | B, mm | tp, mm | hw, mm | tw, mm |
|---|---|---|---|---|---|
| SP-6C | 500 | 500 | 6 | 80 | 10 |
| SP-8C | 8 | ||||
| SP-10C | 10 | ||||
| SP-6I | 6 | ||||
| SP-8I | 8 | ||||
| SP-10I | 10 |
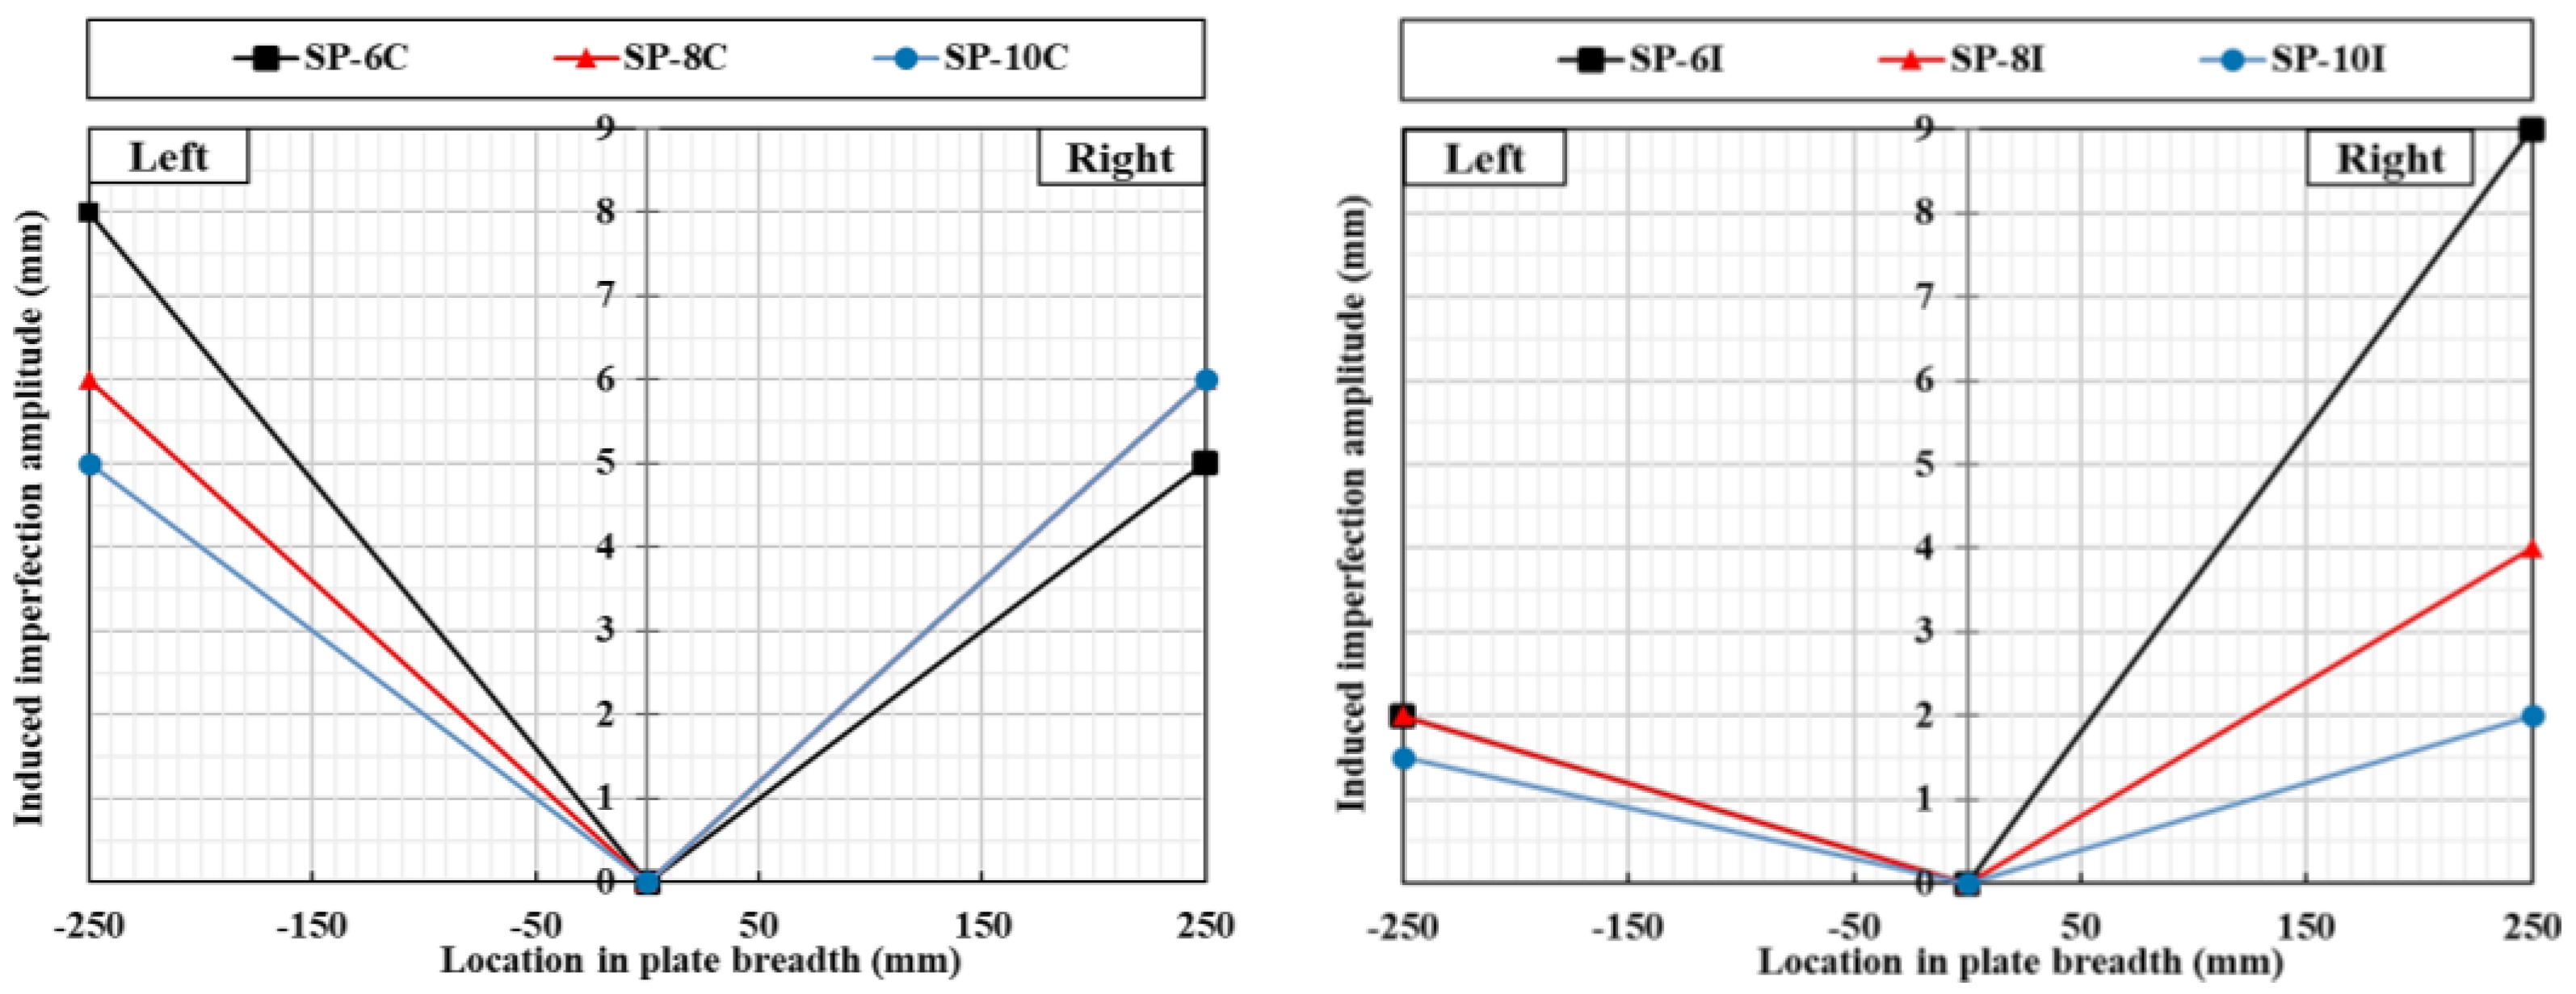
| ID | Left Portion | Middle | Right Portion |
|---|---|---|---|
| SP-6C | +8 | 0 | +5 |
| SP-8C | +6 | 0 | +6 |
| SP-10C | +5 | 0 | +6 |
| SP-6I | +2 | 0 | +9 |
| SP-8I | +2 | 0 | +4 |
| SP-10I | +1.5 | 0 | +2 |
Disclaimer/Publisher’s Note: The statements, opinions and data contained in all publications are solely those of the individual author(s) and contributor(s) and not of MDPI and/or the editor(s). MDPI and/or the editor(s) disclaim responsibility for any injury to people or property resulting from any ideas, methods, instructions or products referred to in the content. |
© 2024 by the authors. Licensee MDPI, Basel, Switzerland. This article is an open access article distributed under the terms and conditions of the Creative Commons Attribution (CC BY) license (https://creativecommons.org/licenses/by/4.0/).
Share and Cite
Saad-Eldeen, S.; Mansour, M.; Eltaramsy, M.-A. Experimental Compressive Assessment of Different Stiffened Plate Welding Configurations. J. Mar. Sci. Eng. 2024, 12, 2238. https://doi.org/10.3390/jmse12122238
Saad-Eldeen S, Mansour M, Eltaramsy M-A. Experimental Compressive Assessment of Different Stiffened Plate Welding Configurations. Journal of Marine Science and Engineering. 2024; 12(12):2238. https://doi.org/10.3390/jmse12122238
Chicago/Turabian StyleSaad-Eldeen, S., Mohamed Mansour, and Menat-Allah Eltaramsy. 2024. "Experimental Compressive Assessment of Different Stiffened Plate Welding Configurations" Journal of Marine Science and Engineering 12, no. 12: 2238. https://doi.org/10.3390/jmse12122238
APA StyleSaad-Eldeen, S., Mansour, M., & Eltaramsy, M.-A. (2024). Experimental Compressive Assessment of Different Stiffened Plate Welding Configurations. Journal of Marine Science and Engineering, 12(12), 2238. https://doi.org/10.3390/jmse12122238