1. Introduction
In recent years, intelligent collision avoidance algorithms for autonomous ship navigation have developed rapidly [
1,
2,
3,
4,
5,
6], and a large number of collision avoidance algorithms have been proposed to improve the safety of ship navigation. However, the implementation of these algorithms is affected by a variety of factors, such as diverse ship behaviors and traffic conditions. These influencing factors pose significant challenges to the effectiveness of collision avoidance algorithms. However, before the algorithms are put into practice, it is important to conduct comprehensive and in-depth tests on their collision avoidance performance to reduce the risk of real ships in navigation [
7]. How to select typical test scenarios with wide coverage and how to design a scientific and reasonable test process, to ensure the effectiveness and consistency of the test result, are the keys to ship collision avoidance testing [
8,
9]. Countries have made some progress in testing methods and specifications [
10,
11,
12,
13,
14].
At present, the testing of ship collision avoidance algorithms is mainly divided into virtual simulation, virtual reality fusion, and real ship test [
15,
16]. The organization cost of real ship testing is high, and the hydrographic and meteorological conditions of the real sea area are difficult to accurately control, and it is difficult to ensure the consistency of the test results. The collision avoidance test based on computer virtual simulation can accurately control the environmental conditions to ensure the consistency of the test and can carry out a large number of collision avoidance tests under different scenarios in a relatively short period [
17], which is the main means to carry out the research and testing of ship collision avoidance algorithms at present [
18,
19]. However, the simulation accuracy of the virtual simulation test on the ship’s motion is limited by many factors, which cannot completely and accurately reflect the motion characteristics of the real ship, so the validity of the test results is doubtful [
20]. Before the collision avoidance algorithm is formally deployed, it still needs to be verified by the real ship test.
The virtual reality fusion test can adopt real ships and sea conditions as the test environment, thus realistically reflecting the ship’s operation status. Meanwhile, the use of an AIS simulator to generate a virtual target ship can reduce the mismatch of collision avoidance algorithms when they are migrated from the virtual simulation environment to the real world environment, thus improving the test efficiency [
21,
22]. In this problem, Yang [
23] established a virtual reality fusion test system that can simulate the collision avoidance scenario of a ship based on the real environment. Pedersen [
24] established a simulation-based test of the autonomous navigation system and its evaluation method, which includes ship-specific hull dynamics models, models of power, propulsion, and ballast systems, models of sensors and actuators, etc., as well as simulation control system hardware running actual control system software. Fun [
25] proposed a method to sequentially test the autonomous navigation system of unmanned ships from three autonomy levels based on the analysis of unmanned ship testing difficulties and established a method to test the autonomous navigation system of unmanned ships from three autonomy levels. The method of testing is carried out, and the corresponding test platform is established and the test results are evaluated, but the method of dividing the autonomous layers needs further research. Skjong [
26] developed a co-simulation case study of a marine offshore surface vessel in a Dynamic Positioning operation, demonstrating how sub-models from different software can be integrated into a unified simulation. This approach allows the use of specialized modeling tools for various dynamic systems and supports hardware integration, such as microcontrollers, for Hardware-In-the-Loop testing.
In this study, a parametric modeling system for collision avoidance test scenarios is proposed based on COLREG for generating a library of standard test scenarios. A virtual–real space mapping method is developed to map the scenes in the standard test scene library to the real world. A test system based on two modes of virtual simulation and virtual reality fusion is built to carry out virtual simulation and virtual reality fusion testing. An autonomous collision avoidance test and evaluation system is established to comprehensively evaluate the test results. The effectiveness of the test method proposed in this paper is verified by the real ship test practice.
The structure of this paper is arranged as follows:
Section 2 introduces the testing method of virtual–real fusion, including the parametric modeling method of ship collision avoidance scenarios, the construction of the evaluation index system, and the virtual–real space mapping method.
Section 3 introduces the composition and framework of the test platform.
Section 4 introduces the process of testing.
Section 5 analyzes the test results and verifies the effectiveness of the proposed method.
Section 6 discusses and summarizes.
2. Methodology
The research on the test validation of intelligent collision avoidance strategy is carried out based on COLREG, considering the typical spatial relationship between ships, combined with the method of collision risk analysis [
27,
28,
29,
30,
31], which is quantified and used as the input item of test scenario design to form a typical test scenario library. Then, through the theoretical calculations, analyzing the behavioral performance of the ship in the actual collision avoidance process and ultimately obtaining the results of the comprehensive evaluation of collision avoidance are possible.
2.1. Parametric Modeling Method
2.1.1. Encounter Situation
In previous studies, bearing relationships are usually defined as two ships being on a course where collision is possible [
32,
33,
34] and there is an intersection or proximity of their trajectories. Section II of COLREG defines the conduct of ships in sight of one another, which is intended to provide the basis for avoidance maneuvers by the two ships. The COLREG provides for three types of encounters: overtaking, head-on, and crossing.
- (1)
Overtaking: The COLREG defines overtaking relatively clearly and gives a specific numerical basis for judgment. According to the COLREG rule 13, a ship is considered to be in overtaking when it is pursuing another ship from some direction more than 22.5 degrees abaft its beam. Thus, overtaking can be defined as the overtaking ship being within the range of 112.5° to 249.5° of the overtaken ship’s bearing;
- (2)
Head-on: According to the COLREG rule 14, head-on refers to the situation when two power-driven ships meet each other ahead or nearly ahead of course. However, the definition of “nearly ahead” in this rule is rather general and lacks clear quantitative standards, which makes the judgment of the head-on situation in actual operation somewhat uncertain. To define this situation more clearly in the collision avoidance operation, it is usually judged on the basis that the target ship (TS) is located within half a compass point on both sides of the ship’s heading line. If the relative bearing of the TS is within 5.625° of the own ship (OS) heading line, the two ships can be considered to be in a head-on situation. In this study, this judgment value is simplified and the angle value is rounded to 6 degrees;
- (3)
Crossing: COLREG does not provide a specific definition of crossing; it only gives a broader definition in rule 15, when two power-driven ships are crossing to involve the risk of collision. However, according to the classification of encounter situations, there are only three types: overtaking, head-on, and crossing, so the bearings of the crossing situation can be judged as ranging from 6° to 112.5° and from 249.5° to 354°. The crossing situation can be further categorized into small-angle crossing and large-angle crossing, with a separating angle of 22.5 degrees from the beam [
35].
The distribution of the three types of encounter situations is shown in
Figure 1.
As shown in
Figure 1, with OS at the center point, the TS located in the area of A and B is considered to be in a head-on situation, where area A represents a port side head-on situation and area B represents a starboard side head-on situation. When the TS is located in the area of C, D, G, and H, it is classified as a crossing situation, with C representing small angle crossing, D representing large angle crossing on the starboard side, H representing small angle crossing, and G representing large angle crossing on the port side. The TS located in the areas of E and F constitutes an overtaking situation, with area E being a port side overtaking and area F being a starboard side overtaking.
According to the bearing of OS and TS, the encounter situation of the two ships cannot be determined, as shown in
Figure 2; the bearing of TS1 and TS2 relative to the OS is located in the range of the head-on area, but according to the COLREG, it is clear that TS1 and the OS constitute head-on situation, and TS2 and the OS constitute an overtaking situation. TS4, TS10, and TS11 constitute a small-angle crossing with OS; TS3 does not constitute a crossing situation although it is within the small-angle crossing area. It can be seen that after determining the bearing angle of the TS relative to OS, the division of the encounter situation also needs to take the difference in the heading angles of the two ships into account.
As shown in
Figure 2, TS5 and TS9 are both within the large angle crossing range of OS, but TS9 does not constitute a rendezvous situation; however, if TS5’s speed is less than that of the vessel, it will not pose a collision threat to the vessel either. The same applies to TS6, TS7, and TS8, where TS7 does not constitute a rendezvous situation, but if TS6 and TS8 constitute a rendezvous situation with the ship, it is necessary to fulfill the requirement that the speeds of TS6 and TS8 are greater than that of the ship. Therefore, the difference in speed between the two ships must also be taken into account when judging the encounter situation.
and
should be set as speed and heading of OS;
and
should be set as speed and heading of TS; the two ship’s speed ratio can be expressed as Equation (1).
The difference of the two ship’s heading angles can be expressed as Equation (2).
The encounter situation can be classified as shown in
Table 1.
2.1.2. Safety Encounter Distance
Safety encounter distance is an important concept in ship collision avoidance, which is a safe basis for judging whether there is a collision danger between OS and TS, but the description of distance in COLREG is vague. It is usually interpreted in COLREG as three kinds of collision stages include immediate danger, close-quarter situation, and risk of collision. The definition depends on the ship parameters and the encounter situation. According to the description of rule 22 in COLREG, when the TS enters within the minimum visual distance of the OS’s masthead lights within 6 n-miles, then the risk of collision between the two ships should be considered to exist. Therefore, the risk of collision range is set to 6 n-miles.
Although close-quarter situation and immediate danger are not explicitly described in COLREG, many researchers have given their interpretations of these terms [
36,
37]. The following definitions are generally accepted [
38]:
In this study, the range of immediate danger is set to 0.25 n-mile, which is according to the longitudinal distance of the participating real ship obtained from the turning test. The distance of close-quarter situation is set to 1 n-mile by the company that owns the ship. Then, the distances can be classified as shown in
Table 2.
2.1.3. Scenario Parameters
The collision avoidance scenario parameters are the relative motion states between OS and TS at a specific point in time, as shown in
Figure 3.
These parameters are of great significance in determining the encounter state of the two ships, assessing the collision risk, and formulating effective collision avoidance strategies. They include the following:
- (1)
Relative distance : The straight line distance between OS and TS reflects the spatial distribution between the two ships. The size of the relative distance is an important basis for judging whether a collision between the two ships is likely to occur.
- (2)
Relative speed : It reflects the rate at which the two ships are approaching or moving away from each other. The size and direction of relative speed directly affect the urgency of collision.
- (3)
Relative heading : Determines the relative trajectory of the two ships. If the angle of relative heading is small, it means that the two ships will move along the approaching trajectory and the possibility of collision is higher.
- (4)
Relative bearing : The horizontal angle between the ship’s heading and the target’s direction line in a clockwise direction. This parameter is used to judge the relative position of the two ships and their movement trend.
- (5)
The distance of the closest point of approach (DCPA) indicates the point where the minimum distance between the two ships may occur at a certain time in the future and is also used to assess the safety distance between the two ships at the nearest point of approach. If the DCPA is less than the set safe distance, collision avoidance measures may be required.
- (6)
The time to closest point of approach (TCPA) indicates the time when the two ships will reach the DCPA at a certain time in the future. By calculating this time, the possibility of collision between the two ships and the time window to avoid collision can be inferred. If the TCPA is too short, the implementation of collision avoidance measures is particularly urgent.
- (7)
Marine environmental factors, such as the effects of wind, waves, and currents, will also have an impact on ship collision avoidance, but since this real ship test is conducted under nearly level 0 sea state, in this paper, the effects of marine environmental factors are set by the level 0 sea state in both the virtual simulation and virtual reality fusion test process.
2.1.4. Scenario Generation
The COLREG-based scenario modeling approach can fully take into account the constraints of the conditions outlined in COLREG. However, since COLREG is a qualitative description without quantitative criteria, it is difficult for this method to provide a comprehensive set of rendezvous scenarios and cover potential traffic scenarios [
39]. Parametric modeling is based on the probability density function of various types of scenario parameters to automatically generate ship encounter scenarios in large quantities under the constraints of COLREG. This approach makes it easy to achieve automatic motion control of the target ship in the simulation environment, and the danger level of the test scenarios can be changed by adjusting the scenario parameters to artificially set up the required test scenarios.
Stage 1: Generate the speed, heading, latitude, and longitude coordinates of OS in a specific area.
Stage 2: Set the corresponding encounter situation according to the test scenario, the value range of TS’s bearing, heading, and distance from OS are determined, and the initial bearing, initial heading, and initial distance from OS are determined by the probability of the TS.
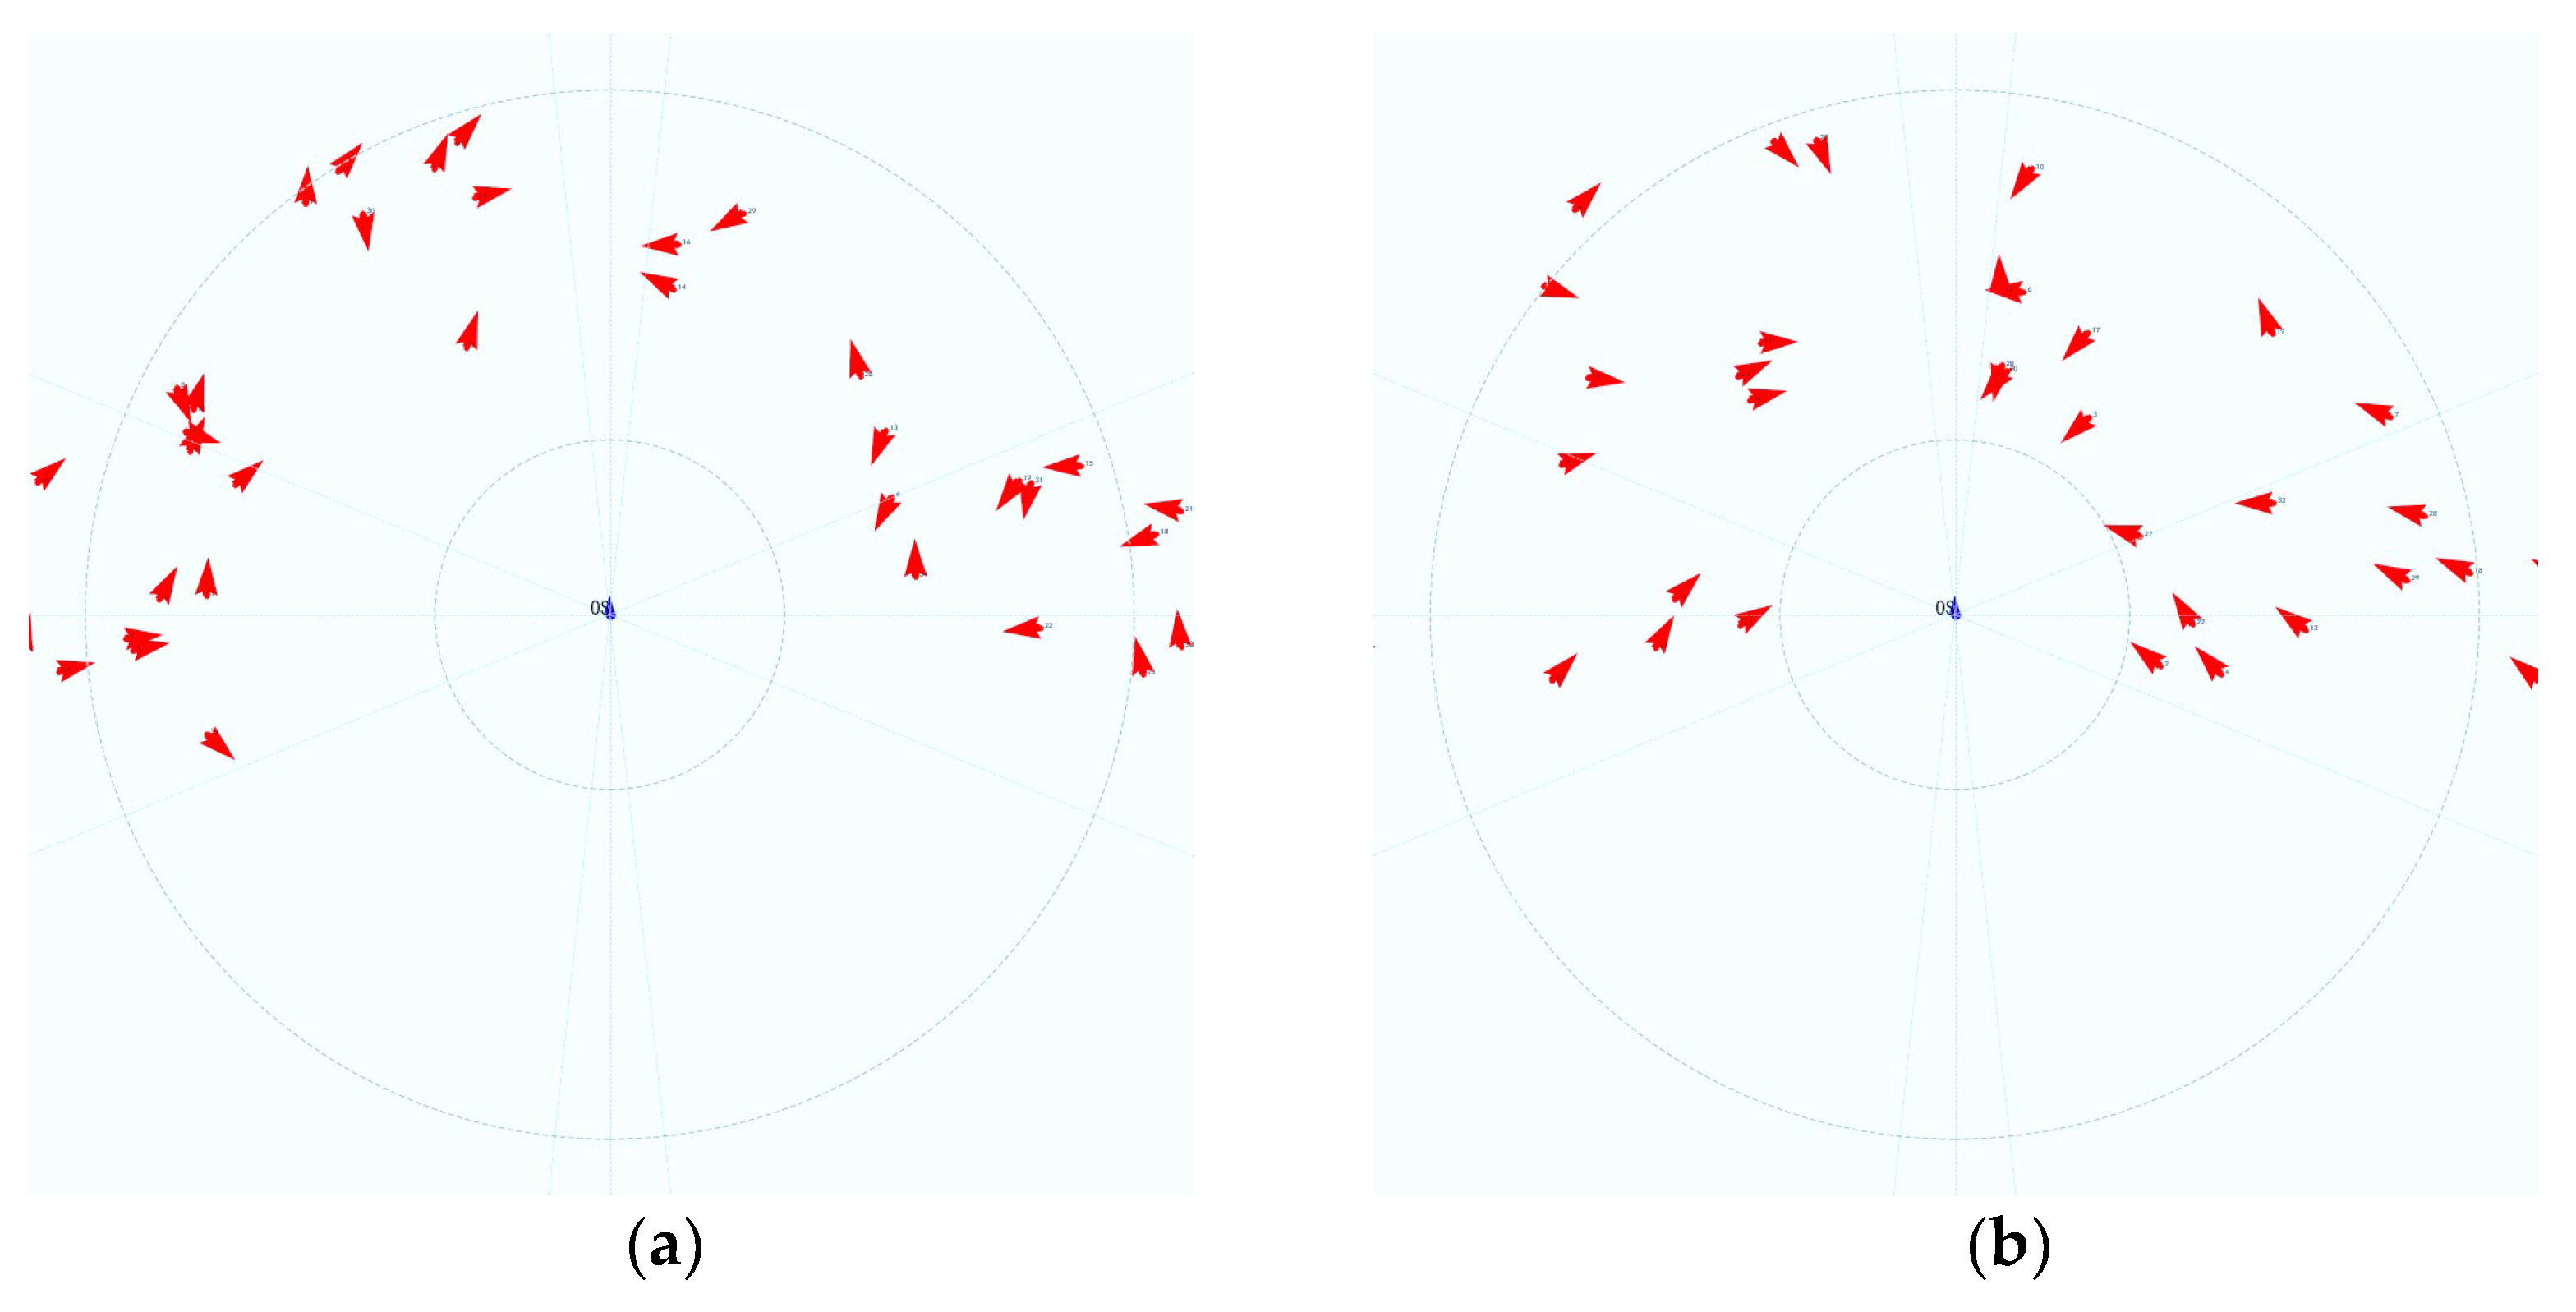
Stage 3: The collision risk is determined based on the DCPA and TCPA of the two ships, and the collision risk is controlled by setting the DCPA values of the two ships when generating the scenario, as shown in
Figure 4. Where The DCPA of the target ship and this ship in
Figure 4a is an arbitrary value, it can be seen that many target ships do not have collision risk with this ship. In
Figure 4b, the DCPA between the target ship and this ship is limited to 0.25 nautical miles, which poses a collision risk with this ship.
Stage 4: Determine the initial speed of the TS.
Stage 5: Batch generates the eligible TSs as shown in
Figure 5.
Figure 5a shows the automatic generation of 20 head-on scenarios,
Figure 5b shows the automatic generation of 50 crossing scenarios, and
Figure 5c shows the automatic generation of 100 overtaking scenarios.
Stage 6: Extract the automatically generated TSs with different encounter situations and combine them into a multi-ship complex scenario.
As shown in
Figure 6a–c, all three scenarios contain head-on starboard small-angle crossing and starboard overtaken at the same time; each scenario is slightly different, which ensures the diversity of scenario generation. Through this method, TSs of different states can be added in one scenario, various encounter situations can be generated in large quantities, and typical collision avoidance scenarios can be extracted from them, to establish a standard test scenario library.
2.2. Construction of the Evaluation Index System
The evaluation of ship autonomous collision avoidance performance should adopt the principle of a comprehensive evaluation of multiple indicators, which should not only consider the safety performance of ship autonomous collision avoidance system but also take into account factors such as the economy of the ship. This can evaluate the performance of the ship autonomous collision avoidance system more comprehensively and provide a more accurate reference [
40]. Evaluating the performance of autonomous collision avoidance on ships is the process of executing the collision avoidance algorithm on ships and the final collision avoidance result [
41].
2.2.1. Evaluation Index
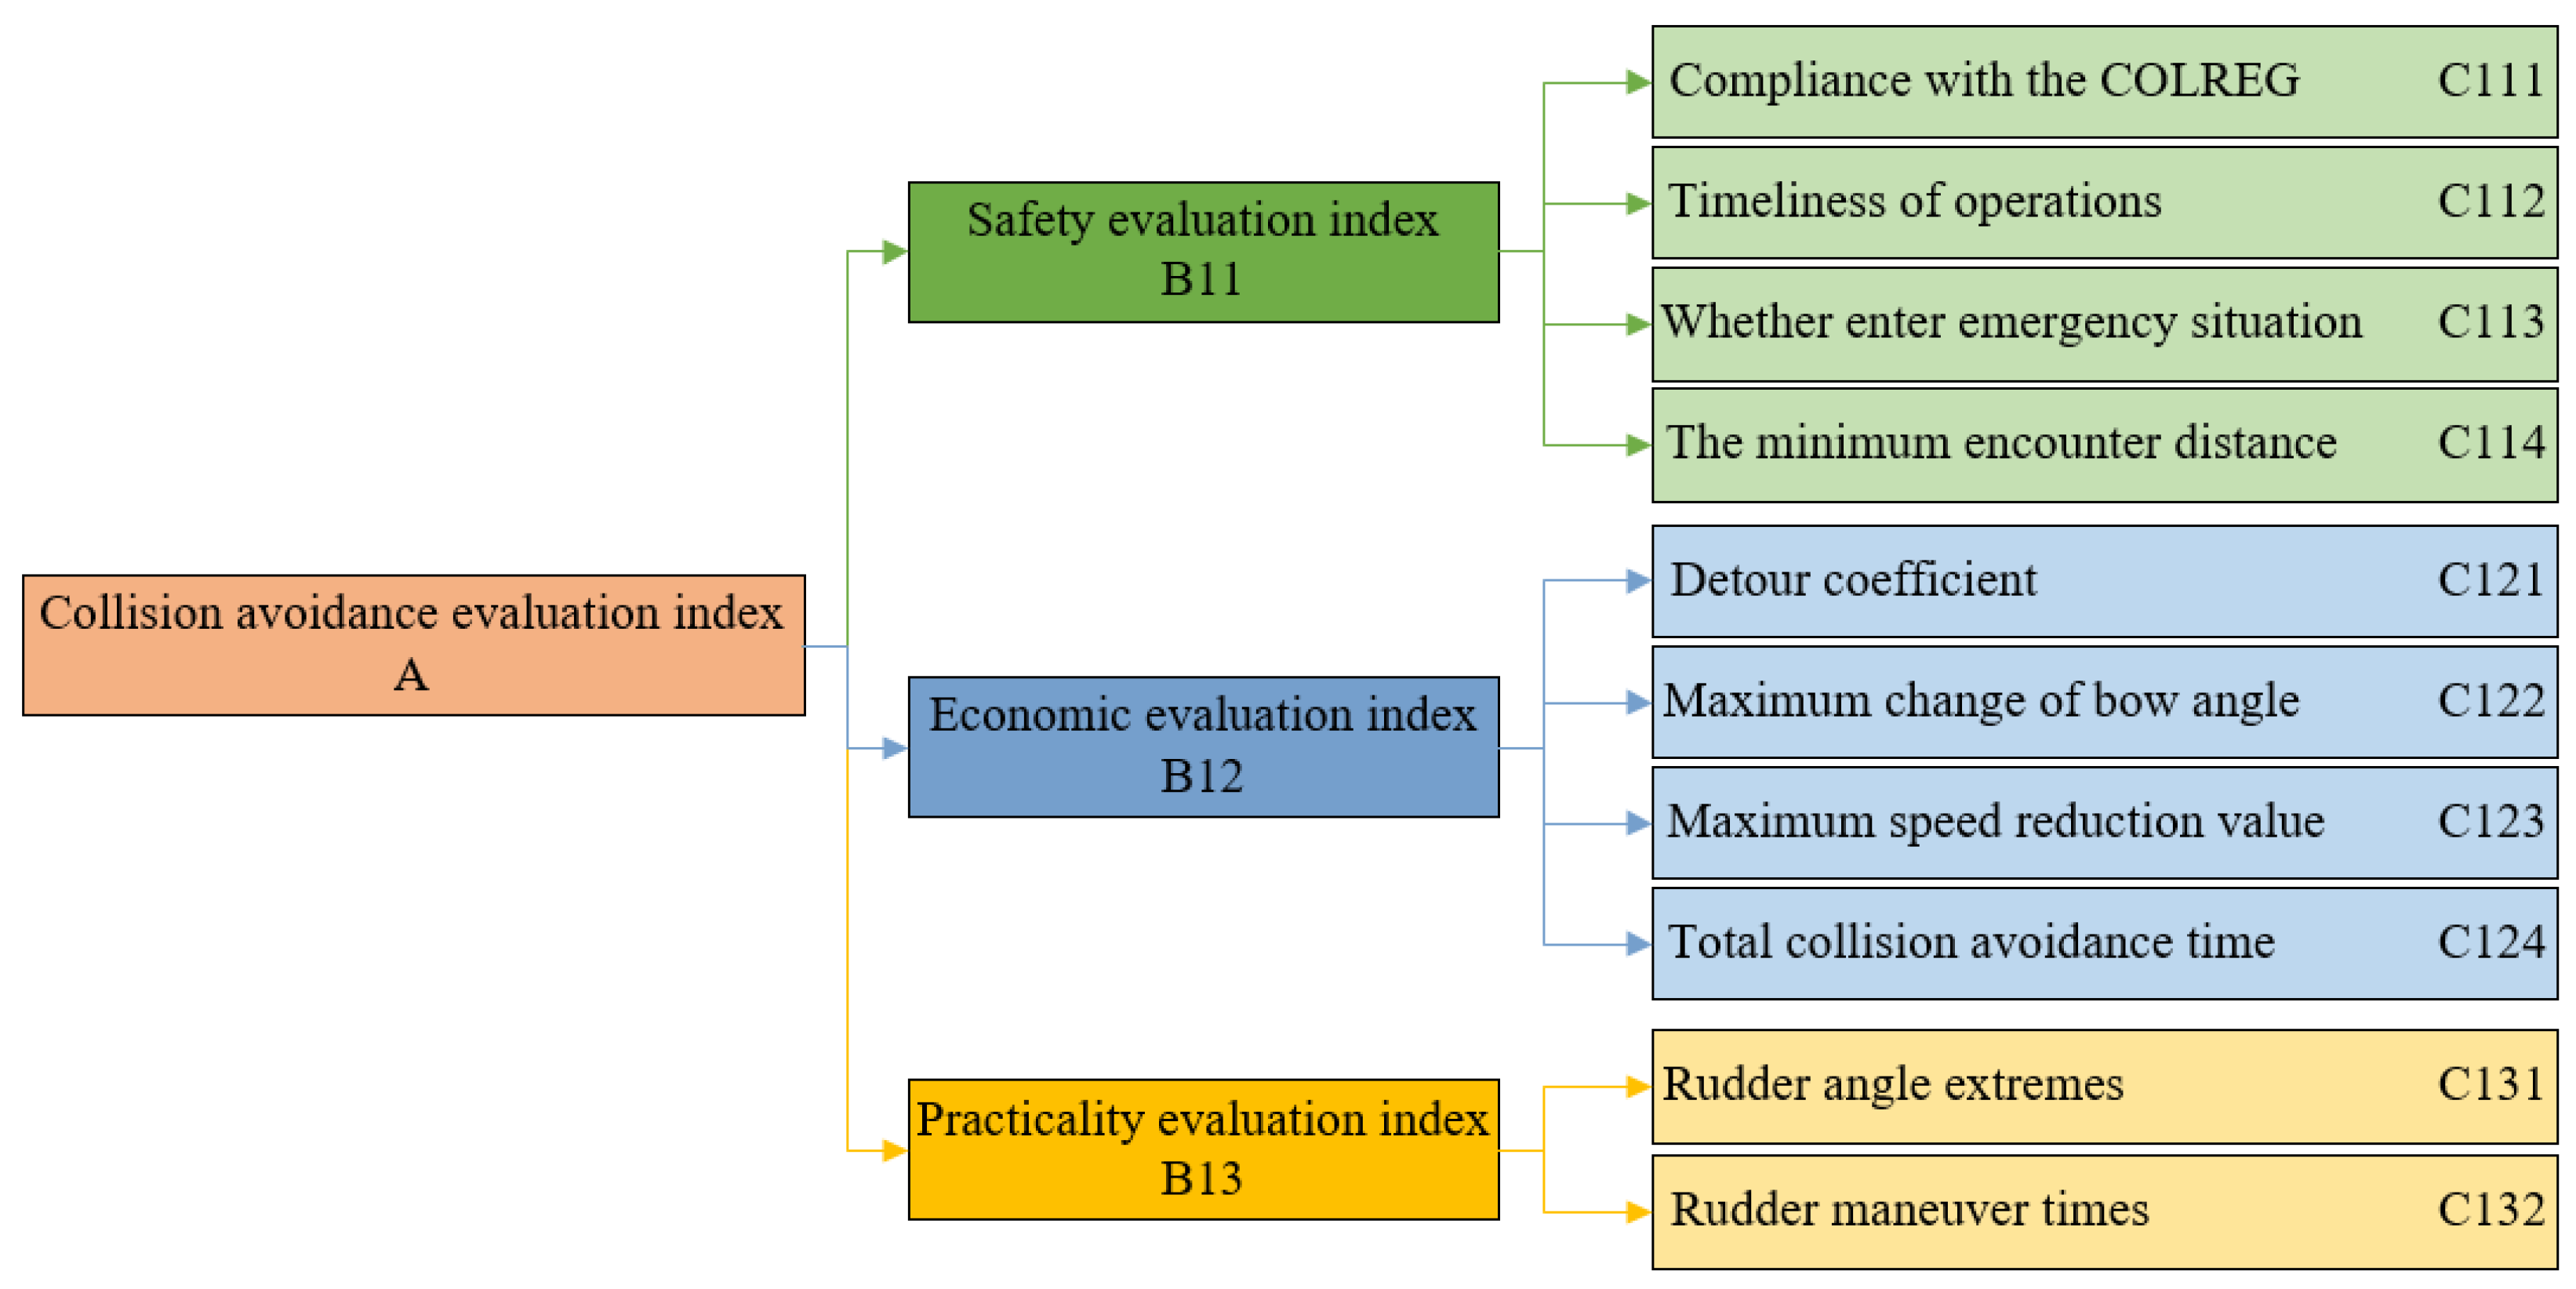
In order to objectively and quantitatively evaluate the ship collision avoidance process, the collision avoidance evaluation index system is established from the three aspects of safety, economy, and practicality, and then the autonomous collision avoidance process is evaluated and the evaluation indexes are categorized into three levels, as shown in
Figure 7. The evaluation indexes are divided into three levels; by comparing the identified evaluation indexes with each other, the judgment matrix is derived, and the weights of each risk factor in the evaluation index system are found. The evaluation index system is evaluated using the fuzzy comprehensive evaluation method.
This index is used to judge whether the collision avoidance process meets the COLREG requirements and ensures the safety of the ship, including the following:
- (1)
Compliance with the COLREG index (C111) and timeliness of operations index (C112), which need to be judged in combination with the size of the ship, the good or bad maneuvering performance, the ship’s navigational environment, and many other factors, and it is not possible to describe them using mathematical models at present, so the above two indexes are evaluated as subjective evaluation indexes and are evaluated by the experts in the form of judging the merits and demerits and fuzzy scoring;
- (2)
Whether or not to enter the emergency situation index (C113) mainly characterizes the risk of collision avoidance, corresponding to the original test data of the distance between the two ships located within the range of the close-quarter situation;
- (3)
The minimum encounter distance index (C114) mainly characterizes the closest distance in the collision avoidance process of two ships and is an important indicator for evaluating the safety of collision avoidance behavior. When determining and modeling this index, it is necessary to refer to the hydrodynamic characteristics of the ship, and its main role is to be used for judging the threshold value of the minimum encounter distance of two ships. By analyzing the force and motion characteristics of the ship in the hydrodynamic environment, the reasonable range for judging the safety of collision avoidance can be set more accurately, and based on this, the mathematical modeling of the minimum encounter distance of the ship is carried out to realize the automatic judgment.
- 2.
Economic Evaluation Index
This index is used to judge whether the collision avoidance process is economical, saves time, and reduces traveled distance, including the following:
- (1)
The detour coefficient index (C121) is an important indicator for measuring the economy of collision avoidance and realistic trajectories of a ship, indicating the ratio of the actual distance traveled by the ship in the process of collision avoidance to the straight-line distance between the starting point and the endpoint. The coefficient not only reflects the additional distance traveled due to the collision avoidance operation but also includes the realistic trajectories formed by the ship’s change in heading in the collision avoidance process, which comprehensively characterizes the complexity and economy of collision avoidance operation. The higher the coefficient of detour, the more extra distance caused by the collision avoidance behavior of the ship, and the worse the economy. By calculating the ratio of the actual sailing distance to the straight-line distance from the starting point to the endpoint, the efficiency, rationality, and trajectory optimization of collision avoidance operation can be accurately assessed. The index is calculated based on the original test data, including the actual distance traveled by the ship and the straight line length between the starting point and the endpoint, which provides important data support for optimizing collision avoidance strategy and improving trajectory planning;
- (2)
The maximum change in bow angle index (C122) refers to the maximum value of the change in bow angle in the collision avoidance process, characterizing the maximum value of the change in bow angle produced by the execution of collision avoidance in the process of collision avoidance. The larger the value of the change in bow angle is, the more obvious the action of collision avoidance of a ship is, the more easily it can be observed by the other ship, but it is also easier to produce a larger additional distance of navigation. This index can be calculated by directly adopting the bow angle in the original test data;
- (3)
Maximum speed reduction value (C123) refers to the maximum reduction in a ship’s speed during collision avoidance. Vessels operating on the high seas run at sea speed and most modern ships are fitted with fixed pitch propellers. Engines are protected by special programs that dampen sudden changes in engine speed, making it difficult to reduce speed quickly. The great inertia of ships also means that reducing propeller rpm does not necessarily mean an effective speed reduction. A small number of ships are fitted with controllable pitch propellers, which can be adjusted to vary speed by adjusting the pitch. These operations are usually carried out in harbors and shipping lanes, and slowing down is not the best option for collision avoidance maneuvers for ships traveling at full speed on the open sea; it is not as convenient as maneuvering the rudder. This indicator can be calculated using the speed data from the original test data;
- (4)
The total collision avoidance time index (C124) refers to the total elapsed time of the collision avoidance process, which can be defined as the time interval starting from applying the rudder until the two ships give way. This index directly affects the fuel cost, operation efficiency, equipment maintenance cost, and sailing plan execution in the process of ship operation. Optimizing the collision avoidance strategy to shorten the collision avoidance time can effectively improve the economy, reduce unnecessary expenses, and at the same time ensure the efficiency and reliability of ship operation. This is of great significance to ship owners and operators regarding cost reduction and competitiveness enhancement.
- 3.
Practicality Evaluation Index
This index is used to judge whether the requirements for simplicity of maneuvering and suitability for live-aboard operations are met, including the following:
- (1)
Rudder angle extremes index (C131). According to the definition of COLREG, in waters with enough operating space, timely and substantial steering to avoid collision is the most effective action to avoid an urgent situation, and such action will not form a new urgent situation. Considering from the point of view of collision avoidance of a ship, it is better to take the larger rudder angle during collision avoidance; however, in some cases, too large a rudder angle may also be detrimental to the navigational safety of the ship. Therefore, it is necessary to consider the rudder angle according to the maximum and minimum values of the rudder angle. This index can be calculated according to the rudder angle data collected;
- (2)
Rudder maneuver times index (C132) refers to the frequency of rudder maneuvering during collision avoidance. Too high a rudder maneuvering frequency requires frequent operation of the rudder system, which increases the mechanical wear and energy consumption of the equipment and may lead to premature aging or failure of the components, which may cause potential mechanical failures and safety hazards. Moreover, too high steering frequency also indicates a lack of planning or foresight in steering decisions, which will increase the ship’s heading fluctuation and thus affect the accuracy and efficiency of the collision avoidance process. Therefore, by analyzing the practicality of steering several rationalities, the steering frequency should be as low as possible. This index can be used in the original test data of the rudder angle for statistics and judgment.
2.2.2. Affiliation Function
Through the above indexes, the evaluation index system of the autonomous collision avoidance process of ships can be established, and the weights of the bottom index can be obtained. However, a reasonable method of determining the evaluation value of the underlying indicators is also needed to complete the final evaluation. Considering the different magnitudes and orders of magnitude between different indexes, it is necessary to normalize the indicators; through the introduction of the affiliation function curve, various bottom indexes are uniformly mapped to between [0, 1], so that the heterogeneous evaluation results can have a unified evaluation form, thus facilitating the final quantitative evaluation results. For the specific form of each bottom index in the ship collision avoidance process, this study mainly adopts three types of affiliation functions: Z-shaped, S-shaped, and trapezoidal.
The Z-shaped function includes two parameters,
and
, as shown in Equation (3).
When the value of the bottom index is less than
, the value of the affiliation function is 1; when the value of the bottom index is greater than
, the value of the affiliation function is 0. When the value of the bottom index is between
and
, the value of the affiliation function is a quadratic function value between [0, 1]. The Z-shaped affiliation function is shown in
Figure 8.
The Z-shaped affiliation function is mainly used to evaluate the smaller the better index, such as economic metrics like the detour coefficient index (C121).
- 2.
S-Shaped Affiliation Function
The S-shaped function includes two parameters,
and
. As shown in Equation (4).
when the value of the bottom index is less than
, the affiliation function value is 0, when the value of the bottom index is greater than
, the affiliation function value is 1, and when the value of the bottom index between
and
, the affiliation function value is a quadratic function value between [0, 1]. The S-shaped affiliation function is shown in
Figure 9.
The S-shaped affiliation function is mainly used to evaluate the larger the better index, such as the DPCA (C114).
- 3.
Trapezoidal Affiliation Function
The trapezoidal function consists of four parameters
,
,
, and
, as shown in Equation (5).
When the bottom index value is less than
or greater than
, the affiliation function value is 0, when the bottom index value is greater than
and less than
, the affiliation function value is 1, and when the bottom index value is between
,
, or between
,
, the affiliation function value is a primary function value between [0, 1]. The trapezoidal affiliation function is shown in
Figure 10.
The trapezoidal affiliation function is mainly used to evaluate indexes that lie in a certain interval of optimality, such as the maximum rudder angle during collision avoidance index (C131).
2.3. Virtual–Real Space Mapping Method
Virtual simulation testing can accurately control the initial parameters of each scenario; however, in a virtual reality fusion test, due to the uncertainty of the motion of the real ship, the problem of underdrive of the ship maneuvering, and the discrepancy between the parameters of each ship’s position and heading, it is difficult to make the initial state of the same scene consistent for each test. Therefore, it is necessary to perform virtual–real space mapping of the scenario based on the real-time sailing parameters of the real ship to realize the correspondence of the virtual scenario in the real world and ensure the consistency of the test scenario. In this study, a virtual–real space mapping method is developed for converting virtual scenarios into real scenarios, as shown in
Figure 11.
The virtual scenarios are extracted from the generated standard scenario library, all of which are standard scenarios. The OS and the th TS (TS) form a starboard small-angle crossing encounter situation, in which the position of OS is (, ), the heading is , the position of TS is (, ), the heading is , the relative bearing angle is , and the distance between the two ships is . After virtual–real space mapping, the real scenario can be obtained, and the actual heading of the ship in the real scenario is , the difference between and is , and the whole virtual scenario needs to be rotated by the angle with the position of the ship as the center of the circle. The rotated scenario will be set at the distance directly in front of the current ship’s heading; is the remaining distance and its length is determined according to the ship’s speed. The main purpose of setting is to leave enough operation time for the spatial mapping operation.
In a planar coordinate system, the real–virtual space mapping only requires the transformation of coordinates; however, in a geodetic coordinate system, it also requires the conversion based on latitude and longitude. To facilitate the calculation, this study assumes that the earth is a sphere, which is accurate enough for most encounter scenarios. The virtual–real space mapping method is the following: know point A latitude and longitude (
,
), as well as the distance
and bearing
from point A to point B, find the latitude and longitude of point B (
,
), and establish the coordinate system as shown in
Figure 12.
Set point C has the same longitude as point A and the same latitude as point B. Taking point A as the origin and the north direction as the Y-axis, we obtain Equation (6).
is the radius of the earth; is the distance from A to point B in the transverse axis direction; and is the distance from A to point B in the longitudinal axis direction. When the real ship maintains the state of constant speed and straight voyage, replace the parameters of OS in the preset scenario with the motion state parameters of the real ship, calculate the amount of heading change in the real ship relative to the preset scenario, keep the distance and bearing angle in TS and the OS unchanged, and rotate the same amount of heading change in the bow of the TS as well as the bow of OS, so as to complete the virtual and real spatial mapping of the scenario.
3. Test Platform Construction
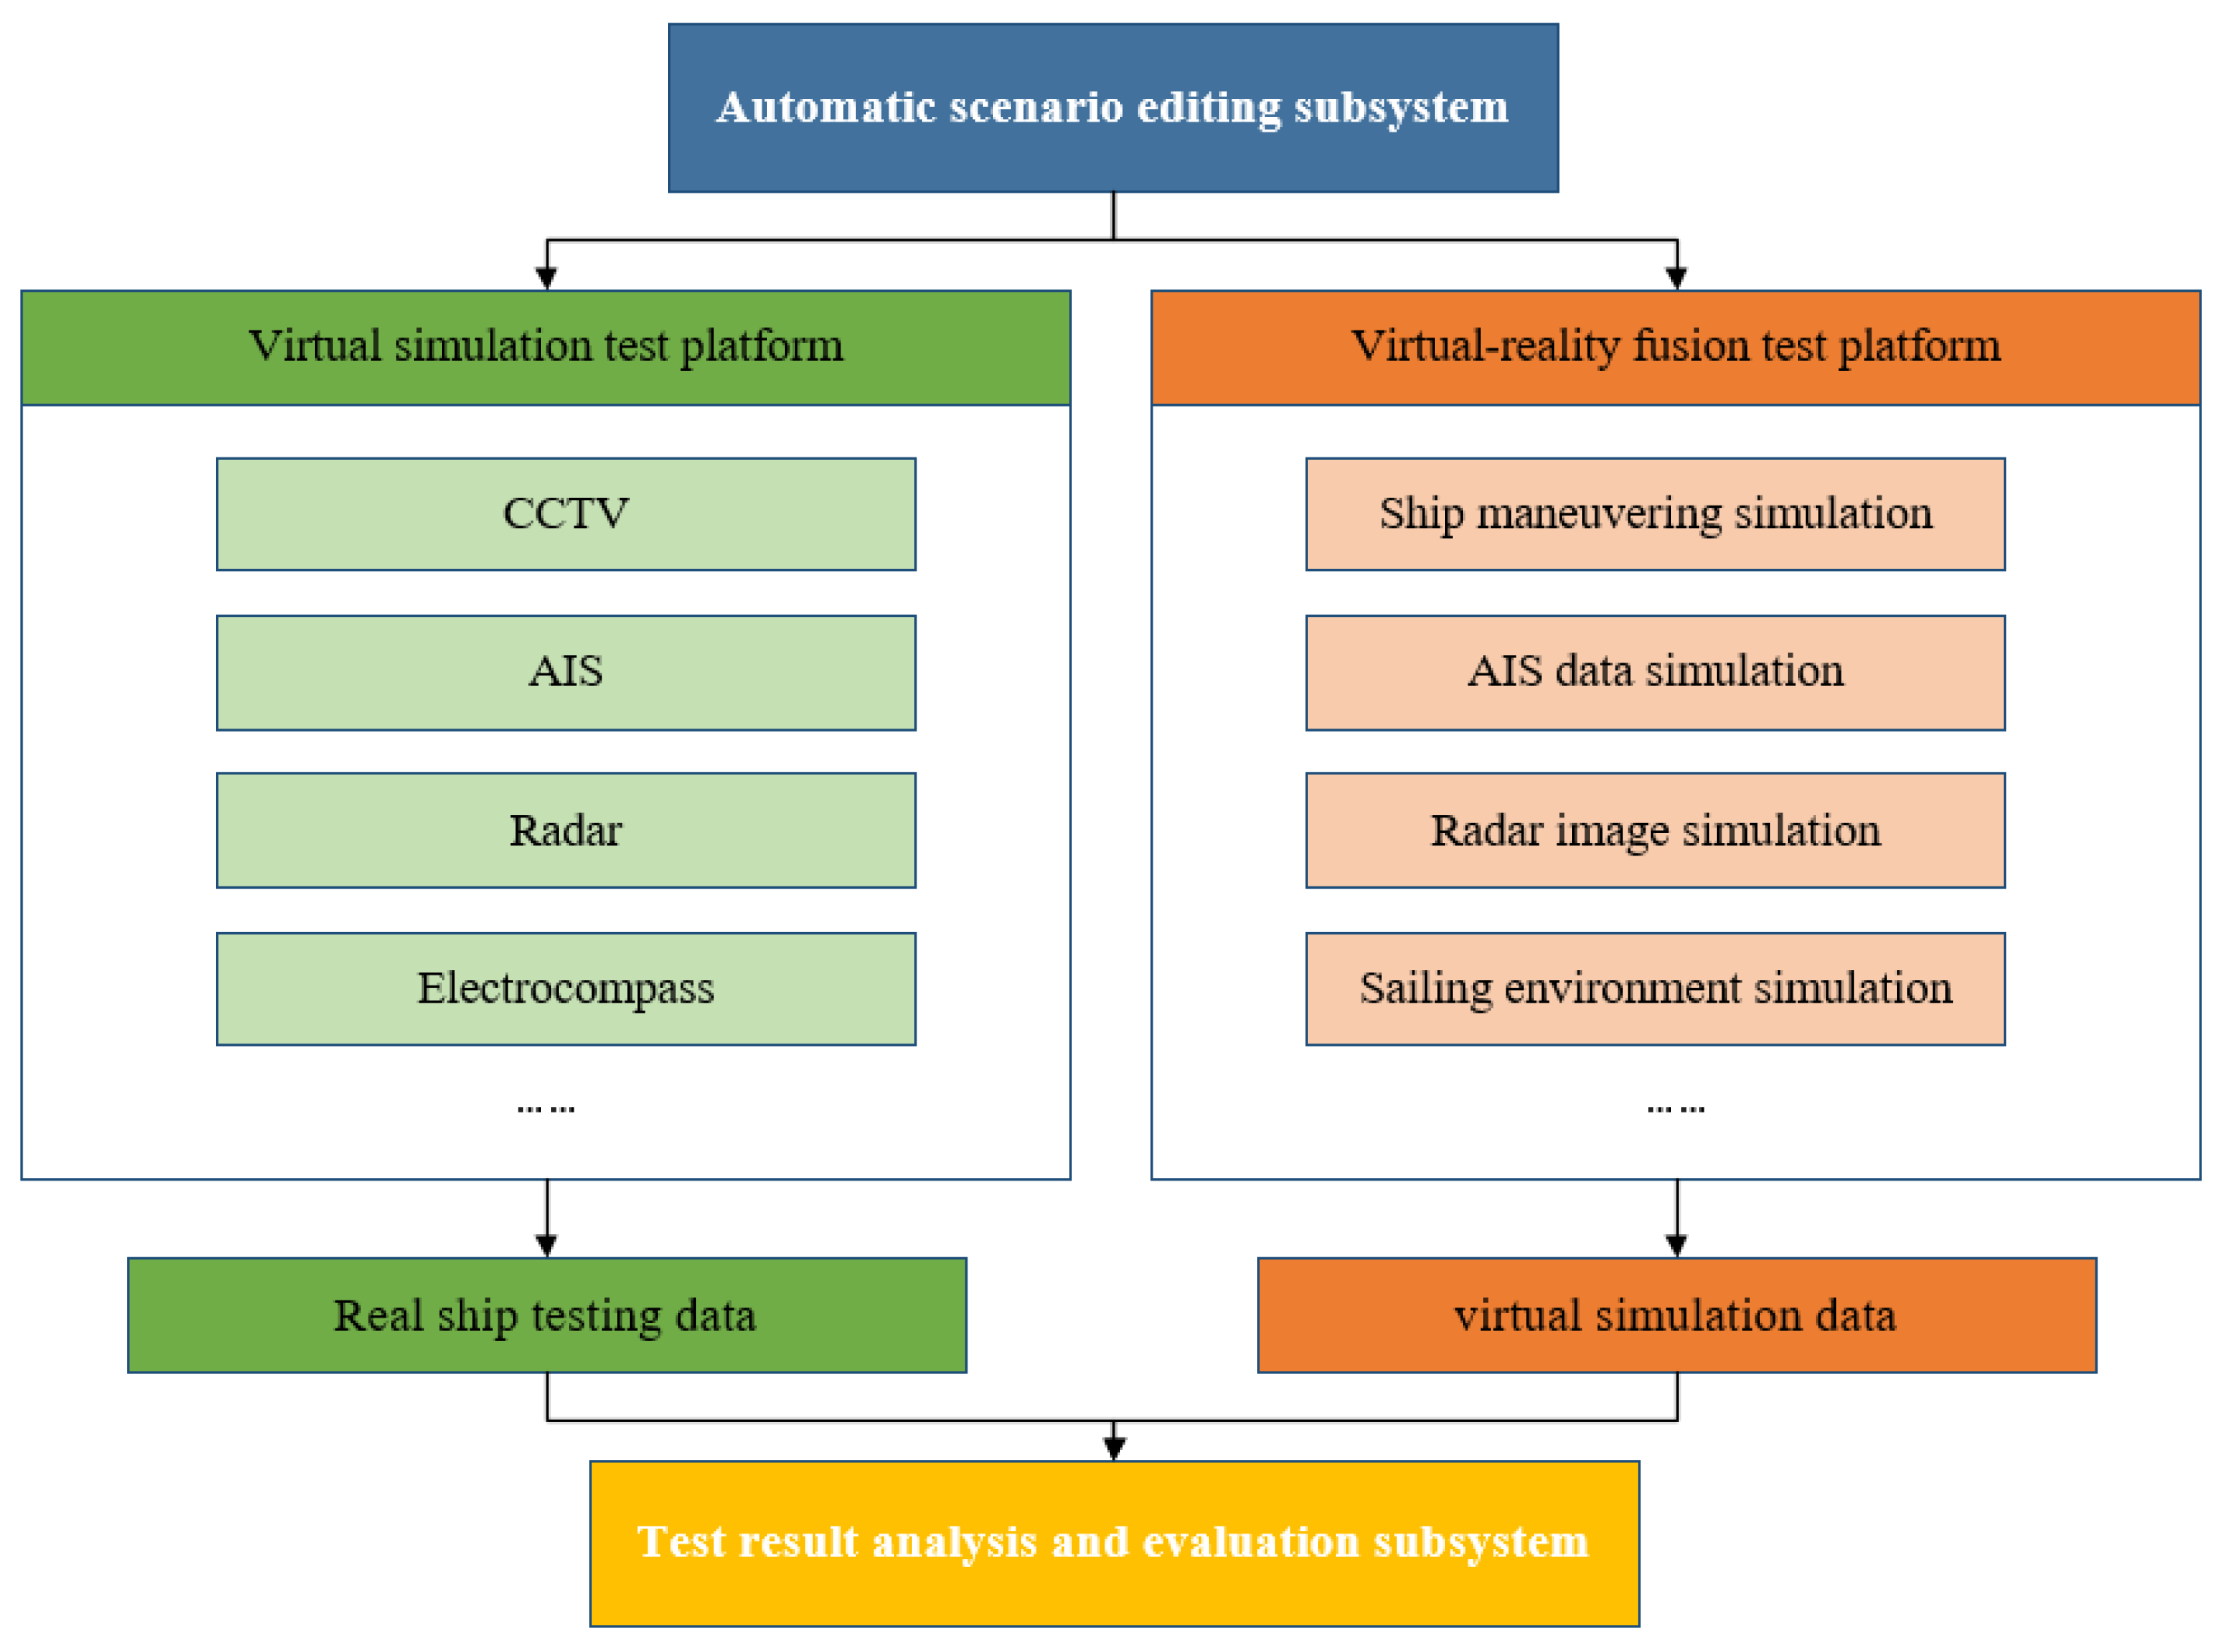
To carry out the autonomous collision avoidance algorithm test, this study establish a ship autonomous collision avoidance test and evaluation system, and the system structure is shown in
Figure 13. The ship autonomous collision avoidance test and evaluation system is mainly composed of an automatic scenario editing subsystem, test platform, and test result analysis and evaluation subsystem.
The automatic scenario editing subsystem is responsible for COLREG and determining possible collision avoidance scenarios based on the input ship parameters and environmental conditions and establishing a library of standard test scenarios;
The test platform consists of two parts: a virtual reality fusion test platform based on a real ship and a virtual simulation test platform based on a simulator;
- (1)
The virtual reality fusion test platform takes the fishery engineering ship as the OS, as shown in
Figure 14. The virtual TS is generated by the AIS simulator. During the collision avoidance process, the captain of OS drives the real ship based on the recommendations from automatic collision avoidance systems. According to the collision avoidance suggestion, by installing sensing equipment on the ship, including AIS, electric compass, radar, and CCTV, the real-world navigation data of the real ship are collected to generate real ship collision avoidance data. The ship parameters are shown in
Table 3;
- (2)
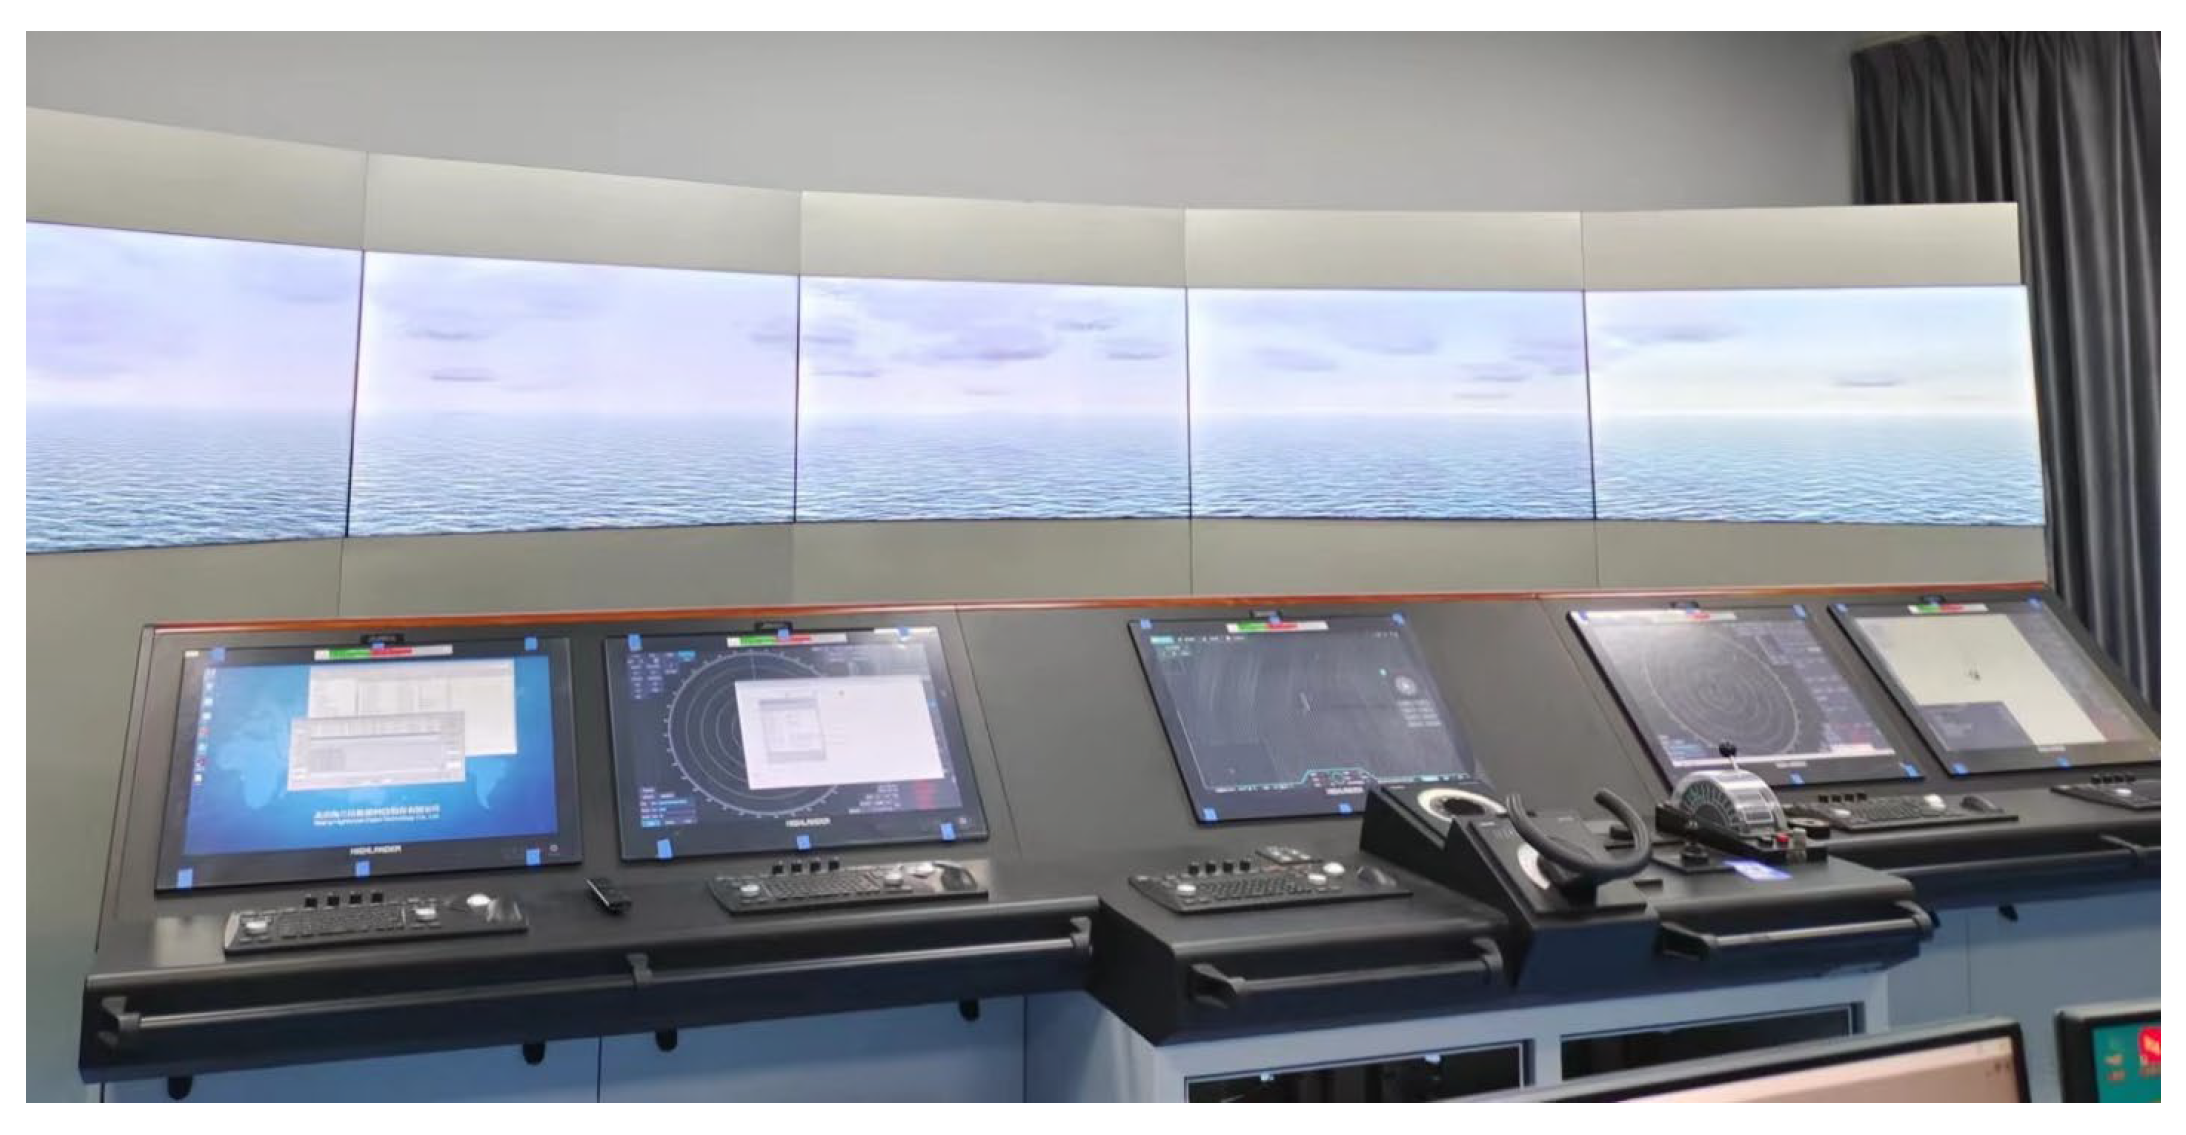
The virtual simulation test platform is built based on the Transas simulator, as shown in
Figure 15. The simulator generates the virtual OS and TS. The simulator completes the collision avoidance operation of OS and TS in the virtual world and outputs the simulation data of the ship’s AIS, radar, ship’s maneuvering, and navigational environment in real time during the process of collision avoidance to generate the virtual ship collision avoidance data;
- (3)
Based on the test data generated by the test platform, the test result analysis and evaluation subsystem adopts the form of autonomous scoring of the system combined with the judgment of human experts to comprehensively evaluate the collision avoidance operation of the ship from the three aspects of safety, economy, and practicability.
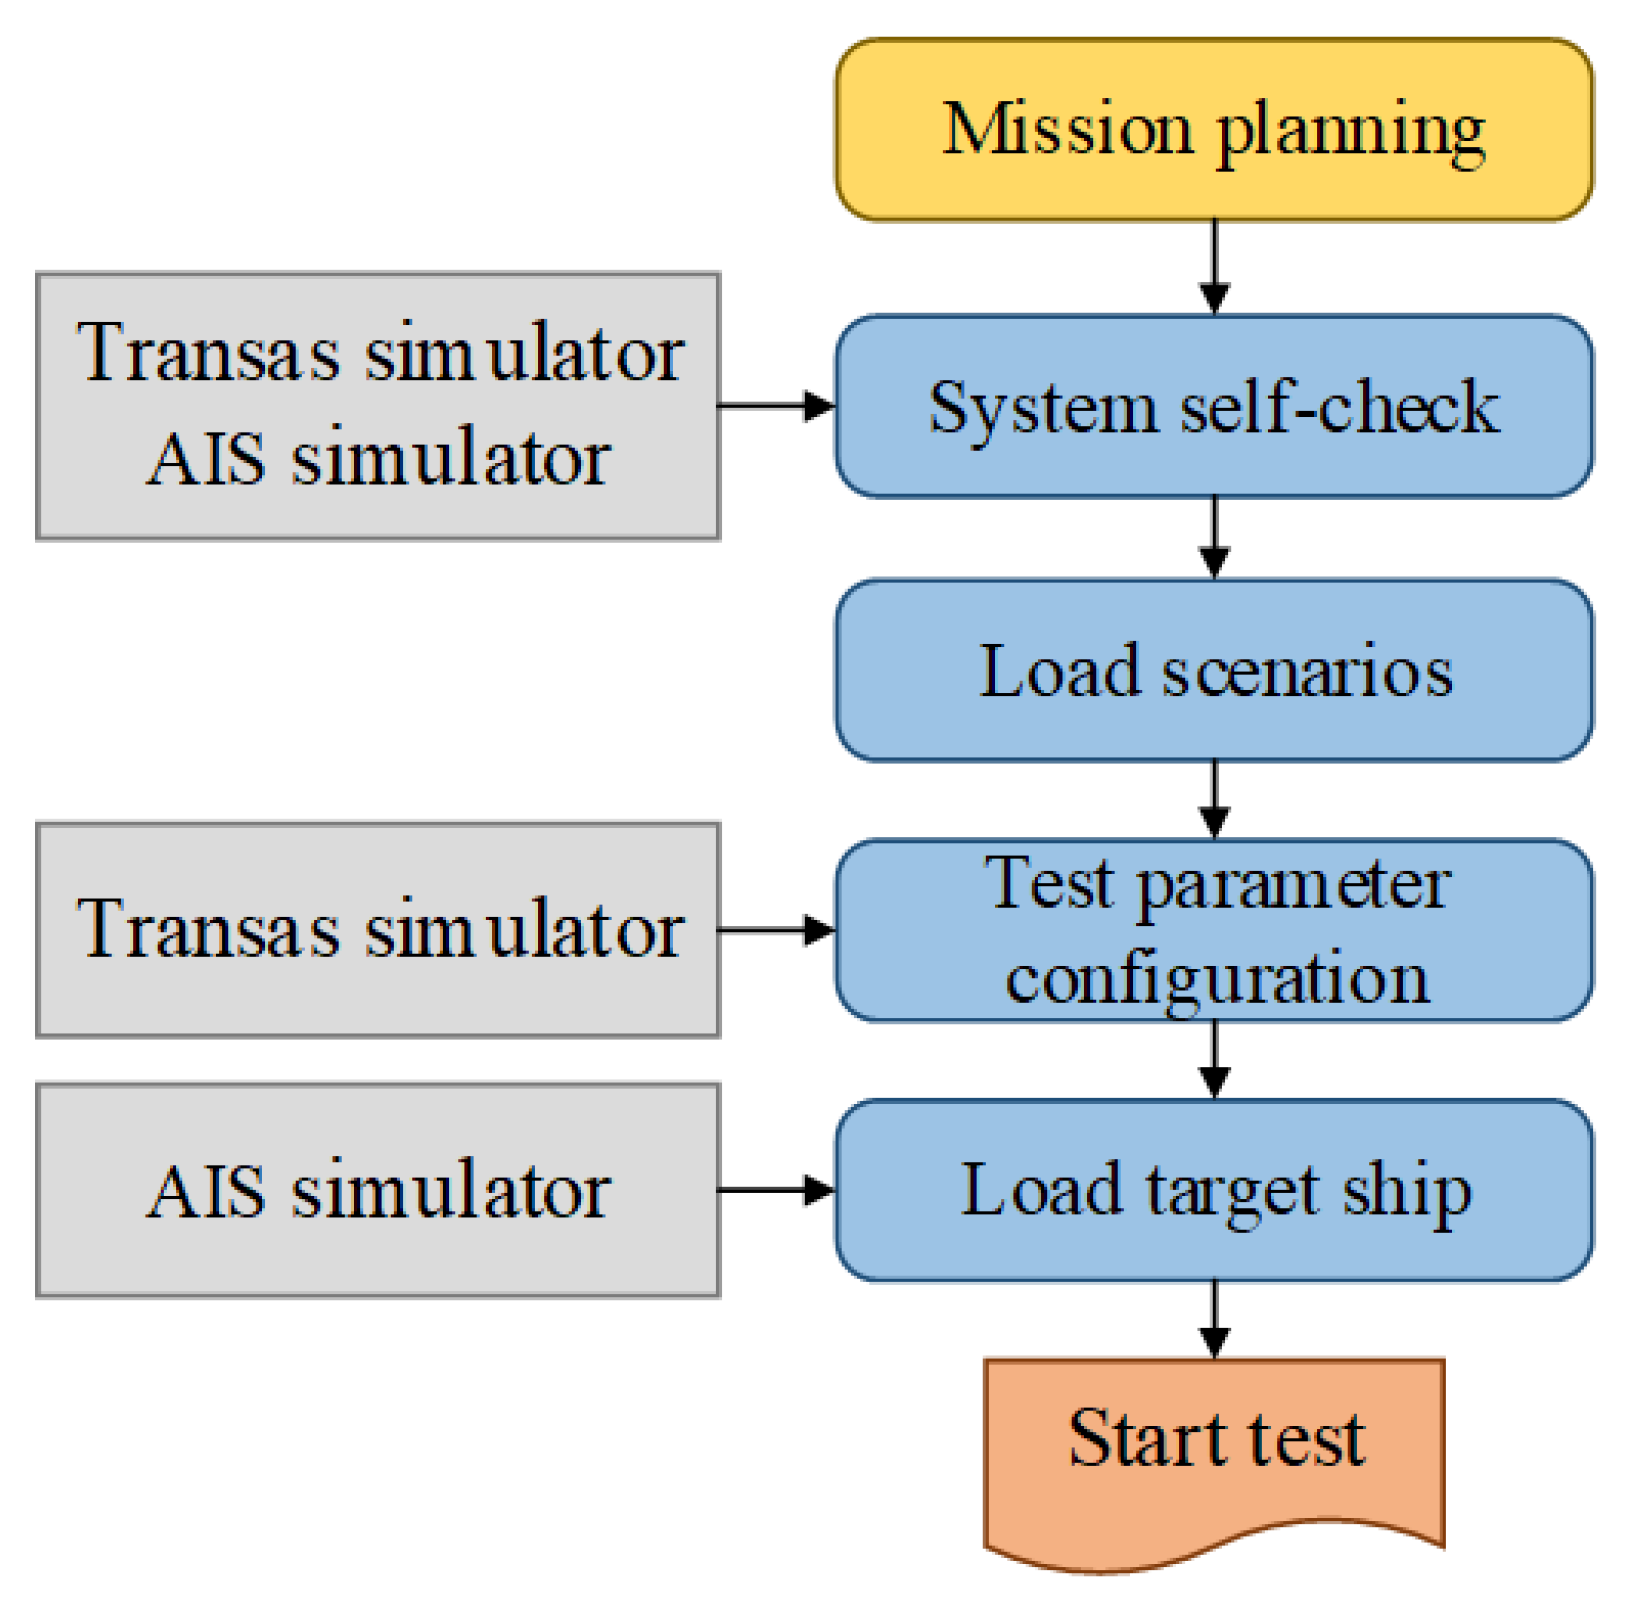
4. Test Process Design
In order to verify the rationality and effectiveness of the method in this paper, the virtual simulation test based on the Transas simulator and the virtual reality fusion test based on a real ship at sea were carried out in Zhanjiang, respectively. The test sea area is shown in
Figure 16, located from N 20.9584° to 21.0381° and E 110.0381° to 110.5691°.
Based on the COLREG established standard test scenario library, 13 typical collision avoidance scenarios are selected to be tested in the virtual reality fusion test platform and the virtual simulation test platform, respectively, which mainly include three stages: the test preparation stage, test implementation stage, and test evaluation stage.
As shown in
Figure 17, in the virtual simulation test based on the Transas simulator, both the OS and TS are virtually generated by the simulator, and the initial scenario parameters can be ensured to be consistent. Therefore, it is only necessary to input the correct collision avoidance initial parameters into the simulator to begin testing. However, in the virtual reality fusion test, the initial parameters of the scenario need to be dynamically adjusted according to the actual navigation state of the OS, generating the target ship parameters through the virtual–real space mapping method. The process of the virtual reality fusion test is shown in
Figure 18.
The process for the virtual reality fusion test is as follows. Before each test, adjust the ship’s attitude first, when the real ship is in the state of uniform speed and straight voyage, turn on the virtual–real space mapping, and input the sailing information of the ship into the virtual–real space mapping module to automatically generate the scenario information for the TS in the virtual reality fusion scenario, and then generate the virtual target ship by the AIS simulator.
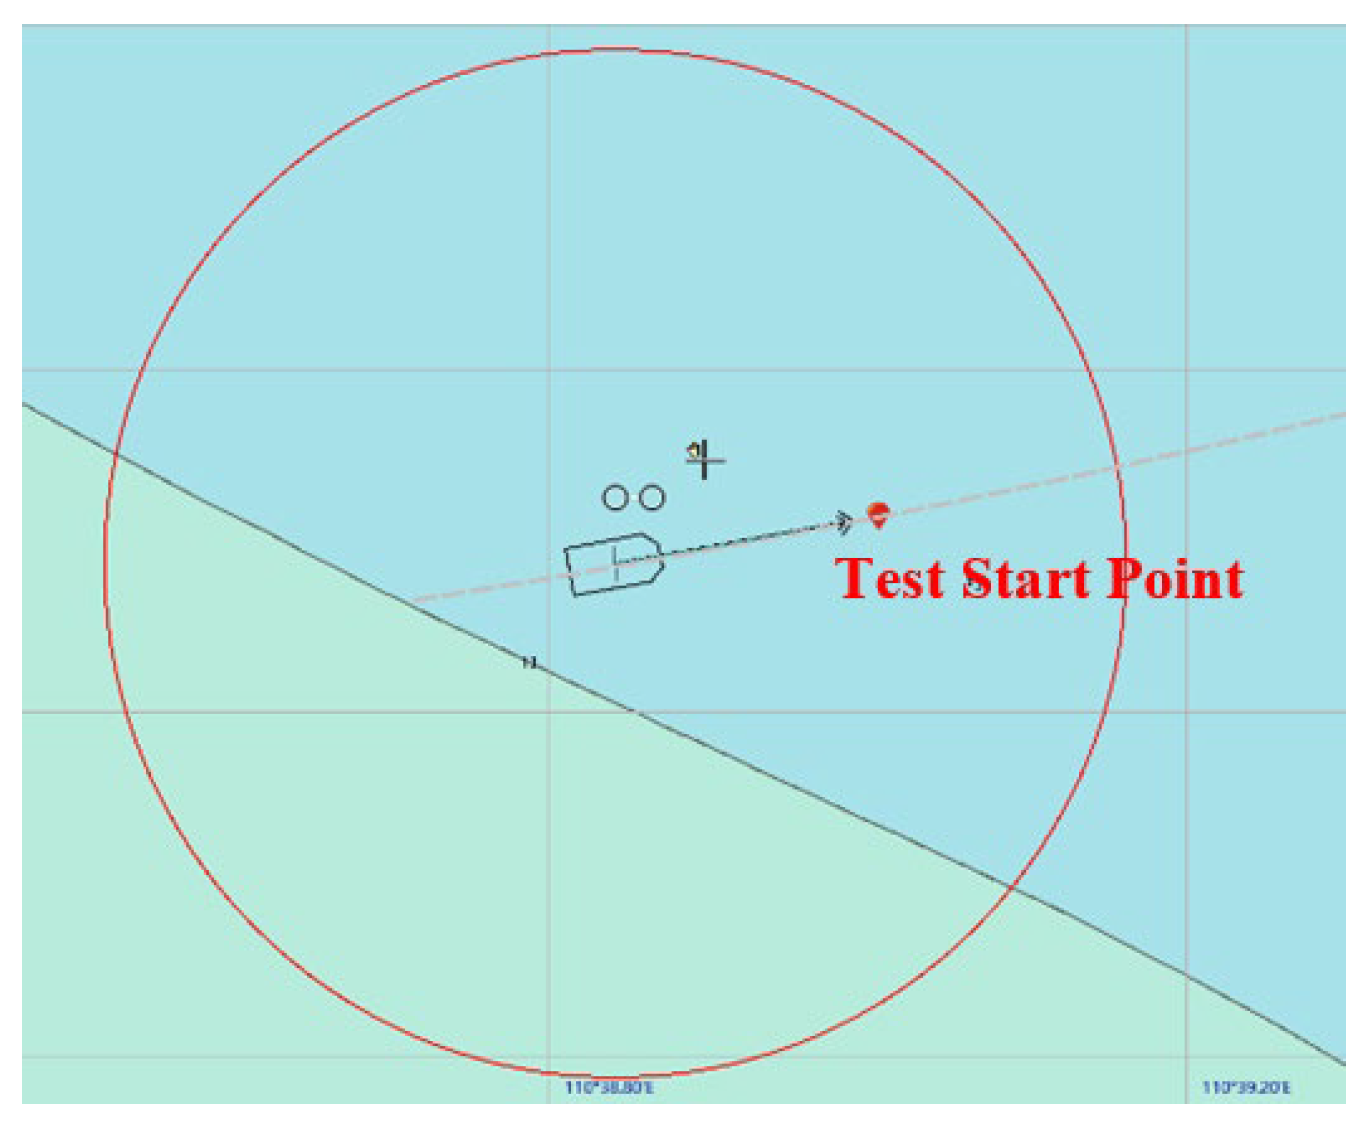
If the position of the real ship at the beginning of the mapping operation is used as the initial point of the scenario, when the mapping is completed, the ship has already sailed away from the initial point of the scenario.
Therefore, considering the time cost of scenario generation, the test start point of the OS in the preset scenario is set to a position at a certain distance directly in front of the actual heading to ensure that the OS sails to this position before completing the scenario mapping operation, as shown in
Figure 19. When the real ship sails straight into the test start point with the determined sailing state, the test starts formally.
Testing begins once the OS reaches the initial position. Throughout the entire test, collision avoidance data are recorded in real-time. After the collision avoidance process is completed, the system will save the test data and generate an evaluation report, as shown in
Figure 20.
5. Test Data Analysis
The experiment lasted for 15 days, during which the virtual simulation test and the virtual reality fusion test were conducted for the following 13 collision avoidance scenarios, as shown in
Table 4.
The initial encounter scenarios are divided into two categories according to the number of participating ships: single-ship scenarios and multi-ship scenarios, in which single-ship scenarios only have one TS avoiding collision with OS. The multi-ship scenarios have multiple TSs avoiding collision with OS at the same time. Then, the scenarios can be further categorized into basic tests or risk tests according to the ship avoidance stage.
In the basic test, OS and TS enter the risk of collision, and the two ships carry out collision avoidance operations by COLREG, taking safety and economy into account at the same time.
In the risk test, OS and TS enter into a close-quarter situation at the beginning of the test and it is necessary to ensure safety as the goal of collision avoidance operation. In the case of a multi-ship collision avoidance scenario, it is necessary to consider the encounter situation of the second TS to make collision avoidance decisions at the same time.
5.1. Consistency Analysis of Real and Virtual Scenarios
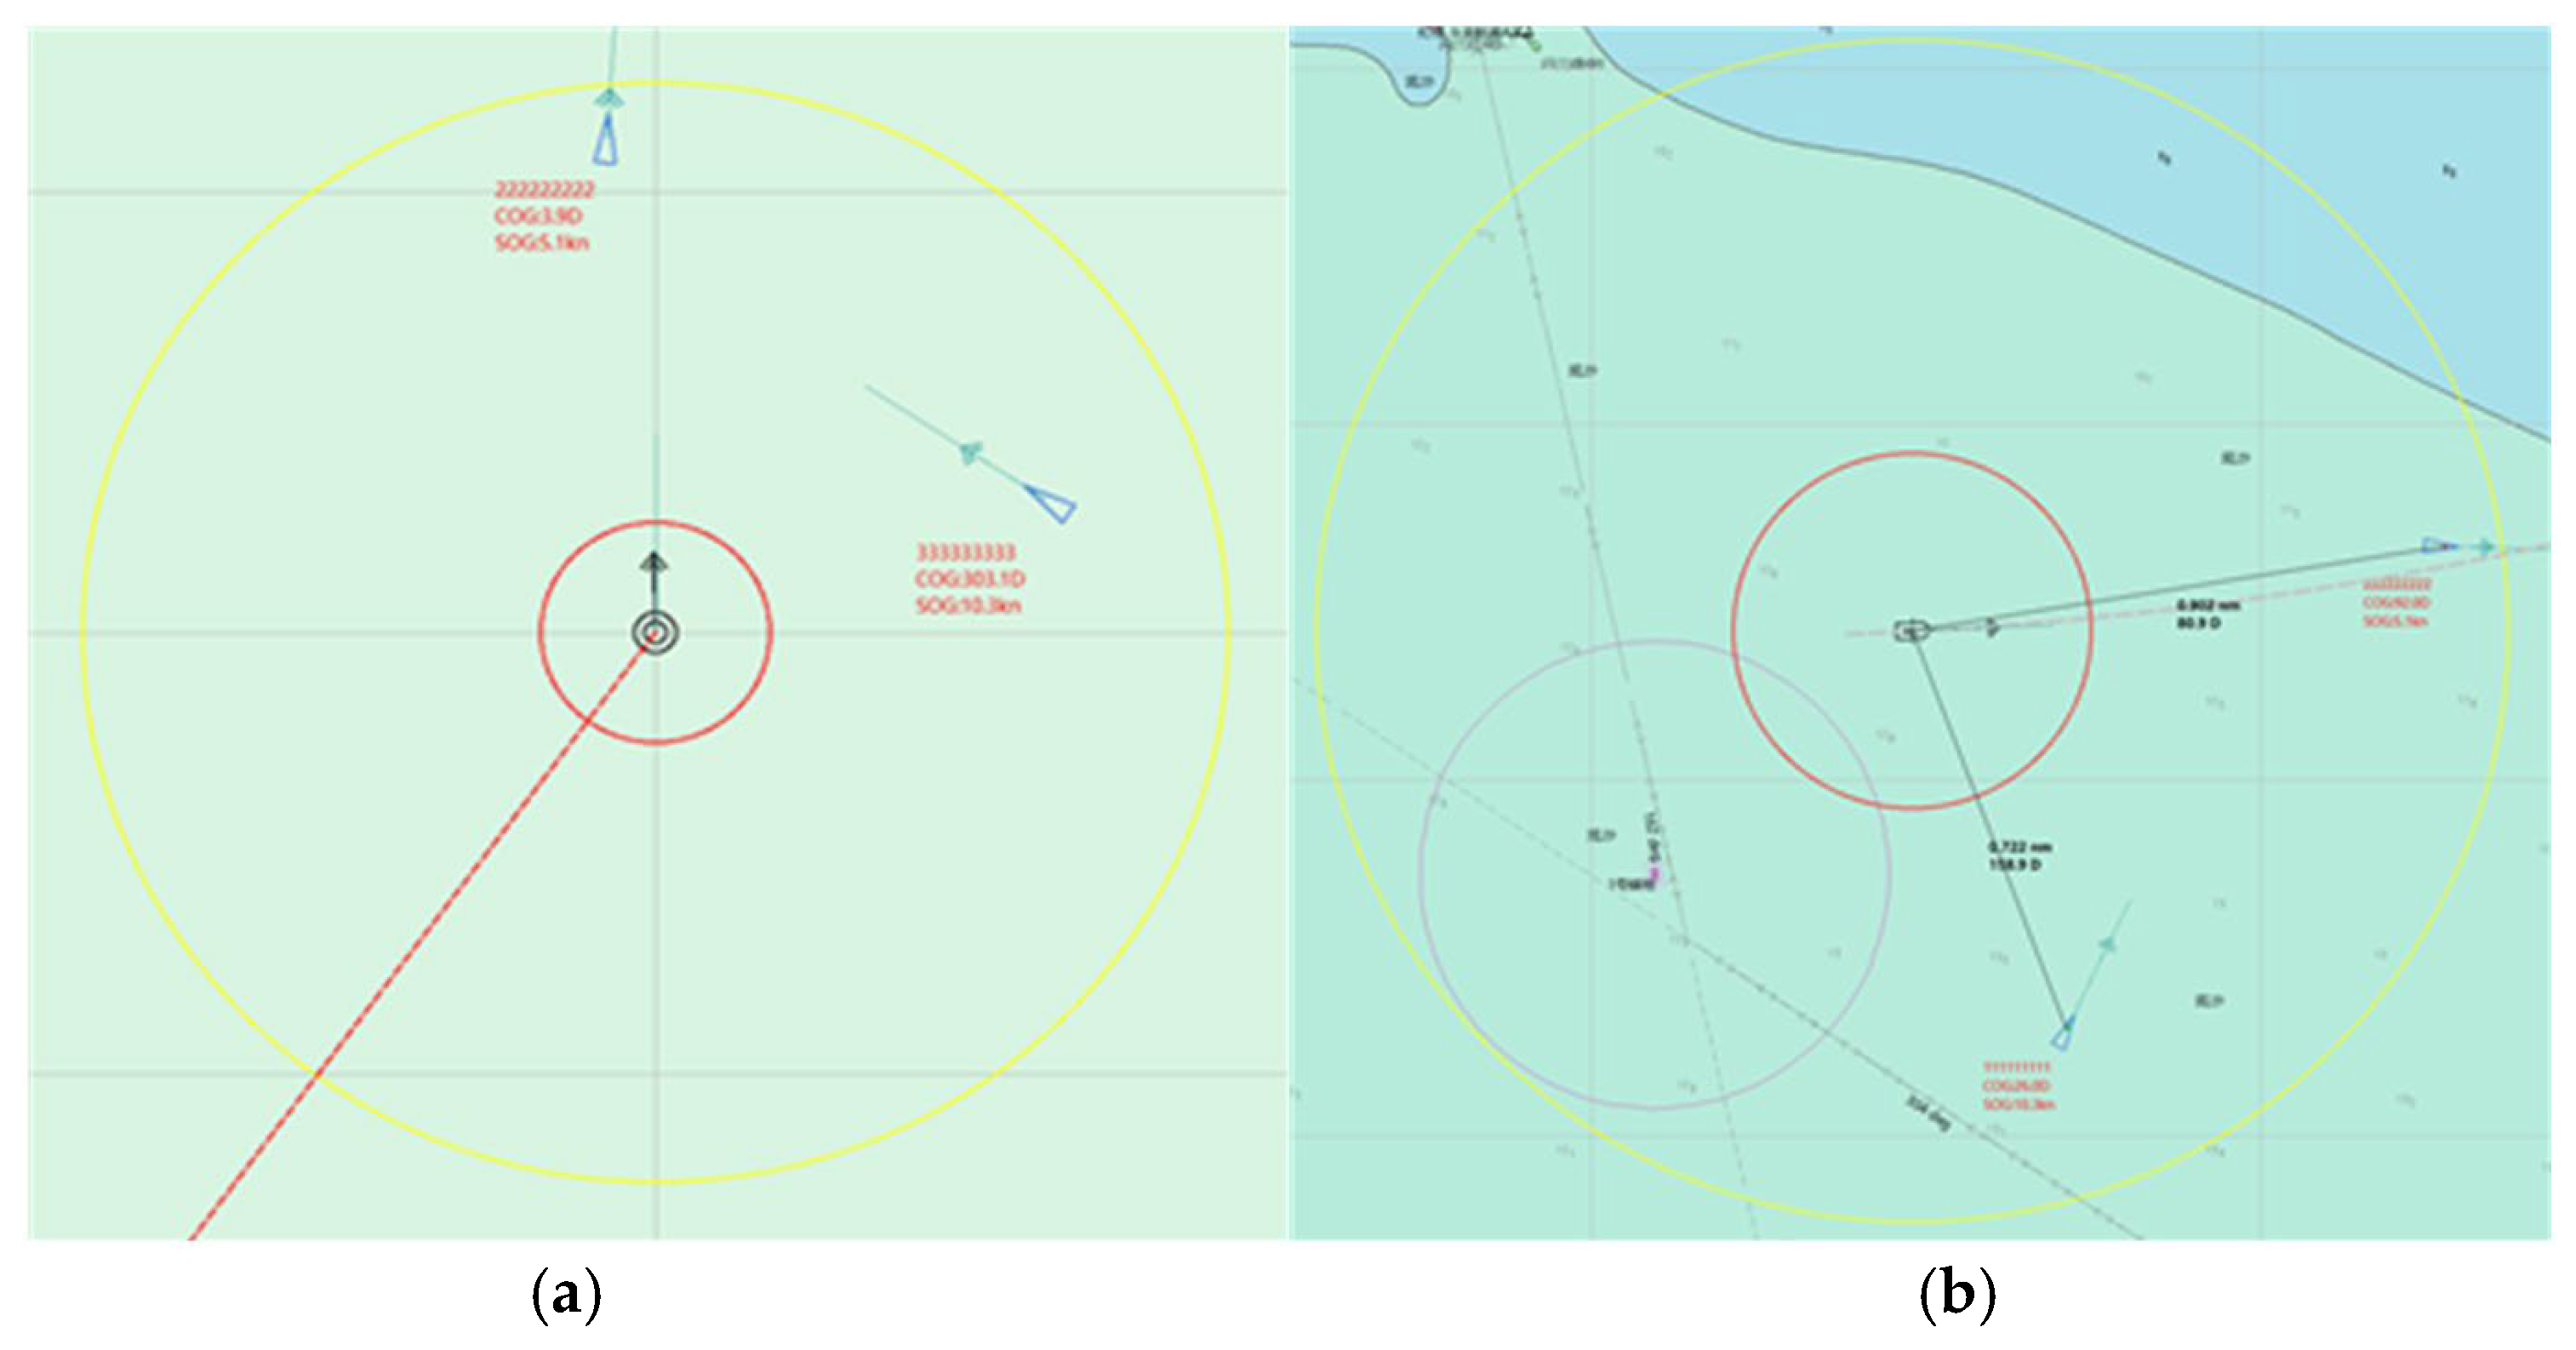
Taking the Double TS collision avoidance basic test scenario ‘starboard overtaking and starboard large-angle crossing’ as an example, in this scenario, the OS needs to complete a large-angle crossing collision avoidance with TS1 while simultaneously performing a right-hand overtaking collision avoidance with TS2. The initial state of the scenario is shown in
Figure 21.
The virtual simulation test, by adopting a standard scenario library, ensures that each test has the same initial state. In contrast, the virtual reality fusion test is influenced by the actual ship and sea conditions, making it difficult to guarantee that the initial position and heading of the ship are completely consistent in each test. However, by performing virtual–real space mapping of the test scenario based on the real-time navigation state of the OS, the standard scenario can be effectively restored, as shown in
Figure 22.
After rotating the initial scenario of the virtual–real fusion test around the OS (
Figure 22b) and comparing it with the initial scenario of the virtual simulation test (
Figure 22a), it can be observed that the distances between the OS and each TS in the virtual simulation test are 0.731 n-mile and 0.911 n-mile, respectively. In the virtual–real fusion test, the distances are 0.718 n-mile and 0.905 n-mile, with deviation rates of 1.7% and 0.7%. The heading angle deviations for OS relative to the two TS are 1° and 1.1°, while the bearing angle deviations are 0.58° and 0.6°.
A detailed comparative analysis of all the initial scenarios of the virtual reality fusion test was conducted as well as the virtual simulation test; the results are shown in
Figure 23. From the analysis results, it can be seen that the initial scenarios of the virtual reality fusion test and the virtual simulation test show a high degree of consistency in several key indicators.
The heading angle deviation values are all centrally distributed in the interval of 0°–2.5°; the distribution and numerical comparison of the virtual reality fusion test and the virtual simulation test are shown in
Figure 23a, indicating that the two test methods have highly similar control accuracy in the initial state of heading angle.
The bearing deviation values are all distributed in the interval of 0°–2.8°; the comparison is shown in
Figure 23b. This indicates that the relative bearing angles between OS and TS maintained a relatively stable error range under both the virtual reality fusion test and the virtual simulation test environments during the test.
The distance deviation rates are all kept within 5%, as shown in
Figure 23c, which further indicates that the two scenarios have a high degree of matching in terms of spatial distance.
Based on the above data -analysis results, it can be concluded that the virtual–real fusion test accurately converts the initial position, heading, and bearing information of OS and each TS in the standard virtual scenario to the real ship test environment using the virtual–real space mapping method. This mapping method can not only effectively reduce the discrepancy between the real scenario and the virtual scenario, but also significantly reduces the scenario consistency deviation caused by the uncertainty of the real ship’s motion.
In addition, the virtual–real space mapping method demonstrates excellent robustness and adaptability in practical applications, effectively avoiding the negative impact of the complex environment on the consistency of the test results in the real ship test at sea. By improving the consistency of the scenarios, the virtual reality fusion test can help the testers verify the performance of the real ship more efficiently, greatly improve the precision and efficiency of the real ship test, and provide reliable support for the development and verification of the maritime intelligent navigation system.
5.2. Validity Analysis
Two groups of real ship test results at sea are used as comparison arithmetic examples to verify the validity of the evaluation index system. Two tests are conducted using the same scenario (
Figure 24). In this scenario, there are two target ships: TS1 forms a starboard small-angle crossing situation with OS, while TS2 forms a port small-angle crossing situation with OS. The initial distances between both TS and OS are less than 1 n-mile, constituting a Close-quarter situation.
The two tests are divided into Group A and Group B. In Group A, the OS and two target ships complete collision avoidance. In Group B, the DCPA between OS and TS 1 is 0.244 n-mile, which is less than the set threshold of 0.25 n-mile. According to the index, this result is deemed unsatisfactory for collision avoidance. The testing trajectories are shown in
Figure 25, with
Figure 25a showing the trajectory for Group A and
Figure 25b showing the trajectory for Group B.
As in
Figure 25, it is obvious that the time at which the trajectory for Group A response is faster than that for Group B.
Figure 26 shows the distance variation curves between OS and each TS in Groups A and B, respectively. It can be seen that in Group A (
Figure 26a), the distance variation curve between the OS and TS1 decreases relatively gently. In contrast, due to delayed steering, the distance between the OS and TS1 in Group B decreases rapidly (
Figure 26b), leading to a critical danger situation.
The changing of the rudder angle is compared in
Figure 27. By combining the rudder angle of the two test groups, it can be observed that the OS in Group A initiated steering significantly earlier than that in Group B, resulting in the OS in Group A starting to turn its heading earlier than that in Group B, as shown in
Figure 28. Consequently, it was able to create sufficient distance from TS1 on the starboard side, ensuring that the DCPA remained above the threshold.
After comparison and comprehensive evaluation, Group A scored 78.2279, while Group B only scored 46.1596. The score for Group A is significantly higher than Group B, indicating that this evaluation index system can quantitatively test the autonomous collision avoidance process of ships and clearly distinguish between qualified and unqualified collision avoidance outcomes.
A comparative analysis of the evaluation scores for all virtual–real fusion tests and virtual simulation tests is presented in
Figure 29.
In tests conducted under the same scenario, the scores for virtual reality fusion tests are slightly lower than those for virtual simulation tests in most cases. The main reason is that the real ship is subject to more external environmental disturbances during navigation, and its collision avoidance operations may experience a time delay due to the influence of mechanical structure and equipment maintenance conditions. Nevertheless, the score difference between virtual simulation and virtual reality fusion remains within 10 points, indicating that virtual simulation tests can realistically simulate the collision avoidance process of real ships. Practical experiments have shown that with the assistance of the virtual reality space mapping method, virtual reality fusion testing can serve as an effective validation tool for virtual simulation testing.
6. Conclusions
Based on the COLREG, we parameterize the typical testing scenarios and construct a testing scenario library. The scene-driven ship testing technology is introduced to address issues of limited encounter situations and unreasonable target ship behavior in traditional testing methods. A virtual reality space mapping method is proposed, which maps standard scenarios to real-world spaces based on the navigation parameters of real ships, thereby enhancing the consistency of the initial testing scenarios for real-ship tests. An evaluation index system for collision avoidance results is established to provide data support for a comprehensive assessment of collision avoidance algorithms. Finally, through validation, the proposed method for autonomous ship collision avoidance through virtual reality fusion testing meets the needs of real ship testing. The practical application of this method demonstrates the effectiveness in various typical scenarios during the actual collision avoidance process under different navigation conditions, addressing issues of improper pre-setting of target ship states, lack of a unified evaluation standard leading to testing scenario failures, and inaccuracies in evaluation results.
Despite achieving important findings, some limitations remain that need to be further investigated. Firstly, both the virtual simulation and virtual reality fusion tests were conducted under sea conditions of levels 0 to 1; the effectiveness of the proposed method in higher sea conditions requires further validation. Secondly, this study did not consider the effect of TS operation switching on ship collision avoidance.
Author Contributions
All authors contributed to the study. H.Z.: Conceptualization, Methodology, Software, Visualization, Writing—original draft, Writing—review and editing; M.Z.: Conceptualization, Data curation, Funding acquisition, Investigation, Supervision, Validation, Writing—review and editing; X.C.: Investigation, Conceptualization, Project administration, Supervision, Validation, Writing—original draft, Writing—review and editing; C.Y.: Conceptualization, Data curation, Formal analysis, Funding acquisition, Investigation, Project administration, Writing—review and editing; J.L.: Supervision, Validation, Writing—original draft, Writing—review and editing; B.L.: Software, Writing—review and editing; K.Z. and W.H.: Writing—review and editing. All authors have read and agreed to the published version of the manuscript.
Funding
This research was funded by the National Key Research and Development Program of China under Grant (2022YFB2602301), the Fund of Guangxi Science and Technology Program (AB23026132), the Research and Development Program of Guangxi Zhuang autonomous region (GuikeAA23062052), and the National Natural Science Foundation of China (52001243).
Institutional Review Board Statement
Not applicable.
Informed Consent Statement
Not applicable.
Data Availability Statement
The datasets presented in this article are not readily available because the data are part of an ongoing study. Requests to access the datasets should be directed to zhouhaiming@whut.edu.cn.
Conflicts of Interest
The authors declare no conflicts of interest.
References
- Huang, Y.; Van Gelder, P.; Wen, Y. Velocity Obstacle Algorithms for Collision Prevention at Sea. Ocean Eng. 2018, 151, 308–321. [Google Scholar] [CrossRef]
- Huang, Y.; Chen, L.; Van Gelder, P. Generalized Velocity Obstacle Algorithm for Preventing Ship Collisions at Sea. Ocean Eng. 2019, 173, 142–156. [Google Scholar] [CrossRef]
- Zhao, L.; Roh, M.-I. COLREGs-Compliant Multiship Collision Avoidance Based on Deep Reinforcement Learning. Ocean Eng. 2019, 191, 106436. [Google Scholar] [CrossRef]
- Chun, D.-H.; Roh, M.-I.; Lee, H.-W.; Ha, J.; Yu, D. Deep Reinforcement Learning-Based Collision Avoidance for an Autonomous Ship. Ocean Eng. 2021, 234, 109216. [Google Scholar] [CrossRef]
- Chen, X.; Ma, D.; Liu, R.W. Application of Artificial Intelligence in Maritime Transportation. J. Mar. Sci. Eng. 2024, 12, 439. [Google Scholar] [CrossRef]
- Xiao, G.; Xu, L. Challenges and Opportunities of Maritime Transport in the Post-Epidemic Era. J. Mar. Sci. Eng. 2024, 12, 1685. [Google Scholar] [CrossRef]
- Zinchenko, S.; Mateichuk, V.; Nosov, P.; Popovych, I.; Solovey, O.; Mamenko, P.; Grosheva, O. Use of Simulator Equipment for the Development and Testing of Vessel Control Systems. Electr. Control Commun. Eng. 2020, 16, 58–64. [Google Scholar] [CrossRef]
- Bakdi, A.; Glad, I.K.; Vanem, E. Testbed Scenario Design Exploiting Traffic Big Data for Autonomous Ship Trials under Multiple Conflicts with Collision/Grounding Risks and Spatio-Temporal Dependencies. IEEE Trans. Intell. Transp. Syst. 2021, 22, 7914–7930. [Google Scholar] [CrossRef]
- Bolbot, V.; Gkerekos, C.; Theotokatos, G.; Boulougouris, E. Automatic Traffic Scenarios Generation for Autonomous Ships Collision Avoidance System Testing. Ocean Eng. 2022, 254, 111309. [Google Scholar] [CrossRef]
- Kim, M.; Joung, T.-H.; Jeong, B.; Park, H.-S. Autonomous Shipping and Its Impact on Regulations, Technologies, and Industries. J. Int. Marit. Saf. Environ. Aff. Shipp. 2020, 4, 17–25. [Google Scholar] [CrossRef]
- Montewka, J.; Wróbel, K.; Heikkilä, E.; Valdez Banda, O.; Goerlandt, F.; Haugen, S. Challenges, Solution Proposals and Research Directions in Safety and Risk Assessment of Autonomous Shipping. Probabilistic Saf. Assess. Manag. PSAM 2018, 14, 16–21. [Google Scholar]
- Ringbom, H. Regulating Autonomous Ships—Concepts, Challenges and Precedents. Ocean Dev. Int. Law 2019, 50, 141–169. [Google Scholar] [CrossRef]
- Munim, Z.H.; Saha, R.; Schøyen, H.; Ng, A.K.Y.; Notteboom, T.E. Autonomous Ships for Container Shipping in the Arctic Routes. J. Mar. Sci. Technol. 2022, 27, 320–334. [Google Scholar] [CrossRef]
- Ziajka-Poznańska, E.; Montewka, J. Costs and Benefits of Autonomous Shipping—A Literature Review. Appl. Sci. 2021, 11, 4553. [Google Scholar] [CrossRef]
- Hu, L.; Naeem, W.; Rajabally, E.; Watson, G.; Mills, T.; Bhuiyan, Z.; Raeburn, C.; Salter, I.; Pekcan, C. A Multiobjective Optimization Approach for COLREGs-Compliant Path Planning of Autonomous Surface Vehicles Verified on Networked Bridge Simulators. IEEE Trans. Intell. Transp. Syst. 2019, 21, 1167–1179. [Google Scholar] [CrossRef]
- Sutulo, S.; Moreira, L.; Soares, C.G. Mathematical Models for Ship Path Prediction in Manoeuvring Simulation Systems. Ocean Eng. 2002, 29, 1–19. [Google Scholar] [CrossRef]
- Zhu, F.; Zhou, Z.; Lu, H. Randomly Testing an Autonomous Collision Avoidance System with Real-World Ship Encounter Scenario from AIS Data. J. Mar. Sci. Eng. 2022, 10, 1588. [Google Scholar] [CrossRef]
- Feng, S.; Feng, Y.; Yu, C.; Zhang, Y.; Liu, H.X. Testing Scenario Library Generation for Connected and Automated Vehicles, Part I: Methodology. IEEE Trans. Intell. Transp. Syst. 2020, 22, 1573–1582. [Google Scholar] [CrossRef]
- Wang, W.; Huang, L.; Liu, K.; Wu, X.; Wang, J. A COLREGs-Compliant Collision Avoidance Decision Approach Based on Deep Reinforcement Learning. J. Mar. Sci. Eng. 2022, 10, 944. [Google Scholar] [CrossRef]
- Bolbot, V.; Theotokatos, G.; Bujorianu, L.M.; Boulougouris, E.; Vassalos, D. Vulnerabilities and Safety Assurance Methods in Cyber-Physical Systems: A Comprehensive Review. Reliab. Eng. Syst. Saf. 2019, 182, 179–193. [Google Scholar] [CrossRef]
- Chen, X.; Chen, W.; Wu, B.; Wu, H.; Xian, J. Ship Visual Trajectory Exploitation via an Ensemble Instance Segmentation Framework. Ocean Eng. 2024, 313, 119368. [Google Scholar] [CrossRef]
- Chen, X.; Zheng, J.; Li, C.; Wu, B.; Wu, H.; Montewka, J. Maritime Traffic Situation Awareness Analysis via High-Fidelity Ship Imaging Trajectory. Multimed. Tools Appl. 2023, 83, 48907–48923. [Google Scholar] [CrossRef]
- Yang, F.; Liu, J.; Li, S.; Ma, F. Virtual-Real Interaction Tests for Functional Testing of Smart Ships. In Proceedings of the ISOPE International Ocean and Polar Engineering Conference, Virtual, 11–16 October 2020; p. ISOPE-I. [Google Scholar]
- Pedersen, T.A.; Glomsrud, J.A.; Ruud, E.-L.; Simonsen, A.; Sandrib, J.; Eriksen, B.-O.H. Towards Simulation-Based Verification of Autonomous Navigation Systems. Saf. Sci. 2020, 129, 104799. [Google Scholar] [CrossRef]
- Yunsheng, F.; Hui, S.; Guofeng, W. A Method and Application Platform of Testing Technology for Unmanned Ship. In Proceedings of the 2020 5th International Conference on Automation, Control and Robotics Engineering (CACRE), Dalian, China, 19–20 September 2020; pp. 8–14. [Google Scholar]
- Skjong, S.; Pedersen, E. Co-Simulation of a Marine Offshore Vessel in DP-Operations Including Hardware-in-the-Loop (HIL). In Proceedings of the International Conference on Offshore Mechanics and Arctic Engineering, Trondheim, Norway, 25–30 June 2017; Volume 57731, p. V07AT06A038. [Google Scholar]
- Goerlandt, F.; Kujala, P. Traffic Simulation Based Ship Collision Probability Modeling. Reliab. Eng. Syst. Saf. 2011, 96, 91–107. [Google Scholar] [CrossRef]
- Montewka, J.; Hinz, T.; Kujala, P.; Matusiak, J. Probability Modelling of Vessel Collisions. Reliab. Eng. Syst. Saf. 2010, 95, 573–589. [Google Scholar] [CrossRef]
- Hänninen, M.; Kujala, P. Influences of Variables on Ship Collision Probability in a Bayesian Belief Network Model. Reliab. Eng. Syst. Saf. 2012, 102, 27–40. [Google Scholar] [CrossRef]
- Huang, Y.; Chen, L.; Chen, P.; Negenborn, R.R.; Van Gelder, P. Ship Collision Avoidance Methods: State-of-the-Art. Saf. Sci. 2020, 121, 451–473. [Google Scholar] [CrossRef]
- Dinis, D.; Teixeira, A.P.; Soares, C.G. Probabilistic Approach for Characterising the Static Risk of Ships Using Bayesian Networks. Reliab. Eng. Syst. Saf. 2020, 203, 107073. [Google Scholar] [CrossRef]
- Perera, L.P.; Carvalho, J.P.; Guedes Soares, C. Fuzzy Logic Based Decision Making System for Collision Avoidance of Ocean Navigation under Critical Collision Conditions. J. Mar. Sci. Technol. 2011, 16, 84–99. [Google Scholar] [CrossRef]
- He, Y.; Jin, Y.; Huang, L.; Xiong, Y.; Chen, P.; Mou, J. Quantitative Analysis of COLREG Rules and Seamanship for Autonomous Collision Avoidance at Open Sea. Ocean Eng. 2017, 140, 281–291. [Google Scholar] [CrossRef]
- Xu, Q.; Zhang, C.; Wang, N. Multiobjective Optimization Based Vessel Collision Avoidance Strategy Optimization. Math. Probl. Eng. 2014, 2014, 914689. [Google Scholar] [CrossRef]
- Sun, F.; Cai, Y.; Ma, J. A Study of Test Methods and Indicators for Marine Intelligent Anti-collision strategy. Traffic Inf. Saf. 2019, 37, 84–93. [Google Scholar]
- Szlapczynski, R.; Szlapczynska, J. A Ship Domain-Based Model of Collision Risk for near-Miss Detection and Collision Alert Systems. Reliab. Eng. Syst. Saf. 2021, 214, 107766. [Google Scholar] [CrossRef]
- Cockcroft, A.N.; Lameijer, J.N.F. A Guide to the Collision Avoidance Rules: International Regulations for Preventing Collisions at Sea, 7th ed.; Elsevier, Butterworth-Heinemann: Amsterdam, The Netherlands, 2011; ISBN 978-0-08-097170-4. [Google Scholar]
- Hilgert, H.; Baldauf, M. A Common Risk Model for the Assessment of Encounter Situations on Board Ships. Ocean Dyn. 1997, 49, 531–542. [Google Scholar] [CrossRef]
- Porathe, T. Maritime Autonomous Surface Ships (MASS) and the COLREGS: Do We Need Quantified Rules or Is “the Ordinary Practice of Seamen” Specific Enough? TransNav Int. J. Mar. Navig. Saf. Sea Transp. 2019, 13, 511–517. [Google Scholar] [CrossRef]
- Meyer, E.; Heiberg, A.; Rasheed, A.; San, O. COLREG-Compliant Collision Avoidance for Unmanned Surface Vehicle Using Deep Reinforcement Learning. IEEE Access 2020, 8, 165344–165364. [Google Scholar] [CrossRef]
- Xiao, G.; Ren, B.; Tong, C.; Hong, X. A Quantitative Evaluation Method for Obstacle Avoidance Performance of Unmanned Ship. J. Mar. Sci. Eng. 2021, 9, 1127. [Google Scholar] [CrossRef]
Figure 1.
Ship initial encounter situation.
Figure 1.
Ship initial encounter situation.
Figure 2.
Encounter situation types. Ships in green constitute an encounter with OS, ships in red do not constitute an encounter or need to be analyzed.
Figure 2.
Encounter situation types. Ships in green constitute an encounter with OS, ships in red do not constitute an encounter or need to be analyzed.
Figure 3.
Relationship between the ship encounter geometric elements.
Figure 3.
Relationship between the ship encounter geometric elements.
Figure 4.
Generated scenarios as a (a) randomized DCPA value and (b) fixed DCPA values.
Figure 4.
Generated scenarios as a (a) randomized DCPA value and (b) fixed DCPA values.
Figure 5.
Generated scenarios as (a) head-on (b) crossing (c) overtaking.
Figure 5.
Generated scenarios as (a) head-on (b) crossing (c) overtaking.
Figure 6.
Multi-ship encounter scenario (a) scenario 1 (b) scenario 2 (c) scenario 3.
Figure 6.
Multi-ship encounter scenario (a) scenario 1 (b) scenario 2 (c) scenario 3.
Figure 7.
Ship collision avoidance evaluation index system.
Figure 7.
Ship collision avoidance evaluation index system.
Figure 8.
Z-shaped affiliation function.
Figure 8.
Z-shaped affiliation function.
Figure 9.
S-shaped affiliation function.
Figure 9.
S-shaped affiliation function.
Figure 10.
Trapezoidal affiliation function.
Figure 10.
Trapezoidal affiliation function.
Figure 11.
Virtual–real space mapping method.
Figure 11.
Virtual–real space mapping method.
Figure 12.
Earth coordinate system.
Figure 12.
Earth coordinate system.
Figure 13.
Ship autonomous collision avoidance test and evaluation system.
Figure 13.
Ship autonomous collision avoidance test and evaluation system.
Figure 14.
Virtual reality convergence test platform.
Figure 14.
Virtual reality convergence test platform.
Figure 15.
Virtual simulation test platform.
Figure 15.
Virtual simulation test platform.
Figure 17.
Virtual simulation test process.
Figure 17.
Virtual simulation test process.
Figure 18.
Virtual reality fusion test process.
Figure 18.
Virtual reality fusion test process.
Figure 19.
Test start point.
Figure 19.
Test start point.
Figure 20.
Test evaluation process.
Figure 20.
Test evaluation process.
Figure 21.
Comparison of the initial state of (a) virtual simulation and (b) virtual reality fusion scenarios.
Figure 21.
Comparison of the initial state of (a) virtual simulation and (b) virtual reality fusion scenarios.
Figure 22.
Comparison of initial parameters of (a) virtual simulation and (b) virtual reality fusion scenarios.
Figure 22.
Comparison of initial parameters of (a) virtual simulation and (b) virtual reality fusion scenarios.
Figure 23.
Comparative analysis of the virtual simulation and virtual reality fusion tests (a) distribution of heading deviation values, (b) distribution of bearing deviation values, and (c) distribution of initial distance deviation values.
Figure 23.
Comparative analysis of the virtual simulation and virtual reality fusion tests (a) distribution of heading deviation values, (b) distribution of bearing deviation values, and (c) distribution of initial distance deviation values.
Figure 24.
Validity analysis scenario initial encounter situation.
Figure 24.
Validity analysis scenario initial encounter situation.
Figure 25.
Comparison of collision avoidance sailing trajectories (a) Group A (b) Group B.
Figure 25.
Comparison of collision avoidance sailing trajectories (a) Group A (b) Group B.
Figure 26.
Comparison of distance variation curves (a) Group A (b) Group B.
Figure 26.
Comparison of distance variation curves (a) Group A (b) Group B.
Figure 27.
Comparison of rudder angle variation curves.
Figure 27.
Comparison of rudder angle variation curves.
Figure 28.
Comparison of heading variation curves.
Figure 28.
Comparison of heading variation curves.
Figure 29.
Comparison of scores for both tests with the same scenario.
Figure 29.
Comparison of scores for both tests with the same scenario.
Table 1.
Classification of the encounter situation.
Table 1.
Classification of the encounter situation.
| Type | Area | | | Encounter Situation |
|---|
| Head-on | A | 90°–180° | 1< or >1 | Port side head-on |
| B | 180°–270° | 1< or >1 | Starboard side head-on |
| Crossing | C | 186°–360° | 1< or >1 | Starboard side small-angle crossing |
| D | 247.5°–360° | >1 | Starboard side large-angle crossing |
| H | 0°–174° | 1< or >1 | Port side small-angle crossing |
| G | 0°–112.5° | >1 | Port side large-angle crossing |
| Overtaking | A, H | 0°–67.5° | 1< | Starboard side overtaking |
| B, C | 292.5°–360° | 1< | Port side overtaking |
| Overtaken | E | 292.5°–360° | >1 | Starboard side overtaken |
| F | 0°–67.5° | >1 | Port side overtaken |
Table 2.
Classification of initial encounter distances.
Table 2.
Classification of initial encounter distances.
| Type | Min Distance (n-Mile) | Max Distance (n-Mile) |
|---|
| Risk of collision | 1 | 6 |
| Close-quarter situation | 0.25 | 1 |
| Immediate danger | 0 | 0.25 |
Table 3.
Parameters of the real ship.
Table 3.
Parameters of the real ship.
| Parameter | Value | Unit |
|---|
| Length | 46.3 | m |
| Breadth | 7.3 | m |
| Draught | 3.1 | m |
| Displacement | 540.5 | m3 |
| Open water speed | 8.7 | knot |
| Propulsion type | Twin-propeller | - |
| Main engine power | 441 | HP |
| Max steering speed of rudder | 1.34 | deg/s |
| Max rudder angle | 35 | deg |
Table 4.
Test scenario information.
Table 4.
Test scenario information.
| Type | Encounter Situation |
|---|
| TS1 | TS2 |
|---|
| Single TS | Basic test | Scenario 1 | Head-on | - |
| Scenario 2 | Starboard overtaking | - |
| Scenario 3 | Starboard large-angle crossing | - |
| Risk test | Scenario 4 | Head-on | - |
| Scenario 5 | Starboard overtaking | - |
| Scenario 6 | Starboard large-angle crossing | - |
Double
TS | Basic test | Scenario 7 | Head-on | Starboard small-angle crossing |
| Scenario 8 | Starboard small-angle crossing | Port small-angle crossing |
| Scenario 9 | Starboard overtaking | Starboard large-angle crossing |
| Risk test | Scenario 10 | Head-on | Starboard small-angle crossing |
| Scenario 11 | Starboard small-angle crossing | Port small-angle crossing |
| Scenario 12 | Starboard overtaking | Starboard large-angle crossing |
Four
TS | Scenario 13 | TS1: Head-on;
TS2: Starboard small-angle crossing;
TS3: Port large-angle crossing;
TS4: Overtaking. |
| Disclaimer/Publisher’s Note: The statements, opinions and data contained in all publications are solely those of the individual author(s) and contributor(s) and not of MDPI and/or the editor(s). MDPI and/or the editor(s) disclaim responsibility for any injury to people or property resulting from any ideas, methods, instructions or products referred to in the content. |
© 2024 by the authors. Licensee MDPI, Basel, Switzerland. This article is an open access article distributed under the terms and conditions of the Creative Commons Attribution (CC BY) license (https://creativecommons.org/licenses/by/4.0/).


 ,
, 


