Article

Array Optimization for a Wave Energy Converter with Adaptive Resonance Using Dual Bayesian Optimization

Department of Ocean Engineering, Texas A&M University, 3145 TAMU, College Station, TX 77840, USA
*
Author to whom correspondence should be addressed.
J. Mar. Sci. Eng. 2024, 12(12), 2143; https://doi.org/10.3390/jmse12122143
Submission received: 8 October 2024 / Revised: 10 November 2024 / Accepted: 18 November 2024 / Published: 24 November 2024
(This article belongs to the Special Issue Feature Papers on Marine Energy in 2024)

Abstract

A novel Dual Bayesian optimization strategy is formed for an array of wave energy converters with adaptive resonance to maximize the annual performance through the energy conversion processes from irregular waves to electricity. A wave energy converter with adaptive resonance changes the natural frequency of power take-off dynamics for varying irregular waves, resulting in the maximum annual energy production. The first step of the two-step Dual Bayesian optimization determines the geometric layout of the array, which maximizes the first energy conversion to the total array excitation for irregular waves occurring annually. The second step optimizes the operational parameters of individual wave energy converters in the optimized array to maximize the power generation in varying sea states through simultaneous conversion to mechanical and electrical energy. The coupled hydrodynamics are solved in the frequency domain, and the power performance is evaluated by solving the Cummins’ equation in the time domain extended for multiple floating bodies, each strongly coupled with nonlinear power take-off dynamics. The proposed method is applied to a surface-riding wave energy converter, already optimized for single unit operation at individual sea states. Investigating two array layouts, linear and random, the optimized arrays after Step 1 increase the excitation spectral area by up to 40% relative to the single unit operation, indicating the synergy enhancing the first energy conversion. Subsequently, the dual-optimized linear layout attained a q-factor up to 1.13 in commonly occurring sea states, achieving improved average power generation in 60% of the evaluated sea states. The performance of the random layout exhibited the average power fluctuating along the wave spectra with a peak q-factor of 1.07. The individual adaptive resonance is confirmed in the optimized arrays, such that each surface-riding wave energy converter of both layouts adaptively resonates with the peak of the wave excitation spectra, maximizing the power generation for the different irregular waves.

1. Introduction

Large-scale applications of wave energy conversion can be considered using a wide range of wave energy converters (WECs) with various operating principles [1,2]. However, the main challenge to the commercialization of WECs is their relatively small and expensive power production compared to floating offshore wind turbines (FOWT), which are in the megawatt scale [3]. WEC arrays have been explored as a potential solution to improve power performance, reduce costs [4], and minimize fluctuations in the generated power [5], with the sizing of WECs in the array playing an important role in economically viable and efficient power absorption [6]. The hydrodynamic interaction between multiple WECs in an array can be synergistic, leading to the array producing more power than an equivalent number of standalone WECs. This is quantified by the q-factor q f , defined as the ratio between the total average power produced by the array and the average power produced by N standalone WECs [7]. The interaction is synergistic when q f > 1. Layout optimization refers to the identification of the specific layout(s) of the WEC array that maximizes the synergistic interaction between the individual WECs. The layout is typically selected from standard arrangements like in-line, staggered, triangular, and rectangular, and the parameters of the layout, such as the spacing, are optimized [8]. In layouts with the WECs linearly arranged along the wave direction, energy absorption by WECs in the front can reduce the incoming wave energy to downstream WECs, limiting their performance [9,10]. The performance of a potential layout is evaluated from the coupled hydrodynamic interaction between the WECs in radiation and diffraction, which depends on many factors, such as the WEC geometry, the positions of WECs in the array, wave frequency, and heading, limiting the possibility of using exhaustive search methods in evaluating the optimal layout. Metaheuristic optimization techniques like Genetic Algorithm (GA) [11], Differential Evolution (DE) [12], and Simulated Annealing (SA), as well as nature-inspired techniques such as Particle Swarm Optimization (PSO) [13], have been increasingly used for layout optimization [14]. The coupled hydrodynamic interaction between the WECs can be solved accurately using the Boundary Element Method (BEM), though it is time-intensive, especially for a large number of coupled bodies [15]. While much smaller than the number required during a parametric study, metaheuristic techniques still require the evaluation of a large number of potential layouts. This requires the use of approximations, such as solving the interaction only between adjacent WECs [16], spectral wave models [17], or analytical methods [18], to solve the coupled hydrodynamic interactions, speeding up the layout optimization.
However, those popular studies in layout optimization for WEC arrays have been focused on the hydrodynamic optimization without resolving the power take-off (PTO) dynamics to quantify actual power generation. They mostly limitedly solved for a single degree of freedom and assumed the WECs are fixed by strong boundary conditions, which include heaving Point Absorbers (PA) or Oscillating Surge Wave Converters (OSWC). A WEC, completely fixed to allow a single degree of freedom, can be infeasible to deploy due to the exceeding expenses and random variation of the ocean waves. Considering a floating WEC in the ocean always involves multiple degrees of freedom and nonlinear dynamics of a power take-off mechanism, which determine the power generation performance in combination; the optimal array layouts from these hydrodynamic studies with the assumptive single degree of freedom are not directly applicable to array optimization of a general WEC [19]. Moreover, most existing studies oversimplified the generator mechanism into constant spring and damping coefficients without detailing generator specifications and resolving the interaction between the generator dynamics and floating body dynamics of the WEC [18,20,21].
In this study, a Dual Bayesian optimization is formed to determine the optimum array layout for a WEC with adaptive resonance that maximizes the total average power for individual irregular sea states. The adaptive resonance sets the natural frequency of the WEC coincident with the peak of wave excitation spectrum for individual sea states, with the WEC’s dynamics nonlinearly coupled with the PTO dynamics. Based on the energy conversion process from the irregular waves to electric power, the first Bayesian optimization finds the array layout and individual vertical centers of gravity that maximize the first energy conversion to the wave excitation on an annual basis using the experimentally validated frequency-domain 3D diffraction and radiation panel method [22,23]. The second Bayesian optimization determines the optimum operational parameters, power take-off damping and stiffness coefficients, for individual sea states, which would result in the resonance adapting to the varying irregular waves and consequently the maximum average power at each irregular wave. The power is measured using time-domain simulation of wave energy conversion with multibody dynamics to resolve coupled generator dynamics [24]. The Dual Bayesian optimization is applied to the surface-riding WEC (SR-WEC), which is already optimized for single operation in the annual set of irregular waves. For the adaptive resonance, SR-WEC changes the pitch natural frequency through a combination of center of gravity and nonlinear interaction with linear generator dynamics. Considering the linear and random layouts, the optimizations for the first energy conversion to the annual wave excitation and subsequent simultaneous conversion to mechanical and electrical energy are investigated in terms of resonance and average electrical power, respectively.
The remainder of this paper is organized as follows: An overview of the optimization of the single unit SR-WEC is presented in Section 2, along with the development of the methodology for Dual Bayesian optimization. The results of the SR-WEC array optimization are discussed in Section 3. Finally, the conclusion is drawn in Section 4, summarizing the main findings of this study along with directions for future research.

2. Dual Bayesian Optimization for Array Layout Optimization

The intermediate-scale surface-riding WEC (SR-WEC) is designed to produce cost-competitive power in varying sea states [25]. The components of the intermediate scale SR-WEC, designed to produce power in kilowatts, are shown in Figure 1a. The device operates on the principle that the incident irregular waves produce pitch motion of the floating body, leading to the translator moving along the stator, which is then converted to electrical power.
The wave energy conversion from irregular waves to electric power involves multiple conversion processes. The Dual Bayesian optimization is developed along these conversions with Step 1 to maximize the first conversion from irregular waves to the excitation for the array, while Step 2 is developed to maximize the second and third conversion to mechanical and electrical energy.

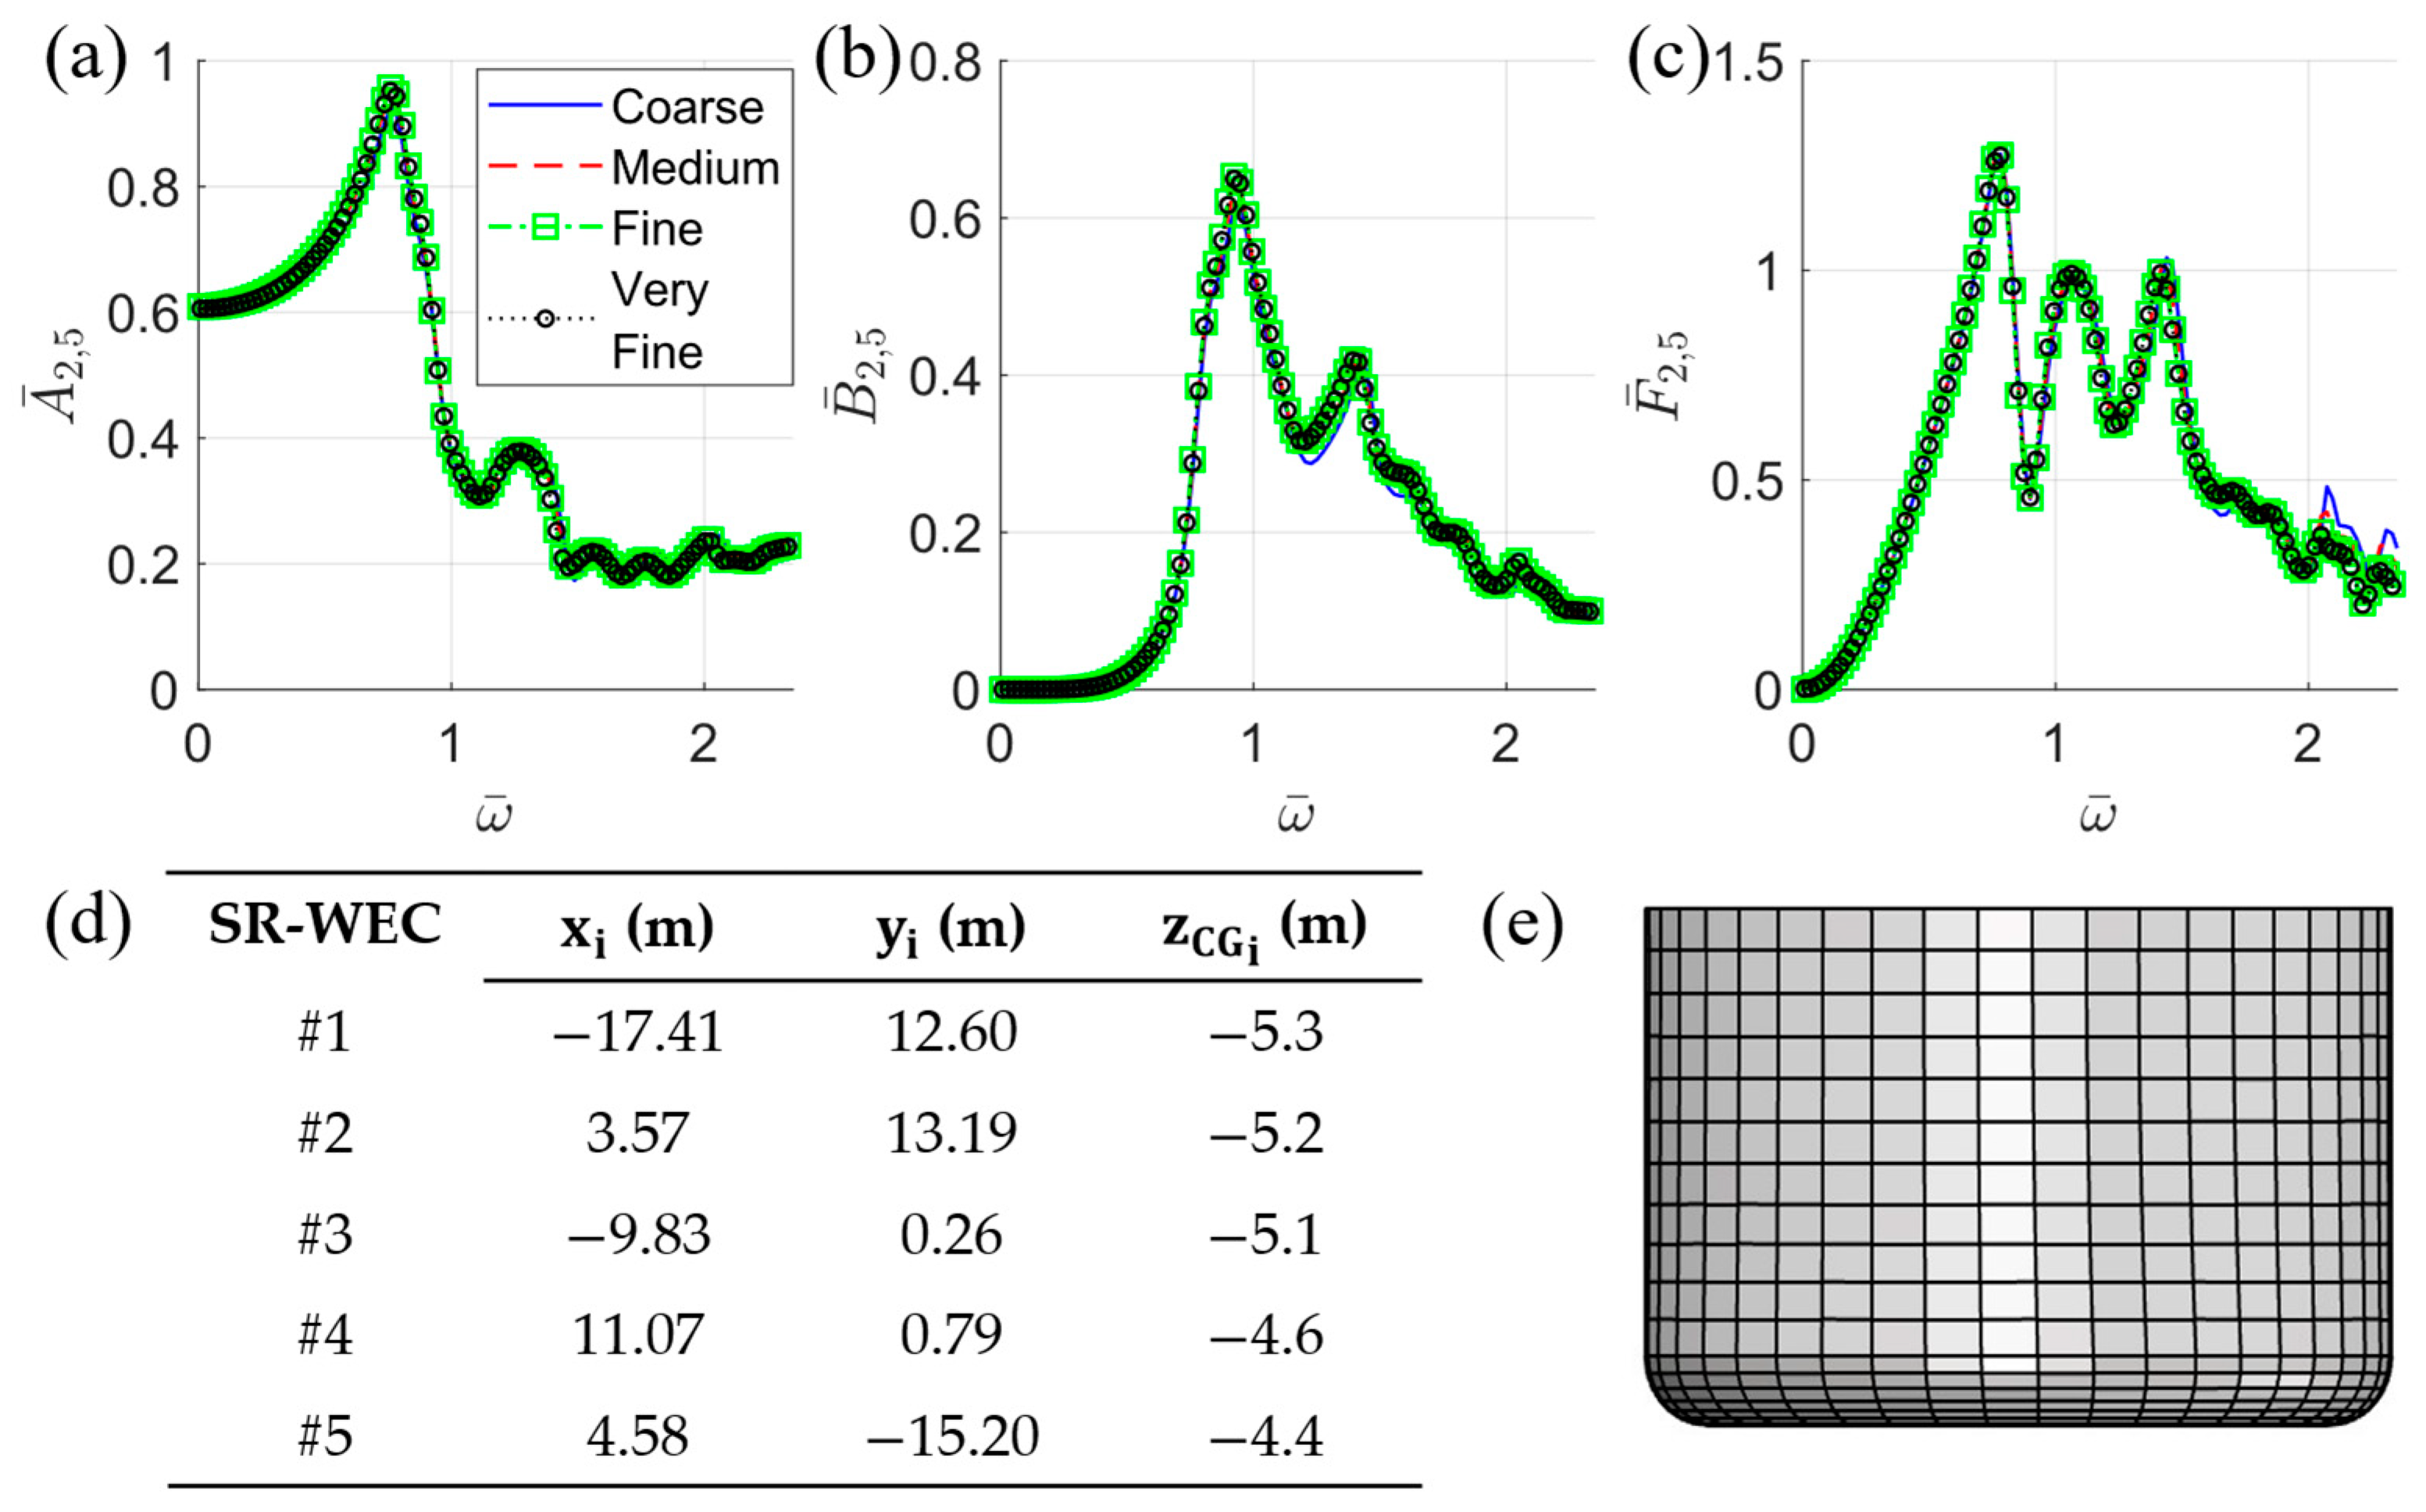
2.1. Power Performance Optimization of Single Unit SR-WEC

The dimensions of the SR-WEC’s submerged volume, which maximize the ratio of annual irregular wave excitation to the radiation damping at a potential deployment site, are selected from a parametric study with a circular cylindrical geometry. Bayesian optimization is used to identify the optimum configuration of mass units, the center of gravity, and the PTO coefficients that entail adaptive resonance maximizing the Capture Width Ratio (CWR) at individual sea states. The SR-WEC is then Froude scaled to situate its natural frequency near the commonly occurring target sea state to achieve the highest Annual Energy Production (AEP). The main dimensions and properties of the single unit optimal SR-WEC are presented in Table 1.

2.2. Dual Bayesian Optimization Strategy

Each individual WEC in an array extracts energy from irregular ocean waves through multiple conversions from irregular waves to electric power [26]. While an integrated optimization maximizing the power performance of the WEC array across all the conversions simultaneously might be ideal, its implementation will be challenging. A straightforward issue is the performance decay of optimization algorithms with a large number of parameters [27]. Additionally, each stage of the energy conversion is modeled differently and can be resource-intensive when combined, limiting such an optimization from achieving convergence in a reasonable time. A multi-step optimization, where each step optimizes one or more conversions, would be a suitable choice to maximize the performance of a WEC array. This overcomes the challenges of integrated optimization and enables the optimization of energy absorption at each step through one or more conversions.
A Dual Bayesian optimization strategy, the overview of which is presented in Figure 2, is formed to maximize the power performance of a WEC array designed along the multiple conversions to enable fast convergence. The choice of Bayesian optimization, though limitedly explored for WEC array layout optimization, is made due to its ability to rapidly optimize functions which are expensive to evaluate in terms of time and computational resources [28]. Bayesian optimization has been used for a wide range of problems for offshore structures, including mooring configuration optimization [29], riser design [30], and ocean current turbine layout optimization [31]. Bayesian optimization has been shown to converge faster, requiring a small fraction of function evaluations to arrive at the optimum compared to more common techniques such as Genetic Algorithm (GA).
In Step 1, the array layout and individual WEC centers of gravity that maximize the first energy conversion to the total annual wave excitation are determined after solving their coupled hydrodynamic interactions using the Boundary Element Method (BEM). The second and third conversions to mechanical and electrical energy are maximized by Step 2, which finds the individual optimum PTO stiffness and damping coefficients to maximize the mean power of the array at each sea state, resolving the nonlinear coupling of the floating body with the PTO.
Mathematically, the goal of Bayesian optimization is to find m parameters x * = [ x 1 * , x 2 * , x m * ] that maximize the energy E f x 1 , x 2 , x m absorbed by the array along the steps. With an initial set of inputs X s = x 1 ,   x 2 x s and corresponding outputs E f s = E f x 1 , E f x 2 , E f x s , Bayesian optimization constructs a probabilistic model of E f (the objective function) defined by a normal distribution with mean m s = [ m X s ] and covariance K s respectively. The joint probability distribution between E f x s + 1 evaluated at point x s + 1 , and E f s is given by
p E f x s + 1 ,   E f s ~ G P m s m x s + 1 , K s k k T C ,
where k is the cross-covariance matrix between X s and x s + 1 and C is the covariance function of x s + 1 . The conditional probability of E f x s + 1 given E f s is determined by
p E f x s + 1 E f s ) ~ N m * , σ * 2 , m * = m x s + 1 + k T K s 1 E f s m s ,   σ * 2 = C k T K s 1 k ,
where m * is the predicted value of E f x s + 1 at x s + 1 with uncertainty σ * 2 . The values of m * and σ * 2 are updated at every new evaluation of the objective function. The part of Bayesian optimization responsible for the rapid convergence is the process of selecting the next point to evaluate x s + 2 [32].
This is achieved through the use of an acquisition function α , which finds the new input x s + 2 that statistically advances the most over the current highest value of E f balancing between exploitation, which involves searching around the current optimal and exploration to search in new areas. The acquisition function can be tuned by the exploration ratio t σ , which makes the acquisition function focus on exploration when set to larger values.

2.3. Step 1—Annual Excitation Maximization of WEC Array

Each individual WEC in an N-WEC array modifies the wave field around it due to diffracted and radiated waves, which are superposed with each other, producing coupled hydrodynamics loads that affect the motion of the other WECs in the array. For an array with the same submerged volume dimensions, the coupled hydrodynamic loads depend on the layout, degrees of freedom, frequency ω , and the heading β .
This interaction can be represented in Equation (3), where A i j ω ,   B i j ω are the added inertia and radiation damping acting on the ith WEC due to the jth WEC, with the off-diagonal terms specifying the coupled interaction between them. The excitation loads for each WEC are given by F i ( ω ). The ith WEC’s inertia matrix, hydrostatic restoring matrix, and motions are denoted by M i i , K i i , and X i , respectively. Correspondingly, the velocity and acceleration vectors are X i ˙ and X i ¨ . The coupled hydrodynamic coefficients of the WEC array are obtained from the BEM solution.
M 11 + A 11 ω A N 1 ω N 1 A 1 N ω M N N + A N N ω X ¨ 1 X ¨ N + B 11 ω B N 1 ω B 1 N ω B N N ω X ˙ 1 X ˙ N + K 11 0 0 K N N X 1 X N = F 1 ω F N ω .
The first energy conversion from irregular waves to excitation can be quantified for the WEC array by the total excitation spectral area for individual WECs. In unidirectional irregular waves defined by a spectrum S i j ω with parameters of significant wave height H s , i and peak period T p , j , the total excitation spectral area is given by
A F , n , N i j = k = 1 N ω m i n ω m a x F k , n ω 2 S i j ω d ω ,
where F k , n ω is the excitation load for the kth body in the n th degree of freedom. The irregular waves are defined using the JONSWAP (Joint North Sea Wave Project) spectrum S i j ( ω ) [25] given below by
S i j ω = 1 0.287 ln γ 5 16 H s , i 2 ω p , j 4 ω 5 exp 5 4 ω ω p , j 4 γ exp 0.5 ω ω p σ ω p 2 ,
where σ is the spectral width parameter that is 0.07 for ω ω p and 0.09 for ω > ω p . The peak enhancement factor γ depends on the wind characteristics. The value of γ in fully developed seas when the wind blows for a long period over a wide area of fetch length is 1, transforming Equation (5) into the Pierson–Moskowitz (PM) spectrum, while it is greater than 1 for partially developed seas in fetch-limited or storm conditions. The value of γ is assessed as a function of H s , i and T p , j [33]. Defining R i j = T p , j / H s , i , the value of γ is calculated as
γ = 5 exp 5.75 1.15 R i j 1    R i j 3.6 3.6 < R i j < 5 R i j 5 .
The wave climate at a deployment site is represented by a resource characteristic bin, which quantifies the annual occurrence of sea states. The excitation spectral area in Equation (4) is weighted by the annual occurrence of the sea state O c c i j and summed up along all the H s , i and T p , j values to obtain a representative annual excitation given by
A E x c , n = i = 1 N H s j = 1 N T p A F , n , N i j O c c i j % 100 .
The coupled interactions in a WEC array are primarily dependent on positions ( x i ,   y i ) and the centers of gravity z C G , i of the individual WECs within the array.

2.4. Step 2—Power Performance Optimization of WEC Array

The dynamics of an N-WEC array, where each WEC can oscillate in six degrees of freedom, can be solved in the time domain by the Cummins’ equation given as
M i j + A i j X j ¨ t + 0 t K i j r t τ X j ˙ τ d τ + F j v i s t + F j h y t = F j e t + F j e x t t ,      i , j = 1 , 6 N ,
where M i j and A i j are the mass matrix and the added inertia matrix at infinite frequency, K i j r is the retardation function representing the radiation damping loads, F j v i s t and F j h y (t) are the viscous damping and hydrostatic restoring loads, F j e t are the excitation loads, and F j e x t are the additional loads on the body, such as mooring and PTO loads [34,35]. The added inertia, radiation damping, excitation, and hydrostatic restoring loads are obtained from the hydrodynamic coefficients in Equation (3) evaluated in BEM for WECs coupled in the array.
The PTO mechanism can be represented as the linear motion of the translator locked along the stator, from Figure 1a, with the single degree of freedom between them specified by a prismatic joint [36]. The stator applies a variable PTO force on the translator, known as reactive damping, where the force has two terms proportional to the relative translator displacement ξ m and velocity ξ ˙ m , respectively. The instantaneous power is given by
P t = F P T O × ξ ˙ m = K P T O ξ m ξ ˙ m C P T O ξ m 2 , P ¯ = C P T O T 0 t t + T 0 ξ m 2 τ d τ .
The instantaneous power P t has two components—the reactive component associated with the PTO stiffness K P T O and the active power, which is associated with damping C P T O . While the reactive component averages out to zero, the mean power absorbed by the WEC is the active component averaged over a long T 0 [37].
For each WEC, the coupled dynamic equations between the floating body and the translator include the translator motions, and PTO force from Equation (9), hydrodynamic and hydrostatic coefficients including the center of gravity from Equation (3). The motion of the floating body in each degree of freedom is coupled to the remaining degrees of freedom by off-diagonal terms. The matrix equation includes higher-order terms representing nonlinearities. The dynamic equation of the translator also includes the accelerations of the floating body [38]. The power absorbed by the PTO is obtained by solving these coupled equations. Step 2 of the Dual Bayesian optimization determines the operational parameters that optimize the second and third energy conversion to mechanical and electrical power simultaneously. For a sea state, the q-factor is defined as
q f = k = 1 N P ¯ k N P ¯ u n i t ,
where P ¯ k is the mean power produced at the optimal operational coefficients identified after Step 2 of Dual Bayesian optimization for the kth WEC in the N-WEC array and P ¯ u n i t is the corresponding mean power produced by a single unit optimal WEC.

3. SR-WEC Array Layout and Performance Optimization

Dual Bayesian optimization is applied to the unit optimal SR-WEC for two different layouts, linear and random, each comprising five SR-WECs.
The linear layout is a standard symmetric arrangement along the y -axis, as shown in Figure 3a. Conversely, the SR-WECs in the random layout can be positioned anywhere within a 1600 m 2 square region, with a minimum distance constraint enforced to keep the centers of any two individual SR-WECs separated by at least 14 m, shown in Figure 3b.

3.1. Identification of Optimal Array Layout

The SR-WEC #1–#5 in the linear layout are located at coordinates (0, 0), (0, ± s a ) and (0, ± 2 s a ), where s a is the array spacing. The remaining parameters include the common vertical center of gravity z C G for the SR-WECs #1 and #2, as well as for SR-WECs #4 and #5, resulting in a total of four variables to be optimized for the linear layout, including the vertical center of gravity for SR-WEC #3. In the random layout, the position of each individual SR-WEC is defined by the coordinates of its center ( x i ,    y i ) and its vertical center of gravity z C G i , totaling 15 variables to be optimized.
Both optimizations are run for unidirectional waves with heading β = 0 ° at the deployment site with the resource characterization bin at (31.887 N, 74.921 W) off the coast of North Carolina [25]. The objective function to be optimized for both arrays is the annual total representative pitch excitation A E x c , 5,5 from Equation (7). The variables and the parameters of the Bayesian optimization in Step 1 of the Dual Bayesian optimization are presented in Table 2.
The coupled hydrodynamic coefficients are evaluated in the first-order frequency domain simulation with Capytaine v2.2.1, the open-source BEM program implemented in Python [39]. Four panel models of the SR-WEC, with 277, 559, 1149 and 1728 panels, respectively, are constructed to check the convergence of hydrodynamic coefficients with the lower-order panel method. A test layout is constructed, with the varying individual SR-WEC locations and centers of gravity listed in Figure 4d. The coupled hydrodynamic coefficients of the test layout are evaluated for each of the four models in deep water with unidirectional waves in the head sea condition ( β = 0 ° ), with a common lid mesh to resolve the effects of irregular frequencies.
The following hydrodynamic coefficients are non-dimensionalized:
ω ¯ = ω R / g , A ¯ k , 5 ω = A k , 5 ω ρ R 5 , B ¯ k , 5 ω = B k , 5 ω ρ R 5 ω ,   F ¯ k , 5 ω = F k , 5 ω ρ g A w R 3 ,
where the bar denotes the non-dimensionalized quantity, R is the radius of the single unit SR-WEC, ρ is the water density, g is the acceleration due to gravity, and k is the index of the SR-WEC in the array. Figure 4a–c show the non-dimensionalized added inertia, radiation damping, and pitch excitation moment for SR-WEC #2 in the test layout with the non-dimensionalized frequency ω ¯   [0, 2.35]. Although the coarse and medium panel models show a reasonable match in the hydrodynamic coefficients at low ω ¯ , they vary from the converged hydrodynamic coefficients in the ω ¯ > 1 range. The fine mesh in Figure 4e converges across all values of ω and is chosen for the Bayesian optimization in Step 1.
The maximum value of the objective function A E x c , 5,5 is shown in Figure 5a as a function of the number of iterations for both layouts. With different optimal values of the maximum objective function, both cases rapidly converge very close to the optimum within 30 iterations while continuing to improve marginally in additional iterations. While the maximum objective function for the linear layout is around 37.3% larger than the corresponding value for the random layout, the effectiveness of each layout can vary across different sea states. The optimal array placement for the linear layout in Figure 5b has the spacing s a of 13.01 m. For the optimal random layout in Figure 5c, the SR-WECs #2 and #4 will partially absorb some of the incoming wave energy in a head sea condition, reducing the incident wave energy to SR-WECs #1 and #5, leading to a shadowing effect which can strongly influence the overall power performance, and subsequently the q-factor in Step 2 of the Dual Bayesian optimization [40].
Of the evaluated potential layouts, the 40 with the largest value of the objective function A E x c , 5,5 , independently normalized to a [0, 1] range for each layout, are analyzed to assess the role of individual inputs on the objective function. In Figure 6a, the normalized objective function A E x c , 5,5 is shown as a function of z C G for the three center of gravity variables in the linear layout, while the normalized objective function for the random layout is evaluated as a function of z C G for each individual SR-WEC in Figure 6b.
The increasing values of the normalized objective function with z C G in the range [−5.5, −5] m for all three variables in the linear layout indicates that the annual representative excitation is maximized with a lower vertical center of gravity, resulting in a stable configuration with a larger pitch restoring coefficient. The value of the objective function for the random layout in Figure 6b is marginally affected by the lower z C G .
Similarly, the normalized objective function is evaluated as a function of the array spacing s a for the linear layout and array coordinates x i and y i for the random layout in Figure 7a–c, respectively. In Figure 7a, the normalized objective function is maximized at the minimum spacing s a of 13 m, suggesting that the close positioning of the SR-WECs in the linear layout increases the annual representative excitation due to synergistic interaction. However, the objective function for the random layout has no optimal positions, varying strongly based on the position of the individual SR-WECs within the layout, as shown in Figure 7b,c.
The performance of the optimal layouts in individual sea states can be measured using a non-dimensional ratio q E S A which is defined as
q E S A = A F , 5,5 i j 5 × A F , 5,1 i j ,
where the total pitch excitation spectral area A F , 5,5 i j at sea state defined by the spectrum S i j ω is normalized by the corresponding area for the five single unit WECs. A q E S A greater than one indicates that the array has positive synergistic interaction.
The q E S A is evaluated in 15 sea states, with H s at 1.25, 2.25, and 3.25 m, and T p varying from 4.06 s to 8.70 s, described by a JONSWAP spectrum in Equation (5) with the peak enhancement factor γ calculated by Equation (6). The value of the q E S A is shown as a function of T p for the optimal linear and random layout in Figure 8a and Figure 8b, respectively. In both cases, the variation of H s affects the value of q E S A limitedly, due to the varying value of γ at each individual sea state. Along the peak period from 4.06 to 8.7 s, the q E S A increases from 0.91 to its maximum value of 1.40 in the optimal linear layout. For the optimal random layout, the minimum q E S A of 0.62 is obtained at a T p of 4.06 s while the values at the remaining peak periods are close to 1.
The absolute difference between the pitch excitation moment of the individual SR-WECs and the corresponding moment of the single unit SR-WEC are shown in Figure 8c,d for the optimal linear and random array. The individual SR-WECs in the linear layout have a larger excitation moment in the frequency range up to 1.10 rad/s, resulting in positive synergy at T p   6.38 s. In the range between 1.1 and 1.6 rad/s, the excitation moment is marginally smaller than the single unit SR-WEC results in the q E S A below 1. For the random layout, the positive synergistic zone, coincident with the higher pitch excitation moment, is comparatively narrow, between 0.9 and 1.4 rad/s. The limited overlap with steep waves, especially at T p of 4.06 s, results in a q E S A of 0.62. The shadowing effect further limits the q E S A to a maximum of 1.13, contrasting with the linear layout with a maximum q E S A of 1.40.

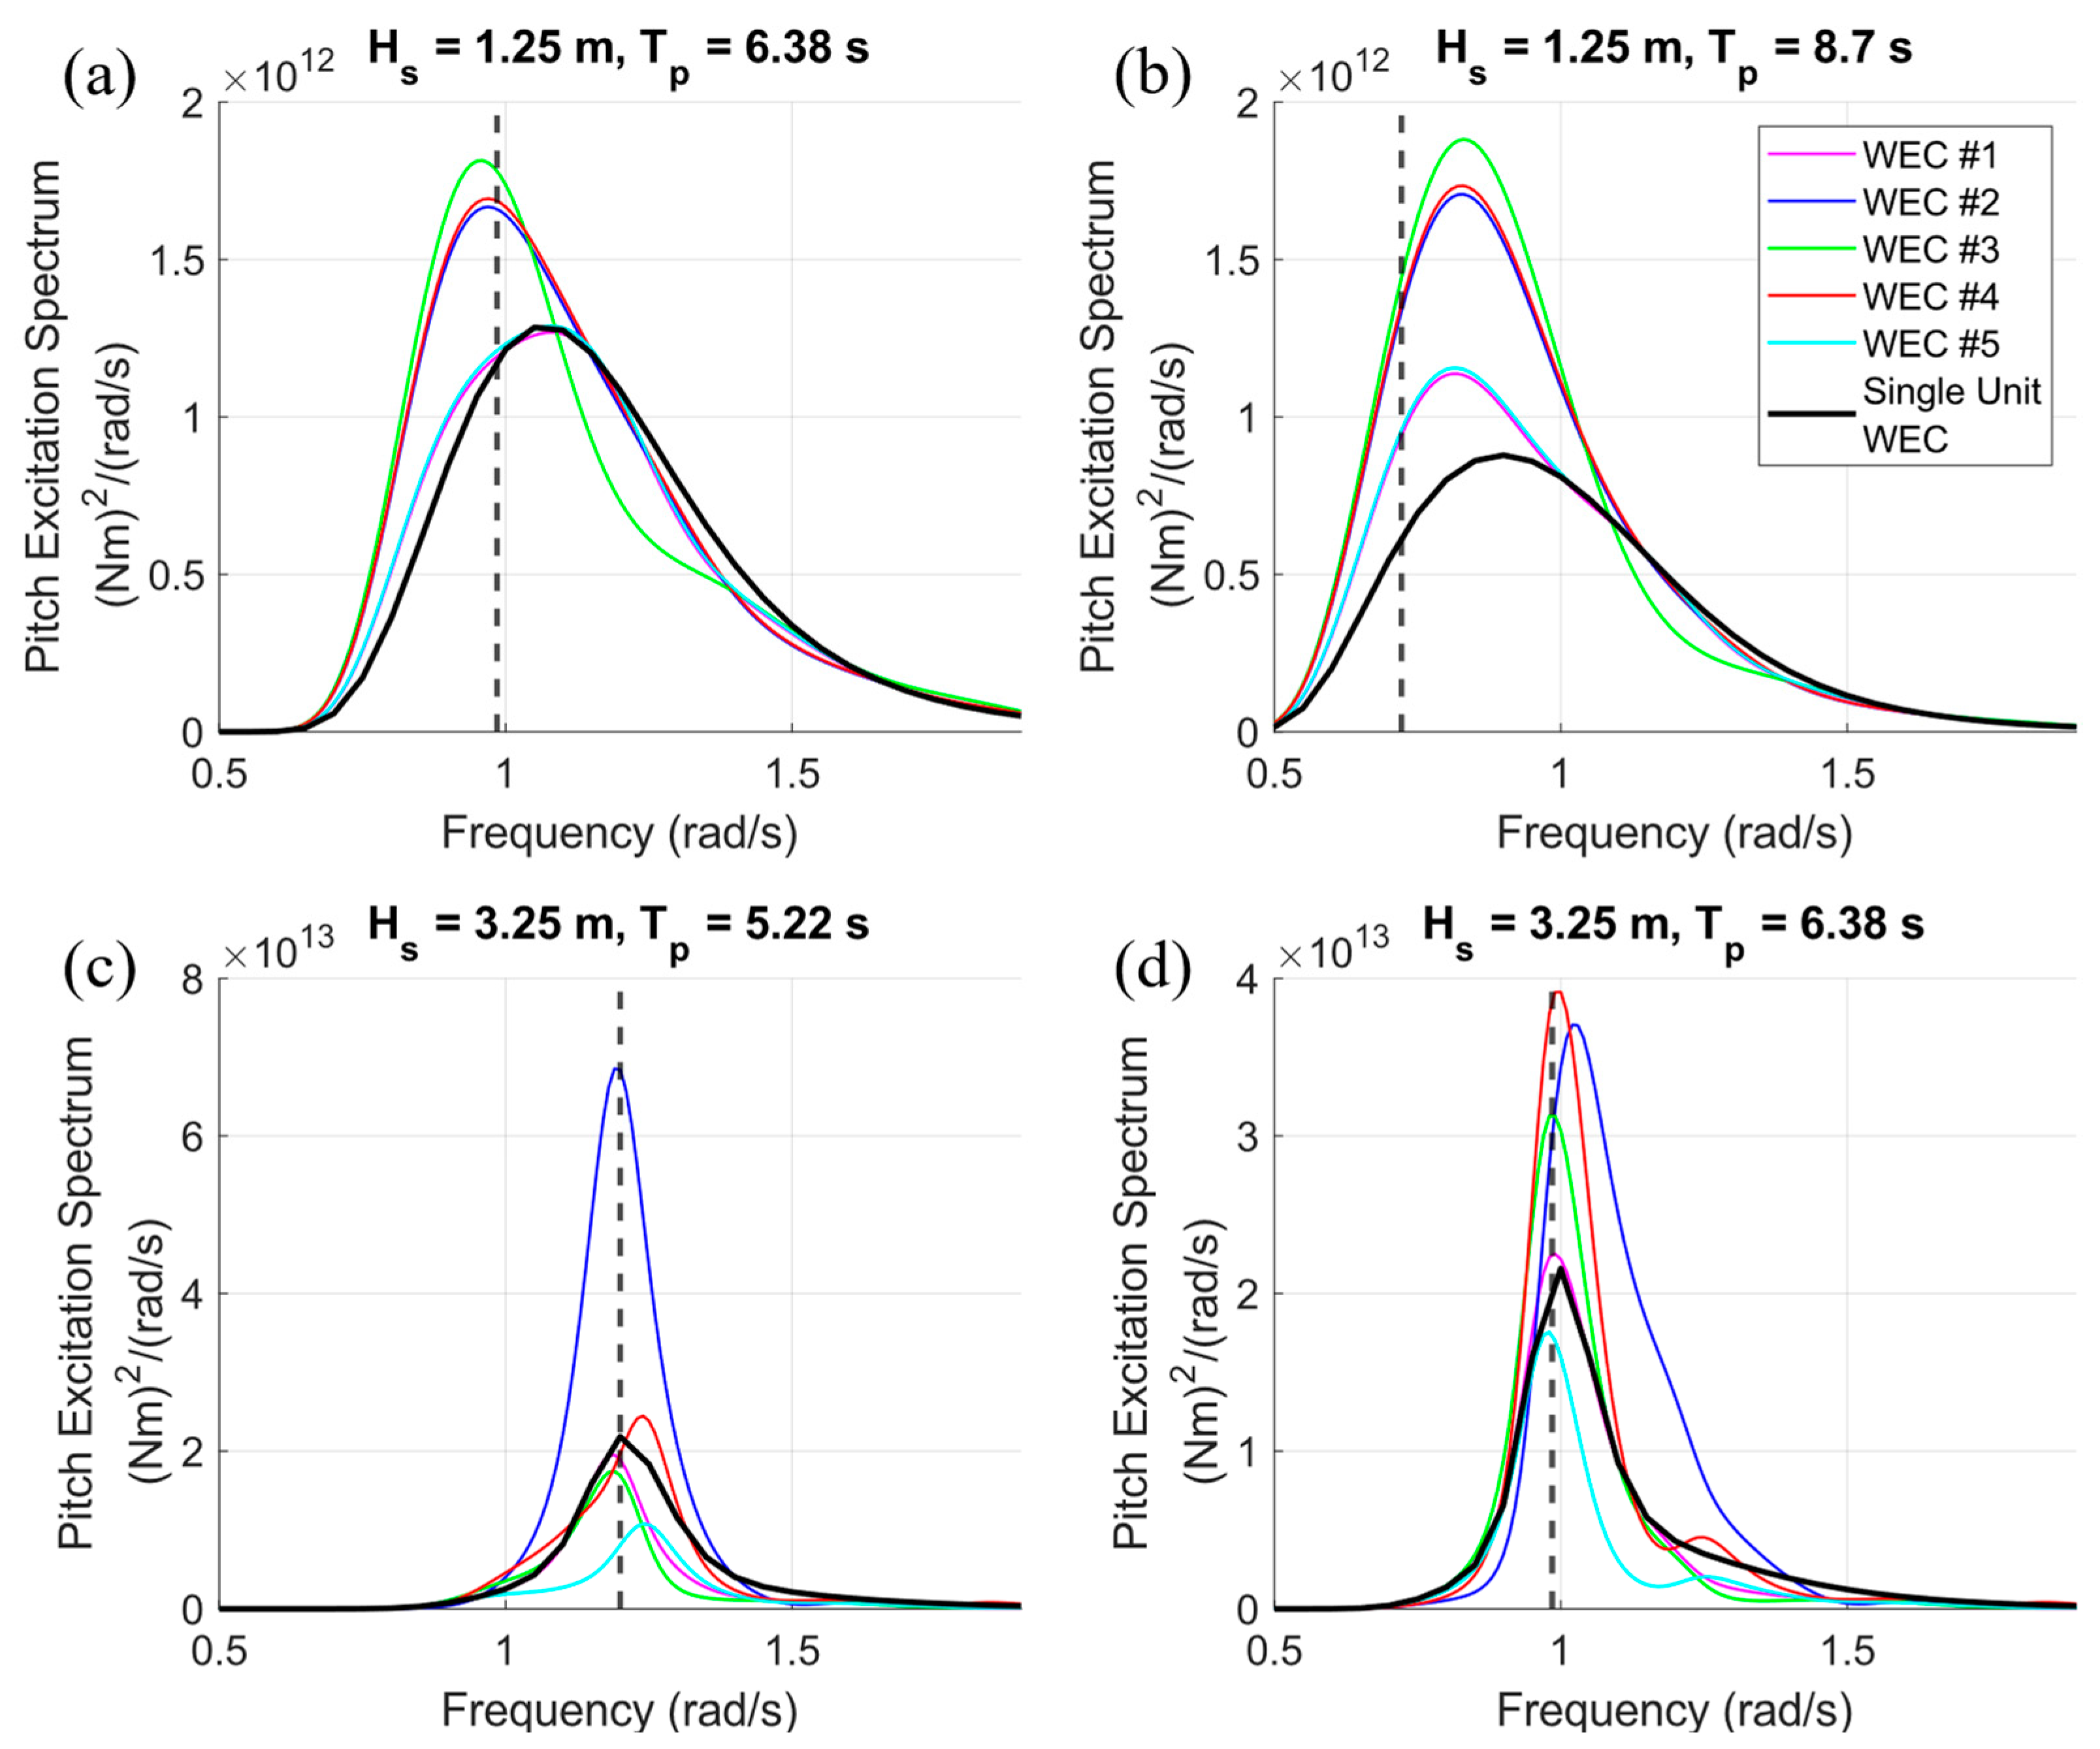
3.2. Power Performance Maximization for Optimal Array Layout

The optimal array placement and the individual centers of gravity that maximize the total annual pitch excitation at the deployment location are evaluated in Step 1 of Dual Bayesian optimization in Section 3.1. A positive synergistic interaction with a q E S A > 1 is obtained in a number of sea states for the optimal linear and random layouts. Step 2 identifies operational parameters to maximize power absorbed by the optimal arrays.
The optimum operational parameters for both layouts are investigated at five T p values ranging from 4.06 s to 8.7 s, corresponding to ω p from 0.72 to 1.55 rad/s. The effect of H s variation is investigated for the random layout alone, with H s = 1.25 m, 2.25 m and 3.25 m, with the optimal linear layout optimized at H s = 1.25 m. The input sea state is represented by JONSWAP spectra from Equation (5) with significant wave height H s , peak period T p with the peak enhancement parameter γ defined by Equation (6). The objective function to maximize is the total mean power absorbed by all the SR-WECs. The variables and parameters of Step 2 of the Dual Bayesian optimization are shown in Table 3. An initial ramping period of 300 s is excluded from the power calculation for every iteration of Bayesian optimization.
In the linear layout, the PTO coefficients of SR-WECs #1 and #2 are identical to each other, and the PTO coefficients of SR-WECs #4 and #5 are similarly identical, leading to six variables. Each individual SR-WEC in the random layout has a different PTO stiffness K P T O and damping C P T O . All the SR-WECs in both layouts have the viscous damping coefficients set to 3% of critical damping of the single unit optimal SR-WEC in the head sea condition. Given the substantial time and computational resources required for dynamic solvers such as MoorDyn, a spring-damper mooring force is applied to each SR-WEC in the surge direction with stiffness K m o o r = 1800 N/m and damping C m o o r = 0   N s / m [35].
The q-factor of the dual-optimized arrays for all the sea states is presented in Figure 9a. The optimal PTO coefficients identified for the dual-optimized arrays at the individual sea states are presented in Table A1, Table A2, Table A3 and Table A4 for both layouts. For the optimal linear layout, q f mostly follows along the trend of q E S A with T p . At 4.06 and 5.22 s, the q f is less than 1, while being greater than or equal to 1 in the remaining T p values. The maximum q f is 1.128 at 8.7 s. indicating around 13% more power absorbed compared to equivalent single unit SR-WECs. Given that the deployment site has the most waves occurring at this sea state, synergistic interaction can strongly impact the AEP. Similarly, the q-factor for the dual-optimized random layout follows q E S A along T p , with the lowest q f at T p of 4.06 s and the highest q f at 6.38 s. While marginal along other H s , the q f of the dual-optimized random layout increases with H s at 6.38 s.
This is due to the changing spectral shape caused by the variation of γ along H s . At a H s value of 1.25, 2.25, and 3.25 m, the corresponding values of γ from Equation (6) at T p of 6.38 s are 1, 2.36, and 5, making the wave spectrum shape increasingly narrower, as shown in Figure 9b. With narrower spectra, the excitation spectrum for all the SR-WECs can coincide with the positive synergy zone around ω = 1 rad/s while simultaneously limiting the effects of the lower magnitude of excitation in the 1.5 < ω < 2 rad/s range, as seen in Figure 8d.
Compared to the q E S A with a maximum value of 1.40, the corresponding highest value of q f is 1.13. The difference between these shows that the synergistic interaction of the array can be overestimated in the existing hydrodynamic optimization without resolving the nonlinearly coupled interactions with the generator dynamics to find the actual electrical power.

3.3. Power Performance and Adaptive Resonance in Time Domain for Optimal Array Layouts

The motions and power of the individual SR-WECs of dual-optimized linear layout are analyzed at H s = 1.25 m and T p of 6.38 s and 8.7 s, while the corresponding data are evaluated at H s = 3.25 m and T p = 5.22 s and 6.38 s for the dual-optimized random layout. The mean power of individual SR-WECs as a fraction of the single unit optimal SR-WEC power is shown in Figure 10 for all four sea states. In Figure 10a, SR-WECs #2 and #4 produce 7% and 8% more power than a single unit SR-WEC, while the underperformance of the remaining SR-WECs limits the q f to 1. At a T p of 8.7 s, the q f of 1.128 is similarly not distributed equally. All the individual SR-WECs outperform the single unit SR-WEC, with the SR-WECs #2–#4 producing almost 20% more.
The contribution of individual SR-WECs to the q f in the dual-optimized random layout is more varied. In Figure 10c,d, the shadowing of SR-WECs #1 and #5 limits their contribution to the q f . At 5.22 s, the 56% increase in the power absorbed by SR-WEC #2 is offset by the underperformance of the other SR-WECs, leading to a q-factor of 0.845. At a T p of 6.38 s, the SR-WECs #2–#4 produce 36%, 20%, and 36% more than the single unit optimal, entailing a positive synergy with a q f of 1.067. Excluding the contribution of SR-WECs #1 and #5, the q f at 5.22 s and 6.38 s increases to 1.120 and 1.306, quantifying the negative impact due to the shadowing effect.
In the multiple energy conversions from irregular waves to electrical power, the maximum electrical power is obtained by the SR-WECs resonating at the peak frequency of the wave excitation spectra ω p E to extract the largest motion. The wave excitation spectra for individual SR-WECs for dual-optimized linear and random layouts are shown in Figure 11 at the same sea states.
For the dual-optimized linear layout, the power spectral density of the individual SR-WECs’ pitch and sliding displacement is compared to the corresponding values of the single unit optimal SR-WEC in Figure 12. At T p values of 6.38 s and 8.7 s, the pitch displacement response spectra entail adaptive resonance near ω p E . The sliding displacement, while matched with ω p E at 6.38 s, has the peak of the response spectra of the individual WECs at 8.70 s away from ω p E , as shown in Figure 12d.
Similarly, the power spectral density of the SR-WECs’ pitch and sliding motion is compared to the corresponding values of the single unit SR-WEC for the dual-optimized random layout in Figure 13. The pitch and sliding response spectral peaks of almost all the individual SR-WECs are close to ω p E at T p = 5.22 and 6.38 s. However, the pitch response peak for the SR-WEC #5 at T p = 5.22 s in Figure 13a is located at around 1.05 rad/s, which is away from its ω p E by almost 0.30 rad/s.
Correspondingly, SR-WEC #5 has smaller pitch and sliding displacement compared to the single unit optimal, as in Figure 14e. The effect of the strong pitch excitation spectra for SR-WEC #2 is visible in Figure 14b, with the larger pitch amplitude transferring more energy to the sliding of the translator relative to the single unit optimal SR-WEC.
As the first step of the Dual Bayesian optimization maximizes the total annual excitation for a given wave climate, the dual-optimized linear layout has a q-factor > 1 in sea states with T p   6.38 s, which coincides with the high-occurrence sea states. Furthermore, the sea states with q-factor < 1 occur limitedly, leading to an improvement in the AEP.
The Levelized Cost of Energy (LCOE) is the minimum unit cost of energy for investors to recover their investment and receive a return [41]. Apart from the AEP, the main factors affecting the LCOE are the total costs, divided into Capital Expenditure (CapEx) and Operational Expenditure (OpEx), which are evaluated systematically based on various factors such as the site characteristics, WEC performance and design, and the topology of the generator. The CapEx and OpEx of an individual WEC in an array can be lower than the single unit cost due to economies of scale and shared costs. The improvement in AEP due to positive synergy combined with the lower costs can improve the LCOE of the SR-WEC array, leading to faster commercialization.

4. Conclusions

A novel Dual Bayesian optimization is formed to maximize the annual power performance of an array for WECs with adaptive resonance following the energy conversion processes from irregular waves to electrical power. A WEC with adaptive resonance relocates the natural frequency of the power take-off dynamics to match with the peak of the wave excitation spectra at individual sea states. This first step of the Dual Bayesian optimization maximizes the first conversion from irregular waves to the annual wave excitation loads in terms of array layout and the centers of gravity of individual WECs. The second step determines the optimum PTO parameters that entail adaptive resonance and subsequently maximize the array’s total average power at individual sea states. The hydrodynamics of multiple WECs are solved with the bodies coupled to each other, and the average power is obtained by the time domain simulation solving the Cummins’ equation, extended to multiple bodies individually coupled with the nonlinear power take-off dynamics.
Applying the Dual Bayesian optimization to surface-riding WEC (SR-WEC), already optimized to produce average kilowatt power in single unit operation, linear and random layouts were investigated for five SR-WECs. The first optimizations of the array positions and centers of gravity in both layouts reached efficiently within 25% of the total iterations. The larger number of variables, along with the high exploration ratio, contributed to a more extensive search for the optimal random layout, leading to a different arrangement not converging to the optimal linear layout. Comparing the synergistic performance of the optimal arrays using the non-dimensional ratio q E S A between the total pitch excitation spectral area for all SR-WECs in the array and the multiplication of the single unit operation, the optimized linear layout presents a q E S A > 1 in 60% of the sea states with a T p from 6.38 s to 8.7 s, while q E S A < 1 at the lower T p of 4.06 s and 5.22 s. The optimized random layout has a q E S A varying from 0.62 at T p of 4.06 s to 1.13 at 6.38 s, while other sea states have a q E S A of around 1. Carrying over the optimal array layouts secured from the first optimization, the second optimization determined the optimum power take-off damping and stiffness coefficients for individual WECs at each sea state. The linear layout attains q-factor q f   1 for 3 out of 5 evaluated sea states, reaching the maximum of 1.128 at T p = 8.7 s. Meanwhile, the q-factor for the random layout fluctuates along both H s and T p with underestimations below 0.6 and 0.9 at T p of 4.06 and 5.22 s for all H s values. Note that the optimized random layout has a q f above 1, 1.067 only at H s = 3.25 m and T p = 6.38 s. Furthermore, the variation of the enhancement parameter γ in the function of H s and T p entailed the higher q f for larger γ .
Analyzing the performance of WECs in the array in specific sea states, the shadowing effect on SR-WECs #1 and #5 in the optimized random layout limited their power production and increased variation within the array. In the optimized linear layout, the individual SR-WECs produced between 94% and 121% of the single unit optimal, exhibiting marginal difference at T p of 6.38 and 8.7 s. In both optimized layouts, the individual SR-WECs adaptively resonate with the peak of the wave excitation spectra ω p E at different T p , which presents the maximum conversion to the mechanical energy by the adaptive resonance and then the conversion to the electrical power for each sea state.
The present study formed a new method to maximize the power production of an array of WECs in unidirectional waves along the wave energy conversion. The method can be adapted to enhance the performance of WECs with the coupled generator dynamics for optimal array layouts identified through other methods. To obtain cost-competitive array operation in real ocean waves, the minimum Levelized Cost of Energy (LCOE) needs to be attained in irregularly varying multidirectional waves. As the minimum LCOE can be achieved by maximizing the annual energy production and minimizing the total costs, the next study can be to extend the Dual Bayesian optimization method to maximize the total excitation of the array in multiple wave headings and to incorporate the Capital Expenditure and the Operational Expenditure of the array to be minimized through the process. Furthermore, the influence of Bayesian optimization parameters on the optimal array layout and performance, along with the effect of symmetrical and other structured array layouts, such as triangular, can be considered for research in the future. For SR-WECs, or a similar WEC that include the directionality of the power take-off dynamics, the optimum array operation in multidirectional seas would entail a weathervane mechanism facing the direction of the incoming waves with the majority of the energy, which can be investigated in the future studies.

Author Contributions

Conceptualization, H.K.; Methodology, A.M. and H.K.; Software, A.M.; Validation, A.M. and H.K.; Formal analysis, A.M. and H.K.; Investigation, A.M. and H.K.; Writing—original draft, A.M.; Writing—review & editing, H.K.; Supervision, H.K.; Project administration, H.K.; Funding acquisition, H.K. All authors have read and agreed to the published version of the manuscript.

Funding

This research is supported by a U.S. DOE EERE WPTO Project, DE-EE0008630.

Institutional Review Board Statement

Not applicable.

Informed Consent Statement

Not applicable.

Data Availability Statement

The numerical data presented in this study are available upon request from the corresponding author at the author’s discretion.

Acknowledgments

Portions of this research were conducted with the advanced computing resources provided by Texas A&M High-Performance Research Computing.

Conflicts of Interest

The authors declare no conflict of interest.

Appendix A

The optimal PTO stiffness K P T O and damping C P T O obtained from Step 2 of the Dual Bayesian optimization are presented in Table A1 for the linear layout at H s = 1.25 m.
Table A1. Optimal PTO stiffness K P T O (kN/m) and damping C P T O (kN/(m/s)) for the individual SR-WECs in a linear layout at H s = 1.25 m.
WEC H s = 1.25 m4.06 s5.22 s6.38 s7.54 s8.70 s
SR-WEC 1 K P T O 45.8627.2334.1432.8031.04
C P T O 14.1518.3519.3725.3916.83
SR-WEC 2 K P T O 45.8627.2334.1432.8031.04
C P T O 14.1518.3519.3725.3916.83
SR-WEC 3 K P T O 39.4714.7144.0135.5132.54
C P T O 12.1517.3711.9744.2119.14
SR-WEC 4 K P T O 41.7125.2834.5331.3230.41
C P T O 8.6716.8624.9914.3319.23
SR-WEC 5 K P T O 41.7125.2834.5331.3230.41
C P T O 8.6716.8624.9914.3319.23
Similarly, the optimal PTO stiffness K P T O and damping C P T O obtained from Step 2 of the Dual Bayesian optimization are presented for the random layout in Table A2, Table A3 and Table A4 at H s of 1.25 m, 2.25 m and 3.25 m, respectively.
Table A2. Optimal PTO stiffness K P T O (kN/m) and damping C P T O (kN/(m/s)) for individual SR-WECs in a random layout at H s = 1.25 m.
WEC H s = 1.25 m4.06 s5.22 s6.38 s7.54 s8.70 s
SR-WEC 1 K P T O 39.8514.5536.39.559.63
C P T O 22.5916.3128.35657.48
SR-WEC 2 K P T O 34.822.8422.8632.1635.36
C P T O 10.3719.2311.1426.9425.08
SR-WEC 3 K P T O 50.0229.5337.7421.6122.17
C P T O 41.0225.6844.4824.4226.36
SR-WEC 4 K P T O 50.2626.1334.8241.240.6
C P T O 28.4212.2221.6240.3639.69
SR-WEC 5 K P T O 49.4812.4115.8746.6741.58
C P T O 22.4710.2550.3938.7637.12
Table A3. Optimal PTO stiffness K P T O (kN/m) and damping C P T O (kN/(m/s)) for individual SR-WECs in a random layout at H s = 2.25 m.
WEC H s = 2.25 m4.06 s5.22 s6.38 s7.54 s8.70 s
SR-WEC 1 K P T O 35.954.7752.9425.1633.51
C P T O 23.1431.6652.2324.628.3
SR-WEC 2 K P T O 14.3126.763.3611.4715.05
C P T O 34.7247.4131.8730.7417.81
SR-WEC 3 K P T O 44.2733.7428.5721.073.92
C P T O 34.0220.0437.6927.5323.28
SR-WEC 4 K P T O 27.919.9827.8663.0618.89
C P T O 29.6615.8739.155.4323.4
SR-WEC 5 K P T O 42.2522.959.8241.1733.18
C P T O 4.69.3470.7418.1521.05
Table A4. Optimal PTO stiffness K P T O (kN/m) and damping C P T O (kN/(m/s)) for individual SR-WECs in a random layout at H s = 3.25 m.
WEC H s = 3.25 m4.06 s5.22 s6.38 s7.54 s8.70 s
SR-WEC 1 K P T O 52.15.1135.1615.9231.25
C P T O 19.0426.2126.5828.750.01
SR-WEC 2 K P T O 27.4411.8522.754.4611.77
C P T O 35.083244.9942.5820.76
SR-WEC 3 K P T O 49.4110.7327.3330.2316.01
C P T O 39.222.248.4236.7455.09
SR-WEC 4 K P T O 29.8715.844.4739.0529.64
C P T O 16.3332.3232.7431.6324.51
SR-WEC 5 K P T O 45.174.8813.9940.5123.61
C P T O 9.3674.0552.7749.437.97

References

  1. Zhang, Y.; Zhao, Y.; Sun, W.; Li, J. Ocean wave energy converters: Technical principle, device realization, and performance evaluation. Renew. Sustain. Energy Rev. 2021, 141, 110764. [Google Scholar] [CrossRef]
  2. Guo, B.; Ringwood, J.V. A review of wave energy technology from a research and commercial perspective. IET Renew. Power Gener. 2021, 15, 3065–3090. [Google Scholar] [CrossRef]
  3. Shields, M.; Beiter, P.; Nunemaker, J.; Cooperman, A.; Duffy, P. Impacts of turbine and plant upsizing on the levelized cost of energy for offshore wind. Appl. Energy 2021, 298, 117189. [Google Scholar] [CrossRef]
  4. Yang, B.; Wu, S.; Zhang, H.; Liu, B.; Shu, H.; Shan, J.; Ren, Y.; Yao, W. Wave energy converter array layout optimization: A critical and comprehensive overview. Renew. Sustain. Energy Rev. 2022, 167, 112668. [Google Scholar] [CrossRef]
  5. Bailey, H.; Robertson, B.; Buckham, B. Variability and stochastic simulation of power from wave energy converter arrays. Renew. Energy 2018, 115, 721–733. [Google Scholar] [CrossRef]
  6. Martić, I.; Degiuli, N.; Grlj, C.G. Scaling of wave energy converters for optimum performance in the Adriatic Sea. Energy 2024, 294, 130922. [Google Scholar] [CrossRef]
  7. Budal, K. Theory for absorption of wave power by a system of interacting bodies. J. Ship Res. 1977, 21, 248–254. [Google Scholar] [CrossRef]
  8. Tay, Z.Y.; Venugopal, V. The impact of energy extraction of wave energy converter arrays on wave climate under multi-directional seas. J. Ocean Eng. Mar. Energy 2019, 5, 51–72. [Google Scholar] [CrossRef]
  9. Hantoro, R.; Septyaningrum, E.; Hudaya, Y.R.; Utama, I. Stability analysis for trimaran pontoon array in wave energy converter–pendulum system (WEC-PS). Brodogr. Int. J. Nav. Archit. Ocean Eng. Res. Dev. 2022, 73, 59–68. [Google Scholar] [CrossRef]
  10. Cheng, Y.; Xi, C.; Dai, S.; Ji, C.; Cocard, M. Wave energy extraction for an array of dual-oscillating wave surge converter with different layouts. Appl. Energy 2021, 292, 116899. [Google Scholar] [CrossRef]
  11. Giassi, M.; Göteman, M. Layout design of wave energy parks by a genetic algorithm. Ocean Eng. 2018, 154, 252–261. [Google Scholar] [CrossRef]
  12. Liu, Z.; Wang, Y.; Hua, X. Proposal of a novel analytical wake model and array optimization of oscillating wave surge converter using differential evolution algorithm. Ocean Eng. 2021, 219, 108380. [Google Scholar] [CrossRef]
  13. Jeong, H.-J.; Koo, W. Analysis of various algorithms for optimizing the wave energy converters associated with a sloped wall-type breakwater. Ocean. Eng. 2023, 276, 114199. [Google Scholar] [CrossRef]
  14. Neshat, M.; Alexander, B.; Wagner, M. A hybrid cooperative co-evolution algorithm framework for optimising power take off and placements of wave energy converters. Inf. Sci. 2020, 534, 218–244. [Google Scholar] [CrossRef]
  15. Babarit, A. On the park effect in arrays of oscillating wave energy converters. Renew. Energy 2013, 58, 68–78. [Google Scholar] [CrossRef]
  16. Sarkar, D.; Contal, E.; Vayatis, N.; Dias, F. Prediction and optimization of wave energy converter arrays using a machine learning approach. Renew. Energy 2016, 97, 504–517. [Google Scholar] [CrossRef]
  17. Atan, R.; Finnegan, W.; Nash, S.; Goggins, J. The effect of arrays of wave energy converters on the nearshore wave climate. Ocean Eng. 2019, 172, 373–384. [Google Scholar] [CrossRef]
  18. Child, B.; Venugopal, V. Optimal configurations of wave energy device arrays. Ocean Eng. 2010, 37, 1402–1417. [Google Scholar] [CrossRef]
  19. Zeng, X.; Wang, Q.; Kang, Y.; Yu, F. Hydrodynamic interactions among wave energy converter array and a hierarchical genetic algorithm for layout optimization. Ocean Eng. 2022, 256, 111521. [Google Scholar] [CrossRef]
  20. Sharp, C.; DuPont, B. Wave energy converter array optimization: A genetic algorithm approach and minimum separation distance study. Ocean Eng. 2018, 163, 148–156. [Google Scholar] [CrossRef]
  21. Bozzi, S.; Giassi, M.; Miquel, A.M.; Antonini, A.; Bizzozero, F.; Gruosso, G.; Archetti, R.; Passoni, G. Wave energy farm design in real wave climates: The Italian offshore. Energy 2017, 122, 378–389. [Google Scholar] [CrossRef]
  22. Payne, G.S.; Taylor, J.R.; Bruce, T.; Parkin, P. Assessment of boundary-element method for modelling a free-floating sloped wave energy device. Part 2: Experimental validation. Ocean Eng. 2008, 35, 342–357. [Google Scholar] [CrossRef]
  23. Cruz, J.M.B.P.; Salter, S.H. Numerical and experimental modelling of a modified version of the Edinburgh Duck wave energy device. Proc. Inst. Mech. Eng. Part M J. Eng. Marit. Environ. 2006, 220, 129–147. [Google Scholar] [CrossRef]
  24. So, R.; Michelen, C.; Bosma, B.; Lenee-Bluhm, P.; Brekken, T.K.A. Statistical analysis of a 1: 7 scale field test wave energy converter using WEC-sim. IEEE Trans. Sustain. Energy 2017, 8, 1118–1126. [Google Scholar] [CrossRef]
  25. Jin, C.; Meduri, A.; Kang, H. Multivariable design optimization for adaptive resonance of a surface riding wave energy converter. Ocean Eng. 2023, 286, 115576. [Google Scholar] [CrossRef]
  26. Penalba, M.; Ringwood, J.V. A review of wave-to-wire models for wave energy converters. Energies 2016, 9, 506. [Google Scholar] [CrossRef]
  27. Shan, S.; Wang, G.G. Survey of modeling and optimization strategies to solve high-dimensional design problems with computationally-expensive black-box functions. Struct. Multidiscip. Optim. 2010, 41, 219–241. [Google Scholar] [CrossRef]
  28. Lei, B.; Kirk, T.Q.; Bhattacharya, A.; Pati, D.; Qian, X.; Arroyave, R.; Mallick, B.K. Bayesian optimization with adaptive surrogate models for automated experimental design. Npj Comput. Mater. 2021, 7, 194. [Google Scholar] [CrossRef]
  29. Lim, J.; Choi, M.; Lee, S. A Bayesian optimization algorithm for the optimization of mooring system design using time-domain analysis. J. Mar. Sci. Eng. 2023, 11, 507. [Google Scholar] [CrossRef]
  30. Elsas, J.; Casaprima, N.; Cardoso, P.; Menezes, I. Bayesian optimization of riser configurations. Ocean Eng. 2021, 236, 109402. [Google Scholar] [CrossRef]
  31. Baheri, A.; Ramaprabhu, P.; Vermillion, C. Iterative 3d layout optimization and parametric trade study for a reconfigurable ocean current turbine array using bayesian optimization. Renew. Energy 2018, 127, 1052–1063. [Google Scholar] [CrossRef]
  32. Garnett, R. Bayesian Ooptimization; Cambridge University Press: Cambridge, UK, 2023. [Google Scholar]
  33. Veritas, N. Environmental Conditions and Environmental Loads; Det Norske Veritas: Oslo, Norway, 2000. [Google Scholar]
  34. Cummins, W. The Impulse Response Function and Ship Motion. Report 1661. Department of the Navy, David W. Taylor Model Basin, Hydromechanics Laboratory, Research and Development Report. October 1962. Available online: https://dome.mit.edu/bitstream/handle/1721.3/49049/DTMB_1962_1661.pdf (accessed on 1 October 2024).
  35. Meyer, J.; Windt, C.; Hildebrandt, A.; Schlurmann, T. Mechanically coupled wave farms: On the accuracy of a mid-fidelity hydrodynamic model under consideration of varying calibration approaches. Ocean Eng. 2024, 305, 117874. [Google Scholar] [CrossRef]
  36. Wood, G.D.; Kennedy, D.C. Simulating Mechanical Systems in Simulink with SimMechanics; The Mathworks Report; Mathworks: Natick, MA, USA, 2003; Volume 210. [Google Scholar]
  37. Sheshaprasad, S.; Naghavi, F.; Hasanpour, S.; Albader, M.; Gardner, M.C.; Kang, H.; Toliyat, H.A. Optimal Electric Power Take-off Strategy for Surface Riding Wave Energy Converter. In Proceedings of the 2022 IEEE Energy Conversion Congress and Exposition (ECCE), Detroit, MI, USA, 9–13 October 2022; pp. 1–7. [Google Scholar]
  38. Meduri, A.; Kang, H. Synergistic Integration of Multiple Wave Energy Converters with Adaptive Resonance and Offshore Floating Wind Turbines through Bayesian Optimization. J. Mar. Sci. Eng. 2024, 12, 1455. [Google Scholar] [CrossRef]
  39. Ancellin, M.; Dias, F. Capytaine: A Python-based linear potential flow solver. J. Open Source Softw. 2019, 4, 1341. [Google Scholar] [CrossRef]
  40. Astariz, S.; Iglesias, G. Enhancing wave energy competitiveness through co-located wind and wave energy farms. A review on the shadow effect. Energies 2015, 8, 7344–7366. [Google Scholar] [CrossRef]
  41. Short, W.; Packey, D.; Holt, T. A Manual for the Economic Evaluation of Energy Efficiency and Renewable Energy Technologies; National Renewable Energy Lab (NREL): Golden, CO, USA, 1995. [Google Scholar]
Figure 1. (a) Main components of the SR-WEC; (b) dimensions of the SR-WEC geometry.
Jmse 12 02143 g001
Figure 2. Flowchart of the Dual Bayesian optimization strategy.
Jmse 12 02143 g002
Figure 3. Plan view of (a) linear layout and (b) random layout.
Jmse 12 02143 g003
Figure 4. (a) Non-dimensionalized added inertia, (b) radiation damping, (c) excitation moment in pitch for SR-WEC #2, (d) parameters of test layout, and (e) fine mesh (1149 panels).
Jmse 12 02143 g004
Figure 5. (a) A E x c , 5,5 vs. iterations—Step 1 of Dual Bayesian optimization, optimal array for (b) linear layout, and (c) random Layout.
Jmse 12 02143 g005
Figure 6. z C G vs. A E x c , 5,5 of the top 40 iterations for (a) linear layout, (b) random layout.
Jmse 12 02143 g006
Figure 7. (a) s a r r a y vs. A E x c , 5,5 of top 40 iterations for the linear layout (b) x i vs. A E x c , 5,5 (c) y i vs. A E x c , 5,5 of top 40 iterations for the random layout.
Jmse 12 02143 g007
Figure 8. q E S A for different H s as a function of T p for optimal (a) linear layout and (b) random layout (dotted line represent q E S A = 1). Difference between excitation moment of individual SR-WECs and single unit SR-WEC for optimal (c) linear layout and (d) random layout.
Jmse 12 02143 g008
Figure 9. (a) q-factor q f as function of T p for different H s for the optimal linear and random layout (b) JONSWAP spectra at H s = 1.25 m and T p = 6.38 s for different γ values.
Jmse 12 02143 g009
Figure 10. Mean power of individual SR-WECs as a fraction of single unit SR-WEC power in dual-optimized linear layout at H s = 1.25 m, (a) T p = 6.38 s, (b) T p = 8.70 s; and dual-optimized random layout at H s = 3.25 m, (c) T p = 5.22 s, (d) T p = 6.38 s.
Jmse 12 02143 g010
Figure 11. Pitch excitation spectra for individual SR-WECs at (a) H s = 1.25 m, T p = 6.38 s, (b) H s = 1.25 m, and T p = 8.70 s for the dual-optimized linear layout, and (c) H s = 3.25 m, T p = 5.22 s, (d) H s = 3.25 m, and T p = 6.38 s for the dual-optimized random layout.
Jmse 12 02143 g011
Figure 12. Power spectral density of individual SR-WECs’ (a,b) pitch and sliding displacement at T p = 6.38 s, (c,d) T p = 8.70 s compared to the single unit optimal SR-WEC for dual-optimized linear layout ( H s = 1.25 m) ( ω p E shown as a dotted line).
Jmse 12 02143 g012
Figure 13. Power spectral density of individual SR-WECs’ (a,b) pitch and sliding displacement at T p = 5.22 s, (c,d) T p = 6.38 s compared to the single unit optimal SR-WEC for dual-optimized random layout ( H s = 3.25 m) ( ω p E shown as a dotted line).
Jmse 12 02143 g013
Figure 14. Time history of pitch, sliding displacement, and active power of individual SR-WECs (ae) #1–#5 for dual-optimized random layout at H s = 3.25 m, T p = 5.22 s (values for single unit optimal SR-WEC represented with a dotted line).
Jmse 12 02143 g014
Table 1. Main properties of the single unit optimal SR-WEC.
ParameterDescriptionValueParameterDescriptionValue
DDiameter12 m L s Stator Length12 m
dDraft7.5 m L t Translator Length (m)1.905 m
R e d g e Radius of Smoothed Edge1 m M Translator Mass (kg)24,300 kg
z C G Center of Gravity (below MWL)−5.4 m M m Total Displaced Mass (kg)861,451.9 kg
Table 2. Variables and parameters of Step 1 of the Dual Bayesian optimization.
TypeDescriptionLinear LayoutDescriptionRandom Layout
BEMFrequency ω [0.01, 3.01] rad/sFrequency ω [0.01, 3.01] rad/s
Wave Heading β 0 ° Wave Heading β 0 °
VariableArray Spacing1 s a
[13 m, 18 m]
Array Coordinates5 ( x i ,   y i )
[−20 m, 20 m]
Center of
Gravity z C G i
3 z C G i
[−5.4 m, −4 m]
Center of Gravity z C G i 5 z C G i
[−5.4 m, −4 m]
Bayesian optimizationObjective Function A E x c , 5,5 Objective Function A E x c , 5,5
Variables4Variables15
ConstraintNoneConstrain d m i n 14   m
Number of Iterations200Number of Iterations200
Exploration Ratio t σ 0.8Exploration Ratio t σ 0.8
Table 3. Variables and parameters of Step 2 of Dual Bayesian optimization.
TypeDescriptionOptimal Linear LayoutOptimal Random Layout
WEC-Sim
v6.0
Simulation Length3600 s3600 s
Sea   State   ( H s , T p )5 ( H s = 1.25 m)
( T p = 4.06 s, 5.22 s, 6.38 s, 7.54 s, 8.7 s)
15 ( H s = 1.25 m, 2.25 m, 3.25 m)
( T p = 4.06 s, 5.22 s, 6.38 s, 7.54 s, 8.7 s)
Wave Spectrum and HeadingJONSWAP, Unidirectional, 0 ° JONSWAP, Unidirectional, 0 °
Variables PTO   Damping   C P T O i 3   C P T O i   [0.5, 78] kN/(m/s)5 C P T O i   [0.5, 78] kN/(m/s)
PTO Stiffness K P T O i 3 K P T O i   [1, 90] kN/m5 K P T O i   [1, 90] kN/m
Bayesian optimizationObjective Function ( i = 1 5 P ¯ i ) ( i = 1 5 P ¯ i )
Number of Iterations50100
Exploration Ratio t σ 0.80.8
Disclaimer/Publisher’s Note: The statements, opinions and data contained in all publications are solely those of the individual author(s) and contributor(s) and not of MDPI and/or the editor(s). MDPI and/or the editor(s) disclaim responsibility for any injury to people or property resulting from any ideas, methods, instructions or products referred to in the content.

