Article

Graphics Processing Unit-Accelerated Propeller Computational Fluid Dynamics Using AmgX: Performance Analysis Across Mesh Types and Hardware Configurations

1
Key Laboratory of High Performance Ship Technology, Wuhan University of Technology, Ministry of Education, Wuhan 430063, China
2
School of Naval Architecture, Ocean and Energy Power Engineering, Wuhan University of Technology, Wuhan 430063, China
3
Green & Smart River-Sea-Going Ship, Cruise Ship and Yacht Research Center, Wuhan University of Technology, Wuhan 430063, China
4
School of Science, Wuhan University of Technology, Wuhan 430070, China
*
Author to whom correspondence should be addressed.
J. Mar. Sci. Eng. 2024, 12(12), 2134; https://doi.org/10.3390/jmse12122134
Submission received: 12 October 2024 / Revised: 4 November 2024 / Accepted: 20 November 2024 / Published: 22 November 2024
(This article belongs to the Section Ocean Engineering)

Abstract

:
Computational fluid dynamics (CFD) has become increasingly prevalent in marine and offshore engineering, with enhancing simulation efficiency emerging as a critical challenge. This study systematically evaluates the application of graphics processing unit (GPU) acceleration technology in CFD simulation of propeller open water performance. Numerical simulations of the VP1304 propeller model were performed using OpenFOAM v2312 integrated with the NVIDIA AmgX library. The research compared GPU acceleration performance against conventional CPU methods across various hardware configurations and mesh types (tetrahedral, hexahedral-dominant, and polyhedral). Results demonstrate that GPU acceleration significantly improved computational efficiency, with tetrahedral meshes achieving over 400% speedup in a 4-GPU configuration, while polyhedral meshes reached over 500% speedup with a fixed mesh count. Among the mesh types, hexahedral-dominant meshes performed best in capturing flow field details. The study also found that GPU acceleration does not compromise simulation accuracy, but its effectiveness is closely related to mesh type and hardware configuration. Notably, GPUs demonstrate more significant advantages when handling large-scale problems. These findings have important practical implications for improving propeller design processes and shortening product development cycles.

1. Introduction

1.1. Background

Computational fluid dynamics (CFD) methods have been extensively applied across various industries, with their progress largely depending on advancements in large-scale parallel computing and high-performance computing (HPC) hardware technologies. Currently, most CFD solutions still mainly rely on the workstation’s central processing unit (CPU), and the CPU’s multithreading capability and data transmission bandwidth are the main bottlenecks limiting its computational efficiency [1]. The graphics processing unit (GPU), initially designed for graphical rendering tasks, has witnessed substantial advancements in memory capacity and computational performance in recent years, driven by the increasing computational demands of generative artificial intelligence [2]. Leveraging the rapid advancement of GPU hardware, employing GPU acceleration for CFD computation has increasingly become a viable solution in engineering applications.
In marine and offshore engineering, CFD methodologies are extensively employed for diverse fluid dynamics analyses [3,4,5], particularly in propeller performance simulation and optimization. Enhanced computational efficiency in these areas can significantly advance propeller design and production processes [6]. Investigating the application of GPU acceleration for CFD solutions carries both significant theoretical research value and offers potential resolutions to urgent challenges in engineering practice. This study comprehensively assesses the effectiveness of GPU acceleration in propeller CFD simulations, aiming to provide valuable insights for refining computational strategies and enhancing design efficiency.

1.2. Current Status of GPU-Accelerated CFD Research

The use of GPUs to accelerate CFD simulations has emerged as an active field of research over the past decade [7,8,9,10]. At the turn of the century, researchers began to recognize and harness the efficiency of GPUs in CFD calculations. Wu et al. [11] were among the pioneers in this field, proposing a novel GPU-based real-time fluid simulation method. They optimized fluid dynamics calculations by leveraging the parallel processing power of GPUs, utilizing fragment programs, and replacing the Gauss–Seidel method with the Jacobi iteration method. These innovations enhanced parallel processing efficiency and achieved real-time interactivity in fluid simulations.
Building on this foundation, Harris et al. [12] utilized the NVIDIA GeForce FX graphics card (NVIDIA Corporation, Santa Clara, CA, USA) to further explore GPU applications in fluid simulation, based on Stam’s [13] “stable fluids” method. Their research demonstrated that GPU computational speed could be increased sixfold compared to traditional CPU methods for fluid dynamics calculations.
Jespersen [14] conducted an in-depth exploration of CUDA technology to accelerate the OVERFLOW code, demonstrating significant performance improvements in large-scale parallel processing, particularly in CFD simulations. However, he also highlighted the trade-offs between memory transfer overhead and the balance of 32 bit versus 64 bit precision.
Brandvik et al. [15,16]. focused on transonic turbine blade row flow fields, implementing solutions for two-dimensional and three-dimensional Euler equations on GPUs. Their work achieved computation speeds 20–40 times faster than CPU implementations. They further extended their research to three-dimensional Navier–Stokes equations, using turbine leakage flow fields as a case study. Implementing these solutions on the NVIDIA GT200 GPU (NVIDIA Corporation, Santa Clara, CA, USA) resulted in a 20-fold acceleration compared to the Intel Xeon CPU (Intel Corporation, Santa Clara, CA, USA) [17].
Dyson [18] expanded GPU applications to the OpenFOAM framework, concentrating on linear system solvers for computationally intensive tasks such as multiphase flow and atomization. His research emphasized reducing computational costs through GPU parallel processing capabilities, particularly by employing multigrid methods to enhance efficiency.
In recent advancements, Piscolini and Ghidoni [19] conducted a comprehensive analysis of GPU acceleration within OpenFOAM, focusing on enhancing CFD simulation performance. Their study explored advanced technologies, particularly algebraic multigrid solvers, and compared GPU and CPU implementations. The research demonstrated significant computational efficiency gains in complex CFD problems, marking a notable milestone in GPU applications within high-performance computing frameworks. This work represents the latest progress in reducing simulation computation time for CFD applications.

1.3. Current Status of CFD Research on Propellers

CFD simulations employ three primary methods for simulating rotating regions: the moving reference frames (MRFs) method, the arbitrary mesh interface (AMI) method, and the overset mesh method (also known as the Chimera method).
The MRFs method sets the reference coordinate system of the rotating region to a local rotating coordinate system, facilitating data exchange between rotating and stationary regions through interface boundaries [20]. This approach is suitable for both steady-state and transient propeller simulations. Dong et al. [21] utilized the MRFs method to study the scale effect of the PPTC-II benchmark propeller, effectively capturing changes in propeller tip load and wake vortex strength. Permadi and Sugianto [22] combined the MRFs method with a multiobjective optimization algorithm to optimize B-series propeller designs, confirming the method’s accuracy in predicting thrust for three- and five-blade propellers. Van-Vu et al. [23] conducted a comprehensive scale effect study on the PPTC VP 1304 benchmark propeller, demonstrating that the MRFs method accurately captures changes in boundary layer thickness on the propeller surface under full-scale conditions, leading to precise propeller performance predictions.
The AMI method simulates propeller rotation by establishing two or more subdomains: a rotating domain containing the propeller and a stationary domain with static components. This approach enables mesh sliding between rotating and stationary domains, accurately replicating the propeller’s actual rotational motion. In recent years, the AMI method has gained widespread attention as an innovative mesh handling technique.
Liu and Wan et al. [24] applied the AMI method to CFD simulations of a propeller with end plates, demonstrating its ability to accurately predict thrust coefficients under high advance ratio conditions. Bahatmaka et al. [25] compared AMI and MRF mesh strategies, finding that while AMI required longer computation times, it provided superior accuracy in analyzing transient interactions between the propeller and hull or rudder. Vargas Loureiro et al. [26] further corroborated these findings, showing that AMI method computations more closely matched experimental data at high advance ratios.
Despite its advantages, the AMI method faces practical challenges. The necessity to regenerate the mesh at each time step results in high computational costs [25,26]. Moreover, the setup of AMI weights significantly impacts result accuracy [26]. Consequently, improving computational efficiency while maintaining accuracy remains a critical area for further research.
The overset grid method, also known as the nested grid or Chimera method, is another crucial technique for propeller simulations. This approach employs multiple independently generated grid systems that partially overlap spatially [27]. Typical propeller simulations using this method involve a local grid surrounding the propeller and a larger background grid. The overset grid method demonstrates exceptional flexibility and efficiency in handling complex geometries and moving components.
Dubbioso et al. [28] successfully applied a structured overset grid method to simulate propeller–body interactions, yielding accurate results. Rhee and Joshi [29] introduced an unstructured grid-based overset grid strategy, better suited for complex geometry simulations. Lee et al. [30] further advanced the unstructured overset grid technique, enabling the numerical simulation of a complete helicopter configuration (including main rotor, fuselage, and tail rotor). Their work demonstrated the method’s effectiveness in capturing interference effects between the rotor and other components.
Despite its advantages, the overset grid method faces several practical challenges. Grid division and interpolation strategies significantly impact computational accuracy and efficiency [29,30]. Moreover, balancing computational costs with accuracy remains a key challenge in applying this method [28].

1.4. Outline of This Work

The remainder of this paper is structured as follows: Section 2 introduces the technical implementation of GPU-accelerated CFD computation. It elaborates on the strategy of integrating GPU solvers into OpenFOAM. The specific implementation process of the AmgX library in OpenFOAM is then described, laying the technical foundation for subsequent performance evaluation. Section 3 outlines the numerical simulation methods. It begins by introducing the geometric characteristics and computational domain settings of the VP1304 propeller model. Then, it determines appropriate mesh resolution through grid independence analysis. Finally, it provides an overview of hardware specifications and computational conditions for performance evaluation. Section 4 presents the research results and conducts an in-depth discussion. It first verifies the accuracy of the GPU solver and analyzes the impact of different mesh types on the results. The section then evaluates the parallel efficiency of both the native CPU solver and the AmgX-based GPU solver. Through direct comparison of GPU and CPU performance, the advantages of GPU acceleration in propeller CFD simulation are comprehensively assessed. Section 5 concludes the paper by summarizing the main findings and conclusions of the study.

2. GPU-Accelerated OpenFOAM Implementation Based on AmgX Library

2.1. Integration Strategy of AmgX Library with OpenFOAM

This study employs OpenFOAM, an open-source CFD solver based on the finite volume method (FVM), as the tool for numerical analysis. OpenFOAM’s open-source nature allows for easy future code modifications and the addition of new solvers, making it an ideal choice for this research.
The essence of the GPU acceleration strategy lies in parallel computing. Unlike CPUs with limited cores, GPUs possess thousands of computing cores, enabling them to handle vast amounts of data simultaneously. To achieve such acceleration, existing computational models must be redesigned into parallel structures, and computation-intensive linear solvers need to be migrated to the GPU for execution. In CFD simulations, linear solvers typically account for more than 60% of the total computation time [31].
Performance can be further enhanced by optimizing the data access patterns for cells, edges, and nodes on unstructured grids. By utilizing collaborative thread groups (CTGs) technology and leveraging the GPU’s on-chip shared memory and registers, data transposition and aggregation are performed efficiently, reducing the frequency of atomic operations [32]. Through parallel computing frameworks like compute unified device architecture (CUDA), open-source CFD software such as OpenFOAM v2312 can port existing algorithms to run on GPUs, significantly improving computational efficiency [32,33].

2.2. Algebraic Multigrid Method in the AmgX Library

The fundamental concept of the AMG (algebraic multigrid) algorithm is to accelerate the solving process by constructing a sequence of increasingly coarser grids. Unlike the geometric multigrid method, AMG operates independently of the problem’s geometric information, instead constructing coarse grids and interpolation operators based directly on the algebraic properties of the matrix. This characteristic makes AMG particularly well-suited for handling unstructured grids and complex geometrical problems.
The AmgX library, developed by NVIDIA [31], builds upon this concept and introduces an innovative approach to calculating the Galerkin product. This advancement further enhances the efficiency of the AMG algorithm in GPU-accelerated computations:
C   = R A P
where, C represents the coefficient matrix on the coarse grid, R is the restriction matrix used to transfer from the fine grid to the coarse grid, A is the original coefficient matrix on the fine grid, and P is the prolongation matrix used to transfer from the coarse grid to the fine grid.
The method decomposes the calculation process into two steps: Z = AP and C = P T Z , using hash tables to combine the results, effectively leveraging the GPU’s parallel processing power, where Z is the intermediate matrix and P T is the restriction matrix. Additionally, AmgX optimizes fundamental operations like vector manipulations and sparse matrix-vector multiplications for GPU architecture and incorporates several smoothers and preconditioners, including Jacobi, Gauss–Seidel, and incomplete lower upper decomposition (ILU).
To effectively execute these algorithms on the GPU, AmgX primarily employs two strategies: level-scheduling and graph coloring. Level-scheduling implicitly reorders the matrix, grouping independent rows into different levels to achieve parallel processing. Graph coloring, conversely, explicitly rearranges the matrix, allowing nodes of the same color to be processed concurrently. Both approaches substantially increase parallelism on the GPU, although they exhibit slight differences in their impact on convergence.
The GPU-accelerated CFD computation method used in this study capitalizes on these strategies by externally calling the AmgX library through OpenFOAM. This approach leverages the efficient GPU implementation of the AmgX library, promising to significantly enhance the computational efficiency of CFD simulations.

2.3. Implementation of AmgX Library in OpenFOAM

AmgX [31], an external library, cannot be directly invoked by OpenFOAM, necessitating the use of a third-party interface. PETSc4FOAM [34] fulfills this role by serving as a bridge between OpenFOAM and the Portable, Extensible Toolkit for Scientific Computation (PETSc). Integrated into OpenFOAM, PETSc4FOAM enables the software to utilize external solvers provided by PETSc v3.22.
A key challenge in this process is the difference in matrix formats: OpenFOAM uses the lower-diagonal-upper (LDU) format, while AmgX supports the compressed sparse row (CSR) format. To address this, the FOAM2CSR [35] library is employed. This specialized tool efficiently converts OpenFOAM’s LDU matrix format into the CSR format, a critical step that directly impacts the efficiency of GPU acceleration.
Once converted, the CSR format matrix data structure is passed to NVIDIA’s AmgX library for solving. Here, computationally intensive linear algebra operations are performed on the GPU, significantly boosting computation speed by leveraging its parallel processing power. This completes one round of solving from OpenFOAM to AmgX.
Finally, the computational results are transferred back from the GPU to the CPU and returned to the main OpenFOAM program via the PETSc4FOAM interface. The detailed workflow of this process is illustrated in Figure 1.

3. CFD Simulation

3.1. VP 1304 Parameters and Computational Domain Setup

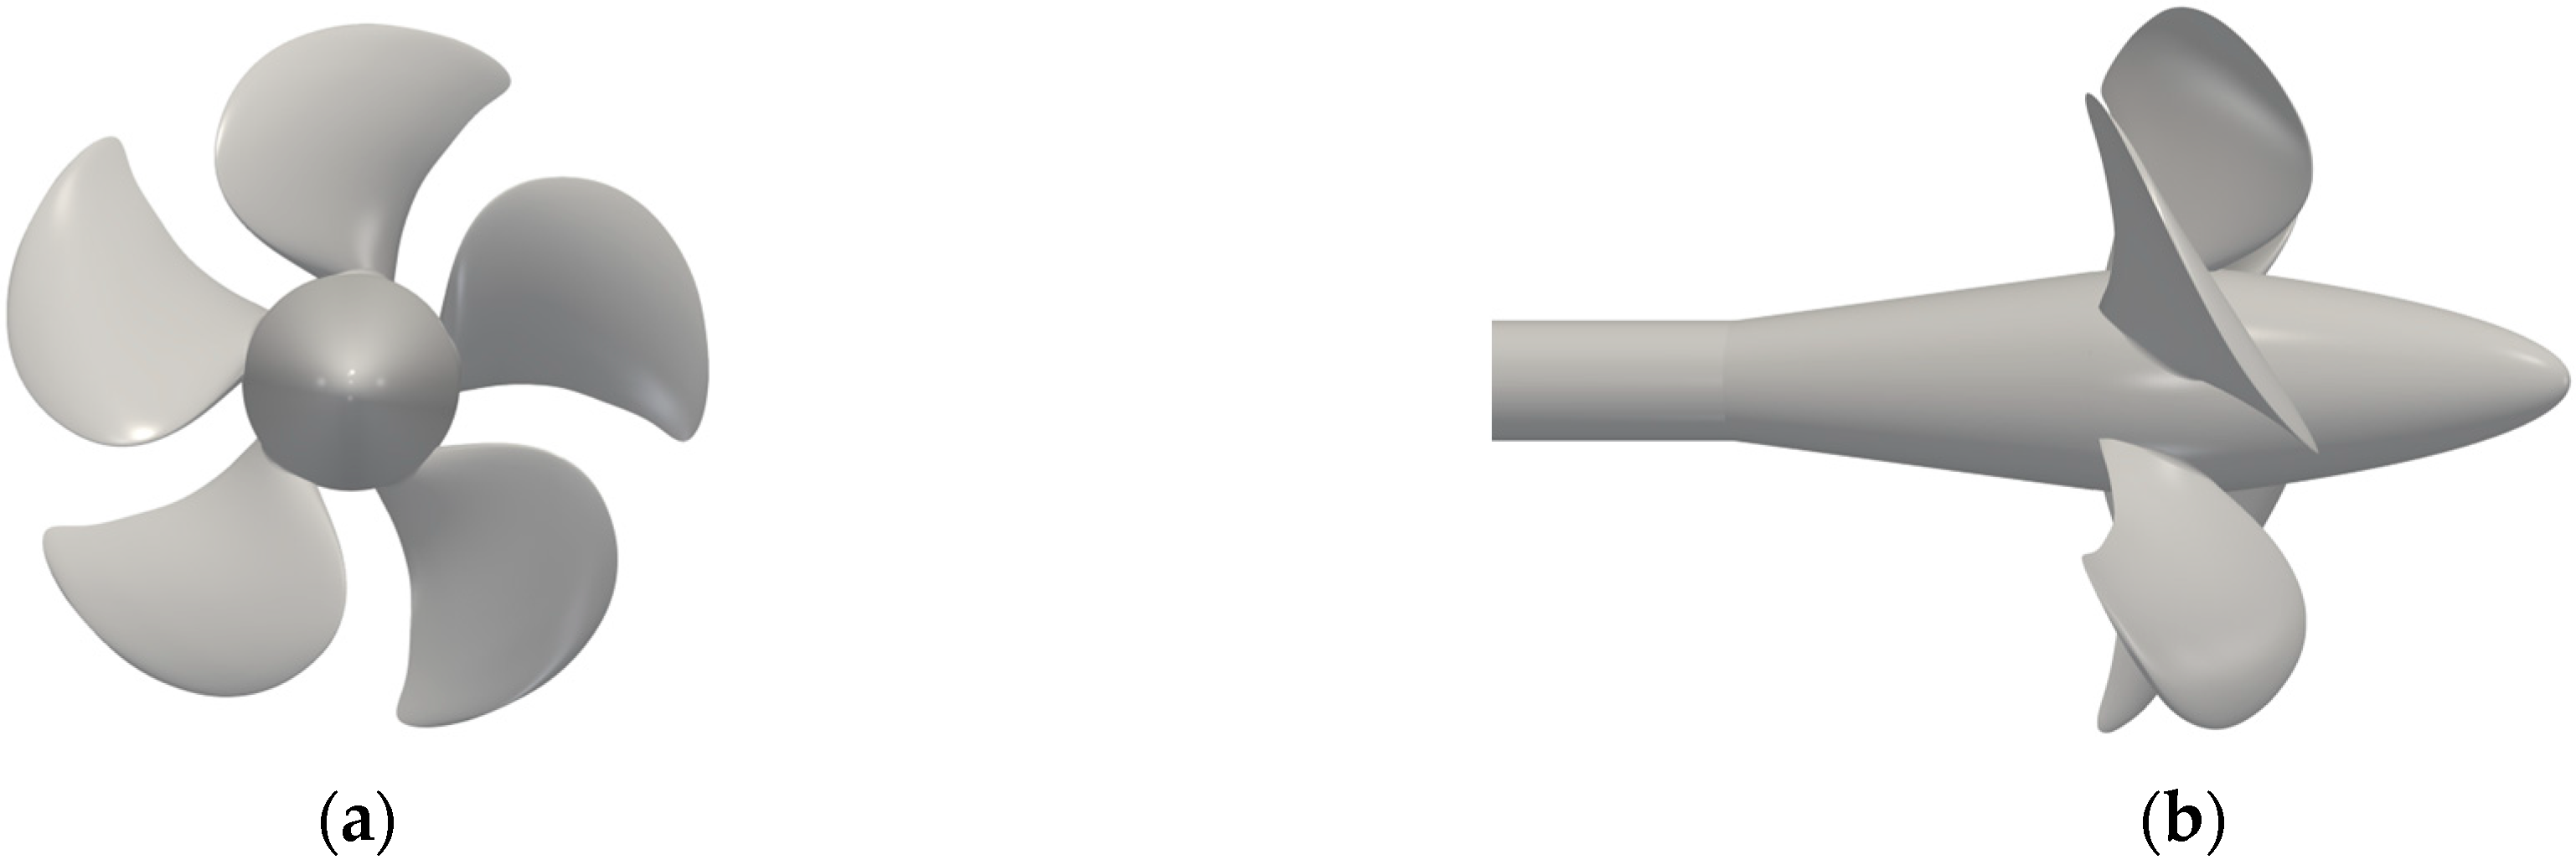
This study selected the VP1304 propeller model from the Potsdam Propeller Test Case (PPTC) as the research subject. The model was designed and comprehensively tested experimentally by Schiffbau-Versuchsanstalt (SVA) Potsdam GmbH [36]. The VP1304 is a five-bladed adjustable-pitch propeller model featuring a pronounced aft sweep. With a diameter of 0.25 m, it is designed for investigating a range of hydrodynamic properties, including open water performance, cavitation, and wake field characteristics. The primary geometric parameters are as showed in Table 1. Figure 2a,b show the front view and side view of the VP1304 propeller, respectively.
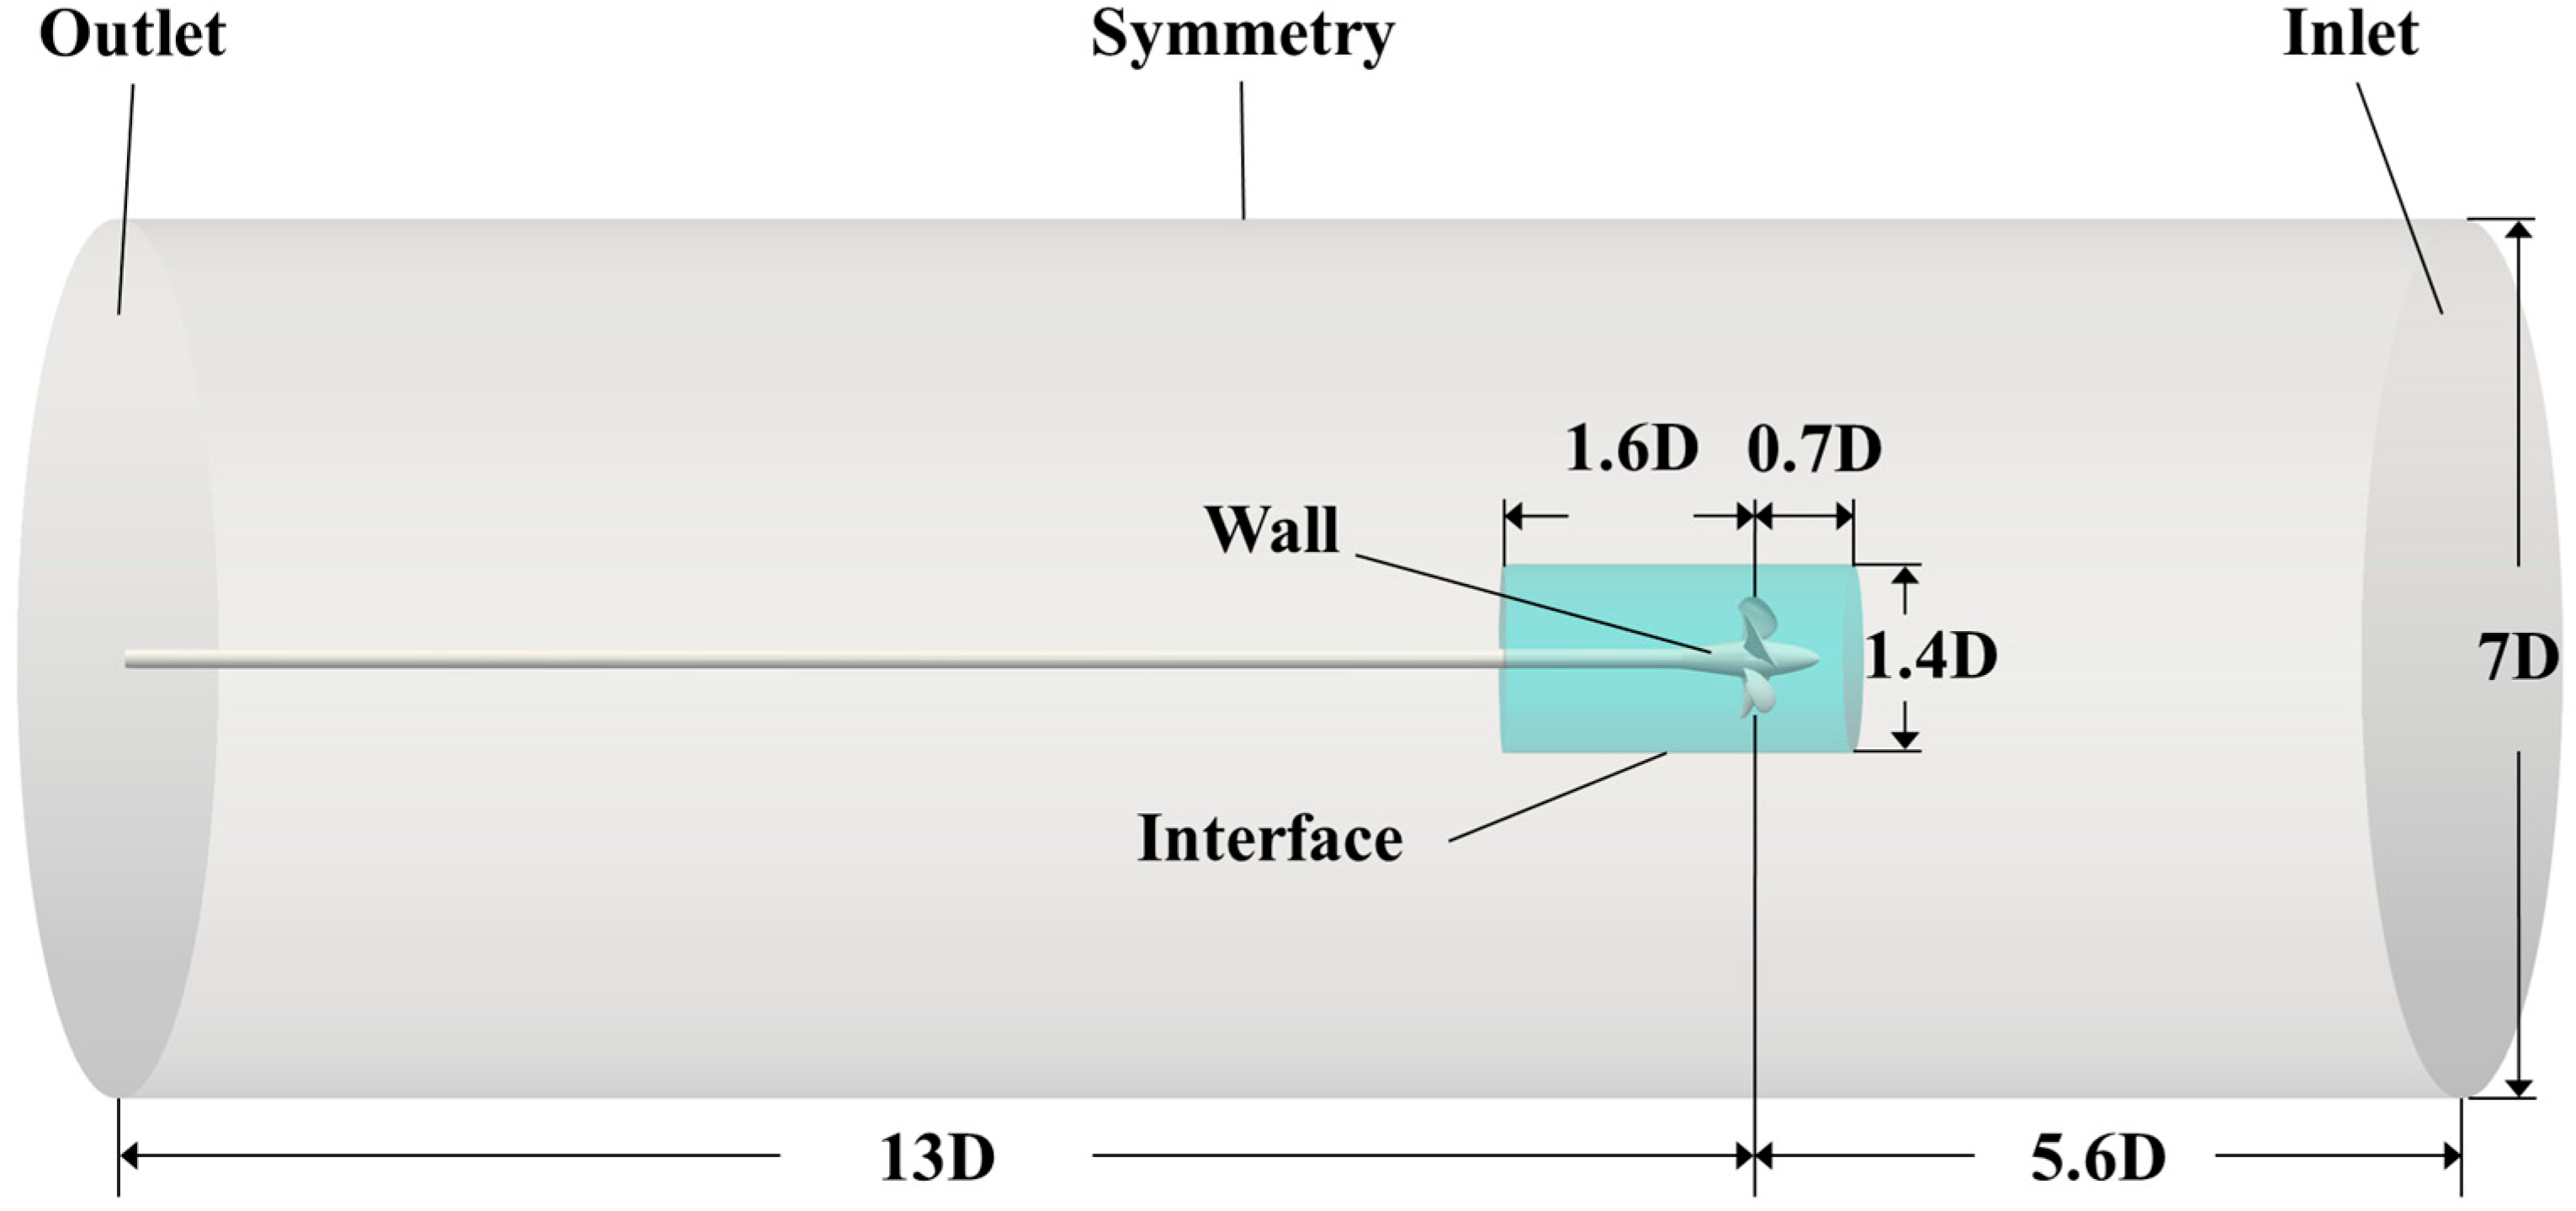
This study employed the MRFs method for propeller open water performance simulation. According to previous studies [22,23], compared to sliding mesh and overset grid methods, the MRFs method demonstrates advantages of high computational efficiency and good convergence in predicting propeller open water characteristics. In order to simulate the rotation effect of the MRFs method, a cylindrical computational domain needs to be constructed, as shown in Figure 3. The computational domain is divided into two regions: the MRFs region and the stationary region. The MRFs region is the inner cylindrical region surrounding the propeller (the part highlighted in blue in Figure 3). Within this region, the rotational effect is simulated by adding additional source terms to the momentum equation, rather than physically rotating the grid. This enables the simulation of the rotating propeller’s influence under steady-state conditions. The stationary domain, also known as the global domain, is cylindrical in shape to maintain radial symmetry and better capture the helical flow patterns commonly induced by the propeller. The dimensions of the computational domain were referenced from the research by Van-Vu et al. [23] The propeller diameter is D, the distance from the inlet of the computational domain to the center of the propeller disk is 5.6 D, the distance from the outlet to the center of the disk is 13 D, and the diameter of the stationary domain cylinder is 7 D. The leading edge of the MRF domain is positioned 0.7 D from the center of the propeller disk, while the trailing edge is 1.6 D from the disk center. The MRFs domain also takes the form of a cylinder, with a diameter measuring 1.4 D.
In order to simulate the laboratory environment as closely as possible, the inlet of the computational domain is set as a velocity inlet boundary condition, the outlet is set as a pressure outlet, the cylindrical side of the computational domain is set as a symmetry plane, the propeller and shaft are set as wall surfaces considering wall functions, and an interface is used for data exchange between the MRFs domain and the stationary domain.

3.2. Governing Equation

The incompressible constant viscosity turbulent flow momentum conservation equation (Navier–Stokes) used in OpenFOAM solver is as follows:
u i t + u j u i x j = - 1 ρ p x i + μ ρ 2 u i x j x j
where u i represents velocity components, t is time, u j u i x j represents the convection term, ρ is density, p is pressure, μ is dynamic viscosity coefficient, and 2 u i x j x j is the Laplacian operator. The continuity equation is given as follows:
· u
is the divergence operator and u is the velocity vector.
As the near-wall mesh y+ is approximately 60 in this study, wall functions are required. For the k-ω SST turbulence model, expressions for turbulent kinetic energy k, specific dissipation rate ω, and turbulent eddy viscosity near the wall are given as follows:
k = m a x k l o g u r 2 , ζ   if   y + > y l a m +
k = m a x k v i s u r 2 , ζ   if   y + y l a m +
k v i s denotes the k prediction in the viscous sublayer, k l o g represents the k prediction in the inertial sublayer, u r is the friction velocity, ζ is a small value preventing floating point exceptions, and y l a m + indicates the estimated intersection of viscous and inertial sublayers in wall units. For the specific dissipation rate ω, the following applies:
ω = ω v i s 2 + ω l o g 2 1 2
where ω v i s is the ω prediction in the viscous sublayer, and ω l o g is the ω prediction in the inertial sublayer. The turbulent eddy viscosity is expressed as follows:
ν t = m a x 0 , u r * 2 u + ζ ν w
u r * 2 represents the friction velocity estimation through iteration, and ν w denotes the kinematic viscosity of the near-wall fluid.

3.3. Simulation Setup

For the physical model of the numerical simulation of the open water performance of the propeller, the k-ω SST model based on steady-state RANS is selected. This model combines the advantages of the k-ω model in the near-wall region and the advantages of the k-ε model in the region far from the wall, and has good applicability to engineering flow problems [37,38]. In the solution process, the governing equations are discretized using a second-order accurate scheme, and a steady-state approach is employed for solving the equations.
In the numerical discretization method, the gradient terms, divergence terms, and Laplacian terms are all discretized using the second-order Gauss linear format. Regarding the convective terms in the velocity field, a hybrid scheme combining bounded first-order upwind and second-order central differencing is utilized, integrating linear upwind and velocity gradient techniques to enhance the computational accuracy and stability. For the convection terms of turbulent kinetic energy k and specific dissipation rate ω, the bounded Gauss upwind format is used for discretization to enhance numerical stability.
As the objective of this study is to investigate the influence of GPU integration on the acceleration performance in comparison to pure CPU-based solutions. In terms of solver selection, when solving with GPU, the pressure field, velocity field, and turbulence field use the external solver AmgX library. On the other hand, when employing a pure CPU-based solution, the pressure field utilizes the geometric-algebraic multigrid (GAMG) solver, while the velocity and turbulence fields are resolved using the smoothSolver with the Gauss–Seidel smoother, to strike a balance between computational efficiency.
For pressure–velocity coupling, the semi-implicit method SIMPLE algorithm is used. During the solving process, the residual control for the pressure correction equation is set to 1 × 10⁻⁴, and the residual control for velocity and turbulence is set to 1 × 10⁻³. To maintain the stability of the solving process, the pressure relaxation factor is taken as 0.3, and the relaxation factor for velocity and turbulence is taken as 0.7.
The MRFs zone (depicted in blue in Figure 3) has a rotational speed of 15 rps, with the axis of rotation situated at the center of the propeller. In order to precisely compute the flow in the vicinity of the wall, the meshWave approach is employed for determining the wall distance.

3.4. Grid Size Independence Analysis

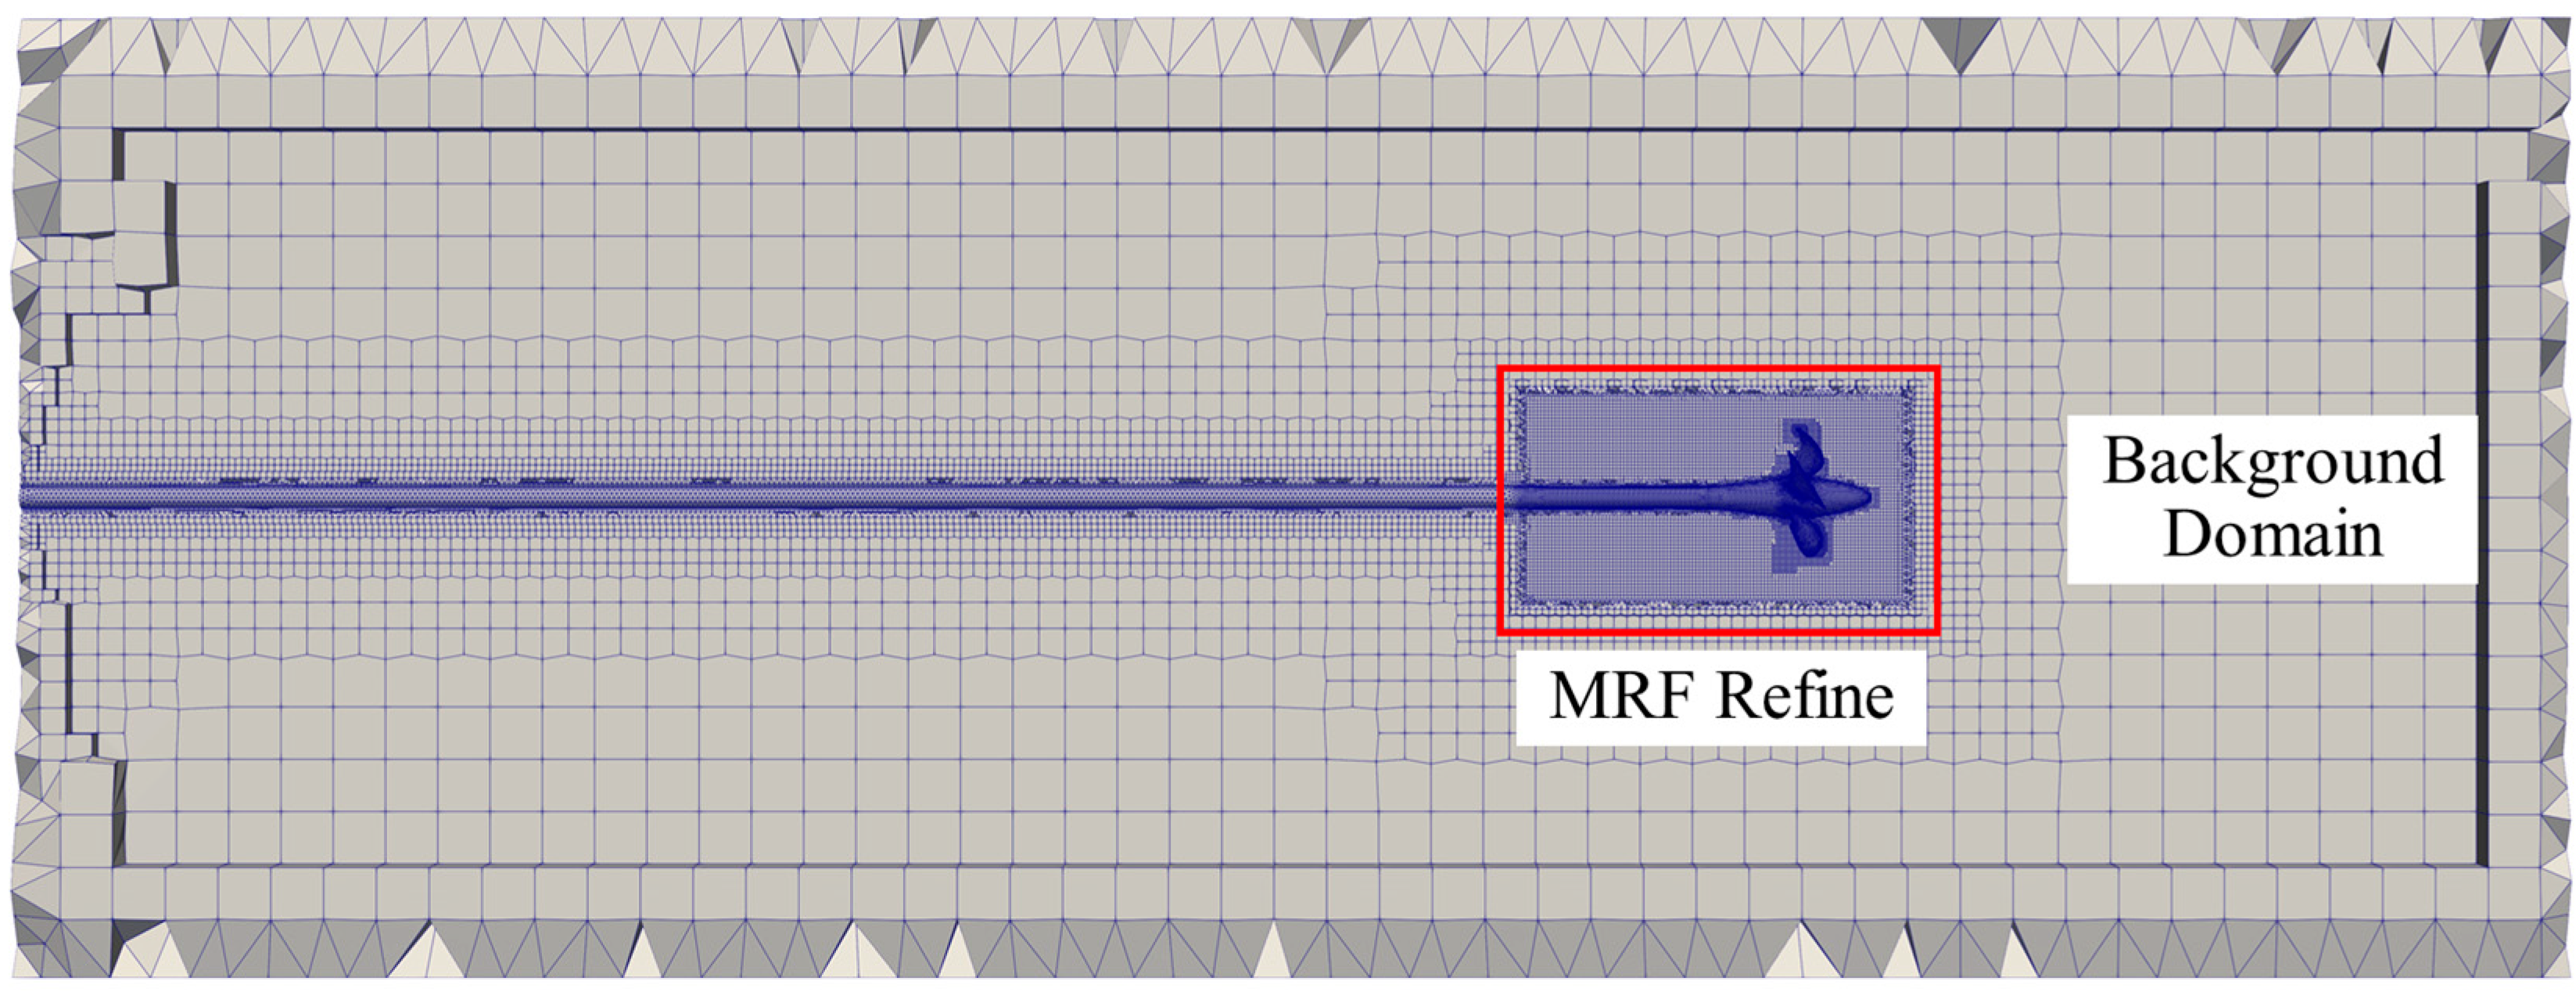
A grid independence study is required to ensure the accuracy and reliability of the CFD simulation results. In this analysis, hexahedral-dominant body-fitted grids are chosen as the basis for the grid size independence analysis. This type of grid is primarily composed of hexahedral elements, with polyhedral elements used for transitioning between grids of different sizes [39,40]. Figure 4 illustrates the grid partitioning strategy and refinement areas, focusing on mesh refinement for the propeller surface, propeller shaft, and MRFs region. In particular, the propeller surface mesh size is established as the baseline mesh size, with the MRFs region mesh size set to twice the baseline, and the mesh size for the large background computational domain set to 16 times the baseline.
To maintain the validity of the wall function, the non-dimensional distance y+ for the first layer of the propeller surface mesh is maintained at around 60. Four layers of boundary layer mesh are configured with a growth rate of 1.5 to model the near-wall flow features.
The mesh independence analysis in this study is performed by selecting varying base mesh sizes for the propeller surface. Based on recommendations from relevant studies by Ferziger et al. [41], Stern et al. [42], and Wilson et al. [43], a ratio of 1/ 2 is employed for successive refinement of the base size. Specifically, three base mesh sizes were selected: 6.3 mm, 4.5 mm, and 3.15 mm, corresponding to grid cell counts of 2,261,032, 3,301,231, and 5,314,897, respectively.
To validate the reliability of the computational results, the numerical simulation results are compared with experimental data [36]. The comparison parameters include the propeller thrust coefficient KT, torque coefficient KQ, and propeller open water efficiency η0. These parameters are expressed as follows:
K T = T ρ n 2 D 4
K Q = Q ρ n 2 D 5
η 0 = J 2 π K T K Q
J = V n D
where T is the propeller thrust, Q is the propeller torque, n is the propeller rotational speed, D is the propeller diameter, ρ is the fluid density, V is the propeller advance velocity, and J is the advance coefficient.
When conducting numerical simulations with different mesh sizes, data results are extracted only after all calculations have reached the residual convergence criteria mentioned in Section 3.2. Table 2 presents the simulation results.
This section analyzes the impact of various grid sizes on three key propeller performance parameters: thrust coefficient KT, torque coefficient KQ, and propeller open water efficiency η0. The analysis covers a range of operating conditions, with the advance coefficient J increasing from 0.6 to 1.4. To assess the accuracy of the computational results, an average error εAvg was calculated for each grid size. This error was determined by comparing the computational results with experimental data across the entire range of J values (0.6 to 1.4). The data presented in Table 2 reveal that the computational results for the three different grid sizes show only minor variations. This suggests that the calculations have low sensitivity to grid resolution. Notably, the computational results for the base grid sizes of 3.15 mm and 4.5 mm demonstrate particularly close alignment. Furthermore, the average errors of KT, KQ, and η0 tend to stabilize as grid resolution increases. This stabilization indicates that the computational results may be approaching a grid-independent solution, a crucial benchmark in computational fluid dynamics studies.
Considering the balance between computational accuracy and computational resource consumption, this study ultimately selects the configuration with a base mesh size of 4.5 mm for subsequent numerical simulation research. This selection maintains an adequate computational precision while moderating computational expenses to a certain degree.
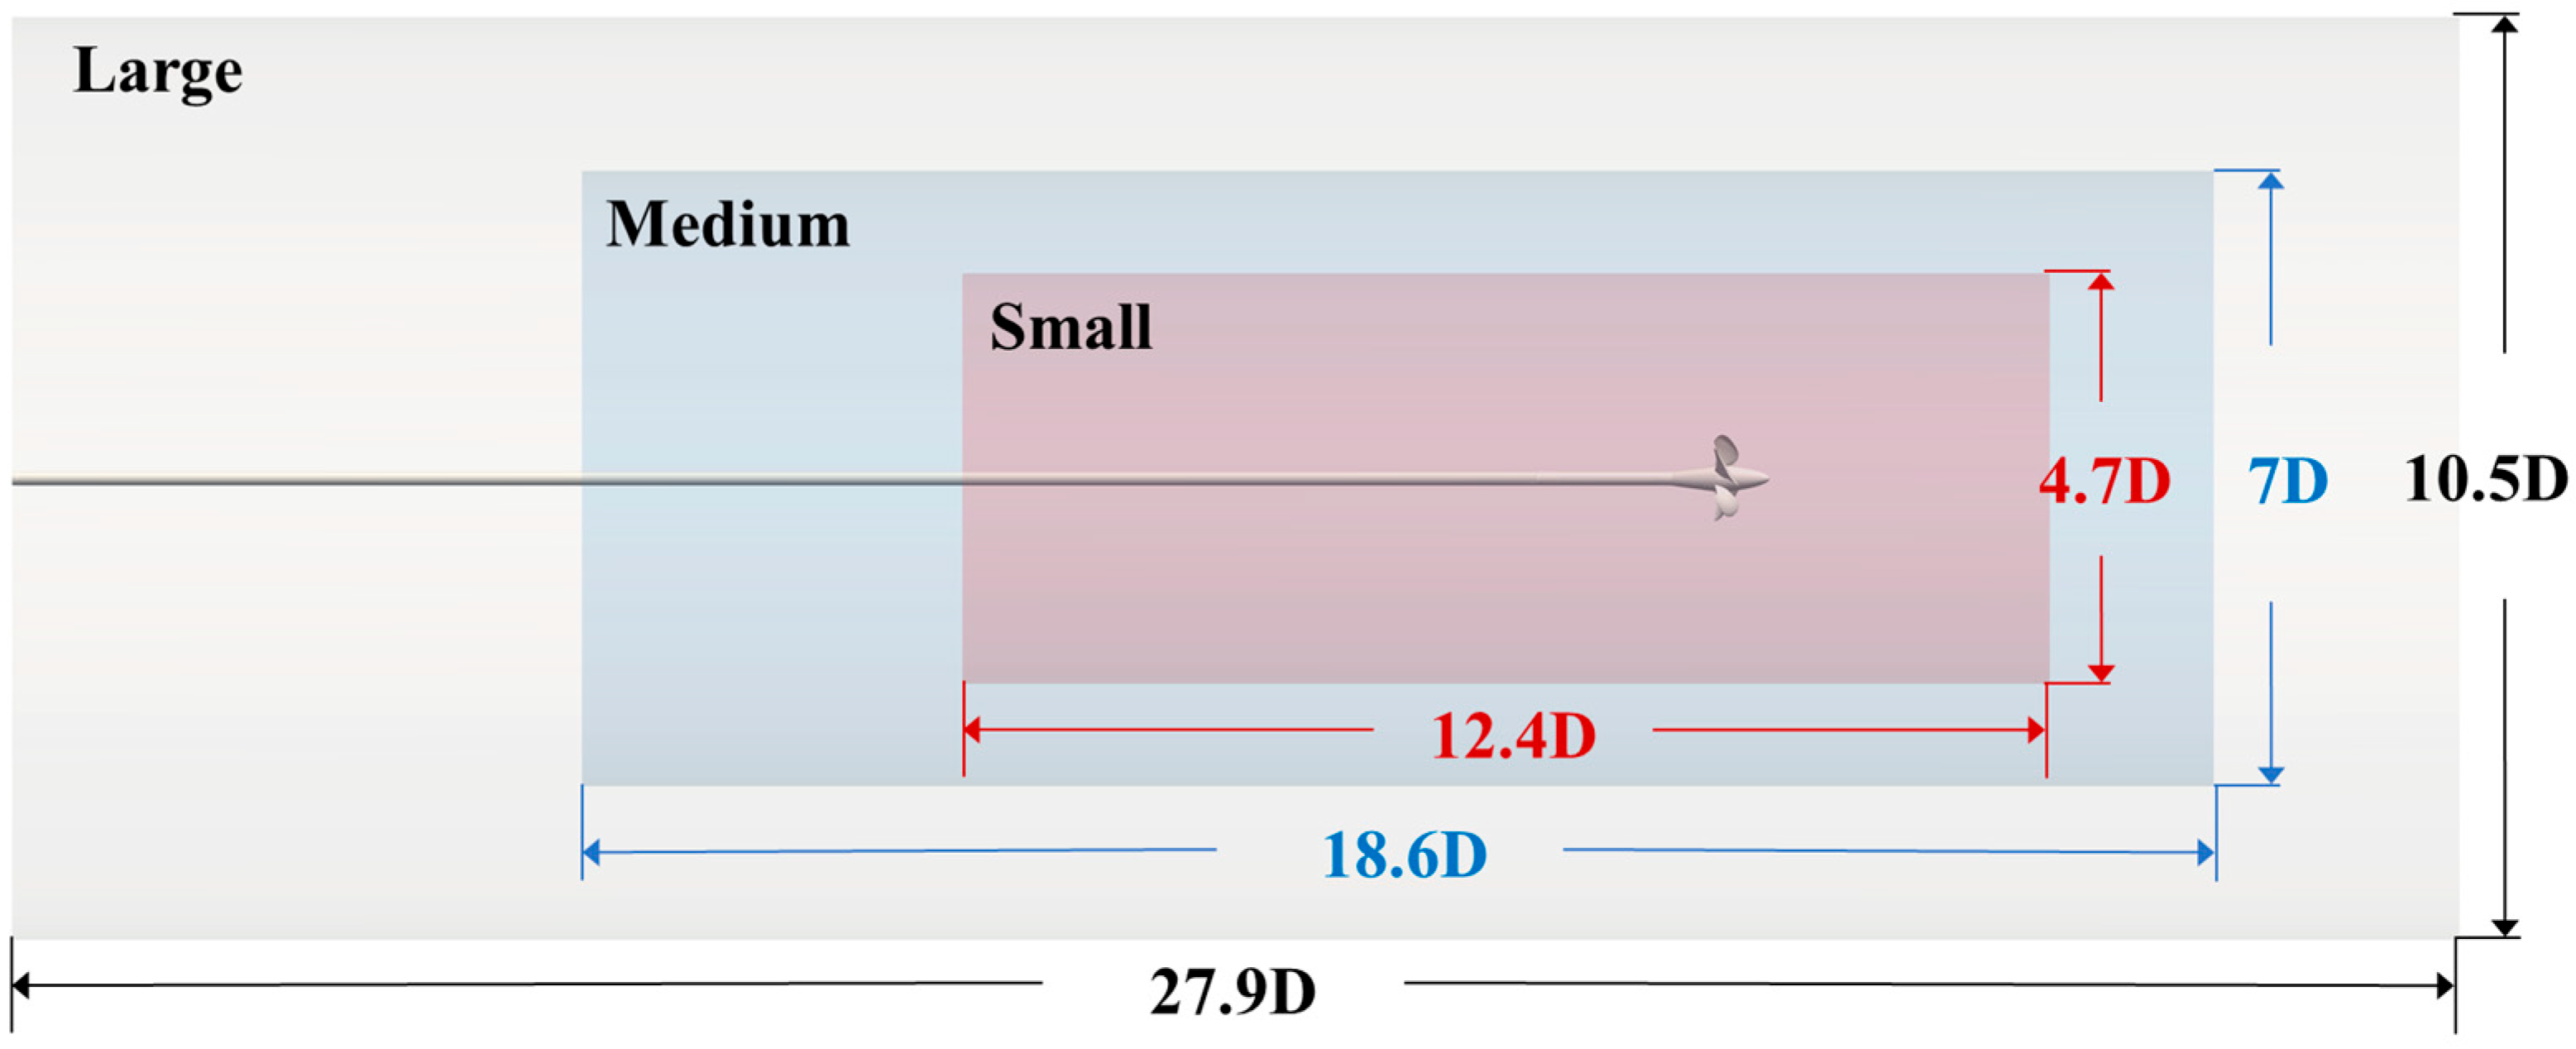
To examine the effect of computational domain dimensions on numerical simulation outcomes, this study performed a domain independence investigation. Three sets of computational domains with varying dimensions were compared, with each successive domain size increasing by a factor of 1.5, and the detailed parameters are illustrated in Figure 5.
The mesh generation strategy and solver settings were kept constant, with only the computational domain size being varied. As presented in Table 3, all three domain sizes exhibited strong consistency in their predictions of propeller performance parameters. Under all operating conditions (J = 0.6–1.4), the differences in thrust coefficient KT, torque coefficient KQ, and open water efficiency η0 among the three domains were minimal. In general, the results from the medium and large computational domains showed strong agreement, and taking into account the trade-off between computational resource utilization and numerical prediction accuracy; the medium-sized computational domain was selected as the standard configuration for subsequent studies.

3.5. Hardware and Computational Conditions

To assess the performance disparity between GPU acceleration and pure CPU environments in propeller hydrodynamics CFD, numerical simulations were performed on two distinct hardware platforms in this study. CPU-based computations were performed on a system equipped with an AMD EPYC 7551P processor (Advanced Micro Devices, Inc., Santa Clara, CA, USA), which has 32 physical cores and 64 logical threads. The system was outfitted with 128 GB of DDR4 memory, utilizing 8 × 16 GB modules operating at a frequency of 2666 MHz. For GPU-accelerated computing, a cluster consisting of four NVIDIA Tesla M40 GPUs (NVIDIA Corporation, Santa Clara, CA, USA) was utilized. Each Tesla M40 is equipped with 3072 CUDA cores and 24 GB of GDDR5 video memory. It should be noted that GPU CUDA cores are fundamentally different from traditional CPU cores: CUDA cores are stream processors specifically designed for the parallel processing of simple computations, while CPU cores are general-purpose processors optimized for complex serial calculations. This architectural difference makes GPUs particularly suitable for handling the massive parallel numerical computations in CFD. Table 4 presents the detailed specifications of both hardware platforms.
Regarding the software environment, Ubuntu 22.04 LTS served as the operating system, while OpenFOAM version v2312 was employed. The library versions required for GPU acceleration were CUDA 11.2 and AmgX 2.5.0, respectively.
Previous CFD studies have shown that different mesh types can significantly affect the accuracy of computational results and computational efficiency [44,45]. To comprehensively evaluate the acceleration effect of GPUs in CFD simulations of propeller open water performance, this study conducted calculations on pure CPU platforms with 1, 8, 16, and 32 cores, as well as GPU platforms with 1–4 graphics cards. Taking into account the potential influence of mesh types on GPU acceleration performance, the research discretized the computational domain using tetrahedral, hex-dominant, and polyhedral meshes independently. The evaluation includes two aspects: (1) under the same mesh scale, i.e., with a base mesh size of 4.5 mm (determined based on the investigation results in Section 3.4); and (2) with the same number of mesh elements (3.3 million), by adjusting the mesh sizes of tetrahedral mesh and polyhedral grids to approximate the number of elements in the 4.5 mm hex-dominant mesh. This approach allows for a comprehensive investigation of GPU acceleration effects under different conditions. Figure 6 shows the discretization effects of the three mesh types on the computational domain.
Simulations for each mesh type were performed across a range of advance ratios J, spanning from 0.6 to 1.4, using an increment of 0.2. To guarantee the convergence of computational results, simulations for each advance coefficient were executed for 1000 iterations, culminating in a total of 5000 iterations across the full spectrum of J values. The assessment of computational efficiency was conducted by measuring the total duration required to complete all simulations for each combination of hardware configuration and mesh type.

4. Results and Discussion

4.1. Impact of GPU Solver and Mesh Type on Computational Outcomes

Figure 7 shows the comparison between the computational results obtained from CPU and GPU platforms and the experimental data. The results indicate that the computational results from CPU and GPU exhibit high consistency across the entire range of advance coefficients. Both computational platforms show good agreement with experimental data in predicting the thrust coefficient KT and torque coefficient 10 KQ. The open water efficiency η0 predictions generally conform to experimental trends, matching well at lower advance coefficients, but show a slight underestimation as the advance coefficient J increases, especially for higher advance coefficients J > 1.2. The agreement between CPU and GPU platform results suggests that, although the GPU solver utilizes external libraries, the implementation of GPU acceleration does not compromise the accuracy of CFD simulation results for propeller performance predictions when configured similarly to the CPU solver.
Figure 8 demonstrates the effect of various mesh types, all with a base size of 4.5 mm, on simulation outcomes, contrasted against experimental data. The findings indicate that throughout the full spectrum of advance ratios, the results from the three mesh types (tetrahedral, hex-dominant, and polyhedral) are highly consistent, with only subtle variations noted. These minimal discrepancies indicate that, for a given mesh size, the selection of mesh type has no substantial impact on the prediction of propeller performance in this research.
Given the high consistency between CPU and GPU computational results, it can be inferred that they also exhibit consistency in the spatial distribution of other physical quantities, a conclusion that was also verified in the study [19]. To further investigate the subtle differences between various mesh types, this study compared the pressure distribution, vorticity conditions, and velocity distribution around the propeller for each mesh type.
Figure 9 illustrates the pressure distribution across the propeller for various mesh configurations. Notably, the three mesh types generate qualitatively comparable pressure distribution patterns on the propeller surface, suggesting their consistent capability in capturing the overall fluid dynamic phenomena. Nevertheless, the polyhedral mesh displays a marginally broader pressure range compared to the other two mesh types, especially in areas of negative pressure.
In analyzing vorticity distribution, this research employs the Q-criterion to identify vortical structures. Figure 10 presents the iso-surface at Q = 2500, facilitating comparison of vortex computations across various mesh types in the flow field. The findings demonstrate that all three mesh types effectively captured the propeller’s tip vortices and wake structures, representing the primary flow features around the propeller. However, there are differences in detail performance among different mesh types: 1. Tetrahedral mesh—vortex breakdown and dissipation are visible at the end of the vortex tube, with some small breaks and discontinuities. 2. Hex-dominant mesh—produces the longest vortex tube structure, with overall results similar to the tetrahedral mesh but smoother. 3. Polyhedral mesh—the computed flow field vortex structure dissipates considerably faster than the other two, with vortical structures becoming largely indiscernible downstream. The vortex structure clarity falls between that of tetrahedral and hexahedral meshes, though more closely resembling the hexahedral outcomes.
As shown in Figure 11, all three simulations consistently capture the main flow features, including high-velocity regions near the propeller blade tips and, in the wake, as well as low-velocity areas upstream of the propeller and in the blade root region. However, notable variations in resolution and flow feature definition are evident among the different mesh types. The tetrahedral mesh (Figure 11a) displays more diffuse velocity contours, particularly in the wake region, suggesting a higher level of numerical diffusion. In contrast, the hexahedral-dominant mesh (Figure 11b) shows sharper velocity gradients and clearer wake structures, indicating a superior resolution of flow features. The polyhedral mesh (Figure 11c) appears to strike a balance between the other two, presenting relatively sharp gradients and well-defined wake structures while potentially offering advantages in computational efficiency. These differences in mesh performance highlight the importance of mesh selection in accurately resolving complex flow structures around marine propellers.
The variations in performance among different mesh types in flow field simulation hold substantial practical significance for propeller design and performance assessment. Tetrahedral meshes, though easily generated for complex geometries and thus commonly used in preliminary design phases, exhibit high numerical diffusion that compromises the accuracy of vortex characteristics and consequently reduces flow field prediction accuracy. Under equivalent mesh sizes, polyhedral meshes offer the advantage of reduced element count, thereby conserving computational resources and providing flexibility for complex geometries; however, their relatively lower local accuracy makes them less effective than hexahedral meshes in capturing flow details (such as vortex separation or fine vortical structures) in high Reynolds number flows.
In the design process, the influence of mesh type on results is critical for applications demanding high simulation accuracy, such as propeller noise prediction. Tetrahedral and polyhedral meshes lose some flow field details at the same mesh size, thereby affecting the final prediction results. Therefore, for design phases pursuing high-precision predictions, hexahedral-dominant meshes are more suitable due to their superior performance in capturing boundary layer flows and detailed vortical structures.

4.2. Native CPU Solver Parallel Efficiency

To quantify the acceleration effect of multiple cores or multiple GPUs, the speedup factor Sf is defined as follows:
S f = T 1 T n
where T1 is the total computation time using a single CPU core or single GPU, and Tn is the total computation time using n CPU cores or n GPUs.
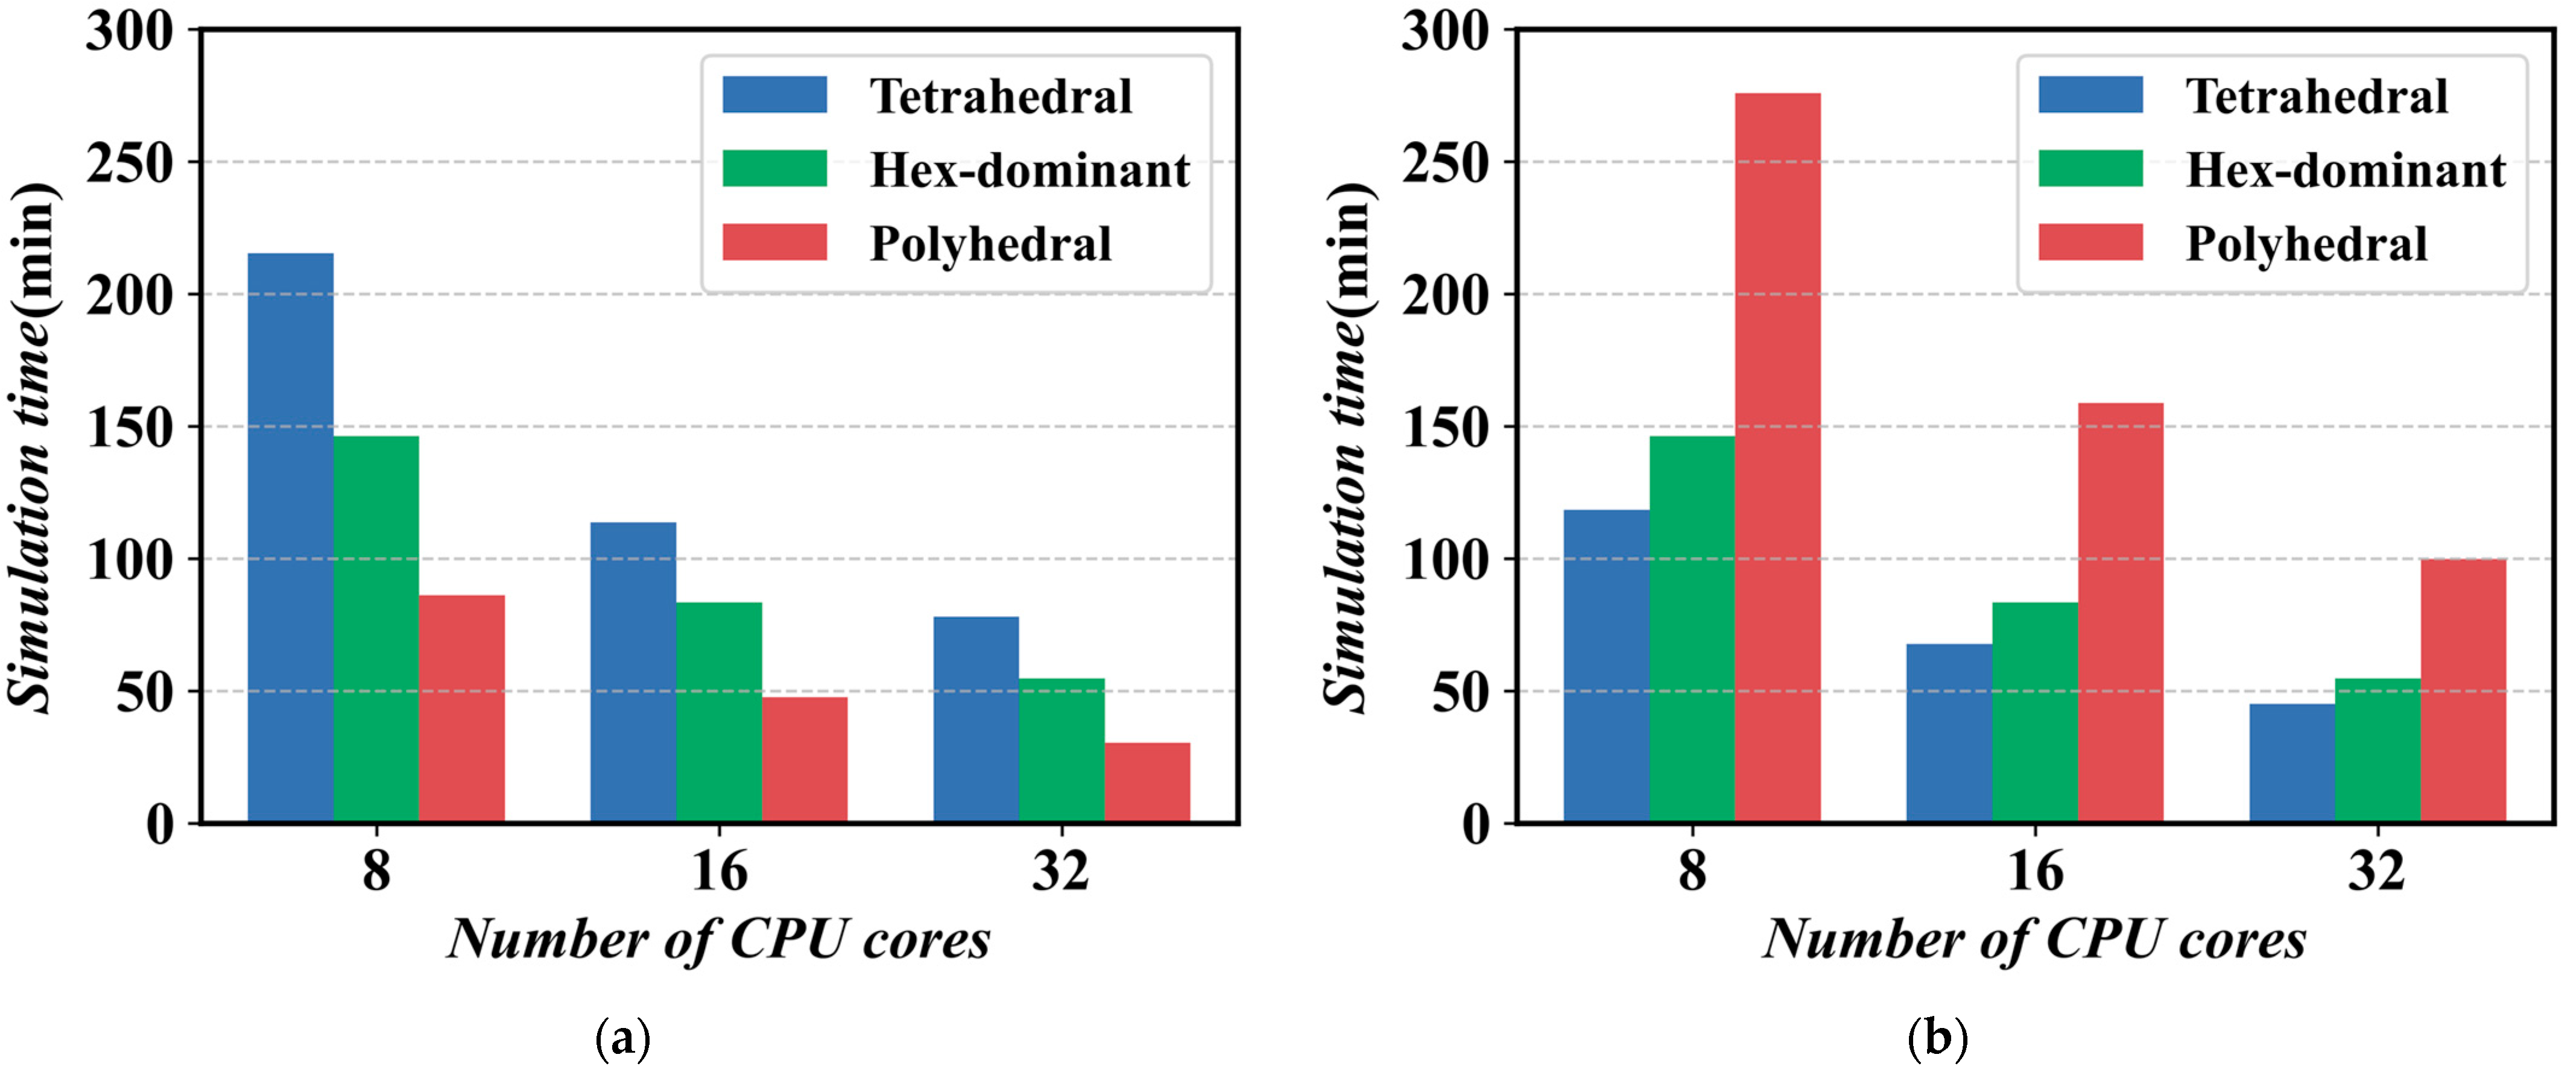
Figure 12a shows the variation in computation time with the number of CPU cores for different element types (tetrahedral, hexahedral, and polyhedral) at a fixed grid size of 4.5 mm. All grid types exhibit a consistent trend of decreasing computation time as the number of cores increases. Tetrahedral elements show the highest computation time, followed by hex-dominant and polyhedral elements. This outcome is expected, given that for the same grid size, tetrahedral meshes have the highest number of elements, followed by hexahedral-dominant meshes, with polyhedral meshes having the least. The most significant reduction in computation time occurs during the transition from 8 to 16 cores, with diminishing returns observed beyond 16 cores.
Conversely, Figure 12b illustrates how computation time varies with CPU core count for different mesh types, while keeping the number of grid cells constant at approximately 3.3 million. Similar to the fixed grid size case, the computation time decreases significantly as the number of cores increases. However, in this instance, polyhedral meshes consistently demonstrate the longest computation times across all core configurations, while tetrahedral meshes exhibit the shortest. This contrasting behavior highlights the importance of considering both grid size and cell count when evaluating mesh performance and computational efficiency.
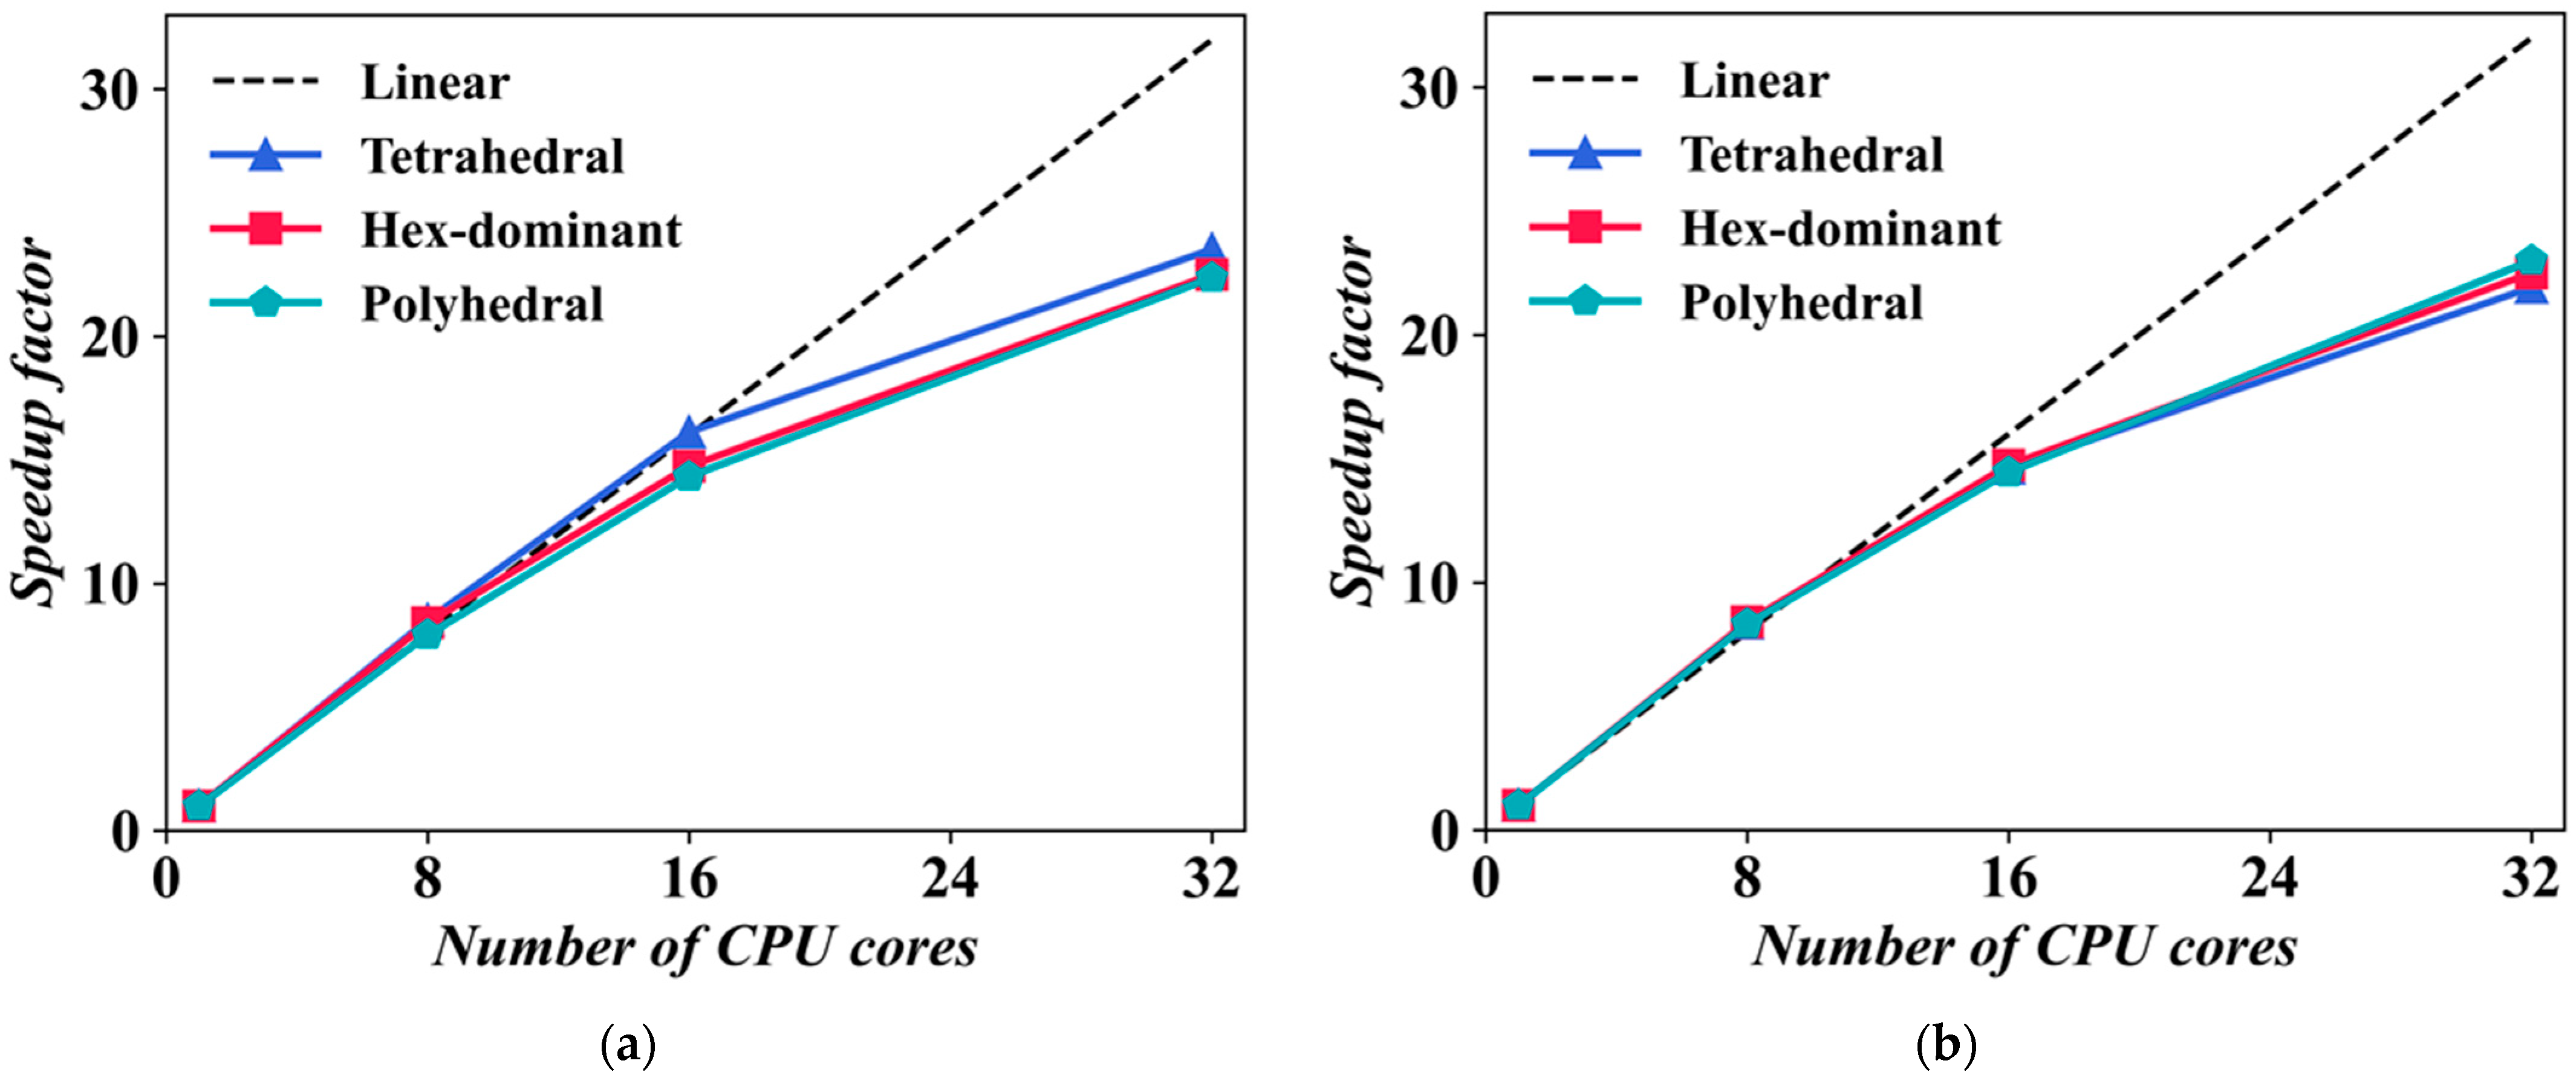
Figure 13a displays the speedup curves for various mesh types, using a base grid size of 4.5 mm. All mesh types exhibit good scalability, showing increased speedup as the core count rises. For core counts under 16, the actual speedup closely approximates the ideal linear speedup. However, as the core count increases to 32, the speedup efficiency begins to decline, with actual speedup falling below the ideal linear speedup. This reduction in efficiency may be attributed to factors such as increased communication overhead and load imbalance.
Figure 13b provides the speedup curves for the case of fixed grid count. Compared to the fixed grid size case, the speedup curves for the three mesh types are more similar. At the 32-core configuration, all mesh types achieve a speedup of approximately 22 times, mirroring the results from the fixed grid size case. This similarity in performance across different mesh types and configurations suggests that the scalability of the simulation is primarily influenced by the computational resources rather than the specific mesh characteristics when the number of grid cells is held constant.
Under the native CPU solver, OpenFOAM demonstrates good parallel scalability, achieving an over 20-fold speedup with a 32-core configuration, similar to the fixed grid size case. While mesh type has some impact on parallel efficiency, this influence diminishes as the number of cores increases. For fixed grid size, polyhedral meshes show slightly higher parallel efficiency, whereas tetrahedral meshes perform marginally better for fixed grid count. The performance curves of the three mesh types are closer in the fixed grid count case, possibly due to the constant problem size, resulting in more consistent effects of parallel overhead. These observations suggest that the choice of mesh type may have varying impacts on parallel performance depending on whether grid size or cell count is held constant, highlighting the importance of considering both factors in optimizing computational efficiency.

4.3. GPU Solver Parallel Efficiency

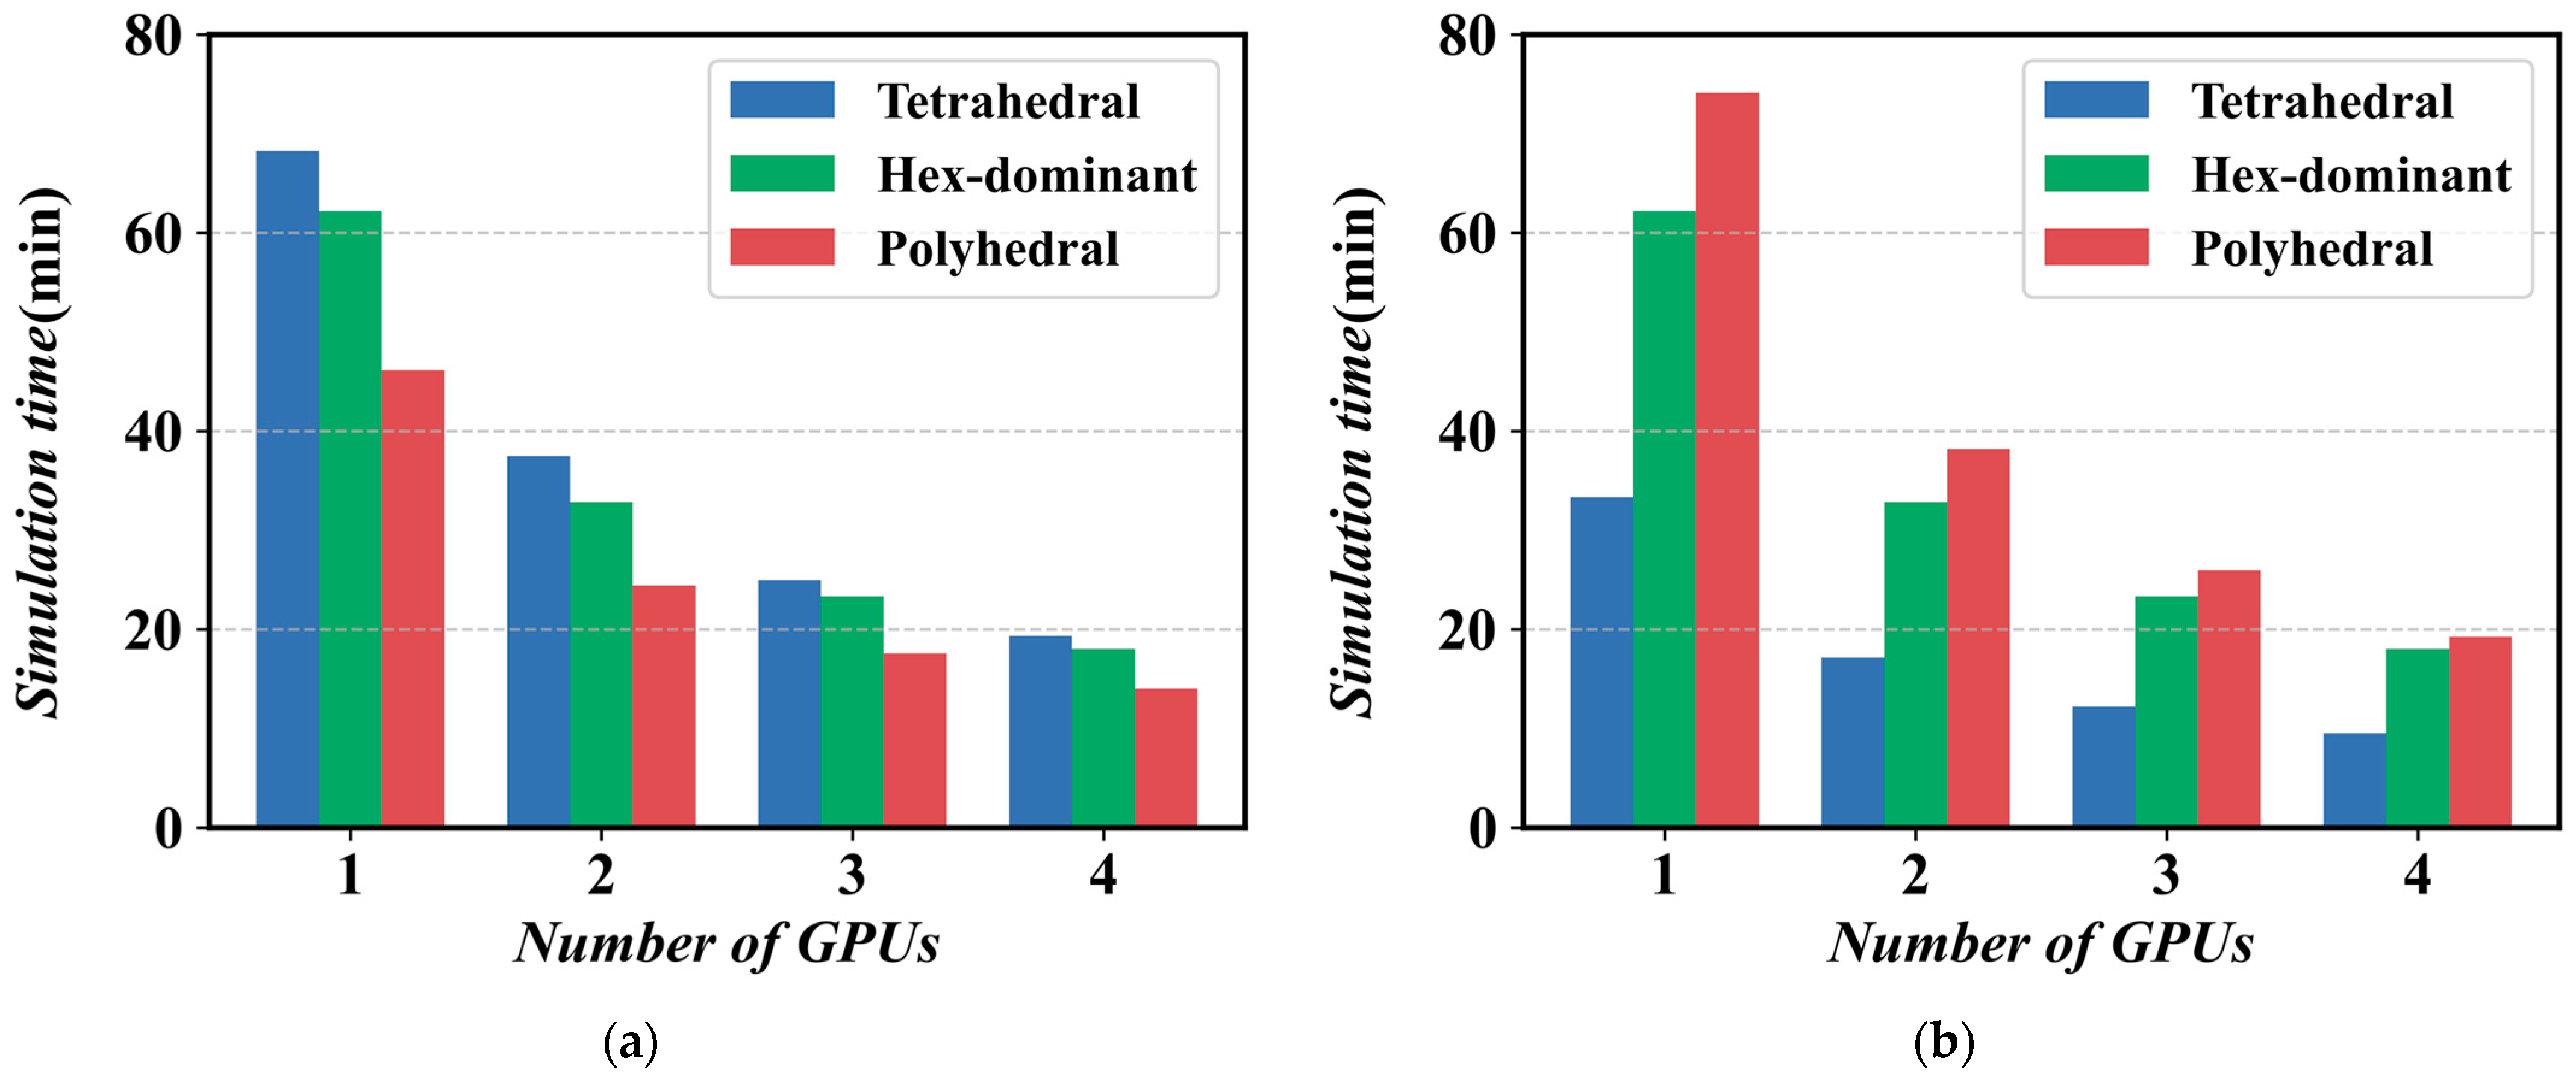
Continuing the evaluation of the GPU solver’s parallel performance based on the AmgX library in propeller CFD simulations, Figure 14a illustrates how computation time varies for different mesh types as the number of GPUs increases, using a base mesh size of 4.5 mm. For all mesh types, computation time decreases significantly with an increasing number of GPUs. In a single GPU configuration, the tetrahedral mesh requires the longest computation time, while the polyhedral mesh requires the shortest. As the number of GPUs increases to four, this difference gradually diminishes, though the polyhedral mesh consistently maintains a slight advantage in computation time.
Figure 14b demonstrates the variation in computation time for different mesh types as the number of GPUs changes, while maintaining a constant mesh count of approximately 3.3 million elements. Compared to the fixed mesh size scenario, the reduction in computation time is more pronounced. Interestingly, in a single GPU configuration, the polyhedral mesh now requires the longest computation time, while the tetrahedral mesh requires the shortest—a stark contrast to the fixed mesh size case.
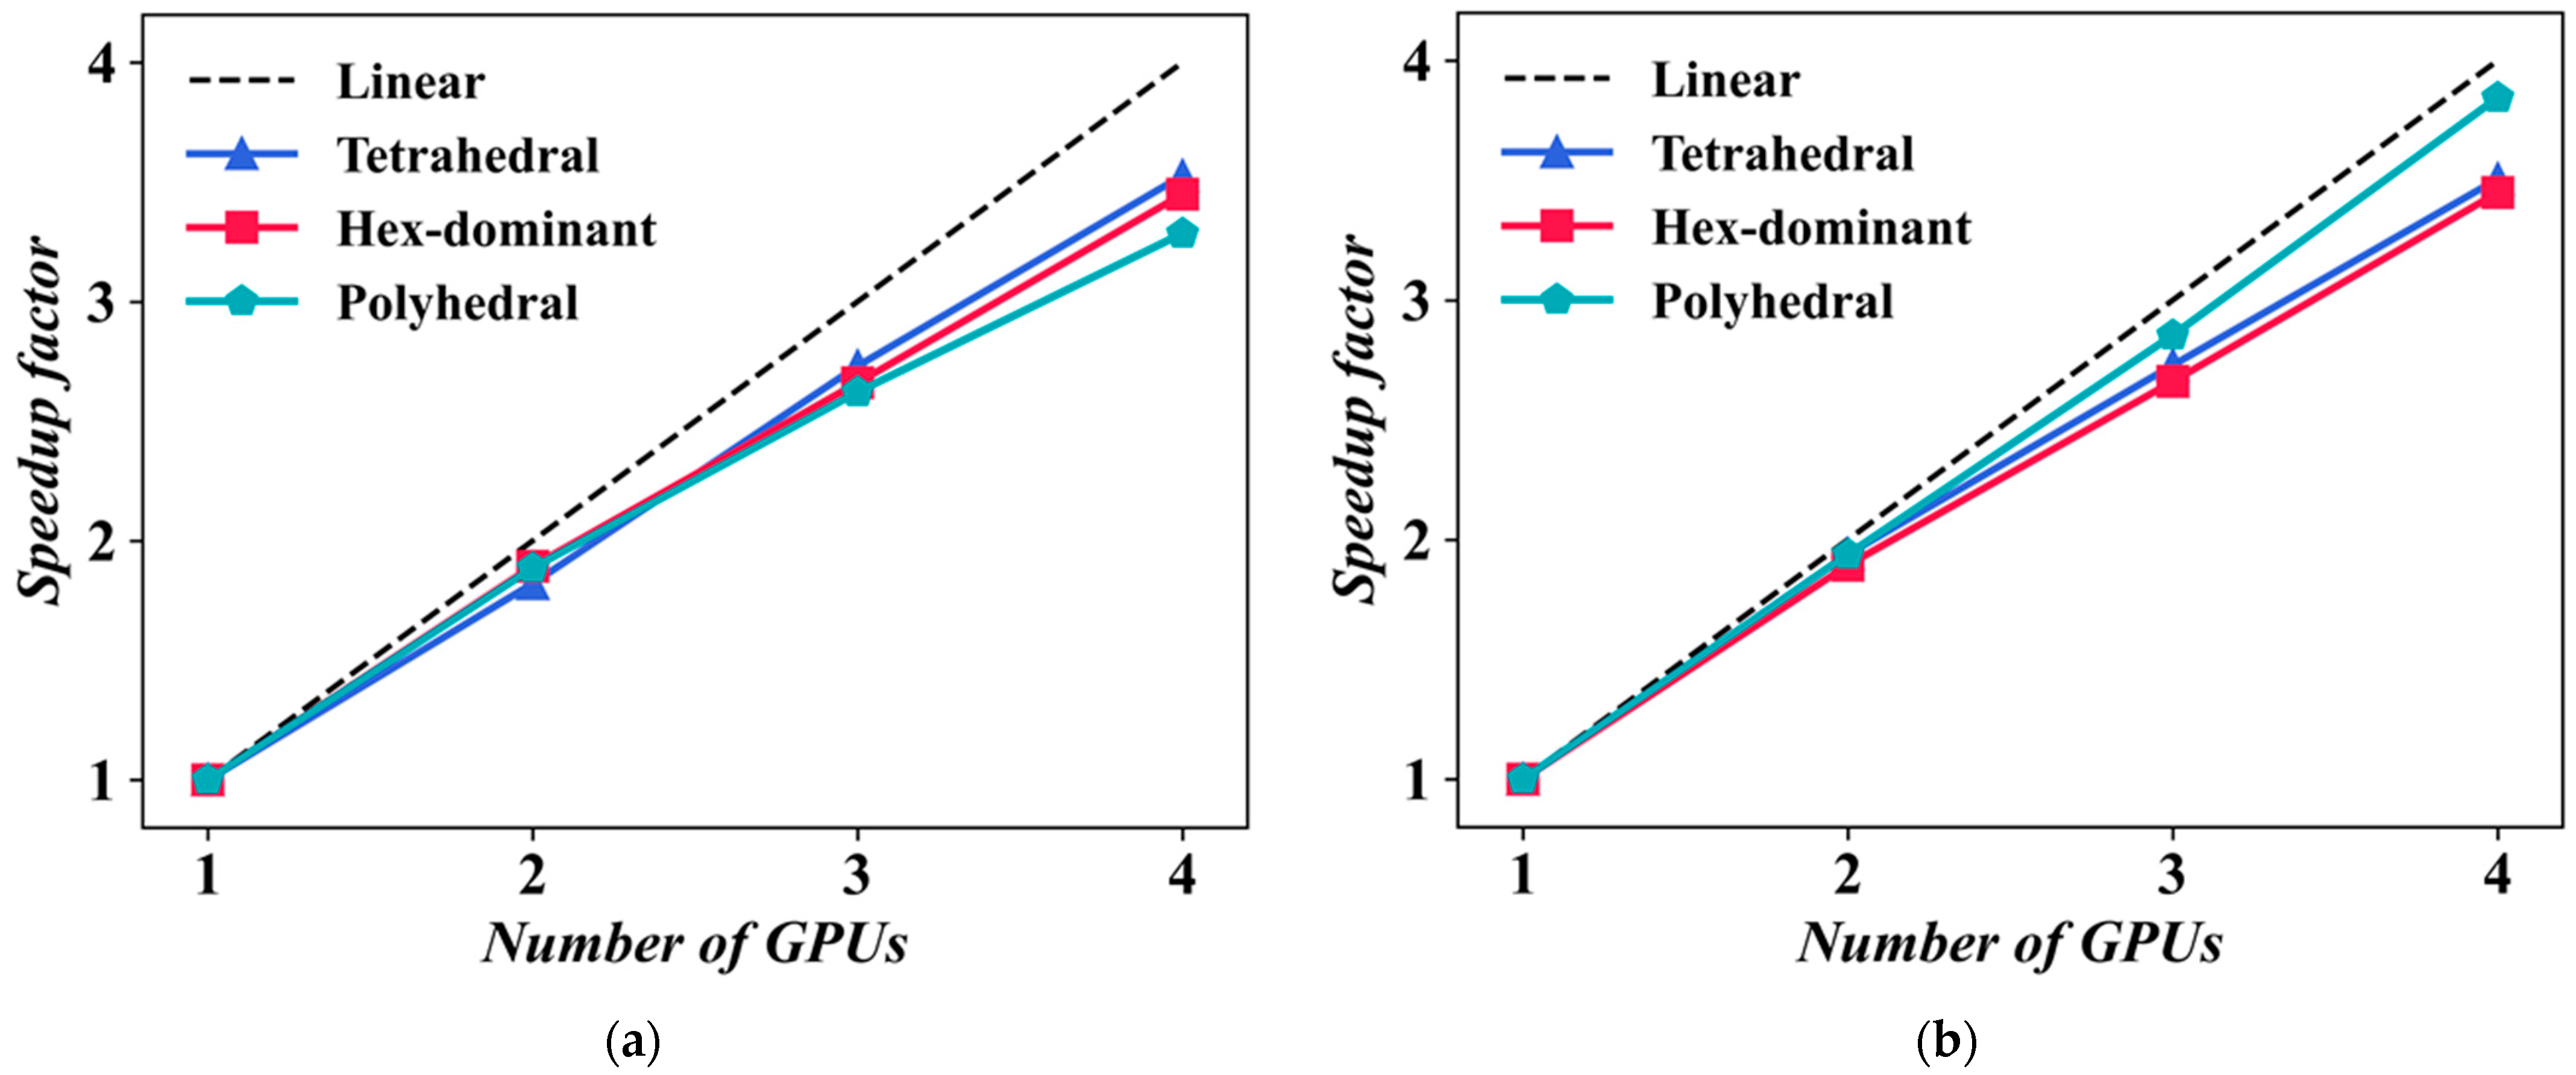
Figure 15a presents the corresponding speedup curves. All mesh types exhibit good scalability, with speedup increasing as the number of GPUs increases. Notably, in the 2 GPU configuration, the actual speedup approaches the ideal linear speedup. However, when the number of GPUs increases to three and four, the acceleration efficiency begins to decline slightly, with the actual speedup falling below the ideal linear acceleration. This decrease in efficiency may be attributed to factors such as increased inter-GPU communication overhead and load imbalance. In the 4 GPU configuration, the tetrahedral mesh achieves the highest speedup (about 3.5 times), while the polyhedral mesh has the lowest speedup (about 3.3 times).
Figure 15b illustrates the speedup curves for the case of fixed mesh count. In contrast to the fixed mesh size scenario, the differences in speedup curves among the three mesh types are more pronounced. In the 4 GPU configuration, the polyhedral mesh achieves the highest speedup (about 3.9 times), approaching ideal linear acceleration. The tetrahedral and hexahedral meshes have relatively lower speedups, both about 3.5 times. This result suggests that for large-scale problems, polyhedral meshes may be more suitable for GPU parallel computing.
A comparison between fixed mesh size and fixed mesh count scenarios in GPU solver applications reveals several key findings: The GPU solver utilizing the AmgX library demonstrates superior parallel scalability, achieving speedups of 3.3 to 3.9 times under a 4 GPU setup. This performance markedly outpaces conventional CPU parallel approaches. Mesh type substantially influences GPU parallel efficiency, with this effect being more pronounced in the fixed mesh count scenario. For large-scale problems, polyhedral meshes exhibit optimal GPU parallel efficiency. Significant disparities in GPU parallel efficiency performance are observed between fixed mesh size and fixed mesh count conditions.
These observations suggest that problem scale significantly influences GPU acceleration effects. In practical applications, it is, therefore, crucial to comprehensively consider both mesh type and problem scale to optimize performance.

4.4. Acceleration Effect of GPU Compared to CPU Solvers

Using the computation time of all 32 cores of the AMD EPYC-7551p CPU as the reference baseline, the acceleration ratio RA is defined as follows:
R A = T n T 32
where T32 corresponds to the total computation time using 32 CPU cores.
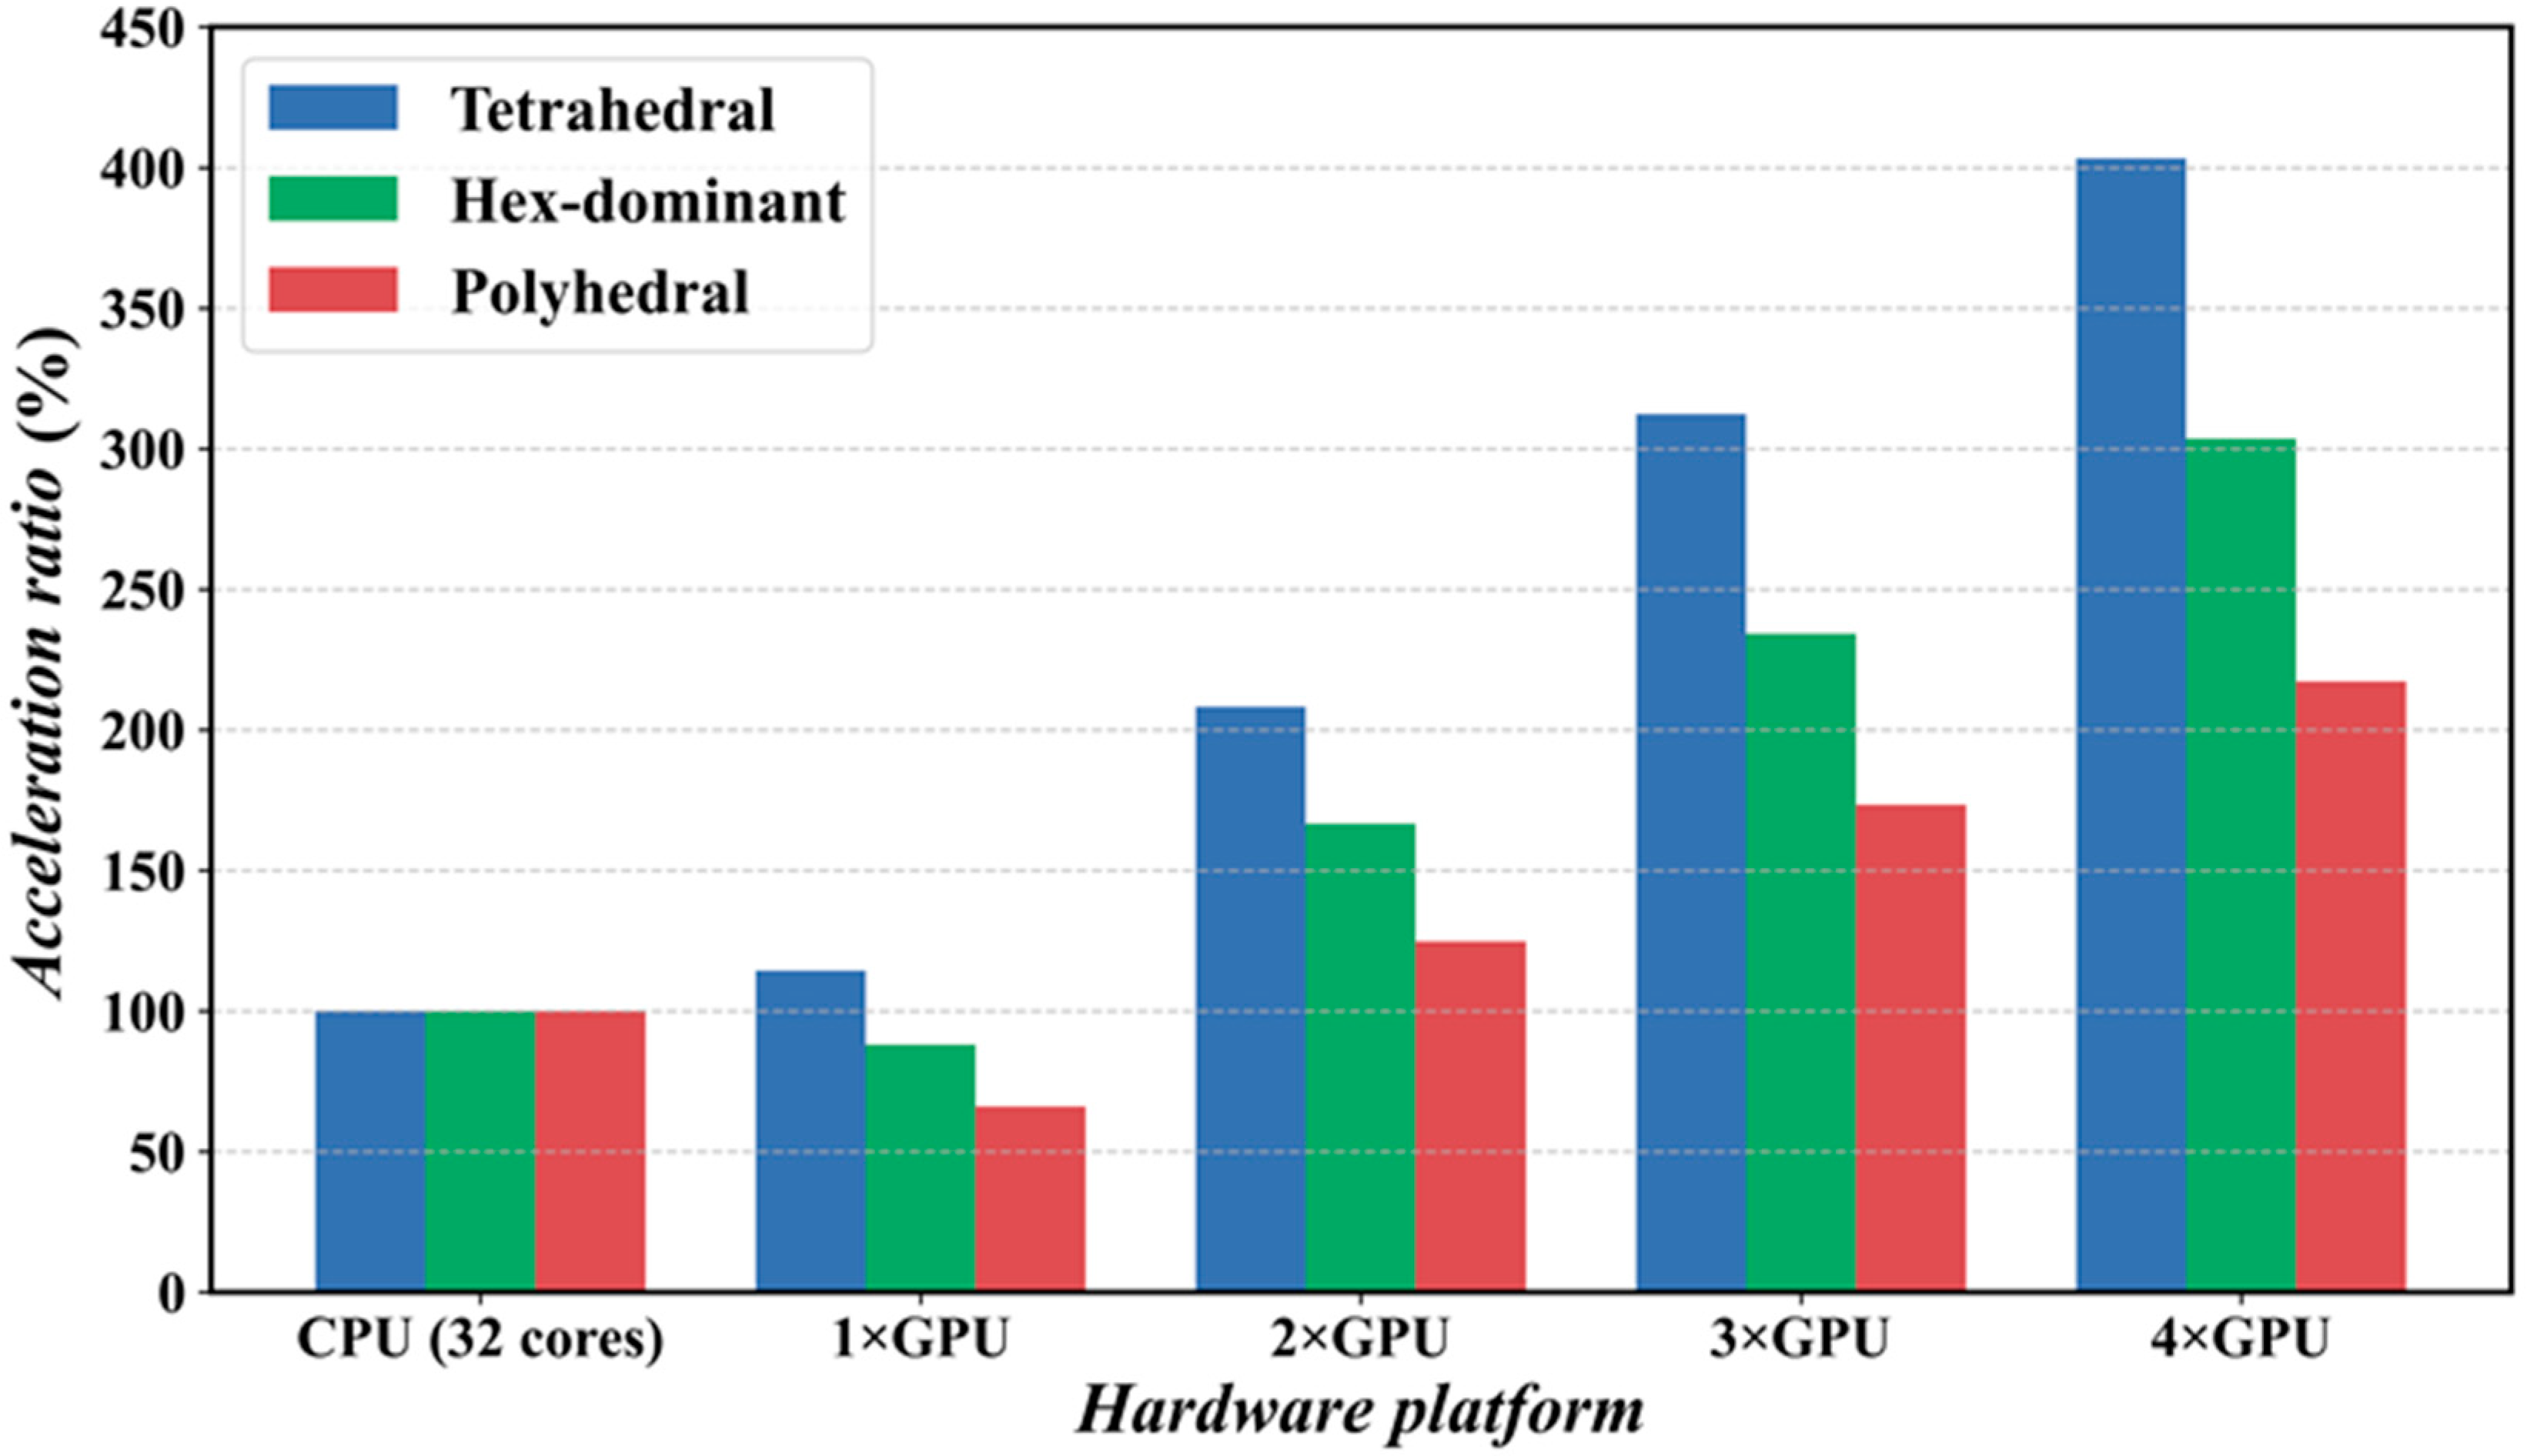
The following analysis compares the advantages of AmgX-based GPU acceleration over native CPU solvers in propeller CFD simulations. Figure 16 illustrates the speedup of different GPU configurations relative to a 32-core CPU, using a base mesh size of 4.5 mm. The 32-core solution time for each mesh serves as the 100% baseline.
Results indicate that even a single GPU configuration can achieve an efficiency comparable to that of a 32-core CPU. As the number of GPUs increases, the acceleration effect improves significantly. Tetrahedral meshes demonstrate the most substantial GPU acceleration effect. A single GPU configuration achieved a speedup of about 117%, while the 4 GPU configuration reached 402%, more than four times faster than the 32-core CPU.
Hexahedron-dominated and polyhedral meshes also showed good acceleration effects, albeit less pronounced than tetrahedral meshes. In the 4 GPU configuration, hexahedron-dominated and polyhedral meshes achieved speedups of 305% and 219%, respectively.
Notably, different mesh types exhibit varying characteristics in GPU acceleration. Tetrahedral meshes show a nearly linear increase in speedup as the number of GPUs increases, compared to the native 32-core CPU. In contrast, hexahedron-dominated and polyhedral meshes exhibit a more gradual trend in speedup growth relative to the CPU.
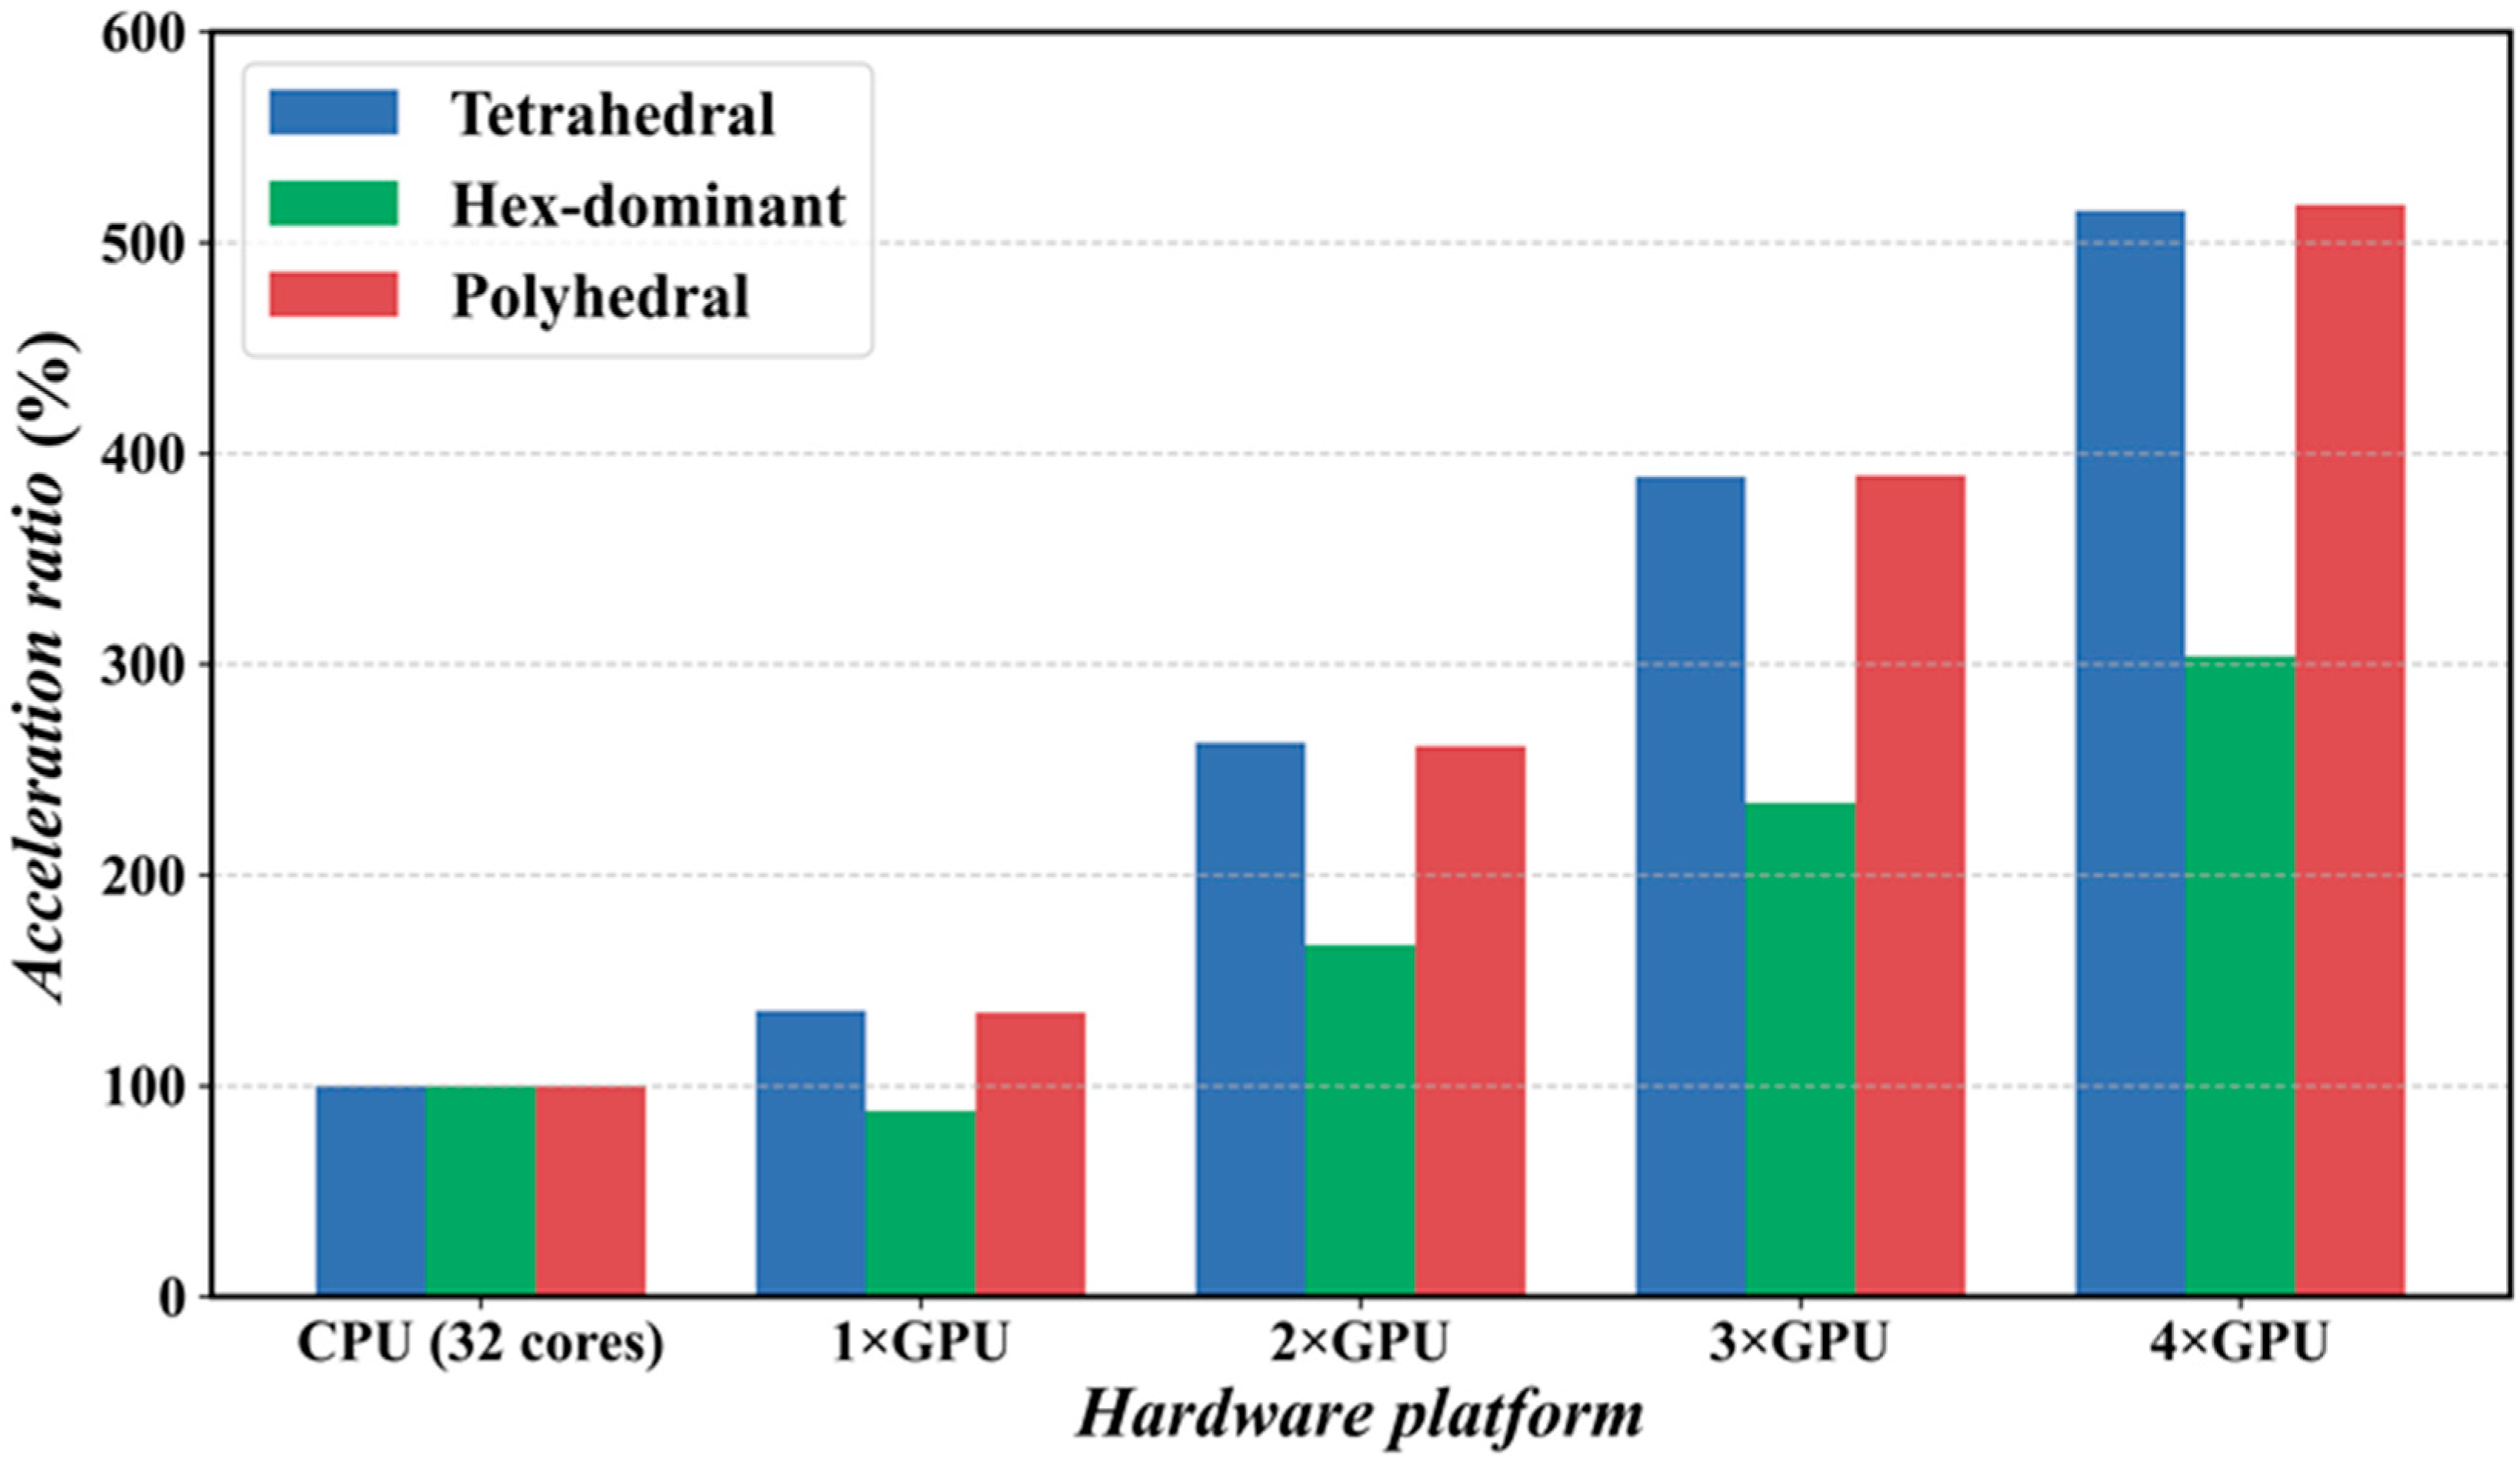
Figure 17 illustrates the speedup of different GPU configurations relative to a 32-core CPU for a fixed grid size (approximately 3.3 million cells). Compared to the variable grid size scenario, the acceleration effect of GPUs is more pronounced, indicating that GPUs have a significant advantage in handling large-scale problems.
In this fixed grid size case, polyhedral meshes demonstrate the best GPU acceleration performance. With a 4 GPU configuration, polyhedral meshes achieve over 500% speedup compared to CPU, which is five times faster than a 32-core CPU. Tetrahedral meshes follow closely, also reaching over 500% speedup. Hexahedron-dominated meshes, although showing relatively weaker acceleration, still achieve a 300% speedup with a 4 GPU configuration.
Notably, for a constant grid count, the increase in GPU number results in a more pronounced enhancement of the acceleration ratio. This observation suggests that when dealing with large-scale problems, increasing the number of GPUs can more effectively improve computational efficiency.
A comparative analysis of GPU and CPU performance under various conditions reveals significant advantages for GPUs in propeller CFD simulations, particularly when handling large-scale problems. Even a single GPU configuration can approach the performance of a 32-core CPU in most scenarios.
The mesh type significantly impacts GPU acceleration effects. With a fixed grid size, tetrahedral meshes achieve maximum acceleration, while polyhedral meshes perform best with a fixed number of grid cells. This observation underscores the importance of considering both problem scale and hardware configuration when selecting mesh types.
GPU acceleration effects are closely correlated with problem scale. When dealing with large-scale problems (such as 3.3 million grid cells), the advantages of GPUs become more pronounced. This indicates that GPUs are particularly well-suited for computationally intensive, large-scale CFD simulation tasks.

5. Conclusions

This study systematically evaluates the application of GPU acceleration technology based on the AmgX library in CFD simulations of propeller open water performance. Numerical simulations of the VP1304 propeller model were used to compare the performance of GPU acceleration against traditional CPU methods across various hardware setups and mesh types. Key findings are as follows:
1.
GPU acceleration substantially enhanced the computational efficiency of propeller CFD simulations. In a 4 GPU setup, tetrahedral meshes achieved more than 400% speedup, while polyhedral meshes exceeded 500% speedup under fixed grid count conditions. This suggests that GPU acceleration techniques have the potential to dramatically reduce propeller design and optimization timelines.
2.
The type of mesh significantly influences the effectiveness of GPU acceleration. For fixed grid sizes, tetrahedral meshes showed the highest acceleration, whereas for fixed grid counts, polyhedral meshes demonstrated optimal performance. This discovery offers valuable insights for refining mesh strategies in GPU-accelerated CFD simulations.
3.
The efficiency of GPU acceleration is strongly correlated with the scale of the problem. For large-scale problems, GPUs show more significant advantages, suggesting they are especially well-suited for computationally demanding, large-scale CFD simulation tasks. Results from GPU and CPU computations show high consistency and good agreement with experimental data, confirming the reliability of GPU acceleration methods.
This research constitutes the first systematic assessment of GPU acceleration in propeller CFD simulation, delivering quantitative comparisons of GPU acceleration performance across various mesh types, thereby providing valuable insights for optimizing CFD simulations in marine engineering. The findings demonstrate that GPU acceleration technology shows promising potential for substantially enhancing the efficiency of propeller design and performance assessment. Nevertheless, GPU-based CFD simulation continues to face certain challenges, including mesh size limitations imposed by single GPU memory capacity and substantial hardware investment requirements. Future research could expand the application of GPU-accelerated CFD technology to other aspects of naval and marine engineering, including hull hydrodynamic performance computations and propeller cavitation characteristics analysis. This advancement will facilitate the broader adoption of GPU acceleration technology in naval and marine engineering CFD simulations, offering substantial support for industry advancement.

Author Contributions

Conceptualization (research design), Y.Z., Y.L. and W.W.; methodology (numerical and experimental), Y.Z. and J.G.; software (numerical calculations), Y.Z.; validation (experimental validation), Y.Z., J.G. and Y.L.; formal analysis (data analysis), Y.Z. and J.G.; investigation (literature search), Y.Z. and Y.L.; resources, W.W.; data curation, Y.Z. and Y.L.; writing—original draft preparation, Y.Z.; writing—review and editing, Y.Z., J.G. and W.W.; visualization (making diagrams and charts), Y.Z.; supervision, W.W.; project administration, W.W.; funding acquisition, W.W. All authors have read and agreed to the published version of the manuscript.

Funding

This research received no funding.

Institutional Review Board Statement

Not applicable.

Informed Consent Statement

Not applicable.

Data Availability Statement

The data presented in this study are available in this article (in tables and figures).

Conflicts of Interest

The authors declare that the research was conducted in the absence of any commercial or financial relationships that could be construed as potential conflicts of interest.

References

  1. Gropp, W.D.; Kaushik, D.K.; Keyes, D.E.; Smith, B.F. Latency, Bandwidth, and Concurrent Issue Limitations in High-Performance CFD; Argonne National Lab: Lemont, IL, USA, 2000. [Google Scholar]
  2. Bandi, A.; Adapa, P.V.S.R.; Kuchi, Y.E.V.P.K. The Power of Generative AI: A Review of Requirements, Models, Input–Output Formats, Evaluation Metrics, and Challenges. Future Internet 2023, 15, 260. [Google Scholar] [CrossRef]
  3. Majumder, P.; Maity, S. A Critical Review of Different Works on Marine Propellers over the Last Three Decades. Ships Offshore Struct. 2022, 18, 391–413. [Google Scholar] [CrossRef]
  4. Grlj, C.G.; Degiuli, N.; Tuković, Ž.; Farkas, A.; Martić, I. The Effect of Loading Conditions and Ship Speed on the Wind and Air Resistance of a Containership. Ocean Eng. 2023, 273, 113991. [Google Scholar] [CrossRef]
  5. Farkas, A.; Degiuli, N.; Tomljenović, I.; Martić, I. Numerical Investigation of Interference Effects for the Delft 372 Catamaran. Proc. Inst. Mech. Eng. Part M J. Eng. Marit. Environ. 2024, 238, 385–394. [Google Scholar] [CrossRef]
  6. Kim, K.-W.; Paik, K.-J.; Lee, J.-H.; Song, S.-S.; Atlar, M.; Demirel, Y.K. A Study on the Efficient Numerical Analysis for the Prediction of Full-Scale Propeller Performance Using CFD. Ocean Eng. 2021, 240, 109931. [Google Scholar] [CrossRef]
  7. Agrawal, S.; Kumar, M.; Roy, S. Demonstration of GPGPU-Accelerated Computational Fluid Dynamic Calculations. In Proceedings of the Intelligent Computing and Applications; Mandal, D., Kar, R., Das, S., Panigrahi, B.K., Eds.; Springer: New Delhi, India, 2015; pp. 519–525. [Google Scholar]
  8. Pickering, B.P.; Jackson, C.W.; Scogland, T.R.W.; Feng, W.-C.; Roy, C.J. Directive-Based GPU Programming for Computational Fluid Dynamics. Comput. Fluids 2015, 114, 242–253. [Google Scholar] [CrossRef]
  9. Niemeyer, K.E.; Sung, C.-J. Recent Progress and Challenges in Exploiting Graphics Processors in Computational Fluid Dynamics. J. Supercomput. 2014, 67, 528–564. [Google Scholar] [CrossRef]
  10. Trimulyono, A.; Atthariq, H.; Chrismianto, D.; Samuel, S. Investigation of sloshing in the prismatic tank with vertical and t-shape baffles. Brodogradnja 2022, 73, 43–58. [Google Scholar] [CrossRef]
  11. Wu, E.; Liu, Y.; Liu, X. An Improved Study of Real-Time Fluid Simulation on GPU. Comput. Animat. Virtual 2004, 15, 139–146. [Google Scholar] [CrossRef]
  12. Harris, M. Fast Fluid Dynamics Simulation on the GPU. In Proceedings of the ACM SIGGRAPH 2005 Courses on—SIGGRAPH ’05, Los Angeles, CA, USA, 31 July–4 August 2005; ACM Press: Los Angeles, CA, USA, 2005; p. 220. [Google Scholar]
  13. Stam, J. Stable Fluids. In Seminal Graphics Papers: Pushing the Boundaries; Whitton, M.C., Ed.; ACM: New York, NY, USA, 2023; Volume 2, pp. 779–786. ISBN 9798400708978. [Google Scholar]
  14. Jespersen, D.C. Acceleration of a CFD Code with a GPU. Sci. Program. 2010, 18, 564806. [Google Scholar] [CrossRef]
  15. Brandvik, T.; Pullan, G. Acceleration of a Two-Dimensional Euler Flow Solver Using Commodity Graphics Hardware. Proc. Inst. Mech. Eng. Part C J. Mech. Eng. Sci. 2007, 221, 1745–1748. [Google Scholar] [CrossRef]
  16. Brandvik, T.; Pullan, G. Acceleration of a 3D Euler Solver Using Commodity Graphics Hardware. In Proceedings of the 46th AIAA Aerospace Sciences Meeting and Exhibit; American Institute of Aeronautics and Astronautics, Reno, NV, USA, 7 January 2008. [Google Scholar]
  17. Brandvik, T.; Pullan, G. An Accelerated 3D Navier-Stokes Solver for Flows in Turbomachines. In Proceedings of the ASME Turbo Expo 2009: Power for Land, Sea and Air, Orlando FL, USA, 8–12 June 2009. [Google Scholar]
  18. Dyson, J. GPU Accelerated Linear System Solvers for OpenFOAM and Their Application to Sprays. Ph.D. Thesis, Brunel University of London, London, UK, 2018. [Google Scholar]
  19. Piscaglia, F.; Ghioldi, F. GPU Acceleration of CFD Simulations in OpenFOAM. Aerospace 2023, 10, 792. [Google Scholar] [CrossRef]
  20. Grlj, C.G.; Degiuli, N.; Farkas, A.; Martić, I. Numerical Study of Scale Effects on Open Water Propeller Performance. J. Mar. Sci. Eng. 2022, 10, 1132. [Google Scholar] [CrossRef]
  21. Dong, X.-Q.; Li, W.; Yang, C.-J.; Noblesse, F. RANSE-Based Simulation and Analysis of Scale Effects on Open-Water Performance of the PPTC-II Benchmark Propeller. J. Ocean. Eng. Sci. 2018, 3, 186–204. [Google Scholar] [CrossRef]
  22. Permadi, N.V.A.; Sugianto, E. CFD Simulation Model for Optimum Design of B-Series Propeller Using Multiple Reference Frame (MRF). CFD Lett. 2022, 14, 22–39. [Google Scholar] [CrossRef]
  23. Van-Vu, H.; Le, T.-H.; Thien, D.M.; Tao, T.V.; Ngoc, T.T. Numerical Study of the Scale Effect on Flow Around a Propeller Using the CFD Method. Pol. Marit. Res. 2024, 31, 59–66. [Google Scholar] [CrossRef]
  24. Liu, Y.; Wan, D. Energy Saving Mechanism of Propeller with Endplates at Blade Tips. In Proceedings of the International Conference on Computational Methods ICCM 2019, Beijing, China, 9–14 June 2019. [Google Scholar]
  25. Bahatmaka, A.; Kim, D.-J.; Zhang, Y. Verification of CFD Method for Meshing Analysis on the Propeller Performance with OpenFOAM. In Proceedings of the 2018 International Conference on Computing, Electronics & Communications Engineering (iCCECE), University of Essex, Southend, UK, 16–17 August 2018; pp. 302–306. [Google Scholar]
  26. Vargas Loureiro, E.; Oliveira, N.L.; Hallak, P.H.; De Souza Bastos, F.; Rocha, L.M.; Grande Pancini Delmonte, R.; De Castro Lemonge, A.C. Evaluation of Low Fidelity and CFD Methods for the Aerodynamic Performance of a Small Propeller. Aerosp. Sci. Technol. 2021, 108, 106402. [Google Scholar] [CrossRef]
  27. Yurtseven, A.; Aktay, K. The Numerical Investigation of Spindle Torque for a Controllable Pitch Propeller in Feathering Maneuver. Brodogradnja 2023, 74, 95–108. [Google Scholar] [CrossRef]
  28. Dubbioso, G.; Muscari, R.; Mascio, A.D. CFD Analysis of Propeller Performance in Oblique Flow. In Proceedings of the Third International Symposium on Marine Propulsors, Launceston, Australia, 5–8 May 2023. [Google Scholar]
  29. Rhee, S.H.; Joshi, S. CFD Validation for a Marine Propeller Using an Unstructured Mesh Based RANS Method. In Proceedings of the ASME/JSME 2003 4th Joint Fluids Summer Engineering Conference, Honolulu, HI, USA, 6–10 July 2003; Volume 1: Fora, Parts A, B, C and D, pp. 1157–1163. [Google Scholar]
  30. Lee, B.-S.; Jung, M.-S.; Kwon, O.-J.; Kang, H.-J. Numerical Simulation of Rotor-Fuselage Aerodynamic Interaction Using an Unstructured Overset Mesh Technique. Int. J. Aeronaut. Space Sci. 2010, 11, 1–9. [Google Scholar] [CrossRef]
  31. Naumov, M.; Arsaev, M.; Castonguay, P.; Cohen, J.; Demouth, J.; Eaton, J.; Layton, S.; Markovskiy, N.; Reguly, I.; Sakharnykh, N.; et al. AmgX: A Library for GPU Accelerated Algebraic Multigrid and Preconditioned Iterative Methods. SIAM J. Sci. Comput. 2015, 37, S602–S626. [Google Scholar] [CrossRef]
  32. Stone, C.P.; Walden, A.; Zubair, M.; Nielsen, E.J. Accelerating Unstructured-Grid CFD Algorithms on NVIDIA and AMD GPUs. In Proceedings of the 2021 IEEE/ACM 11th Workshop on Irregular Applications: Architectures and Algorithms (IA3), St. Louis, MO, USA, 15 November 2021; pp. 19–26. [Google Scholar]
  33. Rathnayake, T.; Jayasena, S.; Narayana, M. Openfoam on GPUS Using AMGX. In Proceedings of the 25th High Performance Computing Symposium, Virginia Beach, VA, USA, 23–26 April 2017. [Google Scholar]
  34. Bna, S.; Spisso, I.; Olesen, M.; Rossi, G. PETSc4FOAM: A Library to Plug-in PETSc into the OpenFOAM Framework. Zenodo, 6 June 2020. Available online: https://www.semanticscholar.org/paper/PETSc4FOAM%3A-a-library-to-plug-in-PETSc-into-the-Bn%C3%A0-Spisso/0234a490ba9a3647a5ed4f35bee9a70f07cb2e49 (accessed on 24 September 2024).
  35. openfoam/FOAM2CSR·GitLab. Available online: https://gitlab.hpc.cineca.it/openfoam/foam2csr (accessed on 24 September 2024).
  36. SVA_report_3752. Available online: https://www.sva-potsdam.de/wp-content/uploads/2016/04/SVA_report_3752.pdf (accessed on 24 September 2024).
  37. Menter, F.R. Two-Equation Eddy-Viscosity Turbulence Models for Engineering Applications. AIAA J. 1994, 32, 1598–1605. [Google Scholar] [CrossRef]
  38. Yang, Y.; Gu, M.; Chen, S.; Jin, X. New Inflow Boundary Conditions for Modelling the Neutral Equilibrium Atmospheric Boundary Layer in Computational Wind Engineering. J. Wind. Eng. Ind. Aerodyn. 2009, 97, 88–95. [Google Scholar] [CrossRef]
  39. Sawant, N.; Yamakawa, S.; Singh, S.; Shimada, K. Automatic Hex-Dominant Mesh Generation for Complex Flow Configurations. SAE Int. J. Engines 2018, 11, 615–624. [Google Scholar] [CrossRef]
  40. Zhang, R.; Lam, K.P.; Zhang, Y. Conformal Adaptive Hexahedral-Dominant Mesh Generation for CFD Simulation in Architectural Design Applications. In Proceedings of the 2011 Winter Simulation Conference (WSC), Phoenix, AZ, USA, 11–14 December 2011; pp. 928–942. [Google Scholar]
  41. Ferziger, J.H.; Perić, M.; Street, R.L. Computational Methods for Fluid Dynamics; Springer International Publishing: Cham, Switzerland, 2020; ISBN 978-3-319-99691-2. [Google Scholar]
  42. Stern, F.; Wilson, R.V.; Coleman, H.W.; Paterson, E.G. Comprehensive Approach to Verification and Validation of CFD Simulations—Part 1: Methodology and Procedures. J. Fluids Eng. 2001, 123, 793–802. [Google Scholar] [CrossRef]
  43. Wilson, R.V.; Stern, F.; Coleman, H.W.; Paterson, E.G. Comprehensive Approach to Verification and Validation of CFD Simulations—Part 2: Application for Rans Simulation of a Cargo/Container Ship. J. Fluids Eng. 2001, 123, 803–810. [Google Scholar] [CrossRef]
  44. Duan, R.; Liu, W.; Xu, L.; Huang, Y.; Shen, X.; Lin, C.-H.; Liu, J.; Chen, Q.; Sasanapuri, B. Mesh Type and Number for the CFD Simulations of Air Distribution in an Aircraft Cabin. Numer. Heat. Transf. Part B Fundam. 2015, 67, 489–506. [Google Scholar] [CrossRef]
  45. Chawner, J.R.; Dannenhoffer, J.; Taylor, N.J. Geometry, Mesh Generation, and the CFD 2030 Vision. In Proceedings of the 46th American Institute of Aeronautics and Astronautics AIAA Fluid Dynamics Conference, Washington, DC, USA, 13 June 2016. [Google Scholar]
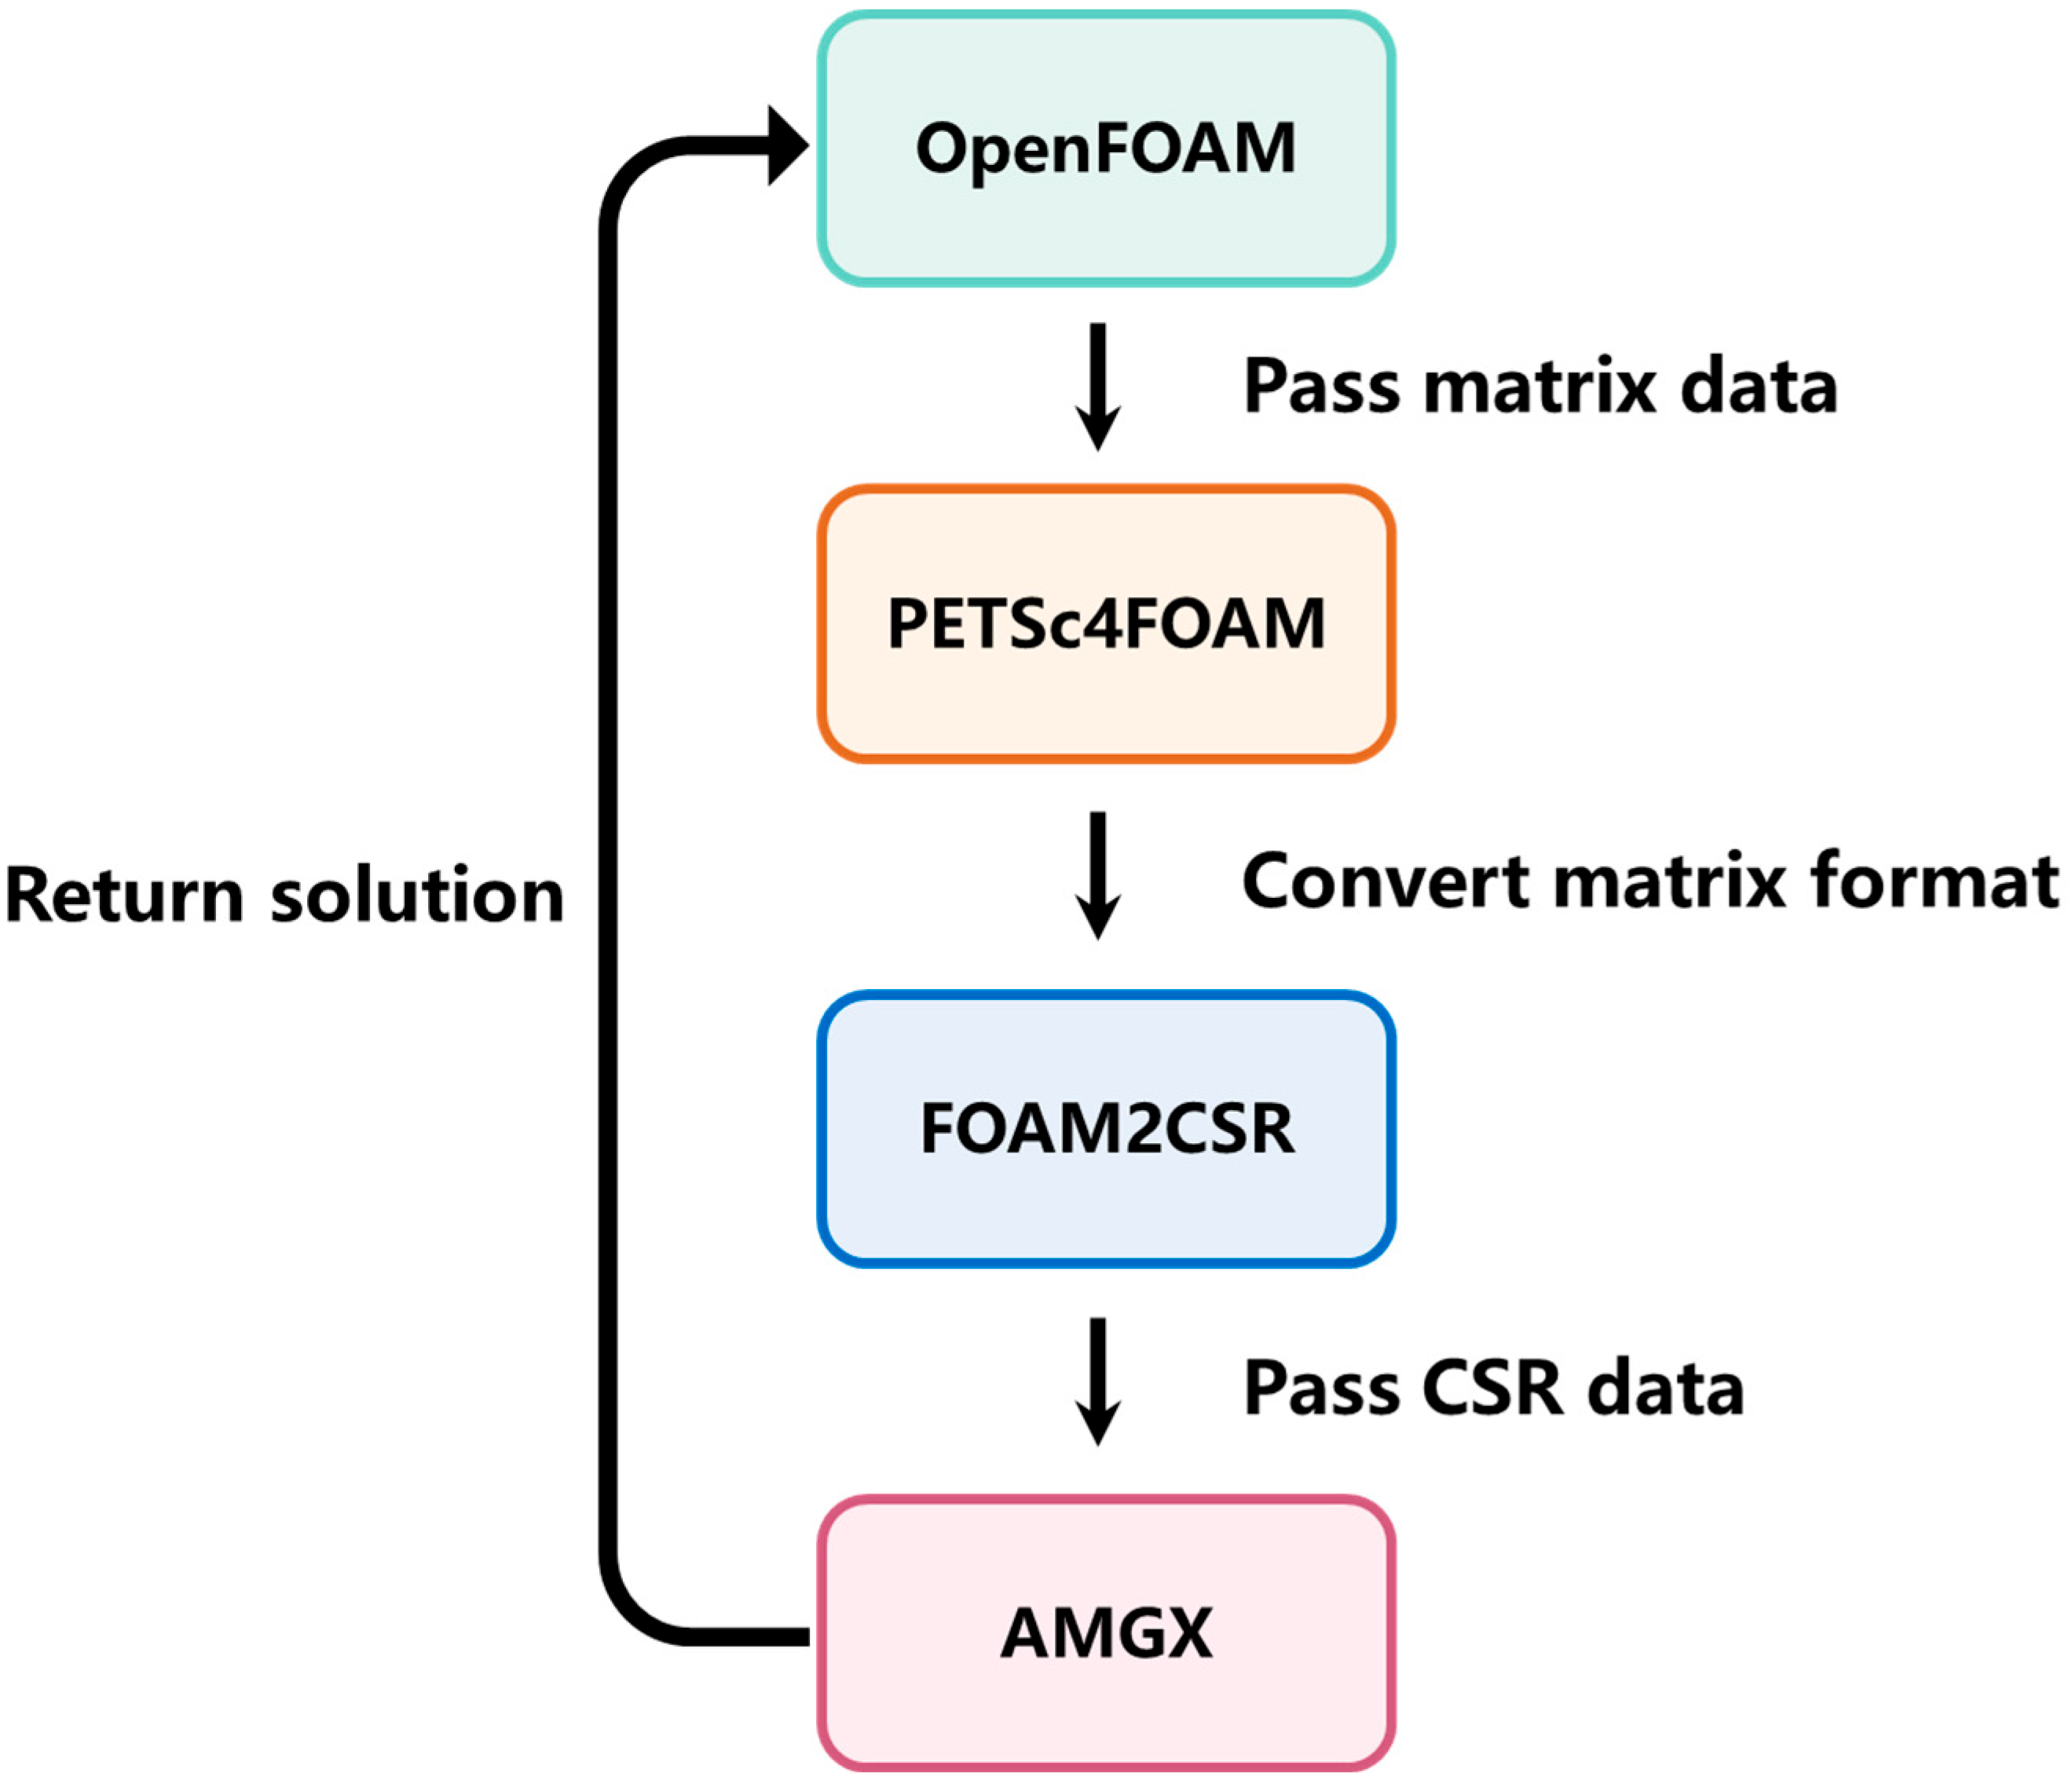
Figure 1. CFD simulation process accelerated through GPU in OpenFOAM.
Jmse 12 02134 g001
Figure 2. Geometric model of propeller VP1304. (a) Front view; (b) side view.
Jmse 12 02134 g002
Figure 3. Numerical simulation domain for open water performance of VP1304 propeller.
Jmse 12 02134 g003
Figure 4. Details of CFD mesh refinement.
Jmse 12 02134 g004
Figure 5. Comparative illustration of three computational domain dimensions (small, medium, and large).
Jmse 12 02134 g005
Figure 6. Different mesh types for CFD simulations. (a) Tetrahedral mesh; (b) hex-dominant mesh; (c) polyhedral mesh.
Jmse 12 02134 g006
Figure 7. Comparison of open water performance of propeller between simulation results on different hardware platforms and experimental data.
Jmse 12 02134 g007
Figure 8. Comparison of open water performance of propeller between simulation results using different grid types and experimental data, with a base size of 4.5 mm.
Jmse 12 02134 g008
Figure 9. Pressure distribution contour plots for different mesh types. (a) Tetrahedral mesh; (b) hex-dominant mesh; (c) polyhedral mesh.
Jmse 12 02134 g009
Figure 10. Vorticity distribution for different mesh types. (a) Tetrahedral mesh; (b) hex-dominant mesh; (c) polyhedral mesh.
Jmse 12 02134 g010
Figure 11. Velocity distribution for different mesh types. (a) Tetrahedral mesh; (b) hex-dominant mesh; (c) polyhedral mesh.
Jmse 12 02134 g011
Figure 12. Simulation time versus number of CPU cores for different mesh types. (a) Fixed mesh size (4.5 mm). (b) Fixed mesh count (3.3 million elements).
Jmse 12 02134 g012
Figure 13. Figure 12 speedup factor versus number of CPU cores for different element types. (a) Fixed mesh size (4.5 mm). (b) Fixed mesh count (3.3 million elements).
Jmse 12 02134 g013
Figure 14. Simulation time versus number of GPUs for different mesh types. (a) Fixed mesh size (4.5 mm). (b) Fixed mesh count (3.3 million elements).
Jmse 12 02134 g014
Figure 15. Speedup factor versus number of GPUs for different mesh types. (a) Fixed mesh size (4.5 mm). (b) Fixed mesh count (3.3 million elements).
Jmse 12 02134 g015
Figure 16. Speedup of different numbers of GPUs compared to 32-core CPU with consistent mesh size.
Jmse 12 02134 g016
Figure 17. Speedup of different numbers of GPUs compared to 32-core CPU with consistent mesh number.
Jmse 12 02134 g017
Table 1. Geometric parameters of VP1304.
ParameterUnitValue
Propellel diameterm0.25
Chord length (0.75 R)m0.106
Pitch ratio 1.635
Skew angle°18.837
Aera ratio 0.779
Number of blades 5
Table 2. Mesh independence results.
JKT10 KQη0
ExpGrid Size (mm)ExpGrid Size (mm)ExpGrid Size (mm)
3.154.56.3 3.154.56.3 3.154.56.3
0.60.629 0.619 0.607 0.617 1.396 1.439 1.440 1.444 0.430 0.411 0.409 0.402
0.80.510 0.500 0.496 0.501 1.178 1.211 1.213 1.220 0.551 0.525 0.525 0.518
1.00.399 0.384 0.381 0.387 0.975 0.992 0.993 1.005 0.652 0.615 0.615 0.604
1.20.295 0.272 0.270 0.275 0.776 0.774 0.775 0.787 0.726 0.670 0.670 0.656
1.40.188 0.158 0.152 0.162 0.559 0.538 0.538 0.552 0.749 0.655 0.652 0.613
εAvg-6.22%6.36%7.64%-2.31%2.37%2.52%-6.99%7.2%9.56%
Table 3. Simulation domain size independence results (S, M, and L represent small, medium, and large computational domains).
JKT10 KQη0
ExpSimulation DomainExpSimulation DomainExpSimulation Domain
SML SML SML
0.60.629 0.615 0.617 0.622 1.396 1.447 1.440 1.433 0.430 0.406 0.409 0.410
0.80.510 0.497 0.500 0.503 1.178 1.216 1.213 1.206 0.551 0.521 0.525 0.525
1.00.399 0.381 0.384 0.384 0.975 0.991 0.993 0.985 0.652 0.612 0.615 0.615
1.20.295 0.268 0.272 0.270 0.776 0.769 0.775 0.765 0.726 0.667 0.670 0.670
1.40.188 0.154 0.157 0.153 0.559 0.525 0.538 0.527 0.749 0.652 0.652 0.650
εAvg-7.3%6.36%6.64%-3.08%2.37%2.63%-7.66%7.2%7.19%
Table 4. Hardware specifications of CPU and GPU computing platform.
PlatformHardware ModelProcessor CoresMemory SizeNumber
CPUEPYC 7551p32 (Physical)128 GB1
GPUTesla M403072 (CUDA)24 GB4
Disclaimer/Publisher’s Note: The statements, opinions and data contained in all publications are solely those of the individual author(s) and contributor(s) and not of MDPI and/or the editor(s). MDPI and/or the editor(s) disclaim responsibility for any injury to people or property resulting from any ideas, methods, instructions or products referred to in the content.