1. Introduction
With the increasing depth of offshore oil and gas exploration and the growing complexity of marine environmental conditions, subsea production systems are gradually becoming one of the main modes of offshore oil and gas resource development [
1,
2,
3]. The Bohai Bay area, as a Chinese inland sea, hosts the Bohai Oilfield, which is the second largest oilfield in China, predominantly producing oil and gas from Bohai Bay [
4,
5]. However, the development of shallow-water areas has become significantly more challenging. The Bohai Sea area is busy with shipping and has a thriving fishing industry, making coordination for oil and gas field development difficult [
6].
Currently, there are dozens of oil fields in Bohai Bay whose development is restricted by navigation, involving hundreds of wells [
7]. This results in millions of tons of crude oil production being unreleased annually, with untapped crude oil reserves amounting to hundreds of millions of tons. This presents a severe challenge for increasing reserves and production in the Bohai Oilfield. To address this, the operator has innovatively proposed shifting the development of restricted area oil and gas fields from jacket platforms to subsea production systems, specifically the shallow-water subsea tree development model (see
Figure 1).
Subsea tree is an indispensable core component of subsea production systems, responsible for connecting oil and gas from deep reservoirs to external transport pipelines, controlling production rates, and enabling real-time monitoring and adjustment of production conditions [
8]. In shallow-water environments, subsea trees are installed on the seabed, particularly during the fourth stage of drilling, where they are positioned above the subsea wellhead. The tree connects to the drilling platform above via risers and the BOP on the platform deck, while also linking to the subsea wellhead below, creating a unique and complex wellbore environment [
9]. Unlike deepwater and conventional drilling operations, in this scenario, there is only one blowout preventer, which is located on the offshore platform, while the subsea tree is situated on the seabed in shallow water, with a flow path maintained between the two. Although this development model offers certain operational advantages, it also presents specific well control risks. These risks are particularly pronounced when dealing with the complex wellbore conditions in shallow-water environments, requiring more rigorous monitoring and risk management strategies. There are numerous risks in the drilling and completion stages under the shallow-water subsea tree development mode. Since this technology has just begun to be applied in China, related reliability studies are not yet mature, especially as a complete reliability analysis system for shallow-water oilfields has not been established [
1,
10,
11]. Currently, some scholars evaluate the risk of well control incidents based on quantitative risk analysis methods, including fault tree analysis, event tree analysis, analytic hierarchy process, fuzzy mathematics, bow-tie model, and Markov process [
12,
13,
14,
15,
16,
17]. However, conventional risk analysis methods are limited to specific fields or types of risks and are influenced by individual subjective judgment, making it difficult to consider comprehensively the complexity and diversity of the system and quantitatively analyze numerous risks.
This paper, based on the improved system-theoretic process analysis (STPA) and fault tree analysis (FTA), identifies and lists typical well control risk factors in the drilling stage of the shallow-water subsea tree development model through a systematic analysis framework. Combined with the DEMATEL method, the interrelationships and impacts of various factors within the system are explored in depth, high-weight risk factors are calculated, and detailed mitigation measures are formulated. This method overcomes the limitations of traditional methods, improves the accuracy and completeness of risk analysis, and enhances the objectivity and scientific nature of the analysis.
2. Improved STPA-FTA-DEMATEL Method
Traditional methods are based on the concept of potential event chains in simple or complex linear causal relationships, whereas the method has improved upon this basis to more comprehensively identify and analyze risk factors [
18]. Given this advantage, this paper combines the characteristics of human, machine, material, and environment, and uses FTA to construct all the risks faced in the four drilling stages.
The DEMATEL analysis method is mainly used to solve complex and difficult problems. This method reduces the composition of system elements, simplifies the relationships between system elements, and introduces quantitative analysis to study the control body of the system [
19]. However, due to the presence of risk factors in the drilling stage of the shallow-water subsea tree development model, this method has been improved. The intermediate layer of the fault tree constructed based on STPA is used as the analysis factor of DEMATEL to calculate high-weight typical factors, extract high-risk factors, perform refined analysis, and construct a high-risk weight control body.
The steps of the improved STPA-FTA-DEMATEL analysis method are as follows.
Identify the main boundaries of the system: Construct a control body model according to the analysis principles of human, machine, material, and environment
Establish a fault tree: Using the control body as a unit, construct a fault tree with the occurrence of on-site well control accidents as the top event
Quantitative evaluation based on DEMATEL: Quantitatively evaluate the risk factors of the intermediate layer, while the refined bottom layer helps accurately identify the details of risk factors, facilitating expert scoring, as follows.
- (1)
Scoring by experts to clarify the logical relationships of risk factors within the system and the relationship matrix (with impacts classified into 5 levels: no impact 0; minor impact 1; moderate impact 2; significant impact 3; and major impact 4). The direct impact matrix M is then calculated using a formula:
In the formula, aij represents the direct influence matrix.
Find the maximum value in each row of the matrix and normalize the direct impact matrix to
N:
- (2)
Obtain the comprehensive impact matrix
T by standardizing the direct impact matrix:
In the formula: I denotes an n-order identity matrix, where n is determined by the number of risk factors involved in the calculation.
- (3)
Use the comprehensive impact matrix to calculate various indicator values, including the impact degree D, the affected degree C, the centrality D + C, the causality D − C, and the weight value.
Centrality
D +
C, denoted as
Mi:
Causality
D −
C, denoted as
Ri:
Then normalize the importance of the above factors to obtain the weight values.
- (4)
Using Equation (8) we can calculate the average weight of all risk factors. Factors with weights higher than the average are considered high-risk factors. Focus on these high-risk factors, investigate their typical characteristics and high-risk weights, and establish a control system for high-risk weights:
- (5)
Based on the above analysis, constrain the high-risk weight factors.
3. Identification of Well Control Risks in Drilling Stages Based on the STPA-FTA Method
In the shallow-water subsea tree development model, complex geological conditions and climatic changes pose challenges to well control operations. To ensure the safety of well control operations, it is crucial to identify accurately various risks during the drilling stages. Especially during the drilling process, the uncertainty of formation pressure, the complexity of the downhole environment, and the diverse operating conditions of drilling equipment make risk management complex [
20,
21]
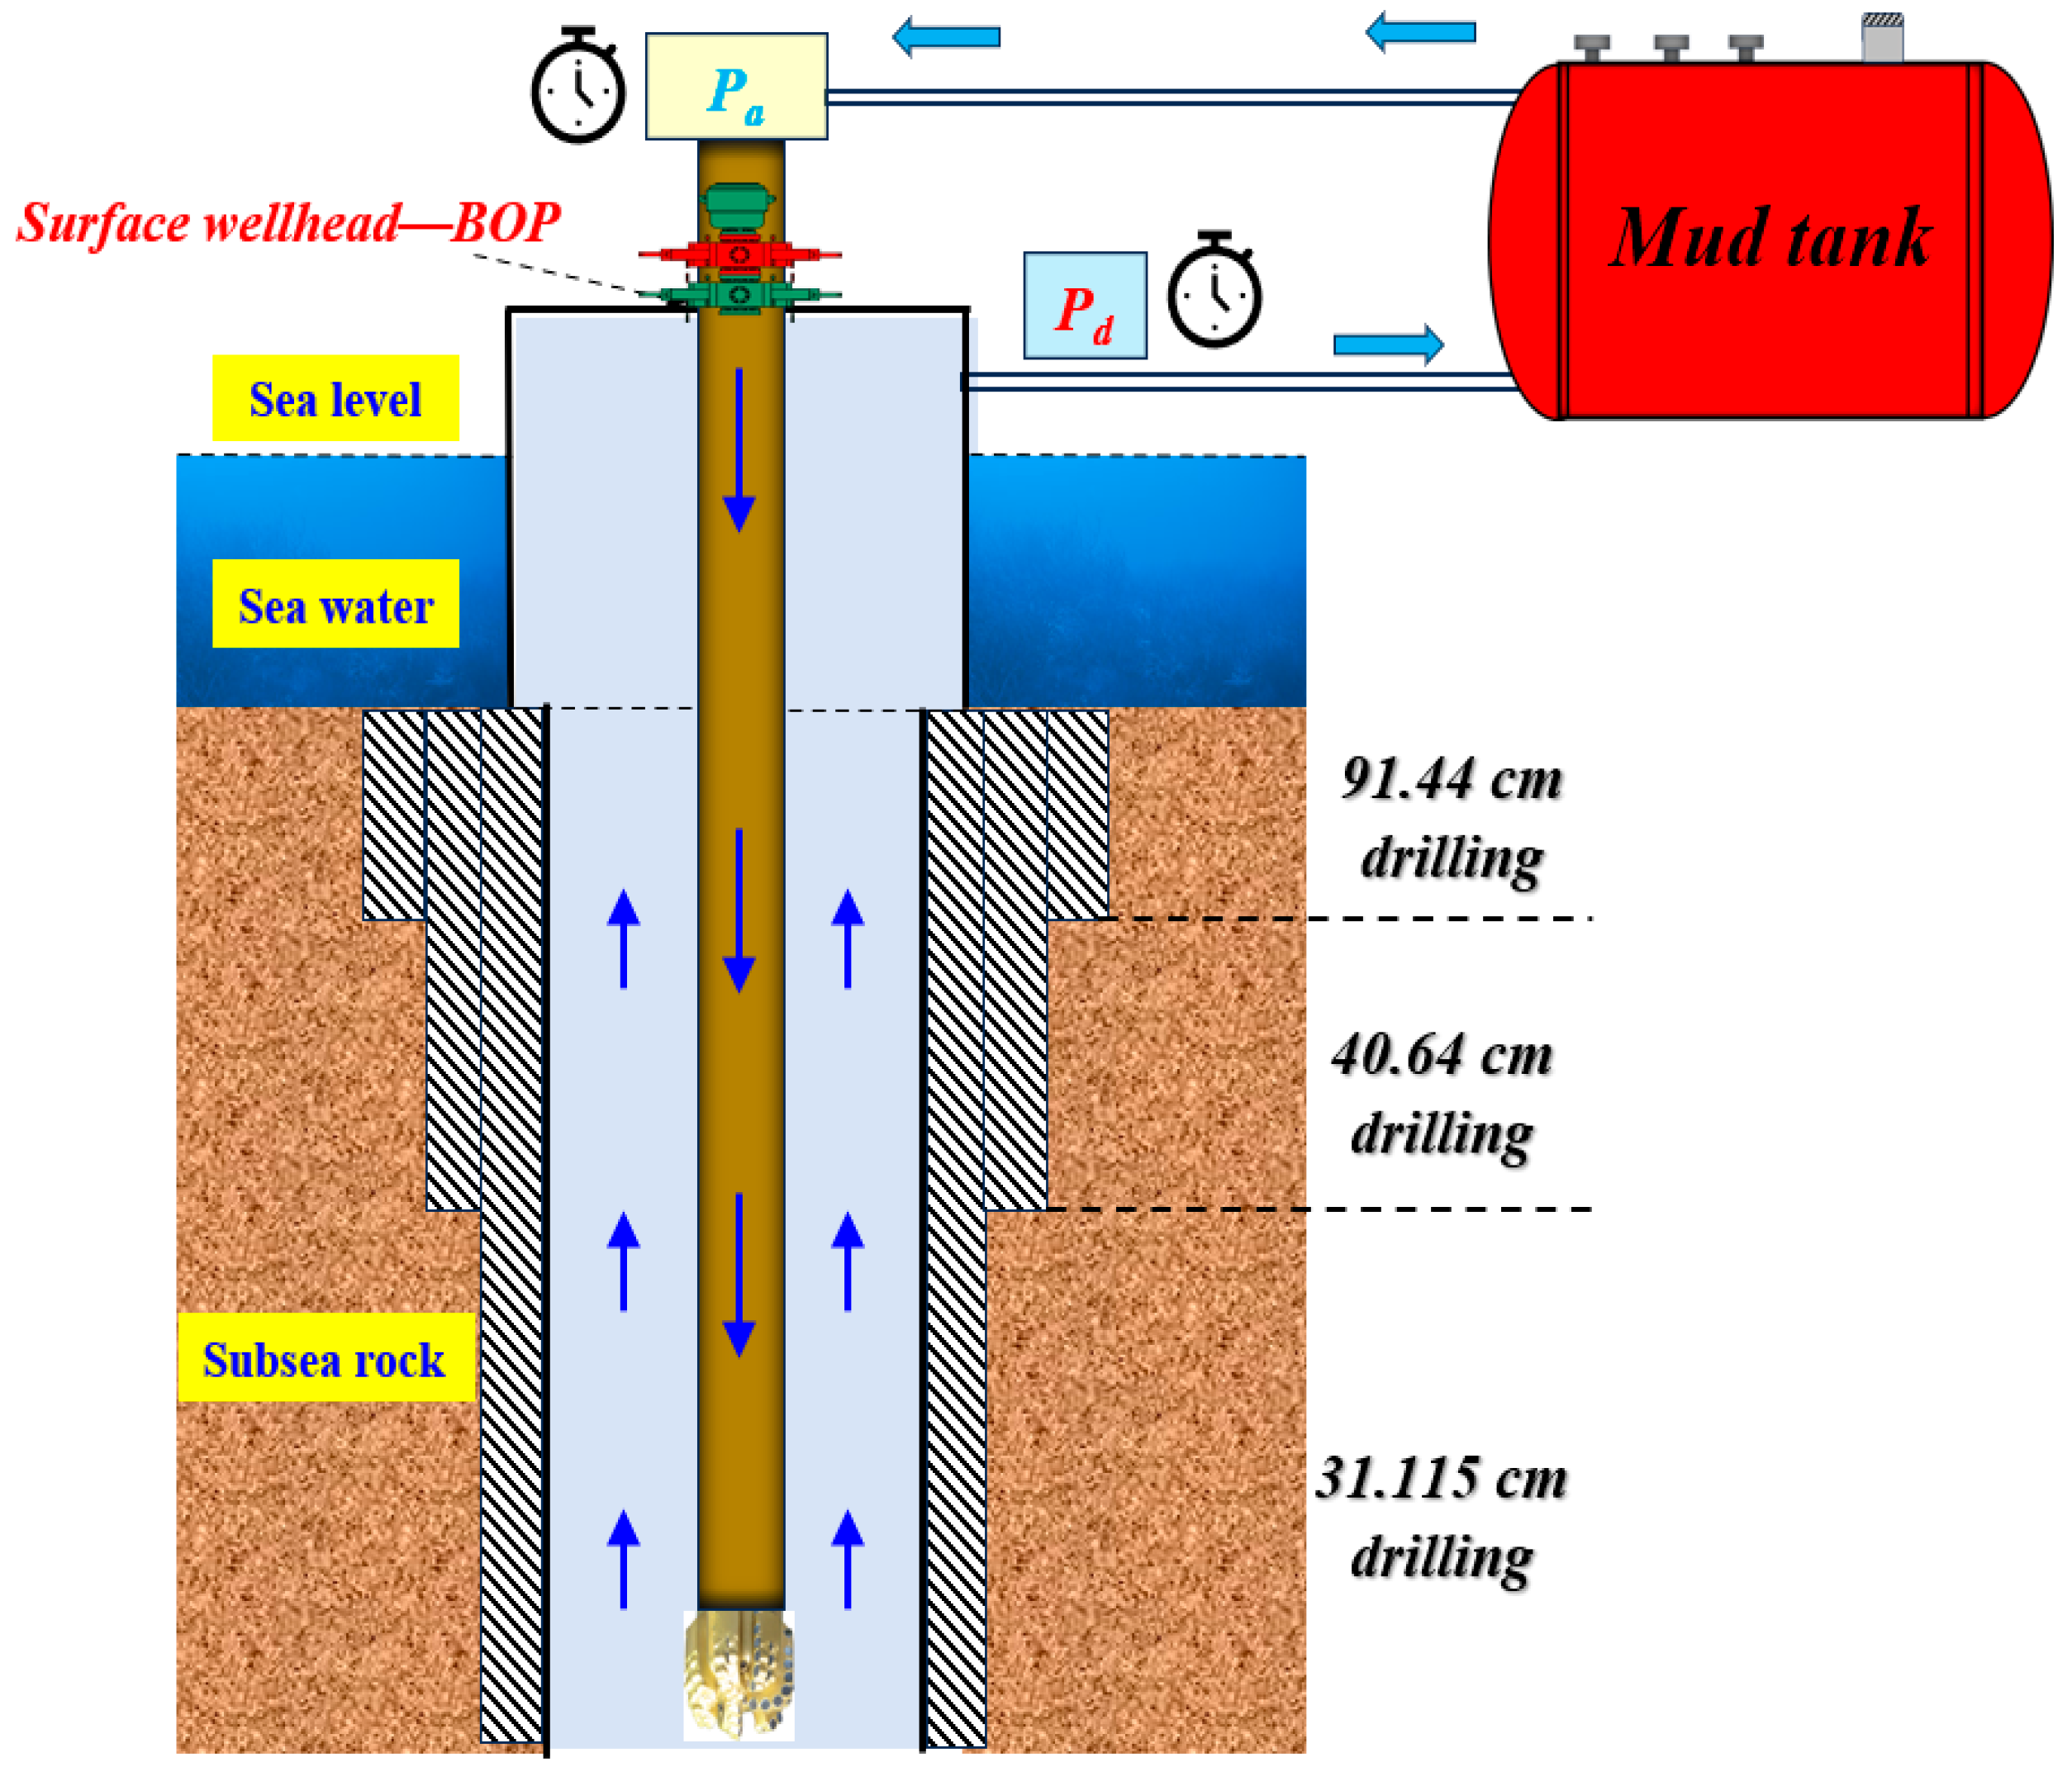
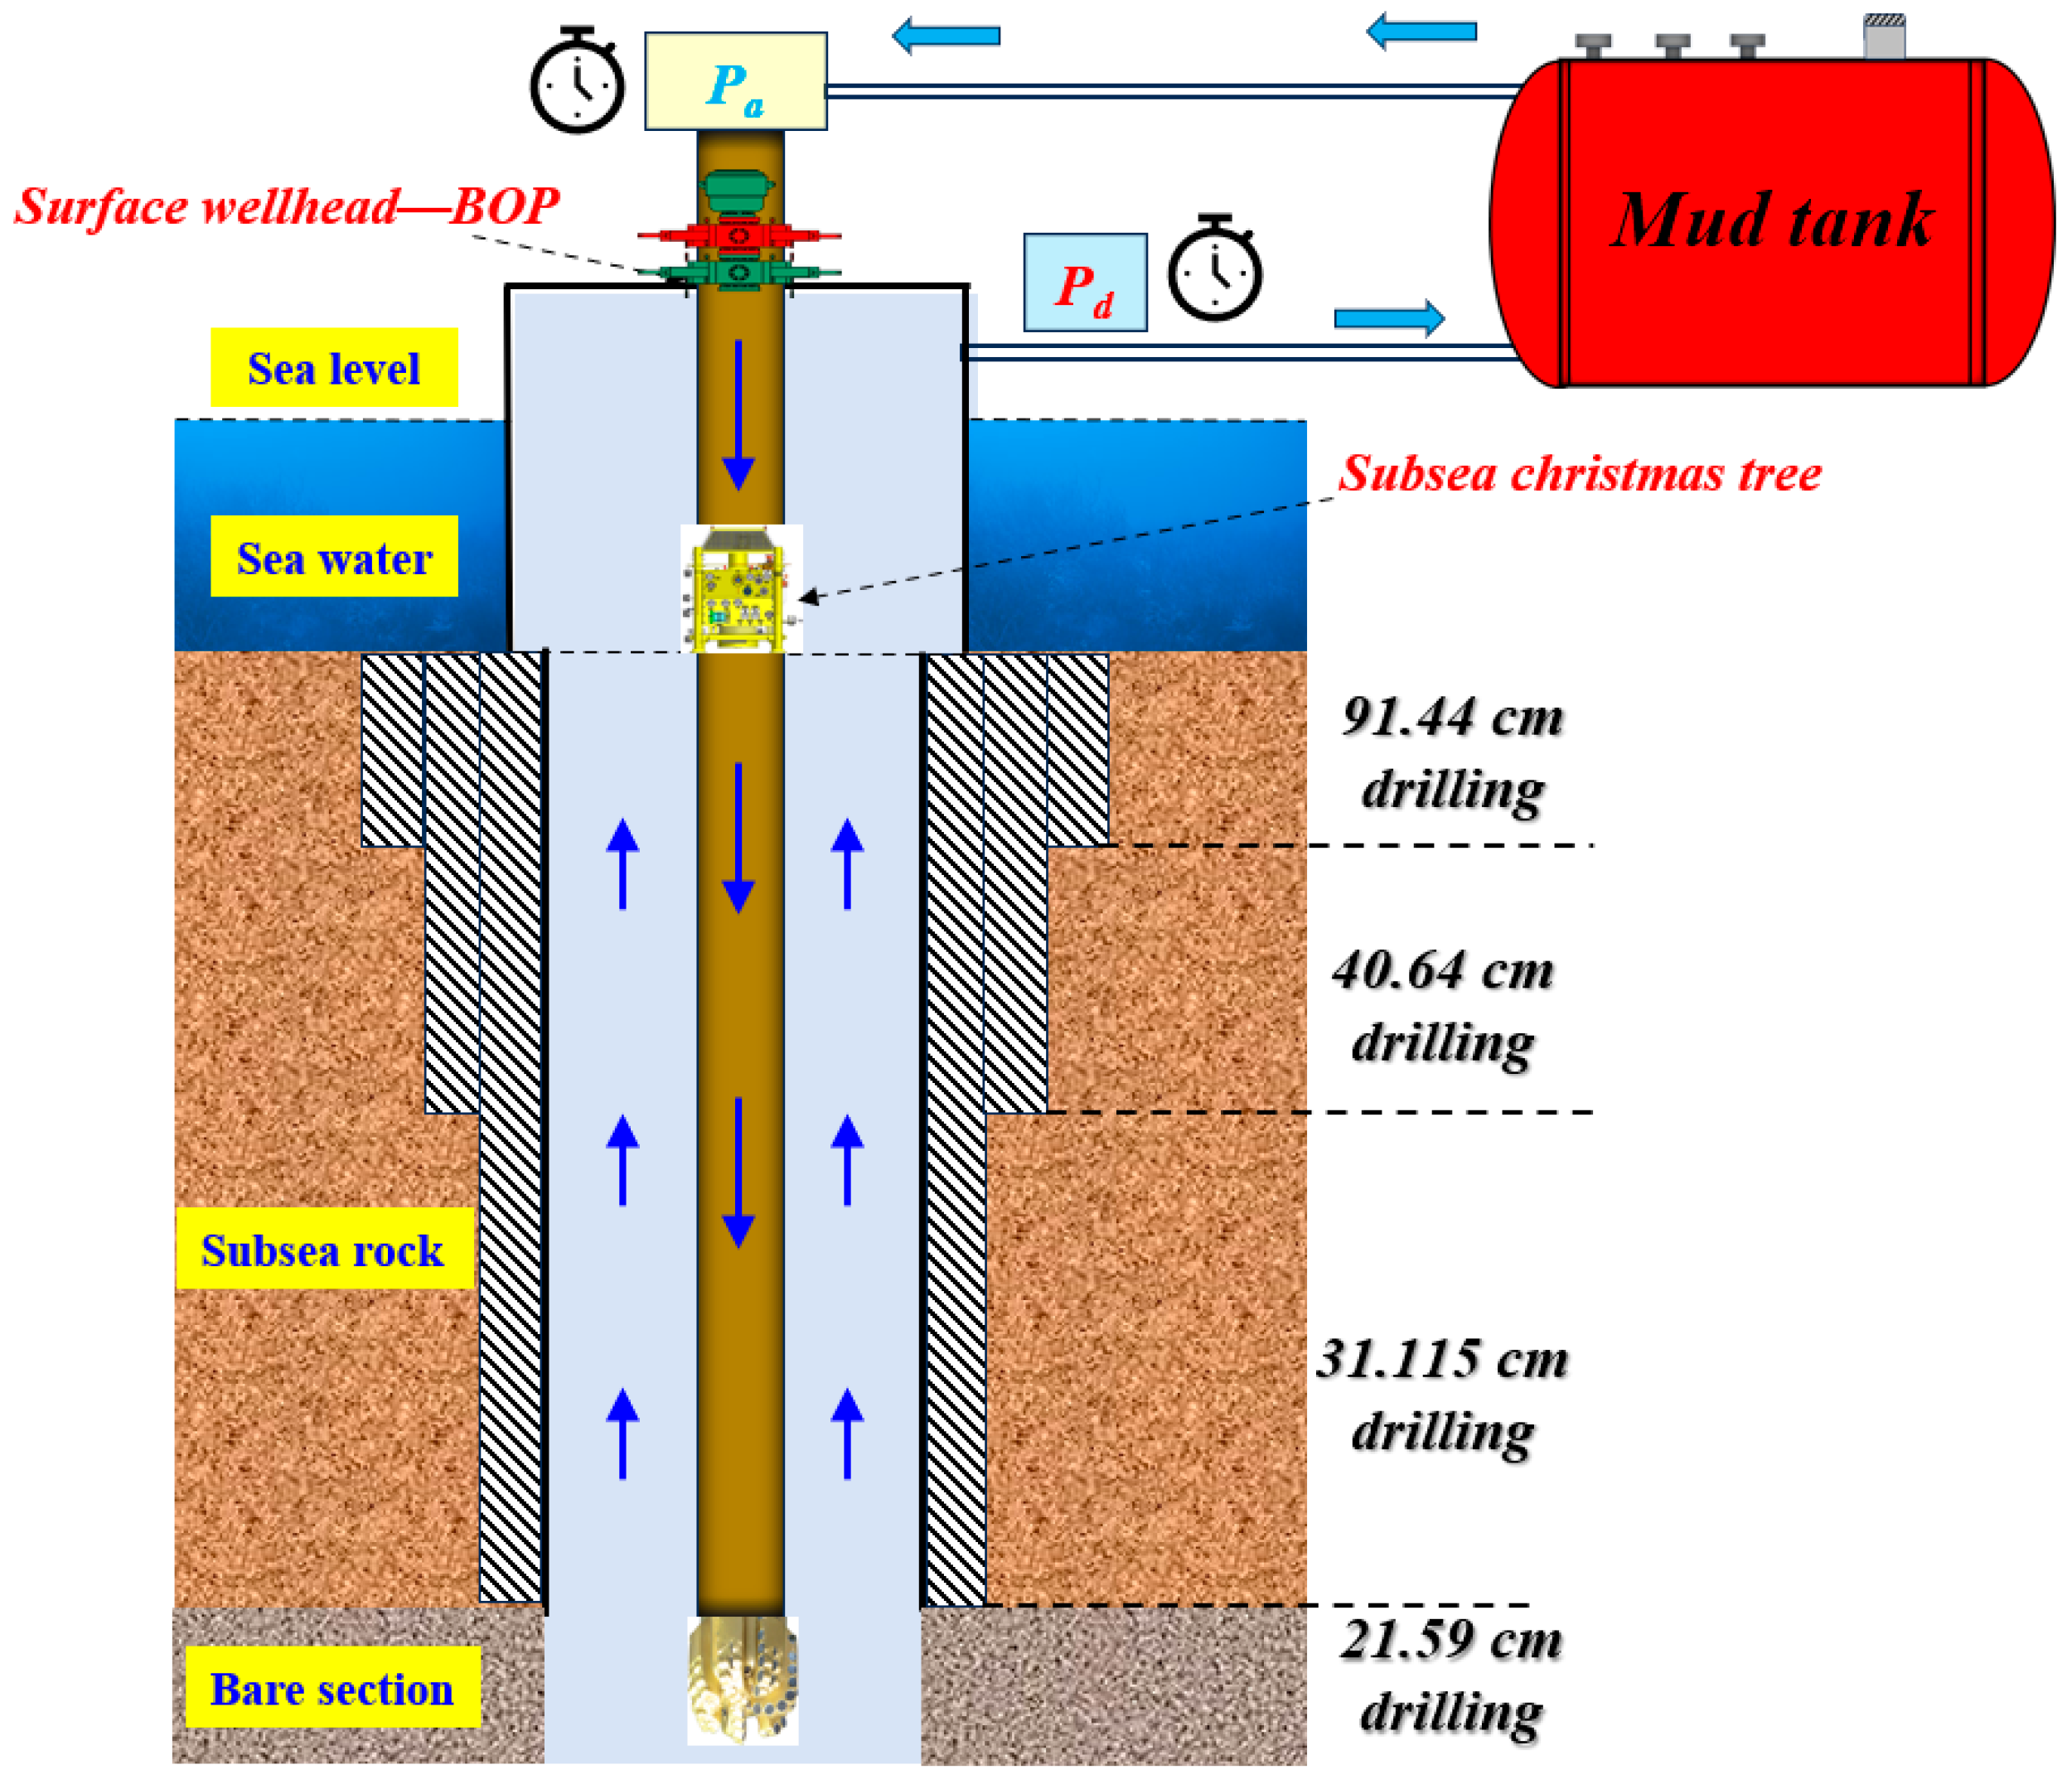
As shown in
Figure 2 and
Figure 3, respectively, they illustrate the wellbore structures for the first three drilling operations and the fourth drilling operation. The wellbore structure of the first three drilling operations includes a surface blowout preventer, high-pressure riser, wellhead, and downhole structure, while the fourth drilling operation additionally includes a subsea tree between the high-pressure riser and the subsea wellhead. Through the STPA and FTA methods, the key risk factors at different stages of drilling can be ac identified.
3.1. Risk Identification in the First Three Drilling Operations
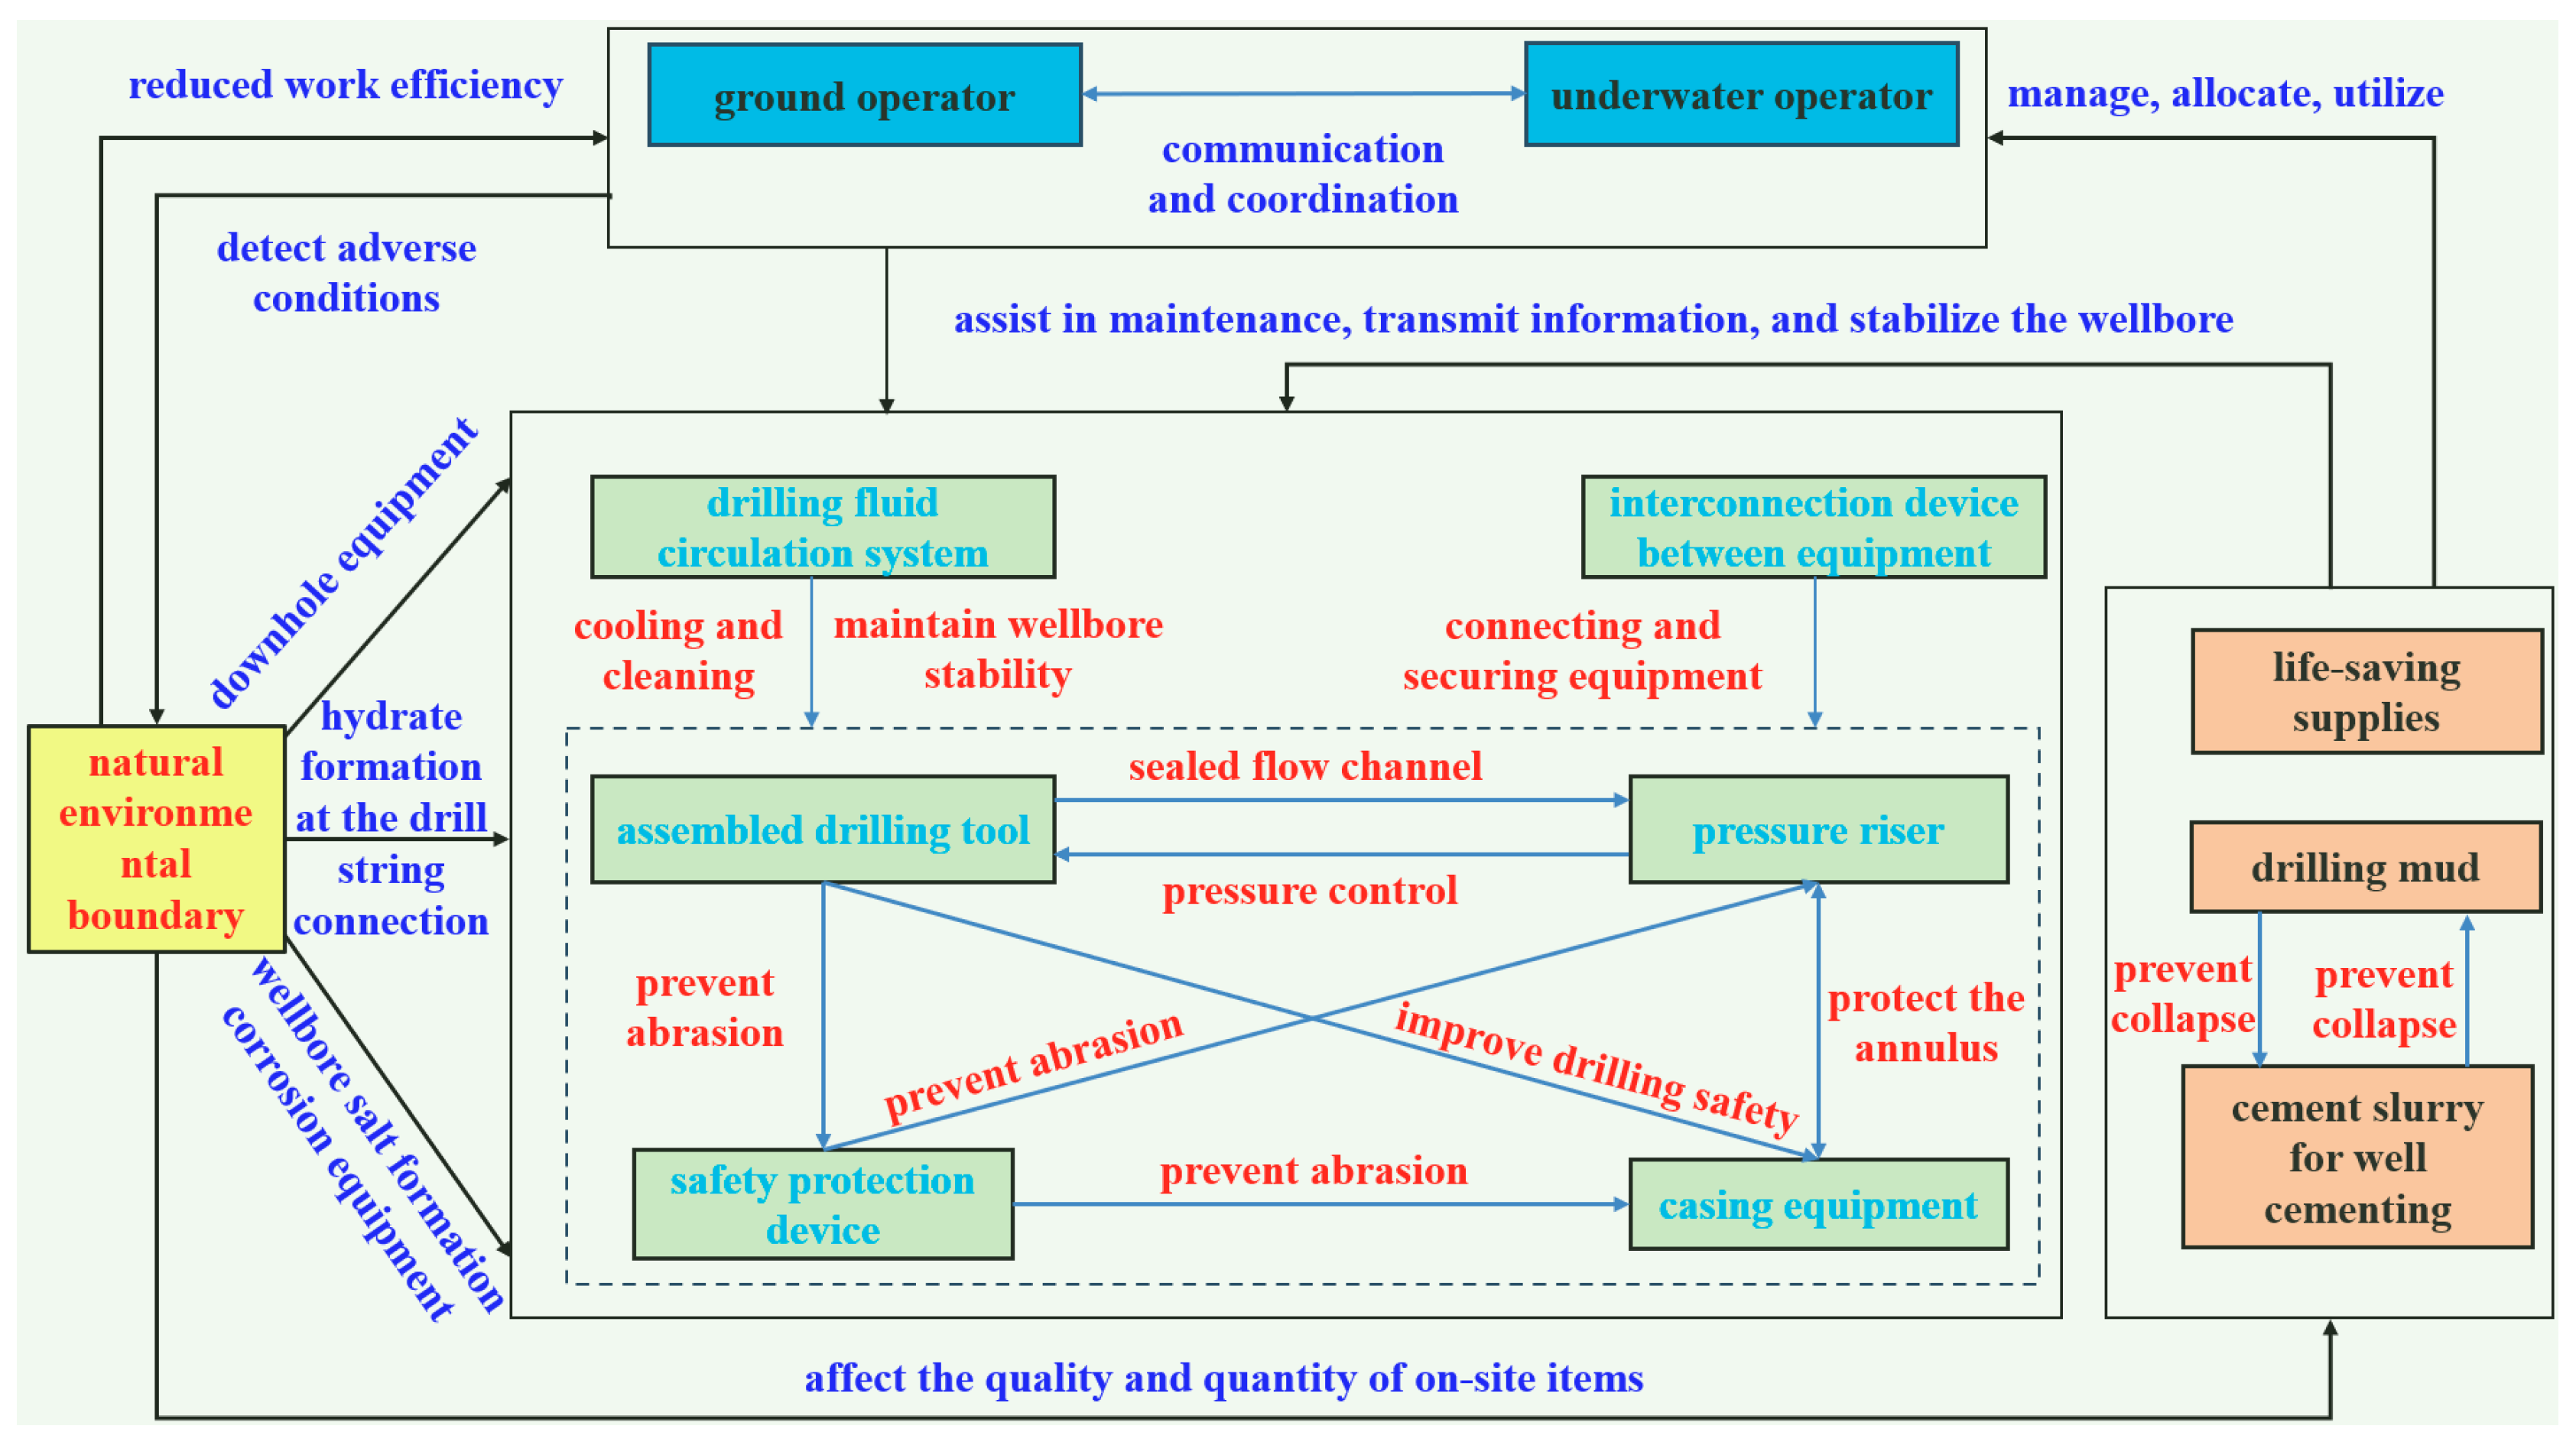
In the first three drilling operations, due to the absence of a subsea tree, the wellbore structure of the shallow-water subsea tree development model primarily included a blowout preventer, a high-pressure riser, and a subsea wellhead. During the first three drilling stages, the system’s boundaries included on-site personnel (surface operators and subsea operators), on-site equipment (drilling fluid circulation system, pressure risers, combination drill tools, cementing equipment, equipment connection devices, and safety protection devices), on-site materials (drilling fluid, cement slurry, and life-saving supplies), and the natural environment on-site. Based on the aforementioned analysis, as illustrated in
Figure 4, a corresponding control body model was constructed to identify and manage the risks during the first three drilling processes.
At the drilling site, risks brought by humans, machinery, materials, and the environment can lead to major accidents such as blowouts, wellbore ruptures, and derrick fires, potentially causing platform explosions, severe casualties, and significant property damage.
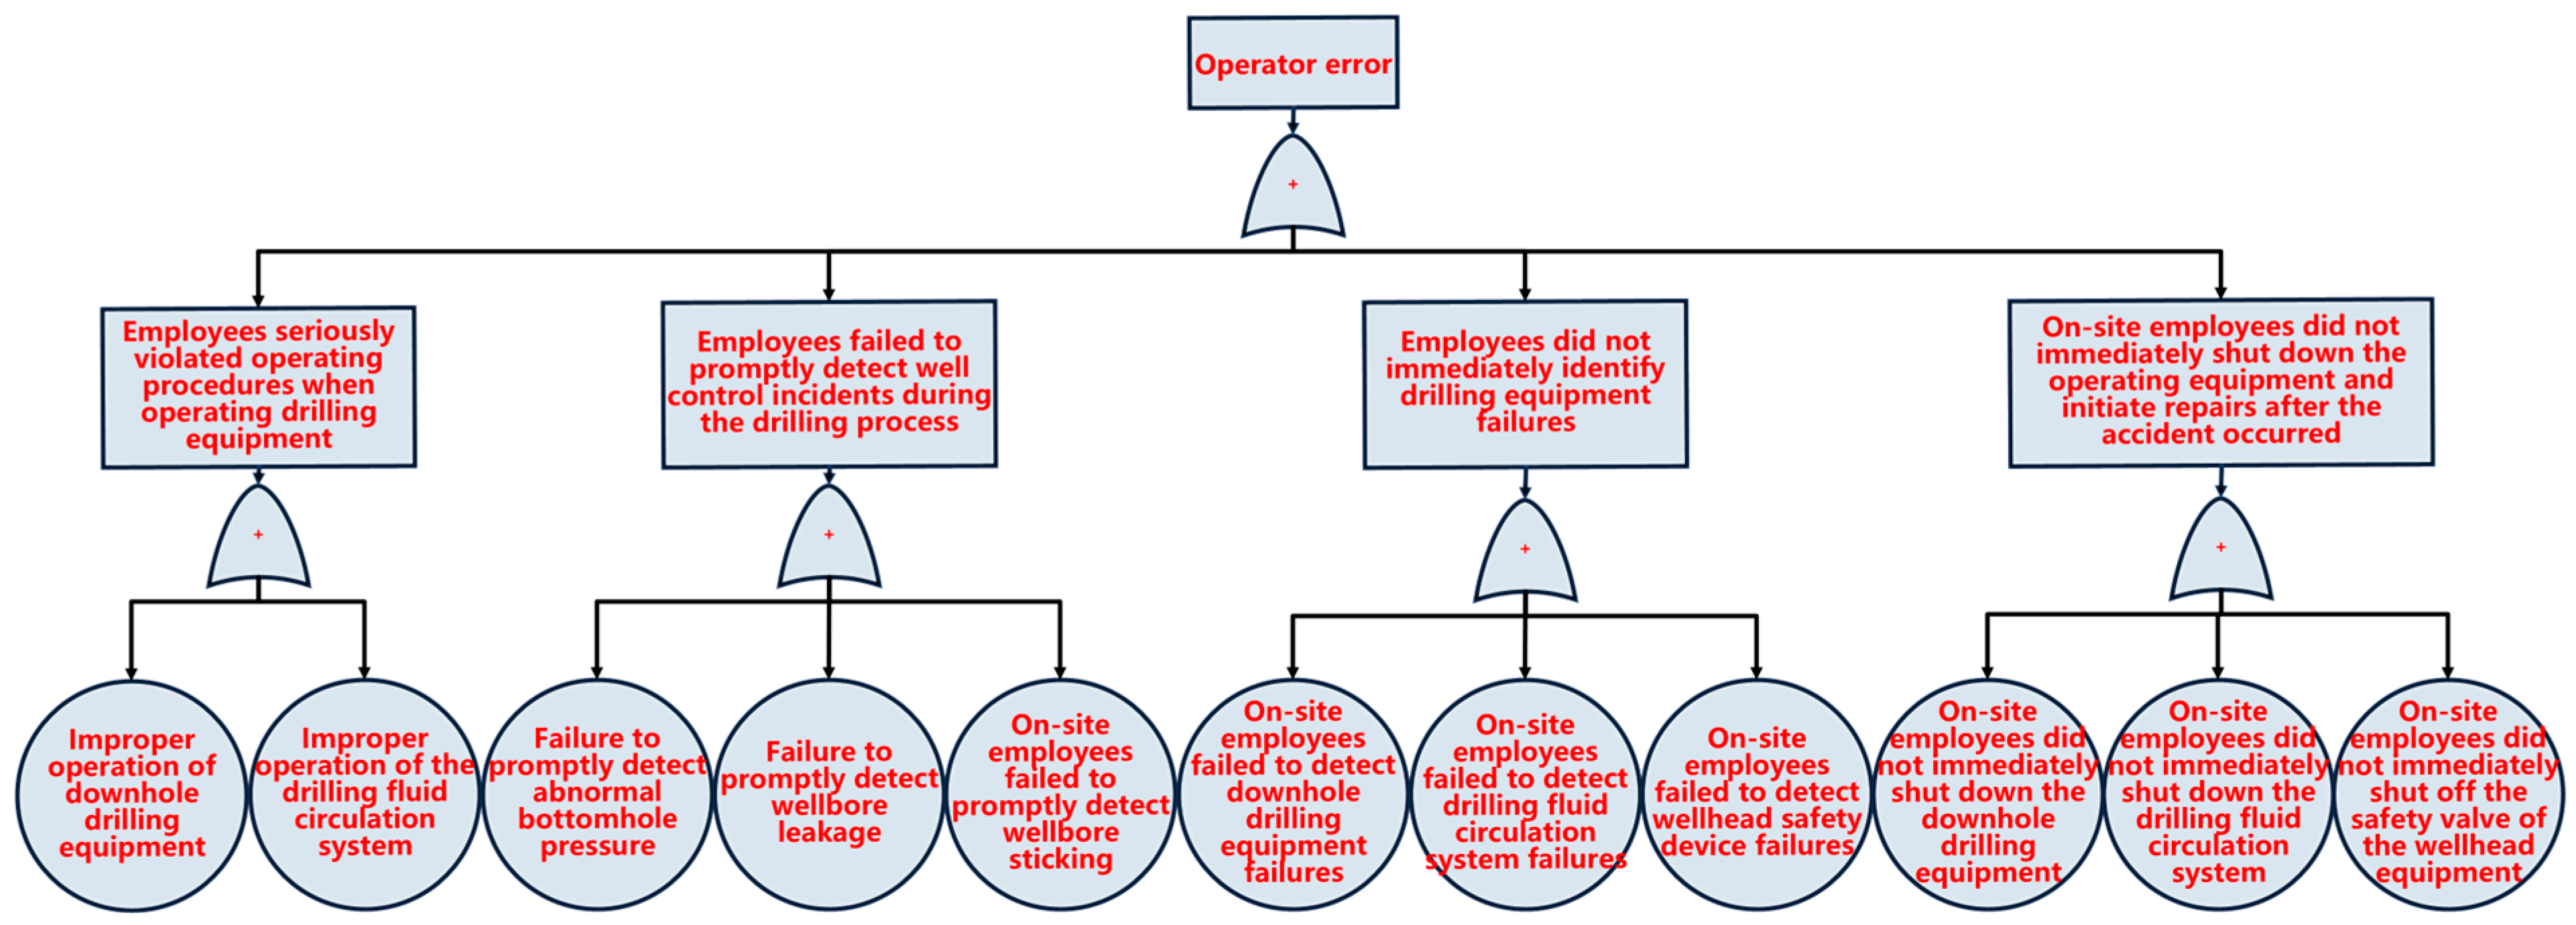
Employees at the drilling site face serious risks, including improper operation of drilling and monitoring auxiliary equipment, failure to detect timely on-site incidents, and failure to promptly take appropriate measures after detecting incidents. These risks pose significant threats to the operation of drilling activities, potentially causing production interruptions and posing major threats to the safety of on-site personnel. Based on the above analysis, as shown in
Figure 5, the well control risks present during the operational processes of on-site employees are detailed.
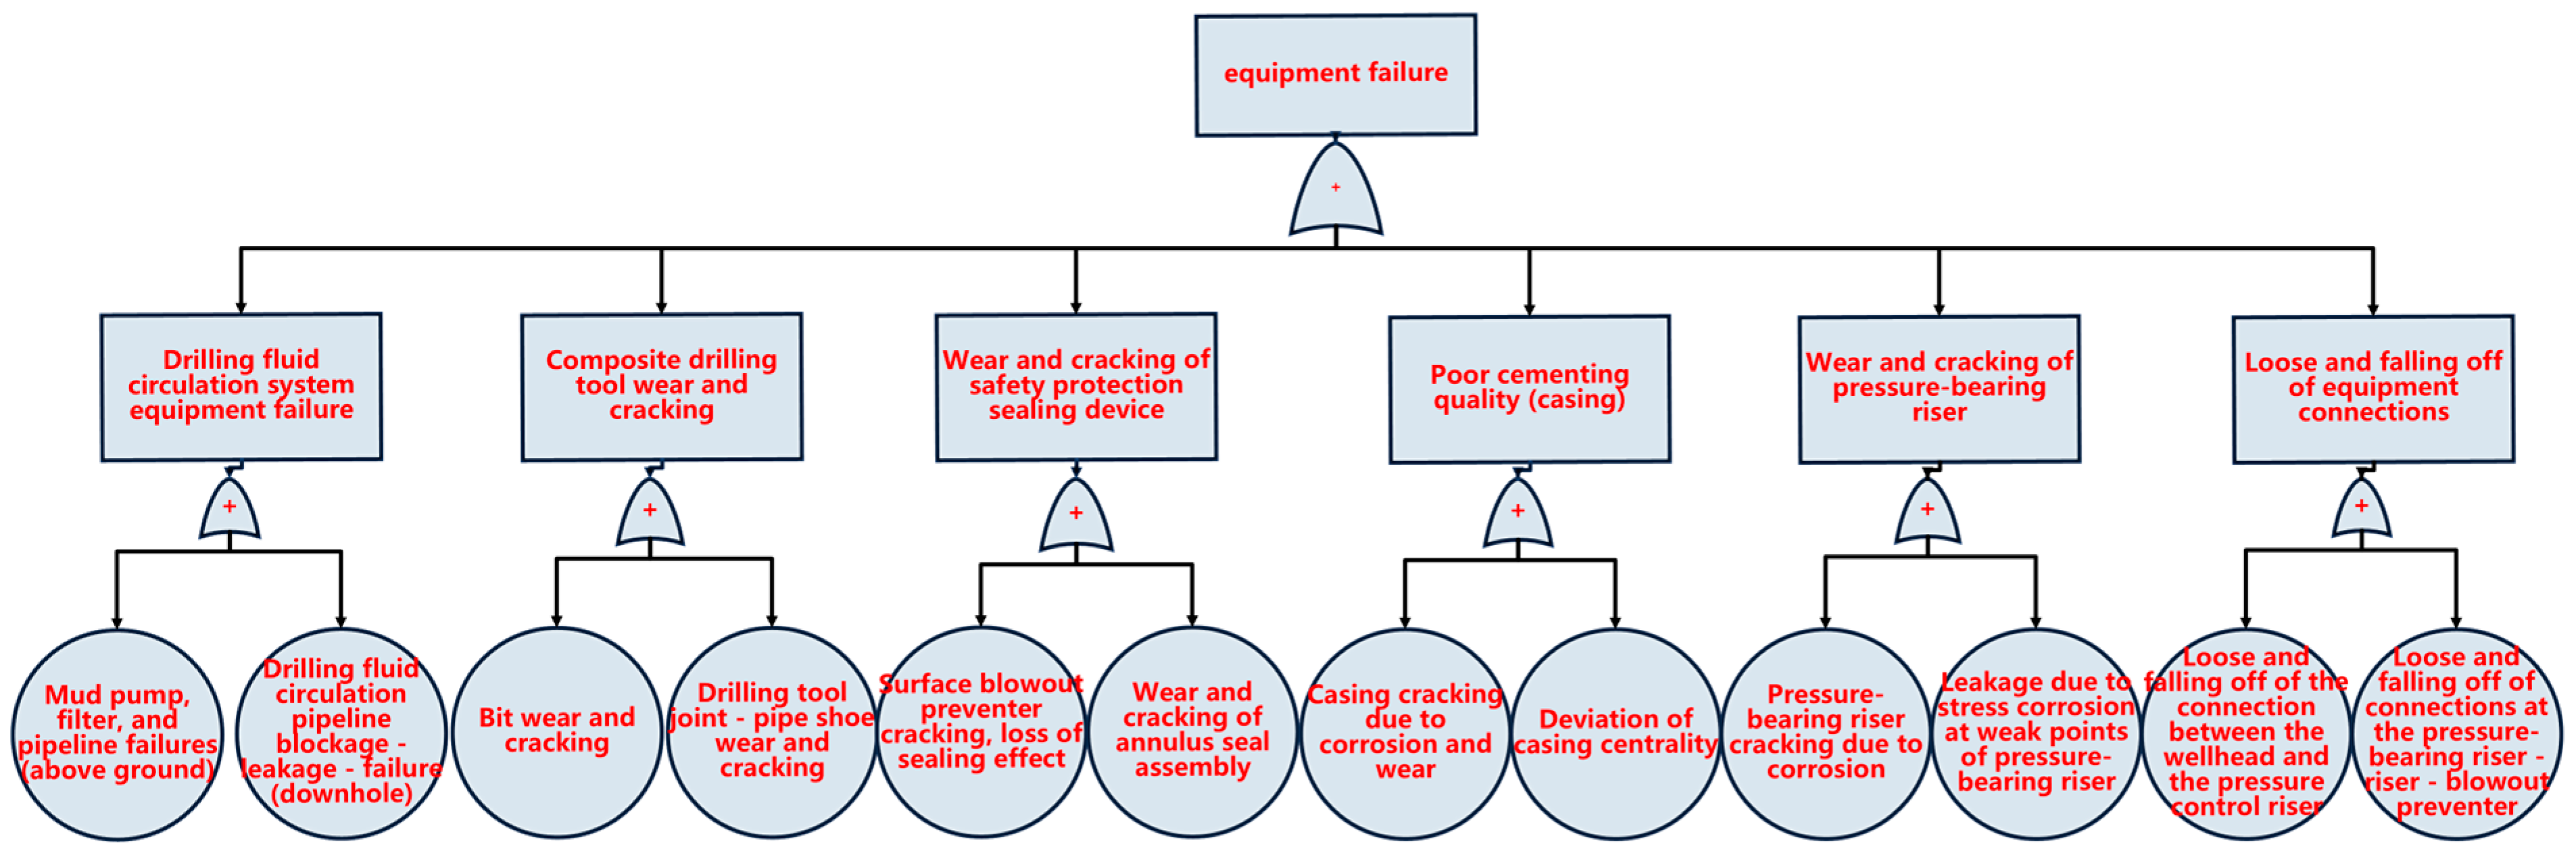
During the drilling process, various key equipment is used, including casing, drill string, wear sleeves, blowout preventers, and high-pressure risers. These pieces of equipment may experience functional failures, wear, or breakage due to inherent characteristics, operational errors, or environmental conditions. Particularly in shallow-water development scenarios, the sealing performance and wear resistance of high-pressure risers and blowout preventers are crucial, as they directly impact operational safety. Through an analysis of the actual field situation (as shown in
Figure 6), the related risks of field equipment systems can be classified into six major categories.
At the drilling site under the development model of shallow-water subsea trees, the main items include drilling fluid, cement slurry, and life-saving supplies (as shown in
Figure 7). Drilling fluid, as an important medium in the drilling process, directly affects the wellbore pressure through its chemical composition and usage. Second, the quality and sealing effect of the cement slurry directly affect the integrity of the wellbore and the safe operation of the downhole equipment. In addition, the adequacy and availability of emergency rescue supplies are directly related to the safety and survival of personnel in emergency situations.
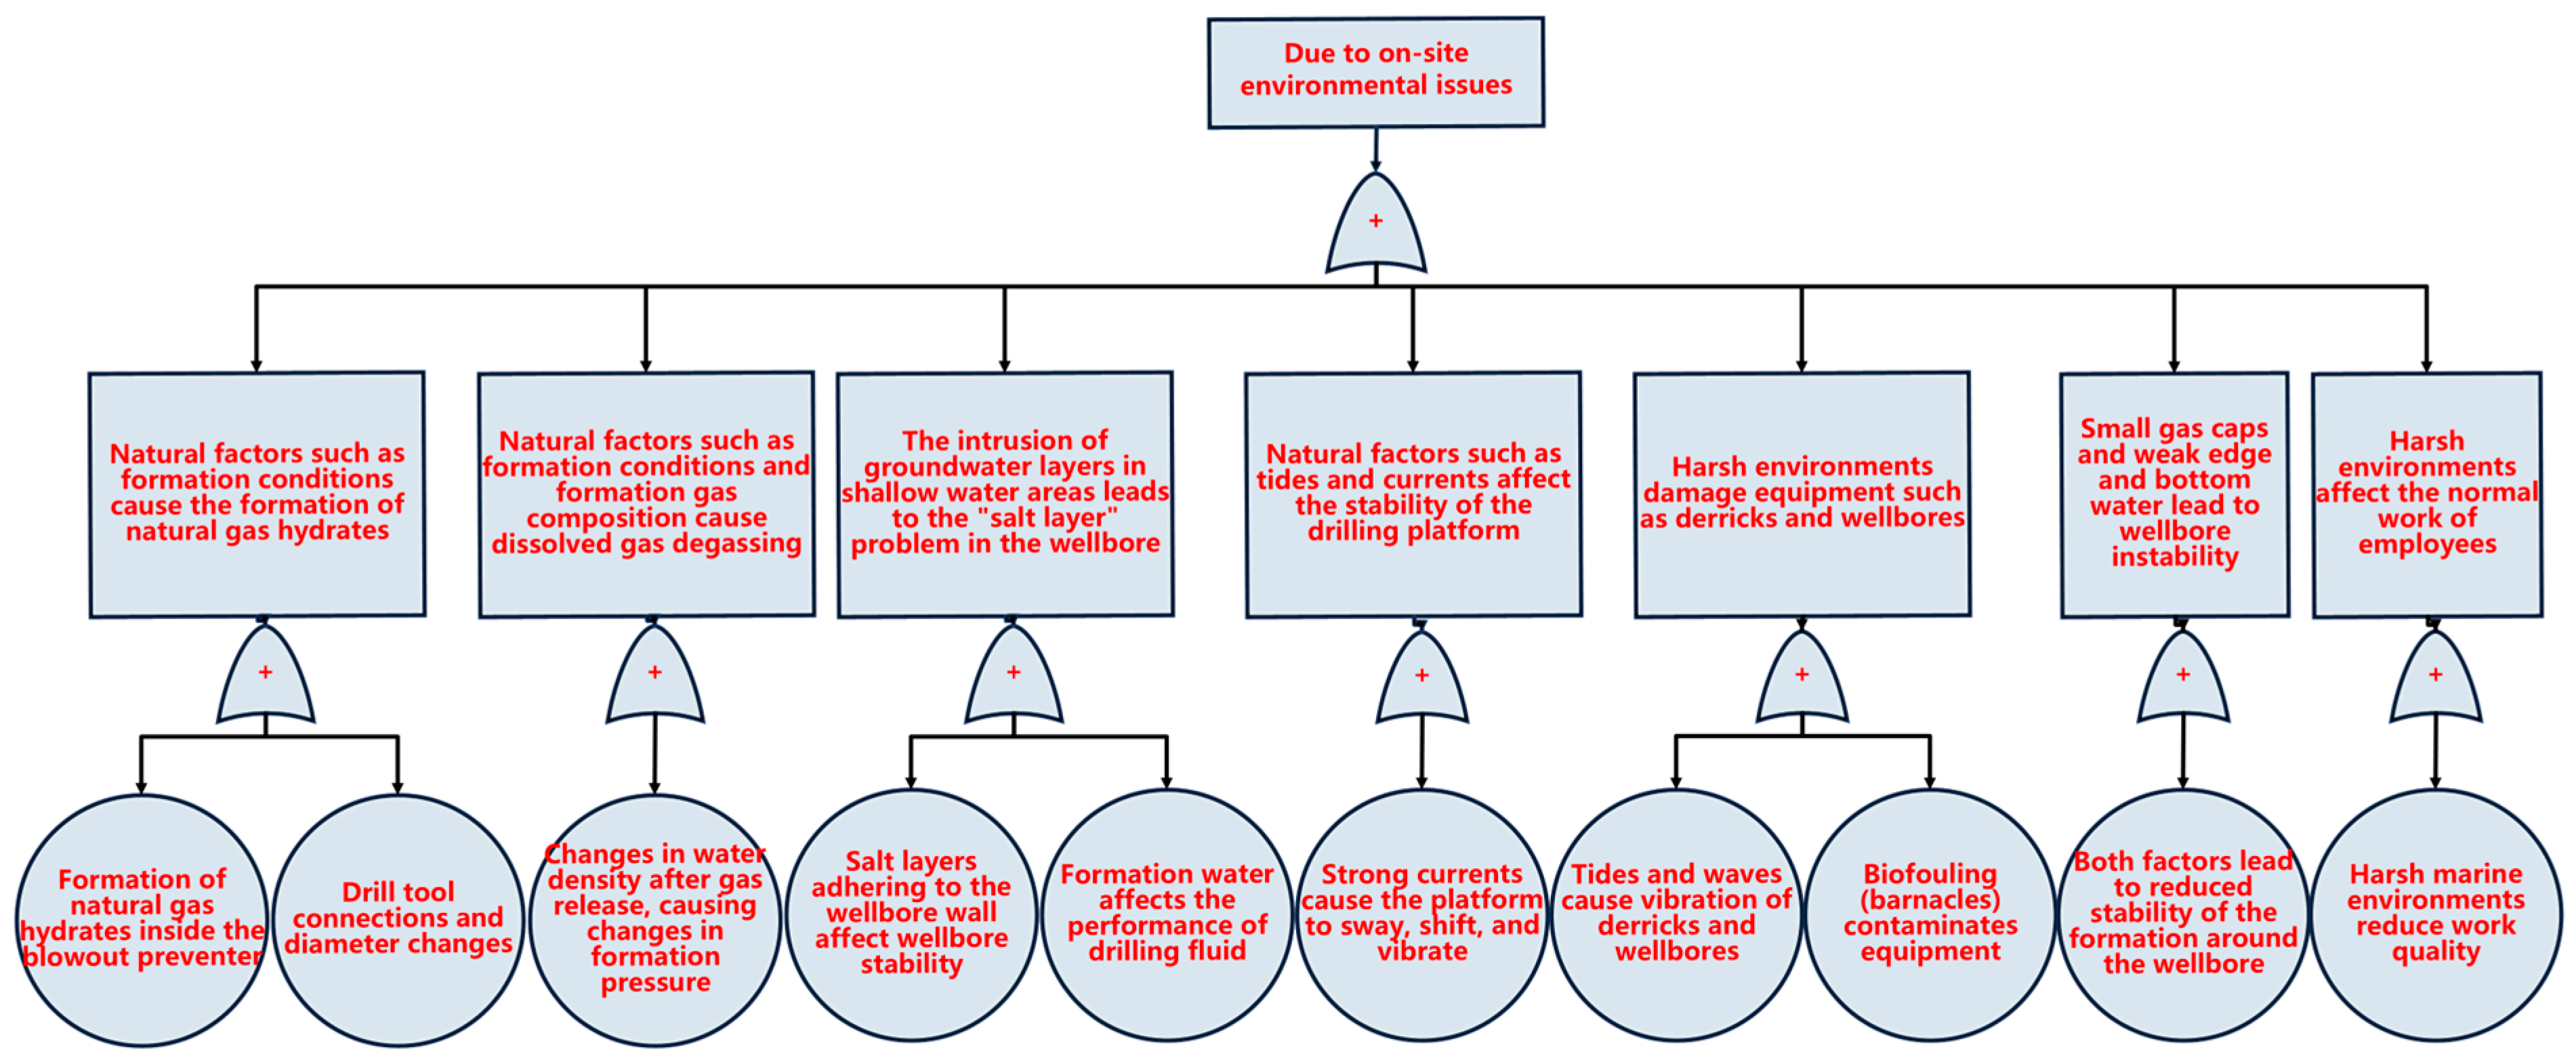
Stratigraphic conditions, gas composition in the formation, and other natural factors significantly affect the formation of natural gas hydrates, the release of dissolved gas, drilling platform stability, groundwater intrusion, and wellbore stability. These environmental factors include tides, water flow, salt layers, small gas caps, and weak edge-bottom water phenomena, as well as the impact of harsh environments on the normal operation of equipment and staff. Specific risks are shown in
Figure 8.
3.2. Risk Identification in the Fourth Drilling Operation
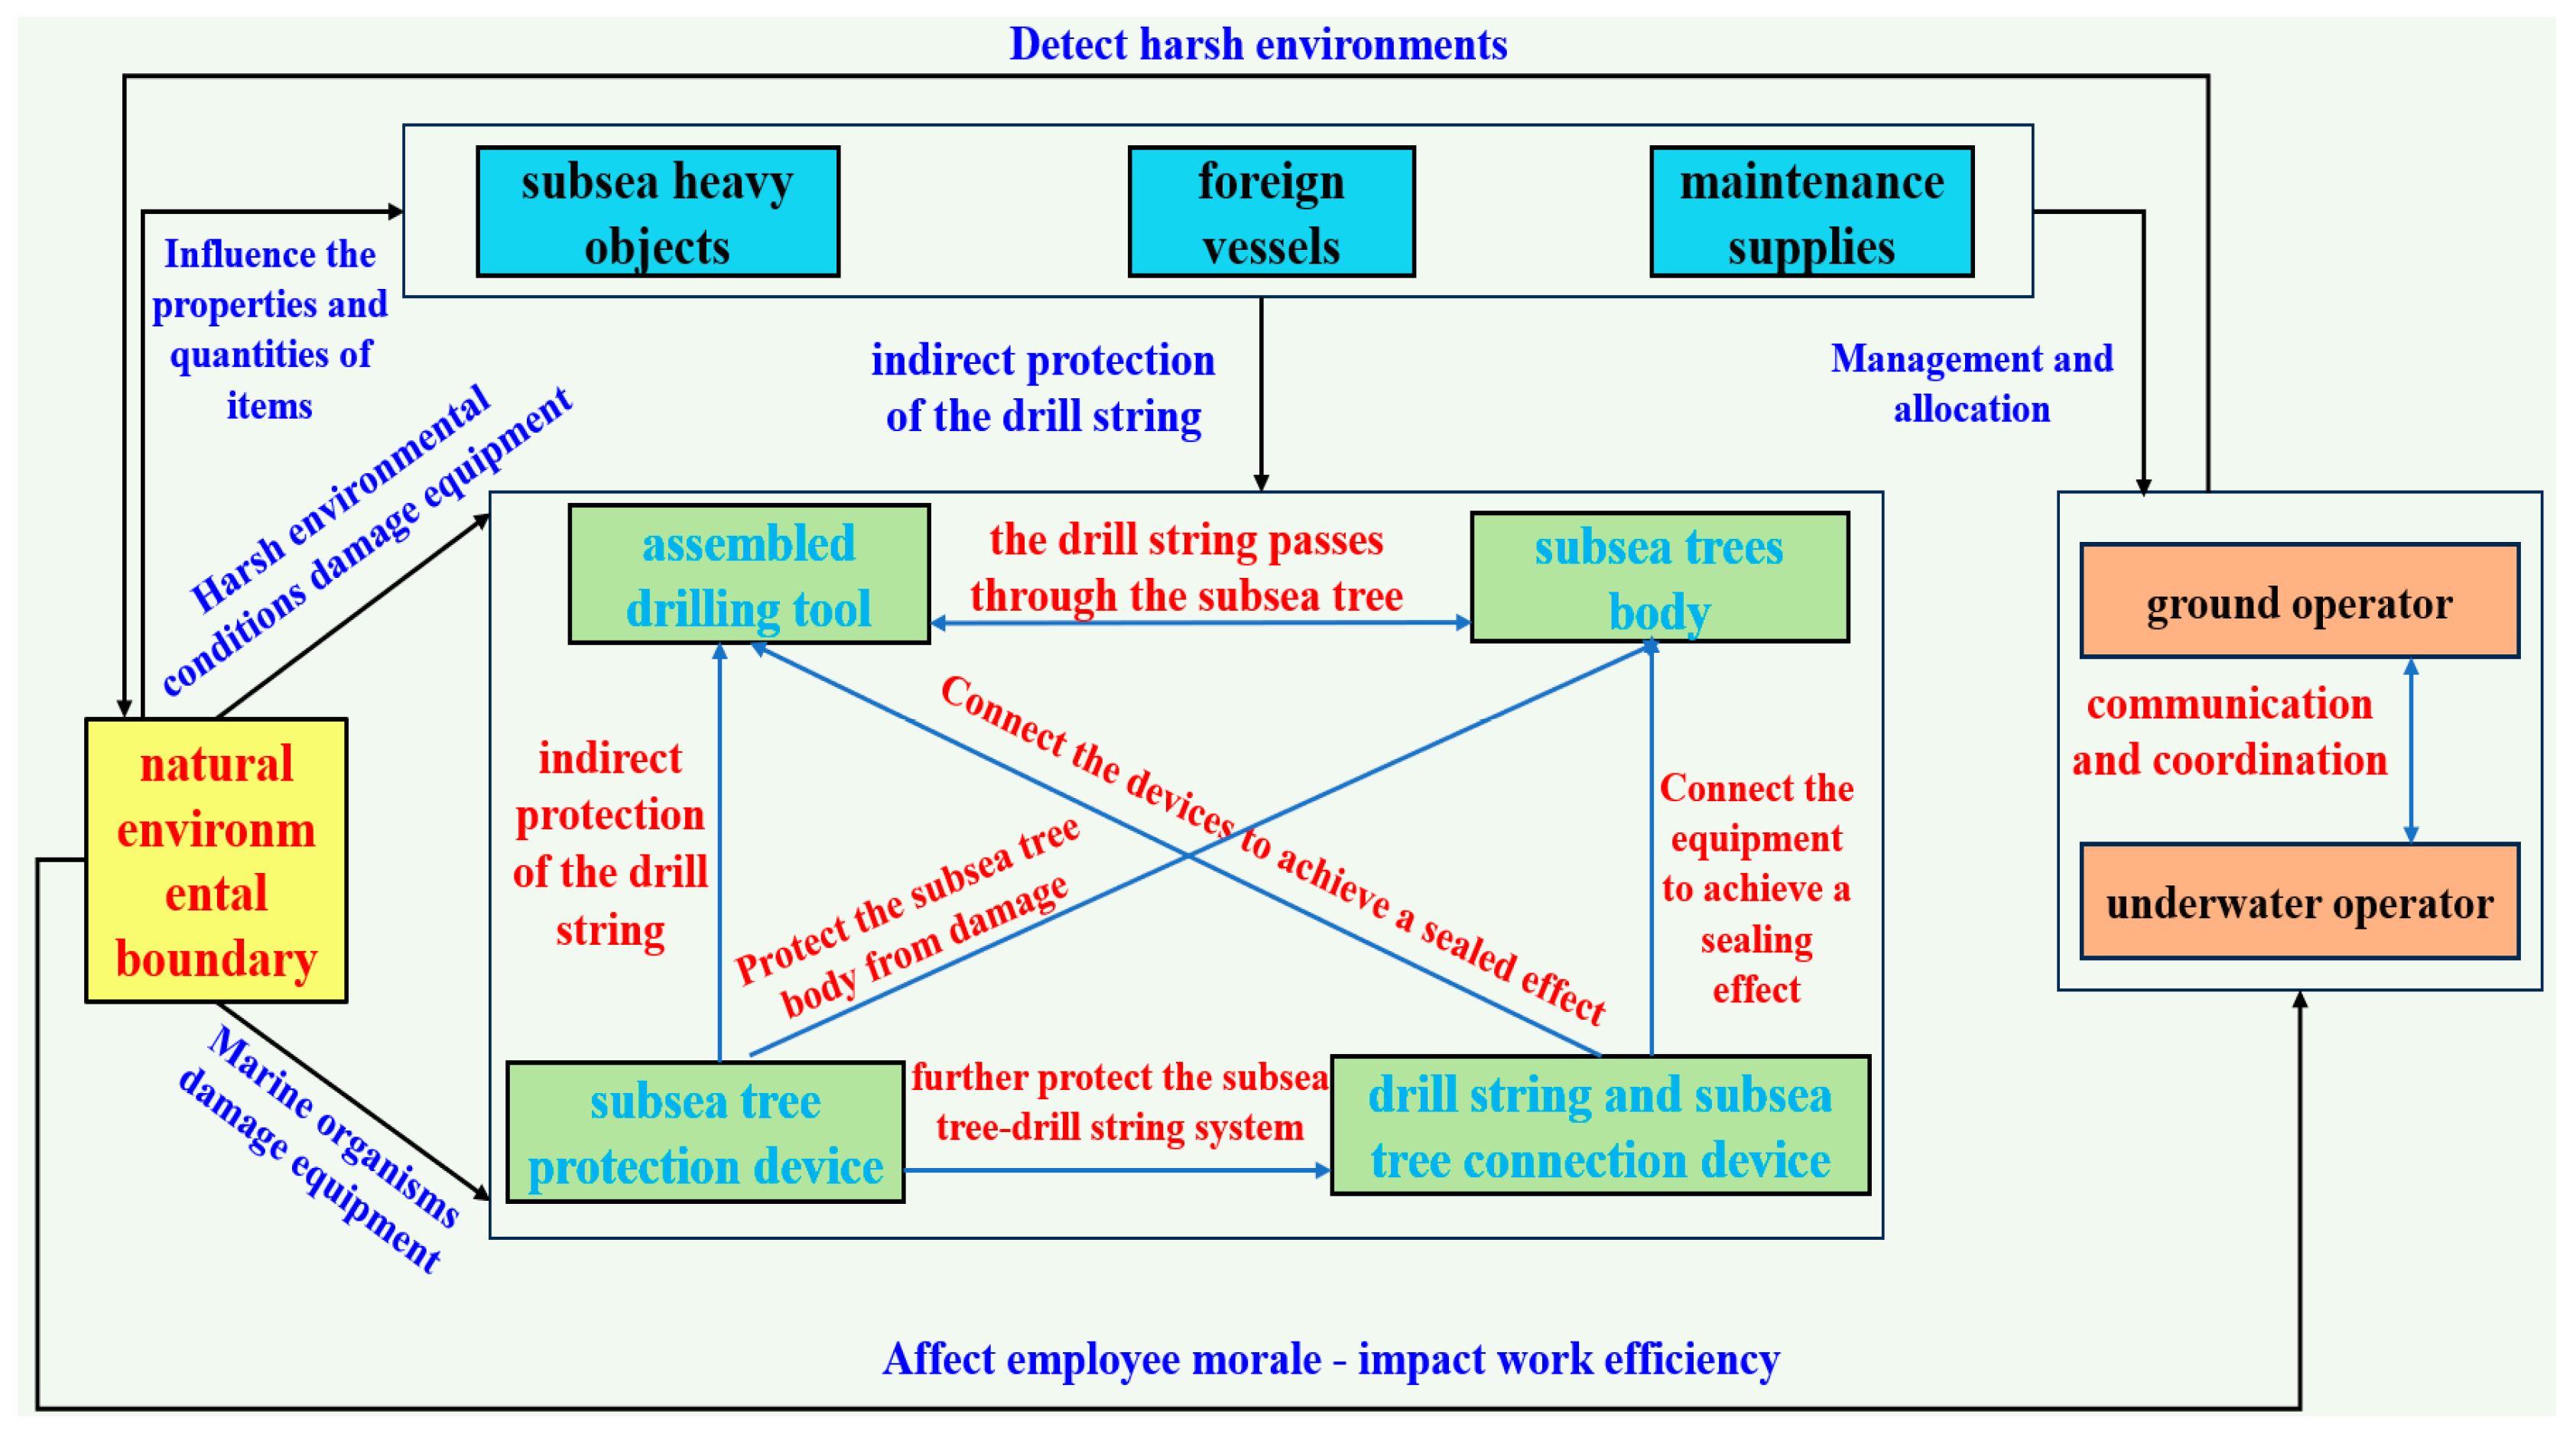
During the fourth drilling phase, based on the risks encountered in the previous three phases, the emphasis was mainly on the significant impact of the deployment and installation of the subsea tree on the drilling process. This phase involved the assessment of factors related to the operation of the subsea tree, including personnel, equipment, materials, and environmental aspects. The complexity of this process mainly arises from dynamic changes in equipment stability, personnel operational skills, environmental factors, and material quality, all of which affect the safety and efficiency of drilling operations. Instability or loss of control of these factors may lead to equipment deviation, damage, or performance degradation, thereby increasing the likelihood and severity of well control risks. To accurately identify potential risks during this process, a control model for the fourth drilling phase was developed, as shown in
Figure 9.
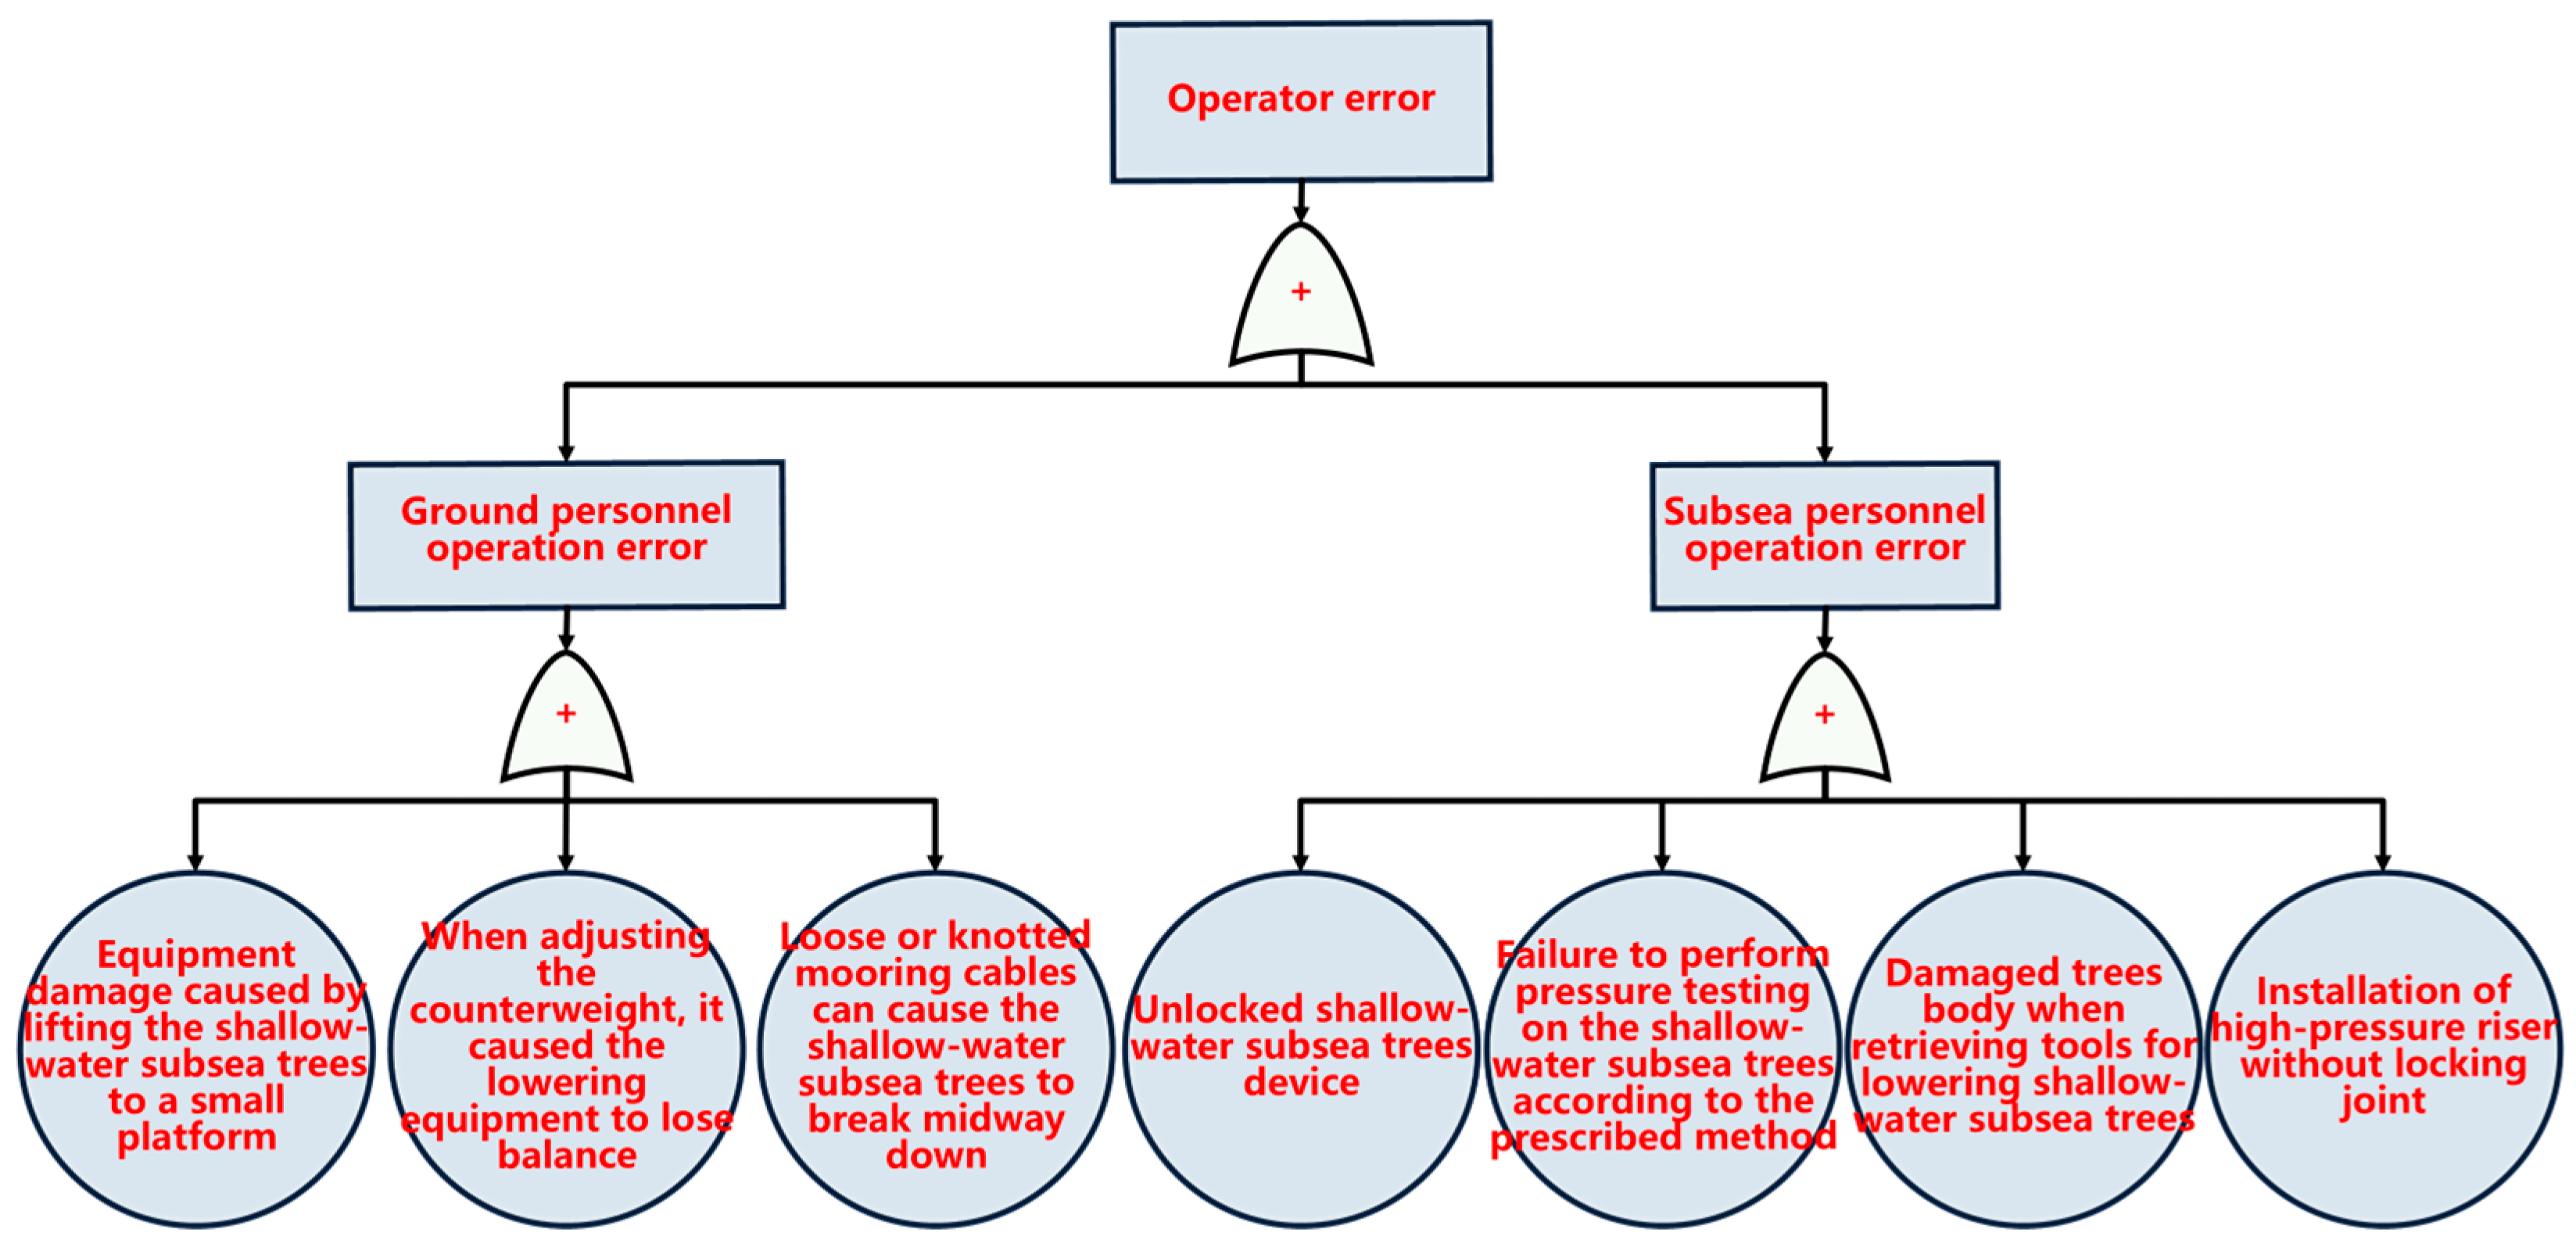
During the installation of the subsea tree, improper operation of the lifting equipment by surface personnel may lead to equipment instability or loss of control. Such errors may cause cable instability or entanglement, resulting in the subsea tree becoming unstable or suddenly breaking during descent. Similarly, if subsea operators fail to properly secure the subsea tree assembly or do not follow the prescribed pressure testing procedures, it could lead to serious well control risks during subsequent drilling operations. These operational errors could result in the failure of the subsea tree system, posing a potential threat to well control safety. As shown in
Figure 10, the personnel risks during the fourth drilling operation are analyzed.
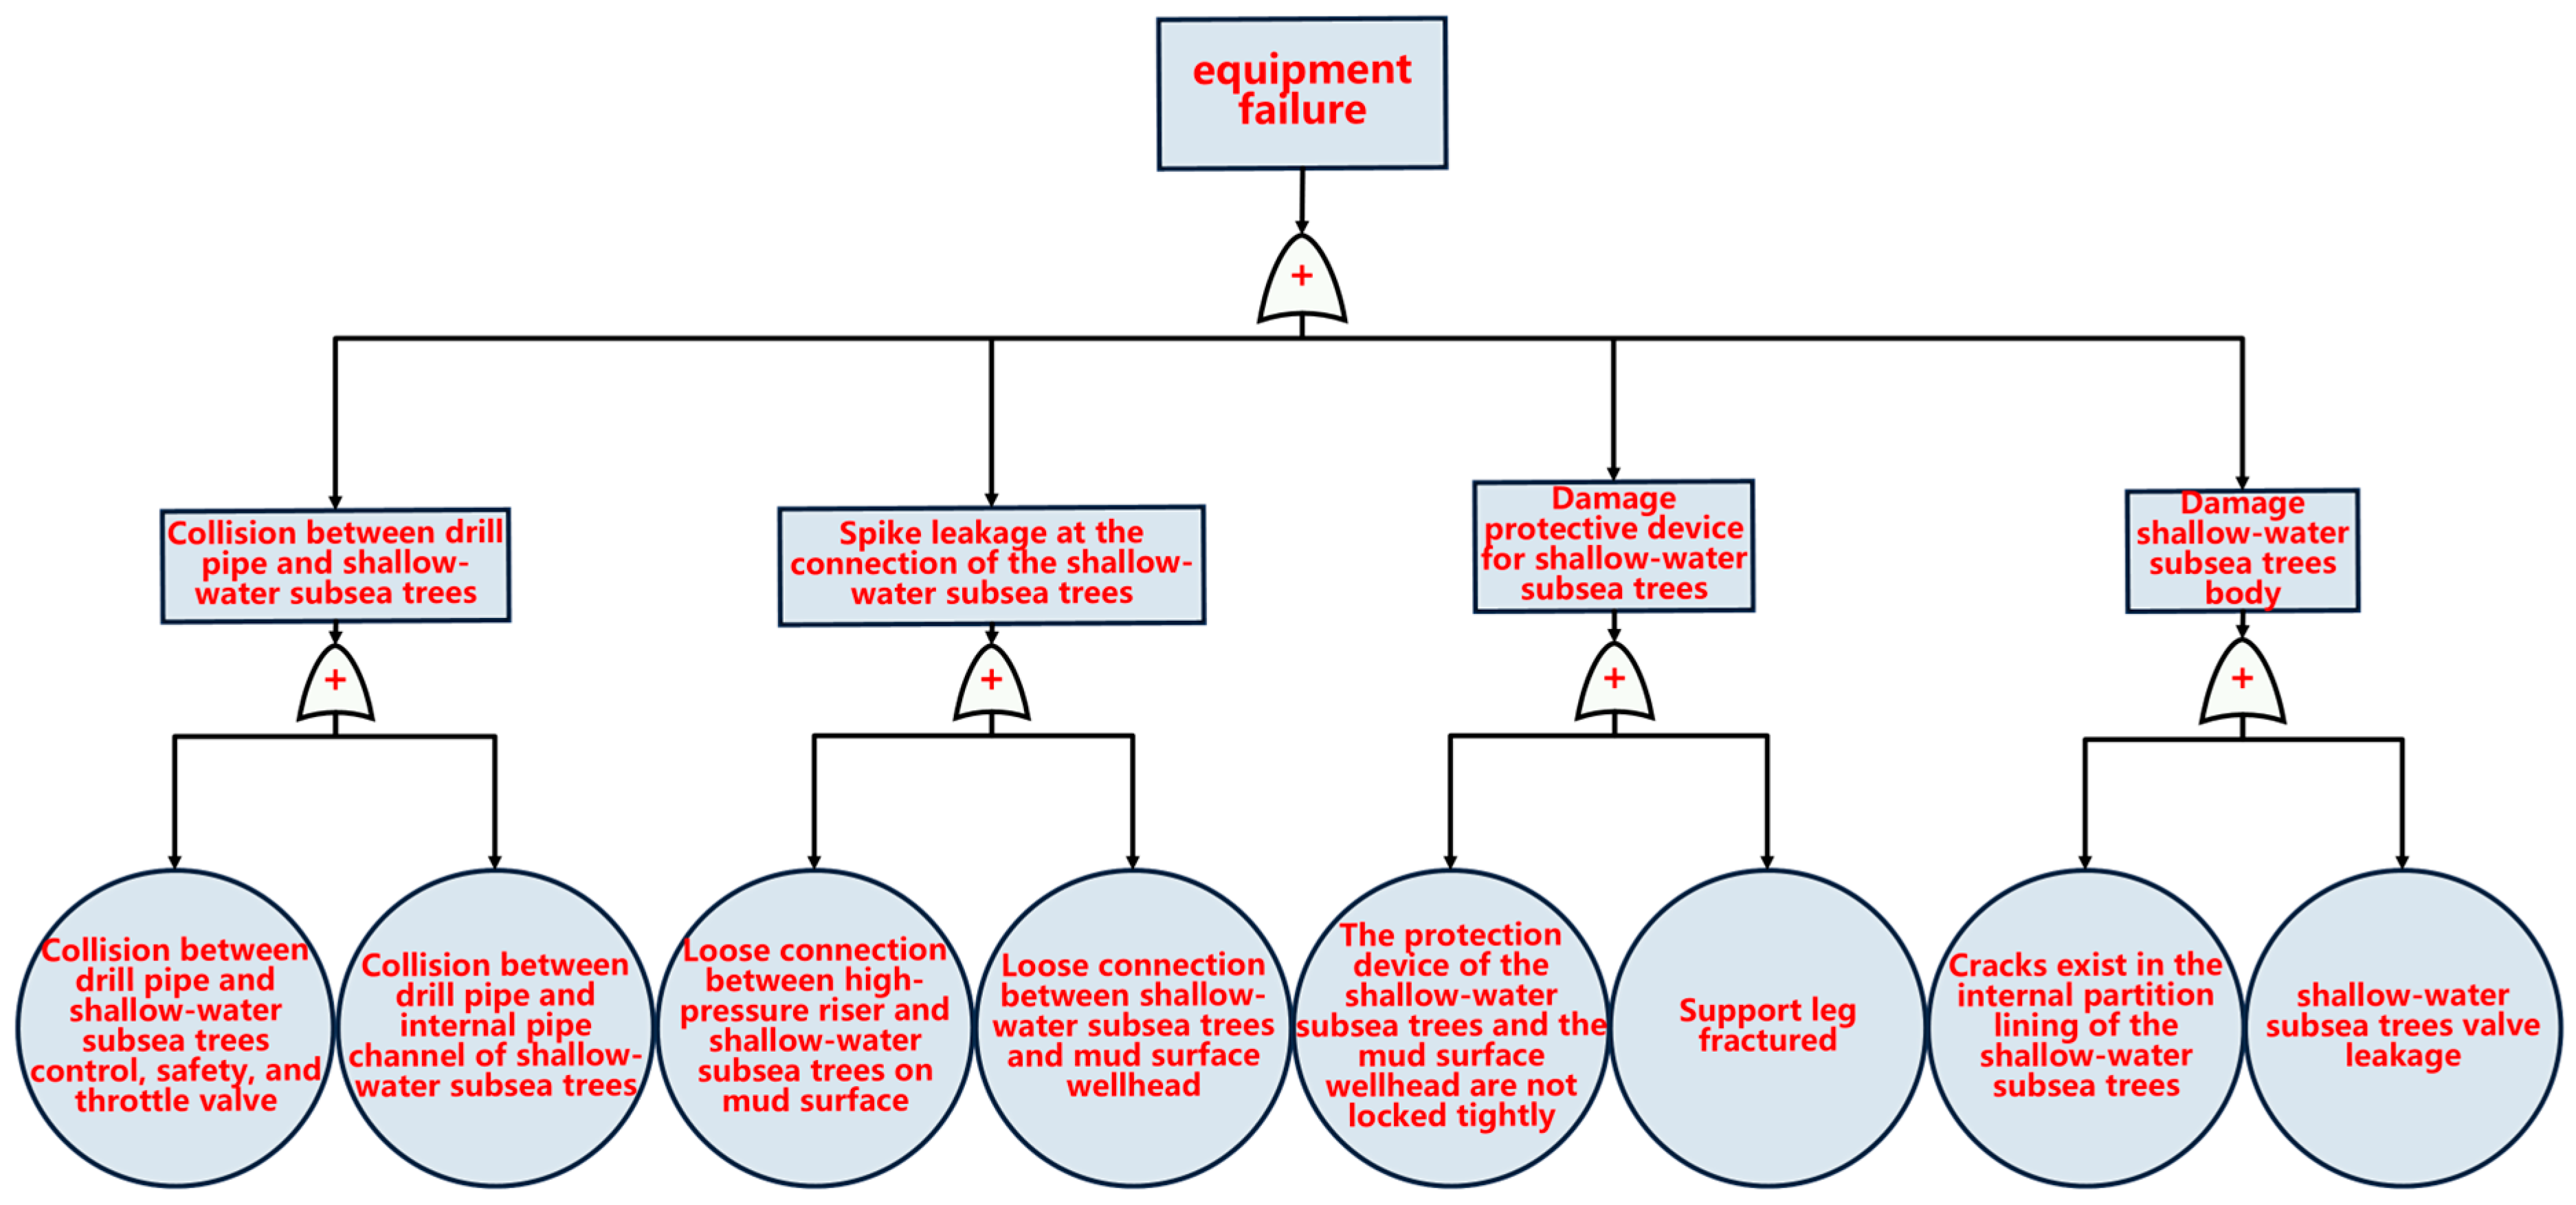
Under the special conditions of the shallow-water subsea tree development model, the equipment risks during the fourth drilling process mainly involve a comprehensive analysis of the drill pipe, pressure riser, and tree. For example, collisions between the drill pipe equipment and the subsea tree, loosening at the connection points leading to leaks, and damage to the protective devices and the body of the subsea tree can all exacerbate well control risks in this environment. Therefore, the risk factors listed in
Figure 11 need be given special attention under these conditions.
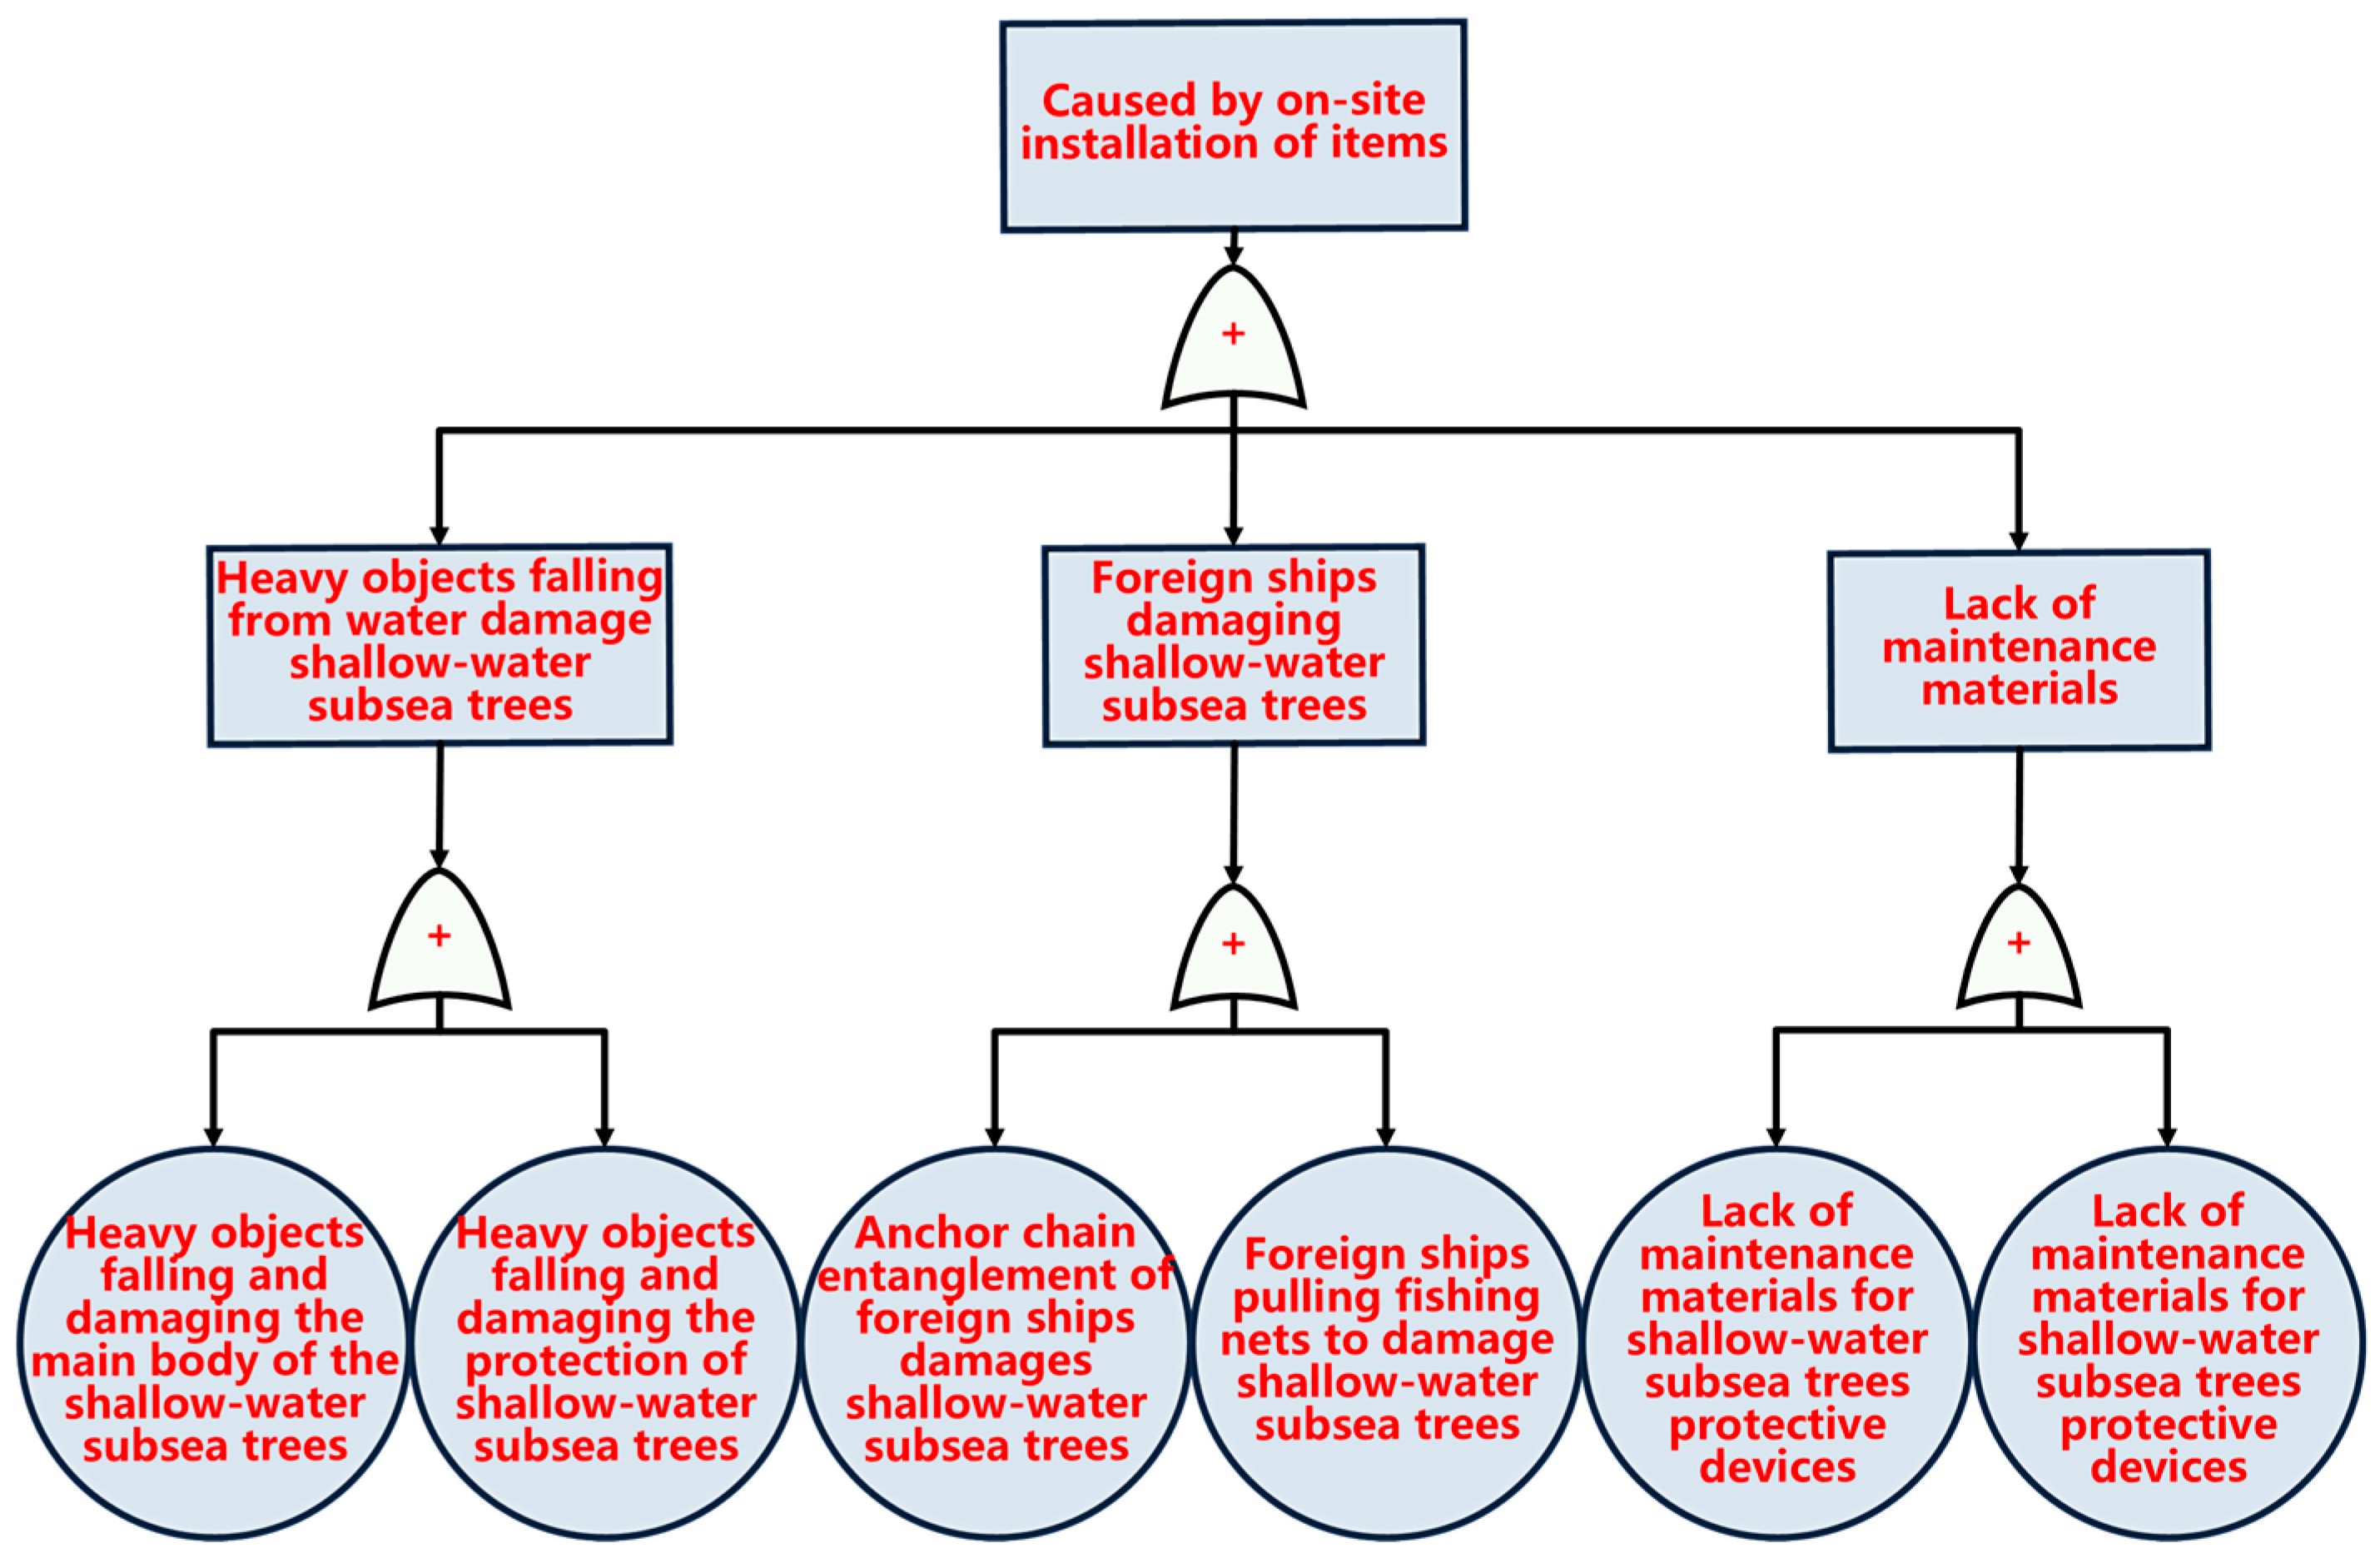
In the shallow-water subsea tree development model, external factors can increase operational risks on facilities and equipment. These external forces may include falling objects in the marine environment, ship anchoring, and fishing net entanglement, all of which can interfere with or damage the normal operation of the subsea tree. During the first three drilling processes, the risks posed by various items were analyzed, but at this stage, particular attention needs to be paid to the potential well control risks posed by falling heavy objects, foreign vessels, and maintenance materials. Falling heavy objects may cause damage to or abnormal operation of the subsea tree, inadvertent operation of foreign vessels may lead to collisions or entanglement, and the incorrect use of maintenance materials may also pose hazards, as shown in
Figure 12.
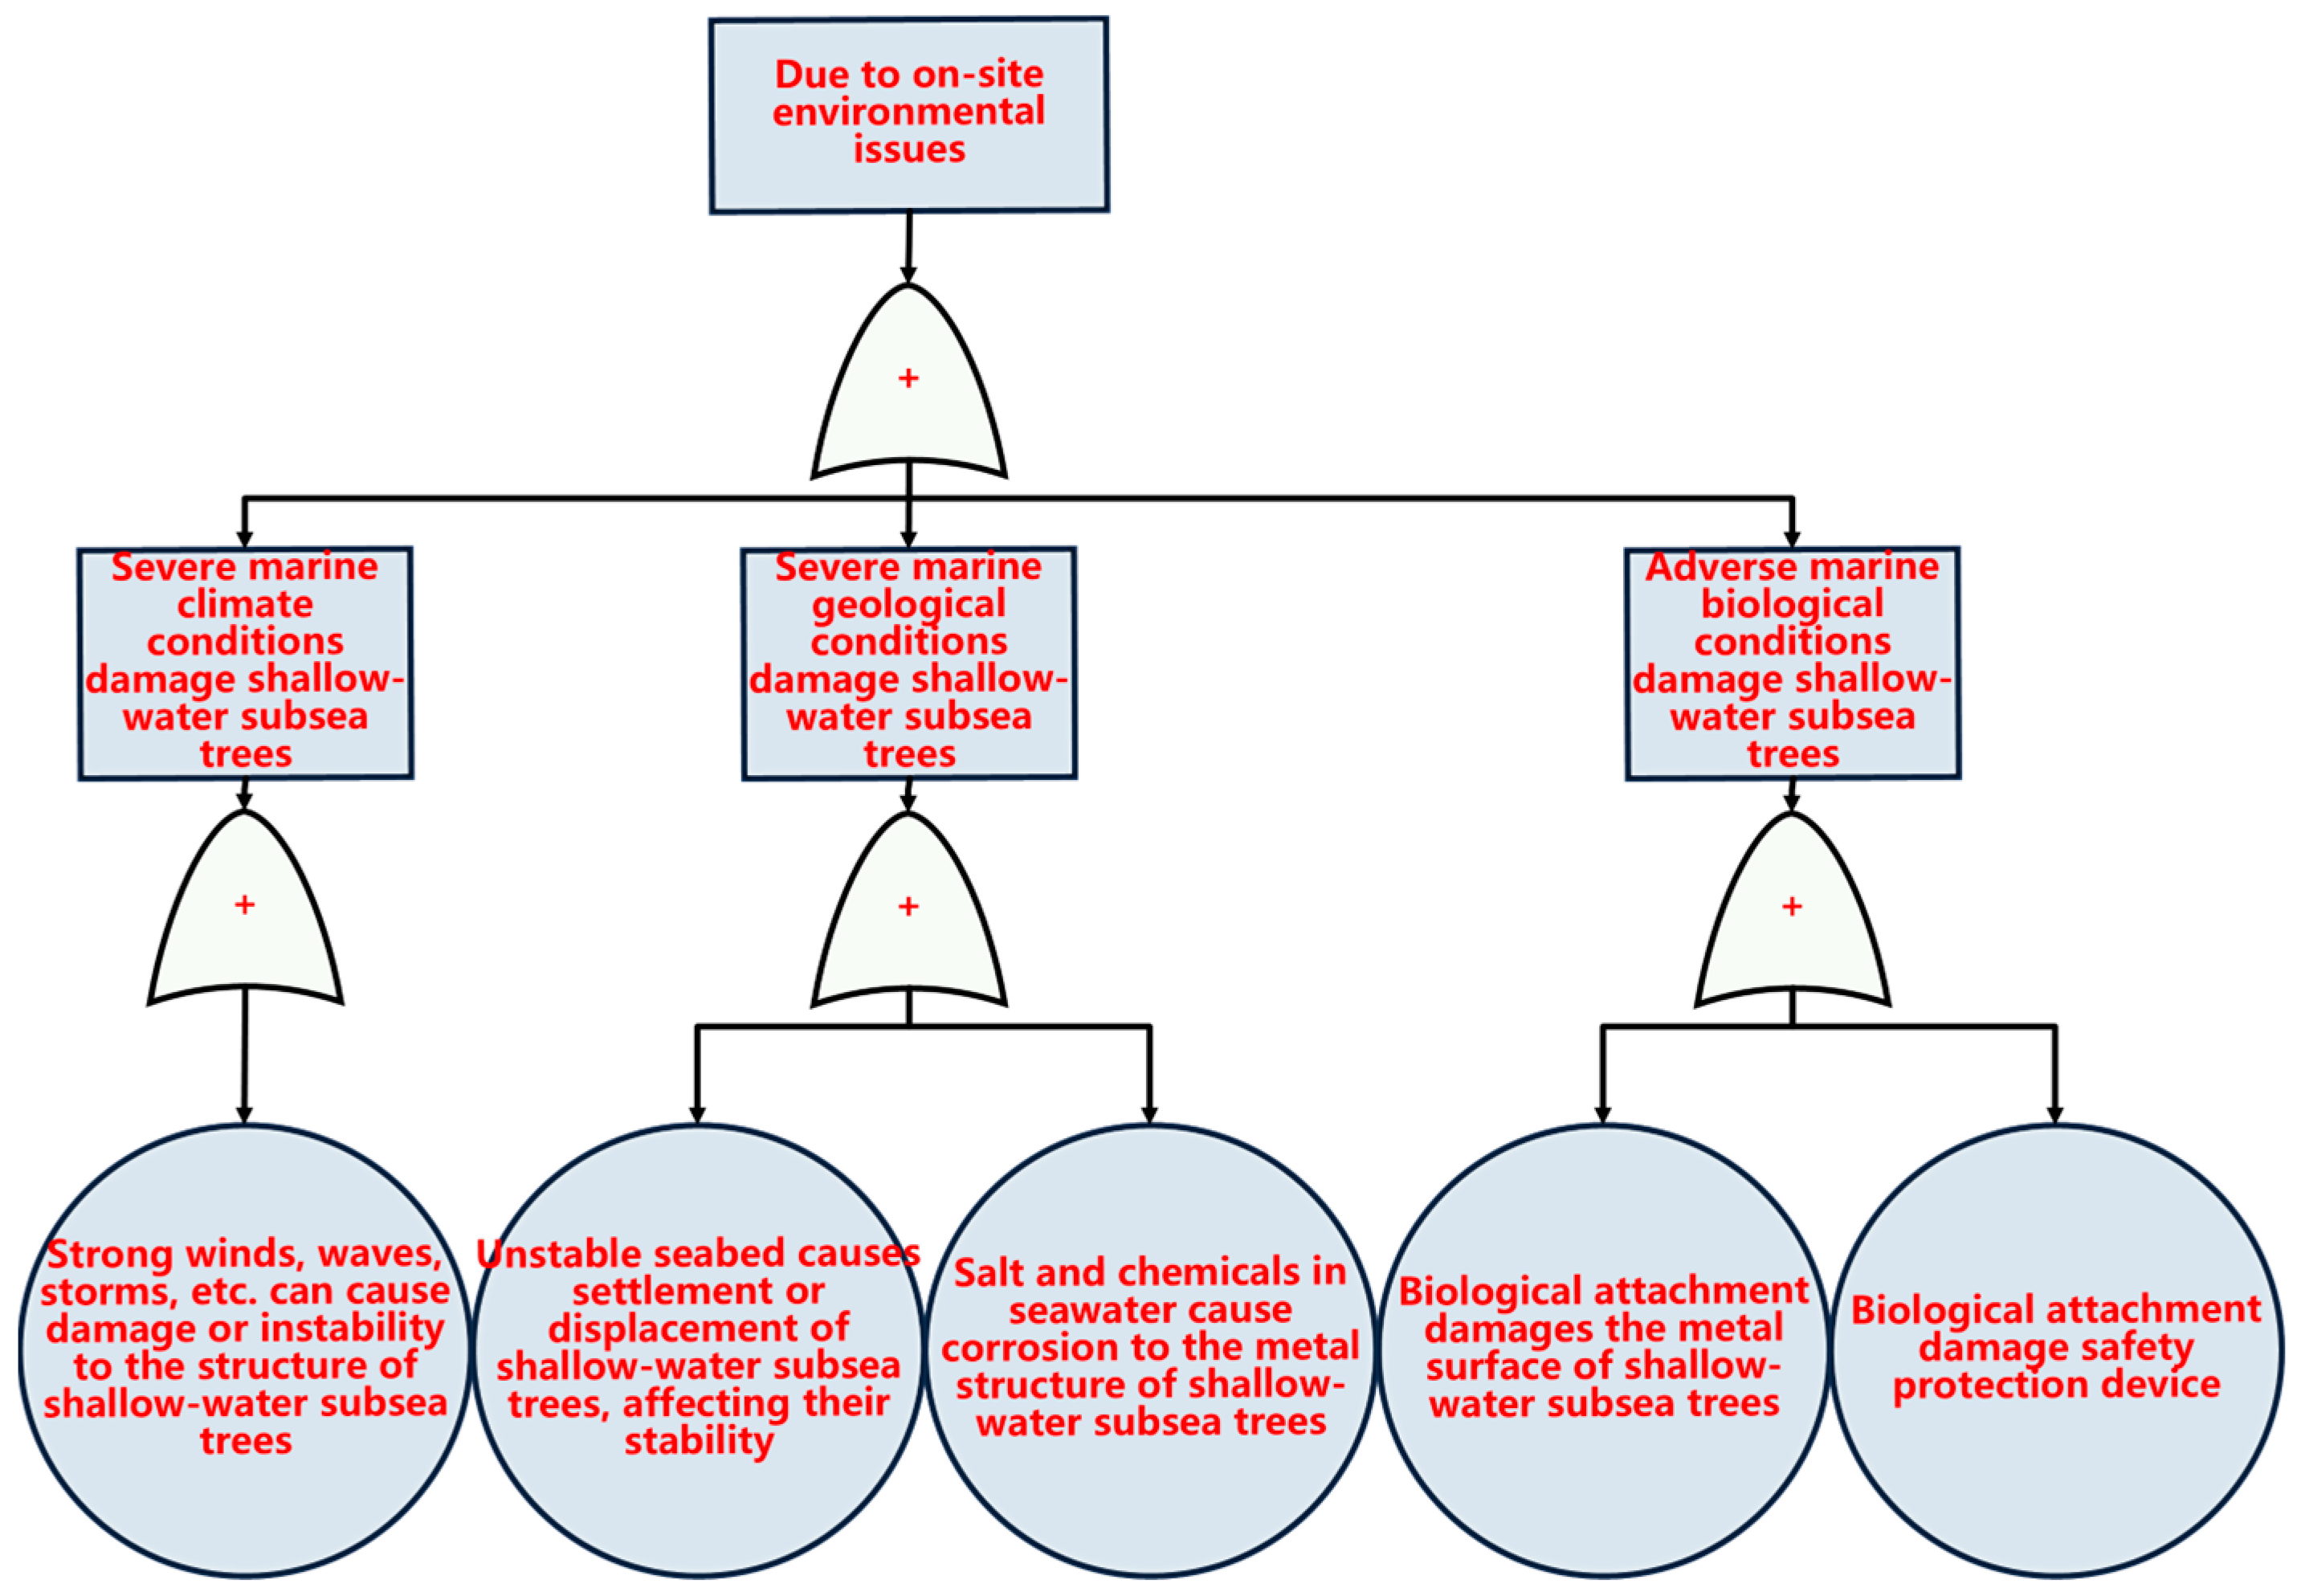
During the fourth drilling operation, based on the analysis of the previous three operations, this phase particularly focuses on environmental risks. These risks primarily stem from the impact of adverse weather, geological, and biological conditions on the subsea production tree and its safety protection devices (as shown in
Figure 13).
4. Quantitative Evaluation of Well Control Risks in Drilling Stages Based on DEMATEL
4.1. Quantitative Evaluation of Well Control Risks in the Previous Three Drilling Operations
Taking the intermediate layer risks in the fault tree as the object of quantitative analysis, as shown in
Table 1, and using the bottom layer risks as discriminating factors, can better connect the internal causal relationships among various risks, facilitating experts in scoring.
Specific results regarding the degree of influence, degree of being influenced, centrality, and rationality of each factor are obtained from the comprehensive influence matrix, as shown in
Table 2 (The relationship matrix of risk factors for the first three drilling operations, the direct in-fluence matrix, and the comprehensive influence evidence can be found in the Appendix
Table A1,
Table A2 and
Table A3). Both the centrality and causality of personnel risk are at relatively high levels, indicating that personnel risk holds a significant position in overall risk management and significantly influences other factors, thus being considered a primary causal factor. In contrast, the centrality of on-site equipment risk is high, but the causality is low, indicating its significant position in overall risk, primarily influenced by other factors, thus classified as a resultant factor. Additionally, the centrality of on-site environmental risk is relatively low, but the causality is high, indicating its relatively low importance in overall risk, yet significant influence on other factors, thus identified as a primary causal factor. Drilling fluid plays a crucial role throughout the drilling process, hence closely related to equipment risk and classified as a resultant factor. However, due to their lower importance in the comprehensive influence matrix, cementing systems and biological rescue materials are classified as secondary causal factors.
4.2. Quantitative Evaluation of Well Control Risks in the Fourth Drilling Operations
Similarly, the intermediate layer risks in the fault tree can be used as objects of quantitative analysis, as shown in
Table 3.
Based on the aforementioned method, the intermediate layer was selected as the object for DEMATEL analysis, and the comprehensive influence matrix was calculated. Through the analysis, specific results regarding the degree of influence, degree of being influenced, centrality, and rationality of each factor were obtained, as detailed in
Table 4 (The relationship matrix of risk factors for the fourth drilling operation, the direct influence matrix, and the comprehensive influence evidence can be found in the Appendix
Table A4,
Table A5 and
Table A6).
4.3. Extracting High-Risk Weights from the First Three Drilling Stages
During the first three drilling operations, since the subsea production tree had not yet been installed, the blowout preventer directly controlled the wellbore pressure (as shown in
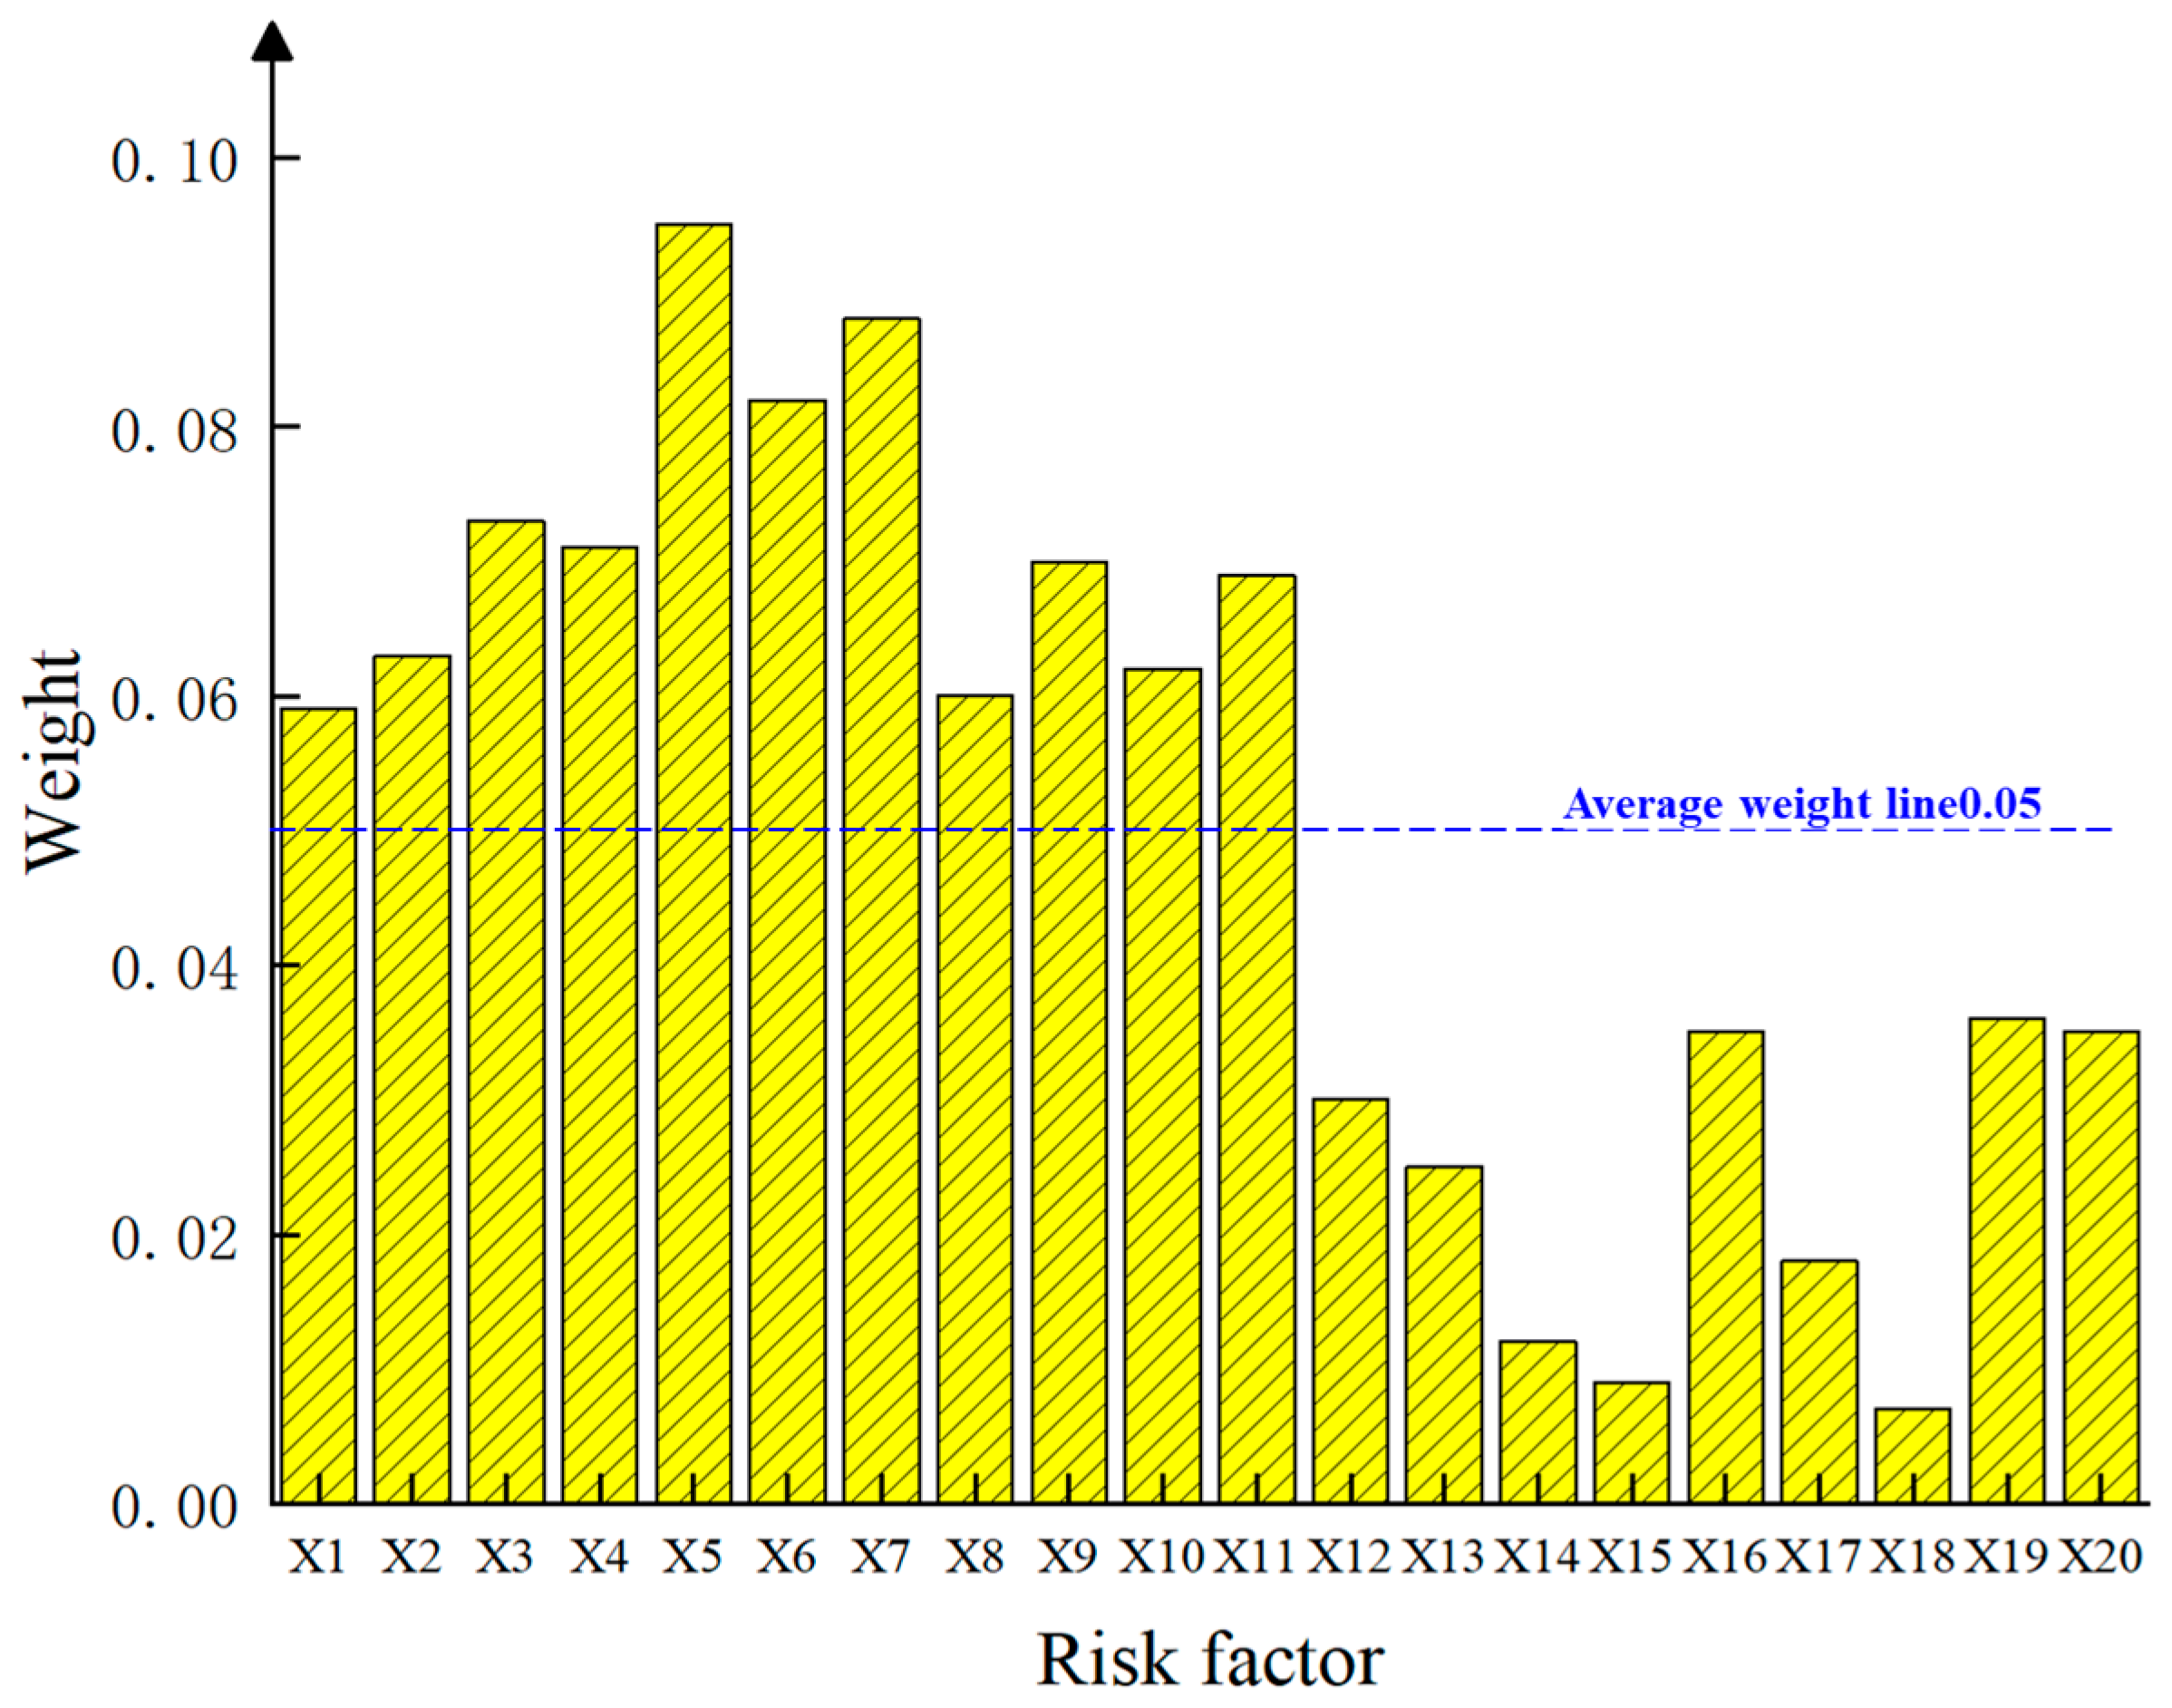
Figure 14). Through quantitative calculations, we found that the high-risk weights primarily stemmed from human operational errors, equipment failures, and the drilling fluid system among on-site items. These risks encompass various scenarios, including potential human operational errors or failure to execute timely the corresponding actions, wear and tear of drilling tools, failure of equipment connection seals, and poor quality of the drilling fluid system. These factors could lead to serious operational incidents or equipment failures, thereby affecting the safety of the drilling process.
4.4. Extracting High-Risk Weights from the Fourth Drilling Stages
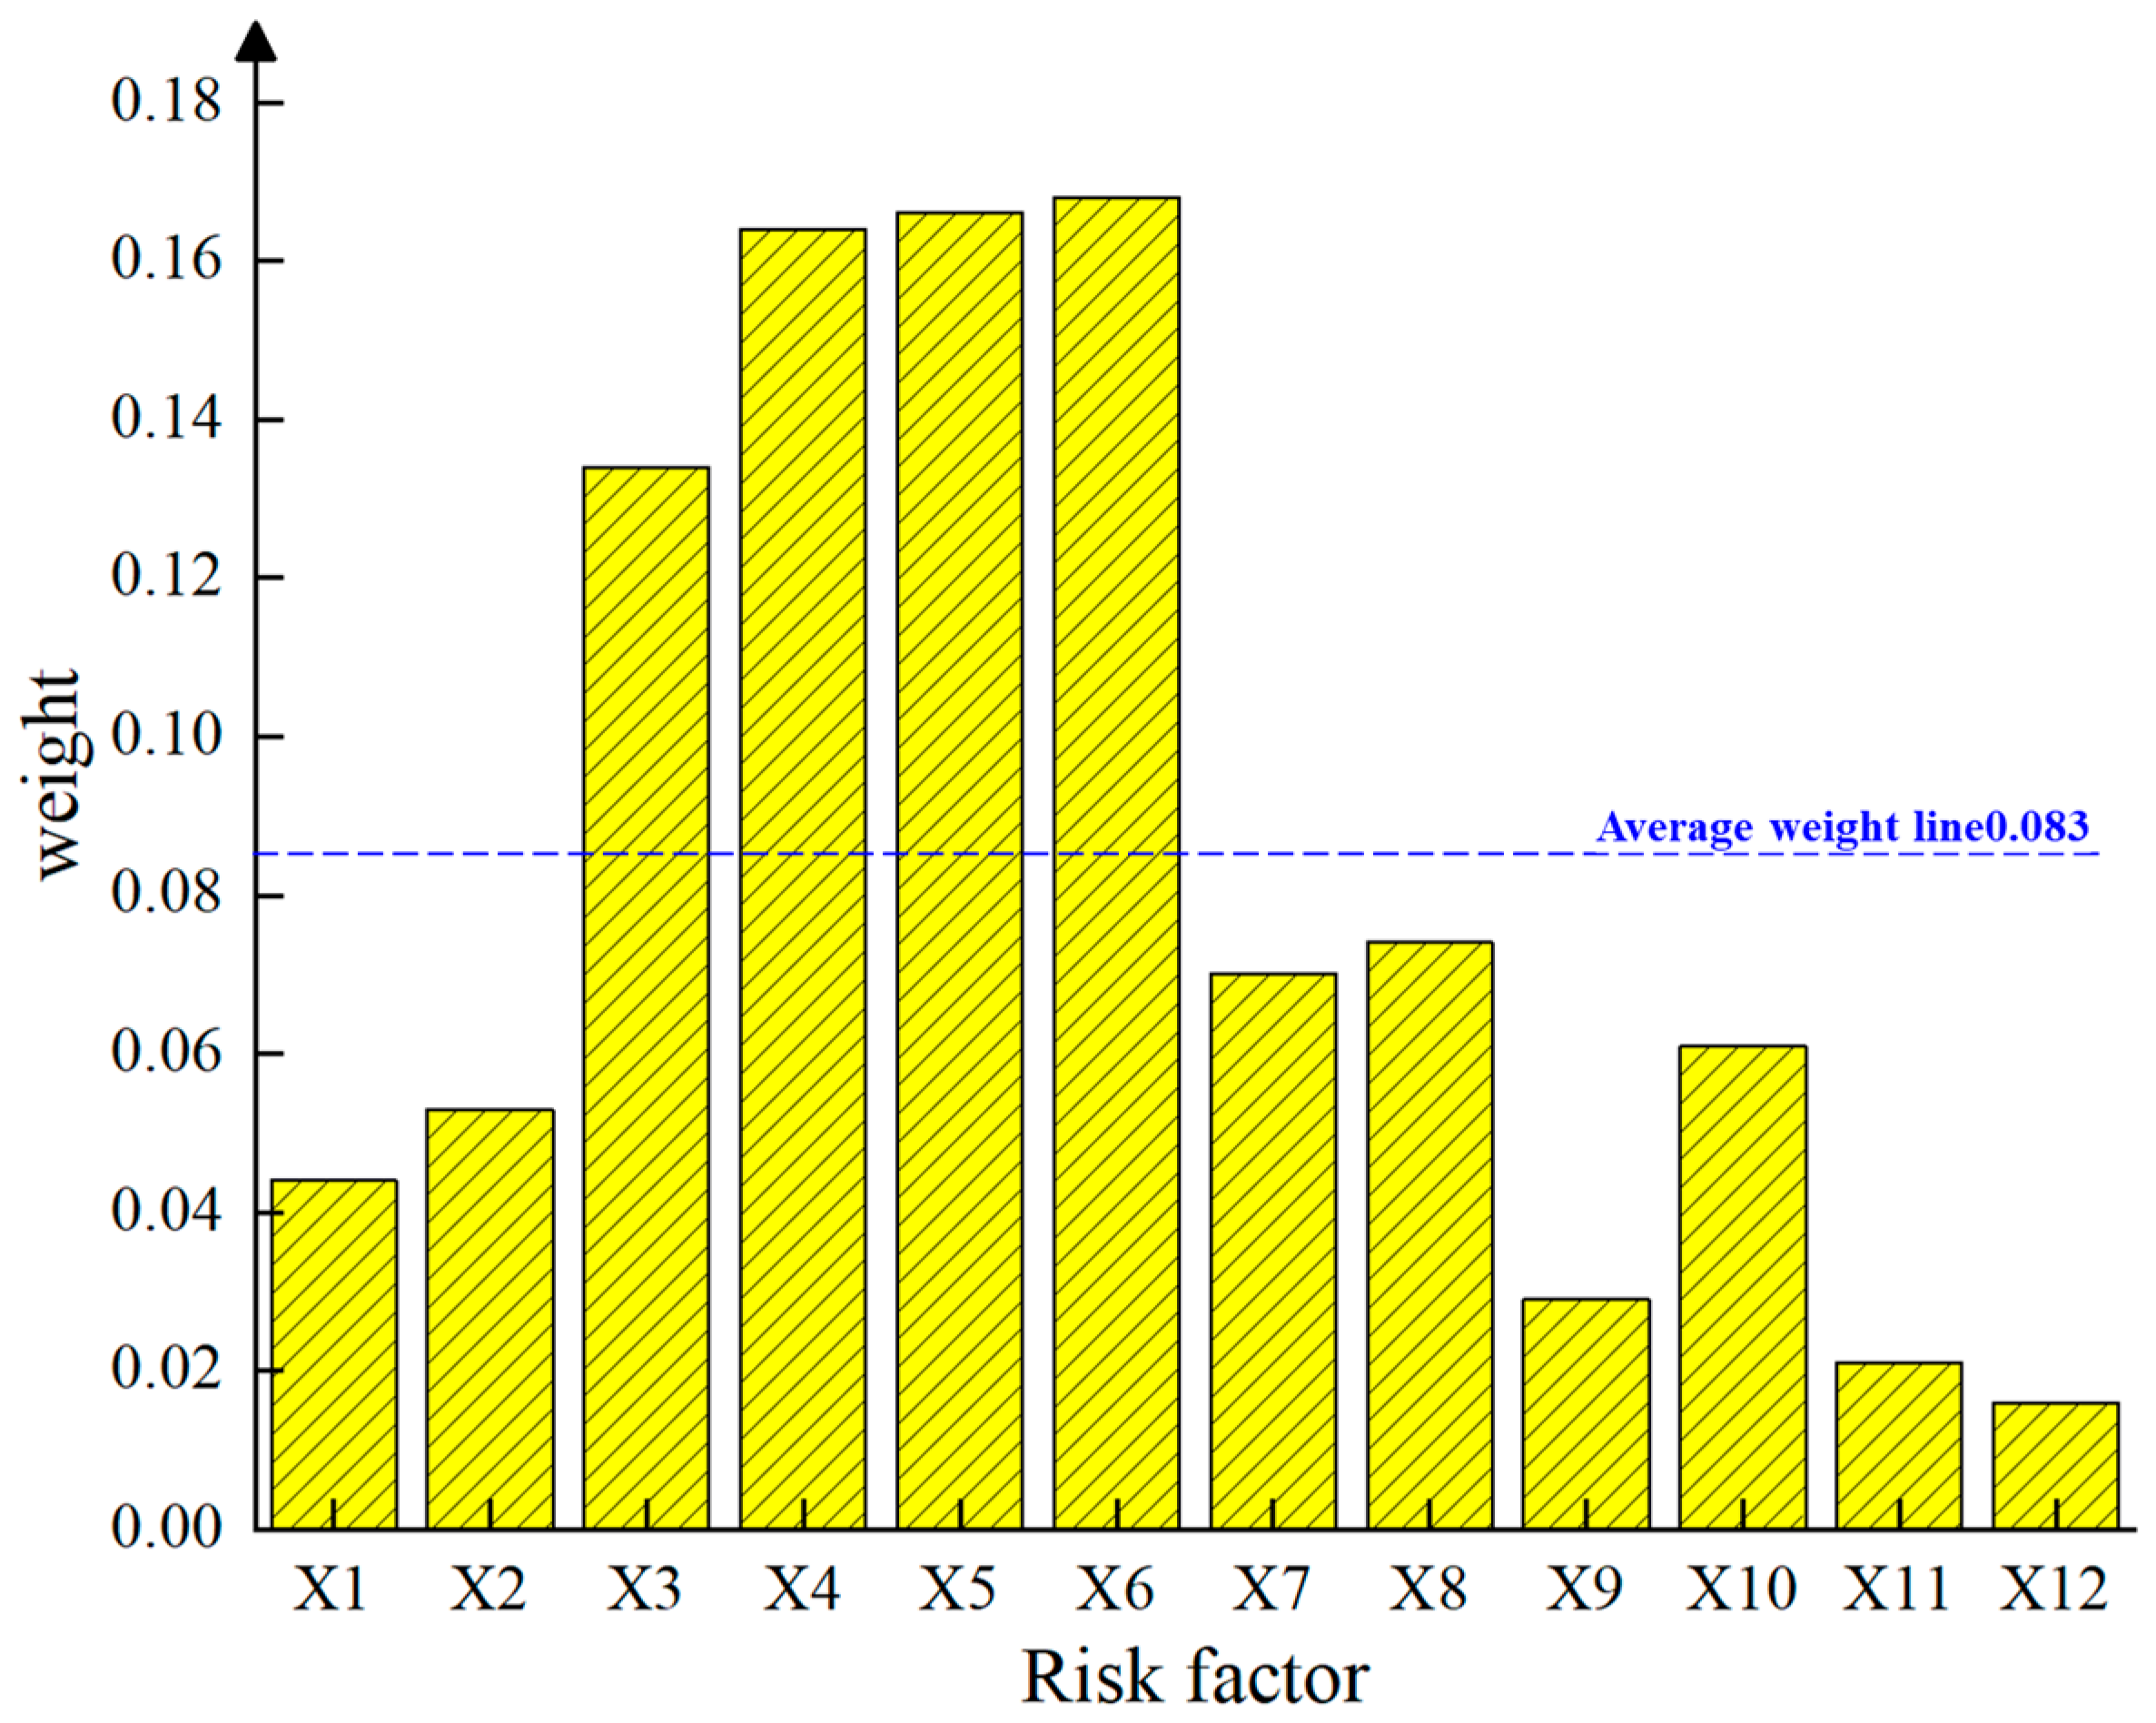
The risk analysis for the fourth drilling operation is based on the experiences from the first three operations and considers the importance of the production tree throughout the drilling process and its environmental impact (as shown in
Figure 15). In shallow-water environments, the production tree operates under special conditions, requiring consideration of various possible marine environmental scenarios during installation and operation, such as falling objects, ship anchoring, and fishing net entanglement. Through quantitative calculations and analysis, it was found that during the fourth drilling operation, high-risk weights are mainly concentrated on potential collisions between the production tree and other equipment, connection failures, and structural damage to the tree itself (as shown in
Figure 6). Since underwater operations in shallow-water environments are susceptible to various external factors, the stability and integrity of the subsea production tree are particularly important. Abnormal adverse events could result in severe safety accidents or equipment damage.
5. Conclusions
This study utilized STPA to map out comprehensively the people, machines, materials, and environment involved in the first three drilling operations and the fourth drilling operation of the shallow-water oil development model, thoroughly extracting the relevant risk factors. Subsequently, FTA was employed to explore the interrelationships among these risk factors from the perspectives of personnel, equipment, items, and the environment. We designated the second-layer factors from the FTA as calculation targets and applied the DEMATEL method to identify high-weight typical factors. Based on this analysis, the specific conclusions are outlined below.
The risks in the first three drilling stages primarily include improper personnel operations, equipment failures, and inadequate emergency responses. Additionally, the wear and loosening of connections in blowout preventers, risers, and drill string components, as well as instances of perforation are also critical risks. The current project faces shortcomings in drilling fluids, cementing materials, and lifesaving supplies, which also exhibit poor physical and chemical properties. Furthermore, environmental factors, such as the formation of shallow gas and hydrates along with strong winds and waves damaging the drilling platform, pose significant threats to operational safety. Through the application of the DEMATEL method for quantitative analysis, we identified high-risk weights in the first three drilling stages, encompassing a total of 11 risk factors, including personnel operations, equipment status, and drilling fluid system quality.
In the fourth drilling stage, the shallow-water subsea tree operates under special working conditions in an underwater environment, necessitating consideration of various possible marine scenarios, such as falling objects, ship anchoring, and fishing net entanglement. The focus of the fourth drilling stage is to analyze the risks associated with the special working conditions that the subsea tree and its auxiliary equipment may encounter. High-risk weights primarily stem from damage between the subsea tree and its auxiliary equipment, including collisions between drilling equipment and the subsea tree, punctures caused by loose connections, damage to the protective devices of the subsea tree, and structural damage to the subsea tree itself.
Author Contributions
Data curation, Y.M.; Funding acquisition, Z.Y.; Investigation, H.W. and C.X.; Methodology, Z.Y.; Validation, M.R., X.Y. and D.T.; Writing—original draft, Z.Y.; Writing—review and editing, C.X. and J.Q. All authors have read and agreed to the published version of the manuscript.
Funding
This research was funded by the National key research and development program (No.2022YFC2806504); National Natural Science Foundation of China (No.52274026); CNOOC Research Project (No.KJGG-2022-17-04, KJGJ-2023-0002).
Institutional Review Board Statement
Not applicable.
Informed Consent Statement
Not applicable.
Data Availability Statement
Data are contained within the article.
Conflicts of Interest
Authors Zhiming Yin, Meipeng Ren, Yingwen Ma, Xiangqian Yang, Deqiang Tian, and Haiwei Wang are employed by CNOOC Research Institute Co., Ltd. The authors declare that this study received funding from CNOOC Research Institute Co., Ltd. The funder was not involved in the study design; the collection, analysis, and interpretation of the data; the writing of this article; or the decision to submit it for publication.
Appendix A
(1) The first three drilling phases:
Table A1.
The relationship matrix of risk factors for the first three drilling phases (expert scoring).
Table A1.
The relationship matrix of risk factors for the first three drilling phases (expert scoring).
| | X1 | X2 | X3 | X4 | X5 | X6 | X7 | X8 | X9 | X10 | X11 | X12 | X13 | X14 | X15 | X16 | X17 | X18 | X19 | X20 |
|---|
| X1 | 0 | 1 | 1 | 2 | 2 | 2 | 2 | 3 | 2 | 2 | 2 | 1 | 0 | 0 | 0 | 0 | 0 | 0 | 0 | 0 |
| X2 | 3 | 0 | 3 | 3 | 2 | 2 | 2 | 1 | 2 | 2 | 2 | 1 | 0 | 0 | 0 | 0 | 0 | 0 | 0 | 0 |
| X3 | 3 | 1 | 0 | 4 | 3 | 3 | 3 | 1 | 3 | 3 | 3 | 1 | 0 | 0 | 0 | 0 | 0 | 0 | 0 | 0 |
| X4 | 2 | 2 | 2 | 0 | 3 | 3 | 3 | 1 | 3 | 3 | 2 | 1 | 0 | 0 | 0 | 0 | 0 | 0 | 0 | 0 |
| X5 | 1 | 1 | 1 | 1 | 0 | 2 | 2 | 0 | 2 | 2 | 3 | 0 | 0 | 0 | 0 | 0 | 0 | 0 | 0 | 0 |
| X6 | 0 | 0 | 0 | 0 | 2 | 0 | 4 | 1 | 3 | 1 | 1 | 1 | 0 | 0 | 0 | 0 | 0 | 0 | 0 | 0 |
| X7 | 0 | 0 | 0 | 0 | 1 | 3 | 0 | 1 | 3 | 3 | 2 | 1 | 0 | 0 | 0 | 0 | 0 | 0 | 0 | 0 |
| X8 | 0 | 0 | 0 | 0 | 3 | 2 | 3 | 0 | 0 | 1 | 1 | 0 | 0 | 0 | 0 | 0 | 0 | 0 | 0 | 0 |
| X9 | 0 | 0 | 0 | 0 | 2 | 1 | 2 | 1 | 0 | 1 | 2 | 0 | 0 | 0 | 0 | 0 | 0 | 0 | 0 | 0 |
| X10 | 0 | 0 | 0 | 0 | 1 | 1 | 1 | 1 | 1 | 0 | 0 | 0 | 0 | 0 | 0 | 0 | 0 | 0 | 0 | 0 |
| X11 | 0 | 0 | 0 | 0 | 3 | 1 | 1 | 1 | 0 | 1 | 0 | 0 | 0 | 0 | 0 | 0 | 0 | 0 | 0 | 0 |
| X12 | 0 | 0 | 0 | 0 | 1 | 1 | 0 | 4 | 0 | 0 | 2 | 0 | 0 | 0 | 0 | 0 | 0 | 0 | 0 | 0 |
| X13 | 1 | 1 | 1 | 1 | 1 | 1 | 1 | 1 | 1 | 1 | 1 | 1 | 0 | 0 | 0 | 0 | 0 | 0 | 0 | 0 |
| X14 | 0 | 0 | 0 | 0 | 1 | 1 | 1 | 1 | 1 | 1 | 0 | 0 | 0 | 0 | 0 | 0 | 0 | 0 | 0 | 0 |
| X15 | 0 | 0 | 0 | 0 | 1 | 0 | 0 | 0 | 0 | 0 | 3 | 0 | 0 | 2 | 0 | 0 | 0 | 0 | 0 | 0 |
| X16 | 0 | 0 | 0 | 0 | 2 | 2 | 2 | 2 | 2 | 2 | 1 | 1 | 1 | 0 | 0 | 0 | 0 | 0 | 2 | 2 |
| X17 | 0 | 0 | 0 | 0 | 2 | 1 | 1 | 1 | 0 | 0 | 3 | 1 | 0 | 0 | 0 | 0 | 0 | 0 | 0 | 0 |
| X18 | 0 | 0 | 0 | 0 | 1 | 1 | 1 | 1 | 0 | 0 | 0 | 0 | 0 | 0 | 0 | 0 | 0 | 0 | 0 | 0 |
| X19 | 0 | 0 | 0 | 0 | 3 | 3 | 3 | 3 | 3 | 3 | 0 | 0 | 0 | 0 | 0 | 0 | 2 | 0 | 0 | 0 |
| X20 | 3 | 3 | 3 | 3 | 0 | 0 | 0 | 0 | 0 | 0 | 0 | 0 | 0 | 0 | 0 | 0 | 0 | 0 | 0 | 0 |
Table A2.
The risk direct impact matrix for the first three drilling phases.
Table A2.
The risk direct impact matrix for the first three drilling phases.
| | X1 | X2 | X3 | X4 | X5 | X6 | X7 | X8 | X9 | X10 | X11 | X12 | X13 | X14 | X15 | X16 | X17 | X18 | X19 | X20 |
|---|
| X1 | 0.000 | 0.036 | 0.036 | 0.071 | 0.071 | 0.071 | 0.071 | 0.107 | 0.071 | 0.071 | 0.071 | 0.036 | 0.000 | 0.000 | 0.000 | 0.000 | 0.000 | 0.000 | 0.000 | 0.000 |
| X2 | 0.107 | 0.000 | 0.107 | 0.107 | 0.071 | 0.071 | 0.071 | 0.036 | 0.071 | 0.071 | 0.071 | 0.036 | 0.000 | 0.000 | 0.000 | 0.000 | 0.000 | 0.000 | 0.000 | 0.000 |
| X3 | 0.107 | 0.036 | 0.000 | 0.143 | 0.107 | 0.107 | 0.107 | 0.036 | 0.107 | 0.107 | 0.107 | 0.036 | 0.000 | 0.000 | 0.000 | 0.000 | 0.000 | 0.000 | 0.000 | 0.000 |
| X4 | 0.071 | 0.071 | 0.071 | 0.000 | 0.107 | 0.107 | 0.107 | 0.036 | 0.107 | 0.107 | 0.071 | 0.036 | 0.000 | 0.000 | 0.000 | 0.000 | 0.000 | 0.000 | 0.000 | 0.000 |
| X5 | 0.036 | 0.036 | 0.036 | 0.036 | 0.000 | 0.071 | 0.071 | 0.000 | 0.071 | 0.071 | 0.107 | 0.000 | 0.000 | 0.000 | 0.000 | 0.000 | 0.000 | 0.000 | 0.000 | 0.000 |
| X6 | 0.000 | 0.000 | 0.000 | 0.000 | 0.071 | 0.000 | 0.143 | 0.036 | 0.107 | 0.036 | 0.036 | 0.036 | 0.000 | 0.000 | 0.000 | 0.000 | 0.000 | 0.000 | 0.000 | 0.000 |
| X7 | 0.000 | 0.000 | 0.000 | 0.000 | 0.036 | 0.107 | 0.000 | 0.036 | 0.107 | 0.107 | 0.071 | 0.036 | 0.000 | 0.000 | 0.000 | 0.000 | 0.000 | 0.000 | 0.000 | 0.000 |
| X8 | 0.000 | 0.000 | 0.000 | 0.000 | 0.107 | 0.071 | 0.107 | 0.000 | 0.000 | 0.036 | 0.036 | 0.000 | 0.000 | 0.000 | 0.000 | 0.000 | 0.000 | 0.000 | 0.000 | 0.000 |
| X9 | 0.000 | 0.000 | 0.000 | 0.000 | 0.071 | 0.036 | 0.071 | 0.036 | 0.000 | 0.036 | 0.071 | 0.000 | 0.000 | 0.000 | 0.000 | 0.000 | 0.000 | 0.000 | 0.000 | 0.000 |
| X10 | 0.000 | 0.000 | 0.000 | 0.000 | 0.036 | 0.036 | 0.036 | 0.036 | 0.036 | 0.000 | 0.000 | 0.000 | 0.000 | 0.000 | 0.000 | 0.000 | 0.000 | 0.000 | 0.000 | 0.000 |
| X11 | 0.000 | 0.000 | 0.000 | 0.000 | 0.107 | 0.036 | 0.036 | 0.036 | 0.000 | 0.036 | 0.000 | 0.000 | 0.000 | 0.000 | 0.000 | 0.000 | 0.000 | 0.000 | 0.000 | 0.000 |
| X12 | 0.000 | 0.000 | 0.000 | 0.000 | 0.036 | 0.036 | 0.000 | 0.143 | 0.000 | 0.000 | 0.071 | 0.000 | 0.000 | 0.000 | 0.000 | 0.000 | 0.000 | 0.000 | 0.000 | 0.000 |
| X13 | 0.036 | 0.036 | 0.036 | 0.036 | 0.036 | 0.036 | 0.036 | 0.036 | 0.036 | 0.036 | 0.036 | 0.036 | 0.000 | 0.000 | 0.000 | 0.000 | 0.000 | 0.000 | 0.000 | 0.000 |
| X14 | 0.000 | 0.000 | 0.000 | 0.000 | 0.036 | 0.036 | 0.036 | 0.036 | 0.036 | 0.036 | 0.000 | 0.000 | 0.000 | 0.000 | 0.000 | 0.000 | 0.000 | 0.000 | 0.000 | 0.000 |
| X15 | 0.000 | 0.000 | 0.000 | 0.000 | 0.036 | 0.000 | 0.000 | 0.000 | 0.000 | 0.000 | 0.107 | 0.000 | 0.000 | 0.071 | 0.000 | 0.000 | 0.000 | 0.000 | 0.000 | 0.000 |
| X16 | 0.000 | 0.000 | 0.000 | 0.000 | 0.071 | 0.071 | 0.071 | 0.071 | 0.071 | 0.071 | 0.036 | 0.036 | 0.036 | 0.000 | 0.000 | 0.000 | 0.000 | 0.000 | 0.071 | 0.071 |
| X17 | 0.000 | 0.000 | 0.000 | 0.000 | 0.071 | 0.036 | 0.036 | 0.036 | 0.000 | 0.000 | 0.107 | 0.036 | 0.000 | 0.000 | 0.000 | 0.000 | 0.000 | 0.000 | 0.000 | 0.000 |
| X18 | 0.000 | 0.000 | 0.000 | 0.000 | 0.036 | 0.036 | 0.036 | 0.036 | 0.000 | 0.000 | 0.000 | 0.000 | 0.000 | 0.000 | 0.000 | 0.000 | 0.000 | 0.000 | 0.000 | 0.000 |
| X19 | 0.000 | 0.000 | 0.000 | 0.000 | 0.107 | 0.107 | 0.107 | 0.107 | 0.107 | 0.107 | 0.000 | 0.000 | 0.000 | 0.000 | 0.000 | 0.000 | 0.071 | 0.000 | 0.000 | 0.000 |
| X20 | 0.107 | 0.107 | 0.107 | 0.107 | 0.000 | 0.000 | 0.000 | 0.000 | 0.000 | 0.000 | 0.000 | 0.000 | 0.000 | 0.000 | 0.000 | 0.000 | 0.000 | 0.000 | 0.000 | 0.000 |
Table A3.
The comprehensive risk impact matrix T for the first three drilling phases.
Table A3.
The comprehensive risk impact matrix T for the first three drilling phases.
| | X1 | X2 | X3 | X4 | X5 | X6 | X7 | X8 | X9 | X10 | X11 | X12 | X13 | X14 | X15 | X16 | X17 | X18 | X19 | X20 |
|---|
| X1 | 0.023 | 0.051 | 0.054 | 0.092 | 0.157 | 0.149 | 0.161 | 0.151 | 0.142 | 0.142 | 0.142 | 0.055 | 0.000 | 0.000 | 0.000 | 0.000 | 0.000 | 0.000 | 0.000 | 0.000 |
| X2 | 0.141 | 0.027 | 0.132 | 0.145 | 0.181 | 0.174 | 0.186 | 0.102 | 0.171 | 0.168 | 0.167 | 0.064 | 0.000 | 0.000 | 0.000 | 0.000 | 0.000 | 0.000 | 0.000 | 0.000 |
| X3 | 0.138 | 0.062 | 0.032 | 0.172 | 0.226 | 0.217 | 0.232 | 0.108 | 0.215 | 0.211 | 0.210 | 0.066 | 0.000 | 0.000 | 0.000 | 0.000 | 0.000 | 0.000 | 0.000 | 0.000 |
| X4 | 0.101 | 0.089 | 0.095 | 0.038 | 0.209 | 0.202 | 0.217 | 0.098 | 0.202 | 0.197 | 0.165 | 0.062 | 0.000 | 0.000 | 0.000 | 0.000 | 0.000 | 0.000 | 0.000 | 0.000 |
| X5 | 0.052 | 0.046 | 0.049 | 0.054 | 0.067 | 0.126 | 0.135 | 0.037 | 0.127 | 0.125 | 0.156 | 0.016 | 0.000 | 0.000 | 0.000 | 0.000 | 0.000 | 0.000 | 0.000 | 0.000 |
| X6 | 0.006 | 0.005 | 0.005 | 0.006 | 0.113 | 0.046 | 0.182 | 0.062 | 0.144 | 0.077 | 0.080 | 0.045 | 0.000 | 0.000 | 0.000 | 0.000 | 0.000 | 0.000 | 0.000 | 0.000 |
| X7 | 0.004 | 0.004 | 0.004 | 0.004 | 0.084 | 0.140 | 0.053 | 0.063 | 0.140 | 0.136 | 0.106 | 0.043 | 0.000 | 0.000 | 0.000 | 0.000 | 0.000 | 0.000 | 0.000 | 0.000 |
| X8 | 0.007 | 0.006 | 0.006 | 0.007 | 0.138 | 0.107 | 0.145 | 0.018 | 0.042 | 0.072 | 0.071 | 0.010 | 0.000 | 0.000 | 0.000 | 0.000 | 0.000 | 0.000 | 0.000 | 0.000 |
| X9 | 0.005 | 0.004 | 0.005 | 0.005 | 0.102 | 0.067 | 0.103 | 0.051 | 0.030 | 0.065 | 0.098 | 0.007 | 0.000 | 0.000 | 0.000 | 0.000 | 0.000 | 0.000 | 0.000 | 0.000 |
| X10 | 0.003 | 0.002 | 0.002 | 0.003 | 0.054 | 0.053 | 0.058 | 0.044 | 0.053 | 0.017 | 0.018 | 0.004 | 0.000 | 0.000 | 0.000 | 0.000 | 0.000 | 0.000 | 0.000 | 0.000 |
| X11 | 0.006 | 0.005 | 0.006 | 0.006 | 0.128 | 0.062 | 0.066 | 0.046 | 0.027 | 0.060 | 0.027 | 0.005 | 0.000 | 0.000 | 0.000 | 0.000 | 0.000 | 0.000 | 0.000 | 0.000 |
| X12 | 0.003 | 0.003 | 0.003 | 0.004 | 0.071 | 0.062 | 0.037 | 0.152 | 0.018 | 0.022 | 0.092 | 0.004 | 0.000 | 0.000 | 0.000 | 0.000 | 0.000 | 0.000 | 0.000 | 0.000 |
| X13 | 0.053 | 0.047 | 0.050 | 0.055 | 0.090 | 0.086 | 0.092 | 0.069 | 0.082 | 0.082 | 0.083 | 0.049 | 0.000 | 0.000 | 0.000 | 0.000 | 0.000 | 0.000 | 0.000 | 0.000 |
| X14 | 0.003 | 0.002 | 0.003 | 0.003 | 0.056 | 0.055 | 0.060 | 0.046 | 0.055 | 0.053 | 0.019 | 0.004 | 0.000 | 0.000 | 0.000 | 0.000 | 0.000 | 0.000 | 0.000 | 0.000 |
| X15 | 0.003 | 0.002 | 0.003 | 0.003 | 0.056 | 0.015 | 0.016 | 0.010 | 0.011 | 0.015 | 0.117 | 0.001 | 0.000 | 0.071 | 0.000 | 0.000 | 0.000 | 0.000 | 0.000 | 0.000 |
| X16 | 0.019 | 0.017 | 0.018 | 0.020 | 0.140 | 0.135 | 0.146 | 0.114 | 0.132 | 0.129 | 0.091 | 0.050 | 0.036 | 0.000 | 0.000 | 0.000 | 0.005 | 0.000 | 0.071 | 0.071 |
| X17 | 0.005 | 0.004 | 0.005 | 0.005 | 0.104 | 0.064 | 0.067 | 0.054 | 0.024 | 0.026 | 0.134 | 0.041 | 0.000 | 0.000 | 0.000 | 0.000 | 0.000 | 0.000 | 0.000 | 0.000 |
| X18 | 0.002 | 0.002 | 0.002 | 0.003 | 0.050 | 0.051 | 0.054 | 0.042 | 0.016 | 0.015 | 0.015 | 0.004 | 0.000 | 0.000 | 0.000 | 0.000 | 0.000 | 0.000 | 0.000 | 0.000 |
| X19 | 0.008 | 0.007 | 0.008 | 0.009 | 0.174 | 0.170 | 0.184 | 0.141 | 0.166 | 0.162 | 0.066 | 0.016 | 0.000 | 0.000 | 0.000 | 0.000 | 0.071 | 0.000 | 0.000 | 0.000 |
| X20 | 0.150 | 0.132 | 0.141 | 0.155 | 0.083 | 0.079 | 0.085 | 0.049 | 0.078 | 0.077 | 0.073 | 0.027 | 0.000 | 0.000 | 0.000 | 0.000 | 0.000 | 0.000 | 0.000 | 0.000 |
(2) The fourth drilling phases:
Table A4.
The relationship matrix of risk factors for the fourth drilling phases (expert scoring).
Table A4.
The relationship matrix of risk factors for the fourth drilling phases (expert scoring).
| | Y1 | Y2 | Y3 | Y4 | Y5 | Y6 | Y7 | Y8 | Y9 | Y10 | Y11 | Y12 |
|---|
| Y1 | 0 | 0 | 1 | 0 | 3 | 3 | 2 | 0 | 0 | 0 | 0 | 0 |
| Y2 | 0 | 0 | 4 | 4 | 2 | 2 | 0 | 0 | 0 | 0 | 0 | 0 |
| Y3 | 0 | 0 | 0 | 3 | 3 | 3 | 0 | 0 | 0 | 0 | 0 | 0 |
| Y4 | 0 | 0 | 1 | 0 | 4 | 4 | 0 | 0 | 0 | 0 | 0 | 0 |
| Y5 | 0 | 0 | 2 | 4 | 0 | 3 | 0 | 0 | 0 | 0 | 0 | 0 |
| Y6 | 0 | 0 | 4 | 4 | 4 | 0 | 0 | 0 | 0 | 0 | 0 | 0 |
| Y7 | 1 | 1 | 3 | 3 | 3 | 3 | 0 | 0 | 0 | 0 | 0 | 0 |
| Y8 | 0 | 0 | 4 | 4 | 4 | 4 | 1 | 0 | 0 | 0 | 0 | 0 |
| Y9 | 0 | 0 | 1 | 1 | 1 | 1 | 1 | 1 | 0 | 0 | 0 | 0 |
| Y10 | 1 | 1 | 2 | 2 | 2 | 2 | 2 | 1 | 1 | 0 | 0 | 0 |
| Y11 | 0 | 0 | 1 | 1 | 1 | 1 | 1 | 0 | 0 | 0 | 0 | 0 |
| Y12 | 0 | 0 | 1 | 1 | 1 | 1 | 0 | 0 | 0 | 0 | 0 | 0 |
Table A5.
The risk direct impact matrix for the fourth drilling phase.
Table A5.
The risk direct impact matrix for the fourth drilling phase.
| | Y1 | Y2 | Y3 | Y4 | Y5 | Y6 | Y7 | Y8 | Y9 | Y10 | Y11 | Y12 |
|---|
| Y1 | 0.000 | 0.000 | 0.059 | 0.000 | 0.176 | 0.176 | 0.118 | 0.000 | 0.000 | 0.000 | 0.000 | 0.000 |
| Y2 | 0.000 | 0.000 | 0.235 | 0.235 | 0.118 | 0.118 | 0.000 | 0.000 | 0.000 | 0.000 | 0.000 | 0.000 |
| Y3 | 0.000 | 0.000 | 0.000 | 0.176 | 0.176 | 0.176 | 0.000 | 0.000 | 0.000 | 0.000 | 0.000 | 0.000 |
| Y4 | 0.000 | 0.000 | 0.059 | 0.000 | 0.235 | 0.235 | 0.000 | 0.000 | 0.000 | 0.000 | 0.000 | 0.000 |
| Y5 | 0.000 | 0.000 | 0.118 | 0.235 | 0.000 | 0.176 | 0.000 | 0.000 | 0.000 | 0.000 | 0.000 | 0.000 |
| Y6 | 0.000 | 0.000 | 0.235 | 0.235 | 0.235 | 0.000 | 0.000 | 0.000 | 0.000 | 0.000 | 0.000 | 0.000 |
| Y7 | 0.059 | 0.059 | 0.176 | 0.176 | 0.176 | 0.176 | 0.000 | 0.000 | 0.000 | 0.000 | 0.000 | 0.000 |
| Y8 | 0.000 | 0.000 | 0.235 | 0.235 | 0.235 | 0.235 | 0.059 | 0.000 | 0.000 | 0.000 | 0.000 | 0.000 |
| Y9 | 0.000 | 0.000 | 0.059 | 0.059 | 0.059 | 0.059 | 0.059 | 0.059 | 0.000 | 0.000 | 0.000 | 0.000 |
| Y10 | 0.059 | 0.059 | 0.118 | 0.118 | 0.118 | 0.118 | 0.118 | 0.059 | 0.059 | 0.000 | 0.000 | 0.000 |
| Y11 | 0.000 | 0.000 | 0.059 | 0.059 | 0.059 | 0.059 | 0.059 | 0.000 | 0.000 | 0.000 | 0.000 | 0.000 |
| Y12 | 0.000 | 0.000 | 0.059 | 0.059 | 0.059 | 0.059 | 0.000 | 0.000 | 0.000 | 0.000 | 0.000 | 0.000 |
Table A6.
The comprehensive risk impact matrix T for the fourth drilling phase.
Table A6.
The comprehensive risk impact matrix T for the fourth drilling phase.
| | Y1 | Y2 | Y3 | Y4 | Y5 | Y6 | Y7 | Y8 | Y9 | Y10 | Y11 | Y12 |
|---|
| Y1 | 0.007 | 0.007 | 0.226 | 0.237 | 0.380 | 0.362 | 0.118 | 0.000 | 0.000 | 0.000 | 0.000 | 0.000 |
| Y2 | 0.000 | 0.000 | 0.397 | 0.484 | 0.388 | 0.370 | 0.000 | 0.000 | 0.000 | 0.000 | 0.000 | 0.000 |
| Y3 | 0.000 | 0.000 | 0.150 | 0.376 | 0.376 | 0.358 | 0.000 | 0.000 | 0.000 | 0.000 | 0.000 | 0.000 |
| Y4 | 0.000 | 0.000 | 0.217 | 0.233 | 0.423 | 0.403 | 0.000 | 0.000 | 0.000 | 0.000 | 0.000 | 0.000 |
| Y5 | 0.000 | 0.000 | 0.254 | 0.418 | 0.228 | 0.360 | 0.000 | 0.000 | 0.000 | 0.000 | 0.000 | 0.000 |
| Y6 | 0.000 | 0.000 | 0.381 | 0.477 | 0.477 | 0.264 | 0.000 | 0.000 | 0.000 | 0.000 | 0.000 | 0.000 |
| Y7 | 0.059 | 0.059 | 0.390 | 0.484 | 0.487 | 0.464 | 0.007 | 0.000 | 0.000 | 0.000 | 0.000 | 0.000 |
| Y8 | 0.003 | 0.003 | 0.494 | 0.618 | 0.618 | 0.588 | 0.059 | 0.000 | 0.000 | 0.000 | 0.000 | 0.000 |
| Y9 | 0.004 | 0.004 | 0.170 | 0.212 | 0.212 | 0.202 | 0.063 | 0.059 | 0.000 | 0.000 | 0.000 | 0.000 |
| Y10 | 0.067 | 0.067 | 0.357 | 0.443 | 0.446 | 0.425 | 0.133 | 0.062 | 0.059 | 0.000 | 0.000 | 0.000 |
| Y11 | 0.003 | 0.003 | 0.141 | 0.176 | 0.176 | 0.168 | 0.059 | 0.000 | 0.000 | 0.000 | 0.000 | 0.000 |
| Y12 | 0.000 | 0.000 | 0.118 | 0.147 | 0.147 | 0.140 | 0.000 | 0.000 | 0.000 | 0.000 | 0.000 | 0.000 |
References
- Cherepovitsyn, A.; Tsvetkova, A.; Komendantova, N. Approaches to assessing the strategic sustainability of high-risk offshore oil and gas projects. J. Mar. Sci. Eng. 2020, 8, 995. [Google Scholar] [CrossRef]
- Capobianco, N.; Basile, V.; Loia, F.; Vona, R. Toward a sustainable decommissioning of offshore platforms in the oil and gas industry: A pestle analysis. Sustainability 2021, 13, 6266. [Google Scholar] [CrossRef]
- Sun, X.; Yao, D.; Qu, J.; Sun, S.; Qin, Z.; Tao, L.; Zhao, Y. A novel transient hole cleaning algorithm for horizontal wells based on drift-flux model. Geoenergy Sci. Eng. 2024, 233, 212517. [Google Scholar] [CrossRef]
- Gorchov Negron, A.M.; Kort, E.A.; Chen, Y.; Brandt, A.R.; Smith, M.L.; Plant, G.; Ayasse, A.K.; Schwietzke, S.; Zavala-Araiza, D.; Hausman, C.; et al. Excess methane emissions from shallow water platforms elevate the carbon intensity of US Gulf of Mexico oil and gas production. Proc. Natl. Acad. Sci. USA 2023, 120, e2215275120. [Google Scholar] [CrossRef] [PubMed]
- Almedallah, M.K.; Branch, G.; Walsh, S.D.C. Combined well path, submarine pipeline network, route and flow rate optimization for shallow-water offshore fields. Appl. Ocean Res. 2020, 105, 102396. [Google Scholar] [CrossRef]
- Shen, Y. Risk prediction method of shallow sea oil removal based on fuzzy analysis. Desalin. Water Treat. 2023, 299, 203–211. [Google Scholar] [CrossRef]
- Wang, Y.; Du, P.; Liu, B.; Wu, X. Geographic information system-based comprehensive oil spill risk assessment in China’s Bohai Sea. Front. Mar. Sci. 2023, 10, 1141962. [Google Scholar] [CrossRef]
- Cai, B.; Fan, H.; Shao, X.; Liu, Y.; Liu, G.; Liu, Z.; Ji, R. Remaining useful life re-prediction methodology based on Wiener process: Subsea Christmas tree system as a case study. Comput. Ind. Eng. 2021, 151, 106983. [Google Scholar] [CrossRef]
- Shang, S.; Wang, X.; Han, Q.; Jia, P.; Yun, F.; Wen, J.; Li, C.; Ju, M.; Wang, L. A Deep-Sea Environment Simulated Test System for Subsea Control Modules, Part A: Prototype and Test. J. Mar. Sci. Eng. 2024, 12, 194. [Google Scholar] [CrossRef]
- Chen, X.; Bose, N.; Brito, M.; Khan, F.; Thanyamanta, B.; Zou, T. A Review of Risk Analysis Research for the Operations of Autonomous Underwater Vehicles. Reliab. Eng. Syst. Saf. 2021, 216, 108011. [Google Scholar] [CrossRef]
- Li, X.; Zhu, Y.; Abbassi, R.; Chen, G. A probabilistic framework for risk management and emergency decision-making of marine oil spill accidents. Process Saf. Environ. Prot. 2022, 162, 932–943. [Google Scholar] [CrossRef]
- Yazdi, M.; Mohammadpour, J.; Li, H.; Huang, H.Z.; Zarei, E.; Pirbalouti, R.G.; Adumene, S. Fault tree analysis improvements: A bibliometric analysis and literature review. Qual. Reliab. Eng. Int. 2023, 39, 1639–1659. [Google Scholar] [CrossRef]
- Zhen, X.; Vinnem, J.E.; Yang, X.; Huang, Y. Quantitative risk modelling in the offshore petroleum industry: Integration of human and organizational factors. Ships Offshore Struct. 2020, 15, 1–18. [Google Scholar] [CrossRef]
- Guidi, G.; Sliskovic, M.; Violante, A.C.; Vukic, L. Application of the analytic hierarchy process (AHP) to select the best oil spill cleanup method in marine protected areas for calm sea condition. Glob. Nest J. 2020, 22, 354–360. [Google Scholar] [CrossRef]
- Sales, L.A.; Patricio, A.R.; Morooka, C.K. A selection method of offshore production systems considering uncertainties. J. Mar. Sci. Technol. 2021, 26, 1251–1261. [Google Scholar] [CrossRef]
- Wang, L.; Sun, L.; Sun, H.; Meng, X.; Kang, J. Risk Propagation Evolution Analysis of Oil and Gas Leakage in FPSO Oil and Gas Processing System by Mapping Bow-Tie into Directed Weighted Complex Network. Water 2022, 14, 2857. [Google Scholar] [CrossRef]
- Erivwo, O.; Makis, V.; Kwon, R. Bayesian change point prediction for downhole drilling pressures with hidden Markov models. Appl. Stoch. Model. Bus. Ind. 2024, 40, 772–790. [Google Scholar] [CrossRef]
- Du, L.; Liao, G.; Zhang, T.; Deng, Q.; Li, A.; Mao, N. Risk assessment of fire and explosion accidents in oil-hydrogen fueling station based on fault tree analysis. J. Phys. Conf. Ser. 2023, 2723, 012005. [Google Scholar] [CrossRef]
- Zhang, J.; Zhang, S.; Liang, Z.; Lang, X.; Shi, M.; Qiao, J.; Wei, J.; Dai, H.; Kang, J. A risk assessment method based on DEMATEL-STPA and its application in safety risk evaluation of hydrogen refueling stations. Int. J. Hydrogen Energy 2024, 50, 889–902. [Google Scholar] [CrossRef]
- An, X.; Yin, Z.; Tong, Q.; Fang, Y.; Yang, M.; Yang, Q.; Meng, H. An integrated resilience assessment methodology for emergency response systems based on multi-stage STAMP and dynamic Bayesian networks. Reliab. Eng. Syst. Saf. 2023, 238, 109445. [Google Scholar] [CrossRef]
- Liu, X.; Wang, C.; Yin, Z.; An, X.; Meng, H. Risk-informed multi-objective decision-making of emergency schemes optimization. Reliab. Eng. Syst. Saf. 2024, 245, 109979. [Google Scholar] [CrossRef]
Figure 1.
Shallow-water subsea wellhead platform and the tree system.
Figure 1.
Shallow-water subsea wellhead platform and the tree system.
Figure 2.
Schematic diagram of the first three drilling operations in the wellbore (Pa represents the drill pipe pressure, and Pd represents the casing pressure).
Figure 2.
Schematic diagram of the first three drilling operations in the wellbore (Pa represents the drill pipe pressure, and Pd represents the casing pressure).
Figure 3.
Schematic diagram of the fourth drilling of the wellbore.
Figure 3.
Schematic diagram of the fourth drilling of the wellbore.
Figure 4.
Control body models for the first three drilling operations.
Figure 4.
Control body models for the first three drilling operations.
Figure 5.
Well control risk for employees during the first three drilling operations.
Figure 5.
Well control risk for employees during the first three drilling operations.
Figure 6.
Well control risk for equipment during the first three drilling operations.
Figure 6.
Well control risk for equipment during the first three drilling operations.
Figure 7.
Well control risk for items during the first three drilling operations.
Figure 7.
Well control risk for items during the first three drilling operations.
Figure 8.
Well control risk for environment during the first three drilling operations.
Figure 8.
Well control risk for environment during the first three drilling operations.
Figure 9.
Control body models for the fourth drilling operations.
Figure 9.
Control body models for the fourth drilling operations.
Figure 10.
Well control risk for employees during the fourth drilling operations.
Figure 10.
Well control risk for employees during the fourth drilling operations.
Figure 11.
Well control risk for equipment during the fourth drilling operations.
Figure 11.
Well control risk for equipment during the fourth drilling operations.
Figure 12.
Well control risk for items during the fourth drilling operations.
Figure 12.
Well control risk for items during the fourth drilling operations.
Figure 13.
Well control risk for environment during the fourth drilling operations.
Figure 13.
Well control risk for environment during the fourth drilling operations.
Figure 14.
Extracting high-risk weights from the first three drilling stages.
Figure 14.
Extracting high-risk weights from the first three drilling stages.
Figure 15.
Extracting high-risk weights from the fourth drilling stages.
Figure 15.
Extracting high-risk weights from the fourth drilling stages.
Table 1.
Risk Factors in the intermediate layer during the first three drilling operations.
Table 1.
Risk Factors in the intermediate layer during the first three drilling operations.
| Number | Specific Risk |
|---|
| X1 | Employees severely violated standard operating procedures while operating drilling equipment |
| X2 | Employees failed to promptly detect well control incidents during drilling operations |
| X3 | Employees did not immediately identify drilling equipment malfunctions |
| X4 | Upon accident occurrence, on-site employees did not immediately shut down operating equipment and initiate emergency repairs |
| X5 | Failure of drilling fluid circulation system equipment |
| X6 | Wear and cracking of assembled drilling tools |
| X7 | Wear and cracking of safety protection sealing devices |
| X8 | Poor cementing quality (casing) |
| X9 | Wear and cracking of pressure-bearing risers |
| X10 | Loosening and detachment of equipment connections |
| X11 | Poor quality of drilling mud system |
| X12 | Poor quality of cement slurry system for cementing |
| X13 | Lack of life-saving and rescue supplies |
| X14 | Natural factors such as formation conditions and gas composition causing the formation of natural gas hydrates |
| X15 | Natural factors like formation conditions and gas composition leading to dissolved gas degassing |
| X16 | Natural phenomena such as tides and currents affecting the stability of the drilling platform |
| X17 | Groundwater intrusion in shallow-water zones causing “salt layer” issues in the wellbore |
| X18 | Small gas caps and weak edge/bottom water causing wellbore instability |
| X19 | Harsh environmental conditions damaging equipment such as derricks and wellbores |
| X20 | Harsh environmental conditions impacting employees’ normal work operations |
Table 2.
Calculation of relevant parameters for risk factors in the first three drilling operations.
Table 2.
Calculation of relevant parameters for risk factors in the first three drilling operations.
| Number | D | C | D + C | D − C | Weight |
|---|
| X1 | 1.319 | 0.733 | 2.052 | 0.586 | 0.059 |
| X2 | 1.658 | 0.516 | 2.174 | 1.141 | 0.063 |
| X3 | 1.890 | 0.621 | 2.511 | 1.269 | 0.073 |
| X4 | 1.675 | 0.787 | 2.462 | 0.888 | 0.071 |
| X5 | 0.989 | 2.283 | 3.272 | −1.295 | 0.095 |
| X6 | 0.771 | 2.060 | 2.830 | −1.289 | 0.082 |
| X7 | 0.780 | 2.279 | 3.060 | −1.499 | 0.088 |
| X8 | 0.629 | 1.458 | 2.086 | −0.829 | 0.060 |
| X9 | 0.541 | 1.874 | 2.415 | −1.334 | 0.070 |
| X10 | 0.311 | 1.849 | 2.160 | −1.538 | 0.062 |
| X11 | 0.445 | 1.929 | 2.374 | −1.485 | 0.069 |
| X12 | 0.470 | 0.575 | 1.045 | −0.105 | 0.030 |
| X13 | 0.838 | 0.036 | 0.874 | 0.803 | 0.025 |
| X14 | 0.358 | 0.071 | 0.429 | 0.286 | 0.012 |
| X15 | 0.323 | 0.000 | 0.323 | 0.323 | 0.009 |
| X16 | 1.193 | 0.000 | 1.193 | 1.193 | 0.035 |
| X17 | 0.534 | 0.077 | 0.611 | 0.458 | 0.018 |
| X18 | 0.256 | 0.000 | 0.256 | 0.256 | 0.007 |
| X19 | 1.183 | 0.071 | 1.255 | 1.112 | 0.036 |
| X20 | 1.129 | 0.071 | 1.201 | 1.058 | 0.035 |
Table 3.
Risk Factors in the intermediate layer during the fourth drilling operations.
Table 3.
Risk Factors in the intermediate layer during the fourth drilling operations.
| Number | Specific Risk |
|---|
| Y1 | Ground personnel incorrectly operated the equipment. |
| Y2 | Subsea personnel incorrectly operated the subsea equipment. |
| Y3 | Collision occurred between the drill pipe equipment and the shallow-water subsea tree equipment. |
| Y4 | Loosening at the connection between the equipment and the production tree led to leaks. |
| Y5 | Damage to protective device for shallow-water subsea trees |
| Y6 | Damage to shallow-water subsea trees body |
| Y7 | Heavy objects falling from water damage shallow-water subsea trees |
| Y8 | Foreign ships damaging shallow-water subsea trees |
| Y9 | Lack of maintenance materials. |
| Y10 | Severe marine climate conditions damage shallow-water subsea trees |
| Y11 | Severe geological conditions damage shallow-water subsea trees |
| Y12 | Adverse marine biological conditions damage shallow-water subsea trees |
Table 4.
Calculation of relevant parameters for risk factors in the fourth drilling operations.
Table 4.
Calculation of relevant parameters for risk factors in the fourth drilling operations.
| Number | D | C | D + C | D − C | Weight |
|---|
| Y1 | 1.337 | 0.143 | 1.481 | 1.194 | 0.044 |
| Y2 | 1.639 | 0.143 | 1.782 | 1.495 | 0.053 |
| Y3 | 1.259 | 3.295 | 4.554 | −2.036 | 0.134 |
| Y4 | 1.276 | 4.304 | 5.580 | −3.028 | 0.164 |
| Y5 | 1.260 | 4.358 | 5.618 | −3.098 | 0.166 |
| Y6 | 1.599 | 4.103 | 5.702 | −2.504 | 0.168 |
| Y7 | 1.951 | 0.439 | 2.390 | 1.511 | 0.070 |
| Y8 | 2.384 | 0.121 | 2.505 | 2.263 | 0.074 |
| Y9 | 0.925 | 0.059 | 0.984 | 0.866 | 0.029 |
| Y10 | 2.057 | 0.000 | 2.057 | 2.057 | 0.061 |
| Y11 | 0.726 | 0.000 | 0.726 | 0.726 | 0.021 |
| Y12 | 0.553 | 0.000 | 0.553 | 0.553 | 0.016 |
| Disclaimer/Publisher’s Note: The statements, opinions and data contained in all publications are solely those of the individual author(s) and contributor(s) and not of MDPI and/or the editor(s). MDPI and/or the editor(s) disclaim responsibility for any injury to people or property resulting from any ideas, methods, instructions or products referred to in the content. |
© 2024 by the authors. Licensee MDPI, Basel, Switzerland. This article is an open access article distributed under the terms and conditions of the Creative Commons Attribution (CC BY) license (https://creativecommons.org/licenses/by/4.0/).


