Article

Improved Fracture Permeability Evaluation Model for Granite Reservoirs in Marine Environments: A Case Study from the South China Sea

1
Key Laboratory of Exploration Technologies for Oil and Gas Resources, Ministry of Education, Yangtze University, Wuhan 430100, China
2
College of Geophysics and Petroleum Resources, Yangtze University, Wuhan 430100, China
3
CNOOC International Limited, Beijing 100028, China
*
Author to whom correspondence should be addressed.
J. Mar. Sci. Eng. 2024, 12(10), 1868; https://doi.org/10.3390/jmse12101868
Submission received: 26 September 2024 / Revised: 15 October 2024 / Accepted: 16 October 2024 / Published: 18 October 2024

Abstract

:
Permeability is a crucial parameter in the exploration and development of oil and gas reservoirs, particularly in unconventional ones, where fractures significantly influence storage capacity and fluid flow. This study investigates the fracture permeability of granite reservoirs in the South China Sea, introducing an enhanced evaluation model for planar fracture permeability based on Darcy’s law and Poiseuille’s law. The model incorporates factors such as fracture heterogeneity, tortuosity, angle, and aperture to improve permeability assessments. Building on a single-fracture model, this research integrates mass transfer equations and trigonometric functions to assess intersecting fractures’ permeability. Numerical simulations explore how tortuosity, angle, and aperture affect individual fracture permeability and the influence of relative positioning in intersecting fractures. The model makes key assumptions, including minimal consideration of horizontal stress and the assumption of unidirectional laminar flow in cross-fractures. Granite outcrop samples were systematically collected, followed by full-diameter core drilling. A range of planar models with varying fracture apertures were designed, and permeability measurements were conducted using the AU-TOSCAN-II multifunctional core scanner with a steady-state gas injection method. The results showed consistency between the improved model and experimental findings regarding the effects of fracture aperture and angle on permeability, confirming the model’s accuracy in reflecting the fractures’ influence on reservoir flow capacity. For intersecting fractures, a comparative analysis of core X-ray computed tomography (X-CT) scanning results and experimental outcomes highlighted discrepancies between actual permeability measurements and theoretical simulations based on tortuosity and aperture variations. Limitations exist, particularly for cross-fractures, where quantifying complexity is challenging, leading to potential discrepancies between simulation and experimental results. Further comparisons between core experiments and logging responses are necessary for model refinement. In response to the challenges associated with evaluating absolute permeability in fractured reservoirs, this study presents a novel theoretical assessment model that considers both single and intersecting fractures. The model’s validity is demonstrated through actual core experiments, confirming the effectiveness of the single-fracture model while highlighting the need for further refinement of the dual-fracture model. The findings provide scientific support for the exploration and development of granite reservoirs in the South China Sea and establish a foundation for permeability predictions in other complex fractured reservoir systems, thereby advancing the field of fracture permeability assessment.

1. Introduction

Permeability is a fundamental parameter in the exploration and development of oil and gas reservoirs, making its precise evaluation essential for assessing resource recoverability and formulating effective development strategies [1,2]. As exploration and production efforts evolve, there has been a notable shift toward unconventional reservoirs, such as shale oil, tight oil, coalbed methane, and carbonate formations [3]. Among these, the development of fractures is recognized as a critical factor for successful resource extraction [4]. Fractures play a significant role in enhancing both storage capacity and fluid flow within these unconventional reservoirs, underscoring the importance of accurately assessing fracture permeability for their effective exploration and development [5,6].
Currently, two primary methods are recognized for evaluating permeability. The first method, laboratory measurement, is the most direct and accurate approach for determining core permeability using experimental instruments on samples sent to the laboratory [7]. However, in fractured reservoirs, the permeability obtained from these measurements primarily reflects matrix permeability, as acquiring plunger samples from fractured sections is often challenging [8,9]. Subsequent assessments of permeability conducted on full-size samples from these fractured sections yield a combined measure of both matrix and fracture permeability [10]. Despite the benefits of laboratory methods, challenges associated with coring in fracture-prone zones—such as high costs, segment discontinuity, and limited borehole coverage—impede their widespread application [11]. The second approach involves utilizing geophysical exploration data, particularly focusing on the calculation of permeability through logging data analysis [12,13]. The porosity–permeability equation established by Kozeny [14] elucidates the relationship between pore-throat radius, tortuosity, and permeability, employing Archie’s formula to characterize the numerical correlations among these factors. This relationship has been further examined across various lithologies. However, the permeability evaluation model derived from the pore-permeability relationship exhibits limitations in its applicability, especially when addressing unconventional reservoirs characterized by significant heterogeneity [15]. Such limitations constrain the accuracy of permeability evaluations in these complex geological settings [16]. Recent studies on rock permeability have revealed a consistent negative correlation between permeability and depth; specifically, as depth increases, permeability tends to decrease [17]. This trend is influenced by factors such as the stress state of the reservoir, seismic activity, and the long-term geological history [18]. This negative relationship is evident across various rock types [19]. Currently, the evaluation of permeability in complex unconventional pore-type reservoirs primarily relies on the petrophysical characteristics of the target reservoir, combined with core permeability experimental data, to develop various tailored permeability evaluation models [20,21]. This approach has been widely adopted and has yielded favorable results. With advancements in geophysical logging technology, the use of nuclear magnetic resonance (NMR) logging for permeability evaluation has produced significant outcomes, exemplified by classic models, such as the SDR model [22,23], the Timur-Coates model [24,25], the Prince-Rezaee model [26,27], and the Hossain model [28]. Building on these foundational frameworks, several researchers have successfully developed improved permeability evaluation models, achieving notable breakthroughs [29]. Additionally, the application of array acoustic wave logging data for calculating permeability through Stonley wave attenuation has emerged as a widely utilized evaluation tool [30]. Among the aforementioned methods, NMR logging data effectively reflect the pore structure of formations, leading to permeability evaluation models that utilize NMR parameters (e.g., T2 geometric mean, T2 cutoff permeability evaluation model) often demonstrating superior accuracy compared to those based on the porosity–permeability relationship [31]. However, these models face challenges in accurately assessing fracture permeability, as the changes in reservoir seepage capacity induced by fractures are difficult to capture in the T2 distribution spectrum. With the rise of big data technology, permeability prediction methods leveraging artificial intelligence have gained traction. These methods utilize machine-learning and deep-learning algorithms to explore the non-linear relationships between logging curve responses and core permeability, subsequently constructing permeability evaluation models [32]. While these approaches have been successfully implemented across various blocks and demonstrate greater accuracy than traditional techniques, they are primarily applicable to pore-permeability reservoirs with favorable pore-permeability relationships [33]. Consequently, despite their higher accuracy in many scenarios, data-driven methods are not well suited for complex fractured reservoirs, as the difficulty in obtaining core samples that meet experimental criteria, combined with the limited availability of full-size cores, hampers the development of effective permeability prediction models.
Consequently, establishing a model analogous to Archie’s formula for calculating fracture permeability holds significant engineering importance, particularly in the exploration and development of fractured reservoirs [34]. For instance, the Qiongdongnan Basin, located in the northern South China Sea, is abundant in subducted reservoirs characterized by diverse basement lithologies, including granite, volcanic rocks, metamorphic rocks, and greywacke, all of which are accompanied by numerous fractures [35,36]. Despite advancements in electric imaging logging technology enabling the identification of fractures as narrow as tens of microns, the existing research on fracture permeability prediction predominantly emphasizes the functional relationship between fracture aperture and permeability, often with a limited scope [37]. Given that the shape of fractures is frequently irregular, and the accuracy of aperture calculations is constrained, the calculated fracture permeability usually fails to align with experimental data and field test results [38]. Therefore, it is imperative to investigate the calculation model of fracture permeability through a more comprehensive response mechanism.
This study employs a plate fracture model as its foundational framework, utilizing Darcy’s law and Poisson’s law. Unlike traditional modeling approaches, this research incorporates the heterogeneity of fractures in the permeability calculation model, introducing the concept of tortuosity while accounting for the angle and aperture of the fractures. By integrating these factors, we establish a model for fluid flow through a single fracture. For the scenario involving two fractures, we introduce a mass transfer equation to examine the effects of inclination angle, aperture, and fracture intersection on permeability. To explore the influence of various factors on permeability, numerical simulations were conducted based on the derived formulae. In the experimental phase, after collecting granite outcrop samples, core drilling was performed to assemble the planar model, and models with varying fracture apertures were designed to measure fracture permeability. An artificial fracturing method was employed to create multiple-fracture cores, and X-ray computed tomography (X-CT) technology was utilized to extract fracture characteristics while measuring permeability. The results of the numerical simulations were compared and analyzed against experimental data, demonstrating the effectiveness of the single-fracture permeability model. Additionally, the discrepancies between theoretical model results and actual measurements in evaluating the permeability of intersecting fractures were discussed. The findings of this study hold promise for advancing the development of a permeability logging assessment system.
Figure 1 illustrates the research workflow. Chapter Two presents the derivation of formulae and results from numerical simulations. Chapter Three details the core acquisition process, the methods for measuring the permeability of single fractures at different apertures, the artificial fracturing techniques, and the application of X-CT technology. Chapter Four showcases the experimental results from Chapter Three, providing a comprehensive comparison between numerical simulation outcomes and core experimental results. Finally, Chapter Five discusses the observed discrepancies, highlighting the innovations and limitations of this study.

2. Formula Derivation and Simulation

2.1. Conventional Flat Plate Model for Single Fracture

As a conduit for fluid flow, the flow conductivity of a single fracture can be modeled as a finite plane extending from within the rock mass to the well wall [39,40]. In the context of an ideal rock body containing a fracture, Figure 2 illustrates a rectangular rock structure with a width w and a length l . This structure includes a fracture height of h , a fracture width of w f , and experiences a pressure differential Δ P across its sides, defined as Δ P = P 1 P 2 .
The classical hydrodynamic equation governing flow [41] through a regularly shaped unit width fracture is expressed as follows:
Q = h 3 w f Δ P 12 μ L
In Equation (1), Q denotes the flow rate, m3/s; μ represents the fluid’s viscosity, Pa·s.
The flow of fluid within the fracture adheres to Darcy’s law [42], articulated as
Q = A k ( P 1 P 2 ) μ L
In Equation (2), A signifies the cross-sectional area of flow, m2; meanwhile, k indicates the permeability of the medium, m2. By integrating Equations (1) and (2), we derive the expression for permeability:
k = h 3 w f 12 w L
The volume of the unit length fracture model can be described as
V f = L · w f · h
Based on this, the porosity of the fracture can be formulated as
φ = V f L · w · h = w f w
Combining Equations (3) and (5) yields the relationship between fracture permeability and porosity:
k = h 3 φ 12 L
In the plate model, the influence of horizontal stress needs to be explained. Horizontal stress affects the formation, development, and closure of fractures, which in turn alters their characteristics; for instance, increasing horizontal stress can compress the width of fractures, leading to a reduction in permeability. However, in the classic models used for calculating planar permeability, this aspect is not directly considered due to the segmentation of the model.
This study aims to measure absolute air permeability in core samples, assuming unidirectional flow within the fractures. The flat plate model classifies the fluid as air and describes the flow as laminar in accordance with Darcy’s law. This characterization indicates a uniform fluid velocity across the fracture cross-section, ensuring stability without transitioning to turbulence. Furthermore, the physical properties of air, including density and viscosity, are treated as constant within the specified ranges of pressure and temperature. The fractures are assumed to be parallel, homogeneous, and straight, with consistent apertures and heights maintained throughout their length.

2.2. Improved Flat Plate Model for Single Fracture

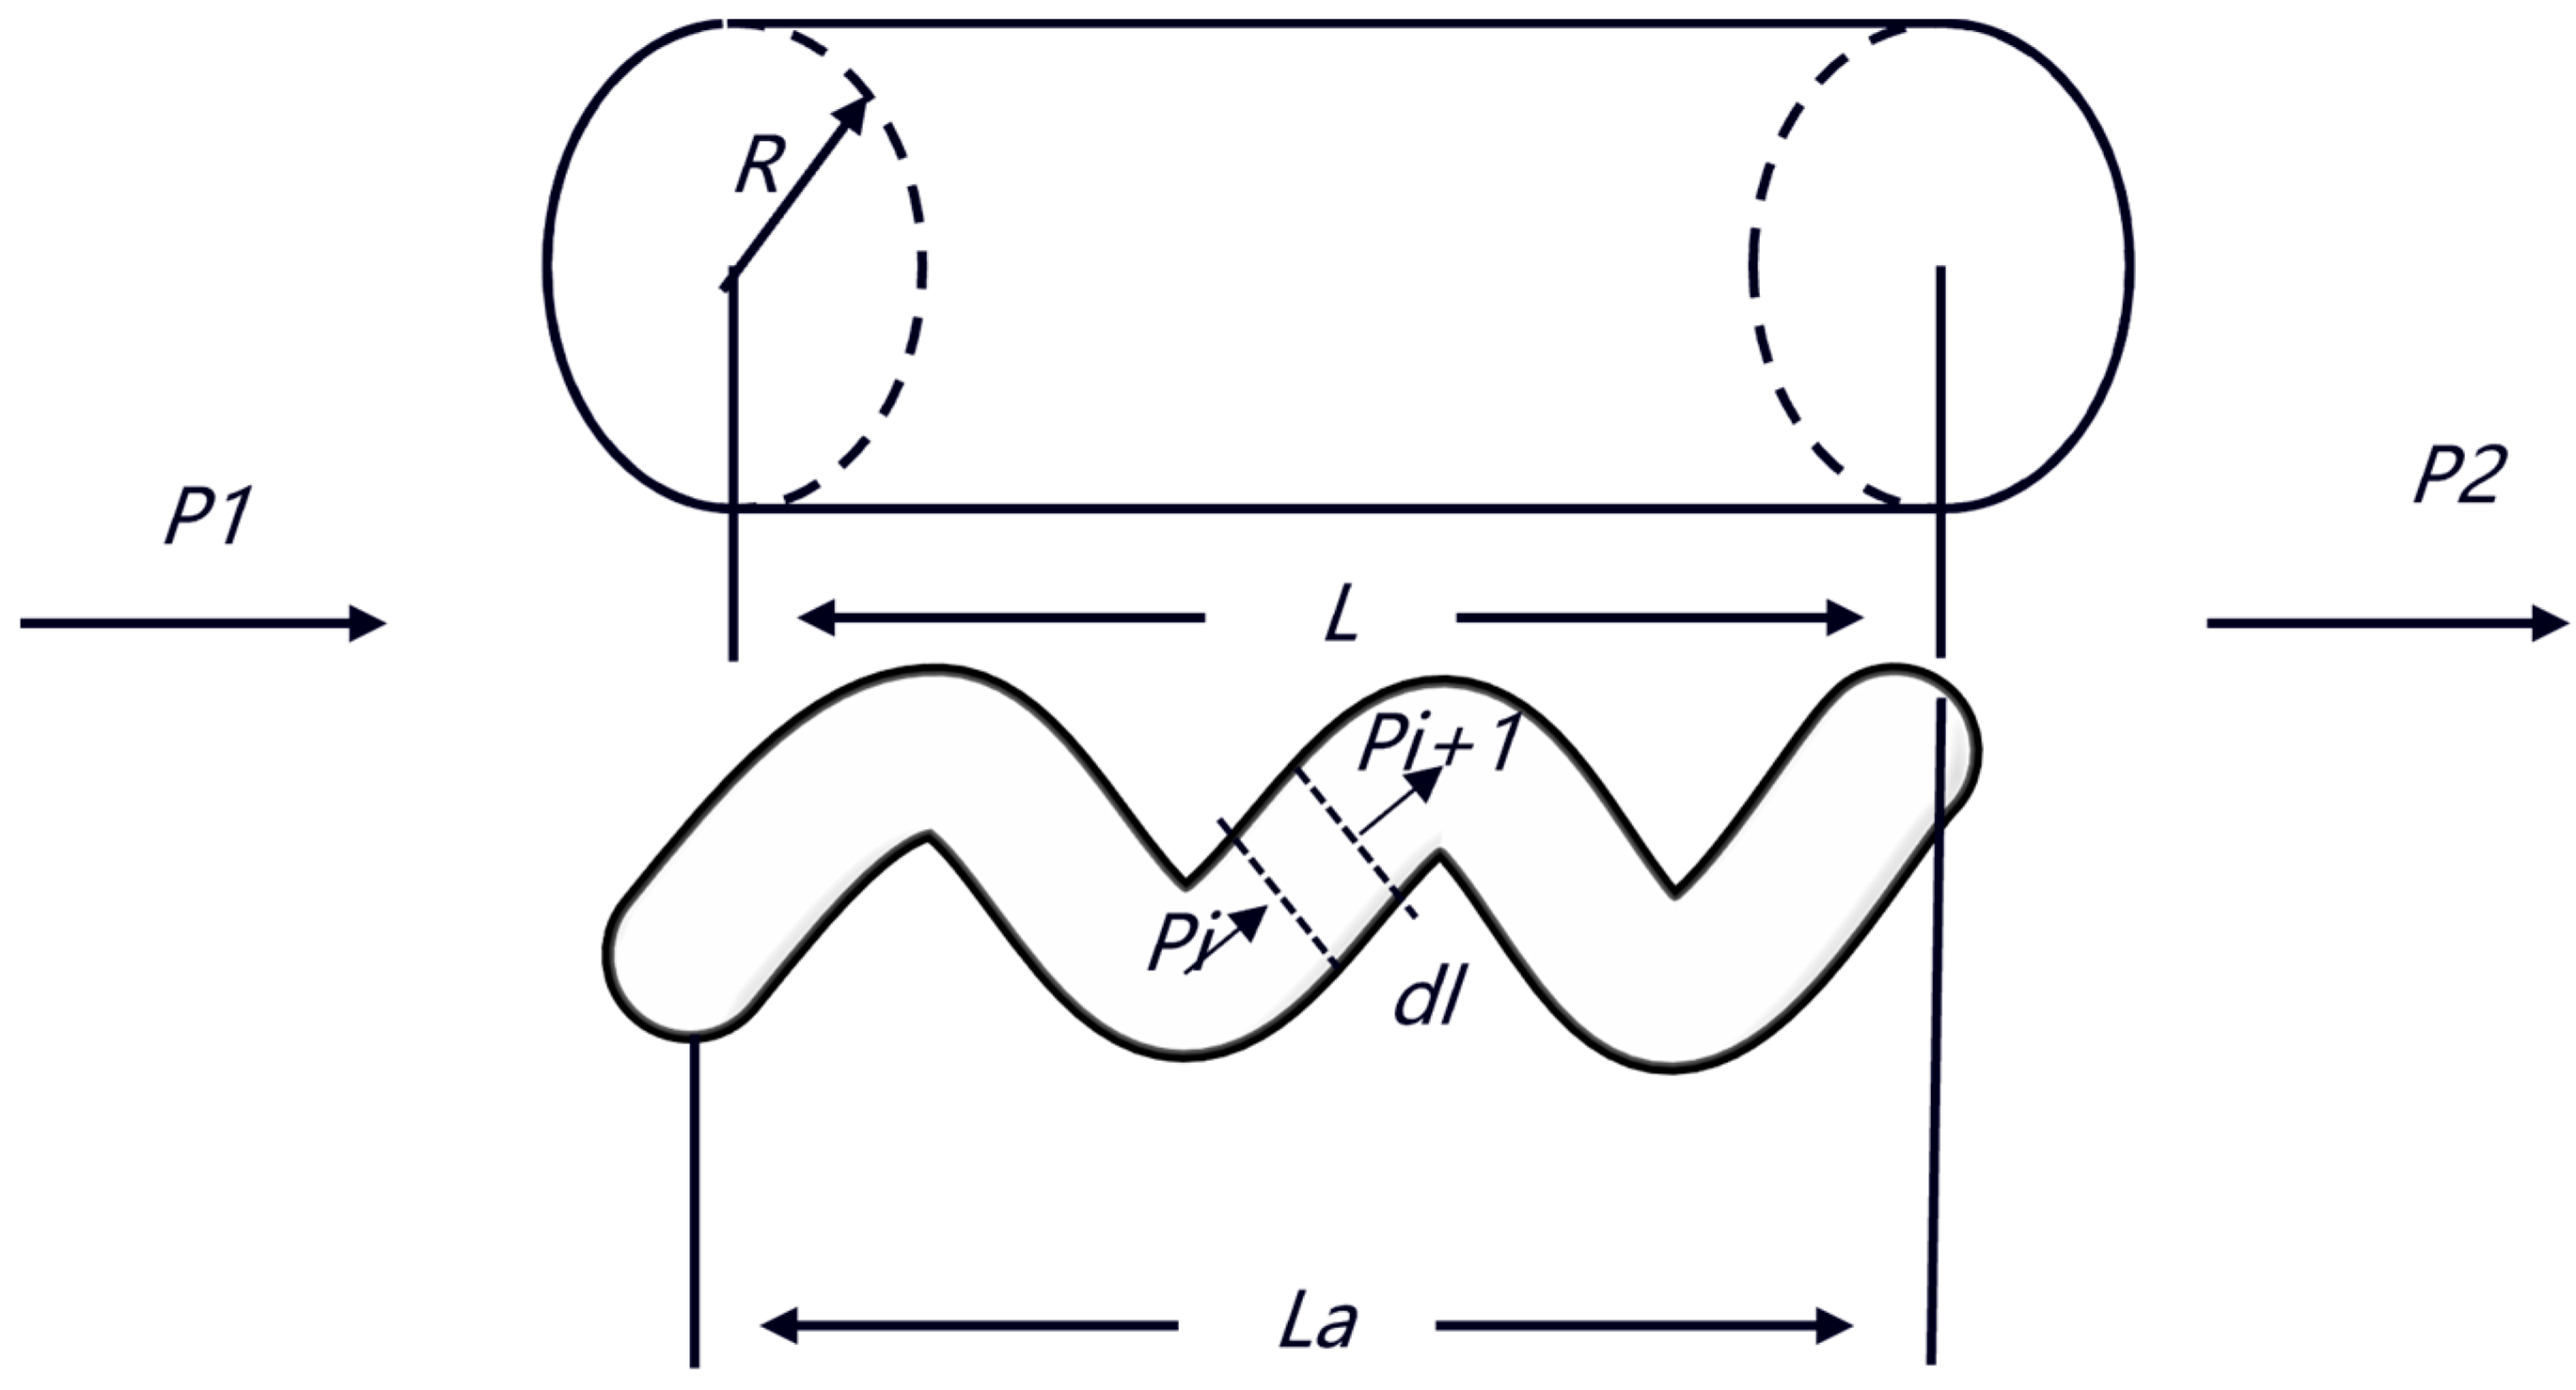
In contrast to the classical model depicted in Figure 2, which fails to account for the non-smooth nature of fractures, the improved model is formulated based on Poiseuille’s law [43]. Initially, for the roar channel, the actual configuration is expected to be curved, as illustrated in Figure 3, where L represents the straight-line length of the pipe at both ends, L a denotes the actual length of the curved roar channel, and R signifies the radius of the pipe, λ = 2 R , reflecting the degree of aperture.
Figure 3 illustrates the flow within a curved channel. Poiseuille’s law [43] delineates the laminar flow of fluid in a pipe, and for the configuration shown in Figure 3, the flow rate is given by
Q v = π ( P 1 P 2 ) R 4 8 μ L
The fracture can be subdivided into L a L infinitesimally small straight sections, corresponding to
d Q v = π ( d Δ P ) R 4 8 μ d l
Integrating Equation (8) results in
Q v = π R 4 0 ( P 1 P 2 ) ( d Δ P ) 8 μ 0 L a d l = π ( P 1 P 2 ) R 4 8 μ L a
Combining Equation (9) with Equation (2) leads to
k = π λ 4 L 128 A L a
By incorporating the tortuosity τ = L a L 2 , the permeability equation can be reformulated as [44]
k = π λ 4 L 128 A L a 1 τ = π λ 4 L 128 L a 3
Equation (11) represents the permeability of the curved interconnected pores, relevant for porous reservoirs, as shown in Figure 4a. For fracture reservoirs, the fractures within the rock can be conceptualized as a plane composed of n interconnected pores, illustrated in Figure 4b.
Figure 4 depicts the flow in a curved channel within a cylindrical rock mass. For the permeability of fractured reservoirs, based on Equation (11) and considering n = L λ , the permeability of horizontal fractures can be expressed as
k = n π λ 4 L 128 L a 3 = π λ 3 L 2 128 L a 3
To account for the influence of fracture angle on radial permeability, when the inclination angle of the fracture in the model is α (where α < 90°),
L a = τ L cos α
Combining Equation (13) with Equation (12) allows us to express permeability as
k = π λ 3 cos α 128 τ L a
Equation (14) is the derived expression for the permeability of the plate fracture model, which integrates the effects of fracture aperture, tortuosity, and angle.

2.3. Derivation of Dual-Fracture Permeability Model

In real reservoirs, the fractures exhibit intricate geometries, particularly when multiple fractures intersect. This section focuses on deriving the permeability formula for two intersecting fractures.
Initially, for two fractures, the flow state of the fluid within the pipeline can be characterized by the Reynolds number [45]:
Re = ν λ μ
In Equation (15), ν represents the average fluid velocity.
The Reynolds number indicates the flow regime, with the critical Reynolds number marking the transition from laminar to turbulent flow. The subsequent deductions assume that the fluid flow in the pipeline is laminar.
Figure 5 illustrates the laminar flow of fluid in a pipe with constant diameter. The flow state of the fluid is defined by the Reynolds number. The flow remains laminar when the Reynolds number is below a critical value, typically around 2000; exceeding this value may lead to turbulence. In this study, the flow is maintained in a laminar state. As shown, the fluid divides into several layers along the pipe’s diameter, each exhibiting varying velocities. A small cylindrical segment aligned with the pipe axis serves as the subject of analysis, where the fluid is in a state of force equilibrium:
( p 1 p 2 ) π r 2 = Δ p π r 2 = F f
In Equation (16), F f denotes the internal frictional force of the fluid.
According to Newton’s law of viscosity, we have
F f = S × μ × d u d r
In Equation (17), S represents the contact area of the friction layer, and d u d r defines the velocity gradient, indicating the rate of change in velocity perpendicular to the flow direction.
Thus, Equations (16) and (17) can be combined to yield
Δ p π r 2 = F f = 2 π r l μ d u d r
Equation (18) can be reformulated as
d u = Δ p 2 μ l r d r
Integrating Equation (19) and applying boundary conditions leads to
u = Δ p 4 μ l ( R 2 r 2 )
It is evident that the velocity distribution in the radial direction follows a parabolic pattern, with maximum velocity at the center of the pipe and decreasing toward the wall, where the velocity is zero.
The flow rate of a differential element can be expressed as
d q = u d A = 2 π u r d r = 2 π Δ p 4 μ l ( R 2 r 2 ) r d r
Integrating Equation (21) leads to a modified form of Poiseuille’s equation:
q = π λ 4 128 μ l Δ p
The average velocity is given by
v = q A = λ 2 32 μ l Δ p
The pressure loss along the pipe is expressed as
Δ p = 32 μ l ν λ 2 = 32 μ 2 Re λ 3
Therefore, under ideal conditions, where other variables remain constant, the fluid flow in the fracture exhibits a linear gradient pressure drop with respect to the flow distance:
P = P 1 ( 32 μ 2 Re λ 3 ) l
When calculating the permeability of intersecting fractures, the embedded discrete fracture permeability model introduces a mass transfer coefficient T to compute the flow within the grid model of the intersecting fractures:
q f f = T f f ( p f i p f j )
In Equation (26), T f f is the mass transfer coefficient, while p f i and p f j denote the pressures in fractures i and j , respectively.
The mass transfer coefficient [46] is defined as
T f f = T f i T f j T f i + T f j
In Equation (27), T f i = k f i λ f i μ d ^ i , T f j = k f j λ f j μ d ^ j ; k f i and k j i are the permeabilities of fractures i and j , derived from Equation (14) in Section 2.2. λ represents the fracture aperture, and d ^ is the distance from a single fracture to the intersection point.
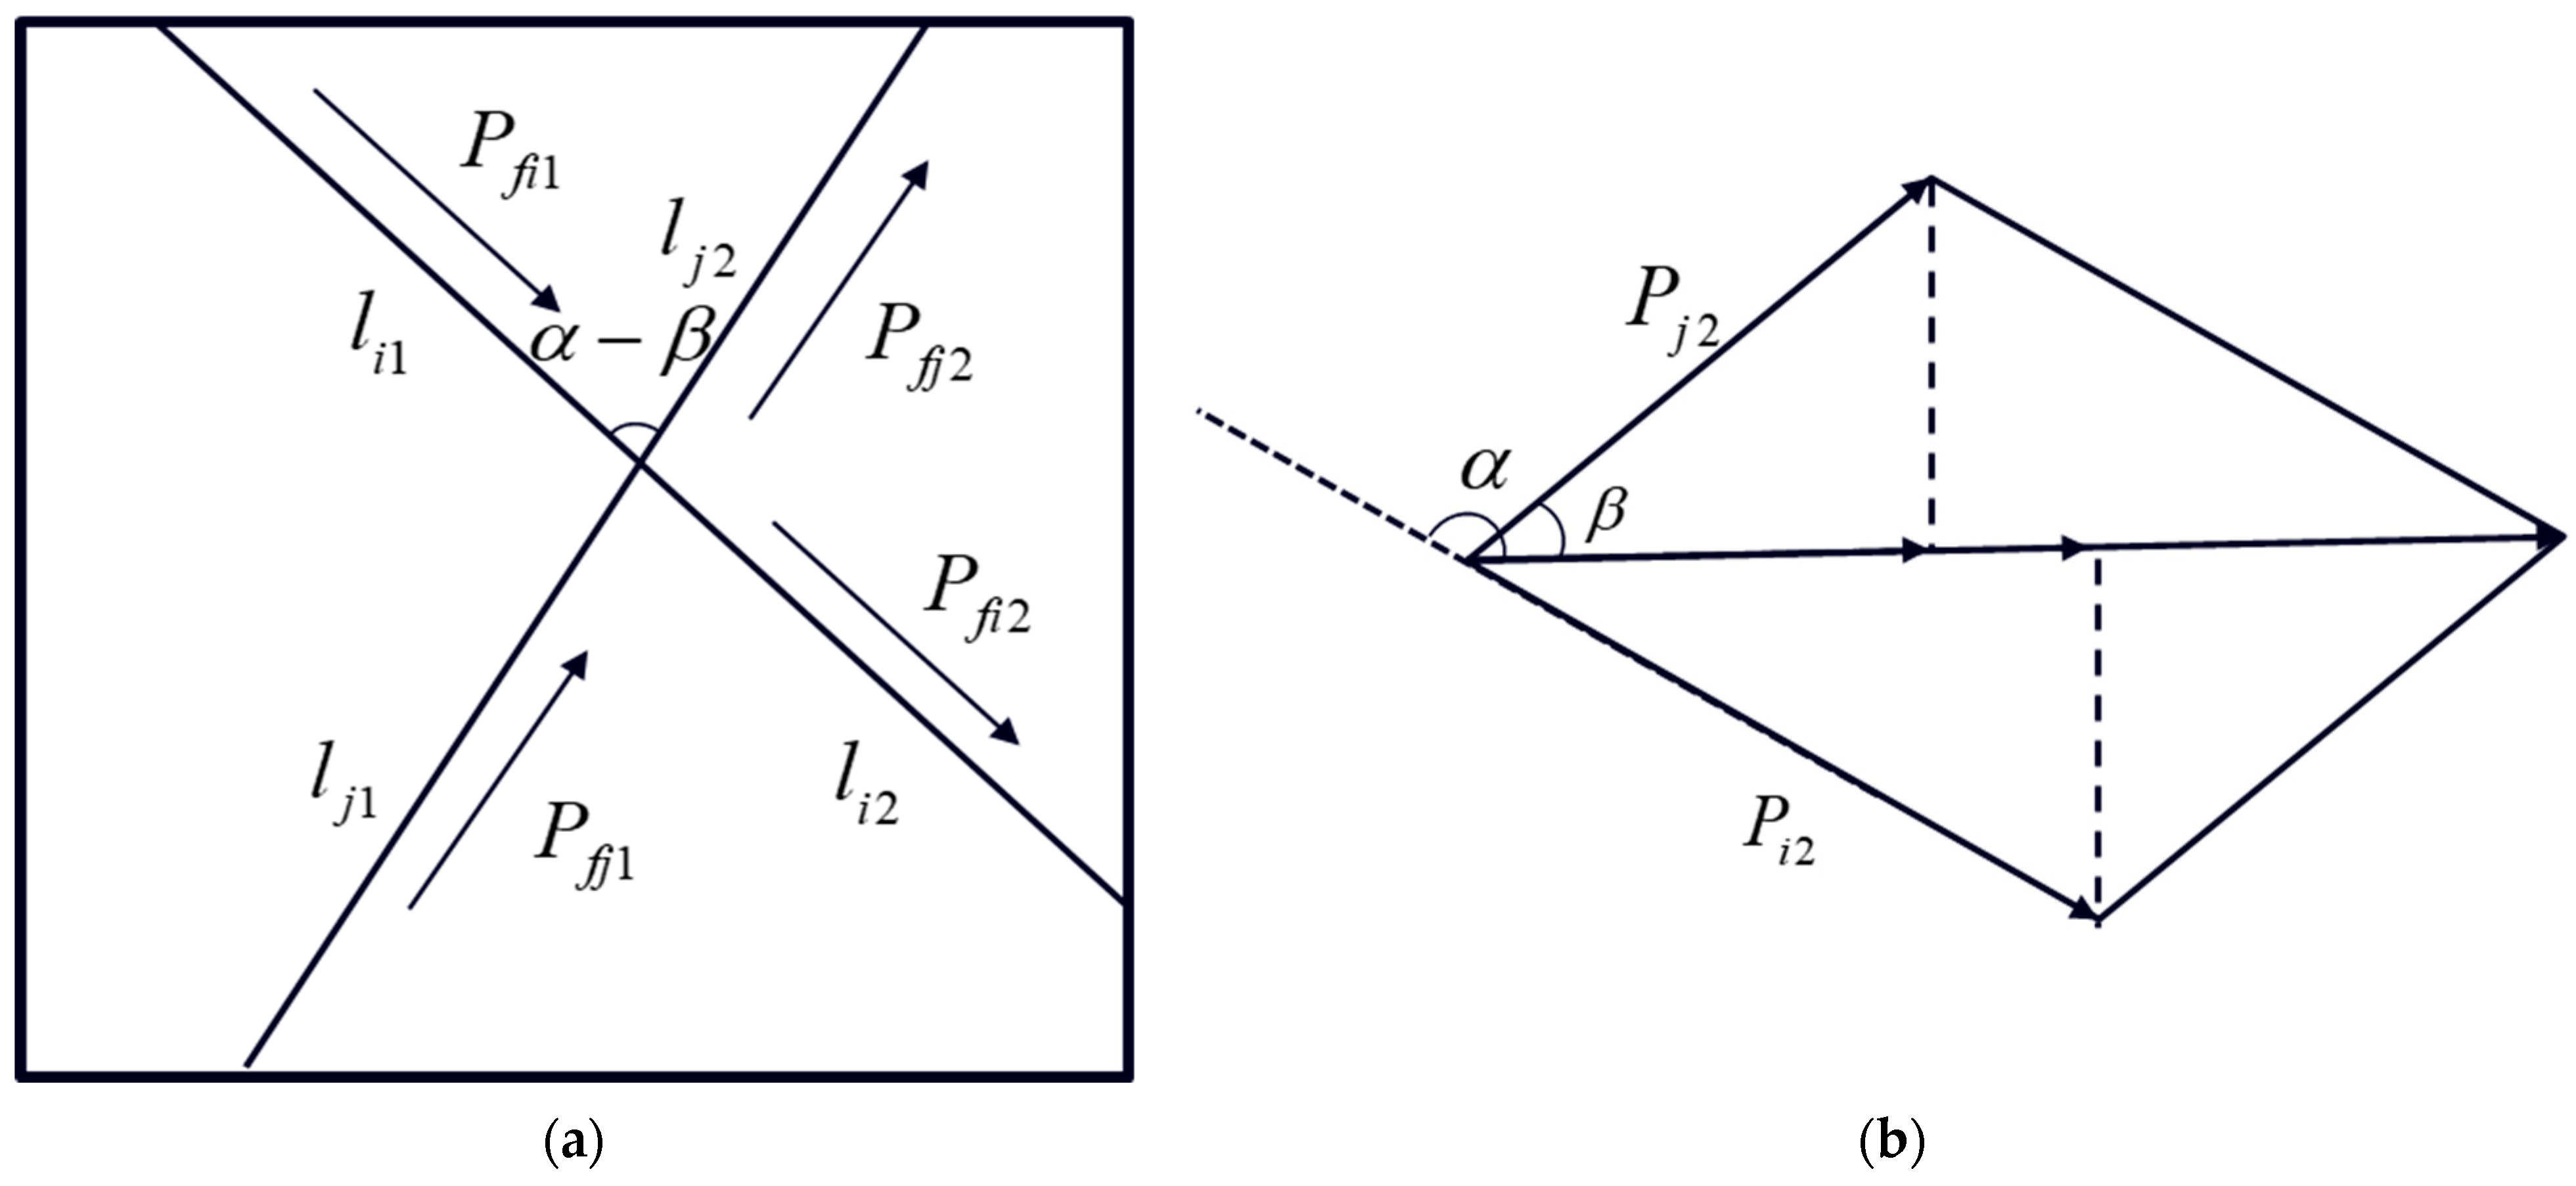
Figure 6a illustrates the scenario where fractures i and j intersect at angles α and β , respectively. The intersection point divides fracture i into segments l i 1 and l i 2 , and fracture j into segments l j 1 and l j 2 ; then, d ^ i = 0 l i 1 l d l + 0 l i 2 l d l l i 1 + l i 2 , d ^ j = 0 l j 1 l d l + 0 l j 2 l d l l j 1 + l j 2 . Figure 6b shows the vector diagram of cross-fractures’ pressure conduction.
Combining Equations (26) and (27), the flow rate through the intersecting fractures can be expressed as
q f f = 2 k f i k f j λ f i λ f j l i 1 + l i 2 l j 1 + l j 2 ( p f i p f j ) μ k f i λ f i l i 1 + l i 2 l j 1 2 + l j 2 2 + k f j λ f j l i 1 2 + l i 2 2 l j 1 + l j 2
In simulating the flow through intersecting fractures using Darcy’s law, it is essential to consider the difference in the radial vector sums of the pressures entering and exiting the fractures. The pressures P1 and P2 can be expressed as
P 1 = p f i 1 cos α + p f j 1 cos β
P 2 = p f i 2 cos α + p f j 2 cos β
Given that the pressure loss in the laminar flow state within the fractures is
P 2 = ( p f i 1 32 μ 2 Re λ 3 l i ) cos α + ( p f j 1 32 μ 2 Re λ 3 l j ) cos β
By integrating Equations (29)–(31), the radial pressure difference can be determined as
Δ P = P 1 P 2 = 32 μ 2 Re λ 3 ( l i cos α + l j cos β )
In Equation (32), l j = l j 1 + l j 2 , and l i = l i 1 + l i 2 .
The flow rate through the intersecting fractures can be represented using Darcy’s law as
Q = A k f f 32 μ 2 Re λ 3 ( l i 1 cos α + l j 1 cos β ) μ L
By combining Equation (33) with the flow rate expression for the embedded discrete fracture model (Equation (28)), we can derive the permeability calculation formula for two intersecting fractures:
k f f = 2 k f i k f j λ f i λ f j l i 1 + l i 2 l j 1 + l j 2 ( p f i p f j ) L k f i λ f i l i 1 + l i 2 l j 1 2 + l j 2 2 + k f j λ f j l i 1 2 + l i 2 2 l j 1 + l j 2 32 μ 2 Re λ 3 ( l i 1 cos α + l j 1 cos β )

2.4. Numerical Simulation Results of the Equation

Building on the fundamental concepts of fracture mechanics and traditional plate-like fracture models, a new plate-like fracture model is derived by considering fracture aperture, tortuosity, and angle. An improved permeability calculation formula for two intersecting fractures is developed by combining the mass transfer equation and trigonometric functions, followed by numerical simulations of the derived results.

2.4.1. Improved Single-Fracture Model

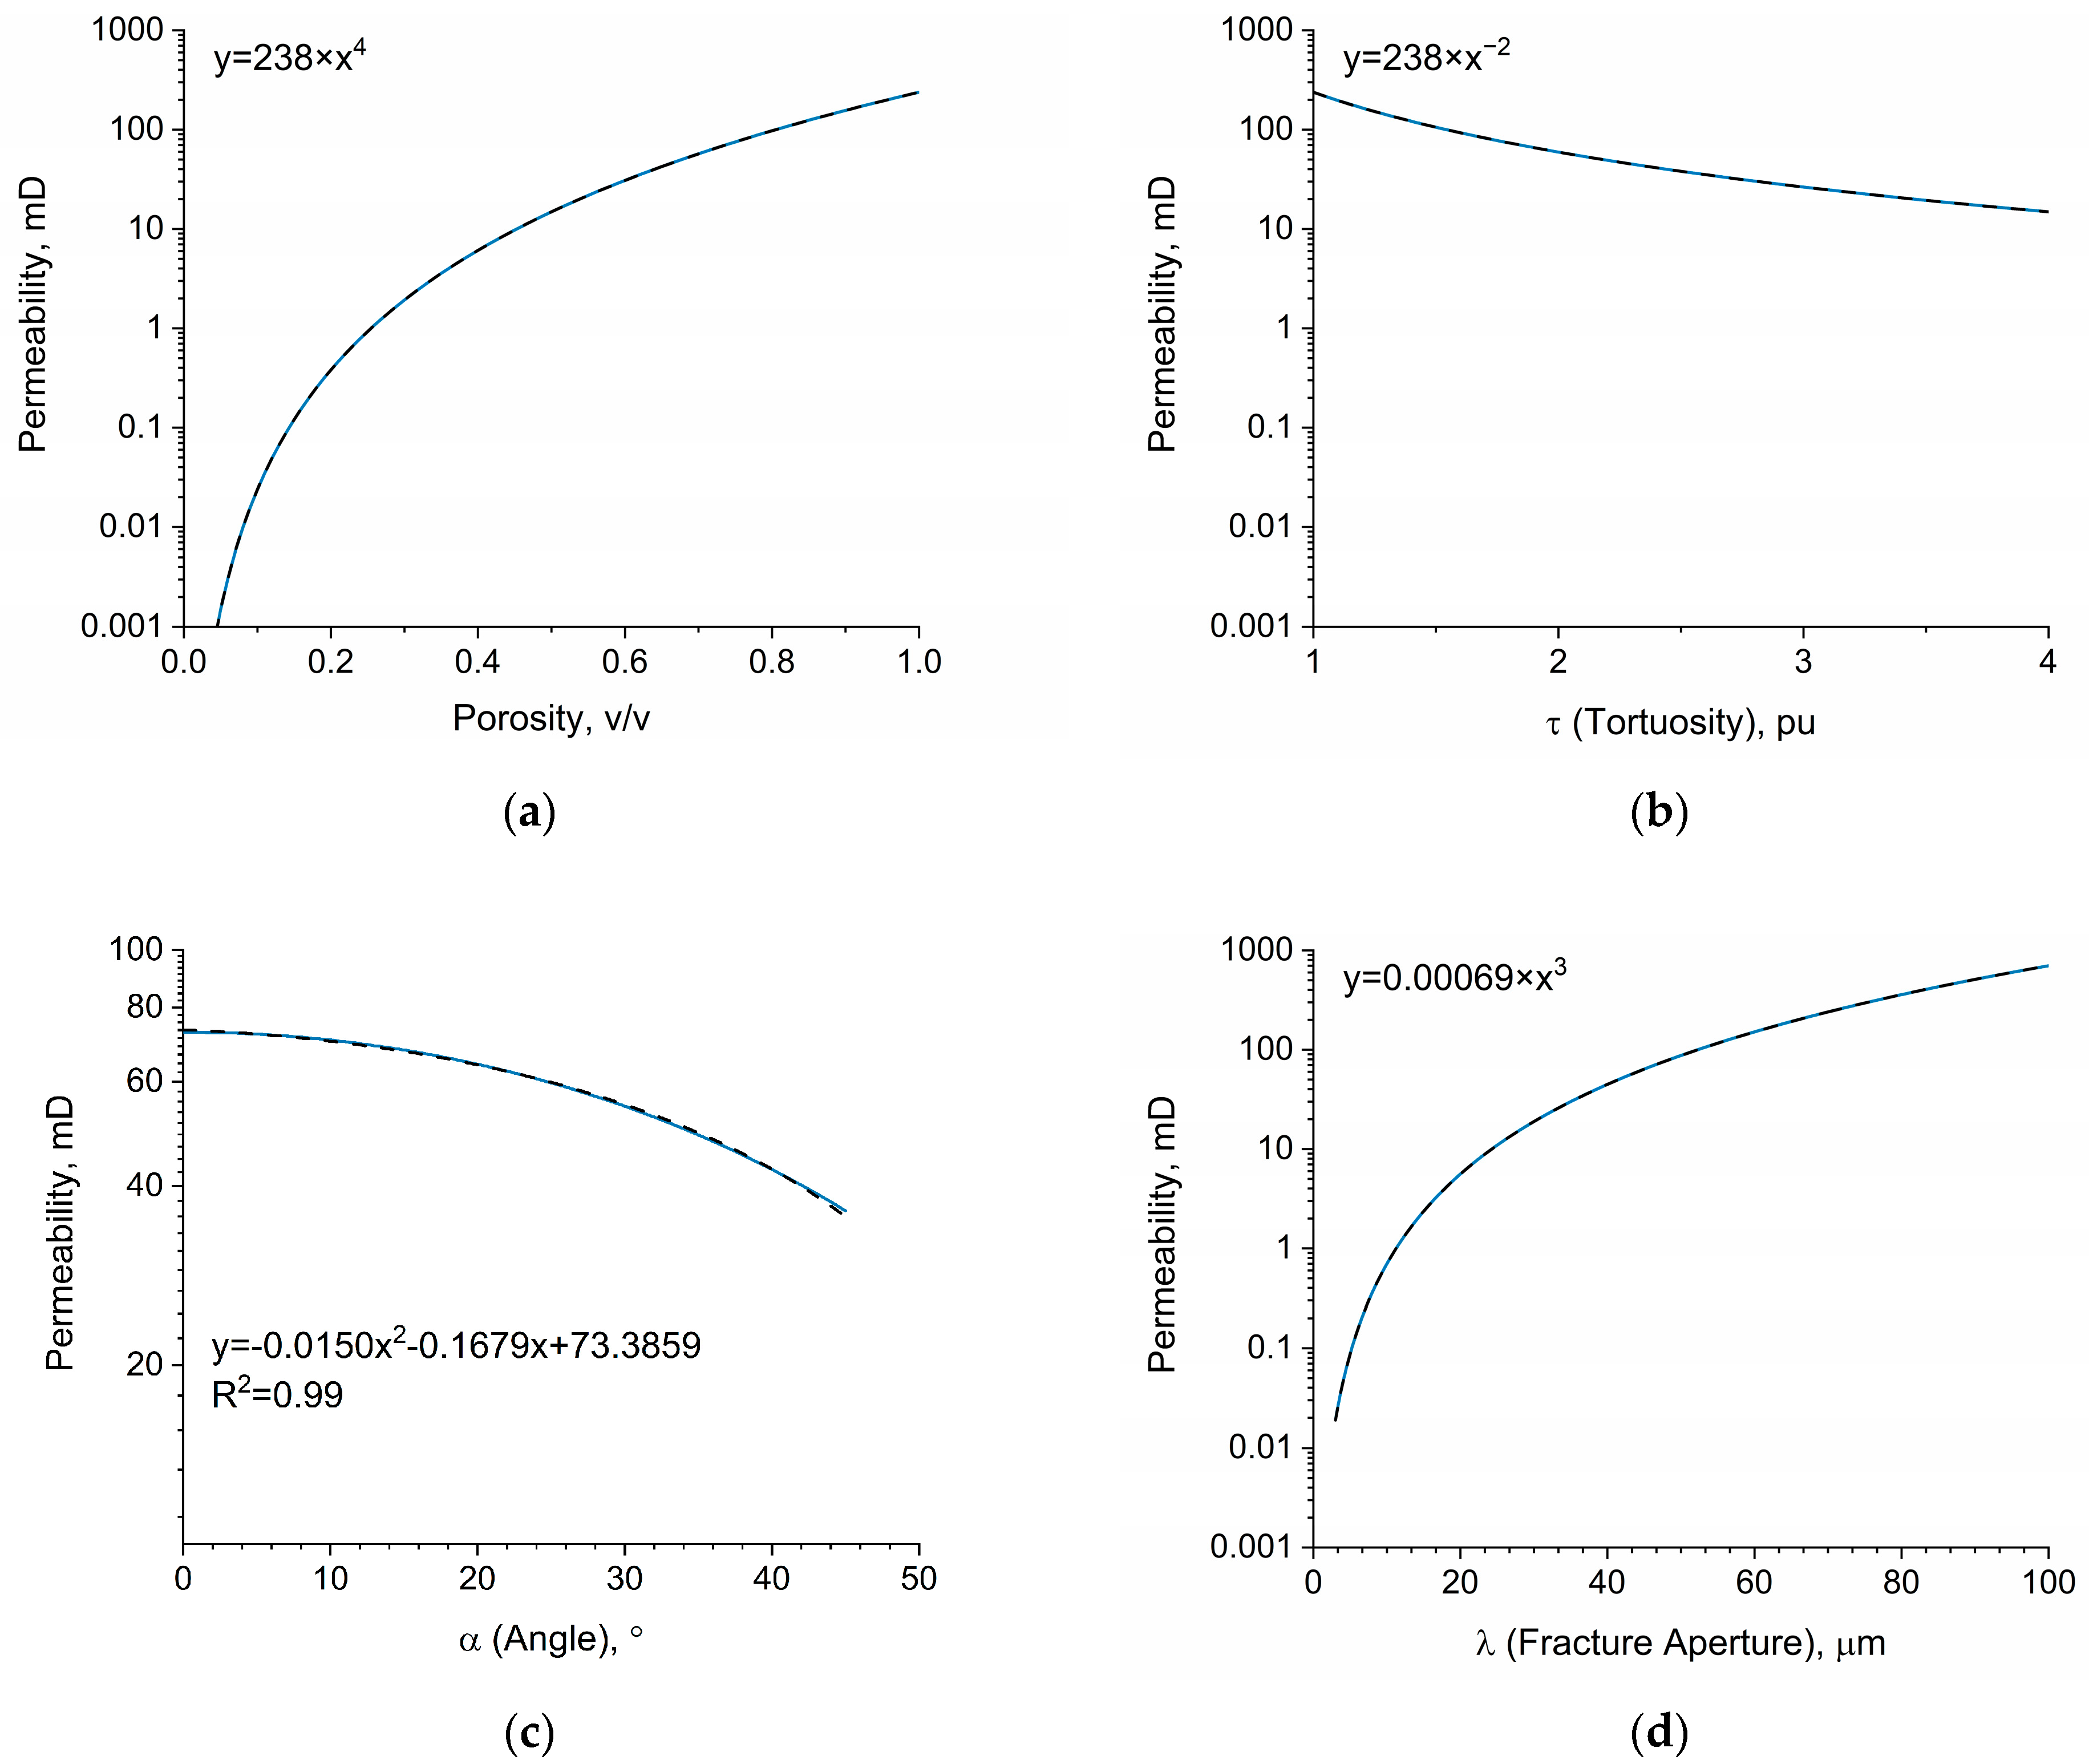
Equation (14) delineates the functional relationship between permeability and the degree of fracture tortuosity, fracture angle, and fracture aperture within the flat model. In this study, numerical simulations were conducted to explore these factors while maintaining other parameters at constant values. Under conditions where fracture aperture, angle, and tortuosity are uniform—specifically within a homogeneous reservoir—the permeability of the flat model demonstrates an exponential correlation with porosity, as shown in Figure 7a. Figure 7b illustrates how flat permeability varies with the tortuosity of the fracture. When the fracture angle and aperture remain constant, an increase in the meandering degree leads to a more intricate fluid pathway within the rock, resulting in decreased permeability. This relationship can be characterized by an exponential function that depicts the decline in permeability with heightened meandering degree. Figure 7c presents the relationship between flat permeability and fracture angle. It is noteworthy that the fitting employed is polynomial, although it is fundamentally linked to the cosine function; radial permeability diminishes as the fracture angle increases. Figure 7d reveals the correlation between flat permeability and fracture aperture. As the fracture aperture expands, permeability increases significantly, especially at larger apertures, where the enhancement in permeability becomes particularly pronounced. Combined with the relationship between different factors and fracture permeability obtained from the above simulation results, the radial permeability is taken as an example. This analysis underscores that the permeability of the rock is governed by a complex interplay of factors, with fracture aperture serving as a crucial determinant for permeability enhancement. In contrast, increases in the meandering degree and angle hinder radial fluid flow, thereby diminishing radial permeability.

2.4.2. Dual-Fracture Permeability Model

Based on Equation (34), cross-fracture permeability is influenced by a variety of factors and their respective variation patterns. This methodology can, in principle, be applied to simulate any cross-fracture scenario. Since the numerical simulation is performed on a per-unit-volume basis for the rock mass, most fixed parameters are dimensionless, allowing for the calculation of only relative permeability values to elucidate the trends and variations.
The calculations presented in this study were conducted using MATLAB 2022b. The model for simulating the intersecting fractures is constructed based on the results obtained from single-fracture simulations. Parameters such as fracture aperture, angle, and tortuosity had already been considered in the single-fracture model, allowing the results to be effectively utilized in the intersecting fracture simulations. For the boundary conditions of the intersecting fractures, both the inlet and outlet were set to fixed fluid pressure to ensure that the fluid flow characteristics within the fractures accurately reflect real-world conditions. Additionally, a constant flow rate was applied to simulate the inflow and outflow of fluids, ensuring a continuity of flow. No-slip boundary conditions were implemented for the walls of the fractures, assuming that the fluid velocity at the wall is zero. This assumption aligns with the actual flow characteristics of fluids near solid surfaces. In the simulation of intersecting fractures, a mass transfer equation was applied to account for the flow characteristics at the intersections. Special attention was given to variations in the angles of the fractures, and scenarios where the angles of the two fractures are identical were not considered. This assumption simplifies the model and better represents the complexity of actual fracture networks. Considering that in the actual reservoir, the development of fractures is more complicated, and the relative error and production of the two fractures in the cross-fracture are also very different, to clarify the influence of the relative position of fractures on the permeability of fractures, the influence of the difference in the angle of the cross-fracture and the change in the position of the intersection point on the permeability is simulated under the control variables.
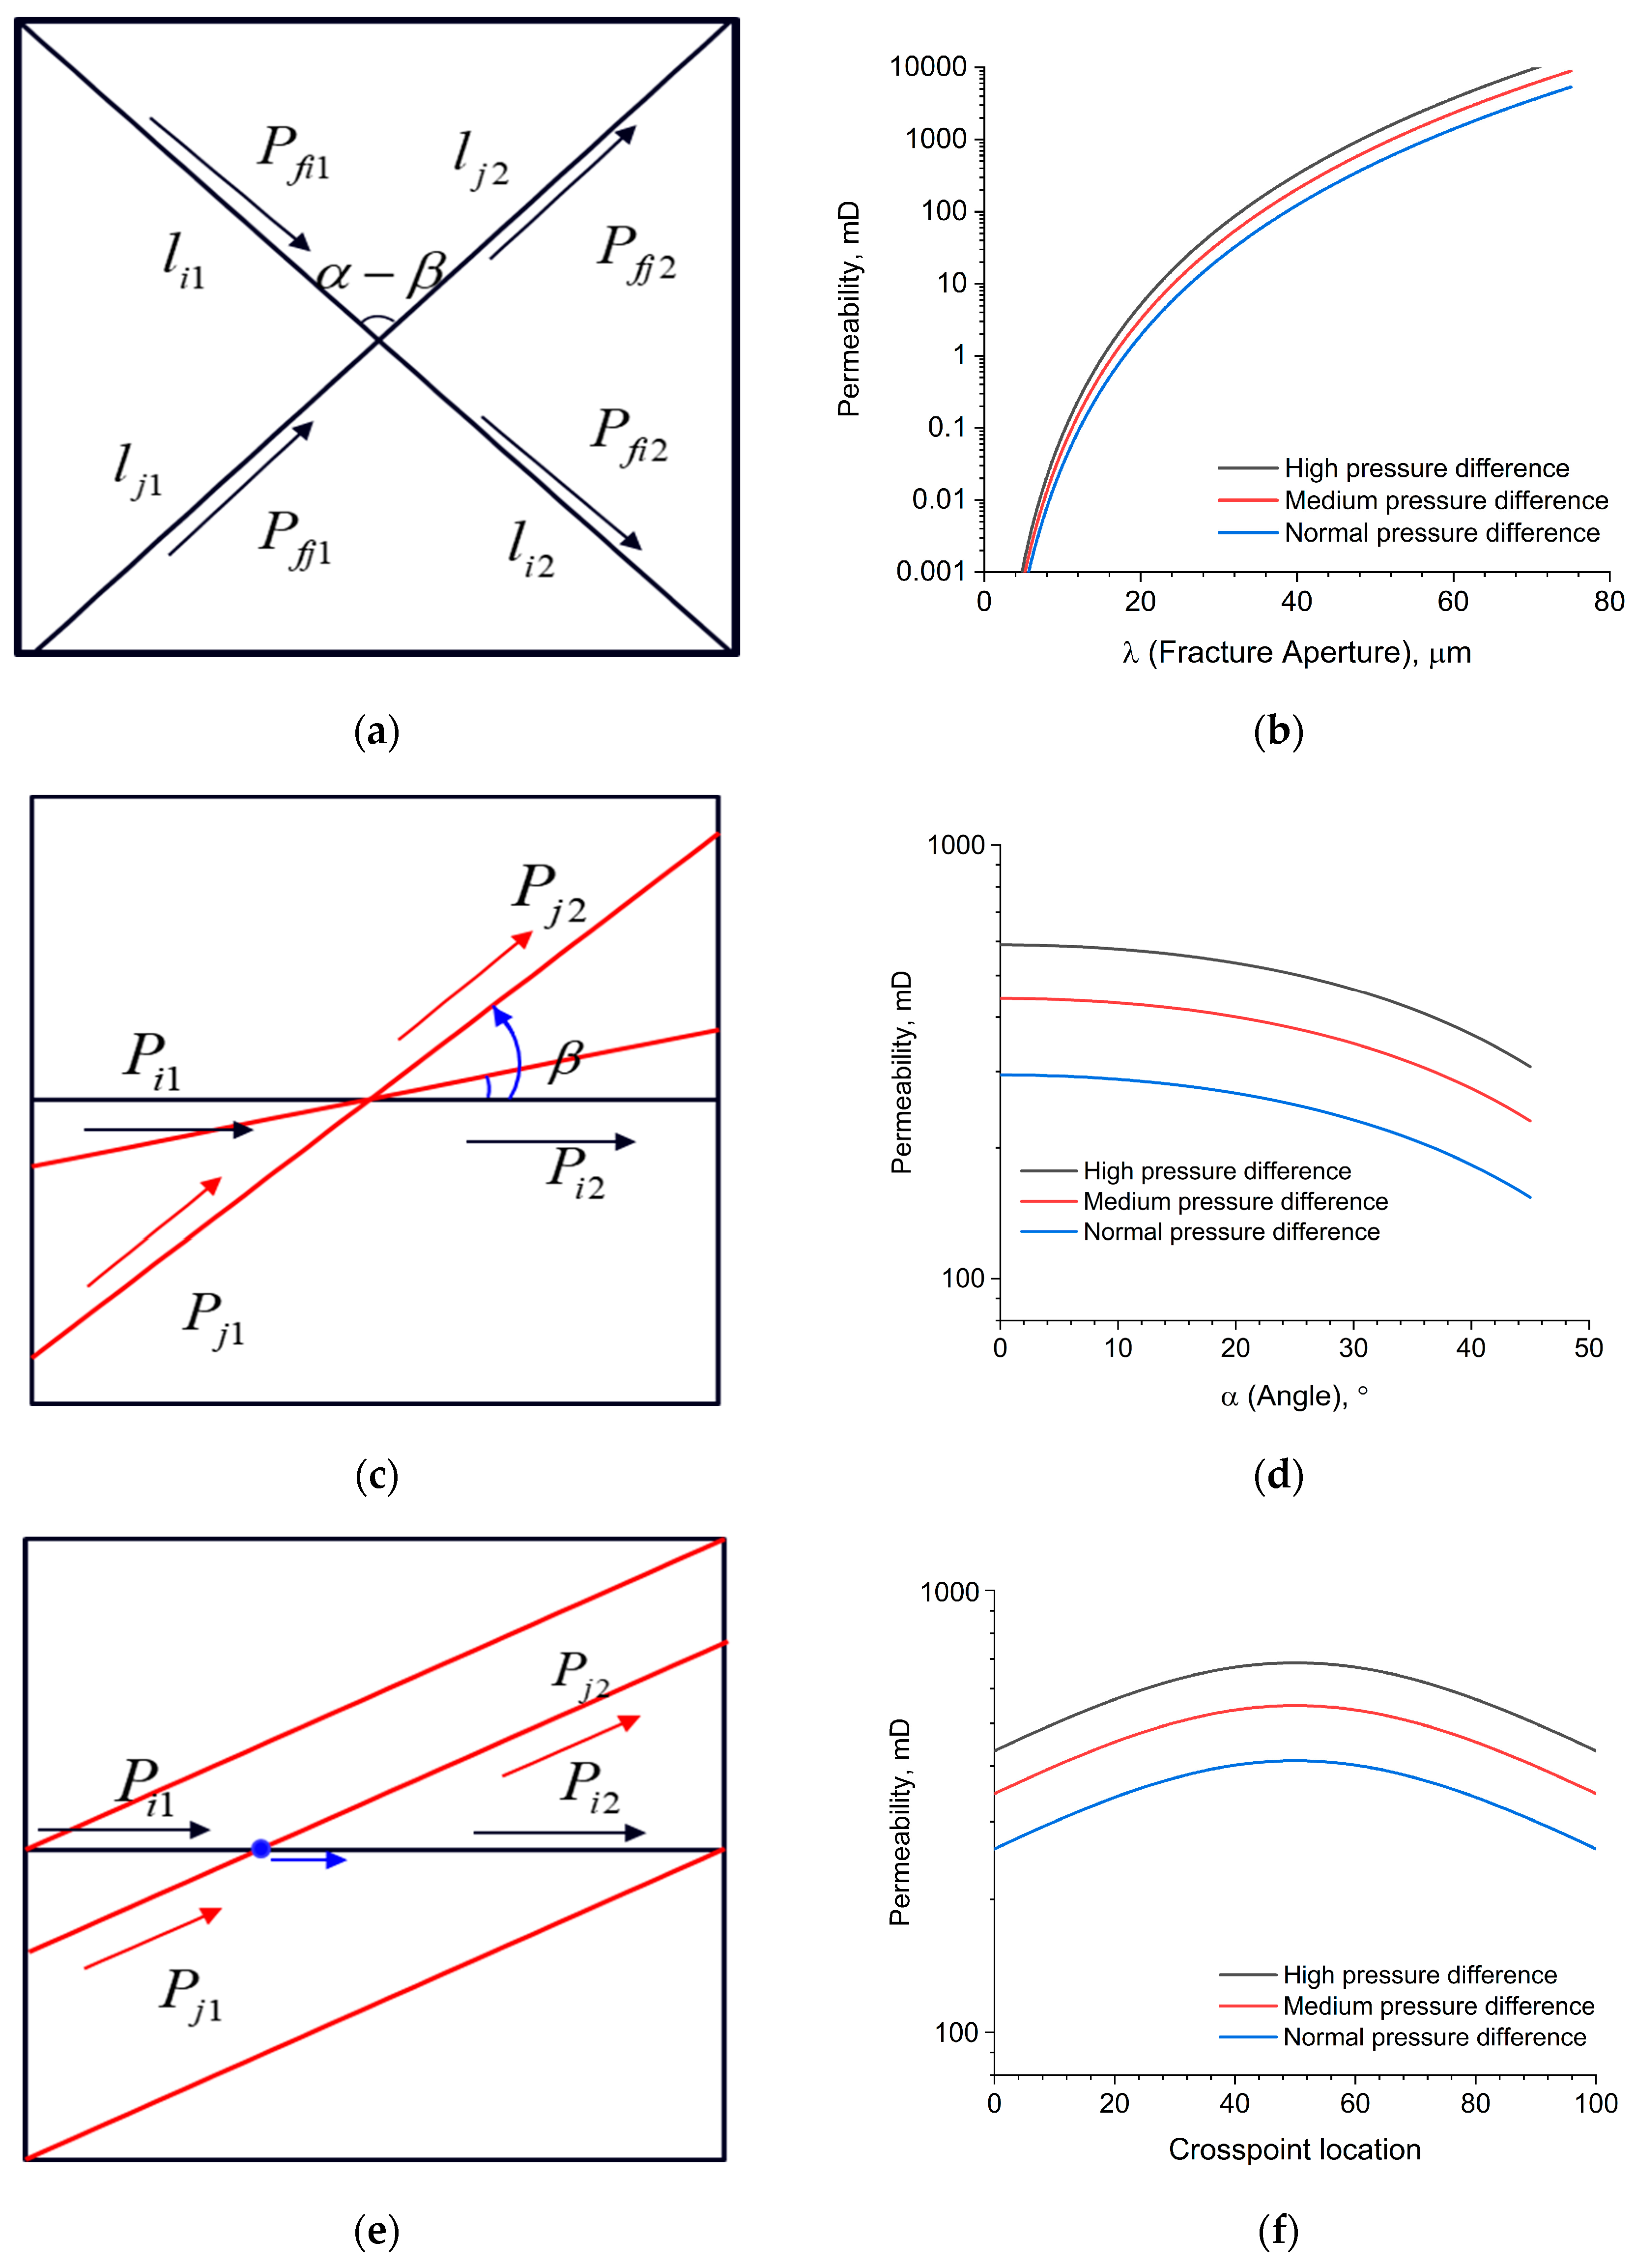
Figure 8 illustrates the numerical simulation of the relative positions of three types of cross-fractures. Figure 8a shows two diagonally crossed fractures within the square grid of the discrete fracture model under ideal conditions, with their inclinations set at α = 135° and β = 45°, and their intersection point located at the center.
Figure 8b demonstrates the impact of fracture tortuosity on the permeability of the rock mass model, given the relative positions of fractures depicted in Figure 8a, specifically when the cross-fracture angle is held constant. The color gradient of the curve in Figure 8b represents various pressure differential conditions, including high, medium, and normal pressure differentials. The results indicate that permeability increases with larger fracture tortuosity across all pressure differential conditions, with the most pronounced increase observed under high-pressure differentials. Additionally, it is important to note that the tortuosity of the two fractures in the simulation is inherently aligned with the default tortuosity settings.
Figure 8c illustrates a scenario in which one fracture remains fixed, intersecting angle α at a constant 0°. The angle of the other fracture varies from 1° to 45°, with the intersection point of the two fractures centered. It is important to note that the application of the mass transfer equation is not considered in this scenario, as the angle of the two fractures is at 0°, resulting in their recombination into a single crack. The simulation results presented in Figure 8d demonstrate that as the angle of the other fracture increases, permeability exhibits a downward trend across all pressure differential conditions, with a more pronounced decrease under high-pressure differentials.
Figure 8e illustrates a scenario in which the angles of the two fractures remain fixed while one fracture moves horizontally and radially, causing the intersection point to shift from left to right. Figure 8f reveals the impact of intersection location on the permeability model of the rock mass. As the intersection point shifts from the leftmost section of the fracture to the right, its distance is measured relative to the entire length of the rock mass, serving as the horizontal coordinate. The results indicate that permeability initially increases under all pressure differential conditions, reaching a maximum at the midpoint before gradually declining back to the initial permeability. The permeability change curve exhibits axisymmetry.
Unlike the numerical simulation results for a single fracture, a novel permeability calculation for the cross-fracture is derived by incorporating the mass transfer equation and trigonometric functions into the analysis of single fractures. Variations in the angle of the cross-fracture and the relative position of the intersection significantly influence the permeability calculation results of the model.

3. Experimental Materials and Methods

The measurement of fracture permeability is essential for validating the accuracy of the derived permeability equations. Therefore, permeability measurements on actual granite were utilized. Two approaches were used: one was to verify the effect of fracture aperture on core permeability in a single fracture, while the other was to measure permeability after crevassing the core to validate the permeability formula for cross- fracturing.

3.1. Acquisition of Experimental Materials

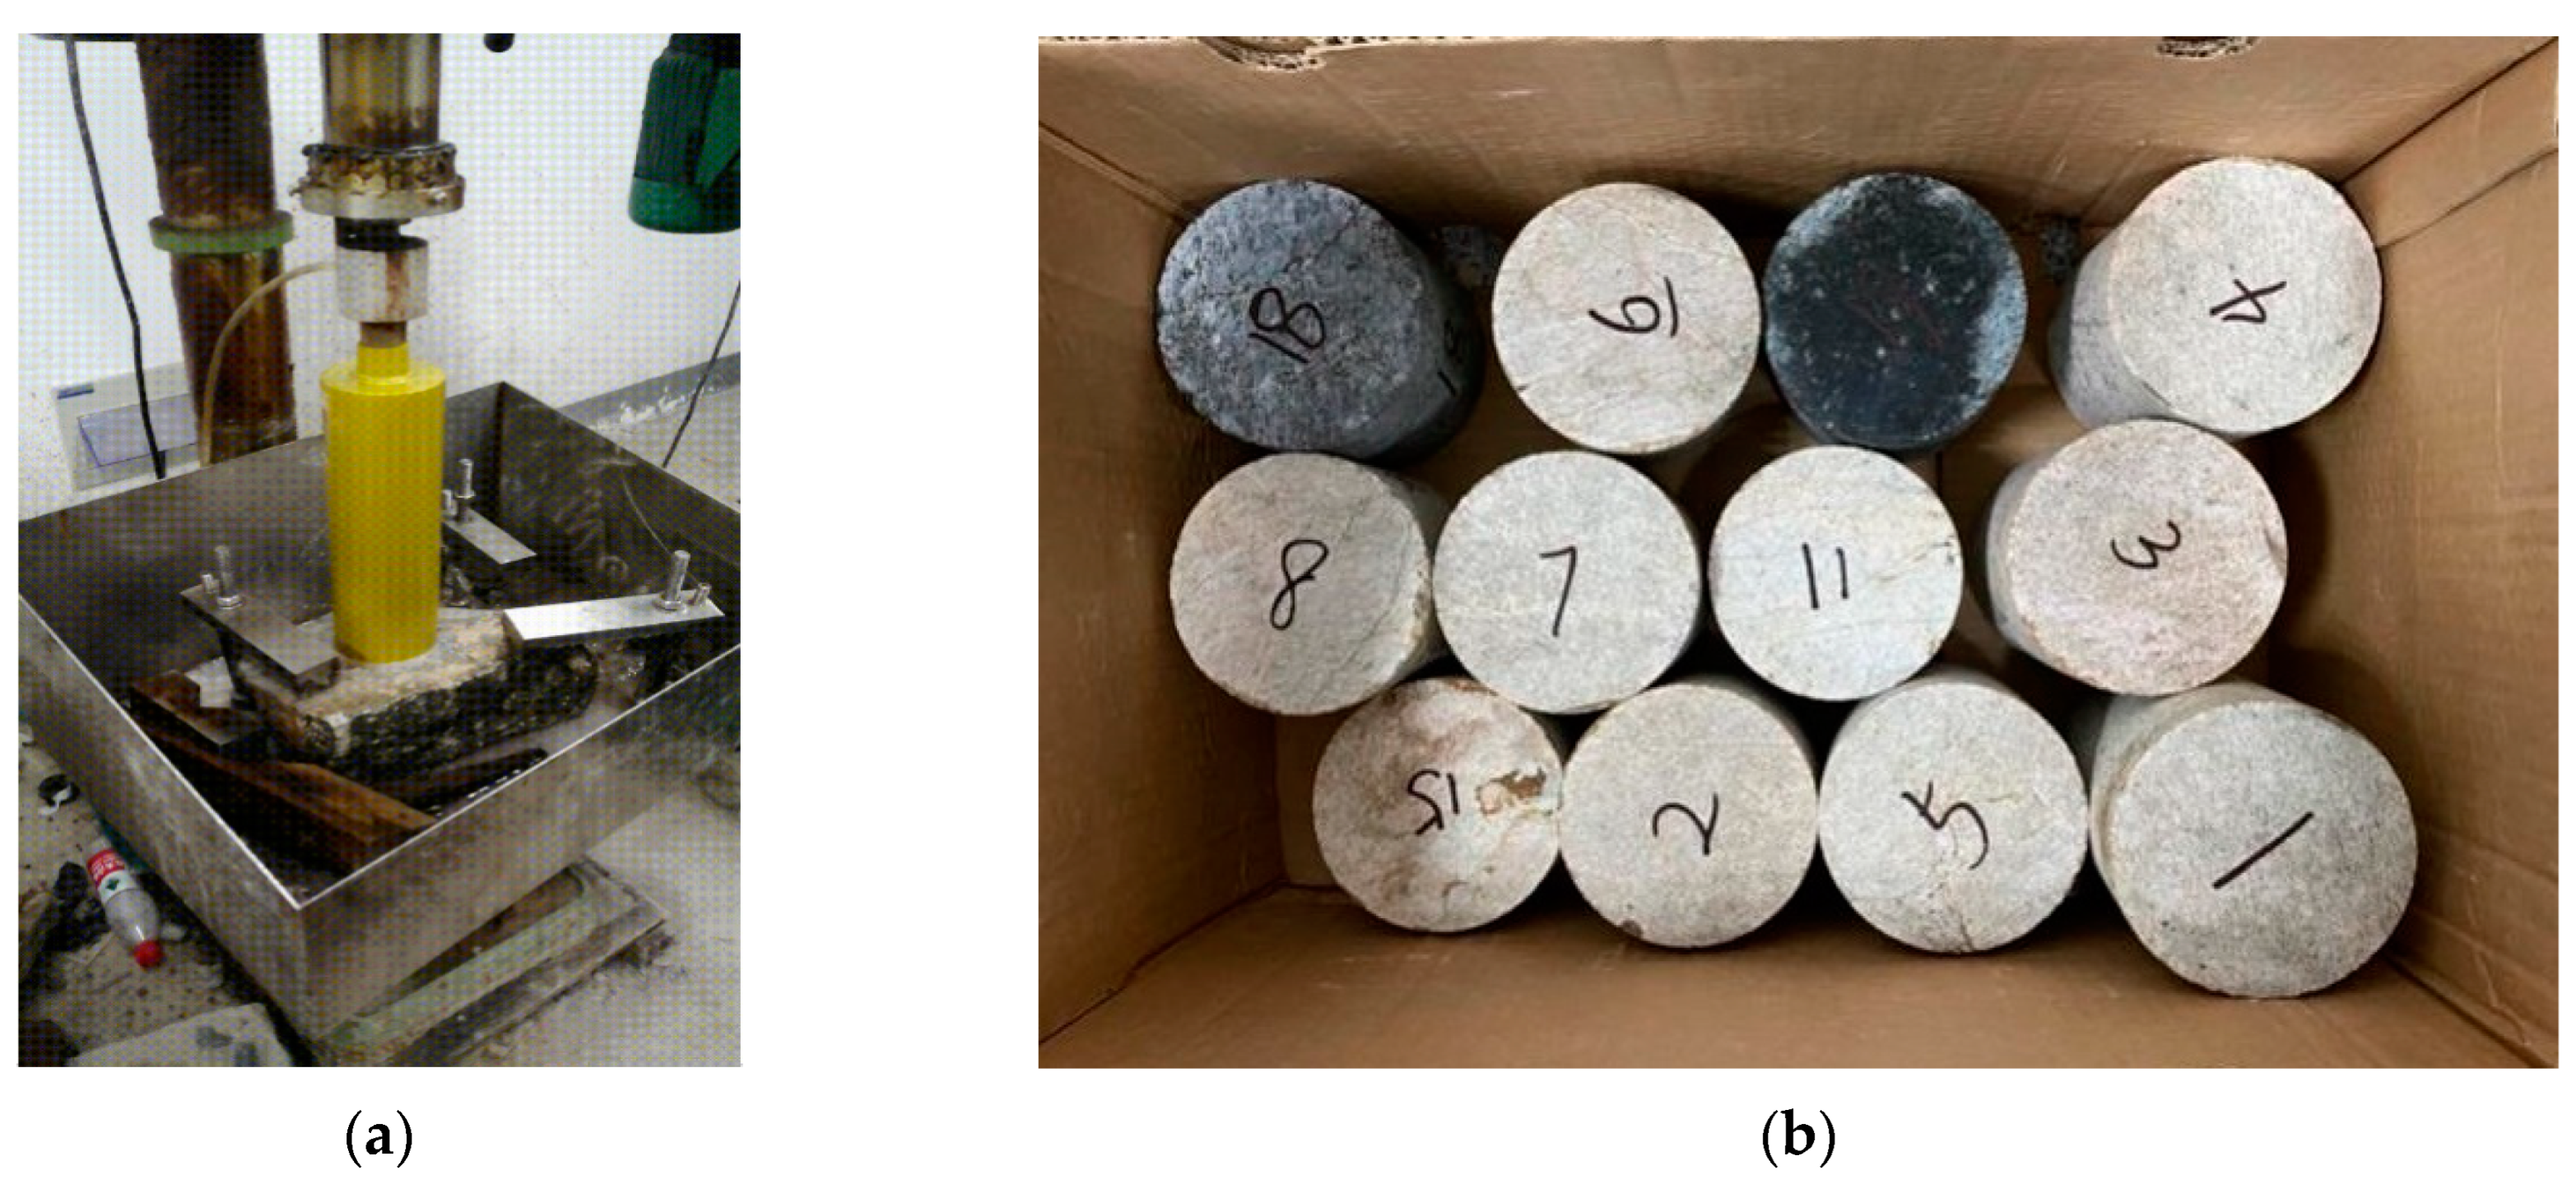
Considering the extensive development of granite fracture-type reservoirs in the Qiongdongnan Basin of the South China Sea, the outcrop samples were collected (Figure 9b) from granite outcrop rock samples (Figure 9a) at a single location.
The preparation process for drilling full-diameter granite cores consists of five key steps. First, the rock sample is positioned on the drilling platform. Next, it is secured to ensure stability during the drilling operation. Following this, the water supply is activated to cool the drill bit and clean the borehole walls. Subsequently, the power supply is engaged to operate the drilling machine. Finally, the height of the drilling platform is adjusted to achieve optimal contact between the drill bit and the rock sample. The full-diameter drill bit has an inner diameter of 8.5 cm, as depicted in Figure 10a, which illustrates the actual procedure for full-diameter core drilling. Figure 10b presents the core sample obtained, which will be utilized for subsequent measurements of planar fracture permeability. The collected samples are cylindrical, with a length of 50 mm and a diameter of 85 mm. We prepared 12 effective sample groups, each containing multiple samples. The average density measurement of the samples was found to be 2.9 g/cm3. To accurately depict the fracture features of the South China Sea granite reservoirs, the X-ray diffraction (XRD) results of the rock were included in the manuscript. The scanning results indicate that the primary constituents of the samples are plagioclase (37%), potassium feldspar (20%), quartz (20%), clay (11%), with minor amounts of rhodochrosite (4%) and pyrite (1%).

3.2. Flat Plate Fracture Permeability Measurement

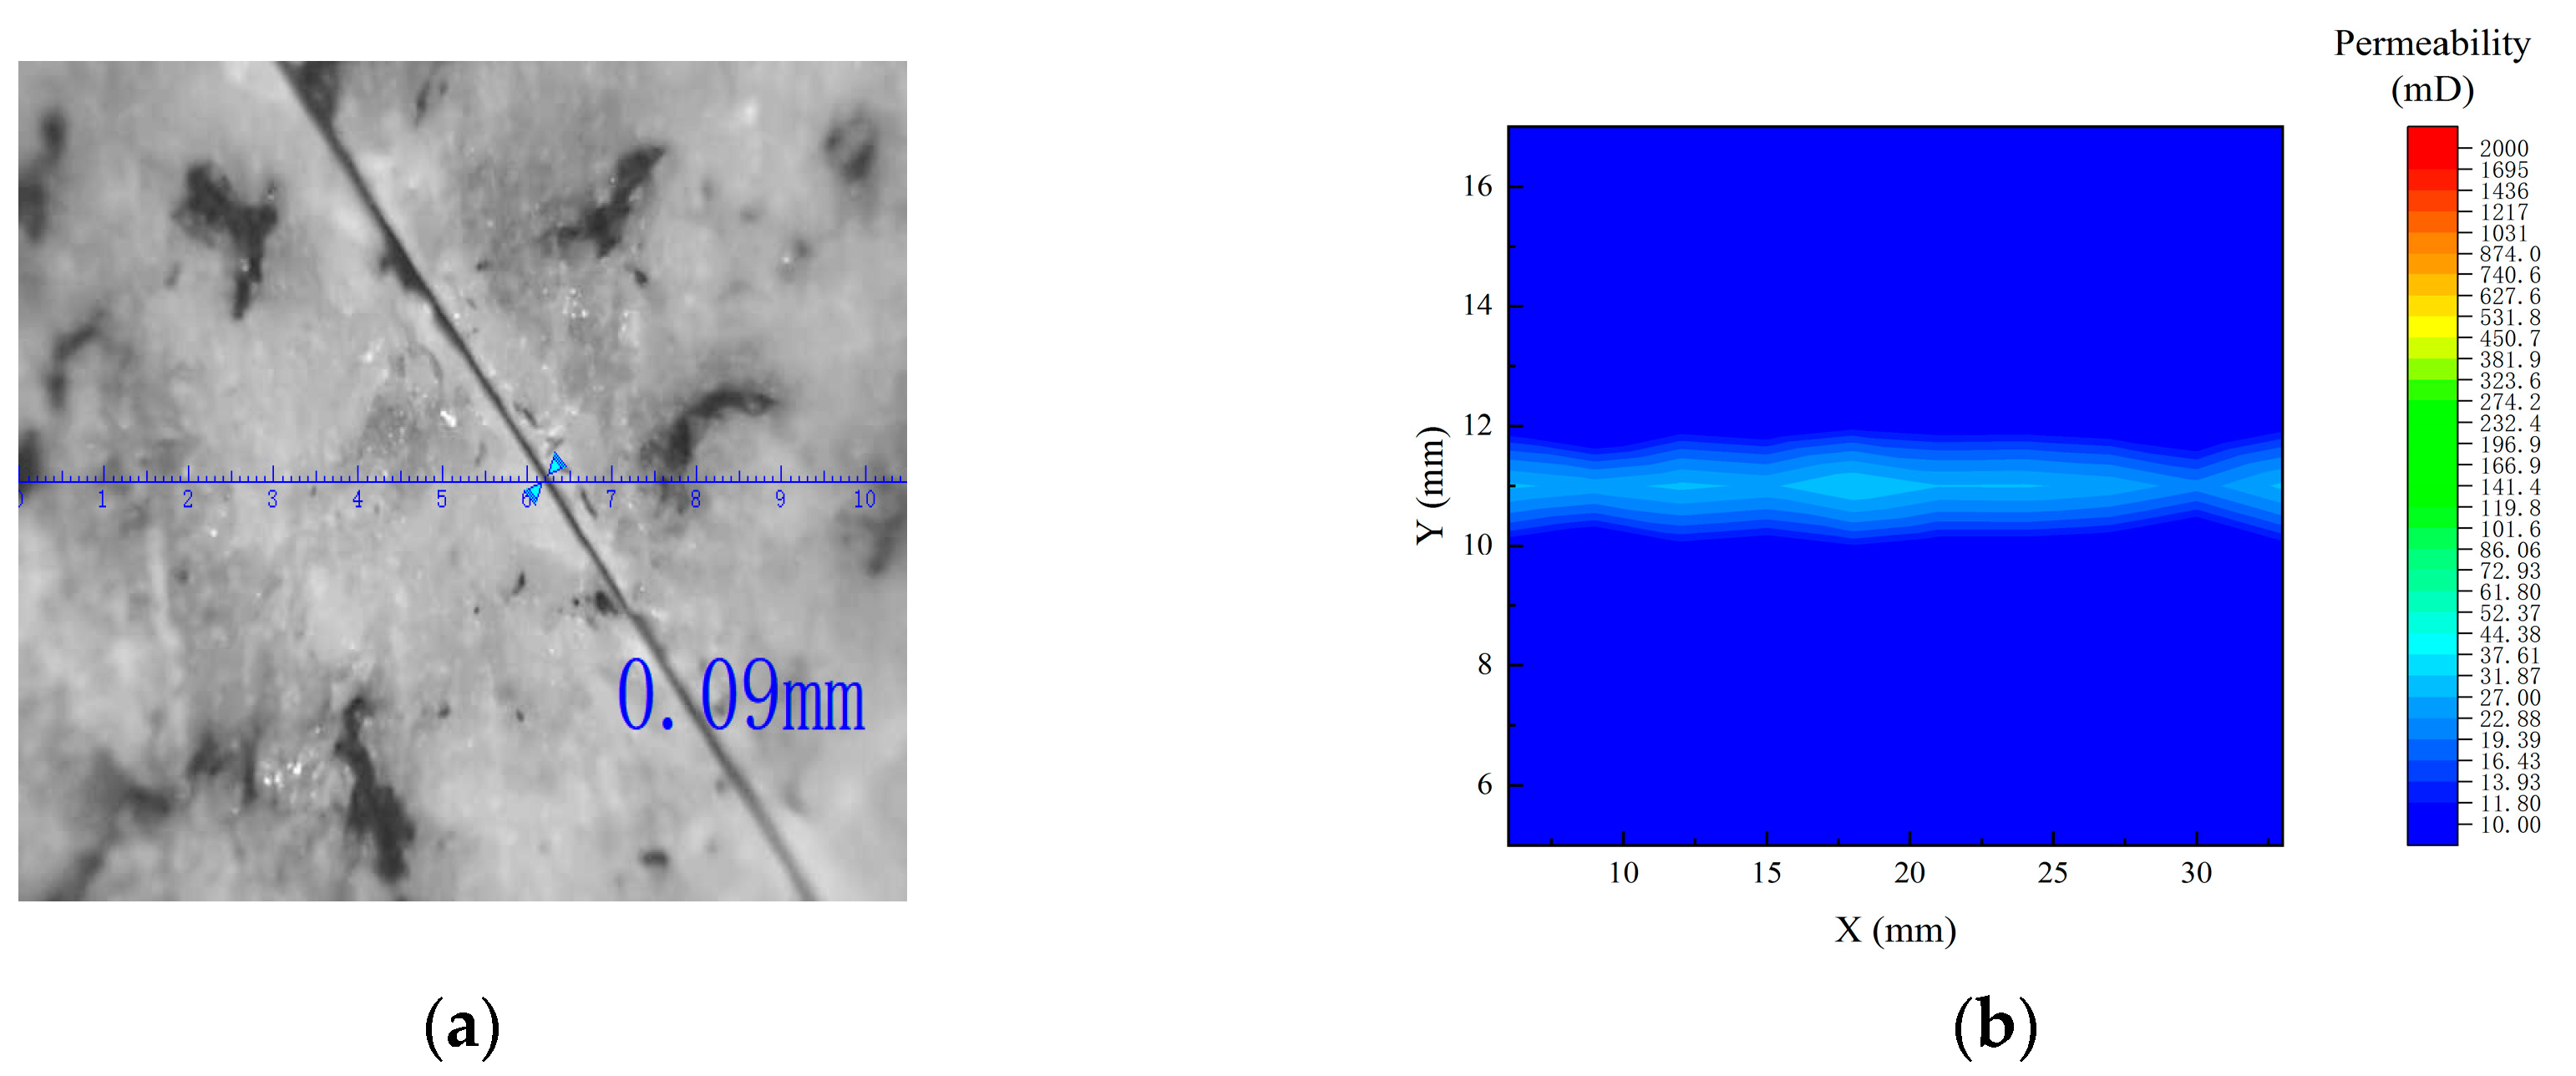
For single fractures, the gasket method was used to change the fracture aperture to ensure the reliability of the experiments, especially for the investigation of fracture aperture. Following core drilling, the flat plate model was assembled, incorporating five distinct fracture apertures. These apertures were adjusted using shims and grippers, with the designated fracture apertures for the five configurations set at 90 μm, 140 μm, 200 μm, 250 μm, and 300 μm, respectively. Figure 11a shows the plate model diagram; Figure 11b is the gasket application diagram (100 μm); and Figure 11c is the gripper diagram.
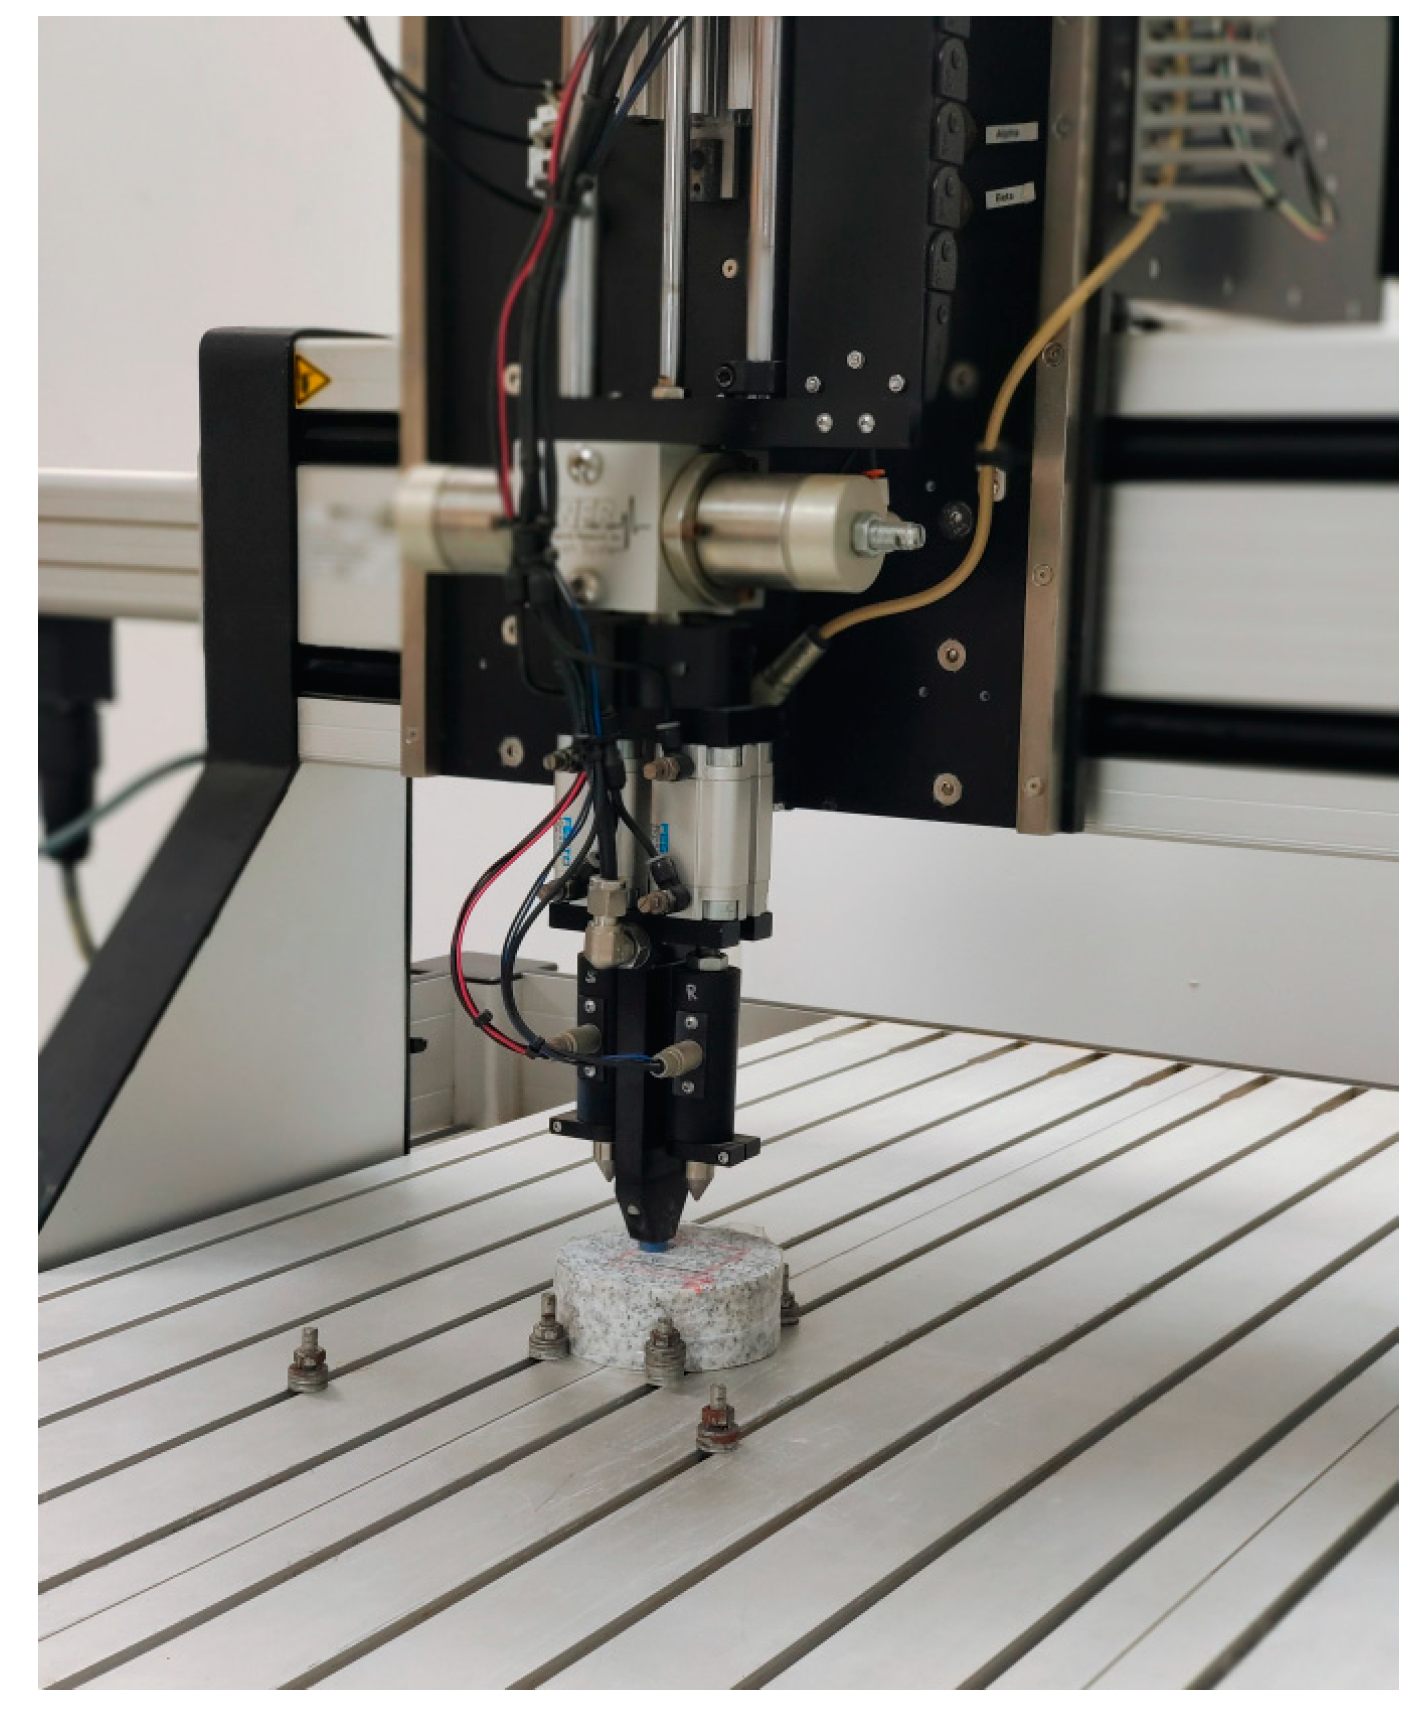
AUTOSCAN-II Core multifunction scanning instrument is used to measure the permeability of plate fractures, and the permeability of the instrument is measured using a steady-state gas injection method. The standard 4 mm permeability probe is used to measure permeability in the range of 0.1 md~3D during the measurement process. Figure 12 is the schematic diagram of AUTOSCAN-II (NER USA, Inc., White River Junction, VT, USA) Core multifunctional scanner.
The experiment in this study is carried out by collecting granite outcrop samples, drilling full-diameter cores, based on the plate model, controlling the fracture aperture using gaskets, and measuring the core fracture permeability under different fracture apertures.

3.3. Core Fracturing Methods and X-CT Scanning

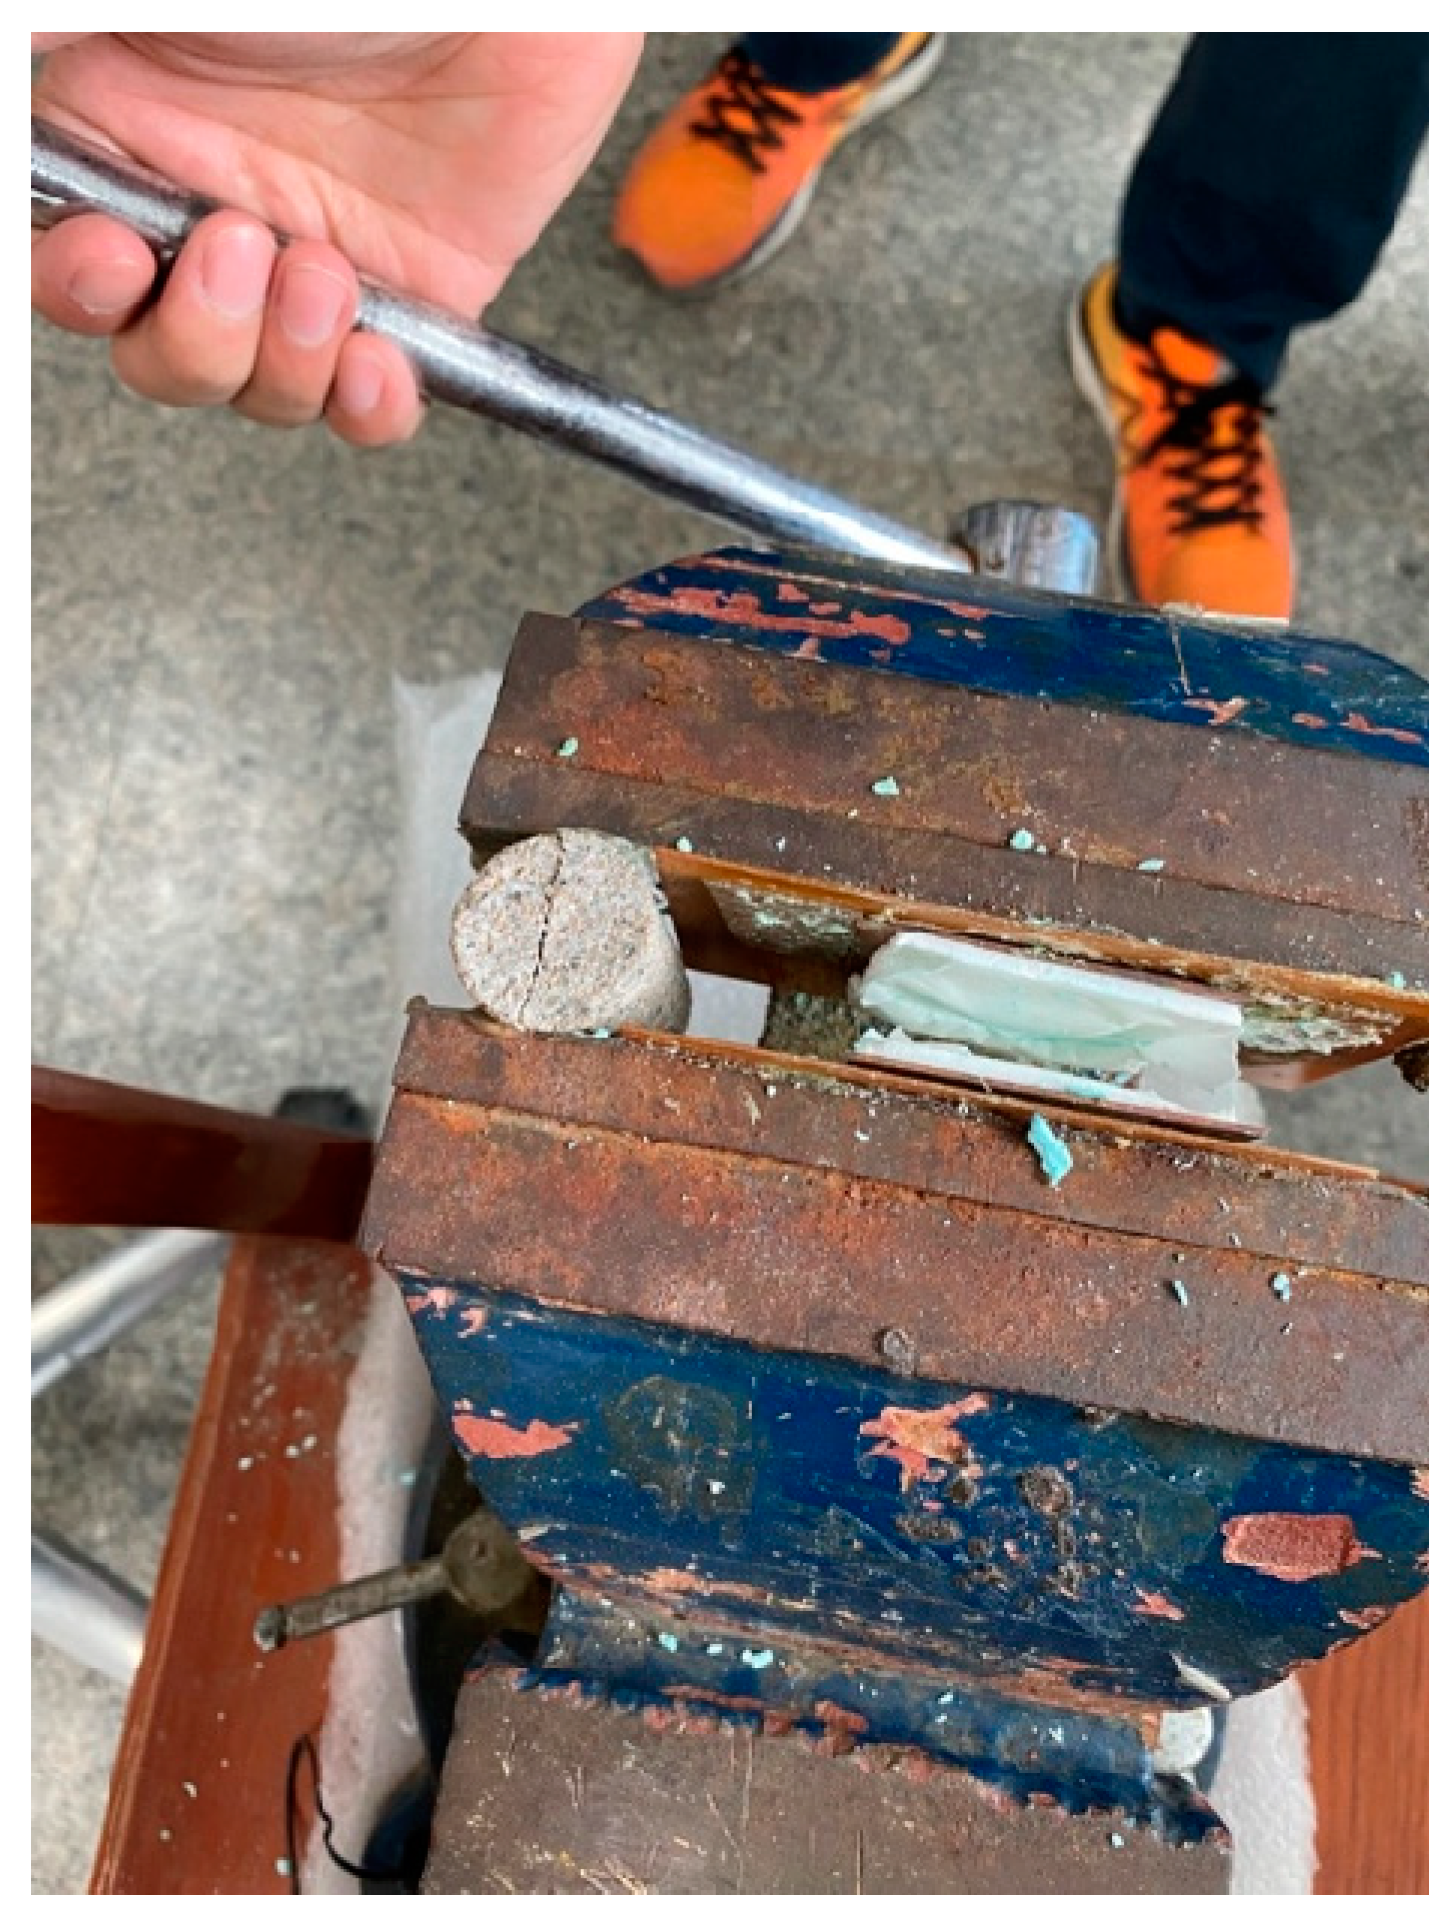
Artificial tensile fractures were created based on the Brazilian splitting theory. How-ever, this method may cause fragmentation of the core samples, making them unsuitable for subsequent X-CT scanning. To mitigate this issue, we employed a manual clamping method using a vise during the fracturing process, thereby preventing the core samples from being crushed. Precise control over the initiation time and fracture strength is critical; however, the cores are vulnerable to crushing, which limits the number of viable samples that can be collected. Figure 13 presents a schematic representation of the process used to create artificial joints.
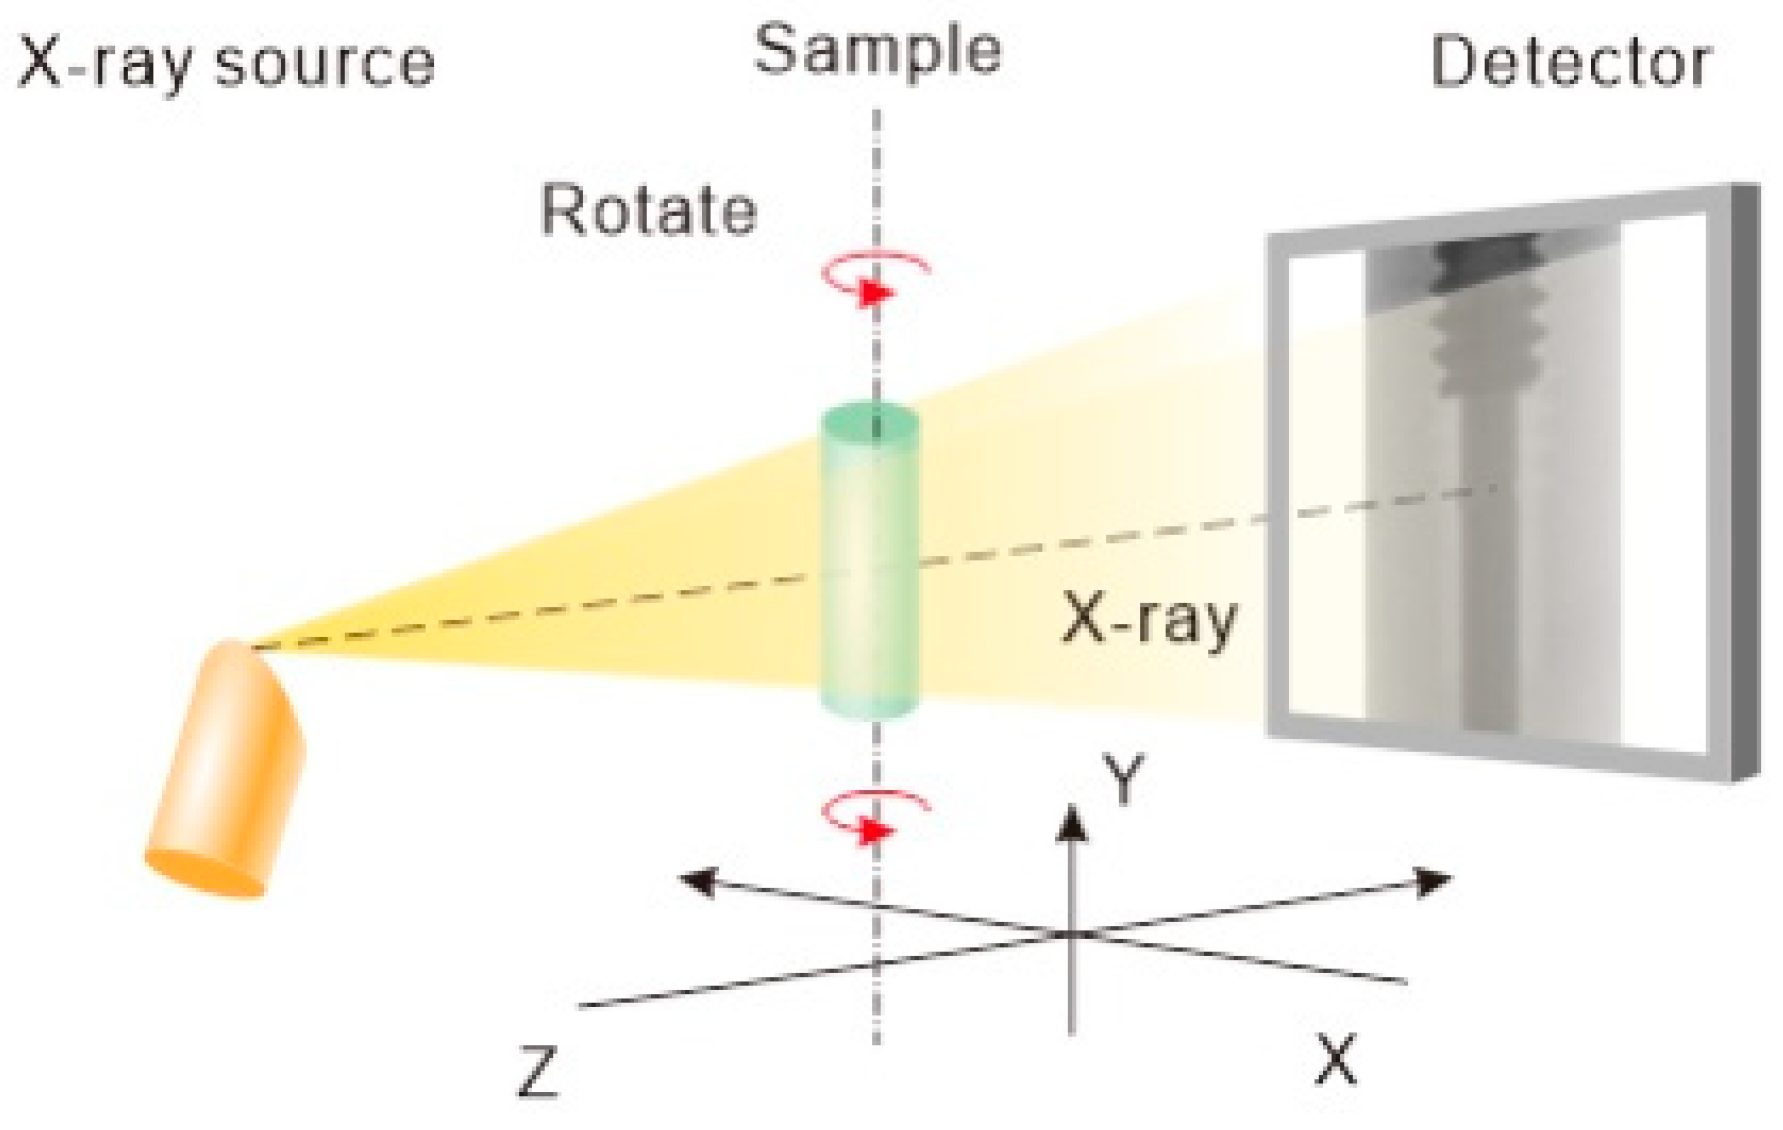
Computed tomography (CT) scanning experiments were performed on core samples both before and after the fracture construction process. The resolution achieved for full-diameter samples in these experiments was 50 μm. The micro-pore structure of the reservoir—including the geometry, size, distribution, and connectivity of pores and throats—plays a critical role in influencing reservoir capacity and seepage efficiency. Recently, X-ray computed tomography (X-CT) has become an essential tool for characterizing the microscopic pore structures in tight sandstone reservoirs. This technique reconstructs the three-dimensional structure of pore throats by using conical X-rays in conjunction with a 360-degree rotation of the sample (Figure 14).

4. Results

4.1. Core Permeability Test Results

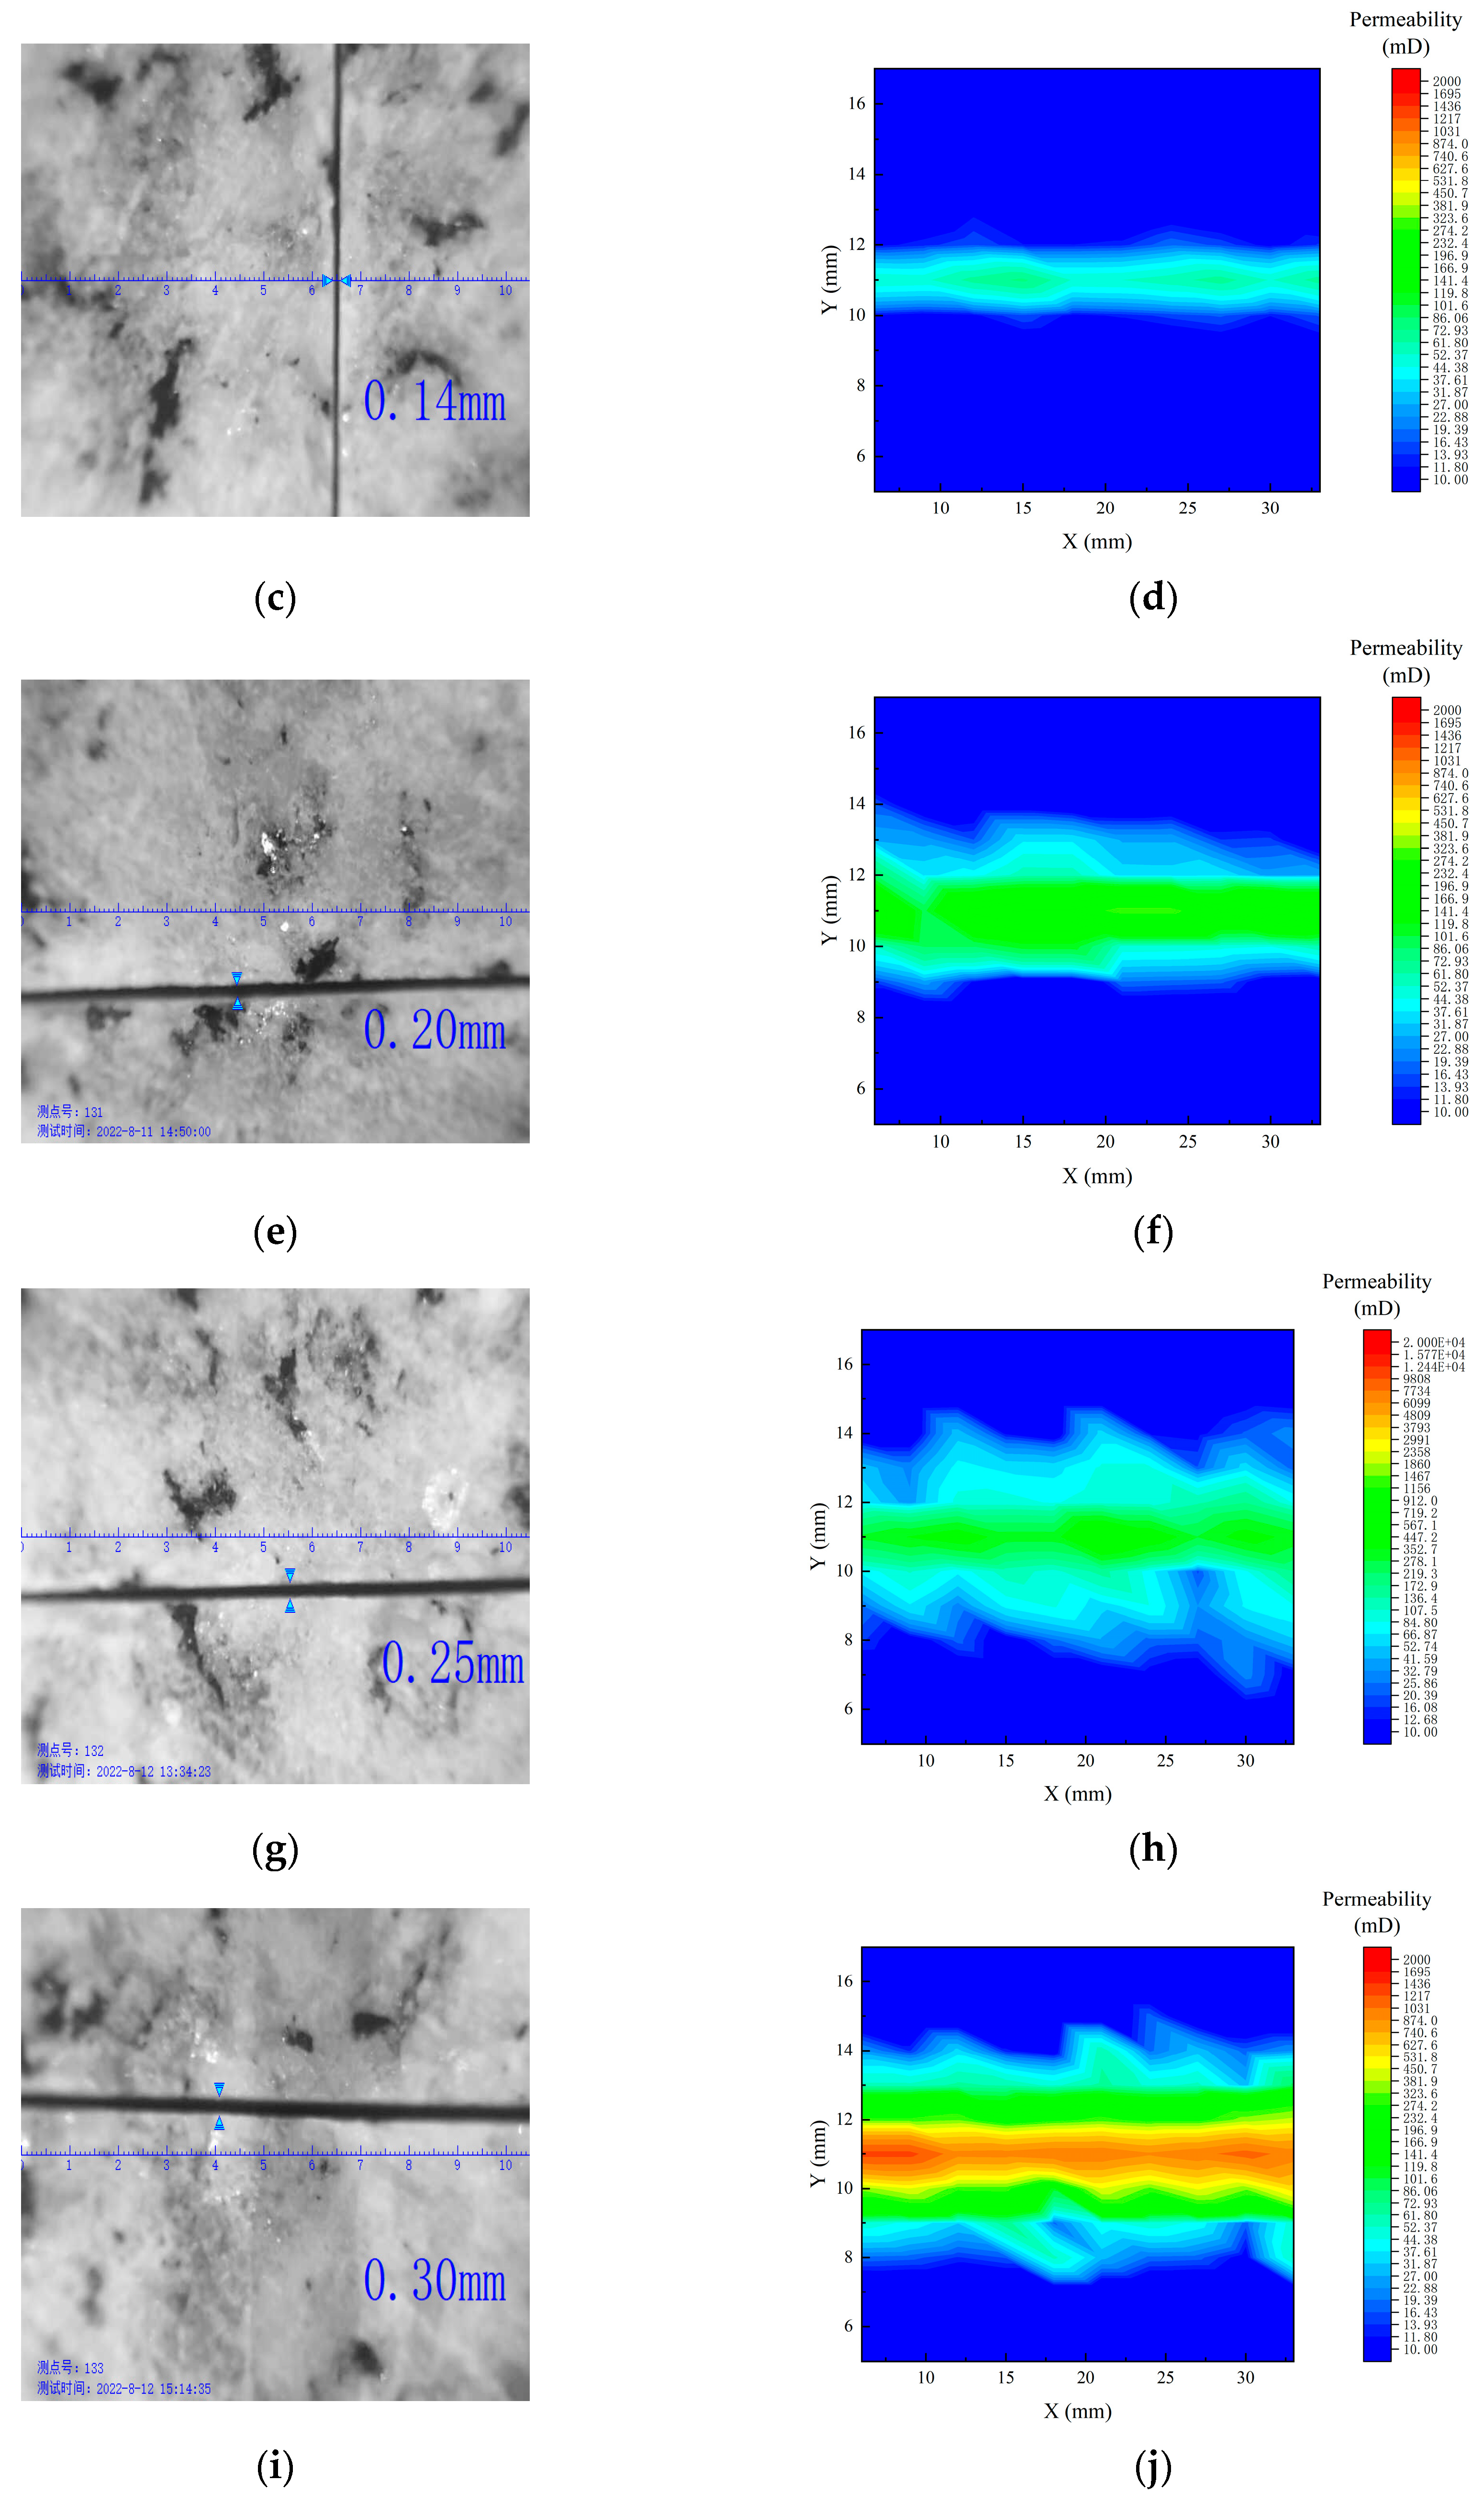
Figure 15 presents the results of five experimental schemes for measuring the permeability of slab fractures, all conducted with a fixed measurement direction and a corresponding fracture angle of 0°. In Figure 15a, a fracture aperture of 90 µm is shown, which corresponds to an average permeability of 30 mD, as illustrated in Figure 15b. Figure 15c displays a fracture aperture of 140 µm, linked to an average permeability of 50 mD, depicted in Figure 15d. In Figure 15e, a fracture aperture of 200 µm results in an increase in average permeability to 230 mD, as shown in Figure 15f. Figure 15g corresponds to a fracture aperture of 250 µm, yielding an average permeability of 350 mD, as demonstrated in Figure 15h. Finally, Figure 15i illustrates a fracture aperture of 300 µm, leading to an impressive average permeability of up to 1300 mD, as presented in Figure 15j. Overall, Figure 15 summarizes the measurement results for the fracture plate models with apertures of 90 µm, 140 µm, 200 µm, 250 µm, and 300 µm.
In this study, the experimentally derived fracture permeability was assessed alongside the measured fracture apertures. Figure 16 presents the calculated results, where the blue spheres represent the core permeability of a single fracture with varying apertures measured during this experiment under shim action. It is important to note that the permeability measurements were aligned with the fracture direction, which is why the figure does not include information regarding the fracture angle. Due to the technical limitations associated with artificial fractures, the experimental results can only achieve a minimum fracture aperture of 49 μm, making it impossible to investigate the trend of permeability at smaller fracture apertures. The results obtained in this study are consistent with the findings of previous research [47,48].

4.2. X-CT Scanning Results and Permeability Test Results of Cores before and after Fracturing

The three-dimensional digital core obtained through CT technology provides a detailed representation of the microstructural features of the rock mass [49]. Figure 17 illustrates the entire application process, with Figure 17a presenting an overall view of the three-dimensional digital core, while Figure 17b and 17c depict the digital reconstruction results of the core samples before and after the fracture construction, respectively. Following the scanning and three-dimensional reconstruction of the CT images, a series of image processing steps are required, including filtering and threshold segmentation.
In the threshold segmentation process, median filtering is first applied to eliminate noise and enhance image quality, followed by a binarization step to construct the three-dimensional pore network model of the core. Figure 17d,e show the two-dimensional cross-sectional images before and after filtering, while Figure 17f,g correspond to the results obtained before and after the fracture construction, reflecting changes in fracture characteristics. Figure 17h illustrates the fracture extraction process, and Figure 17i presents the visualization of the three-dimensional fracture distribution obtained through threshold segmentation. Finally, Figure 17j,k display the processing results of the full-diameter samples before and after the fracture construction, along with a detailed representation of the fracture morphology.
By comparing the CT scan results of full-size samples before and after fracture formation, the fracture complexity in the actual rock core is higher, especially the cross-fracture, and the aperture and tortuosity of the fracture are significantly different from the ideal model. Table 1 measures the porosity and permeability of eight full-diameter cores before and after fracture formation. After the fractures were formed, only five samples were complete and did not drop, and valid data were extracted.
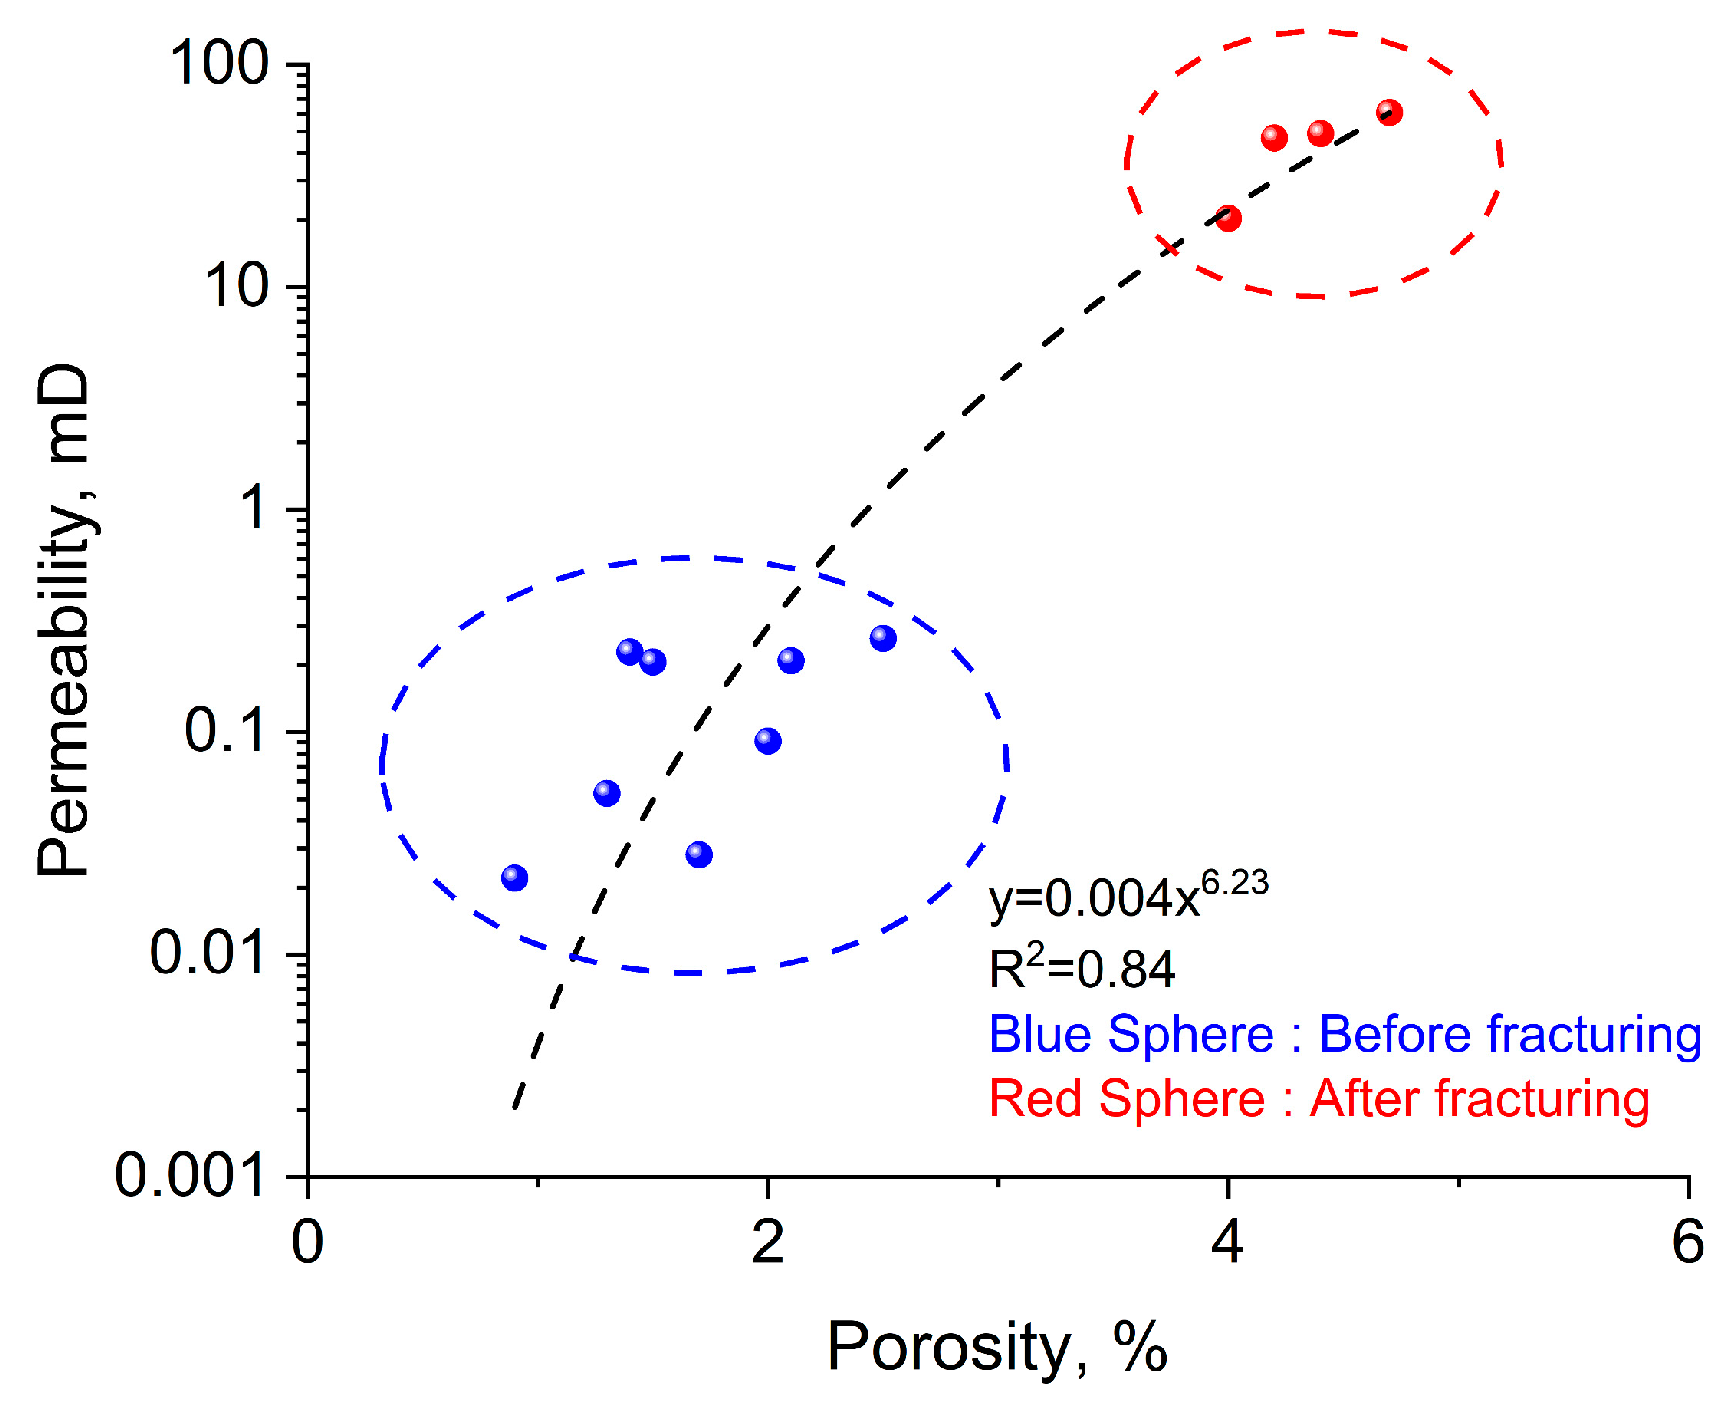
After excluding certain seamless cores and those affected by falling blocks, we first compare the relationship between porosity and permeability for the cores before and after fracturing, as illustrated in Figure 18. Notably, the permeability shows a significant increase following the formation of fractures. Analyzing the permeability variations among the X2, X3, X5, X6, and X7 samples reveals the emergence of two distinct clusters in the cross-plot, with an overall goodness of fit reaching 0.84.

4.3. Comparative Analysis of Simulation and Experiment Results

To verify the validity of the improved single-fracture flat plate model, the formulae used to fit the permeability of the laboratory core, as shown in Figure 16, were compared with Equation (14). Both equations share the same structure, and the coefficients in the numerical simulation results of the theoretical formulae (Figure 7d) closely align with those from the laboratory results. In Equation (14), permeability is positively proportional to the cubic power of the fracture apertures when only the fracture apertures are considered. However, in the actual results, the exponential coefficient for the fracture apertures is 2.51. This discrepancy arises from the challenges in obtaining the tortuosity of the actual core and the complexity of the fracture surfaces.
To further assess the accuracy of the equation, the model was additionally verified using full-diameter core samples. Permeability was calculated by measuring the fracture aperture and angle within these full-diameter core samples, and the results were subsequently compared with the experimental permeability of the cores. Table 2 presents an analytical summary of the verification results for the plate permeability model. The data indicate that the calculated results of the plate fracture permeability model closely align with the core fracture permeability, exhibiting an average absolute error of 11.47 mD and an average relative error of 25.57%. For the dual-fracture samples after fracture formation, we take X5 as a representative case. Utilizing Equation (34), along with the aperture and angles of the two fractures derived from CT scanning results, we calculate a permeability of 114 mD, which significantly exceeds the laboratory measurements. The comparison between the theoretical derivation and experimental results for a single fracture demonstrates consistency, indicating the effectiveness of the model. The CT scan results align well with the principles established through core experiments and the trends explored in this study. However, for intersecting fractures, the model’s calculated permeability is higher than the measured values.

5. Discussion

5.1. Error Analysis of Single-Fracture Model

Building on the classical plate model, this research introduces and validates a permeability calculation model that integrates fracture tortuosity, angle, and aperture, utilizing core experimental data for validation. The identified errors can be summarized as follows.
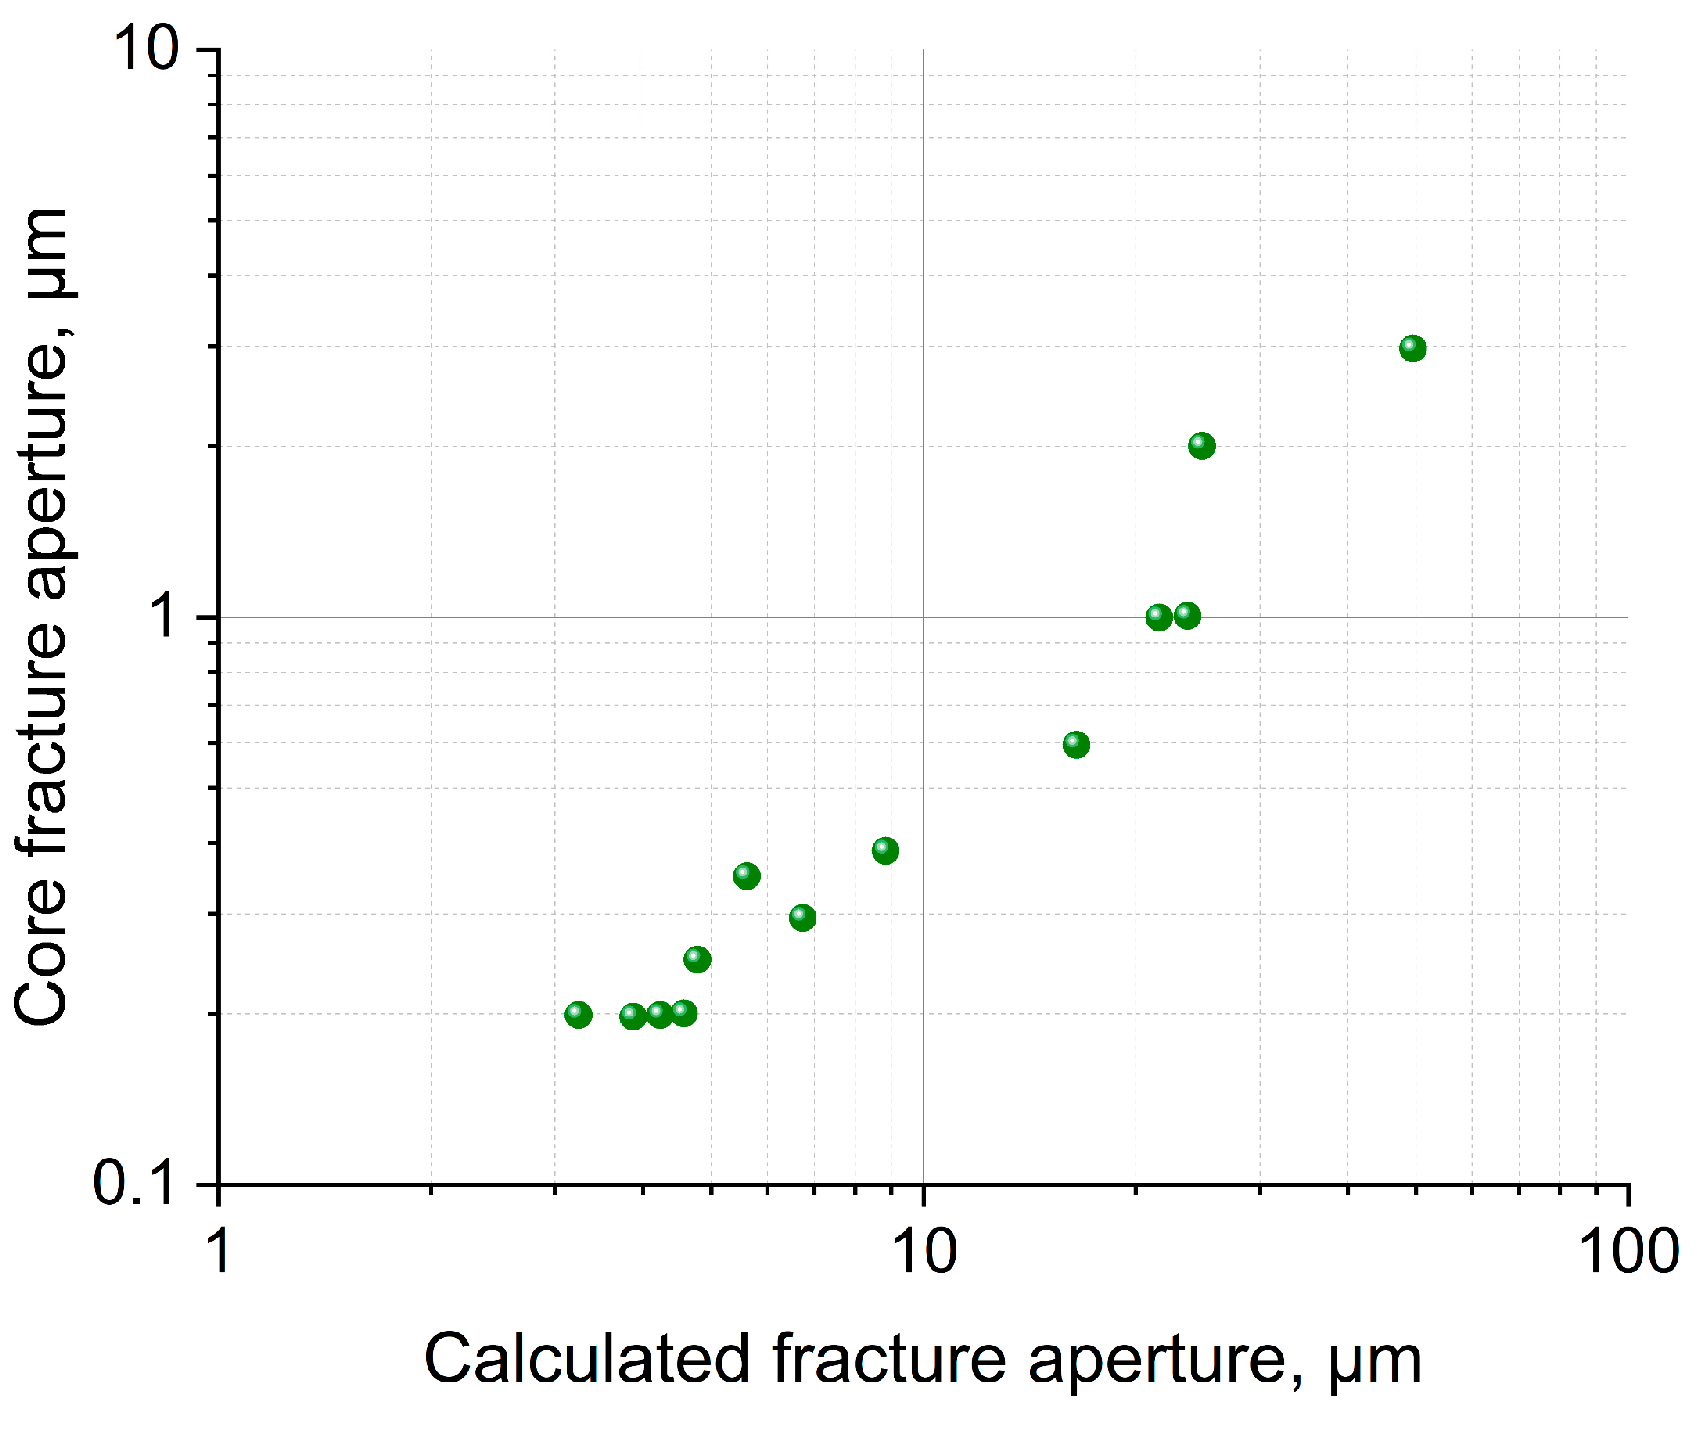
(1) Although Equation (14) aligns formally with the model depicted in Figure 19, there are discrepancies in the coefficients. The theoretical fracture aperture index in Equation (14) is higher, while the coefficient observed in the numerical simulation (Figure 7d) is lower. Although the tortuosity of fractures is not reflected in the experimental data, the irregularities of fractures within the rock samples result in a non-uniform fracture aperture across the core sample, leading to differences between the final fitting results and the theoretical predictions.
(2) In calculating fracture aperture, electrical imaging logging data may be utilized for calibration with actual logging results. Luthi S.M. et al. [50] developed a formula for determining fracture aperture using the finite element method. This method establishes a correlation between the conductivity anomaly at the fracture and the fracture aperture, with the anomalous conductivity represented by a curve. The area under this curve is influenced by both the fracture aperture and the resistivity of the adjacent intrusion zone near the wellbore. Consequently, a formula is derived for the quantitative assessment of crack opening:
  W = c × A 1 × R m b × R x o 1 b
In Equation (35), the parameters b and c represent instrument-specific constants; R m denotes the resistivity of the mud; R x o indicates the resistivity of the wash zone; and A 1 signifies the area of abnormal current.
Using the ERMI instrument as a case study, the calibrated parameters for the fracture aperture formula are b = 0.7 and c = 3.5, which are applied in the calculation of fracture aperture. Figure 15 illustrates a comparison between the calculated values and the core measurements. Figure 15 reveals a substantial relative error between the fracture aperture obtained using the original parameters and the core-derived fracture aperture, highlighting the necessity for calibration. In the context of calculating actual fracture permeability, inaccuracies in the determination of fracture aperture frequently lead to errors in the computed permeability values.
(3) The computation of tortuosity within the fracture formula presents considerable challenges. In porous reservoirs, researchers such as Li et al. [51] have established numerical relationships among the formation factors, cementation index, and tortuosity through rock electrical experiments. They derived the cementation index by assessing the difference between total porosity and connected porosity, which subsequently allowed for the calculation of tortuosity. However, for fractured reservoirs, establishing a similar numerical relationship for tortuosity calculations remains problematic. Currently, most rock electrical experiments are focused on porous sections, while conducting resistivity experiments on fractured sections is complicated by the inability of core samples to meet experimental standards, preventing the establishment of consistent rules. As a result, the calculation of the cementation index largely remains confined to numerical simulation at this stage [52].

5.2. Limitations of the Dual-Fracture Model

The cross-dual-fracture model is generalized based on the single-fracture model, incorporating the mass transfer equation and trigonometric functions. This paper conducts numerical simulations; however, further verification through actual experimental data remains challenging. The study identifies the primary limitations.

5.2.1. Limitations of the Suture Experiment

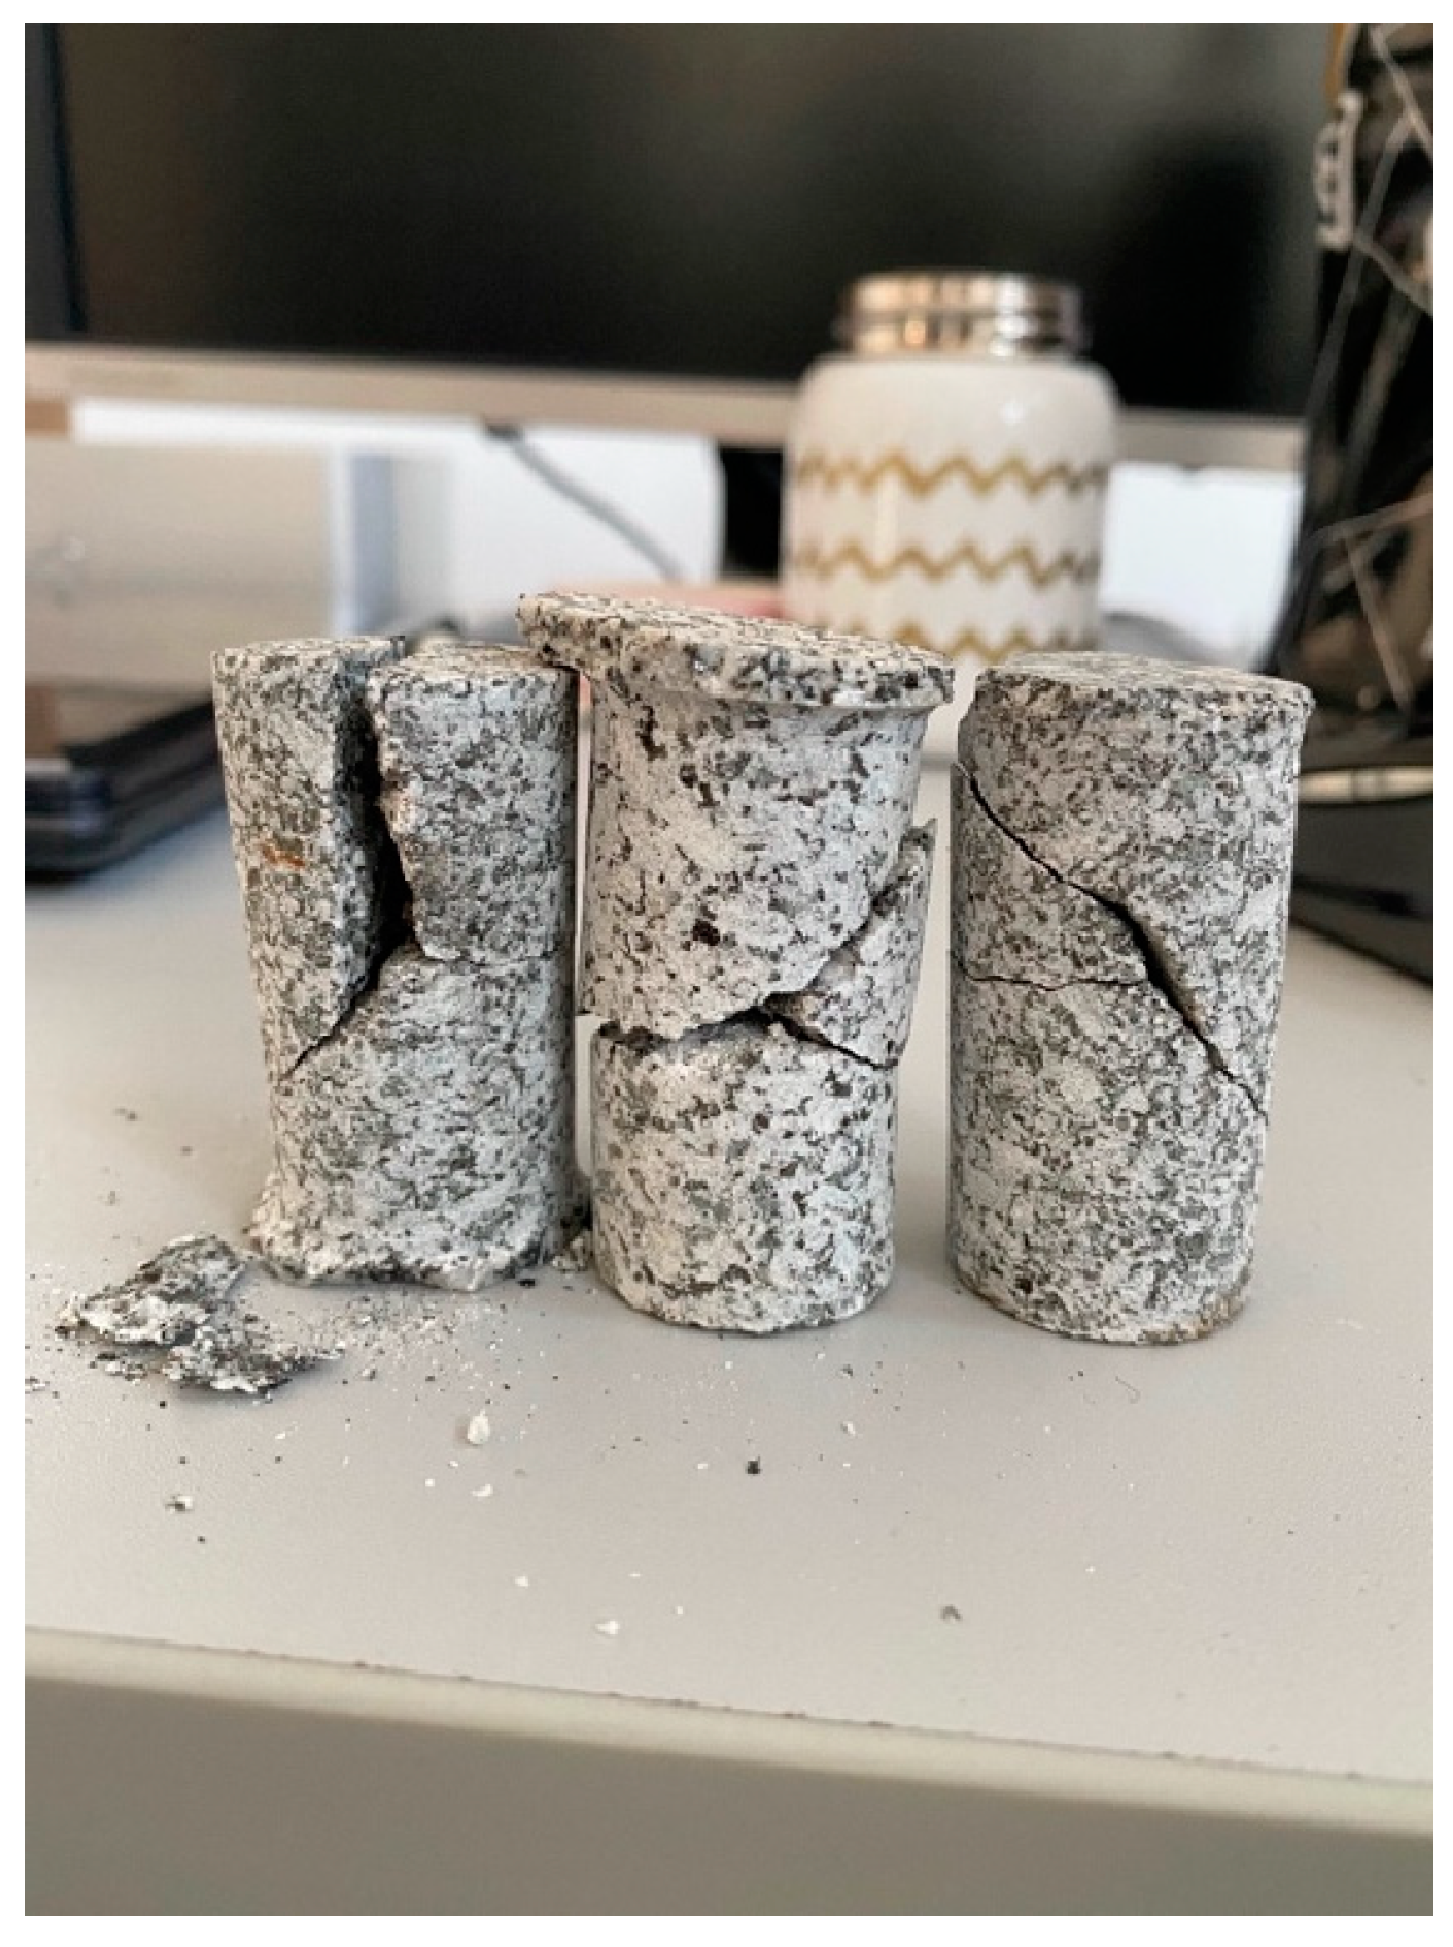
To create fractures in the core, a clamp is gradually tightened to achieve the fracturing process, resulting in artificial fractures that closely resemble the morphology of natural fractures. However, during the actual operation of core fracturing, there are stringent requirements for controlling the crack initiation time and strength, which makes the core susceptible to crushing [53]. As a result, the number of samples collected is limited. Figure 20 illustrates the outcomes of fracturing in artificial fractures, demonstrating the ability to generate fractures at various angles. However, controlling the opening and angle of these fractures proves to be challenging, and there is a significant incidence of core failure.

5.2.2. Differences between the Ideal Fracture Model and Actual Core Characteristics

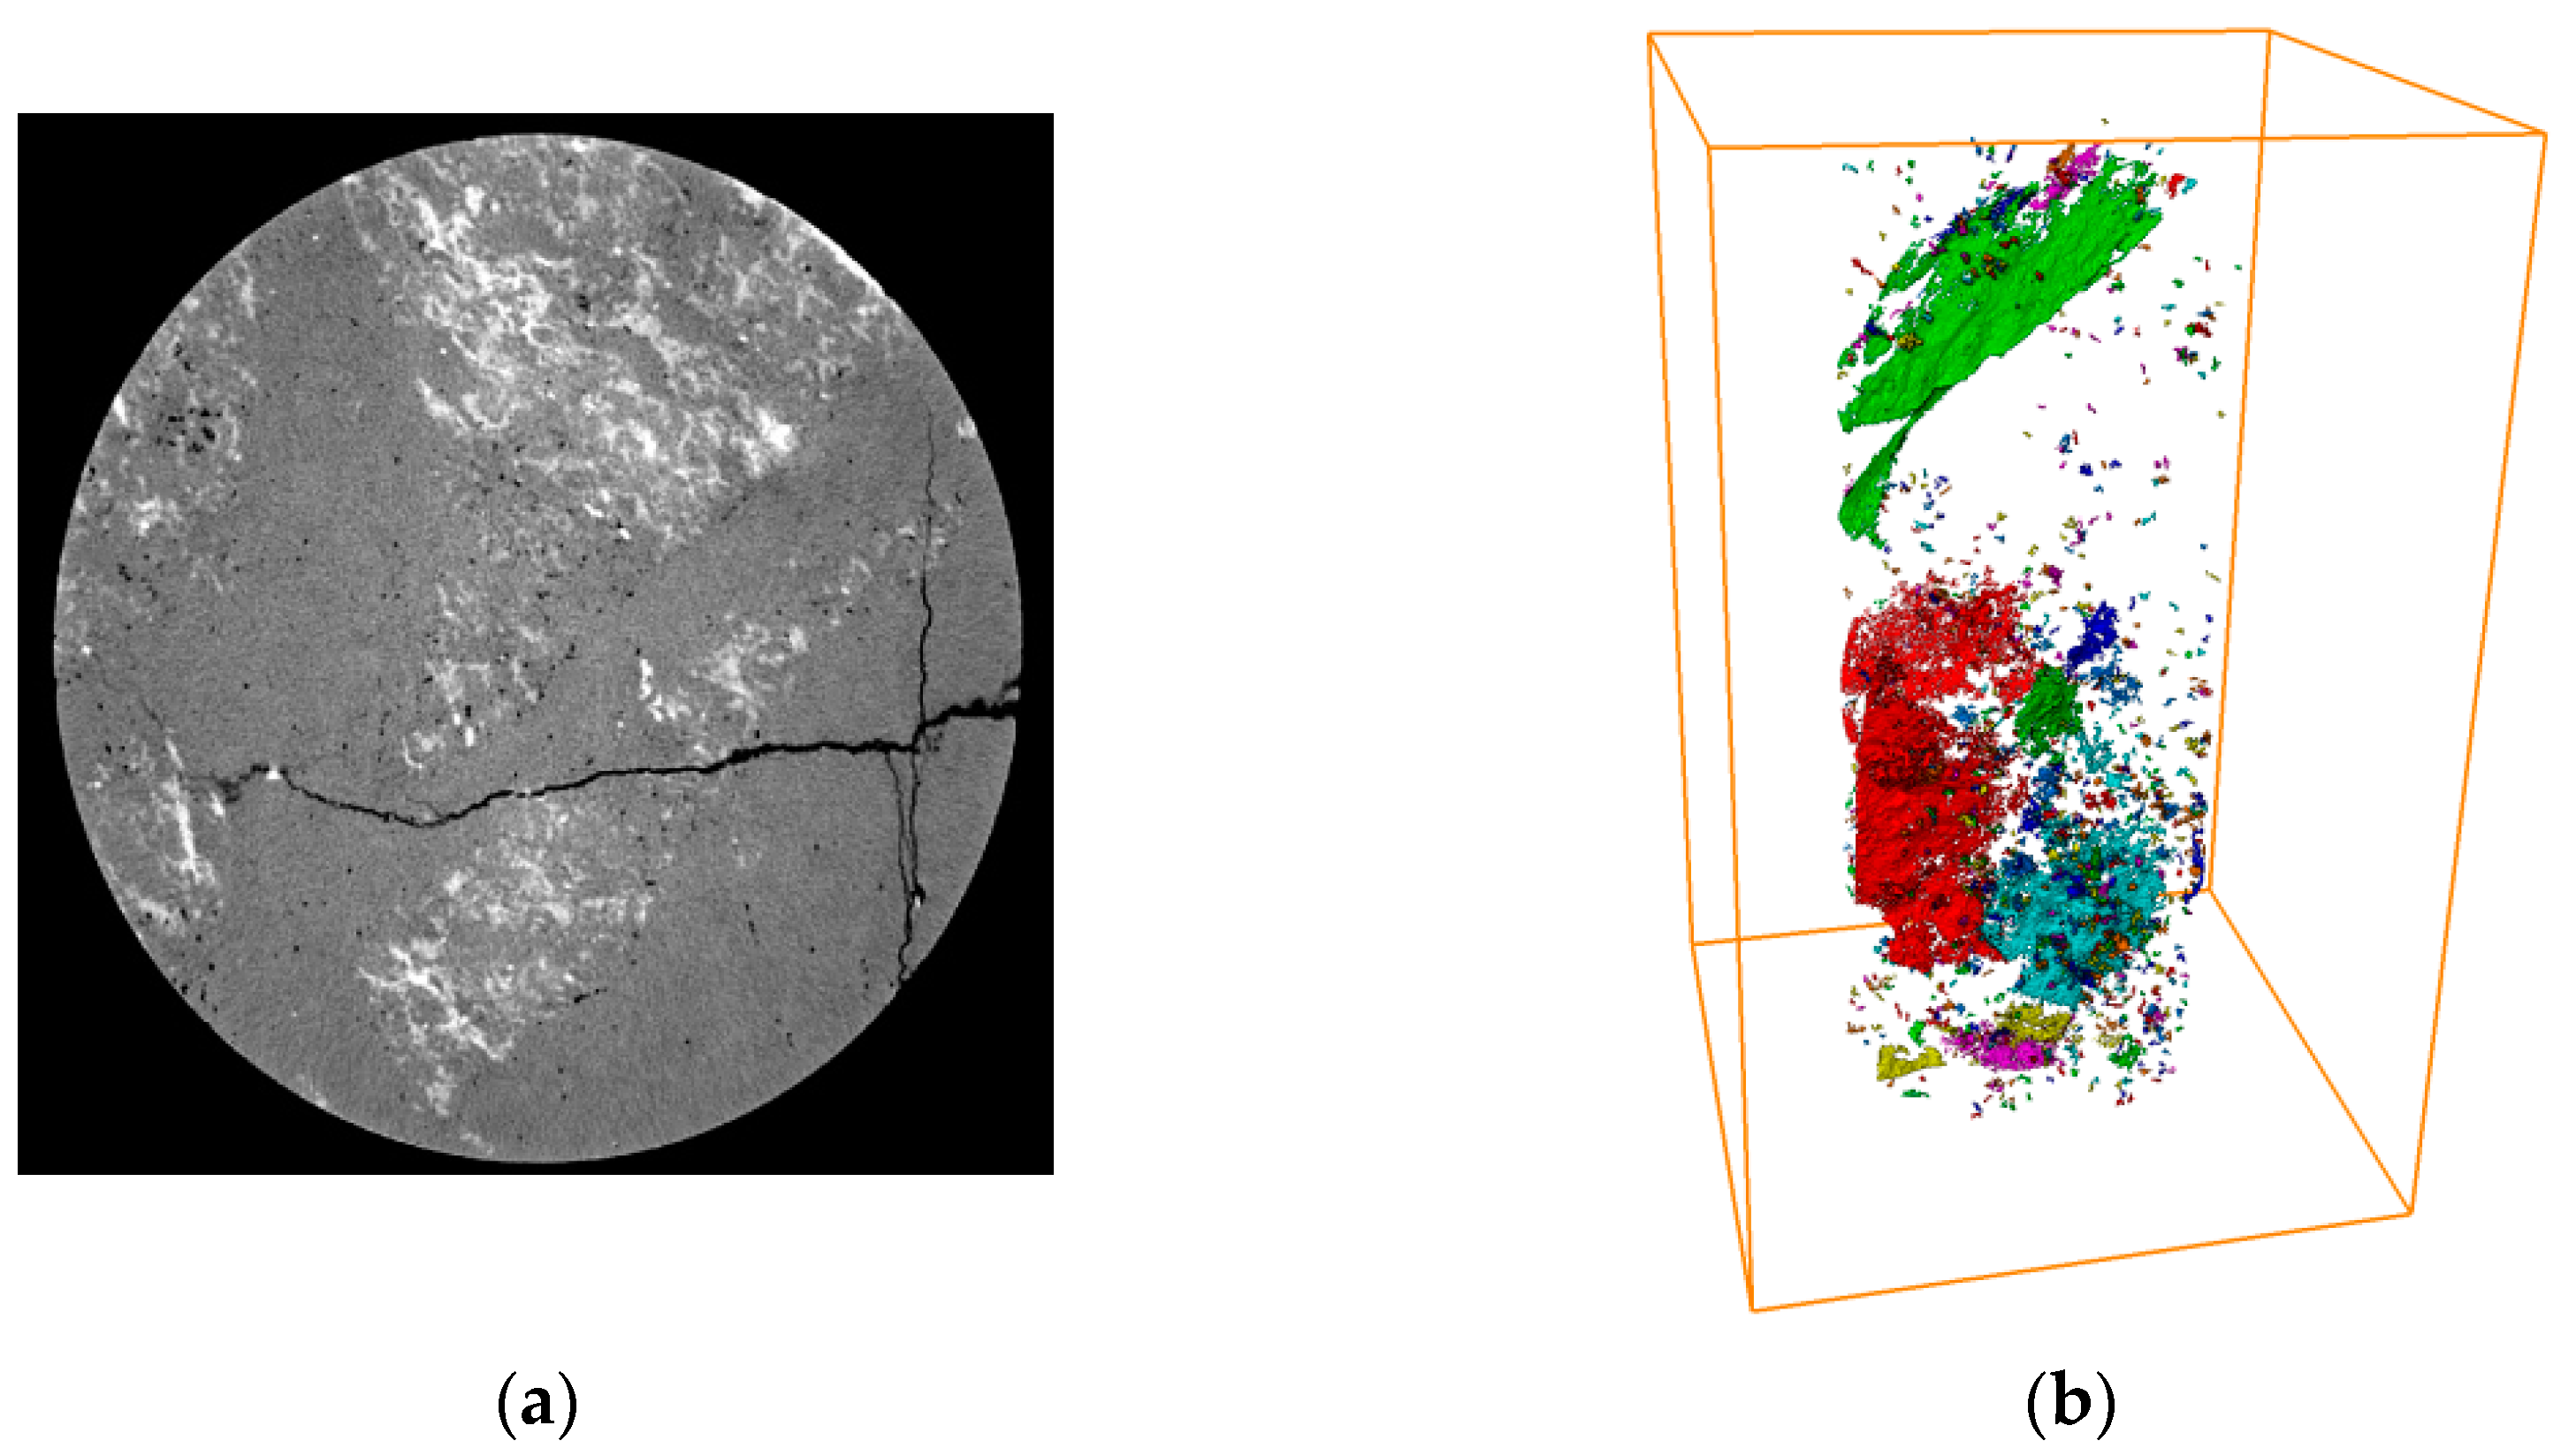
For the cross-fractures observed in the actual core, the model’s calculated results are significantly higher than the measured values. This discrepancy arises from the fact that actual data cannot account for the tortuosity, leading to the assumption that the fracture aperture remains constant. This assumption can be identified as one of the primary sources of error in the analysis. At the same time, the X-CT scan results can be used for further demonstration. Figure 21a illustrates the interface of the X5 sample after fracture formation, while Figure 21b depicts the fracture morphology obtained from CT scanning. Analysis reveals that the fractures in the actual core data exhibit greater complexity, particularly regarding the irregularities of the fracture surfaces, which are not smooth and exhibit variable apertures. Additionally, the quantification of tortuosity poses challenges. These factors can occasionally contribute to increased discrepancies in the results.

5.2.3. Limitations of Logging Methods in Evaluating Cross-Fracture Permeability

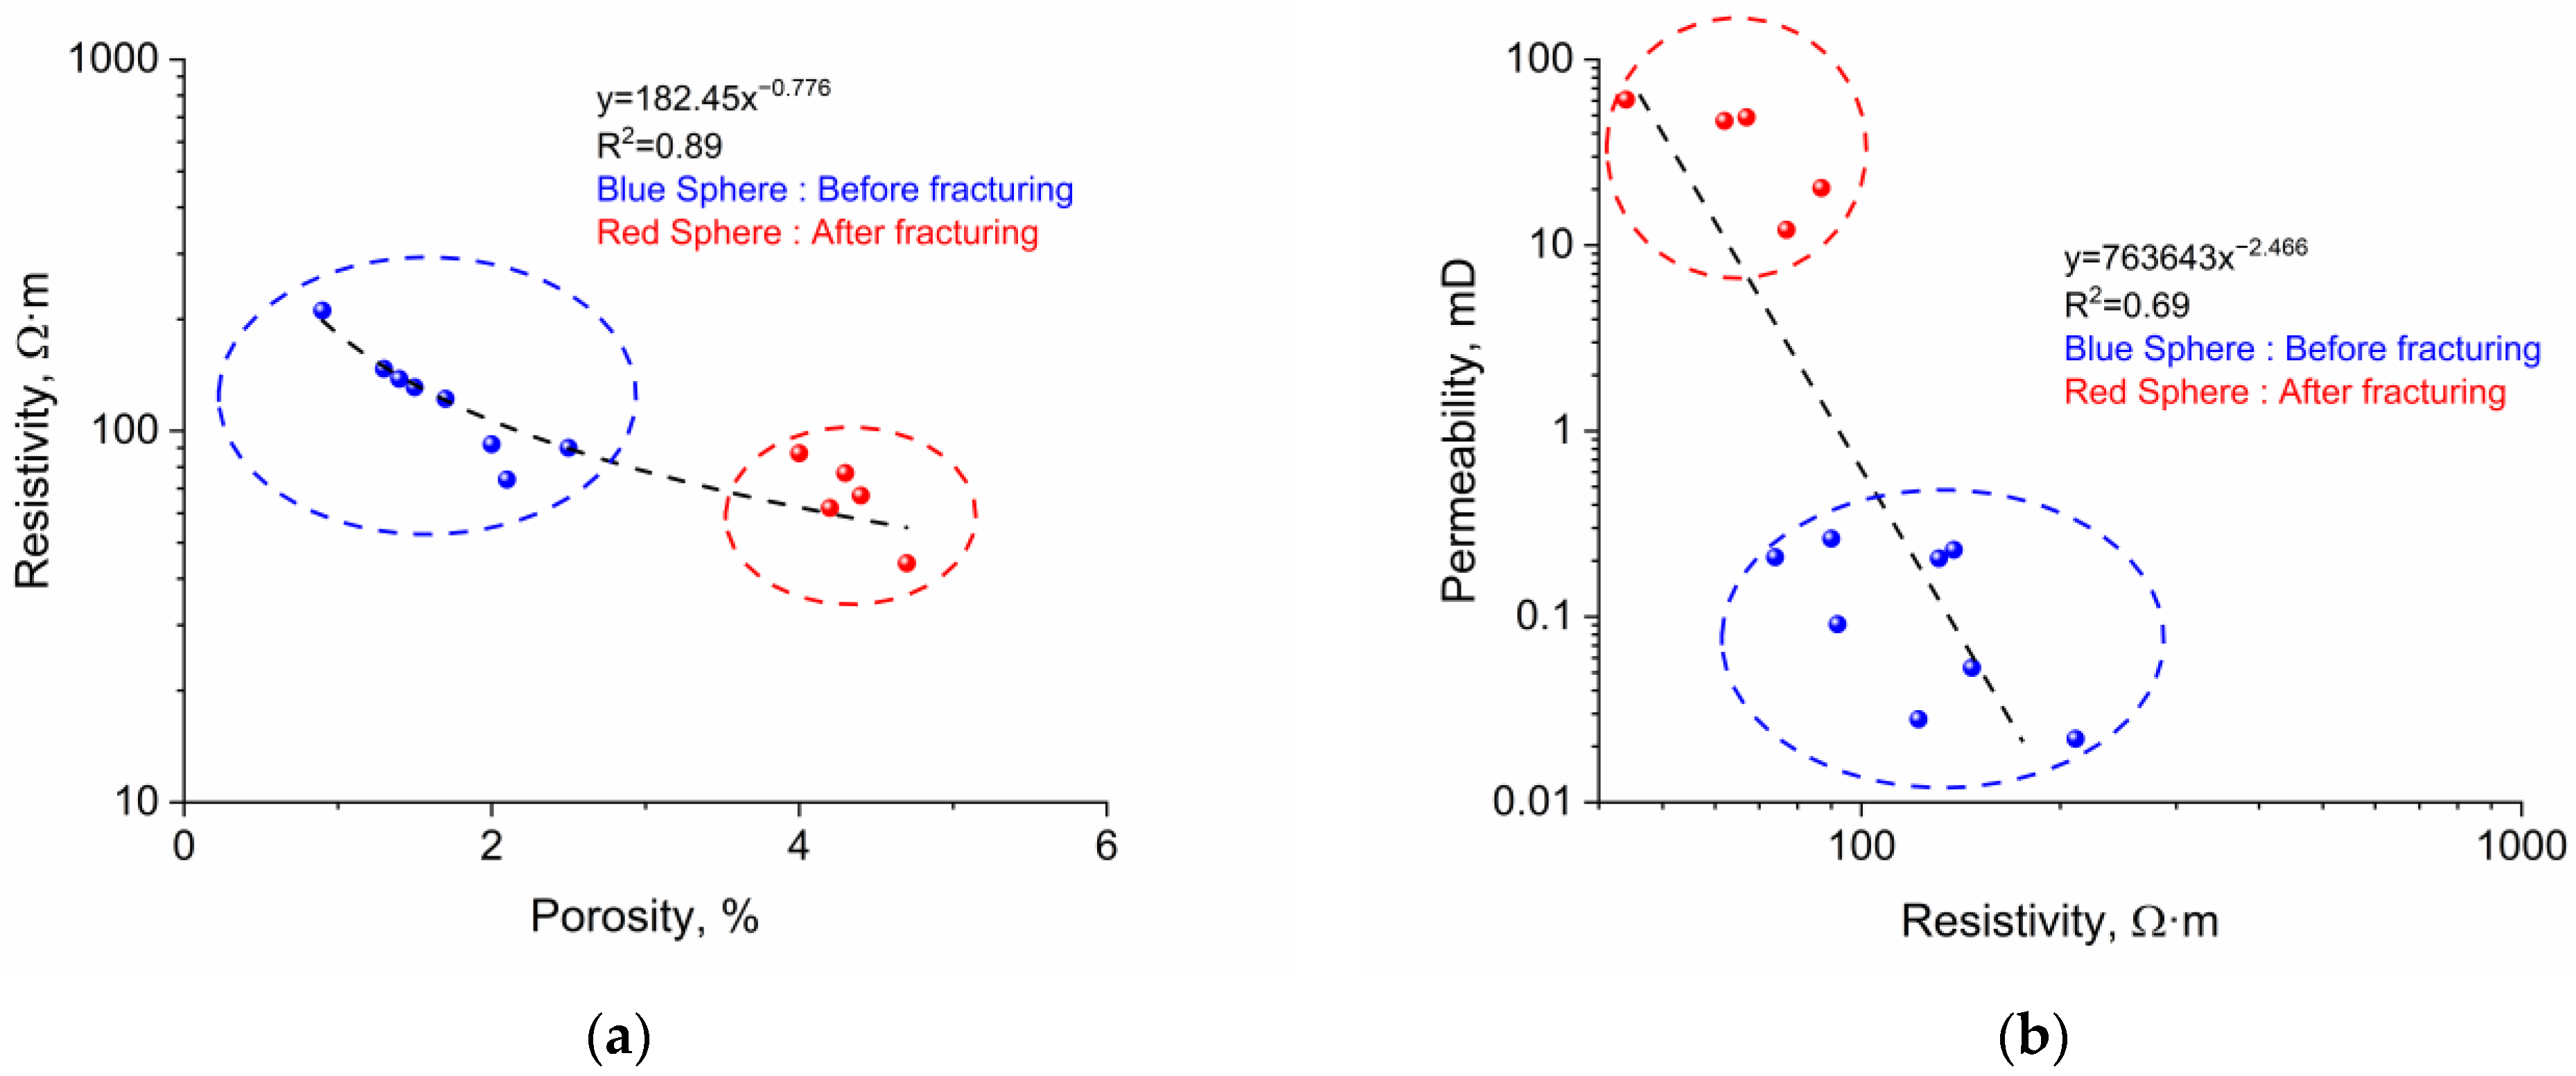
Simultaneously, it must be considered that in practical exploration, logging information is commonly used to evaluate fracture segments and calculate permeability. The resistivity of the core was measured both before and after fracturing, revealing a strong correlation with fracture porosity, with a goodness of fit reaching 0.89 (Figure 22a). Additionally, owing to the established relationship between porosity and permeability, the goodness of fit between resistivity and permeability was found to be 0.69 (Figure 22b). This finding aligns with the perspective of Zheng et al. [54], who suggest that resistivity data can be utilized to predict parameters related to fracture occurrence. However, it is important to note that discrepancies exist between core measurement techniques and logging data acquisition methods, which introduces several limitations to the direct application of these findings. The actual resistivity response is influenced by multiple coupled factors, making it significantly more complex than laboratory measurements. Additionally, the fluids present in the reservoir must be considered, as they also affect resistivity. Furthermore, the presence of high-angle fractures in intersecting fractures can lead to non-unique solutions in the results [54].

6. Conclusions

This study proposes a novel fracture permeability evaluation model based on the classical planar fracture model, specifically tailored for marine granite reservoirs. The model effectively incorporates the heterogeneity of fractures, accounting for factors such as tortuosity, fracture angle, and aperture, thus enhancing traditional models. Additionally, building upon the single-fracture model, we introduce mass transfer equations and trigonometric functions to develop a dual-crossed fracture model.
By integrating numerical simulations with experiments on full-diameter core samples, we validate the effectiveness of the proposed model. The results indicate that the single-fracture model aligns well with actual experimental data in predicting fracture permeability, demonstrating its practical applicability. Depending on the fracture aperture, when the fracture aperture varies from 90 μm to 130 μm, the permeability values derived from the laboratory tests range from 30 mD to 1300 mD. When the results calculated by the model derived in this paper are compared with the actual measurements, the average absolute error is 11.47 mD, and the relative error is 25.57%, which demonstrates the validity of the model deduced in this paper.
In the case of the dual-crossed fracture model, we elucidate the influence of fracture aperture, relative positioning of the two fractures, and intersection points on permeability. To address the complexities associated with crossed fractures, we employ X-ray computed tomography (X-CT) scanning technology to extract and compute fracture parameters. Although the calculated results from the model exceed the actual measurements, the application of digital core technology confirms that this discrepancy arises from the inherent complexity of fractures in the actual rock samples. Furthermore, we investigate the sensitivity of resistivity in permeability calculations.
The current challenges in this research include the preparation of dual-fracture cores, the computation of tortuosity, and the direct application of simulation results to experimental data.
In summary, the proposed fracture permeability evaluation model offers new insights for theoretical research and provides practical solutions for engineering applications, thus advancing the scientific study and development of fractured reservoirs. Future research could further explore the model’s applicability across various geological conditions and optimize parameter extraction methods to enhance the accuracy of permeability assessments.

Author Contributions

Conceptualization, J.G. and Z.Z. (Zhansong Zhang); Methodology, J.G. and H.L.; Software, H.L. and Z.Z.; Validation, J.G., B.G. and H.L.; Formal analysis, J.G.; Investigation, B.G.; Resources, Z.Z. (Zhansong Zhang); Data curation, Z.Z. (Zhansong Zhang); Writing—original draft, J.G.; Writing—review & editing, J.G. and Z.Z. (Zuomin Zhu); Supervision, Z.Z. (Zuomin Zhu); Project administration, Z.Z. (Zhansong Zhang); Funding acquisition, J.G. All authors have read and agreed to the published version of the manuscript.

Funding

This work was financially sponsored by Open Fund of Key Laboratory of Exploration Technologies for Oil and Gas Resources, Ministry of Education (No. K2023–02).

Institutional Review Board Statement

Not applicable.

Informed Consent Statement

Not applicable.

Data Availability Statement

All our data are displayed in the pictures in the paper.

Acknowledgments

The authors would like to express their most sincere gratitude to the field workers in the oil field, Xin Nie, and CNOOC workers.

Conflicts of Interest

Author Baoxiang Gu was employed by the company CNOOC International Limited. The remaining authors declare that the research was conducted in the absence of any commercial or financial relationships that could be construed as a potential conflict of interest.

References

  1. Dong, Z.; Aifen, L.; Qiang, S.; Yangqing, F. Measuring oil and water relative permeability in a single fracture and researching its impacting factors. Petrol. Sci. Technol. 2013, 31, 2191–2201. [Google Scholar] [CrossRef]
  2. Chen, H.; Li, H.; Li, Z.; Li, S.; Wang, Y.; Wang, J.; Li, B. Effects of matrix permeability and fracture on production characteristics and residual oil distribution during flue gas flooding in low permeability/tight reservoirs. J. Petrol. Sci. Eng. 2020, 195, 107813. [Google Scholar] [CrossRef]
  3. Huang, X.; Kang, Z.; Zhao, J.; Wang, G.; Zhang, H.; Yang, D. Experimental investigation on micro-fracture evolution and fracture permeability of oil shale heated by water vapor. Energy 2023, 277, 127677. [Google Scholar] [CrossRef]
  4. Zhang, Y.; Hou, S.; Mei, S.; Zhao, T.; Li, D. Experimental study of permeability-hydraulic fracturing characteristics of tight rocks. Geomech. Geophys. Geo-Energy Geo-Resour. 2022, 8, 182. [Google Scholar] [CrossRef]
  5. Li, X.; Yang, Z.; Li, S.; Huang, W.; Zhan, J.; Lin, W. Reservoir characteristics and effective development technology in typical low-permeability to ultralow-permeability reservoirs of China National Petroleum Corporation. Energy Explor. Exploit. 2021, 39, 1713–1726. [Google Scholar] [CrossRef]
  6. Gale, J.F.W.; Laubach, S.E.; Olson, J.E.; Eichhubl, P.; Fall, A. Natural fractures in shale: A review and new observations. AAPG Bull. 2014, 98, 2165–2216. [Google Scholar] [CrossRef]
  7. Wang, S.; Elsworth, D.; Liu, J. Permeability evolution in fractured coal: The roles of fracture geometry and water-content. Int. J. Coal Geol. 2011, 87, 13–25. [Google Scholar] [CrossRef]
  8. Ghanizadeh, A.; Clarkson, C.R.; Aquino, S.; Ardakani, O.H.; Sanei, H. Petrophysical and geomechanical characteristics of Canadian tight oil and liquid-rich gas reservoirs: II. Geomechanical property estimation. Fuel 2015, 153, 682–691. [Google Scholar] [CrossRef]
  9. Guo, J.; Zhang, Z.; Xiao, H.; Zhang, C.; Zhu, L.; Wang, C. Quantitative interpretation of coal industrial components using a gray system and geophysical logging data: A case study from the Qinshui Basin, China. Front. Earth Sci. 2023, 10, 1031218. [Google Scholar] [CrossRef]
  10. Zhang, H.; Ait Abderrahmane, H.; Arif, M.; Al Kobaisi, M.; Sassi, M. Influence of heterogeneity on carbonate permeability upscaling: A renormalization approach coupled with the pore network model. Energy Fuels 2022, 36, 3003–3015. [Google Scholar] [CrossRef]
  11. Nabawy, B.S.; Géraud, Y.; Rochette, P.; Bur, N. Pore-throat characterization in highly porous and permeable sandstones. AAPG Bull. 2009, 93, 719–739. [Google Scholar] [CrossRef]
  12. Taghipour, S.A.; Hoseinpour, S.A.; Soltani, B.; Bahadori, A. Accurate estimation of formation permeability by means of petrophysical logs. Petrol. Sci. Technol. 2017, 35, 718–725. [Google Scholar] [CrossRef]
  13. Aghli, G.; Moussavi-Harami, R.; Mohammadian, R. Reservoir heterogeneity and fracture parameter determination using electrical image logs and petrophysical data (a case study, carbonate Asmari Formation, Zagros Basin, SW Iran). Petrol. Sci. 2020, 17, 51–69. [Google Scholar] [CrossRef]
  14. Kozeny, J. Ueber kapillare leitung des wassers im boden. Sitzungsberichte Akad. Wiss. Wien 1927, 136, 271–306. [Google Scholar]
  15. Wu, F.; Fan, Q.; Huang, D.; Ma, L.; Liang, X.; Sima, L. Predicting gas–water relative permeability using nuclear magnetic resonance and mercury injection capillary pressure measurements. J. Nat. Gas Sci. Eng. 2016, 32, 35–47. [Google Scholar] [CrossRef]
  16. Zhu, L.; Zhang, C.; Wei, Y.; Zhang, C. Permeability prediction of the tight sandstone reservoirs using hybrid intelligent algorithm and nuclear magnetic resonance logging data. Arab. J. Sci. Eng. 2017, 42, 1643–1654. [Google Scholar] [CrossRef]
  17. Piscopo, V.; Baiocchi, A.; Lotti, F.; Ayan, E.A.; Biler, A.R.; Ceyhan, A.H.; Cüylan, M.; Dişli, E.; Kahraman, S.; Taşkın, M. Estimation of rock mass permeability using variation in hydraulic conductivity with depth: Experiences in hard rocks of western Turkey. Bull. Eng. Geol. Environ. 2018, 77, 1663–1671. [Google Scholar] [CrossRef]
  18. Jiang, X.; Wang, X.; Wan, L. Semi-empirical equations for the systematic decrease in permeability with depth in porous and fractured media. Hydrogeol. J. 2010, 18, 839–850. [Google Scholar] [CrossRef]
  19. Achtziger-Zupančič, P.; Loew, S.; Mariethoz, G. A new global database to improve predictions of permeability distribution in crystalline rocks at site scale. J. Geophys. Res. Solid Earth 2017, 122, 3513–3539. [Google Scholar] [CrossRef]
  20. Tang, X.; Zhou, W.; Yang, W.; Zhang, C.; Zhang, C. An improved method in petrophysical rock typing based on mercury-injection capillary pressure data. Energy Sources Part A 2020, 2020, 1–16. [Google Scholar] [CrossRef]
  21. Chen, L.; Jiang, Z.; Liu, Q.; Jiang, S.; Liu, K.; Tan, J.; Gao, F. Mechanism of shale gas occurrence: Insights from comparative study on pore structures of marine and lacustrine shales. Mar. Pet. Geol. 2019, 104, 200–216. [Google Scholar] [CrossRef]
  22. Kenyon, W.E.; Day, P.I.; Straley, C.; Willemsen, J.F. A three-part study of NMR longitudinal relaxation properties of water-saturated sandstones. SPE Form. Eval. 1988, 3, 622–636. [Google Scholar] [CrossRef]
  23. Morriss, C.E.; Maclnnis, J.; Freedman, R.; Smaardyk, J.; Straley, C.; Kenyon, W.E.; Vinegar, H.S.; Tutunjian, P.N. Field test of an experimental pulsed nuclear magnetism tool. In Proceedings of the SPWLA Annual Logging Symposium, Calgary, AB, Canada, 13 June 1993. Paper ID. SPWLA-1993-GGG. [Google Scholar]
  24. Timur, A. An investigation of permeability, porosity, and residual water saturation relationships. In Proceedings of the SPWLA Annual Logging Symposium, New Orleans, LA, USA, 23 June 1968. Paper ID. SPWLA-1968-J. [Google Scholar]
  25. Coates, G.R.; Xiao, L.; Prammer, M.G. NMR Logging. Principles and Interpretation; Halliburton Energy Service: Huston, TX, USA, 1999. [Google Scholar]
  26. Prince, C.M.; Steele, D.D.; Devier, C.A. Permeability estimation in tight gas sands and shales using NMR—A new interpretive methodology. In Proceedings of the 9th AAPG International Conference and Exhibition, Rio de Janeiro, Brazil, 15–18 November 2009. [Google Scholar]
  27. Rezaee, R.; Saeedi, A.; Clennell, B. Tight gas sands permeability estimation from mercury injection capillary pressure and nuclear magnetic resonance data. J. Petrol. Sci. Eng. 2012, 88, 92–99. [Google Scholar] [CrossRef]
  28. Hossain, Z.; Grattoni, C.A.; Solymar, M.; Fabricius, I.L. Petrophysical properties of greensand as predicted from NMR measurements. Petrol. Geosci. 2011, 17, 111–125. [Google Scholar] [CrossRef]
  29. Wu, F.; Li, Y.; Burnham, B.; Zhang, Z.; Yao, C.; Yuan, L.; Zhang, F.; Deng, H.; Xi, Y.; He, J. Fractal-based NMR permeability estimation in tight sandstone: A case study of the Jurassic rocks in the Sichuan Basin, China. J. Petrol. Sci. Eng. 2022, 218, 110940. [Google Scholar] [CrossRef]
  30. Xia, F.; Su, Y.; Tang, X. Stoneley wave reflection and transmission across permeable formations and fractured zones: Comparison of analytical and numerical modeling results. Chin. J. Geophys. 2022, 65, 1508–1518. [Google Scholar]
  31. Guo, J.; Zhang, Z.; Nie, X.; Zhao, Q.; Lv, H. Logging Evaluation of Irreducible Water Saturation: Fractal Theory and Data-Driven Approach—Case Study of Complex Porous Carbonate Reservoirs in Mishrif Formation. Fractal. Fract. 2024, 8, 487. [Google Scholar] [CrossRef]
  32. Tian, Y.; Wang, G.; Li, H.; Huang, Y.; Zhao, F.; Guo, Y.; Gao, J.; Lai, J. A novel deep learning method based on 2-D CNNs and GRUs for permeability prediction of tight sandstone. Geoenergy Sci. Eng. 2024, 238, 212851. [Google Scholar] [CrossRef]
  33. Li, N.; Wang, K.; Lu, J.; Liu, P.; Xiao, C.; Wu, H.; Guo, Q.; Fan, H.; Men, B.; Feng, Z.; et al. First successful downhole testing of the permeability logging prototype. J. Geophys. Eng. 2024, 21, 1179–1182. [Google Scholar] [CrossRef]
  34. Moinfar, A.; Varavei, A.; Sepehrnoori, K.; Johns, R.T. Development of an efficient embedded discrete fracture model for 3D compositional reservoir simulation in fractured reservoirs. SPE J. 2014, 19, 289–303. [Google Scholar] [CrossRef]
  35. Zhang, H.; Hu, Y.; Li, X.; Du, K.; Zeng, T.; Li, C. Application of support vector machines and genetic algorithms to fluid identification in Offshore Granitic subduction hill reservoirs. Geoenergy Sci. Eng. 2024, 240, 213013. [Google Scholar] [CrossRef]
  36. Li, Z.; Guo, J.; Wu, S. Characteristics and Genetic Mechanism of Granite Weathering Crust of Songnan Low Uplift, Qiongdongnan Basin, South China Sea. Minerals 2024, 14, 512. [Google Scholar] [CrossRef]
  37. Bisdom, K.; Bertotti, G.; Nick, H.M. The impact of different aperture distribution models and critical stress criteria on equivalent permeability in fractured rocks. J. Geophys. Res. Solid Earth 2016, 121, 4045–4063. [Google Scholar] [CrossRef]
  38. Zhang, B.; Deng, Z.; Fu, X.; Yu, K.; Zeng, F.B. An experimental study on the effects of acidization on coal permeability: Implications for the enhancement of coalbed methane production. Energy 2023, 280, 128145. [Google Scholar] [CrossRef]
  39. Nakagawa, S.; Nakashima, S.; Korneev, V.A. Laboratory measurements of guided-wave propagation within a fluid-saturated fracture. Geophys. Prospect. 2015, 64, 143–156. [Google Scholar] [CrossRef]
  40. Jiao, Y.; Wang, Y.; Feng, D.; Gong, J.; Niu, Y.; Hu, S.; Ren, J. Laboratory study on fluid-induced fracture slip and permeability evolution in marble fractures. Rock Mech. Rock Eng. 2023, 56, 2497–2513. [Google Scholar] [CrossRef]
  41. Aziz, A. A similarity solution for laminar thermal boundary layer over a flat plate with a convective surface boundary condition. Commun. Nonlinear Sci. 2009, 14, 1064–1068. [Google Scholar] [CrossRef]
  42. Niessner, J.; Berg, S.; Hassanizadeh, S.M. Comparison of two-phase Darcy’s law with a thermodynamically consistent approach. Transport. Porous. Med. 2011, 88, 133–148. [Google Scholar] [CrossRef]
  43. Pouya, A.; Vu, M.N. Fluid flow and effective permeability of an infinite matrix containing disc-shaped cracks. Adv. Water Resour. 2012, 42, 37–46. [Google Scholar] [CrossRef]
  44. Su, H.; Zhang, Y.; Xiao, B.; Huang, X.; Yu, B. A fractal-monte carlo approach to model oil and water two-phase seepage in low-permeability reservoirs with rough surfaces. Fractals 2021, 29, 2150003. [Google Scholar] [CrossRef]
  45. Teruel, F.E. Characterization of a porous medium employing numerical tools: Permeability and pressure-drop from Darcy to turbulence. Int. J. Heat Mass Tran. 2009, 52, 5878–5888. [Google Scholar] [CrossRef]
  46. Ahmia, A.C.; Idouhar, M.; Wongwailikit, K.; Dietrich, N.; Hébrard, G. Impact of cellulose and surfactants on mass transfer of bubble columns. Chem. Eng. Technol. 2019, 42, 2465–2475. [Google Scholar] [CrossRef]
  47. Li, X.; Qin, R.; Wei, D.; Cao, J.; Wang, P.; Ye, X.; Yin, Z. Research progress in logging evaluation of offshore buried-hill fractured reservoirs in China. China Offshore Oil Gas 2023, 35, 69–82. [Google Scholar]
  48. Li, X.; Qin, R.; Cao, J.; Wang, P.; Liu, X.; Ping, H. Method of connected porosity evaluation and quantitative permeability calculation for complex reservoirs. Oil Geophys. Prospect. 2022, 57, 377–385. [Google Scholar]
  49. Li, B.; Nie, X.; Cai, J.; Zhou, X.; Wang, C.; Han, D. U-Net model for multi-component digital rock modeling of shales based on CT and QEMSCAN images. J. Petrol. Sci. Eng. 2022, 216, 110734. [Google Scholar] [CrossRef]
  50. Plumb, R.A.; Luthl, S.M. Analysis of borehole images and their application to geologic modeling of an eolian reservoir. SPE Form. Eval. 1989, 4, 505–514. [Google Scholar] [CrossRef]
  51. Li, X.; Qin, R.; Cao, J.; Wang, P.; Ye, X.; Yin, Z. Dolomite reservoir characteristics and permeability evaluation methods: An example from the Paleogene, Mesopotamian basin, Iraq. China Offshore Oil Gas 2024, 36, 81–94. [Google Scholar]
  52. Qin, Z.; Wu, J.; Wang, C.; Luo, S.; Yang, H.; Su, K.; Luo, Y.; Liu, L.; Zhu, Y.; Wei, K.; et al. A novel calculation model, characteristics and applications of Archie’s cementation exponent in dual porosity reservoirs with intersecting dual fractures. Geoenergy Sci. Eng. 2023, 231, 212390. [Google Scholar] [CrossRef]
  53. Zhu, Z.; Cui, L.; Dong, Y.; Sheng, Q.; Tian, K.; Guo, Z. A Novel Deformation Analytical Solution and Constitutive Model for Fractured Rock Masses. J. Mar. Sci. Eng. 2023, 11, 2351. [Google Scholar] [CrossRef]
  54. Zheng, H.; Zhang, Z.; Guo, J.; Fang, S.; Wang, C. Numerical Simulation Study on the Influence of Cracks in a Full-Size Core on the Resistivity Measurement Response. Energies 2024, 17, 1386. [Google Scholar] [CrossRef]
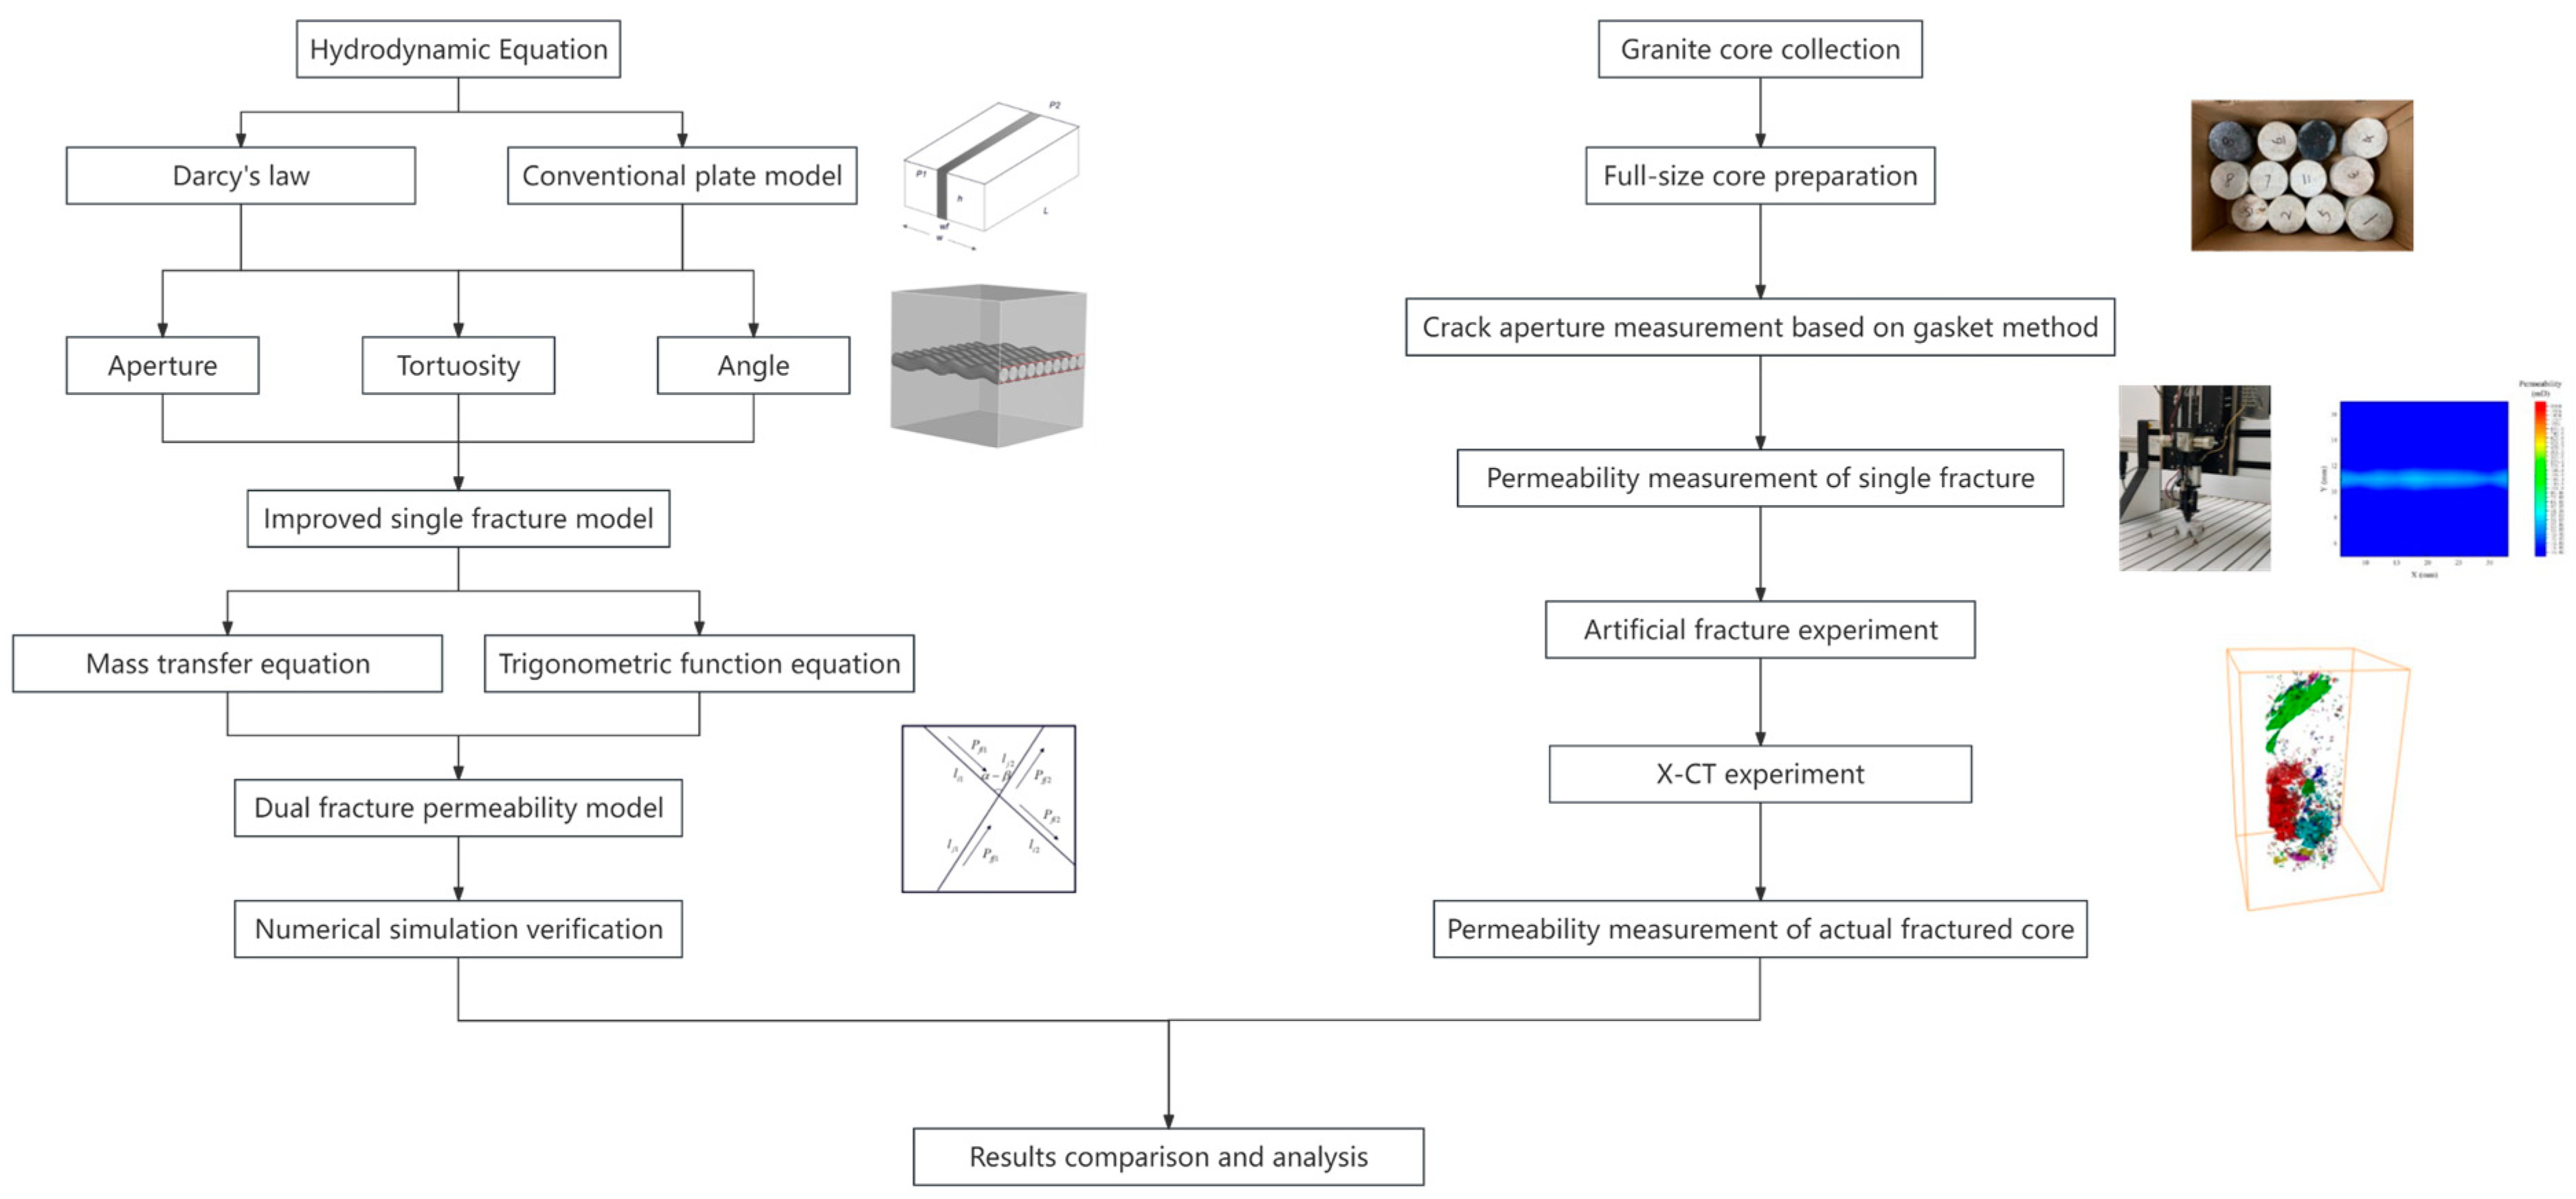
Figure 1. Flow chart of this research.
Jmse 12 01868 g001
Figure 2. The classic flat plate fracture model.
Jmse 12 01868 g002
Figure 3. Flow diagram of curved roar.
Jmse 12 01868 g003
Figure 4. A sketch of roars and fractures. (a) A diagram of the curved connected pores in the rock mass; (b) The fracture in the fractured reservoir is regarded as a plane composed of n connected pores.
Jmse 12 01868 g004
Figure 5. A schematic diagram of laminar flow of liquid in an equal-diameter pipe.
Jmse 12 01868 g005
Figure 6. Model diagram of cross-fractures. (a) The case where fracture i with an inclination angle of α intersects fracture j with an inclination angle of β ; (b) Pressure conduction diagram of cross-fractures.
Jmse 12 01868 g006
Figure 7. Numerical simulation results of single fracture. (a) Fracture porosity vs. permeability in homogeneous reservoir; (b) Fracture tortuosity vs. permeability (constant angle and aperture); (c) Fracture angle vs. permeability (constant tortuosity and aperture); (d) Fracture aperture vs. permeability (constant tortuosity and angle).
Jmse 12 01868 g007
Figure 8. Numerical simulation results of cross-fractures. (a) Two diagonally crossed fractures in the discrete fracture model under ideal conditions; (b) Relationship between fracture opening and rock mass permeability at fixed cross-fracture angles; (c) Model with one fixed fracture and the angle of the other increasing from 1° to 45°; (d) Relationship between fracture angle and rock mass permeability with varying single-fracture angle; (e) Model with fixed angles and radial horizontal movement of one fracture, shifting the intersection point; (f) Relationship between the relative position of the intersection and rock mass permeability.
Jmse 12 01868 g008
Figure 9. Granite sample collection. (a) Outcrop rock samples; (b) Outcrop sample collection.
Jmse 12 01868 g009
Figure 10. Full-diameter core drilling schematic diagram. (a) Drilling the operating table; (b) Core drilling finished product.
Jmse 12 01868 g010
Figure 11. Plate model apparatus diagram. (a) Flat plate model diagram; (b) Gasket schematic diagram; (c) Schematic diagram of the gripper.
Jmse 12 01868 g011
Figure 12. AUTOSCAN-II Core multifunctional scanner.
Jmse 12 01868 g012
Figure 13. Artificial fracture experiment process.
Jmse 12 01868 g013
Figure 14. X-CT scan imaging layout diagram.
Jmse 12 01868 g014
Figure 15. Experimental results of core permeability. (a) Measurement results for a core fracture aperture of 90 μm; (b) Permeability measurement results for the 90 μm fracture slab model; (c) Measurement results for a core fracture aperture of 140 μm; (d) Permeability measurement results for the 140 μm fracture slab model; (e) Measurement results for a core fracture aperture of 200 μm; (f) Permeability measurement results for the 200 μm fracture slab model; (g) Measurement results for a core fracture aperture of 250 μm; (h) Permeability measurement results for the 250 μm fracture slab model; (i) Measurement results for a core fracture aperture of 300 μm; (j) Permeability measurement results for the 300 μm fracture slab model. The non-English fonts in the lower left corner of Figures (a,c,e,g,i) are the recorded measurement point numbers and test times.
Jmse 12 01868 g015aJmse 12 01868 g015b
Figure 16. Fitting results of single-fracture aperture and permeability.
Jmse 12 01868 g016
Figure 17. Processing workflow and results of 3D digital core. (a) Overall view; (b) Reconstruction results of the core before fracturing; (c) Reconstruction results of the core after fracturing; (d) 2D cross-sectional image before filtering; (e) 2D cross-sectional image after filtering; (f) Filtered 2D cross-sectional image of the core before fracturing; (g) Filtered 2D cross-sectional image of the core after fracturing; (h) Preliminary extraction results of fractures; (i) Visualization results of the 3D fracture distribution based on threshold segmentation; (j) Processing results of the actual full-size core before fracturing; (k) Display of fracture morphology of the actual full-size core after fracturing (The different colors in the diagram represent different fracture groups).
Jmse 12 01868 g017
Figure 18. The relationship between porosity and permeability of full-size core before and after fracture formation.
Jmse 12 01868 g018
Figure 19. Calculated intersection diagram of fracture aperture and core fracture aperture.
Jmse 12 01868 g019
Figure 20. Cores with artificial fractures at different angles.
Jmse 12 01868 g020
Figure 21. CT scan results of X5 sample. (a) The cross-section of X5 sample; (b) Fracture structure diagram of X5 sample.
Jmse 12 01868 g021
Figure 22. The relationship between resistivity and porosity and permeability. (a) The relationship between porosity and resistivity; (b) The relationship between permeability and resistivity.
Jmse 12 01868 g022
Table 1. Porosity and permeability measurement results of eight full-diameter cores before and after fracture formation.
Core
No.
Fracture InformationBefore FracturingAfter Fracturing
Fracture
No.
AngleAperture
(μm)
AngleAperture
(μm)
Porosity
(%)
Permeability
(mD)
Porosity
(%)
Permeability
(mD)
X173°32468.26°342.50.263
129°20520.888.43
74°17215.5431.75
28°993.136.71
X258°30920.0914.312.09
X384°32499.32°1091.50.2064.448.841
98°162
182
X491°35999.348°801.40.229
98°72
X584°3541.70.0284.760.743
83°297
X674°159116.68°792.10.2094.246.649
X7118°2840.90.022420.323
X880°25580.57°1211.30.053
93°76
179°303
Table 2. Plate fracture permeability model verification table.
Validation Sample
Number
Fracture
Aperture
(μm)
Fracture
Angle
(°)
Core Fracture Permeability
(mD)
Calculated Fracture
Permeability
(mD)
Absolute Error
(mD)
Relative
Error
(%)
V194.9061.5859.572.013.26
V2173.60247.63268.5120.888.43
V31094048.9464.4815.5431.75
V4893146.6543.523.136.71
V5995820.3236.1115.7977.71
94.9061.5859.572.013.26
Average Error11.4725.57
Disclaimer/Publisher’s Note: The statements, opinions and data contained in all publications are solely those of the individual author(s) and contributor(s) and not of MDPI and/or the editor(s). MDPI and/or the editor(s) disclaim responsibility for any injury to people or property resulting from any ideas, methods, instructions or products referred to in the content.