Article

A Back–Forward Approach-Based Efficiency Performance Analysis Model for Hybrid Electric Propulsion Ships Using the Holtrop–Mennen Method

Department of Naval Architecture and Ocean Engineering, Chungnam National University, Daejeon 34134, Republic of Korea
*
Author to whom correspondence should be addressed.
J. Mar. Sci. Eng. 2024, 12(1), 9; https://doi.org/10.3390/jmse12010009
Submission received: 14 November 2023 / Revised: 13 December 2023 / Accepted: 17 December 2023 / Published: 19 December 2023
(This article belongs to the Section Ocean Engineering)

Abstract

:
Due to tightening regulations on exhaust emissions from ships, there is a growing need to develop electric or hybrid electric propulsion systems to replace conventional diesel-based ship power systems. The hybrid electric propulsion system is suitable for small and medium-sized vessels and its energy efficiency significantly depends on the arrangement of different power sources, power control strategies for energy sources, and energy storage system (ESS). Therefore, an analytical simulation to evaluate the energy efficiency of ships with their structure and control strategies is needed. In this study, a back–forward approach-based efficiency performance analysis model was developed using the Holtrop–Mennen resistance model to calculate ship resistance and power demand based on a given ship’s speed profiles. This model has the advantages of using easily obtainable ship speed profiles as the input and can be modularized for each power source and ESS, incorporating mechanical performance limitations, and allows for rapid analysis. The developed analytical model was applied to a hybrid electric propulsion system in a marine support vessel and its energy efficiency was evaluated by establishing rule-based power control strategies. As a result, the engine efficiency of the hybrid electric propulsion system increased from about 27% to 30% compared to the existing system, and the final effect of reducing fuel consumption by about 10% compared to the existing system was confirmed through the developed simulator. In the future, this analytical model could be utilized to derive the optimal layout of hybrid electric propulsion systems, and to formulate power control strategies.

1. Introduction

While efforts to reduce greenhouse gas (GHG) emissions are progressing across various industries, the shipbuilding and shipping sectors are also actively striving to decrease the emissions of environmental pollutants such as carbon dioxide, sulfur oxides, and nitrogen oxides. In particular, the international maritime organization (IMO) is at the forefront of enhancing regulations on ship emissions based on criteria such as the energy efficiency design index (EEDI), energy efficiency existing ship index (EEXI), and carbon intensity indicator (CII). These regulations aim to further strengthen the control of emissions from ships [1]. The IMO has announced the IMO GHG strategy, aiming to reduce the total annual GHG emissions from each ship by up to net zero by the year 2050 compared to the emissions in 2008. This strategy is designed to regulate greenhouse gas emissions in the international shipping industry [2]. In response to increasingly stringent environmental regulations, international shipyards are focusing their attention on environmentally friendly vessels that can reduce emissions and improve energy efficiency [3]. Now, ships are also at a point where they need to transform, like the automotive industry, towards pure electric propulsion systems using clean energy sources. During this transitional phase, hybrid electric propulsion systems may be one of the most promising solutions [4]. In this study, the target hybrid electric propulsion system utilizes multiple heterogeneous power sources, maximizing the efficiency of each individual power source. In the automotive industry, this type of system is considered the most efficient powertrain during the transition from internal combustion engine-based power systems to pure electric propulsion systems.
The conventional diesel power systems, which are mainly used as the propulsion system for ships, are most efficient when operated within the range of 70% to 90% of their rated power. However, for small and medium-sized vessels, there is a frequent need to operate the power system at lower power levels, typically ranging from 20% to 50% when in harbors [5]. Moreover, these vessels, which are utilized in various operational fields, often navigate at variable speeds. These variable speed operations constitute a significant portion of the total operating time. In such cases, hybrid power systems can offer advantages due to their flexibility and efficiency in accommodating varying operational demands [6,7]. Hybrid electric propulsion ships offer flexibility by utilizing a combination of diesel power and electric power, allowing the selective use of the efficiency range of each power system. If a ship operates primarily at less than 15% of its maximum power (around 40% of its maximum speed), it has been reported that the hybrid electric propulsion system is considered efficient [8].
The hybrid electric propulsion system with an auxiliary power source and power conversion device added to the existing propulsion method has the disadvantage that the total weight of the ship increases compared to the existing system, and the diameter of the propeller to handle this power along with the diesel engine, which is the main power source, can increase. It also offers freedom in power selection, but at the same time, it requires an appropriate structural arrangement between the diesel engine and electric propulsion system for higher energy efficiency. Additionally, it needs proper power control strategies that can maximize energy efficiency [9].
The control of hybrid electric propulsion power systems can be categorized into primary control, secondary control, and tertiary control [10]. Firstly, primary control is responsible for controlling and operating basic power, and mainly uses basic control methods such as droop control methods to stabilize the system and control the necessary basic functions to be maintained. Secondary control mainly serves to maintain stability and efficiency by controlling the power requirements inside the power system. Next, tertiary control serves as the higher-level controller that determines the power distribution between different power sources to operate each power source at its most efficient operating point. Optimizing power distribution is essential to ensure the efficient operation of each power source. Representative techniques for tertiary control include heuristic control strategies based on predefined rules and equivalent consumption minimization strategies (ECMSs) as an instantaneous optimal controller at each time step [11]. Power control logic, primarily studied and applied in hybrid automotive systems, has also been reported in the development of hybrid electric propulsion ships [12,13].
Regarding the optimization of the power source arrangement in hybrid ships, it is needed to optimize the layout of power sources but also control strategies [14]. However, to optimize both the layout of power sources and related control strategies simultaneously, it is essential to consider a complex optimization problem that optimizes variables related to control strategies for each power source arrangement. In this respect, attempting to solve the optimization problem using a design point-based performance analysis that considers only specific operating points cannot give a solution. In automotive systems where hybrid powertrains were first researched, the modeling of the power flow at the system level, including the structural topology of power sources, was conducted. Numerous studies focused on optimizing the acceleration performance and energy efficiency using these models [15,16]. Through such system-level modeling, the design and establishment of control strategies for powertrain systems have become necessary in the maritime industry [17].
The most significant difference between ship and automotive powertrain systems lies in the scale of power sources and the type of load experienced during operation. In the case of hybrid electric propulsion systems for ships, multiple diesel engines can be used, and a significant portion of power consumption can be attributed to electrical loads within the cabin and equipment. Therefore, in the modeling of hybrid electric propulsion systems for ships, it is essential to incorporate multiple power sources flexibly into the model to enable simulation and to dynamically model the required power based on the ship’s operational conditions. In addition, regarding the power load, in the case of vehicles, simple polynomial equations can model the aerodynamic resistance, rolling resistance, and gradient resistance within a high accuracy range. However, for ships, the power load can vary nonlinearly depending on the environment. In a recent study, a study on the development of an energy management system (EMS) to improve the performance of a hybrid electric marine vessel (HEMV) was reported by developing map-based performance parameters for the main components of the HEMV [18,19]. However, for the development of the EMS in this study, the modeling method for the performance evaluation of the HEMV used a method of calculating the efficiency by simply distributing it to the input value of the model after determining the operating load in advance [9,20]. However, acquiring the actual operating load for ships is not easy, and using fixed power demand profiles can be considered as neglecting the direct correlation with the ship’s real operating conditions. Since the power of a ship is affected by the ship’s type, size, weight, hull design, climate, environment, and draft of the ship [19], it is difficult to define the same as a fixed power demand profile. In the case of the automotive area, advanced vehicle simulator (ADVISOR-2003-00-r0116), a representative software used for powertrain analysis in vehicles, the vehicle speed is input as an operational cycle. It then calculates the aerodynamic load, resistance load, and inertial load based on the vehicle speed and acceleration/deceleration, enabling the calculation of the power demand under conditions that closely resemble actual driving situations [21]. Likewise, in this study, an independent variable, the ship speed, was used as the input. The Holtrop–Mennen resistance model was employed to calculate the resistance values based on the ship speed, which were then substituted as the power demand. This approach allows for the prediction of the energy efficiency by accommodating changes in the ship power load due to the hotel load or alterations in the operational conditions, enabling the evaluation of the energy efficiency under various operational conditions. Furthermore, a back–forward approach-based model was developed by combining a backward model, which calculates the powertrain efficiency based on the required power information, and a forward model that considers the dynamics and operational limits of the power sources. This integrated model can consider the mechanical limitations of the power sources, allowing for the rapid calculation of the powertrain energy efficiency.
This paper is structured as follows: In Section 2, the proposed structure of the back–forward approach-based model for hybrid electric propulsion power systems is presented. Section 3 describes the algorithm for calculating the ship power demand based on the Holtrop–Mennen resistance model. In Section 4 and Section 5, the simulation results for the energy efficiency of a marine support vessel equipped with a hybrid electric propulsion system are presented as case studies.

2. Back–Forward Powertrain Model

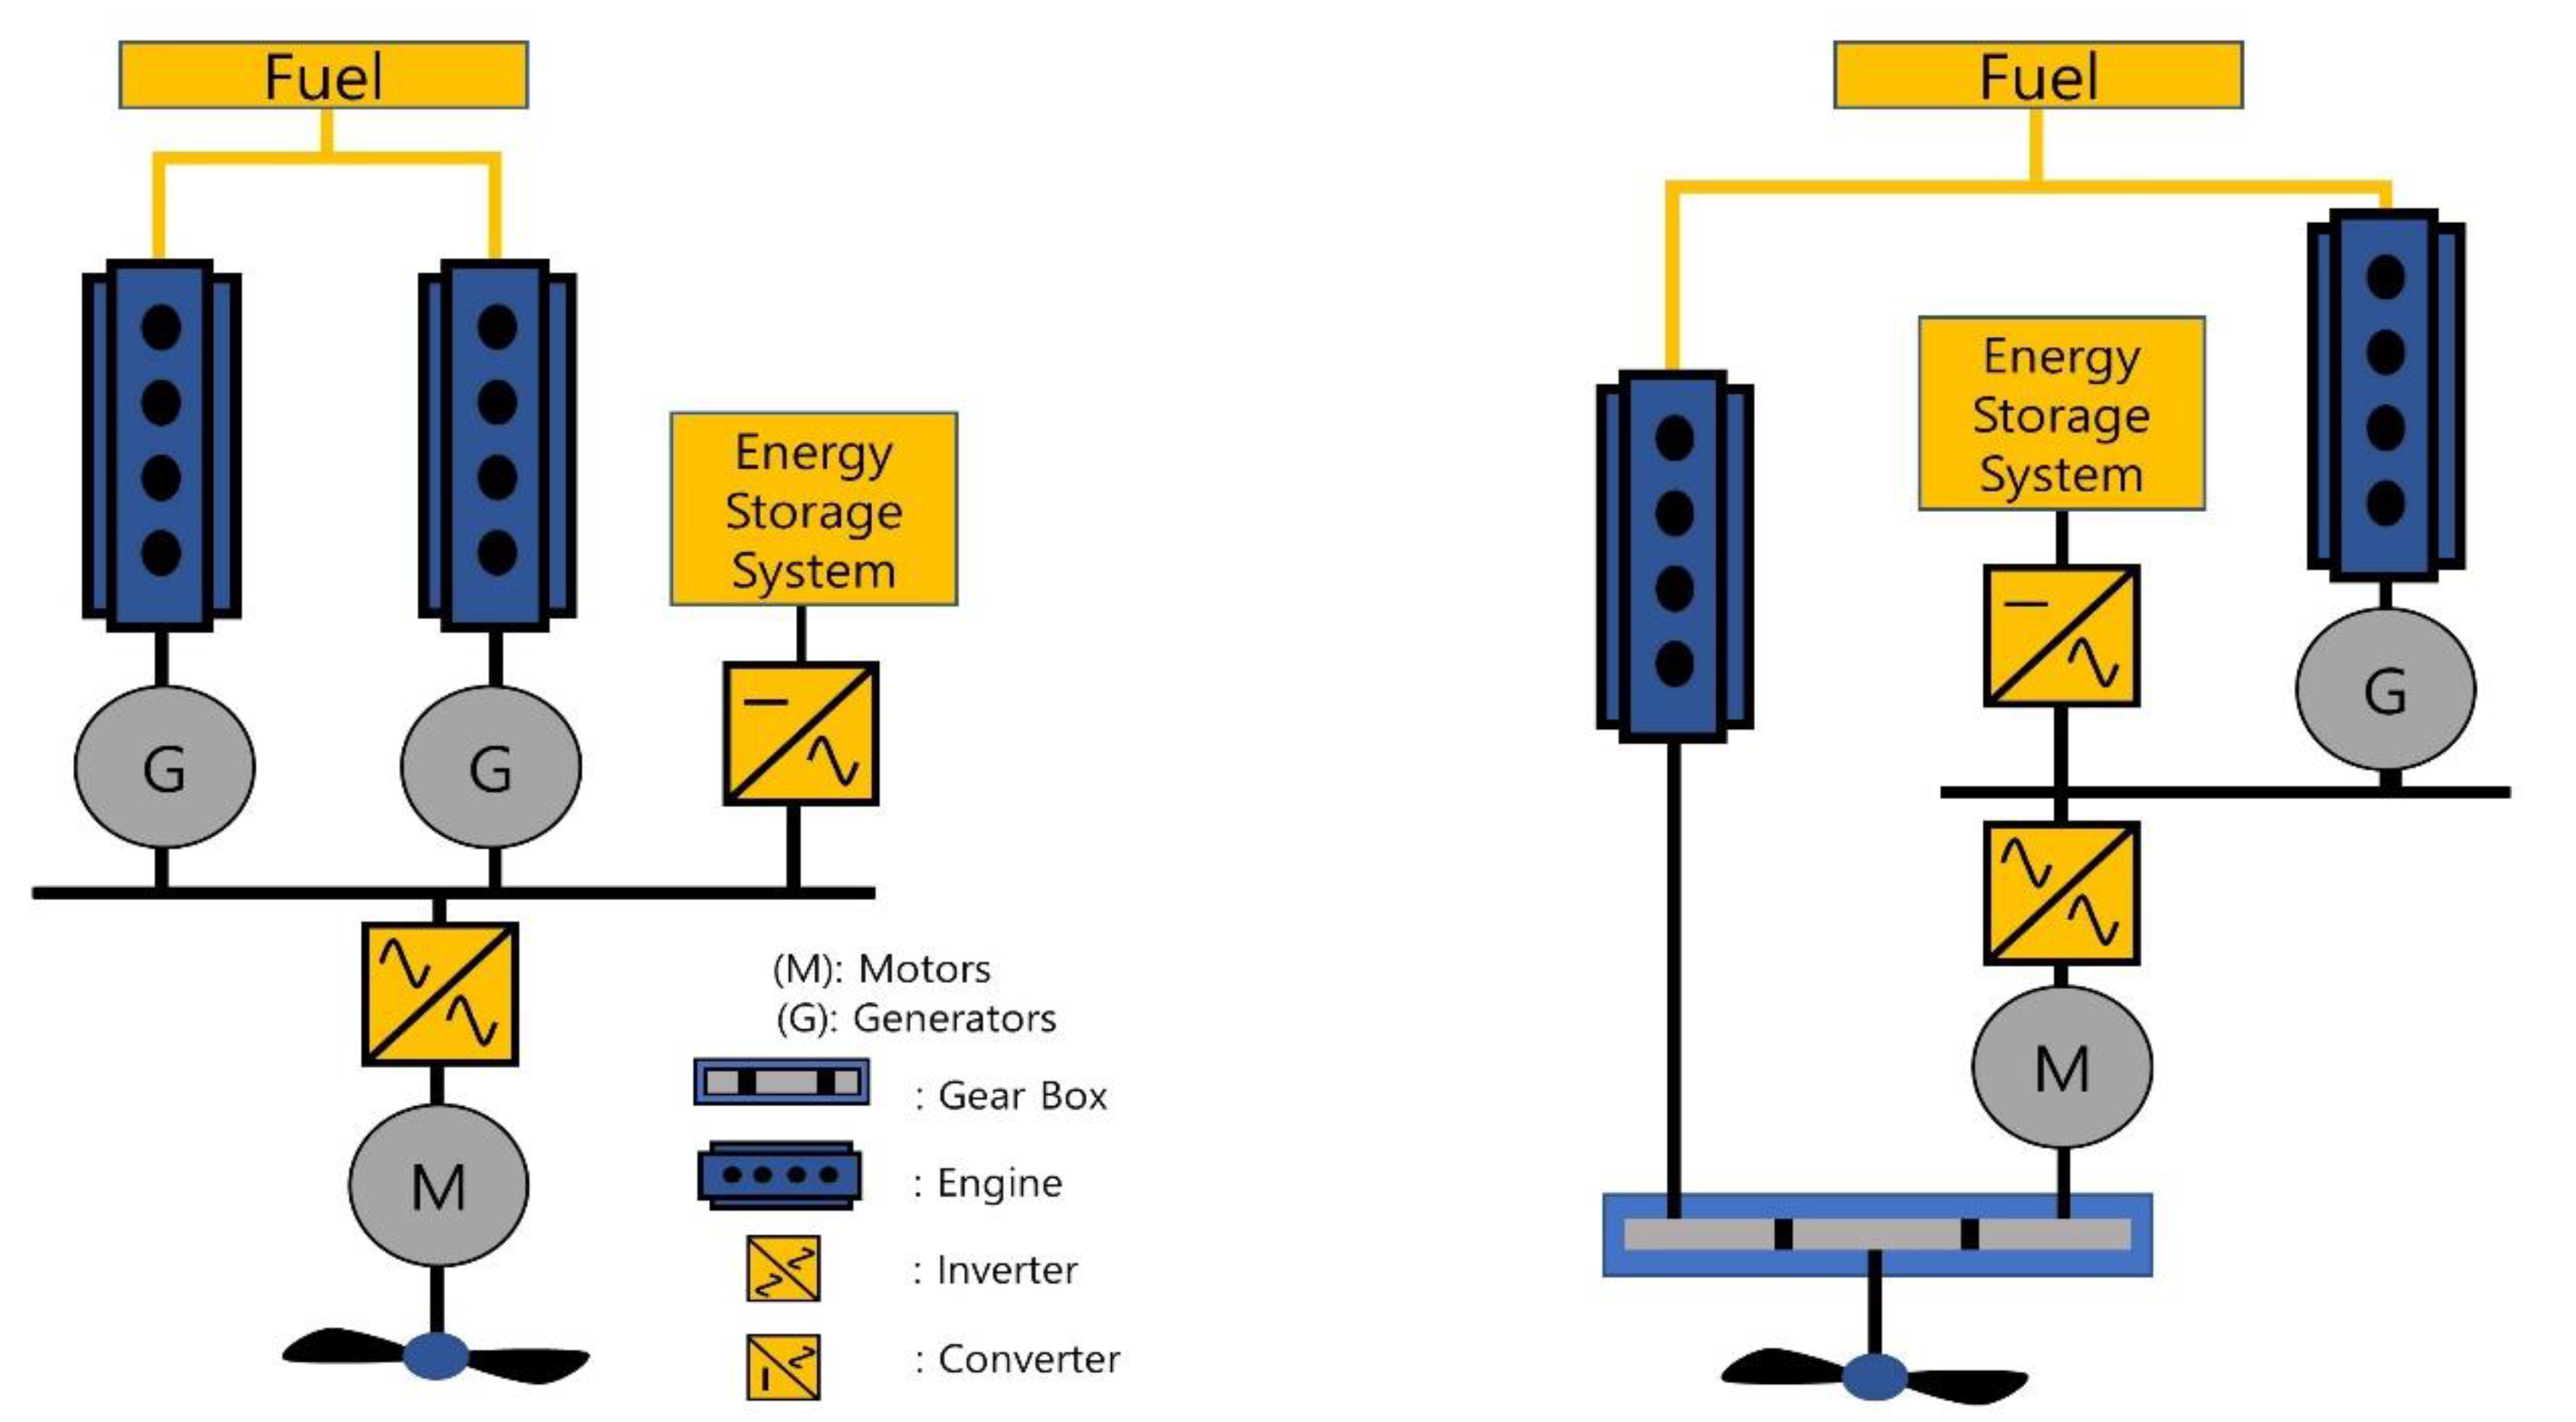
2.1. Types of Hybrid Electric Propulsion System

The hybrid electric propulsion system of a ship utilizes a diesel engine, such as a prime mover, to provide steady power, while an electric motor supplies dynamic power. This allows the system to continuously operate the diesel engine in its optimal efficiency points and flexibly utilize the electric motor to compensate for any shortage or surplus of power [22]. The overall performance of the system is significantly influenced by the structural arrangement of the power sources (hybrid topology), the power control strategies among the power sources, and the ESS [23,24]. The structural arrangement of the hybrid propulsion system can be categorized into series hybrid and parallel hybrid configurations. In the case of ships, this structure classification can be determined based on the role of the prime mover. As shown in Figure 1, left, in a series hybrid architecture, the diesel engine is solely responsible for power generation, and the actual propulsion power is supplied by the electric motor. This results in a serial flow of power between the diesel engine and the electric motor. The series hybrid architecture allows for the mechanical decoupling of the diesel engine and propeller, enabling the diesel engine to operate continuously at its optimal operating point. However, it requires a large-capacity electric motor capable of delivering the maximum propulsion power, and it involves two stages of electric conversion, leading to inevitable energy conversion losses. One of the representative series hybrid propulsion ships is the Roald Amundsen cruise vessel, built by Kleven Maritime [25]. In Figure 1, right, a concept diagram of the parallel hybrid architecture is shown, where the prime mover and electric motor are mechanically coupled to secure propulsion power from two or more power sources. This configuration allows for operational flexibility, enabling the reduction in the capacity of the electric motor and the possibility of operating purely on electric propulsion or pure engine propulsion, although it comes with the drawback of increased mechanical complexity. One of the representative parallel hybrid propulsion ships is the Mochi rescue yacht built by Ferretti. It is known for its operational flexibility with modes such as economy mode, no-emission mode, and power-boost mode, providing a range of power management options [26]. The high level of operational flexibility in power management has led to the widespread adoption of parallel hybrid architecture in the automotive industry recently. However, with the diverse possibilities in powertrain configuration and the significant impact of power control strategies on performance, there are significant technical challenges to address in parallel hybrid architecture. Therefore, in this study, a simulation environment capable of analyzing the energy efficiency of hybrid electric propulsion ships was developed to explore powertrain configurations and establish control strategies. This simulation environment was applied specifically to the parallel hybrid architecture.

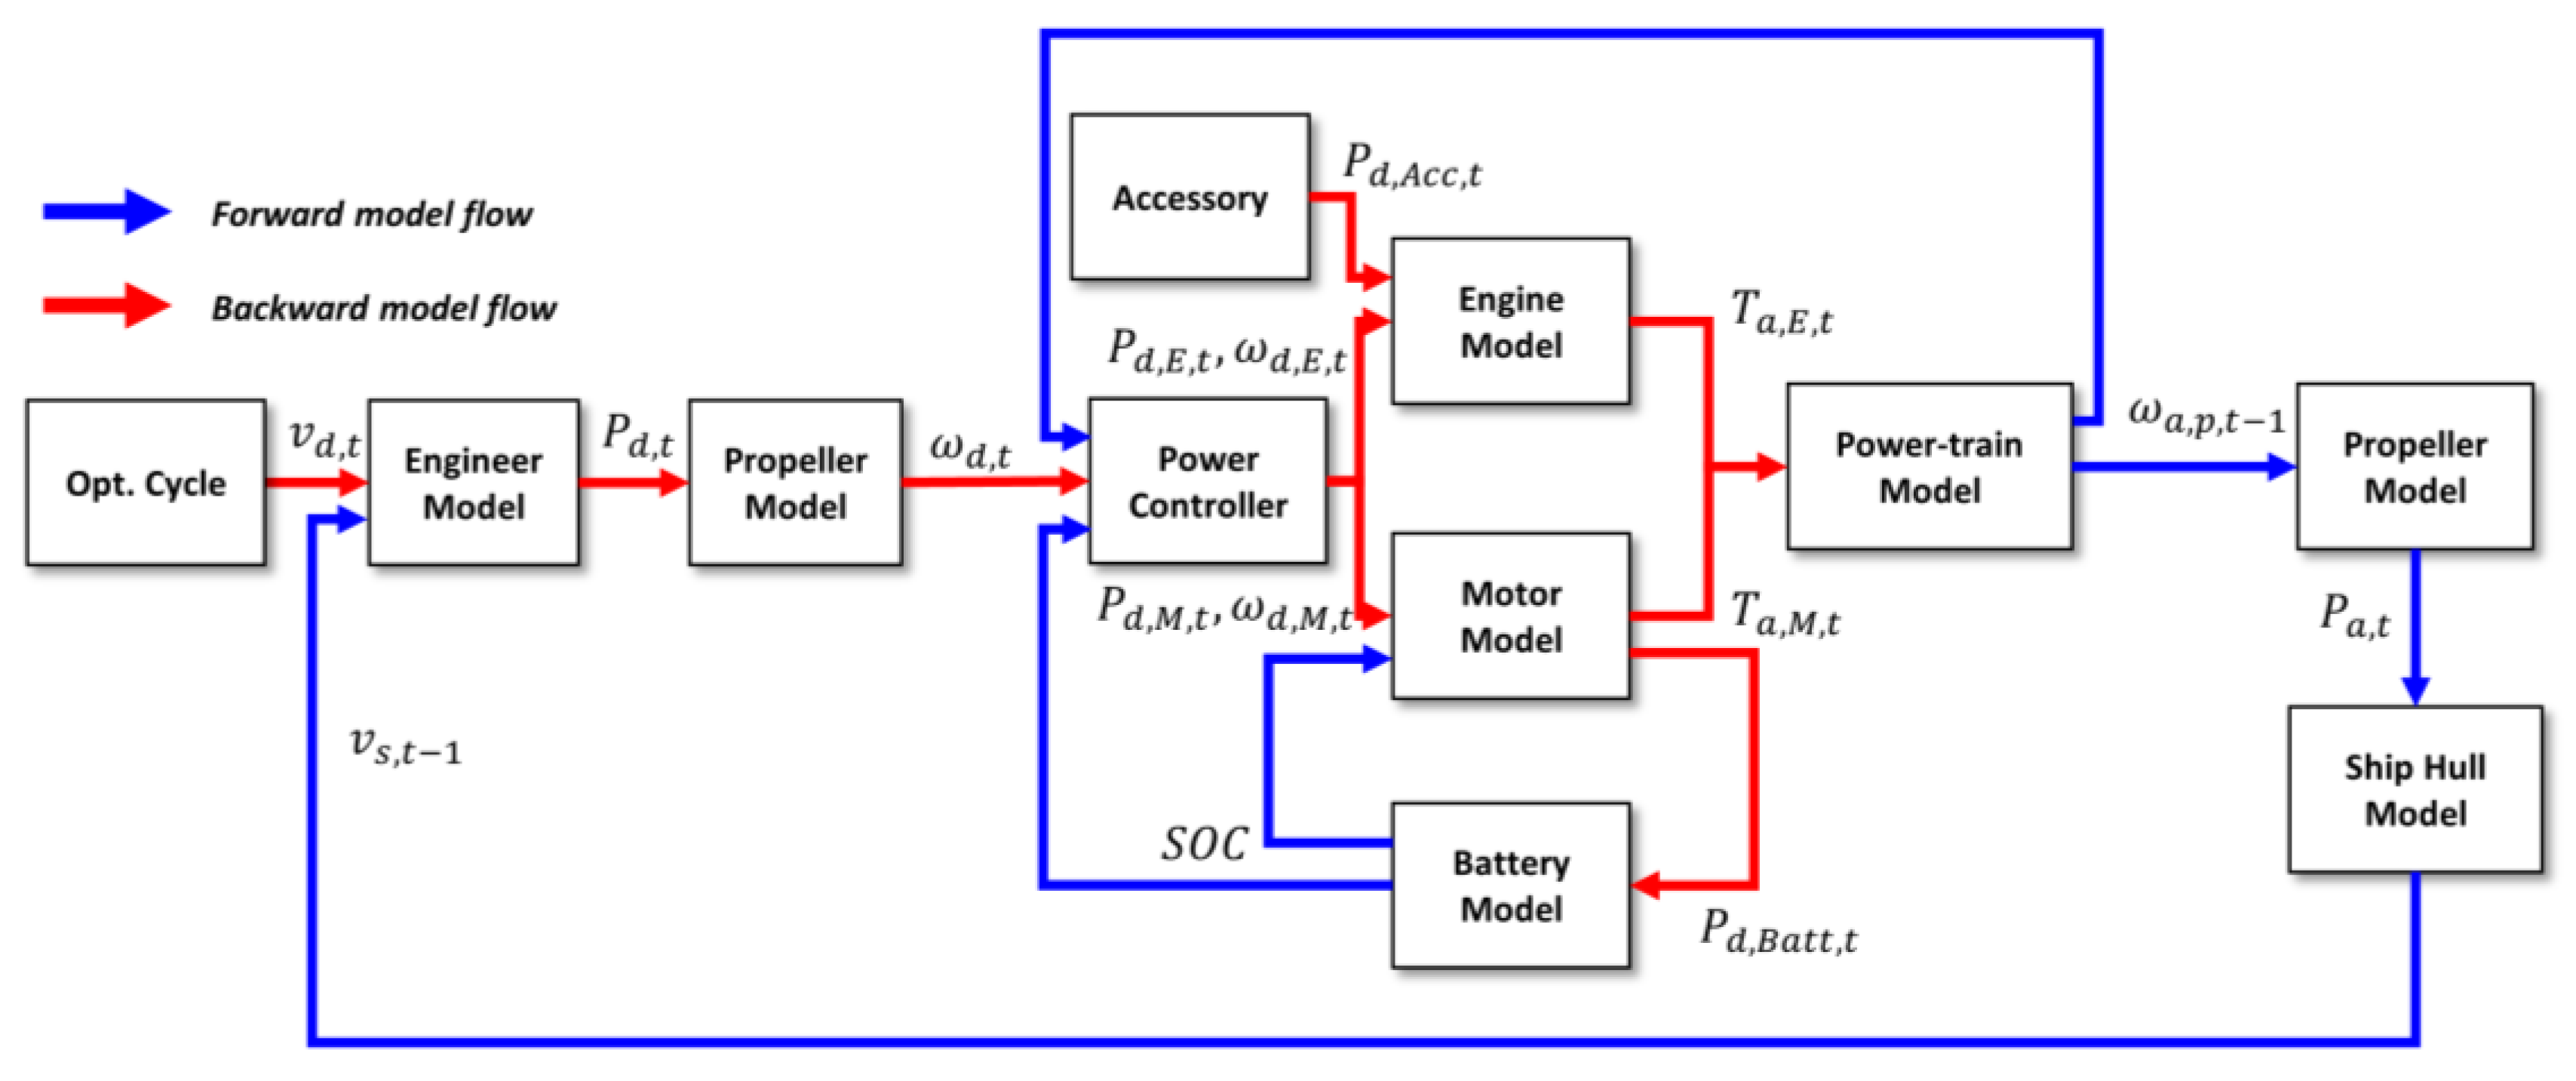
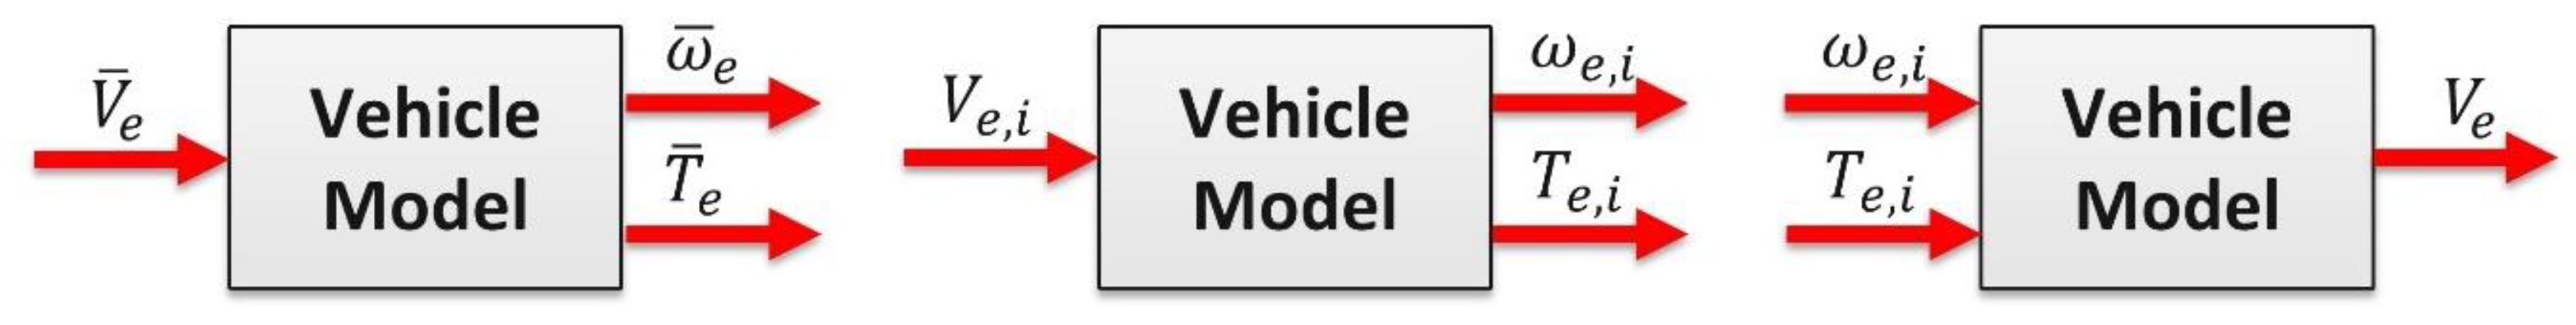
2.2. Back–Forward Approach-Based Model

There are three main modeling approaches to evaluate the energy efficiency of propulsion systems, as depicted in Figure 2: the average operating point approach, quasi-static approach, and dynamic approach [27]. V ¯ e , ω ¯ e , T ¯ e , V e , i , ω e , i , and T e , i in Figure 2 represent the average speed, average rotation speed, average torque, speed per step, torque per step, torque per step, and torque per step. The average operating point approach calculates the energy efficiency based on representative operating points. It is suitable for systems with fixed design operating points, making it straightforward to compute the quantitative efficiency. However, for systems like ships where power usage varies during operation, the quasi-static approach or dynamic approach is required to calculate the efficiency over time. The quasi-static approach involves finding the operating point at each time step and using it to calculate the energy consumption and efficiency. Typically, the model is constructed using a backward approach, finding the operating points of each power source from the overall power demand. However, the quasi-static approach has a limitation in simulating operating conditions that do not satisfy the entire power demand. On the other hand, the dynamic approach involves formulating system dynamic equations in the form of differential equations and solving all system states, making it suitable for studying transient behavior. However, it requires significant computational time and may encounter convergence issues. In this study, to address the computational time and convergence issues associated with the dynamic approach, a back–forward quasi-static approach model was developed. This model combines the backward quasi-static approach with a re-evaluation of the mechanical limits of each power source and component to calculate the actual power and incorporates a feedback loop to resolve the issues.
The flow diagram of the developed back–forward quasi-static approach model in this study is shown in Figure 3. The backward model involves retroactively calculating the demanded power ( P d , t ) for the ship from the operational cycle representing the speed demands ( v d , t ). The power distribution controller then calculates the demanded power for the engine and electric motor ( P d , E , t ,   P d , M , t ). In the forward model, the actual output power values ( T a , E , t ,   T a , M , t ) are calculated based on the mechanical performance limitations of each component (e.g., maximum torque, maximum speed, maximum power, etc.). These calculated power values are then input to the powertrain model to calculate the propeller’s rotational speed and the ship’s actual speed, which are fed back into the simulation. This approach allows for efficient calculation while also evaluating the feasibility of the powertrain system by considering the calculated actual power from the forward loop in determining the ship’s actual operating speed.
In this study, the back–forward approach-based model incorporates the Holtrop–Mennen resistance model into the engineer model, allowing for the interpretation of the energy efficiency in hybrid electric propulsion ships using the ship’s speed profile.

2.3. Modeling Equations

Firstly, the ship dynamics were derived based on the general form of the equation as follows:
x ¨ + b x ˙ + k x = f ( t ) m a   x ¨
Here, x is the displacement of inertia, x ˙ is the speed of inertia, x ¨ is the acceleration of inertia, m is the system inertia, b is the linear damping coefficient of the system, k is the stiffness, f ( t ) is the external force, and m a is the added mass by fluid. In this equation, the general 6-DOF force ( m a   x ¨ ) related to the added mass can be expressed as follows in three terms of translational velocities: surge, sway, and heave and three terms of rotational velocities: roll, pitch, and yaw.
F 1 = U ˙ 1   m 11 U ˙ 3 m 21 U ˙ 3 m 31 U ˙ 4 m 41 U ˙ 5 m 51 U ˙ 6 m 61 ε 1 k l U 1 Ω k m l 1 ε 1 k l U 2 Ω k m l 2 ε 1 k l U 3 Ω k m l 3 ε 1 k l U 4 Ω k m l 4 ε 1 k l U 5 Ω k m l 5 ε 1 k l U 6 Ω k m l 6
Subscripts 1, 2, and 3 are related to translation motion, and 4, 5, and 6 are related to rotational motion. In this case, U 1 , U 2 , U 3 , U 4 , U 5 , and U 6 are the velocities of each direction, Ω k is the rotational velocity of each axis, and ε 1 k l is the permutation symbol. In this study, we focused on the energy efficiency simulation of the hybrid propulsion ship and considered only the surge motion under the assumption that the ship’s maneuvering is negligible. Therefore, if the motion other than the surge motion is ignored in the previous equation, the influence of the added mass may be simplified as follows:
F 1 = U ˙ 1 m 11
Applying this to the equation of motion for surge motion below, it is as follows:
m + m 11 d v d d t + F d r a g v s = P d
The added mass applied in this paper was determined using the Lewandowski longitudinal additional mass approximation [28]. This approximation assumes that the hull is an “equivalence sphere” and evaluates the additional mass for the surge motion. The Lamb coefficient of inertia for surge motion can be used to express the following equation:
m 11 = ρ K 1
Here, m 11 is the surge added mass of the ship, and ρ , , and K 1 are the density of the seawater, the drainage of the ship, and the added mass coefficient, respectively. K 1 was calculated by using the method to obtain the additional mass coefficient assuming that the hull is ellipsoid [29]. As a result of calculating K 1 and m 11 for the Section 4 ship targeted in this study using this application method, 0.125 and 8875 kg, respectively, were confirmed, and the final weight using Equation (4) was set to 79,875 kg by adding 8875 kg to the existing 71,000 kg.
The engineer model was modeled based on Equation (4), the demanded speed ( v d , t ) from the operational cycle, the ship resistance ( F d r a g ), and the ship velocity from the previous time step ( v s , t 1 ) and total ship mass (Included added mass) ( m + m 11 ) are utilized to calculate the demanded power ( P d , t ).
In order to propel a ship, the shaft connecting the engine and the propeller should be rotated. Using the ratio of the maximum propeller rotation speed ( w M C R ) in the capacity of the engine ( P M C R ), the propeller model is implemented to quickly calculate the demanded propeller rotation speed ( w d , t ) compared to the demanded power, as shown in the following equation:
P d , t P M C R 1 / 3 × w M C R = w d , t
In the engine model, the accessory load ( P d , A , t ), demanded speed of the engine ( ω d , E , t ), demanded torque ( T d , E , t ), engine rotational inertia ( I E ), and the engine speed from the previous time step ( ω E , t 1 ) are utilized to calculate the actual output torque ( T a , E , t ) that the engine produces. This value is constrained to be within the maximum torque range of the engine.
P d , A , t ω E , t 1 + T d , E , t + I E ω d , E , t ω E , t 1 t = T a , E , t
The available engine torque and rotational speed values are then used as inputs to the engine efficiency map, which calculates the fuel consumption to evaluate the energy efficiency of the ship. The electric motor model utilizes the requested electric motor speed ( ω d , M , t ), demanded torque ( T d , M , t ), electric motor rotational inertia ( I M ), and the previous time step motor speed ( ω M , t 1 ) to calculate the actual output torque of the motor ( T a , M , t ). This calculation ensures that the motor operates within its minimum (for generating) and maximum (for propulsion) torque ranges.
T d , M , t + I M ω d , M , t ω M , t 1 t = T a , M , t
The output of the electric motor is determined by substituting the calculated efficiency ( η M ) from the electric motor efficiency map into the following equation. This equation transfers the demanded power from the battery ( P d , B , t ) to the electric motor, resulting in changes to the state of charge (SOC) of the battery.
T a , M , t η M ω M , t 1 = P d , B , t
The battery was implemented in an equivalent circuit model, the effect of the temperature change and battery life was not considered, and the SOC change was calculated by considering the simple battery internal resistance based on the demanded battery power calculated from the electric motor block. V o c , R b a t , and C b a t represent the open-circuit voltage, battery internal resistance, and capacity, respectively.
S O C ˙ = V o c V o c 4 R b a t 0 P d , B , t 2 R b a t C b a t
The available outputs of the engine and electric motor are input into the powertrain model, and the propeller speed ( ω P , t 1 ) is calculated based on the following equation:
T a , E , t + T a , M , t = I E + I M ω P , t ω P , t 1 t + P d , t + P d , A , t ω P , t 1
The ship speed in the previous time step ( v s , t 1 ) and ship resistance value ( F d r a g ) are again used to calculate the final actual speed of the ship ( v a , t ) based on the following forward model equation:
( P d , t v s , t 1 F d r a g ) / m   d t + v s , t 1 = v a , t
The variables of the governing equations are indicated in the model flow chart of Figure 3.
In this study, each component of Figure 3 was modularized into governing models, as shown in Figure 4, using the MATLAB-R2022a-Simulink environment. The analysis was conducted at discrete time intervals of 1 s.

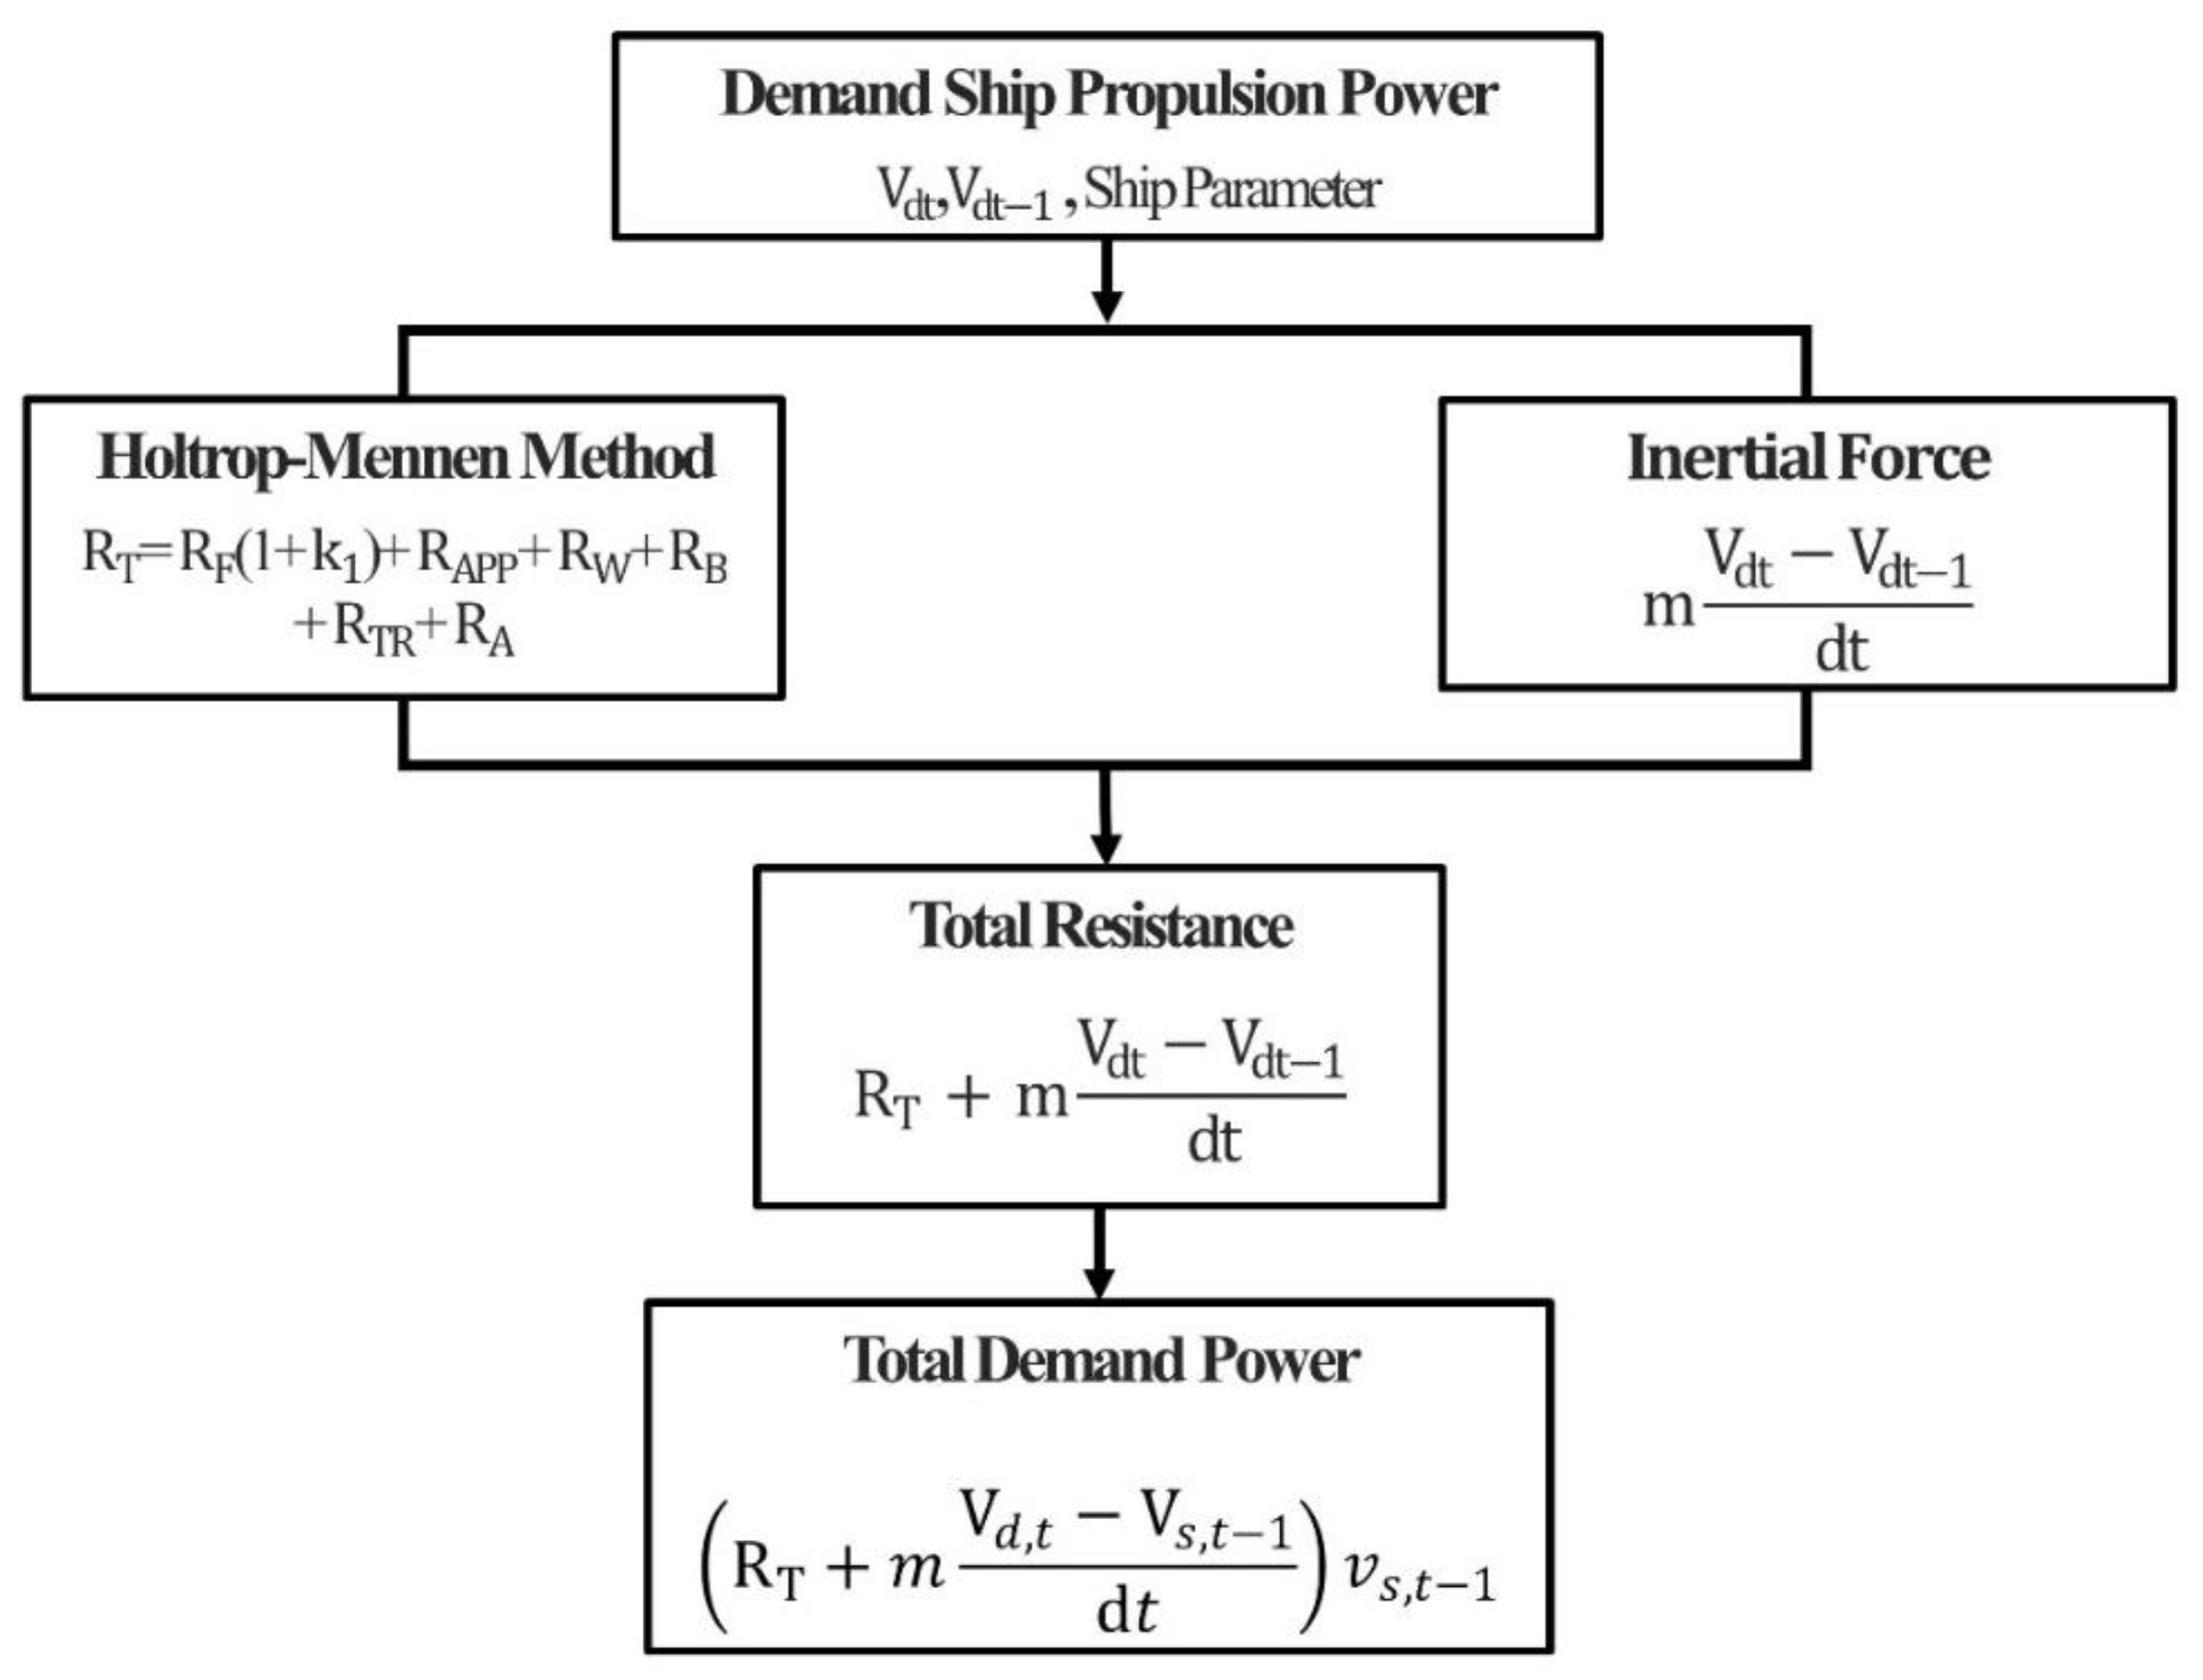
3. Power Demand from Holtrop–Mennen Resistance Model

Estimating ship resistance is crucial to accurately understand the characteristics and speed performance of a ship sailing. This resistance is defined as the force acting in the opposite direction of the ship’s movement. Ship resistance prediction has conventionally relied on methods such as computational fluid dynamics (CFD)-based approaches, traditional theoretical methods, and model tests [30]. However, these ship resistance estimation methods often lack the ability to provide rapid computation times and require a significant amount of experimental data, making them less suitable for the backward approach used in energy efficiency calculations.
In this study, the Holtrop–Mennen method, which allows for the quick computation of widely accepted ship resistance values, was applied to estimate the ship’s power requirements. The Holtrop–Mennen method is a regression equation used to estimate ship resistance and power at the design stage. It is based on the regression analysis of data obtained from accumulated model tests and data used to determine the minimum demanded power at the initial design phase [31]. The Holtrop–Mennen method utilizes the parameters in Table 1 to calculate the ship resistance. The total resistance in the Holtrop–Mennen method is described as follows.
R T = R F 1 + k 1 + R A P P + R W + R B + R T R + R A
In the Holtrop–Mennen method, R F represents the frictional resistance, where 1 + k 1 is the form factor describing the viscous resistance of the hull form in relation to R F , R A P P is the appendage resistance, R W is the wave-making resistance, R B is the additional resistance due to the bulbous bow, and R T R is the additional resistance due to the transom stern. R A represents the skin friction and air resistance effects, considering the correlation between the model scale and full scale. Detailed technology is included here [32].
The distinguishing feature of the Holtrop–Mennen method lies in predicting the wave-making resistance more accurately by dividing the speed range into three regions. The formulas for each region are as follows:
R W = C 1 C 2 C 5 ρ g exp m 1 F r d + m 4 cos λ F r 2                         F r 0.40
R W = R W F r = 0.40 10 F r 4 R W F r = 0.55 R W F r = 0.40 / 1.5       0.40 < F r < 0.55
R W = C 17 C 2 C 5 ρ g exp m 3 F r d + m 4 cos λ F r 2                         F r 0.55
In the above equations, represents the displacement volume, ρ is the density of seawater, g is the gravitational acceleration, and F r is the Froude number. The remaining coefficients are calculated based on the fundamental parameters of the ship and can be expressed as follows [32]:
C 1 = 2,223,105 ( C 7 ^ 3.7861 ) ( ( T / B ) ^ 1.0796 ) ( 90 i E ) ^ 1.3757
C 7 = 0.2296 ( ( B / L W l ) 0.3333 )                                                                                         B / L W L 0.11
C 7 = B / L W L                                                                                                                                             B / L W L   0.25
C 7 = 0.5 0.0625 × B / L W L                                                                                           B / L W L > 0.25
i E = 1 + 89 × exp L W L B 0.80856 × 1 C W P 0.30484 × i E E 0.6367 × L R B 0.34574 × 100 × L W L 3 0.16302
i E E = 1 C P 0.0225 × L C B a f t
L R = L W L × ( 1 C P + 0.06 × C P × L C B a f t / ( 4 × C P 1 ) )
C 2 = e x p ( 1.89 × C 3 )
C 3 = 0.56 × A B T 1.5 / ( B × T × ( 0.31 A B T + T f h B
C 5 = 1 0.8 × A T / ( B × T × C M )
C 17 = 6919.3 × C M 1.3346 × ( / L W L 3 ) 2.00977 × ( L W L / B 2 ) 1.40692
m 1 = 0.01404 × ( L W L / T ) 1.7525 × ( 1 3 / L W L ) 4.7932 × ( B / L W L ) C 16
C 16 = 1.7301 0.7067 × C P                                                                                                     C P > 0.8
C 16 = 8.0798 × C P 13.8673 × C P 2 + 6.9844 × C P 3                       C P 0.8
m 3 = 7.2035 × B × L W L 0.326869 × ( T / B ) 0.605375
m 4 = C 15 × 0.4 × e x p ( 0.034 × F r 3.29 )
C 15 = 1.69385                                                                                                                   L W L 3 / 512
C 15 = 1.69385 + ( ( L W L 3 / ) 1 / 3 8 ) / 2.36                       L W L 3 / 1727
C 15 = 0                                                                                                                                               L W L 3 / > 1727
d = 0.9
λ = 1.446 × C P 0.03 × L W L / B                 L W L / B 12
λ = 1446 × C P 0.36 × L W L / B                   L W L / B > 12
The flowchart for calculating the demanded power with respect to the ship speed, as proposed in this study, is depicted in Figure 5. Initially, the defined ship parameters, the desired speed ( v s , t ), and ship speed ( v s , t 1 ) in the previous time step are taken as the input values. Through the Holtrop–Mennen method, the resistance corresponding to the ship speed is computed. The ship inertia force is calculated based on the ship mass ( m ), the desired speed ( v s , t ), and the previous time step speed ( v s , t 1 ). The sum of these two values yields the total demanded resistance of the ship. Subsequently, the demanded power is computed accordingly. In Section 4, a case study is conducted using the selected 20 m parallel hybrid propulsion ship parameters which are shown in Table A1, and the Holtrop–Mennen method is applied to calculate the resistance at various speeds. The results are presented in Figure 6. As described above, for more accurate wave resistance prediction, the resistance calculated based on the speed and selected parameters can also be divided into three sections to check the increasing trend.
The results obtained from this method have been validated and shown to have a certain level of reliability through comparison with CFD-based results [33]. This Holtrop–Mennen method for calculating the demanded power ensures fast computations and does not significantly impact the simulation analysis speed.

4. Model for a Maritime Supply Ship

4.1. Ship Specifications

In this study, research was conducted using a maritime support vessel, as shown in Figure 7, as a reference. The basic information about the reference vessel is provided in Table 2. The existing reference vessel had a conventional mechanical propulsion system, where a 1440 kW diesel engine directly connected to the propeller provided the propulsion force. To investigate the efficiency of a hybrid system, a parallel hybrid configuration was assumed by adding a 450 kW electric motor and a 450 kWh battery pack to the existing vessel. As a result, an additional weight of 6000 kg was introduced compared to the original mechanical propulsion system.

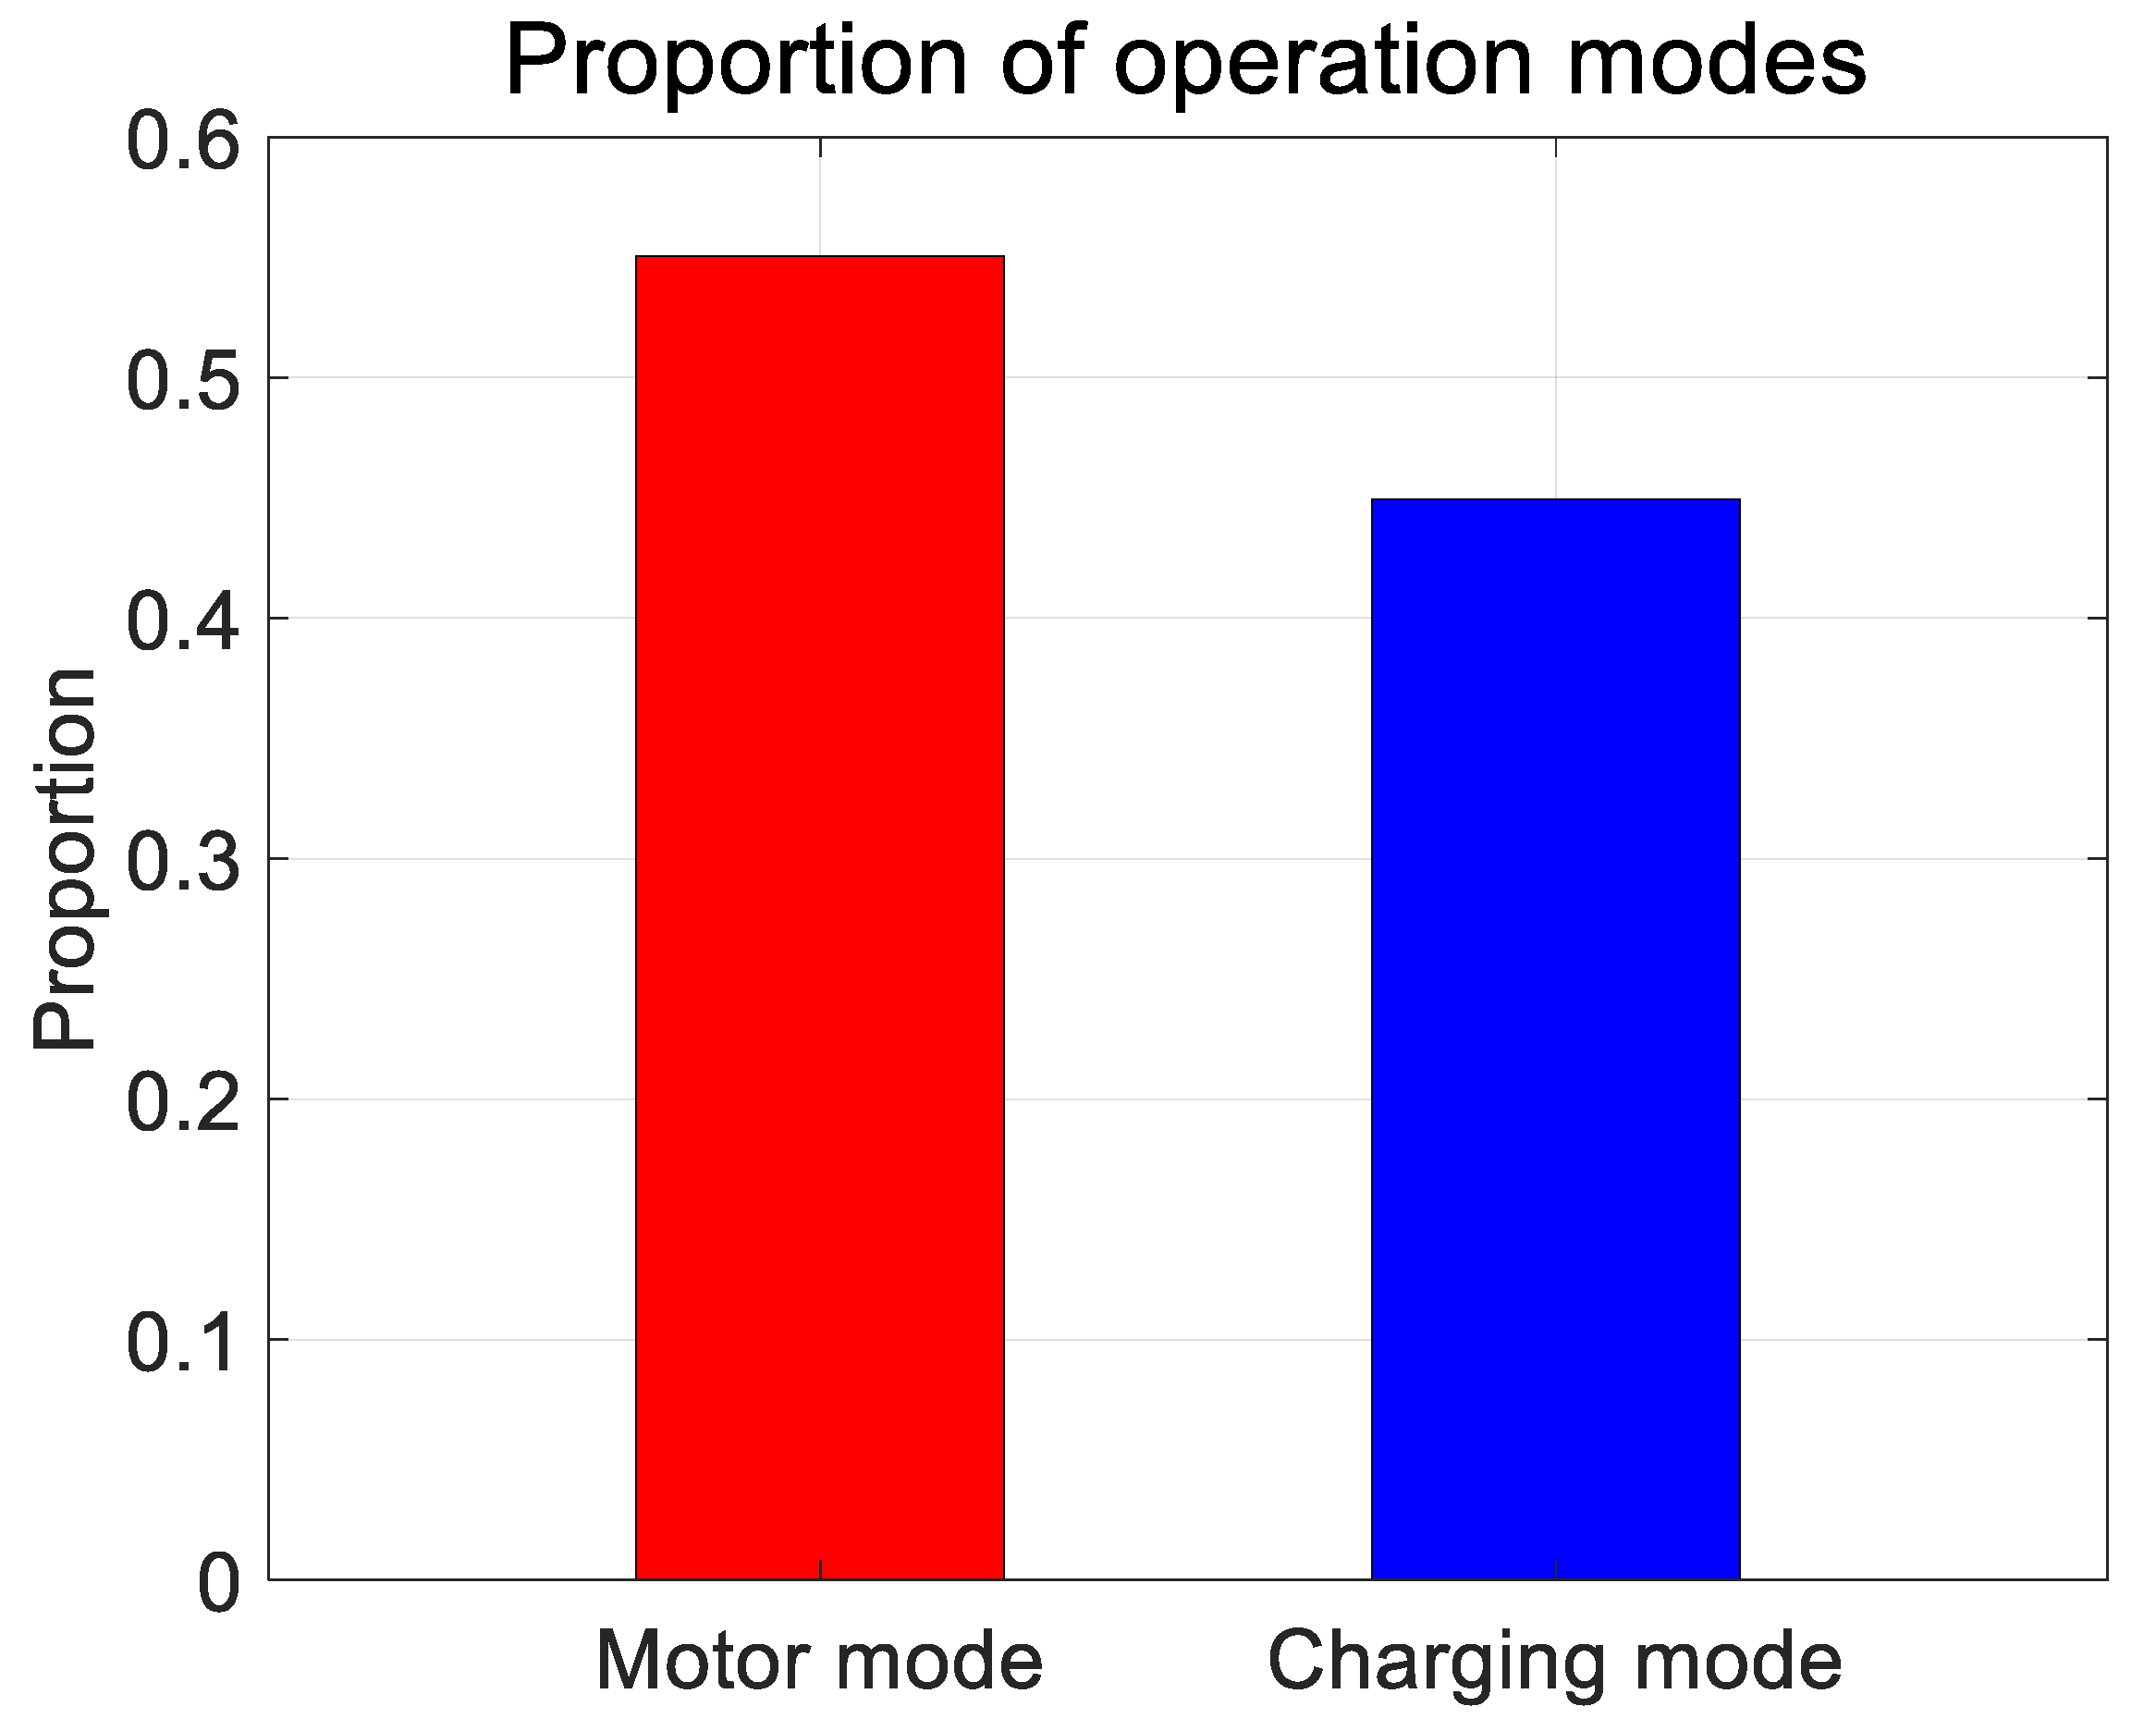
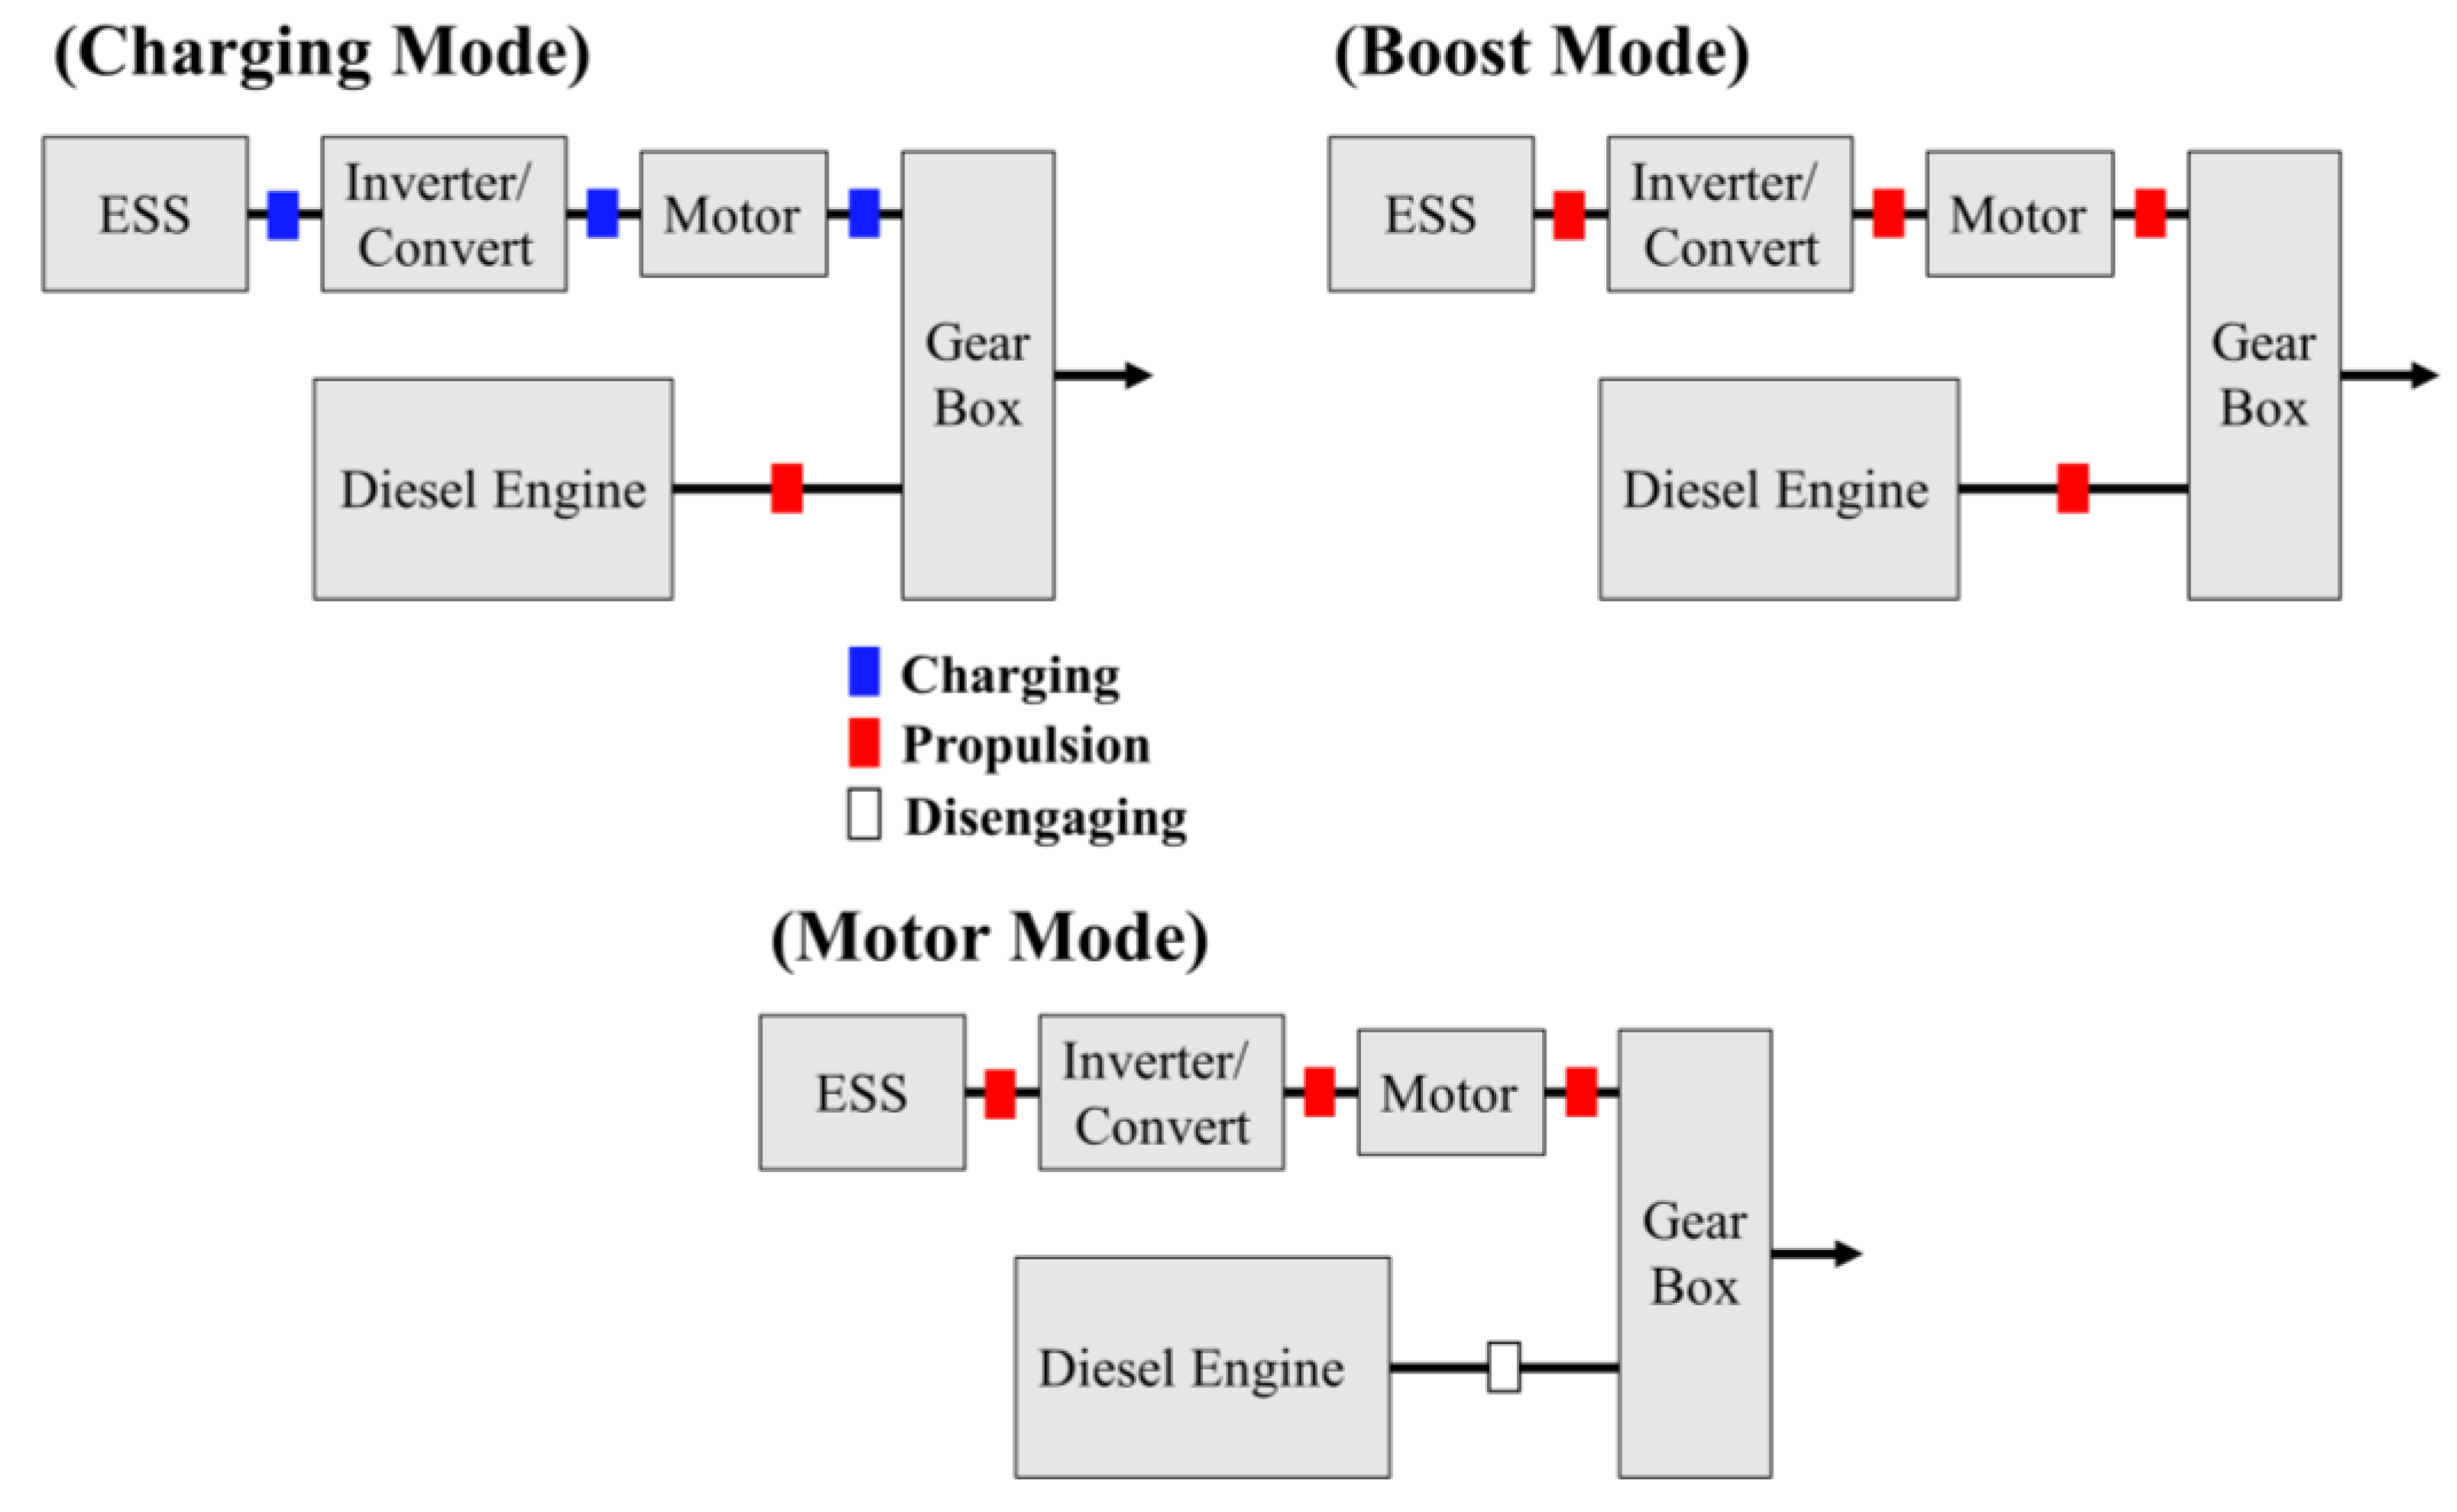
4.2. Propulsion Modes of the Hybrid System

The parallel hybrid configuration, as shown in Figure 8, allows for various operational modes depending on the powertrain operation. The first mode is the charging mode, where the excess power from the engine is used to charge the battery through the motor acting as a generator. In this mode, the vessel is propelled using the power from the engine, and the surplus power is utilized to recharge the battery. The second mode is the boost mode, where both the engine and the motor operate simultaneously to propel the vessel. The motor assists the engine, resulting in reduced fuel consumption. The last mode is the motor mode, where the vessel is propelled solely by the motor. In this mode, the engine is not active, and the propulsion is entirely driven by the electric motor.
The power composition for each mode is depicted in Figure 8. In the charging mode, the engine operating power exceeds the demanded power, allowing for adjustments in the engine operating point. This provides the possibility of increasing the engine efficiency. In the boost mode, the ship’s propulsive power is distributed into the electric motor and the engine. If the engine alone cannot meet the entire propulsion demand, the electric motor can provide additional power. Therefore, the hybrid system offers the advantages of flexible engine operating points and motor assistance, resulting in a higher efficiency and improved propulsion performance compared to conventional diesel engine-based ships.

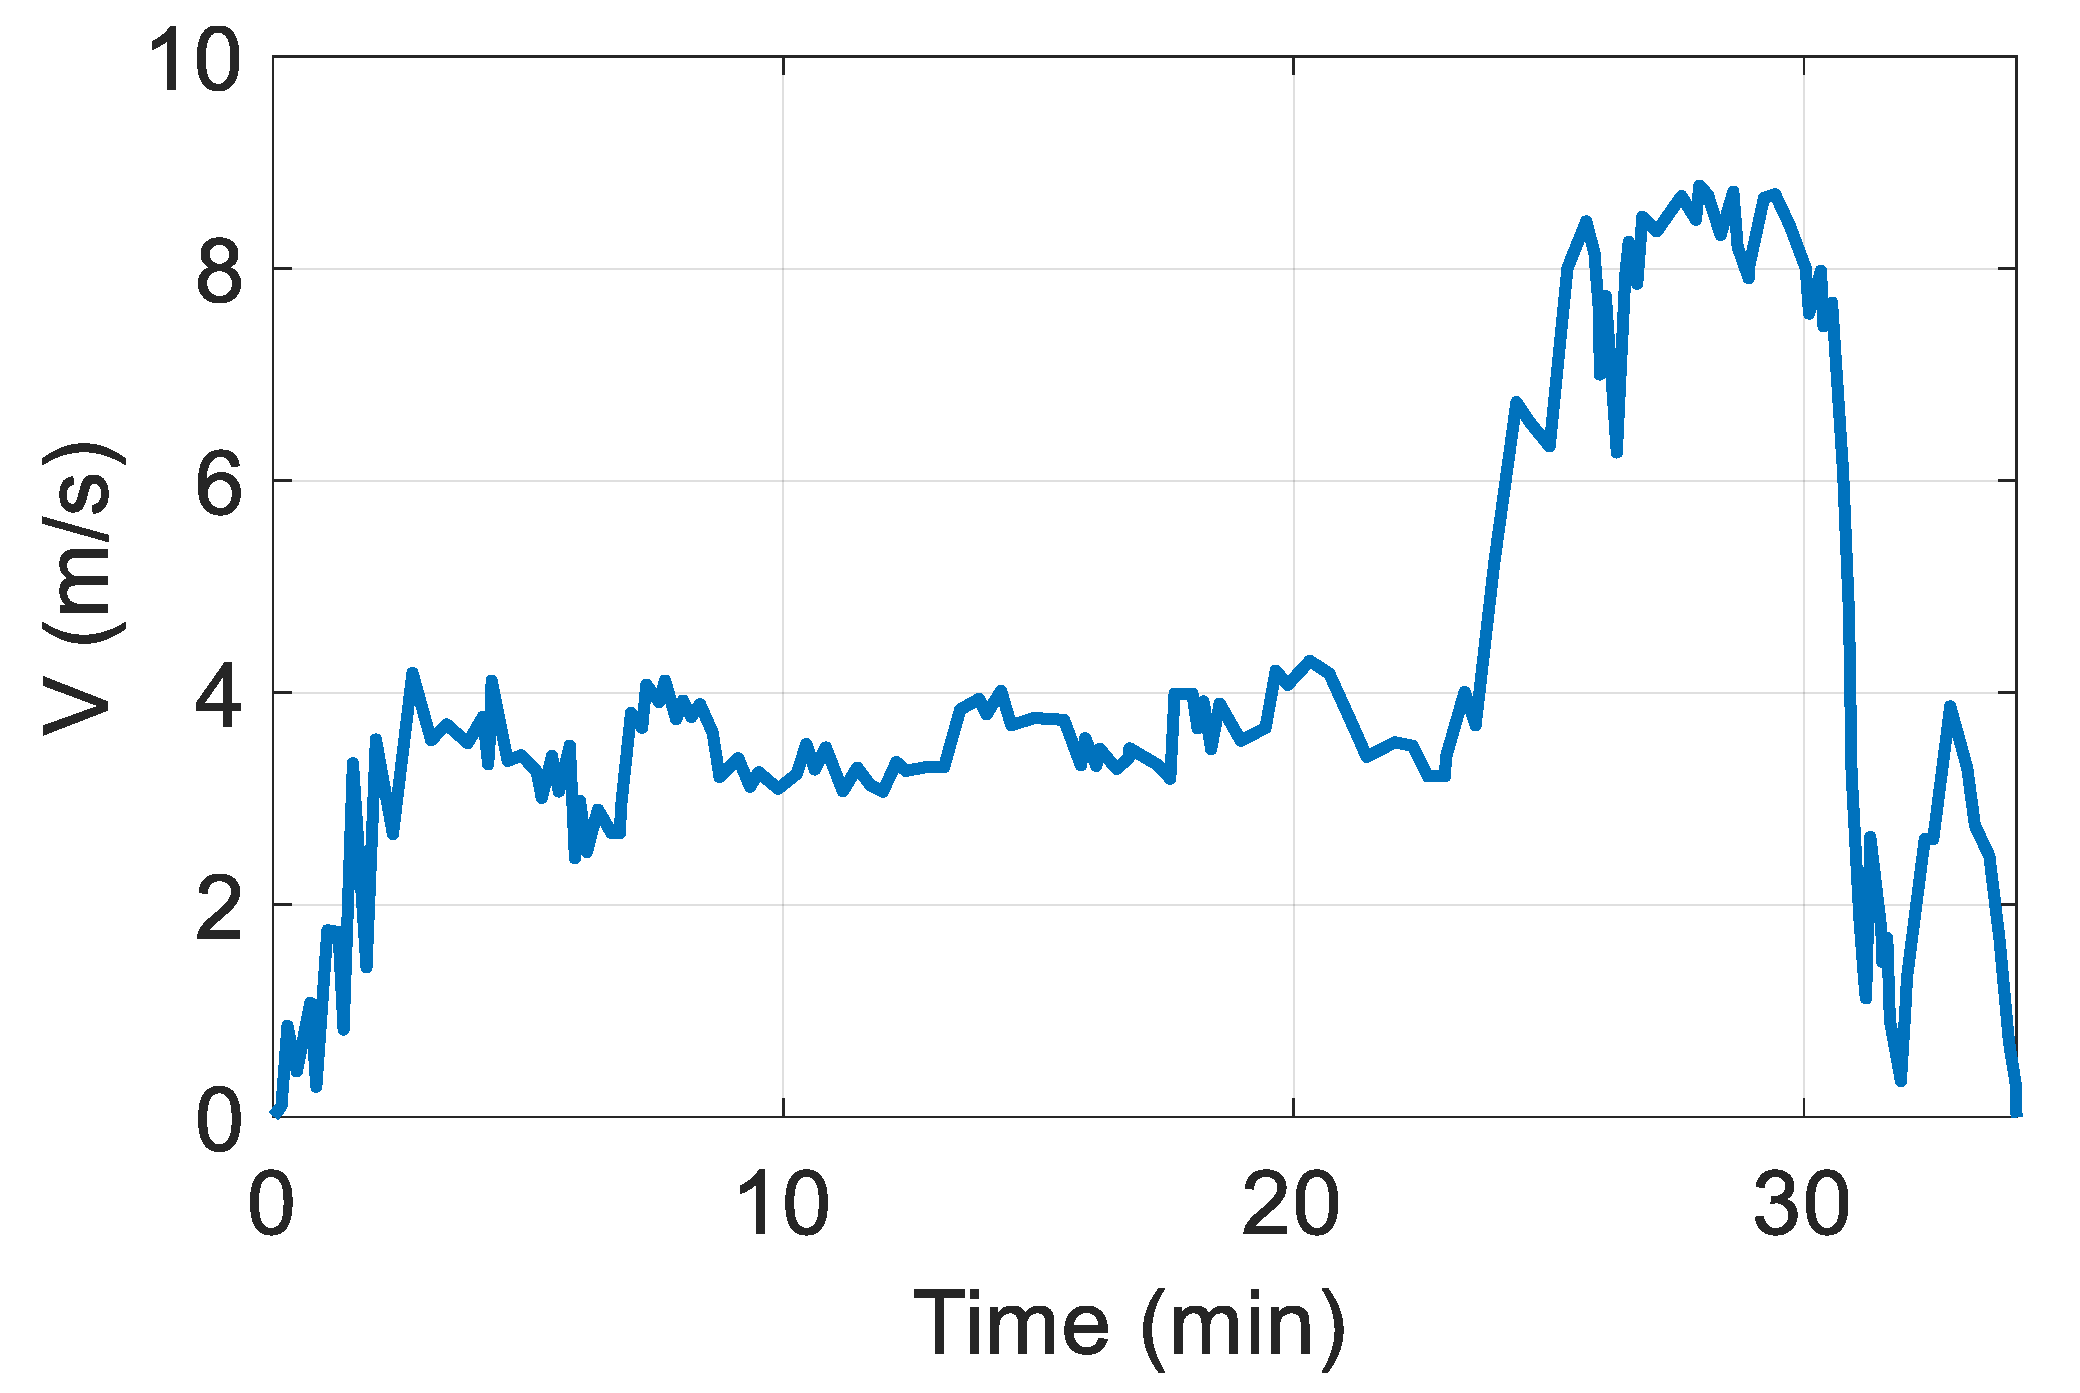
4.3. Operation Cycle

In this study, a case study was conducted using the proposed ship energy efficiency analysis environment to analyze the operation cycle shown in Figure 9. This operation cycle is used for a plug-in hybrid electric recreational boat operating on the Kuantan River (KT river) in Malaysia, with a cycle duration of 2050 s and an average speed of 4.1 m/s, 7.9 Knots, reaching a maximum speed of 8.25 m/s, 16 Knots. To achieve sufficient power consumption, an extended operation cycle with a duration of 16,400 s was created by repeating the original cycle eight times, and the analysis was conducted based on this extended cycle.

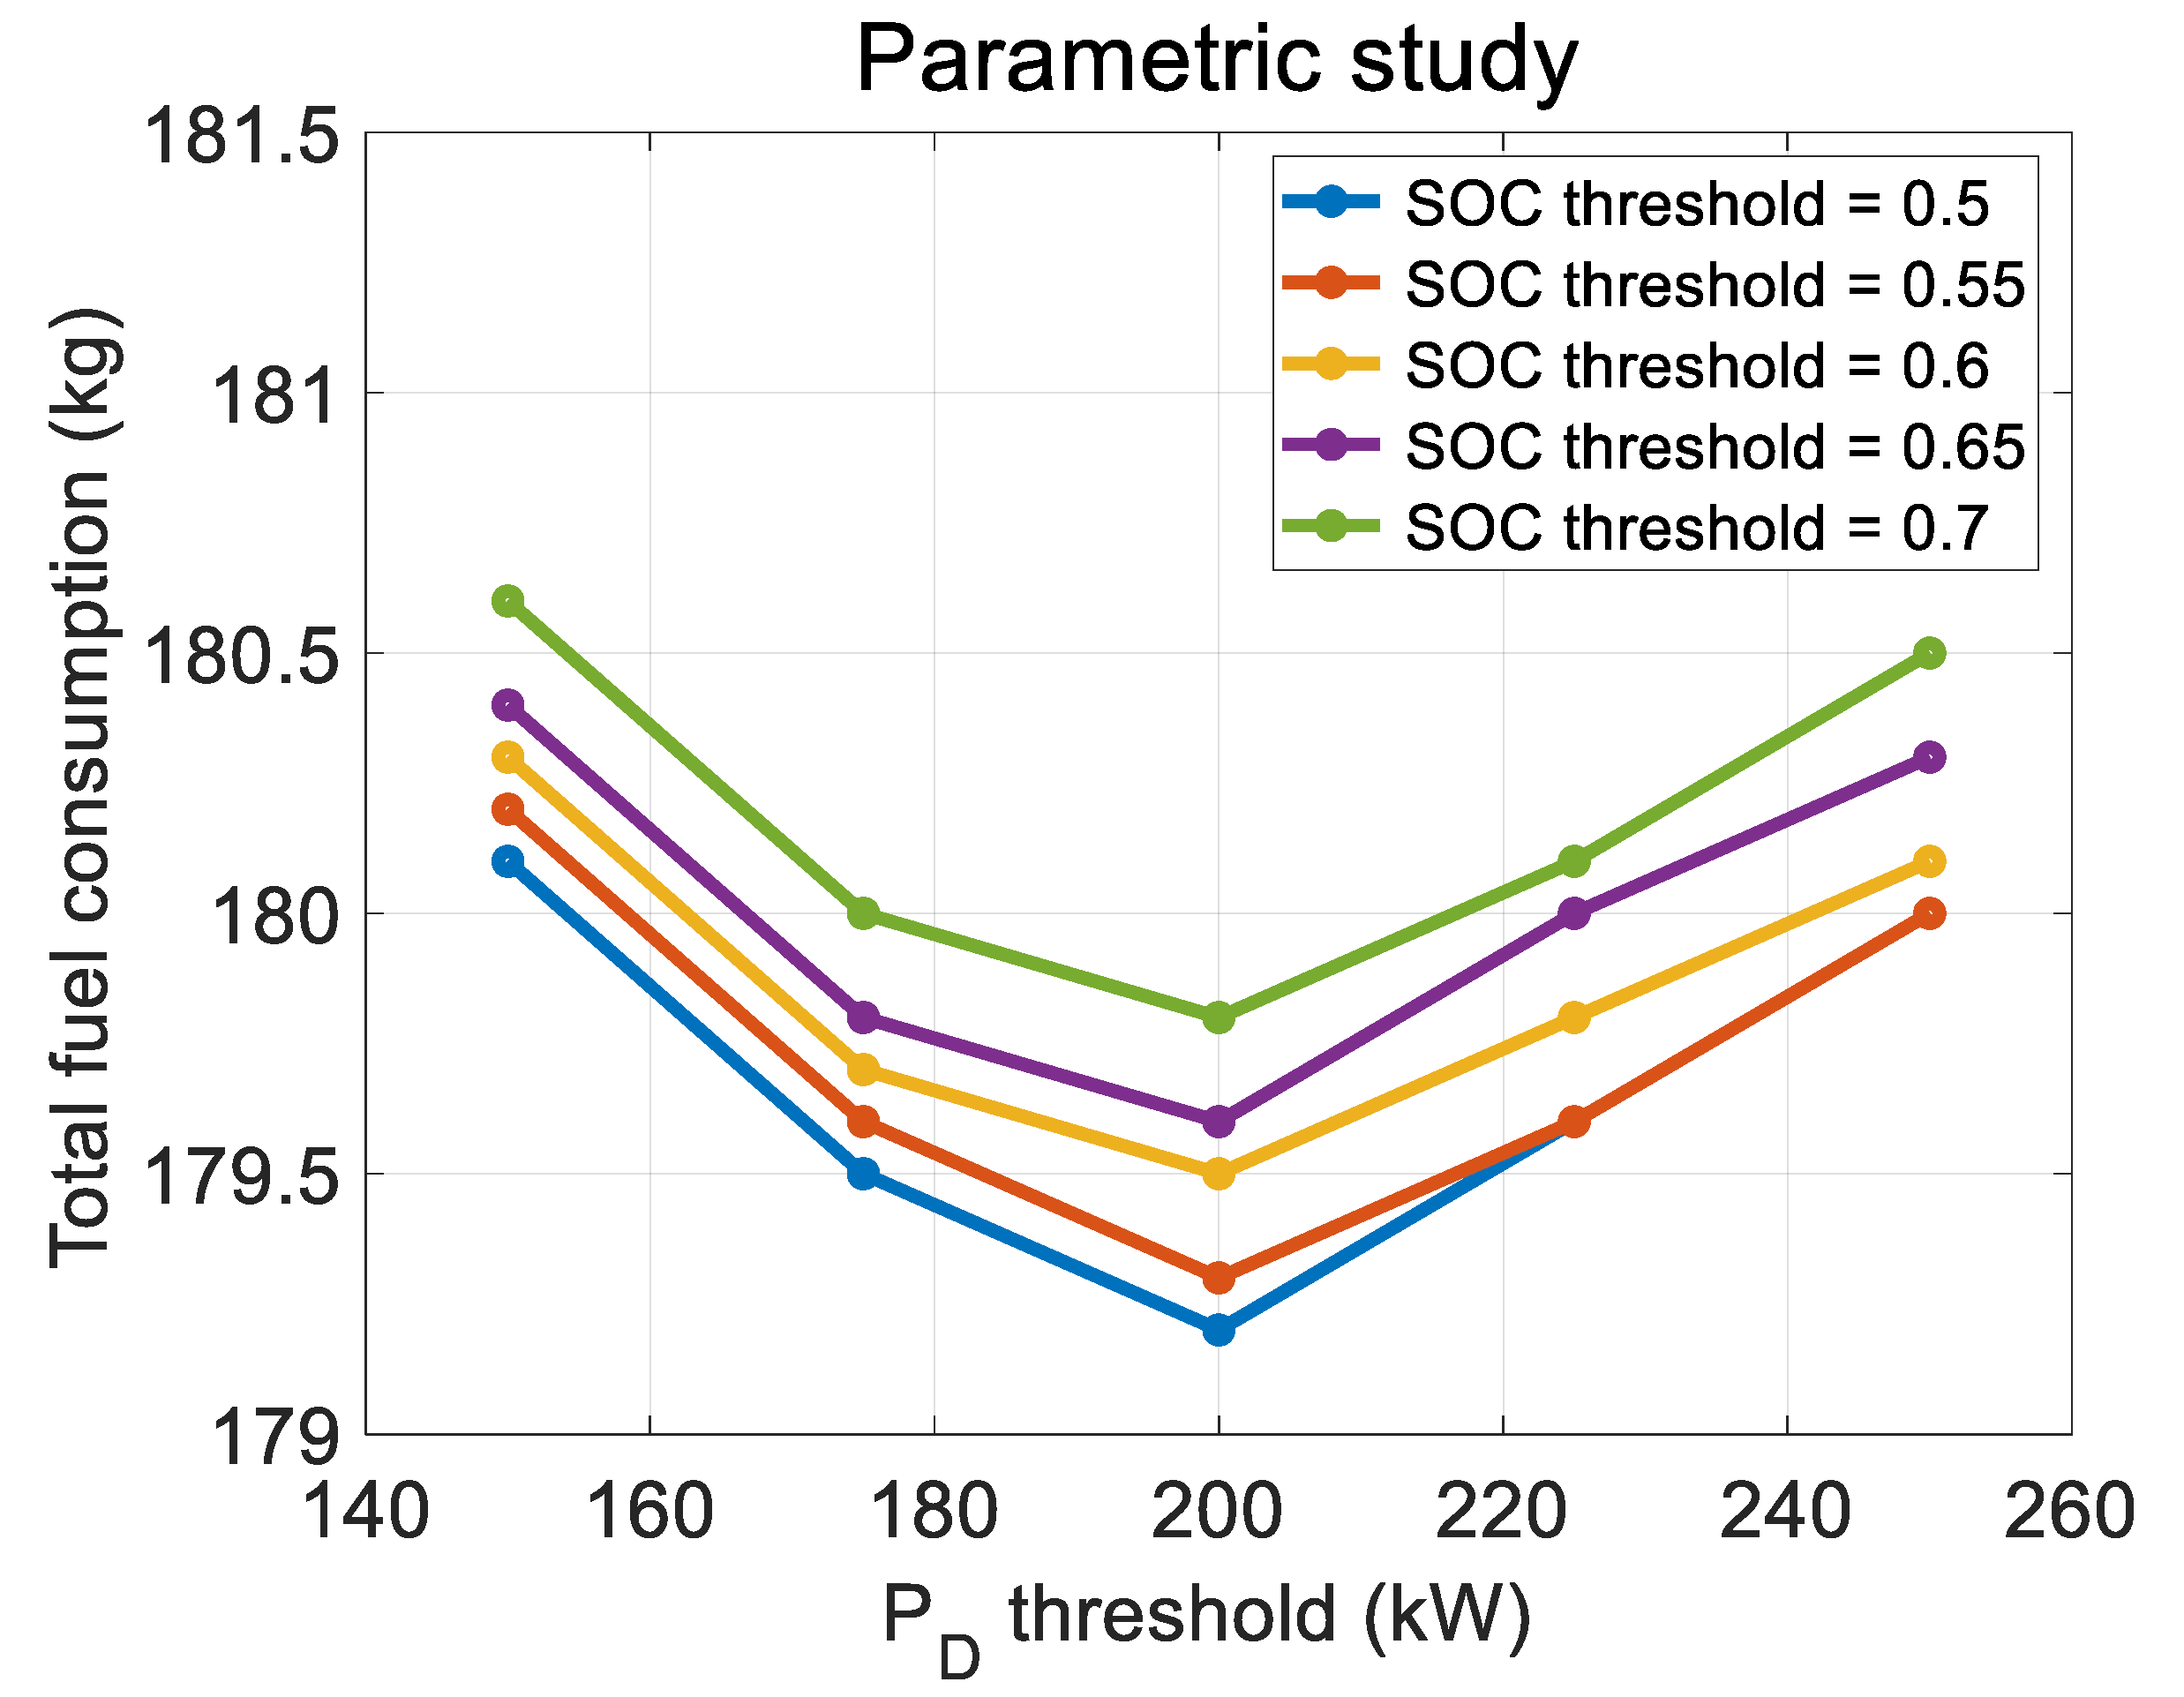
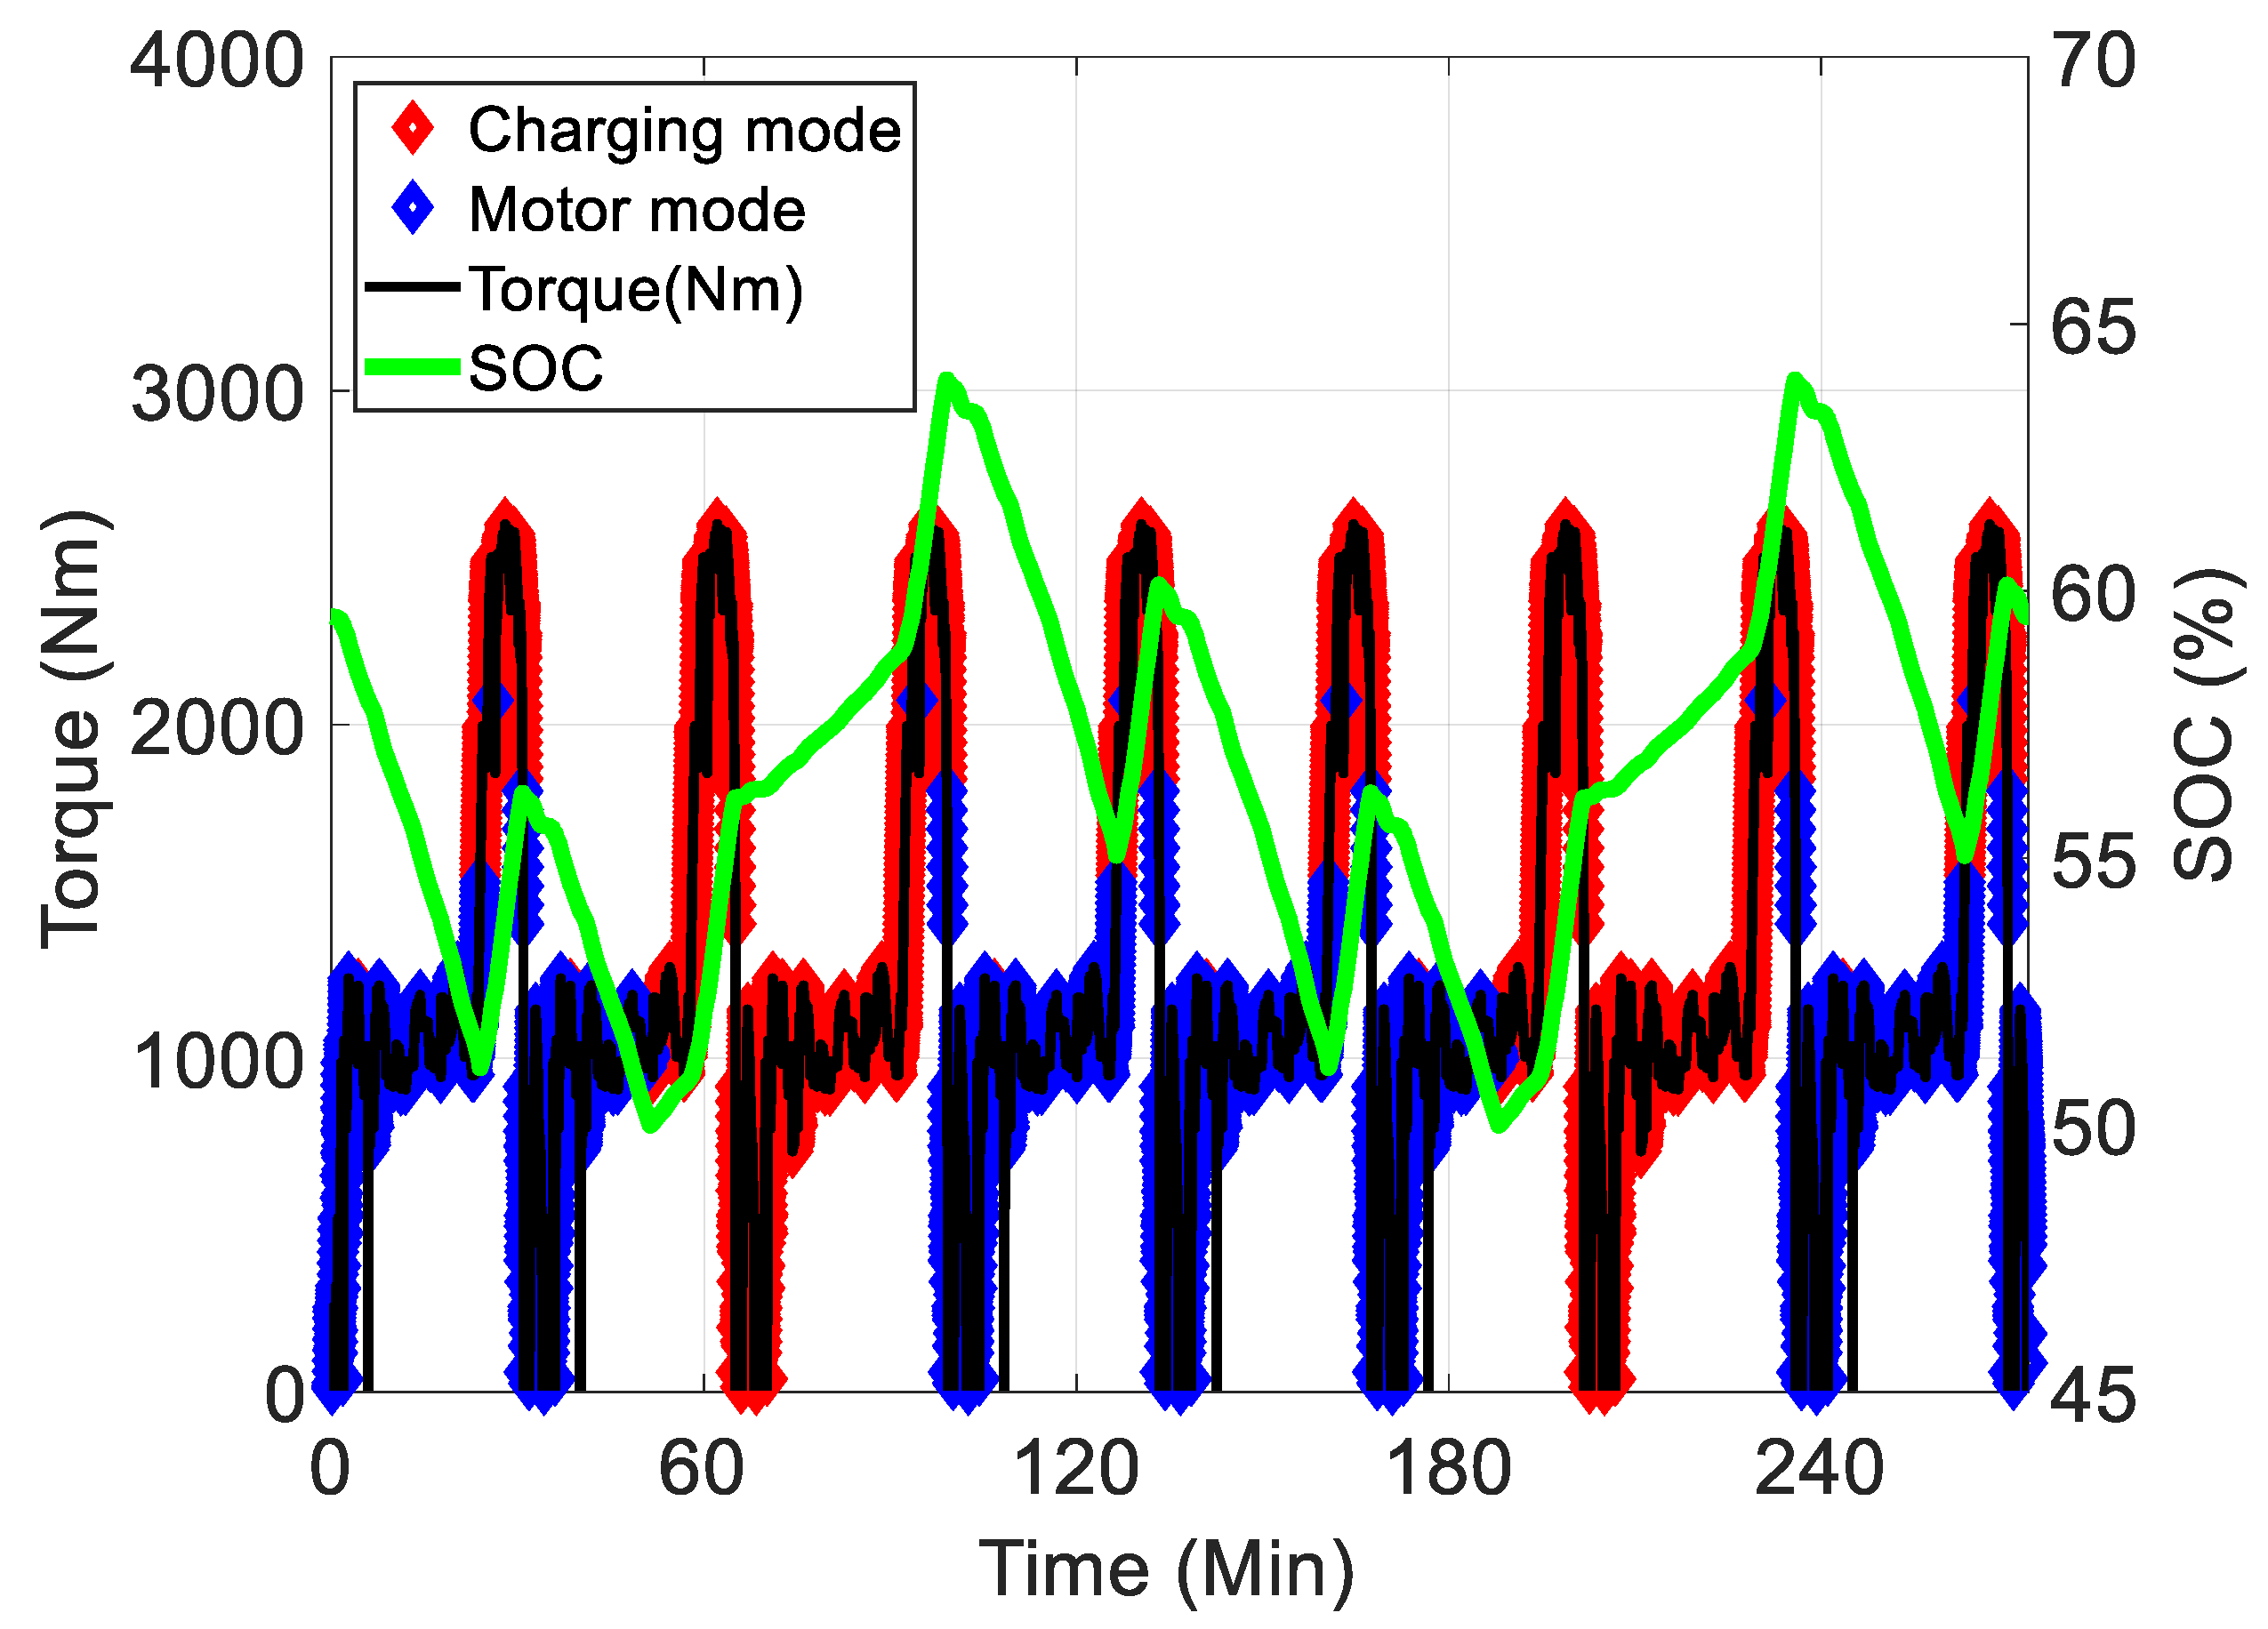
4.4. Rule-Based Power Control Strategy

Hybrid electric propulsion systems exhibit varying efficiency characteristics due to the different power sources they incorporate, making the optimization of the power distribution crucial for maximizing the overall efficiency. To achieve this, an appropriate control strategy that considers the characteristics of each power source is essential. Power control strategies can be classified into rule-based approaches and optimization approaches.
Among them, the rule-based control method is a technique for determining control policies based on predefined rules and conditions and is used in hybrid electric vehicle power control and various industries due to its fast calculation and simple application [35,36]. The ship targeted in this study is a parallel hybrid ship with various propulsion modes depending on the power distribution ratio, and this propulsion mode was stably changed and operated, and power distribution was performed by adopting an easily implementable rule-based control method. Figure 10 shows the flow chart of the rule-based hybrid power controller applied in this study. The control strategy is primarily based on the SOC threshold (SOC threshold) of the battery and the demanded power threshold ( P D threshold) to determine the operating mode. To prevent excessive SOC depletion, which can lead to battery discharge, the transition parameter for the control strategy was selected. For the parametric study that determines the policy of the rule-based approach, the fuel consumption according to the demanded power threshold and SOC threshold was derived through simulation. As shown in Figure 11, the demanded power threshold determining the transitions of the propulsion mode shows low fuel consumption around 200 kW, and it was confirmed that it is optimal at 50% of the SOC threshold. Therefore, in this study, the thresholds for the rule were selected as 200 kW for the power threshold and 50% for the SOC threshold that determine the propulsion mode of a parallel hybrid structure, respectively. Although the threshold parameters were investigated, this value cannot be guaranteed to be the optimal point for all situations because it can cause a lot of discharge depending on the battery resources. In addition, the optimal point should be adjusted through threshold analysis considering various situations for different cycles with different load characteristics.
In summary, the controller selects the motor mode when the SOC is greater than 50% and the required power is less than 200 kW, where the thrust is provided only by the electric motor. On the other hand, when the required power exceeds 200 kW, the system enters the charging mode. In this mode, the engine uses the excess power generated in excess of the required power to operate the motor as the generator to charge the battery while providing the thrust. It also enters the charging mode when the SOC is less than 50% until the system is over 60% charged.
As for the boost mode, it was not included in the current study. Without prior optimization of each power control variable, the boost mode may not offer a higher energy efficiency compared to the conventional diesel engine propulsion. However, in future research, the inclusion of the boost mode is planned, where the optimal control variables of each power source will be explored to further enhance the overall energy efficiency of the hybrid power system.

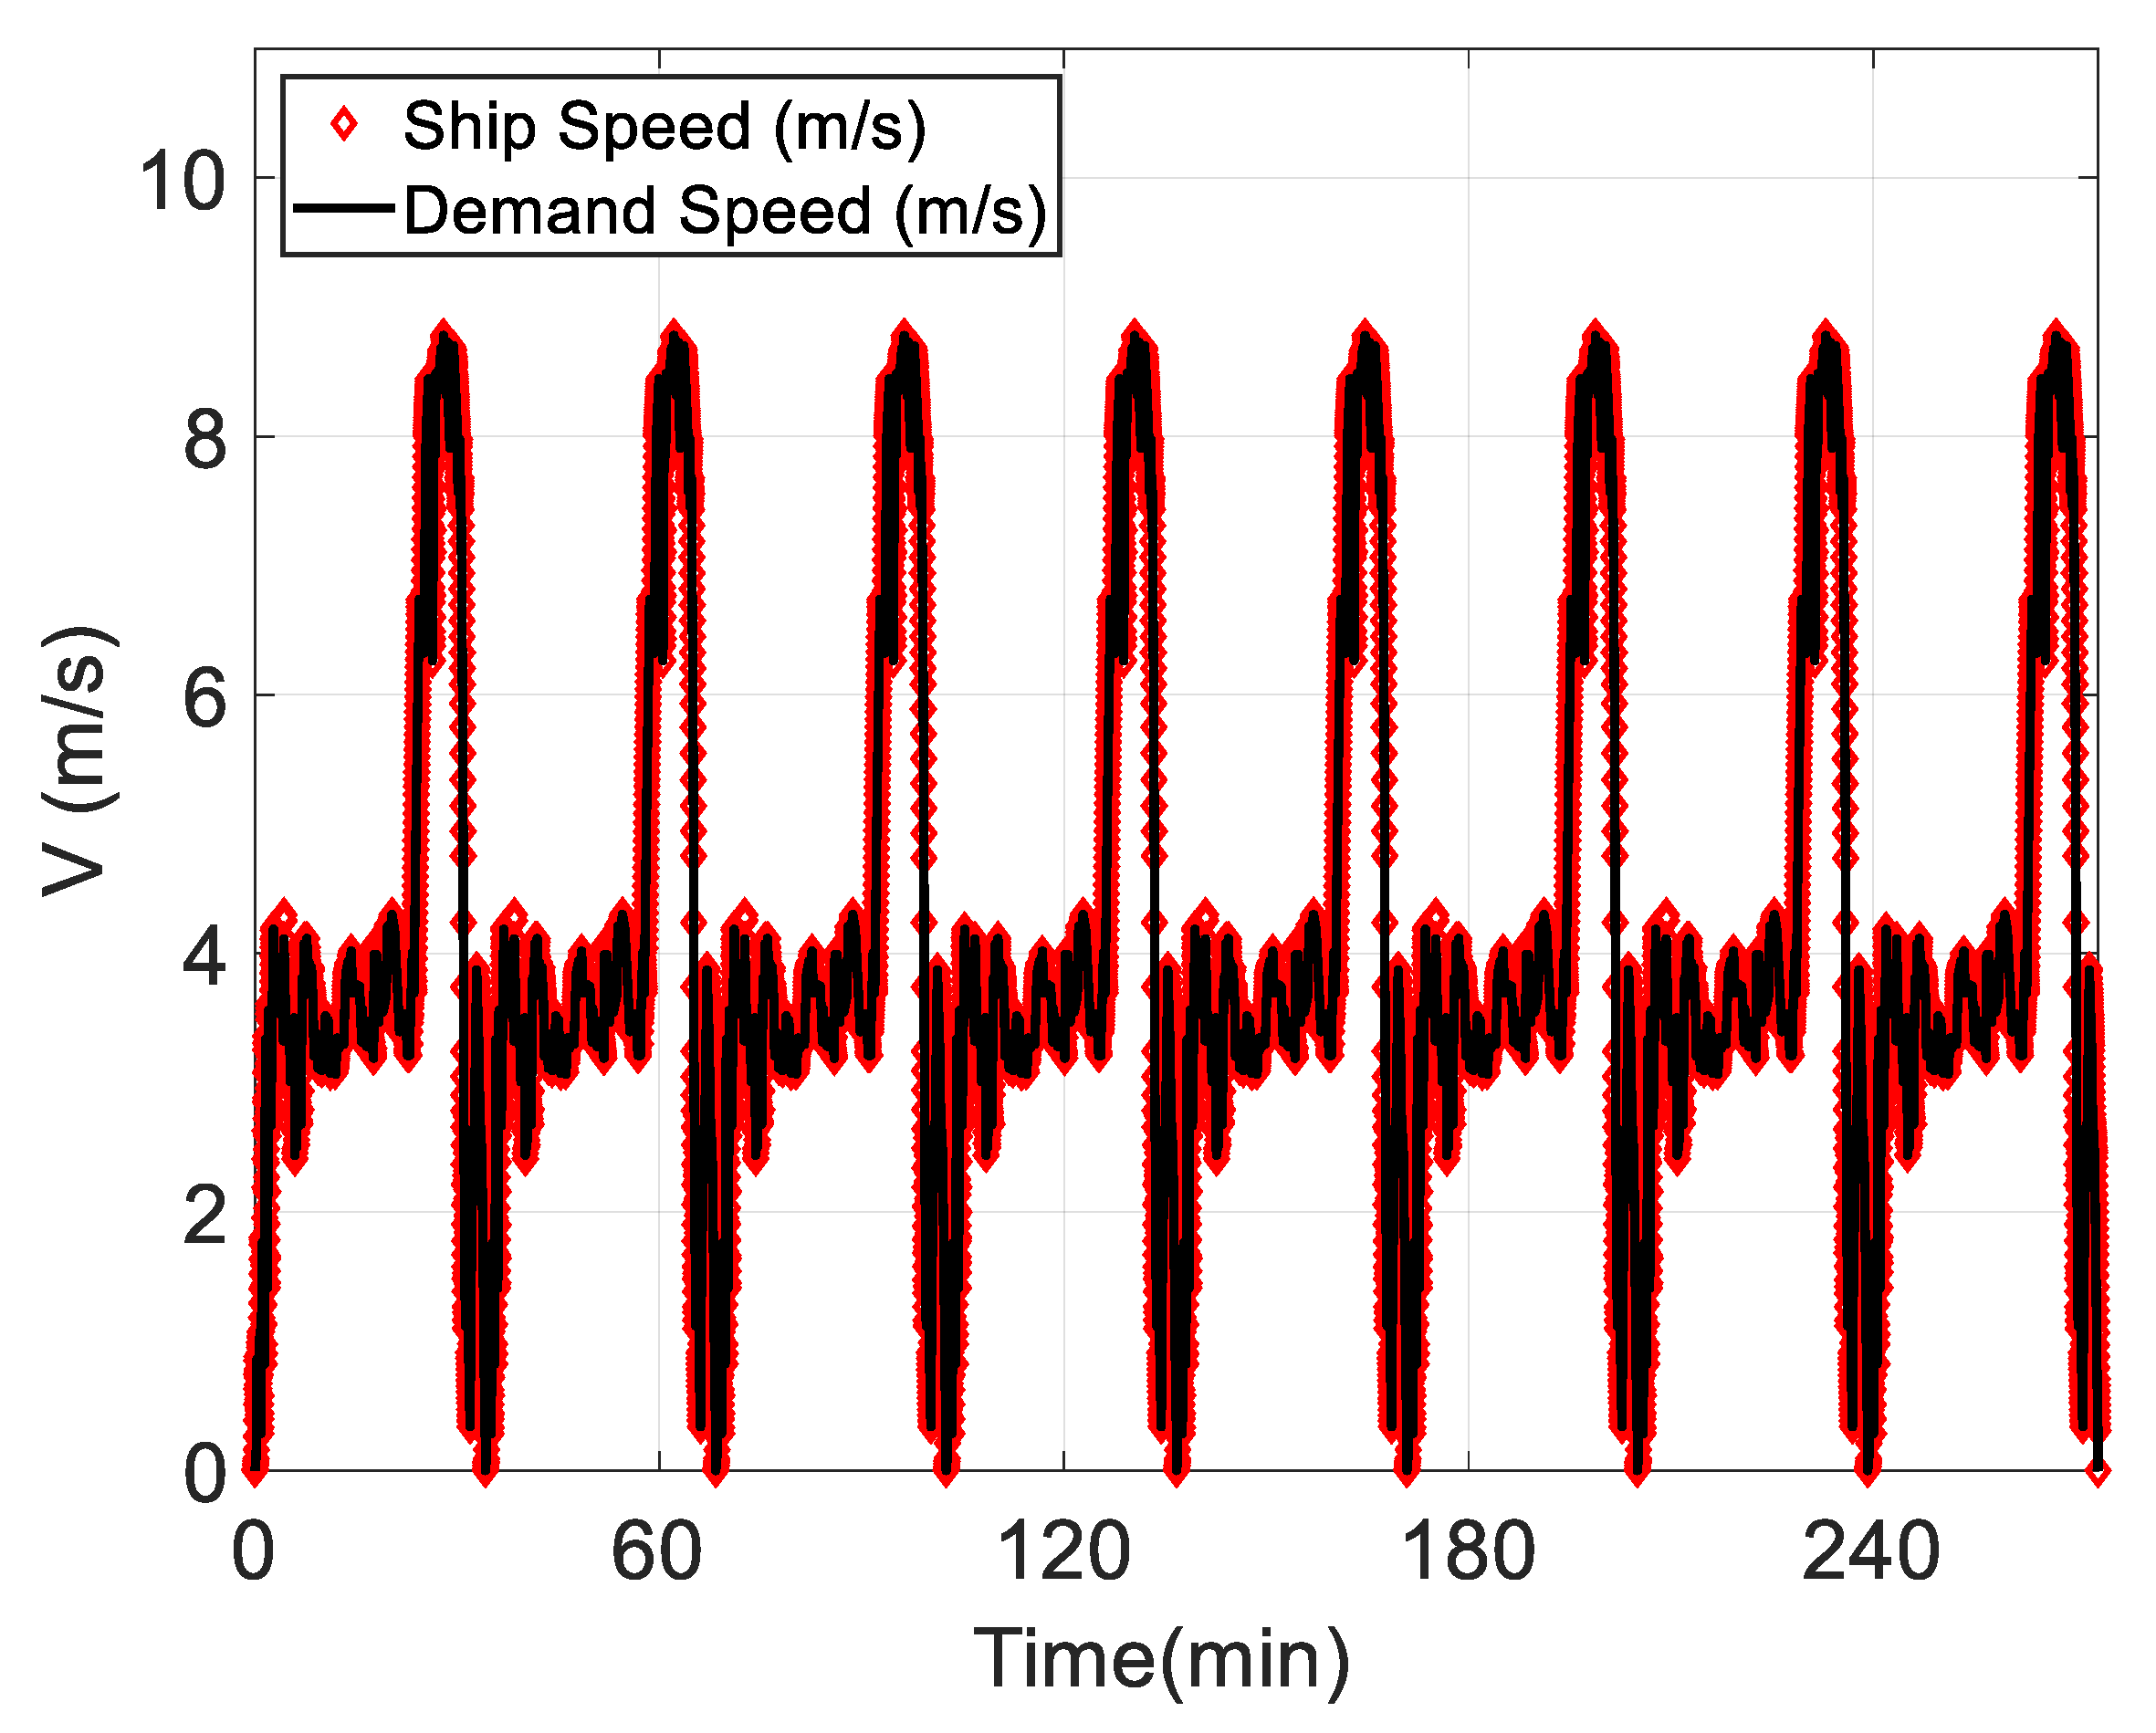
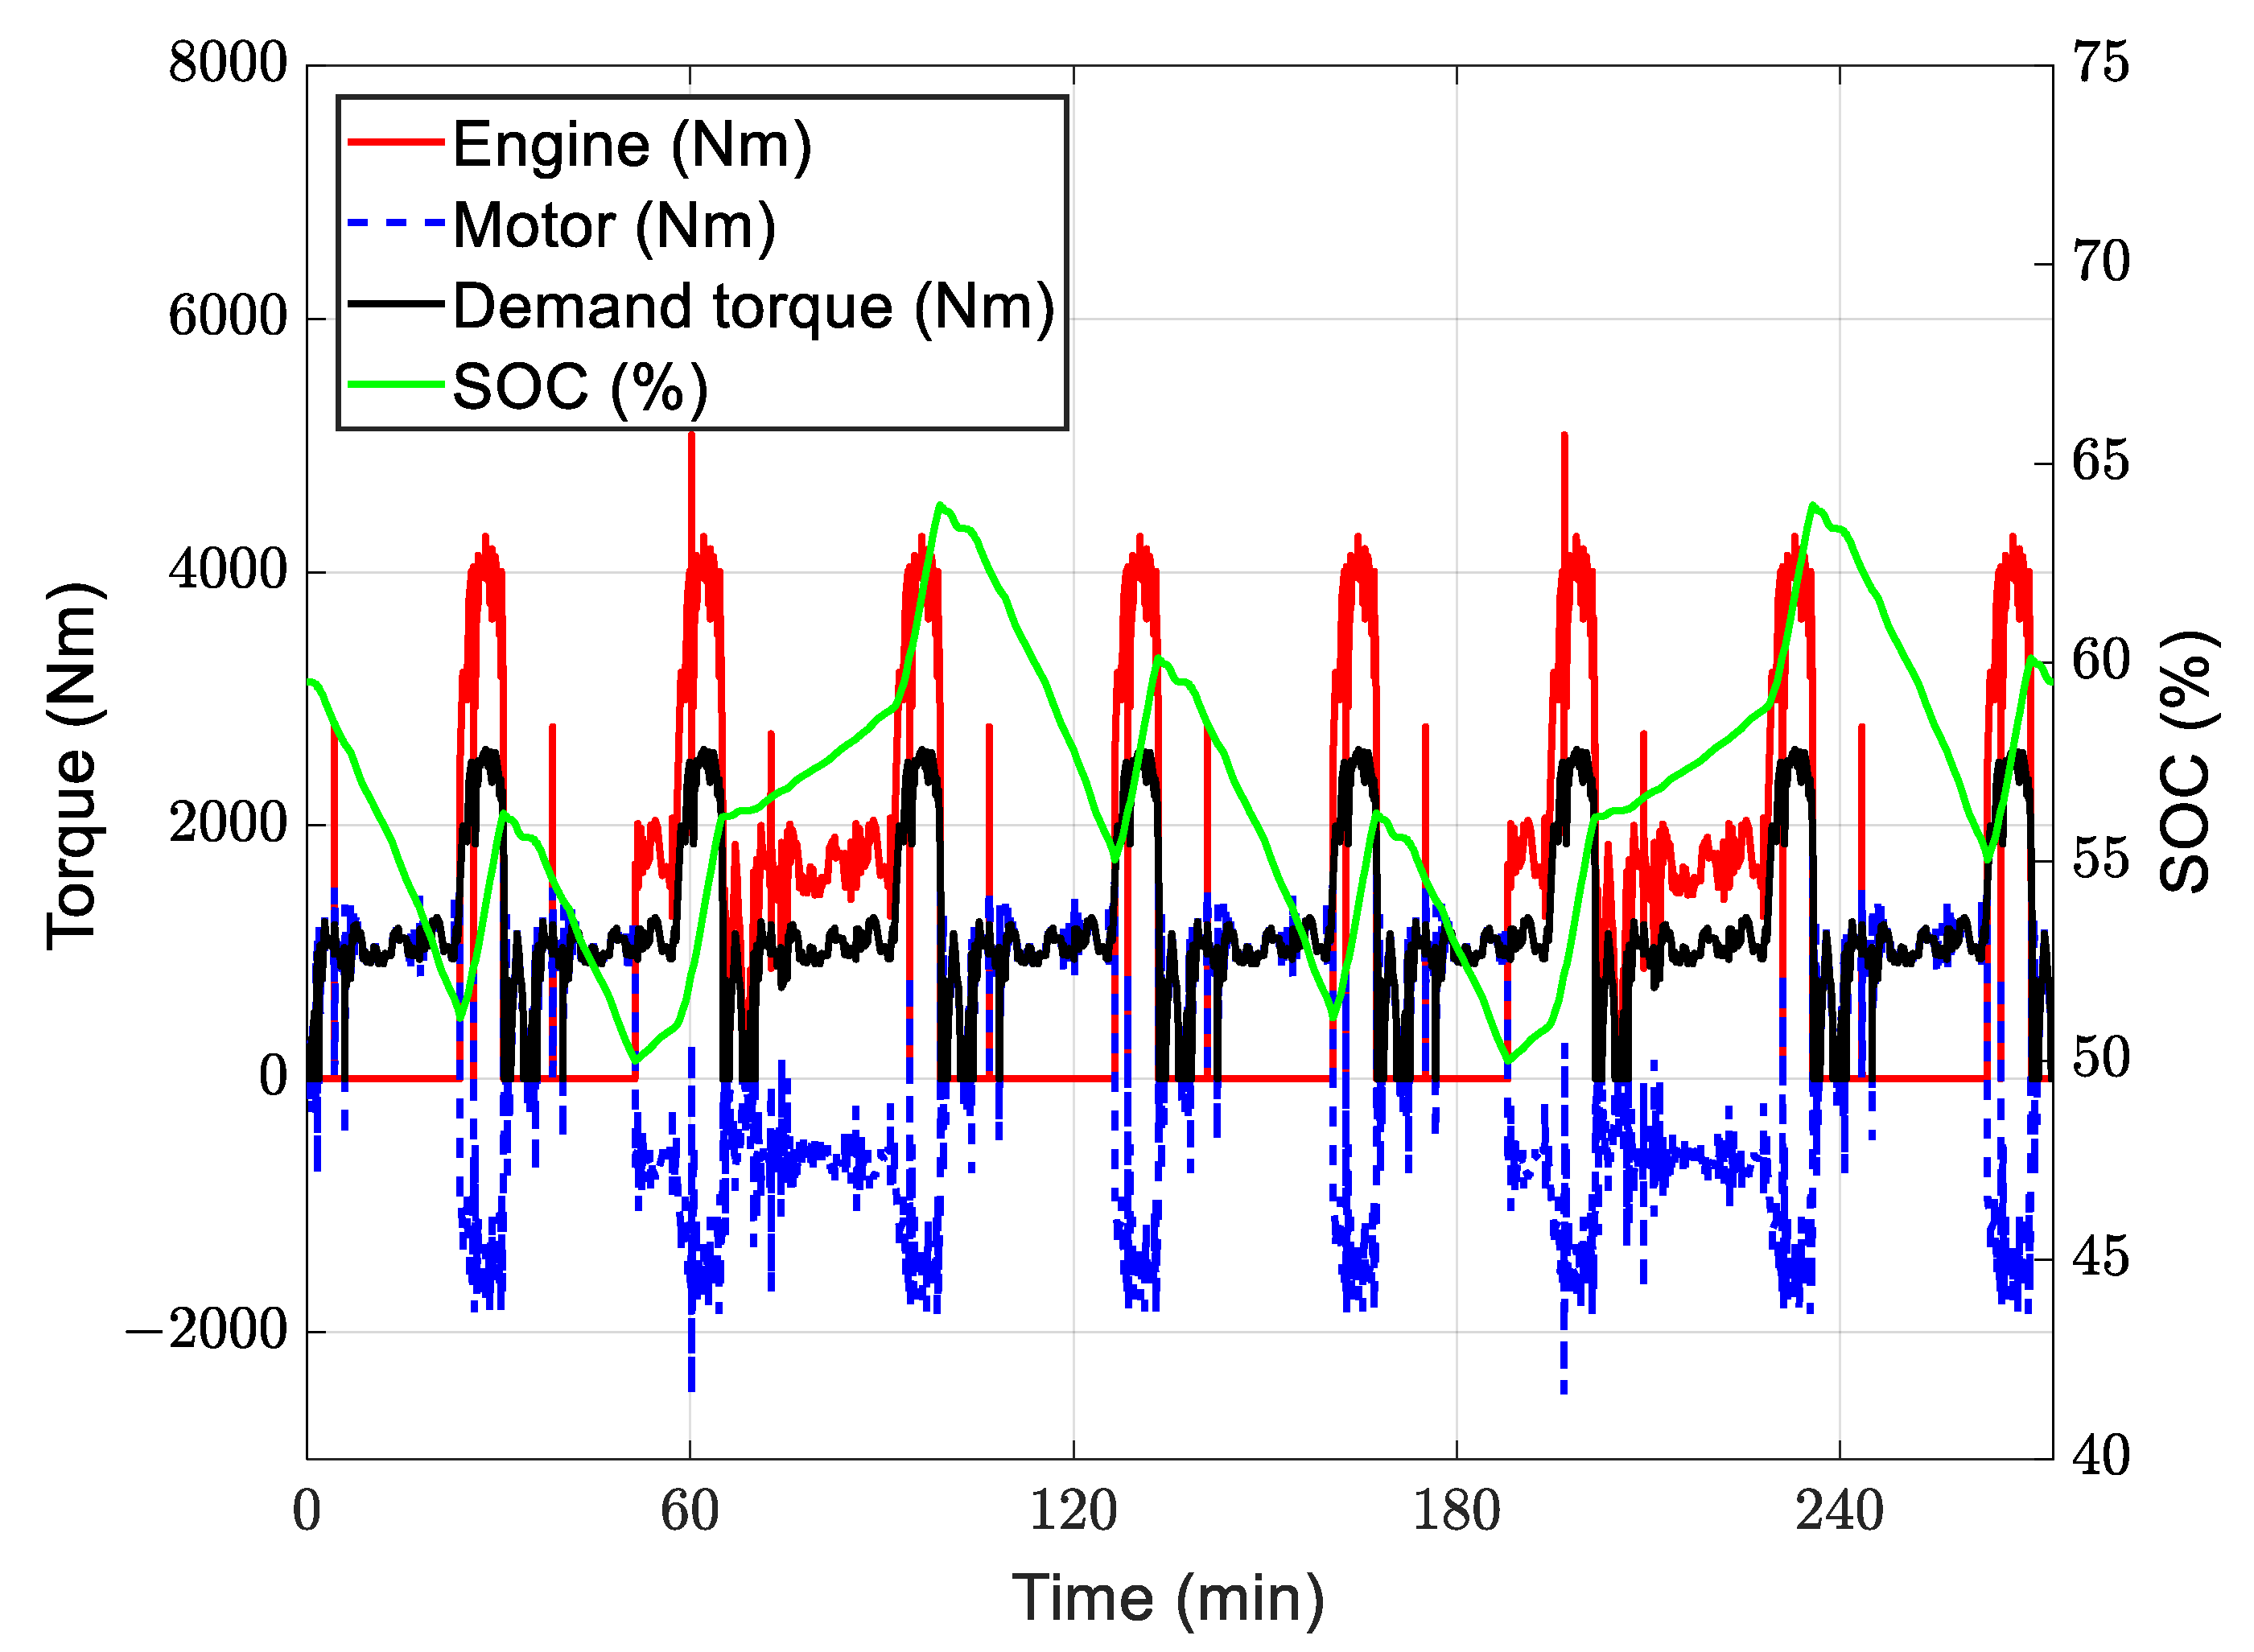
5. Simulation Results

5.1. Performance Analysis Result

The performance analysis results of the parallel hybrid propulsion ship for the defined operation cycle in Section 4 were obtained using the developed model. Figure 12 shows the ship’s demanded power calculated based on the Holtrop–Mennen method and the actual torque and revolutions per minute (RPM) of the ship’s propulsion shaft calculated using the propeller model with the demanded power as the input. Figure 13 shows the actual speed of the ship obtained through calculations that consider acceleration and deceleration, considering the inertial loads. It demonstrates how the powertrain system of the modeled ship accurately follows the demanded speed while considering the performance limits of the propulsion components and power sources during the operation cycle. The model simulates the dynamic characteristics and effects of the developed model, ensuring strict adherence to the constraints of the operation cycle and power source specifications.
Figure 14 depicts the power distribution of the hybrid propulsion system according to the rule-based controller explained in Section 4.4. Unlike the conventional mechanical propulsion method, the hybrid propulsion method determines the propulsion mode based on the SOC and demanded power using pre-defined rules, leading to a distribution of power between the engine and the motor. During the initial cycle starting period, the demanded power is below a certain threshold, so the ship operates in the motor mode, where the motor propels the ship independently within its performance range. As the demanded power increases beyond the threshold, the system switches to the charging mode, where the excess power generated by the engine over the demanded power is utilized by the motor, acting as a generator to charge the batteries while propelling the ship.
Figure 15 demonstrates how the hybrid propulsion system maintains the SOC by operating in the charging mode even during low-power segments. In the low-power segment, the ship is propelled solely by the motor. However, in the mid-power segment, the system switches to the charging mode, increasing the engine power rating to operate the engine at high efficiency operating points, ensuring optimal engine performance, and reducing fuel consumption and environmental emissions. Figure 16 illustrates the distribution of the operating modes during the cycle. Throughout the cycle, the system avoids engine operation in the low-power segment by utilizing the motor mode. On the other hand, during engine operation, the system employs the charging mode, allowing the engine to operate only in high efficiency regions, thus enhancing the energy efficiency during propulsion.

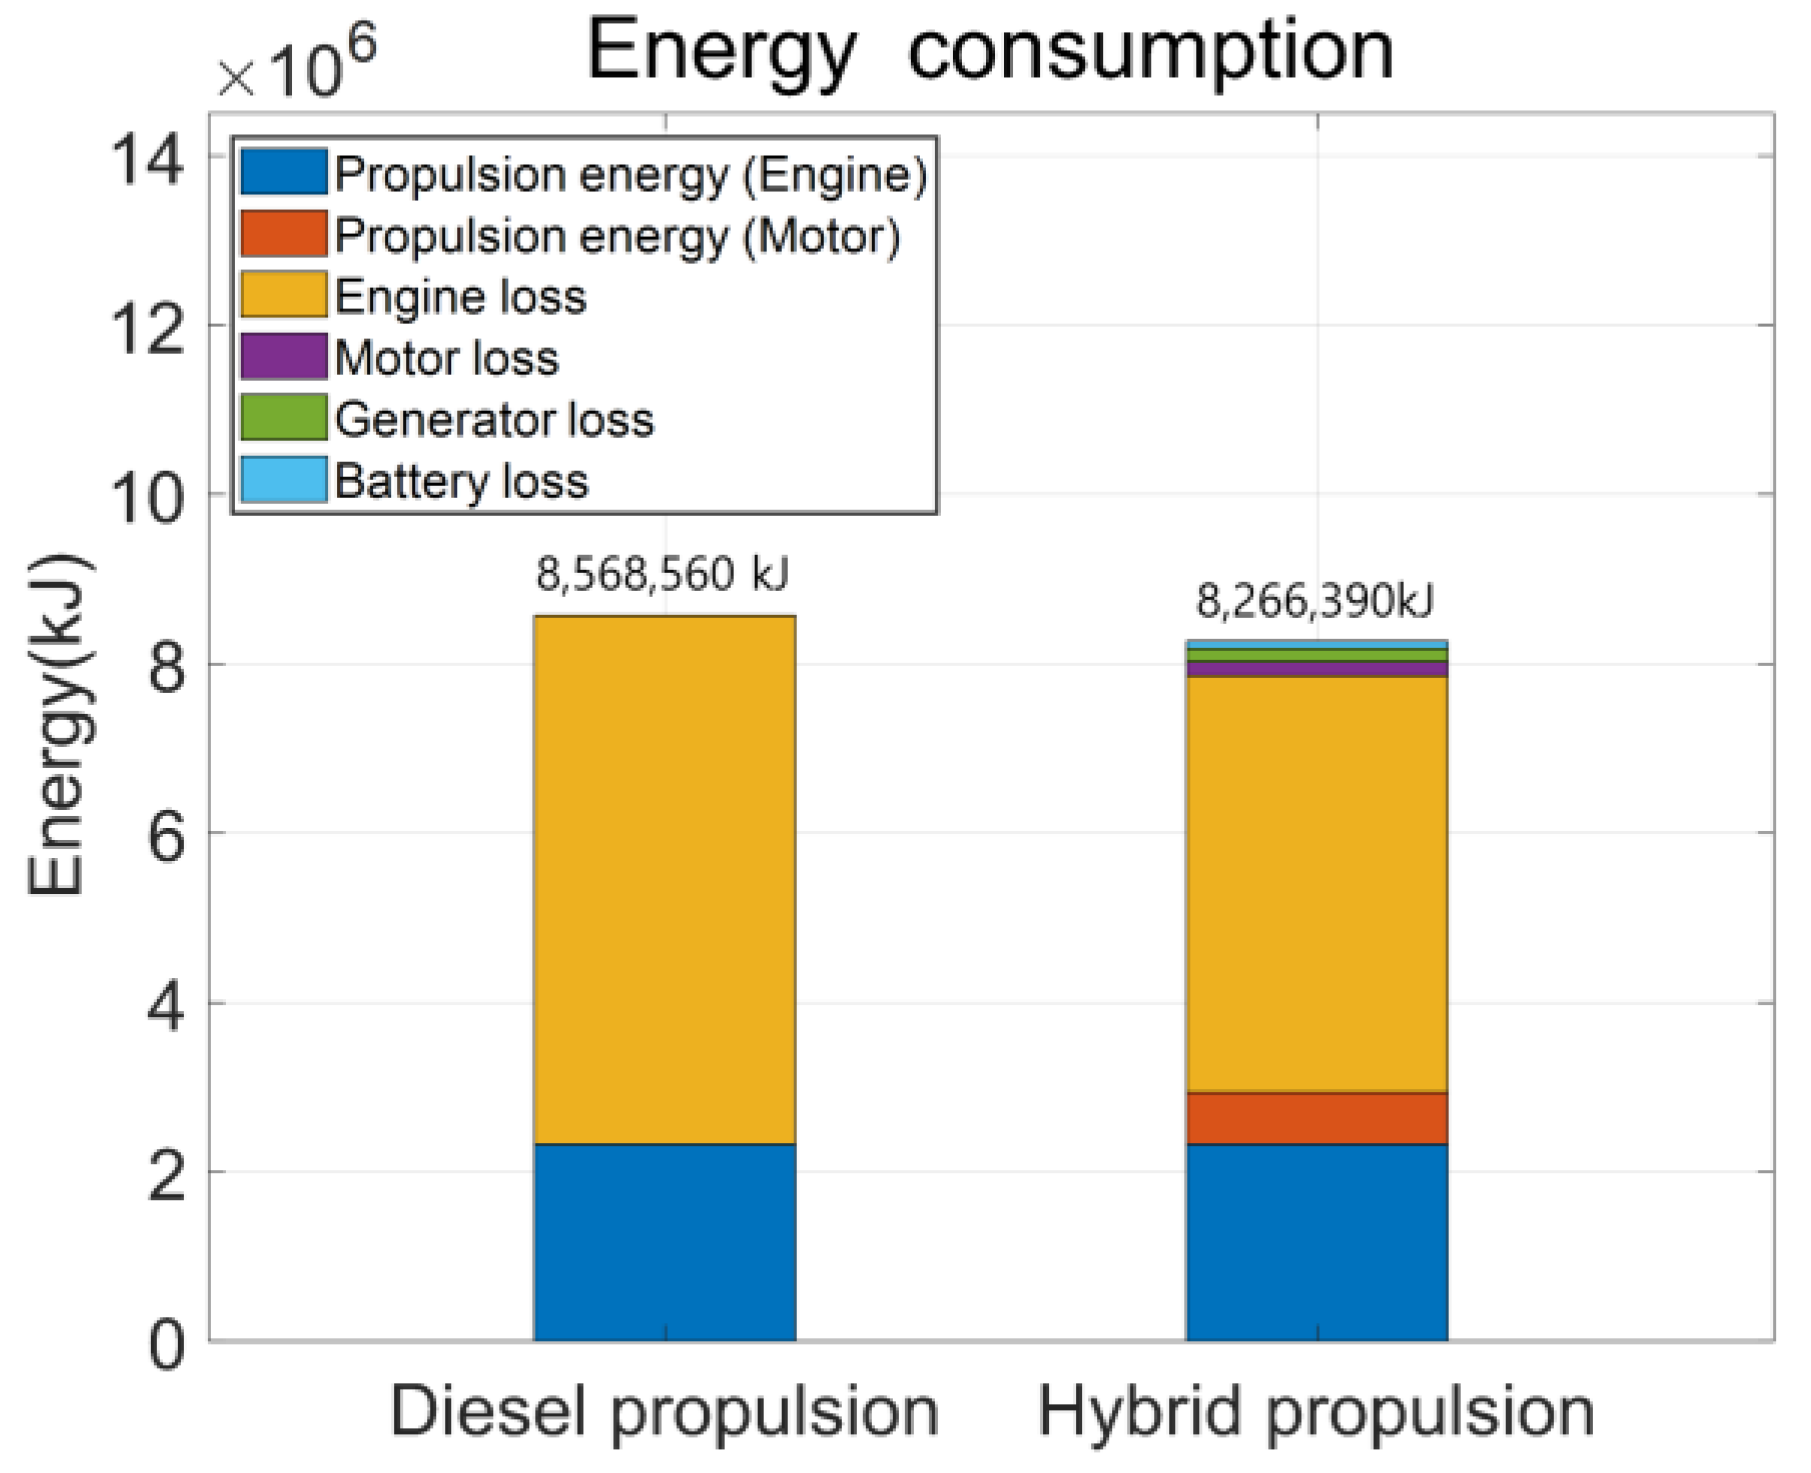
5.2. Comparison with the Diesel Propulsion Powertrain

In this study, the energy efficiency of a hybrid electric propulsion ship was analytically compared with a diesel engine-based ship to examine the characteristics of the hybrid electric propulsion system. The energy efficiency of the diesel engine-based ship was obtained using the simulation environment developed based on the hybrid electric propulsion ship, assuming zero motor usage in the power control strategy. The energy efficiency and fuel consumption of the existing mechanical propulsion system and the hybrid propulsion system were calculated for the operation cycle.
Firstly, examining the energy efficiency of each powertrain component, as shown in Table 3 and Figure 17, the engine efficiency for the conventional diesel engine propulsion system is 0.271, while the hybrid electric propulsion system shows an improved efficiency of 0.303. The fuel consumption is reduced by 21 kg for the entire operation cycle, representing a 10% improvement compared to the conventional mechanical propulsion system.
The hybrid propulsion system experiences increased propulsion power due to the combined driving of multiple power sources, which is influenced by the inertia of each power source. Additionally, there are energy losses in charging, propulsion, and power transfer within the electric motor. However, these losses are compensated for by increasing the engine efficiency, resulting in an overall reduction in energy consumption compared to the conventional system. As shown in Figure 18, the conventional diesel engine propulsion system operates solely based on the demanded power without considering the engine efficiency range (blue region in the map). On the other hand, the hybrid propulsion system operates more in an efficient range. The excess power is utilized to charge the batteries through the motor acting as a generator, ensuring a higher efficiency and demonstrating a superior performance.
Figure 19 compares the cumulative fuel consumption between the conventional diesel engine propulsion system and the hybrid propulsion system. In the diesel engine propulsion system, the engine needs to be constantly running throughout the cycle, leading to a linear increase in fuel consumption. On the other hand, the hybrid propulsion system operates differently in various power conditions, taking advantage of its unique features. In the low-power range where the initial engine efficiency is not optimal, the hybrid system relies on motor-only propulsion without using the engine. As the power demand increases to a certain level, the hybrid system switches to consider the engine efficiency and operates it efficiently while simultaneously charging the batteries to provide propulsion. This intelligent power management allows the hybrid system to achieve a reduced overall fuel consumption compared to the conventional propulsion method. The hybrid propulsion system provides an effective solution for vessels that frequently operate at low speeds and experience frequent load variations, mitigating issues related to incomplete combustion and fuel inefficiency. By utilizing motor-driven propulsion and optimizing engine operation, it addresses the challenges posed by certain ship types.
It is important to note that the selected parallel hybrid propulsion system in this study is a simple addition of electric motors and batteries to the existing diesel engine propulsion system without prior optimization of the power source sizes. Additionally, the control variables for each operating mode have not been fully optimized, and the boost mode has not been included. As a result, the maximum potential of the hybrid propulsion system, such as the reduction in the main engine size, has not been fully realized. Future research with the optimization of power sources and control variables is expected to achieve an even higher efficiency for the hybrid propulsion system.

6. Conclusions

In this study, a MATLAB/Simulink-based simulator was developed for the performance evaluation of a hybrid electric propulsion system for ships. The simulator was constructed using a back–forward approach-based model, which combines the backward quasi-static approach with the forward approach. Therefore, the simulator can calculate fuel consumption by inputting the speed profile, which is easy to obtain by including the dynamics of the ship. In addition, the Holtrop–Mennen method can be applied to quickly calculate the ship resistance, and through this, a structure has been implemented that can derive fast fuel consumption and performance. To drive the simulator, a parallel hybrid powertrain was configured by adding a 450 kW electric motor and a 450 kWh battery to an existing support vessel. The selected hybrid powertrain was then applied to a real operation cycle used in hybrid boat operations to assess the performance of the parallel hybrid powertrain for the chosen cycle.
Through the simulator, the performance of the existing diesel propulsion system and the parallel hybrid electric propulsion system were derived and compared. The hybrid propulsion system showed a significant improvement in engine efficiency, by considering the engine optimal operating points. The overall energy efficiency was enhanced by about 10%. As a result, when applying the parallel hybrid powertrain to the existing powertrain, there was a 10% reduction in fuel consumption. This effect is especially noticeable on ships with frequent load changes and low speed operation and is expected to be effective in reducing fuel consumption and exhaust gas emissions from the perspective of improving the energy efficiency by avoiding low-efficiency sections of the engine through auxiliary power sources.
The results derived from this study are simply the results of confirming the improvements in the parallel hybrid propulsion structure, which were constructed by adding batteries and electric motors to the existing propulsion structure through the developed simulator. However, it is difficult to determine that these results have been quantitatively verified. Therefore, in future studies, we plan to secure real-time climate data and the operation profile of the target ship to develop a more precise simulator, including additional resistance arising from waves and wind loads in the calculation process. Also, we will secure the reliability of the simulators developed through the power hardware in the loop simulator. Furthermore, as the rule-based approach selected through the current parametric studies cannot guarantee the optimal performance, we will utilize the improved simulators to optimize the power distribution control strategies along with the structure and size of the power source to maximize the performance.
The developed simulator can be useful in deriving a quantitative performance index in future research on the power system optimization of hybrid propulsion ships. Furthermore, it can be used as a digital twin model for hybrid ships and can be applied to predicting the condition of the ship and establishing an optimal operation schedule.

Author Contributions

S.H.H.: Conceptualization, investigation, methodology, writing. D.M.K.: Investigation, validation. S.J.K.: Project administration, conceptualization, investigation, validation, writing. All authors have read and agreed to the published version of the manuscript.

Funding

This work was supported by the National Research Foundation of Korea (NRF) grant funded by the Korea government (MSIT) (No. NRF-2022R1F1A 1070449) and supported by the Korea Institute for Advancement of Technology (KIAT) grant funded by the Korea Government (MOTIE) (P0017006, HRD Program for Industrial Innovation).

Institutional Review Board Statement

Not applicable.

Informed Consent Statement

Not applicable.

Data Availability Statement

Data not available due to legal (contract) restrictions.

Conflicts of Interest

The authors declare that they have no known competing financial interests or personal relationships that could have appeared to influence the work reported in this paper.

Appendix A

Table A1. Modeling parameter for the Holtrop–Mennen method resistance calculate.
SymbolValueSymbolValue
L W L 19.5 mW.S.A 155   m 2
L B P 19.5 m S a p p 60   m 2
B 7.46 m C P 0.785
T 1.7 m h B 0.34 m
69   m 3 T f 1.7 m
71 ton T a 1.7 m
δ 0 m A B T 15   m 2
S s t e r n 35   m 2 L C B a f t 14 m
C M 0.95 1 + k 2 2.8
C B 0.746

References

  1. Faber, S.; Hanayama, S.; Zhang, S. Fourth IMO GHG Study 2020-Fianl Report; International Maritime Organization (IMO): London, UK, 2020. [Google Scholar]
  2. International Maritime Organization. Initial IMO Strategy on Reduction of GHG Emissions from Ships; International Maritime Organization: London, UK, 2018. [Google Scholar]
  3. Roskilly, A.P.; Palacin, R.; Yan, J. Novel technologies and strategies for clean transport systems. Appl. Energy 2015, 157, 563–566. [Google Scholar] [CrossRef]
  4. Inal, O.B.; Charpentier, J.-F.; Deniz, C. Hybrid power and propusion systems for ship: Current status and future challenges. Renew. Sustain. Energy Rev. 2022, 156, 111965. [Google Scholar] [CrossRef]
  5. Hou, J. Control and Optimization of Electric Ship Propulsion Systems with Hybrid Energy Storage. Ph.D. Dissertation, University of Michigan, Ann Arbor, MI, USA, 2017. [Google Scholar]
  6. Castles, G.; Bendre, A. Economic benefits of hybrid drive propulsion for naval ships. In Proceedings of the 2009 IEEE Electric Ship Technologies Symposium, Baltimore, MD, USA, 20–22 April 2009; pp. 515–520. [Google Scholar]
  7. Sulligoi, G.; Castellan, S.; Aizza, M.; Bosisch, D.; Piva, L.; Lipardi, G. Active front-end for shaft power generation and voltage control in FREMM frigates integrated power system: Modelling and validation. In Proceedings of the 21st International Symposium on Power Electronics, Electrical Drives, Automation and Motion, Sorrento, Italy, 20–22 June 2012; pp. 452–457. [Google Scholar]
  8. de Waard, D.S. Parameterization of ship propulsion drives and their fuel efficiency under different operational modes and configurations. In Proceedings of the Engine as a Weapon VI Conference, Bath, UK, 23 May 2015; pp. 44–57. [Google Scholar]
  9. Balestra, L. Modelling simulation of a zero-emission hybrid power plant for a domestic ferry. Int. J. Hydrogen Energy 2021, 46, 10924–10938. [Google Scholar] [CrossRef]
  10. Guerrero, J.M.; Vasquez, J.; Matas, J.; de Vicuna, L.G.; Castilla, M. Hierarchical control of droop-controlled AC and DC microgrids—A general approach towards standardization. IEEE Trans. Ind. Electron. 2011, 58, 158–172. [Google Scholar] [CrossRef]
  11. Sciarretta, A.; Serrao, L.; Dewangan, P.C.; Tona, P.; Bergshoeff, E.N.D.; Bordons, C.; Charmpa, L.; Elbert, P.; Eriksson, L.; Hofman, T.; et al. A control benchmark on the energy management of a plug-in hybrid electric vehicle. Control Eng. Pract. 2014, 29, 287–298. [Google Scholar] [CrossRef]
  12. Breijs, A.; Amam, E.E. Energy management—Adapt your engine to every mission. In Proceedings of the 13th International Naval Engineering Conference, Bristol, UK, 20–22 July 2016; pp. 1–8. [Google Scholar]
  13. Caledonian Maritime Assets Limited. Hybrid Ferries Project. Available online: http://www.cmassets.co.uk/project/hybrid-ferries-project/ (accessed on 16 December 2023).
  14. Wang, X.; Shipurkar, U.; Haseltalab, A.; Polinder, H.; Claeys, F.; Negenborn, R.R. Sizing and control of a hybrid ship propulsion system using multi-objective double-layer optimization. IEEE Access 2021, 9, 72587–72601. [Google Scholar] [CrossRef]
  15. Silvas, E.; Hofman, T.; Murgovski, N.; Etman, L.F.P.; Steinbuch, M. Review of optimization strategies for system-level design in hybrid electric vehicles. IEEE Trans. Veh. Technol. 2017, 66, 57–70. [Google Scholar] [CrossRef]
  16. Liu, J.; Peng, H. Modeling and control of a power-split hybrid vehicle. Trans. Control Syst. Technol. 2008, 16, 1242–1251. [Google Scholar]
  17. Zhang, W.; Maleki, A.; Birjandi, A.K.; Nazari, M.A.; Mohammadi, O. Discrete optimization algorithm for optimal design of a solar/wind/battery hybrid energy conversion scheme. Int. J. Low-Carbon. Technol. 2020, 115, 326–340. [Google Scholar] [CrossRef]
  18. Dinh, T.Q.; Bui, T.M.N.; Marco, J.; Watts, C.; Yoon, J.I. Optimal energy management for hybrid electric dynamic positioning vessels. IFAC-PapersOnLine 2018, 54, 98–103. [Google Scholar] [CrossRef]
  19. Bui, T.M.N.; Dinh, T.Q.; Marco, J.; Watts, C. Development and Real-Time Performance Evaluation of Energy Management Strategy for a Dynamic Positioning Hybrid Electric Marine Vessel. Electronics 2021, 10, 1280. [Google Scholar] [CrossRef]
  20. Sajjad, M.; Shahariar, G.M.; Chu-Van, T.; Suara, K.A.; Zare, A.; Bodisco, T.; Brown, R. Developing a transient drive cycle representing ship acceleration with test-bed engine. In Proceedings of the 22nd Australasian Fluid Mechanics Conference AFMC2020, Brisbane, Australia, 6–10 December 2020; pp. 7–10. [Google Scholar]
  21. Markel, T.; Brooker, A.; Hendricks, T.; Johnson, V.; Kelly, K.; Kramer, B.; O’Keefe, M.; Sprik, S.; Wipke, K. ADVISOR: A systems analysis tool for advanced vehicle modeling. J. Power Sources 2002, 110, 255–266. [Google Scholar] [CrossRef]
  22. Ehsani, M.; Gao, Y.; Miller, J.M. Hybrid electric vehicles: Architecture and motor drives. Proc. IEEE 2007, 95, 719–728. [Google Scholar] [CrossRef]
  23. Geertsma, R.D.; Negenborn, R.R.; Visser, K.; Hopman, J.J. Parallel control for hybrid propulsion of multifunction ships. IFAC-PapersOnLine 2017, 50, 2296–2303. [Google Scholar] [CrossRef]
  24. Momoh, O.D.; Omoigui, M.O. An overview of hybrid electric vehicle technology. In Proceedings of the 2009 IEEE Vehicle Power and Propulsion Conference, Dearborn, MI, USA, 7–11 September 2009; pp. 1286–1292. [Google Scholar]
  25. Ship Technology. MS Roald Amundsen Polar Cruise Ship. Available online: https://www.ship-technology.com/projects/ms-roald-amundsen-polar-cruise-ship/ (accessed on 16 December 2023).
  26. Power&Motoryacht. Mochi 23M Hybrid. Available online: https://www.powerandmotoryacht.com/boat-tests/mochi-23m-hybrid/ (accessed on 16 December 2023).
  27. Chen, D.; Li, X.; Chen, L.; Yang, L.; Tian, F.; Xu, D. Research on Simulation of the Hybrid Electric Vehicle Based on Software ADVISOR. Sens. Transducers 2014, 171, 68–78. [Google Scholar]
  28. Lewandowski, E.M. The Dynamics of Marine Craft, Maneuvering and Seakeeping; World Scientific: Washington, DC, USA, 2004. [Google Scholar]
  29. Korotkin, A.I. Added mass of ship structure. In Fluid Mechanics and Its Applications; Academic Press: Cambridge, MA, USA, 2009; Volume 88. [Google Scholar]
  30. Carlton, J. Marine Propellers and Propulsion; Butterworth-Heinemann: Oxford, UK, 1994. [Google Scholar]
  31. Nikolopoulos, L.; Boulougouris, E. A Study on the Statistical Calibration of the Holtrop and Mennen Approximate Power Prediction Method for Full Hull Form, Low Froude Number Vessels. J. Ship Prod. Des. 2019, 35, 41–68. [Google Scholar] [CrossRef]
  32. Holtrop, J.; Mennen, G. An Approximate Power Prediction Method. Int. Shipbuild. Prog. 1982, 29, 166–170. [Google Scholar] [CrossRef]
  33. Deng, R.; Hu, S.W.Y.; Wang, Y.; Wu, T. The Effect of Hull Form Parameters on the Hydrodynamic Performance of a Bulk Carrier. J. Mar. Sci. Eng. 2021, 9, 373. [Google Scholar] [CrossRef]
  34. Norbakyah, J.S.; Atiq, W.H.; Salisa, A.R. Power requirements for PHERB powertrain. IOP Conf. Ser. Mater. Sci. Eng. 2015, 100, 012035. [Google Scholar] [CrossRef]
  35. Ding, N.; Prasad, K.; Lie, T.T. Design of a hybrid energy management system using de-signed rule-based control strategy and genetic algorithm for the series-parallel plug-in hybrid electric vehicle. Energy Res. 2021, 45, 1627–1644. [Google Scholar] [CrossRef]
  36. Peng, J.; He, H.; Xiong, R. Rule based energy management strategy for a series–parallel plug-in hybrid electric bus optimized by dynamic programming. Appl. Energy 2017, 185, 1633–1643. [Google Scholar] [CrossRef]
Figure 1. Typical hybrid propulsion system architectures for a ship (left: series hybrid architecture, right: parallel hybrid architecture).
Jmse 12 00009 g001
Figure 2. Modeling approaches to assess energy efficiency of propulsion system (left: average operating approach, middle: quasi-static approach, right: dynamic approach).
Jmse 12 00009 g002
Figure 3. Back–forward quasi-static approach model for the hybrid electric propulsion ship.
Jmse 12 00009 g003
Figure 4. Simulation layout with modularized model components on MATLAB-Simulink environment.
Jmse 12 00009 g004
Figure 5. Calculation flow to obtain ship propulsion demand power based on the Holtrop–Mennen resistance model.
Jmse 12 00009 g005
Figure 6. Ship resistance values with respect to ship speed.
Jmse 12 00009 g006
Figure 7. Picture of the reference ship [source: https://www.geoxyz.eu/en/fleet].
Jmse 12 00009 g007
Figure 8. Propulsion modes of the parallel hybrid architecture.
Jmse 12 00009 g008
Figure 9. Operation speed profile for the case study [34].
Jmse 12 00009 g009
Figure 10. Rule-based hybrid power controller applied in the case study.
Jmse 12 00009 g010
Figure 11. Parametric study according to the threshold of the rule.
Jmse 12 00009 g011
Figure 12. Torque and speed demands of the simulated ship’s propulsion system.
Jmse 12 00009 g012
Figure 13. Demanded speed profile and resultant ship speed from the simulation.
Jmse 12 00009 g013
Figure 14. Torques for total demand and each power source. SOC is represented by green line.
Jmse 12 00009 g014
Figure 15. Total demand torque and propulsion modes determined by the controller.
Jmse 12 00009 g015
Figure 16. Operation mode selections in the simulation.
Jmse 12 00009 g016
Figure 17. Energy consumption and loss for each power source.
Jmse 12 00009 g017
Figure 18. Operating points in diesel engine and electric motor.
Jmse 12 00009 g018
Figure 19. Cumulative fuel consumption in diesel propulsion system and hybrid propulsion system.
Jmse 12 00009 g019
Table 1. Modeling parameter for the Holtrop–Mennen method resistance model.
SymbolParticularSymbolParticular
L W L Waterline lengthW.S.AWetted surface area
L B P Length between perpendiculars S a p p Total wetted surface area
B Molded breath C P Prismatic coefficient
T Draft h B Height of the centroid
Volumetric displacement T f Draft at the fore perpendiculars
Displacement T a Draft at the after perpendiculars
δ Trim A B T Stem contour
S s t e r n Normal section shape V Ship speed
C M Midship section coefficient L C B a f t Longitudunal center of buoyancy from after perpendiculars
C B Block coefficients 1 + k 2 Appendage resistance factor
1 + k 1 Form factor
Table 2. Reference ship modeling parameters.
DescriptionsValues
TypeOffshore Support
Overall length19.52 m
Width7.46 m
Draught1.70 m
Gross tonnage65.24 t
Diesel engine1440 kW
Electric motor450 kW
Battery450 kWh
1126.4 V
Maximum speed12 m/s
Cruising speed11 m/s
Table 3. Energy efficiency comparisons between diesel and hybrid propulsion.
Diesel PropulsionHybrid Propulsion
Distance67.87 km
Engine efficiency0.2710.303
Motor efficiencyMotoring-0.78
Generating-0.798
Overall efficiency *0.2710.303
Fuel consumption (kg)200.2 kg179.2 kg
Improvement10.4%
* Overall eff. = propulsion energy/(energy from the fuel − stored energy in the battery).
Disclaimer/Publisher’s Note: The statements, opinions and data contained in all publications are solely those of the individual author(s) and contributor(s) and not of MDPI and/or the editor(s). MDPI and/or the editor(s) disclaim responsibility for any injury to people or property resulting from any ideas, methods, instructions or products referred to in the content.

