Article

Numerical Investigation of Flow and Scour around Complex Bridge Piers in Wind–Wave–Current Conditions

1
National Engineering Research Center of High-Speed Railway Construction Technology, Central South University, Changsha 410075, China
2
School of Civil Engineering, Central South University, Changsha 410083, China
3
Key Laboratory for Damage Diagnosis of Engineering Structures of Hunan Province, College of Civil Engineering, Hunan University, Changsha 410082, China
*
Author to whom correspondence should be addressed.
J. Mar. Sci. Eng. 2024, 12(1), 23; https://doi.org/10.3390/jmse12010023
Submission received: 15 November 2023 / Revised: 13 December 2023 / Accepted: 15 December 2023 / Published: 20 December 2023
(This article belongs to the Section Ocean Engineering)

Abstract

:
A sea-crossing bridge is typically constructed in a marine environment with complex piers, and is susceptible to severe scour at the foundation. This study presents a numerical investigation on flow and scour around a complex pier, specifically focusing on a real-world sea-crossing bridge in China. A comprehensive CFD model incorporating hydrodynamic, free surface, sediment transport, and morphological models is employed for numerical modeling. Additionally, a wind shear stress model is considered to accurately simulate wind generation. The validation of the CFD model is achieved through comparison with experimental data of scour around a cylinder, demonstrating its capability to accurately replicate scour morphology and the temporal evolution of scour depth. Subsequently, the validated model is utilized for full-scale simulation of scour around the complex bridge pier under different wind, wave, and current conditions. The results indicate that compared to single piers with uniform cross-sectional shapes, flow patterns around complex piers are much more complicated. Scour predominantly occurs around the first row of group piles, while downstream piles experience less scour due to the sheltering effect from upstream piles. Furthermore, it becomes evident that the current exerts greater influence on pier scour than waves and wind, while the latter two factors primarily influence the superstructure of the bridge.

1. Introduction

With the rapid advancement of transportation infrastructure, an increasing number of sea-crossing bridges have been constructed to facilitate inter-island transportation. Since these bridges are situated in marine environments, they are inevitably exposed to wind, waves, and currents. Under extreme conditions, the bridge may suffer damage or even collapse due to the huge attacking forces from the hydrodynamic impact [1,2]. The coupling wind–wave–current effect on the bridge can lead to severe bed scour around its pier foundation, which threatens the safety of the bridge [3,4,5]. Therefore, it is crucial to improve our understanding of the flow and scour mechanisms around complex piers to enhance the stability and safety of the bridge.
The piers of sea-crossing bridges are typically designed with complex geometries that consider various mechanical, geotechnical, and structural conditions. Consequently, complex pier forms are commonly employed in practice [6]. While numerous studies have reported the pier scour issues, most focus on the single pier form with a uniform cross-section [7]. Compared with single piers, the geometry of a complex pier is much more complicated and may consist of a few different pier components connected together [8]. A typical complex bridge pier often comprises a wall-like column supporting the bridge deck and superstructures along with a pile-cap beneath the column, which is further supported by a group of piles, as depicted in Figure 1. Due to the complexity of the structure, the flow mechanism and scour characteristics around the complex pier differ from those observed for simple piers [9,10,11]. However, the research on scour around complex piers remains limited, and the existing studies primarily focus on the river environment under current flow conditions only; see, e.g., [12] and the comprehensive review by Ettema et al. (2017) [13]. To the best of our knowledge, studies considering the combined effects of wind, waves, and currents on complex piers have not been reported so far.
With the advancements in modern numerical simulation methods, the CFD (computational fluid dynamics)-based flow model incorporating free surface capturing and bed sediment models has been employed to study pier/pile scour in wave conditions (e.g., [14,15,16,17,18,19,20]). To enhance the conciseness of the paper and mitigate redundancy, for more details on the progress of CFD modelling of scour for marine structures, readers are referred to the reviews by Lai et al. (2022) [21] and Zhao (2022) [22]. However, it is worth noting that previous numerical simulations on scour around marine structures did not consider the influence of wind, which is a crucial factor, especially affecting the safety of the sea-crossing bridge, regardless of the hydrodynamic impact or foundation scour. Notably, Qu et al. (2020; 2021) [23,24] highlighted that wind presence can significantly alter incident wave characteristics and intensify the wave impact on the structure. The results demonstrate that strong wind can substantially enhance the impact intensity of waves on the bridge deck, resulting in increased horizontal and vertical hydrodynamic loads.
The objective of this study is to conduct a numerical investigation on the flow and scour characteristics around a complex bridge pier. The subsequent sections of this paper are structured as follows. Section 2 introduces the numerical model. Section 3 provides details on the numerical setup and validation of the model using available experimental data. Section 4 demonstrates the full-scale numerical modeling of a complex pier, and the flow field, scour characteristics, and influence of parameters are analyzed. Finally, conclusions are drawn in Section 5.

2. Numerical Model

2.1. Hydrodynamic Model

The numerical simulation conducted in this study utilizes the CFD program FLOW-3D v11.2.0. A hydrodynamic model employed based on the solution of the unsteady Reynolds-averaged Navier–Stokes (RANS) equations for incompressible flow is employed [25]:
𝜕 u i 𝜕 t + u j 𝜕 u i 𝜕 x j = 1 ρ 𝜕 p 𝜕 x i + 𝜕 𝜕 x j ν 𝜕 u i 𝜕 x j + 𝜕 u j 𝜕 x i + τ i j ρ + σ T κ γ ρ 𝜕 γ 𝜕 x i
𝜕 u i 𝜕 x i = 0
where u represents the time-averaged velocity, ρ denotes the fluid density, p is the pressure, ν is dynamic viscosity, σT represents the surface tension coefficient, κγ indicates the surface curvature, and τij represents the Reynolds stress based on Boussinesq approximation:
τ i j = u i u j ¯ = 2 ν T S i j 2 3 k δ i j
Here, νT refers to the eddy viscosity, δij represents the Kronecker delta function, and k = u i u i ¯ / 2 denotes the turbulent kinetic energy (TKE). The γ term in Equation (1) corresponds to the volume fraction with a value 0 for air, 1 for water, and ranging from 0 to 1 for an air–water mixture.
To incorporate turbulence effects into the model, we adopt the k-ω turbulence model proposed by Wilcox (2006) [25], which can be expressed as follows:
𝜕 k 𝜕 t + u j 𝜕 k 𝜕 x j = τ i j ρ 𝜕 u i 𝜕 x j β * k ω + 𝜕 𝜕 x j ν + σ * k ω 𝜕 k 𝜕 x j
𝜕 ω 𝜕 t + u j 𝜕 ω 𝜕 x j = α ω k τ i j ρ 𝜕 u i 𝜕 x j β ω 2 + σ d ω 𝜕 k 𝜕 x j 𝜕 ω 𝜕 x j + 𝜕 𝜕 x j ν + σ k ω 𝜕 ω 𝜕 x j
ν T = k ϖ ,   ϖ = max ω ,   C l i m 2 S i j S i j β *
σ d = H 𝜕 k 𝜕 x j 𝜕 ω 𝜕 x j σ d o
where ω denotes the dissipation rate, and H{·} symbolizes the Heaviside step function that equals zero when its argument is negative, and one otherwise. The other coefficient values are Clim = 7/8, α = 0.52, β = 0.078, β* = 0.09, σ = 0.5, σ* = 0.6, and σdo = 0.125.

2.2. Free Surface Model and Wave Generation

The volume-of-fluid (VOF) method [26] is adopted to track the free surface, which can be mathematically represented by the following equation:
𝜕 γ 𝜕 t + 𝜕 γ u j 𝜕 x j = 0
In our numerical modeling, a numerical wave flume is established by imposing regular waves at the inlet boundary of the computational domain. For more detailed information on the wave generation method, please refer to Kuai et al. (2018) [27].

2.3. Wind Generation

When simulating large open-water bodies, it is frequently advantageous to incorporate wind-induced shear stress on the water surface for realistic wind effects. The wind shear stress τw can be calculated using the quadratic law [28]:
τ w = ρ a C D V w V w
where ρa is the air density, CD is the wind shear coefficient with a typical value of 0.003 [28], and Vw is the wind velocity above the water surface.

2.4. Sediment Transport and Morphological Models

This study considers the transportation of sediment in both bed-load and suspended-load modes. The bed-load sediment transport qb is determined using the commonly used empirical equation proposed by van Rijn (1984) [29]:
q b = 0.053 g s 1 d 50 3 1 / 2 θ θ c 2.1 d * 0.3
Herein, d50 refers to the sediment mean diameter, s = ρs/ρ represents the relative density of the sediment, and θ = U f 2 / s 1 g d 50 corresponds to the Shields parameter, with Uf denoting the friction velocity. θc signifies the critical Shields number of sediment incipient motion, which is calculated according to the following equation [30]:
θ c = 0.3 1 + 1.2 d * + 0.055 1 exp 0.02 d *
where d* defines the dimensionless sediment size as
d * = g s 1 / ν 2 1 / 3 d 50
The suspended-load sediment transport is obtained through solving an advection-diffusion equation [15]:
𝜕 c 𝜕 t + u j w s δ j 3 𝜕 c 𝜕 x j = 𝜕 𝜕 x j ν + ν T 𝜕 c 𝜕 x j
where c denotes the mass concentration of suspended sediment particles, and ws represents the sediment fall velocity.
The morphological change in the sediment bed is governed by the Exner equation for sediment continuity [31]:
𝜕 z b 𝜕 t = 1 n 1 𝜕 q b i 𝜕 x i + D s E s
where zb represents the bed elevation, n = 0.4 denotes the sediment porosity, qbi refers to the quantity resulting from bed-load sediment transport, and Ds and Es represent the sediment erosion and deposition due to suspended-load sediment transport, respectively. Further details regarding numerical computation can be found in a previously published paper by the authors [32].

3. Model Validation

To validate our model, we performed experiments in a water-recirculating flume with the dimensions of 20 m length, 0.8 m width, and 0.5 m depth. To minimize flow turbulence, a flow straightener was installed at the entrance of the flume, while a tailgate was positioned at its outlet to regulate water depth. A vertical circular cylinder with a diameter (D) of 8 cm represented the bridge pier and was placed on the bed at a distance of 10 m downstream from the flume entrance to ensure that fully developed flow conditions were achieved. A sediment bed with a layer height of 15 cm was carefully arranged on top of the bottom surface. The experiment was conducted under steady-current conditions where the incoming discharge remained constant throughout. Specifically, we maintained a flow depth (h) of 10 cm and focused on clear-water scouring phenomena around the pier by monitoring temporal variations in scour depth. More details regarding the flume and equipment can be found in previous studies by Li et al. (2020) [33] and Yang et al. (2020) [34].

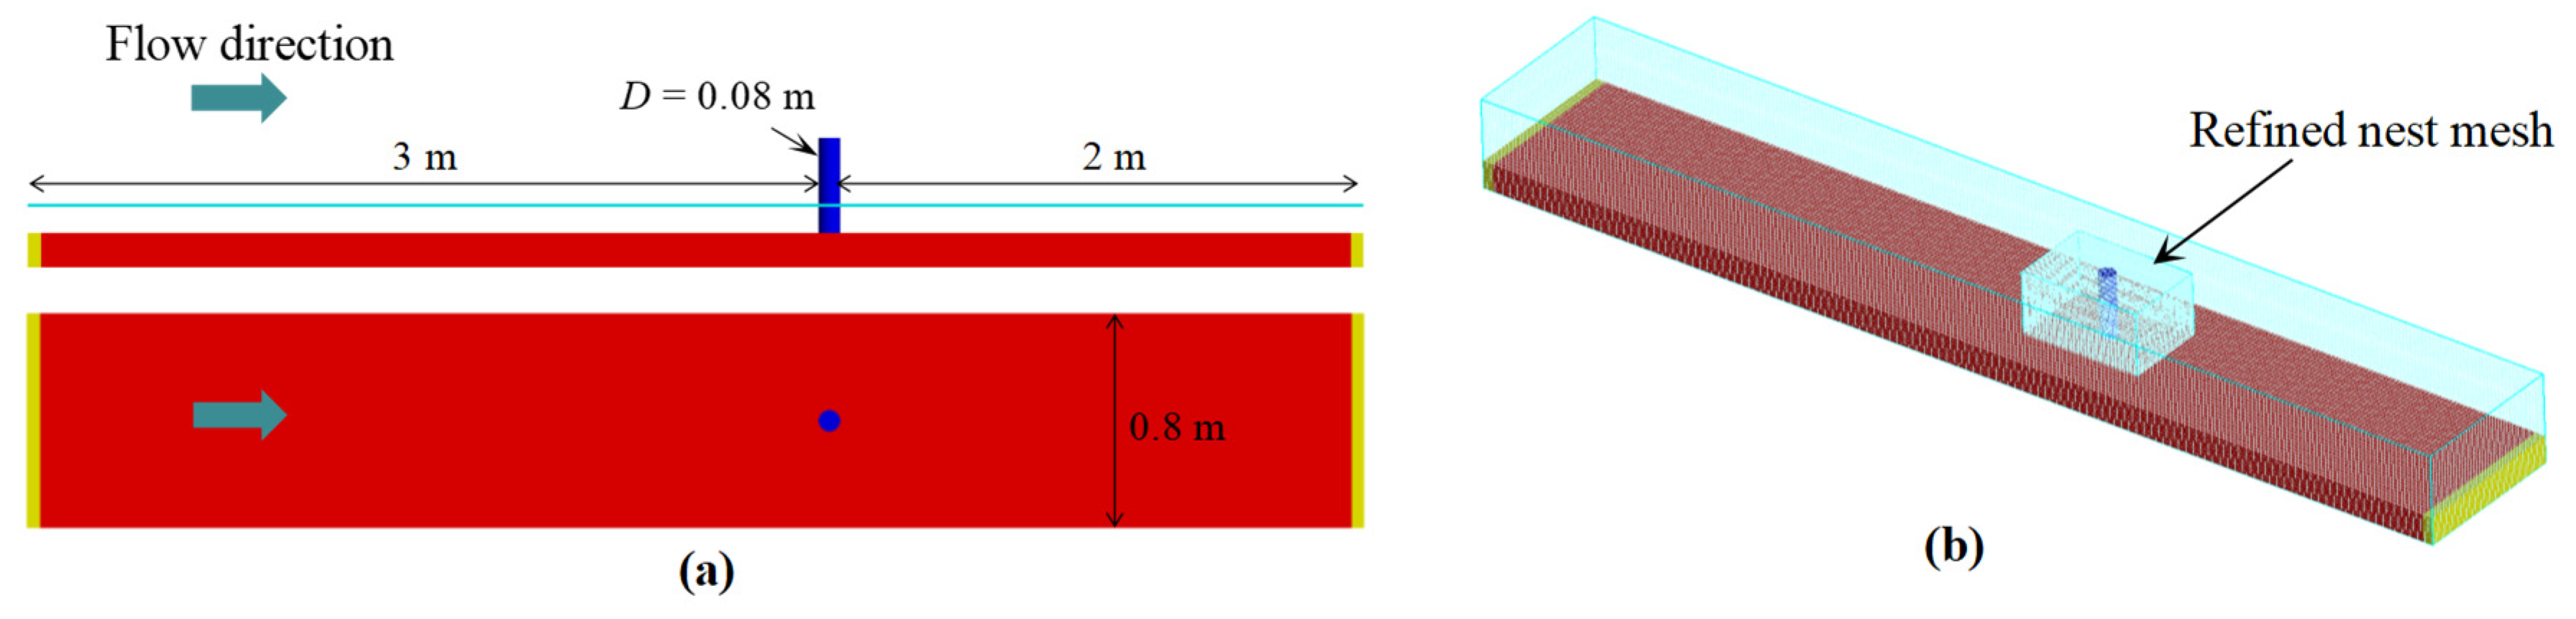
3.1. Numerical Setup

The numerical setup is identical to the corresponding experiment, as illustrated in Figure 2a. The numerical flume has dimensions of 5 m (length) × 0.8 m (width) × 0.5 m (height). A vertically mounted circular cylinder with a diameter D = 8 cm is positioned on the bed, located at a distance of 3 m from the inlet. Baffle plates are set at both the inlet and the outlet. The baffle plate at the entrance prevents the sand erosion caused by sudden water inflow, while the outlet baffle plate ensures the retention of sediment within the model domain. The sediment layer on the bottom bed is 0.15 m in height, with a water surface elevation maintained at 0.1 m above it. In CFD simulation, grid setting plays a crucial role and requires careful consideration. Herein, we employed a nested mesh strategy consisting of relatively coarse meshes covering the entire computational domain and refined nest meshes focused around the cylinder region, as depicted in Figure 2b. The size of the nested mesh block is 0.6 m long and 0.4 m wide, with a density of approximately 0.01 m. This grid-setting strategy effectively captures detailed flow and scour characteristics near the cylinder while maintaining reasonable computational efficiency. For further insights into how grid size influences computational results, please refer to Appendix A.
The boundary conditions are defined as follows: the prescribed flow velocity at the inlet boundary; the outflow condition specified at the outlet boundary; symmetry boundaries applied to both the top and two sides of the computational domain; the wall boundary condition assigned to both the bottom and the cylinder surface. Furthermore, a modified wall shear stress model proposed by Xie et al. (2021) [35] is adopted for determining the bed shear stress.
Six cases were selected for the validation experiments, and the corresponding conditions for the simulation of cylinder scour are listed in Table 1, in which Vc represents the flow velocity, d50 is the sediment diameter, and Se and Sn denote the final scour depth from experiments and numerical simulations, respectively. It is worth noting that due to a lack of available experimental data, we did not consider the coupling effect between wind, wave, and current in our validation experiments. In fact, there is currently no existing experimental research on the combined effects of wind, waves, and currents on pile scour due to the inherent experimental challenges. However, it is important to note that our validation aims to confirm the reliability of the established CFD scour model and its utility as a tool (similar to numerical experiments) for conducting parametric analysis related to wind–wave–current-induced scour issues.

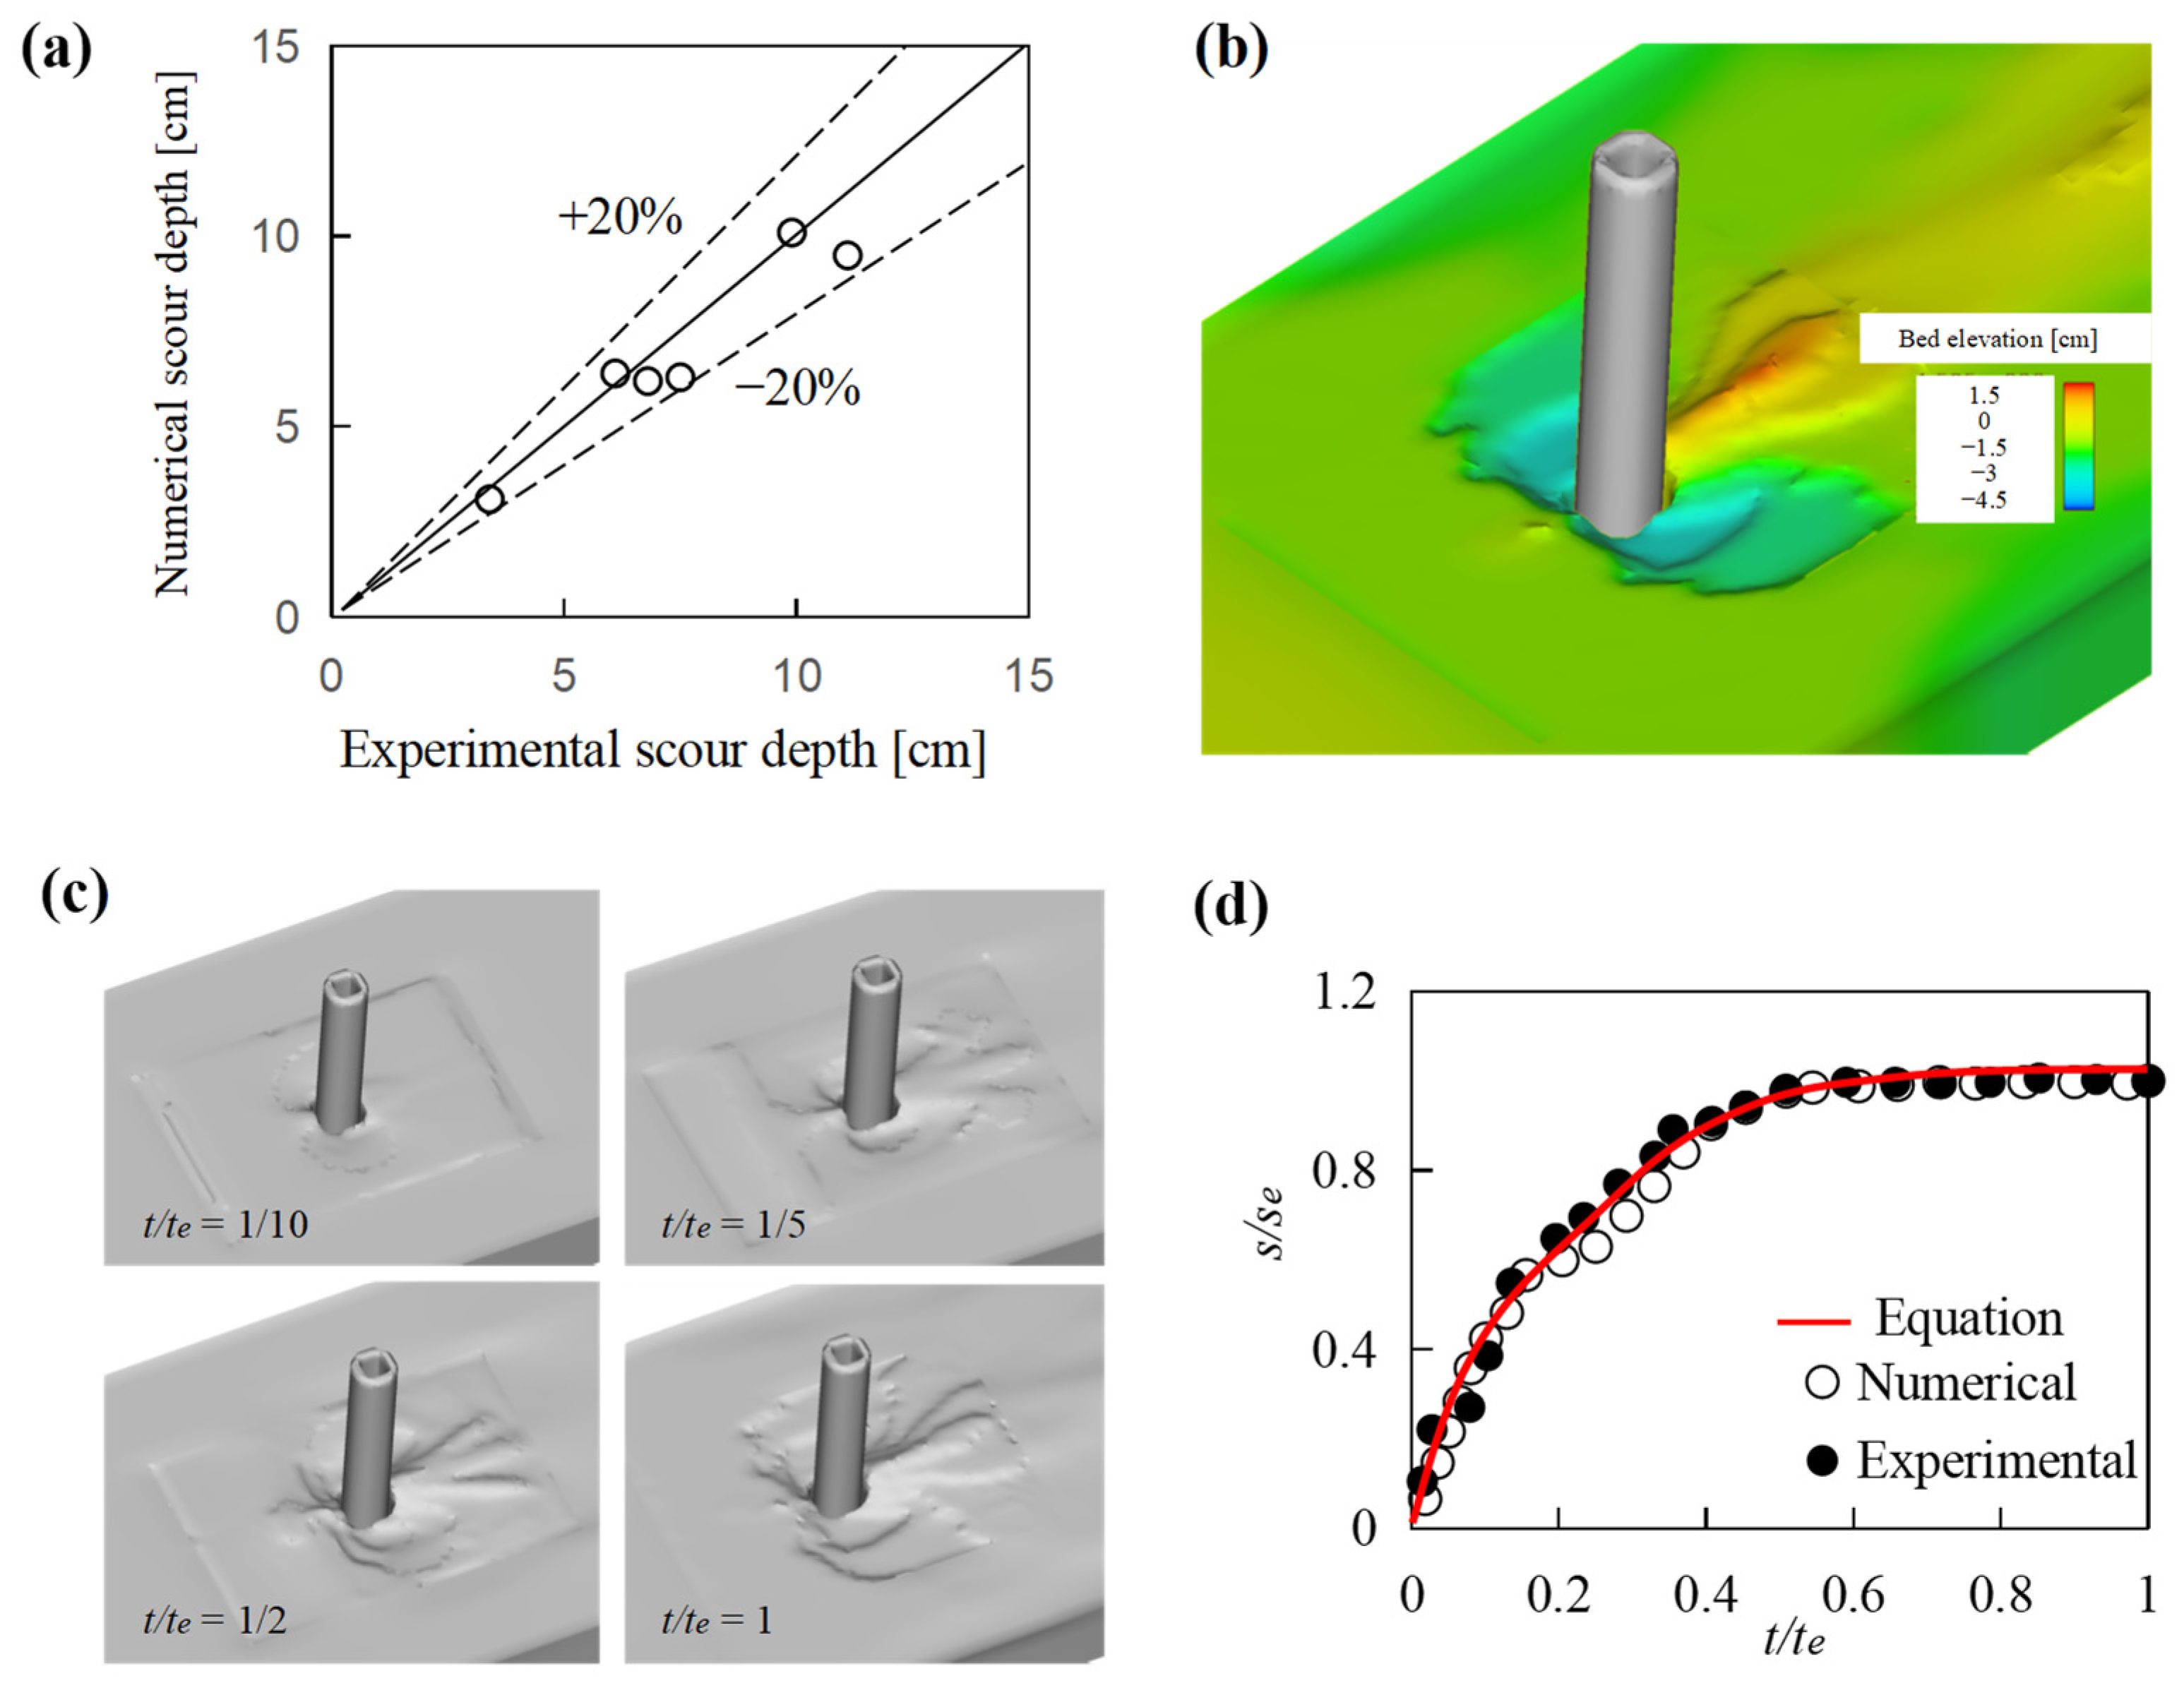
3.2. Comparison with Experimental Results

The comparisons of scour results between the numerical computation and the experimental measurement are presented in Figure 3, where the final scour depth data (i.e., values listed in Table 1) are plotted and compared. The perfect line at a 45-degree angle represents the ideal scenario where the numerical results match the experimental results exactly. It is evident that nearly all the data points collapse to the perfect line, falling within the ±20% error range. The previous relevant studies [36,37] reported an average error of approximately 3% in their simulated scour results. Our results indicate a relatively larger average error of around 9%. However, it is important to note that their studies report a maximum error of 25%, slightly higher than our maximum error of 16%. It should be considered that simulation accuracy can be influenced by various factors, including physical models, meshing techniques, parameter settings, etc. Furthermore, it is worth mentioning that there are differences in validation cases between our study and those mentioned above. Importantly, this research aims to conduct parametric studies to identify the effects of primary factors on flow and scour results. Therefore, although our numerical results may not appear as accurate as those presented in the aforementioned relevant studies, they do not significantly impact the conclusions drawn from this study. Figure 3b illustrates the scour hole morphology for the final time in Case 6, representing the equilibrium scour state. The simulated scour hole shape is consistent with the observed results from experiment. The semicircular shape of the scour hole in front of the cylinder is attributed to the horseshoe vortex, while sediment deposition occurs behind the cylinder due to the blocking effect of the pier. The maximum scour depth occurs at approximately 70° from the centerline of the pier.
Figure 3c exhibits the scour hole evolution with time, which can be described as follows. (1) Initially, scouring occurs on both sides of the cylinder due to amplified bed shear stress and contracted streamlines. (2) Subsequently, the scour region extent, as well as the scour depth, increases, and the sediment ridge behind the cylinder is formed due to sediment deposition. (3) As time progresses, the bed shear stress at the side regions of the cylinder decreases, and the horseshoe vortex in front of the cylinder contributes more to the scour. Hence, the scour hole gradually expands towards the front of the cylinder. (4) At the equilibrium stage, the scour depth remains constant. It should be noted that in laboratory experiments, reaching equilibrium can often take a considerable amount of time, typically 1–2 weeks [38]. Therefore, the duration of the scour experiment was relatively short, at 420 min, to achieve full equilibrium. However, as shown in Figure 3d, the scour depth appears to gradually approach equilibrium, since there is minimal variation in scour depth during the later stages, and it remains almost unchanged at the final stage. Thus, it can be regarded as a quasi-equilibrium state, at least.
Figure 3d presents the variation in scour depth with time in Case 6. The simulated and measured results fit well, showing an exponential increasing tendency in scour depth. In fact, numerous studies have been conducted on the scour evolution of pier scour, particularly focusing on the temporal development of scour depth (see [6] for a comprehensive review). It is commonly accepted that the temporal variation in scour depth can be effectively described and predicted using an exponential expression [39]:
S S e = 1 exp c 1 t T s c 2
where S is the scour depth, Se is the equilibrium scour depth, c1 and c2 are fitting coefficients, which can be determined using the method proposed by Li et al. (2020) [33], and Ts is the time scale of scour calculated by integrating the scour curve:
T s = 0 t m S m S S m d t
where Sm is the maximum scour depth at any given time, and tm indicates when this maximum occurs. The result based on Equation (15) is also plotted in Figure 3d, demonstrating excellent agreement with the present findings regarding the exponential nature characterizing the temporal development of scour depth.
Overall, the present CFD model can accurately simulate the scour around the cylinder, reasonably capturing the temporal evolution of the scour process. Consequently, this CFD model holds potential for further applications in more complicated scenarios, such as simulations involving complex pier scour phenomena.

4. Results and Discussion

In this section, the scour around a prototype-scale complex-bridge pier is simulated and analyzed based on the validated CFD model mentioned above. The bridge pier model refers to a real-world sea-crossing bridge foundation. Detailed descriptions of the flow field and scour characteristics around the complex pier are provided to illustrate the scour mechanism. Additionally, the influence of some primary parameters, involving wind, waves, and currents, is discussed systematically.

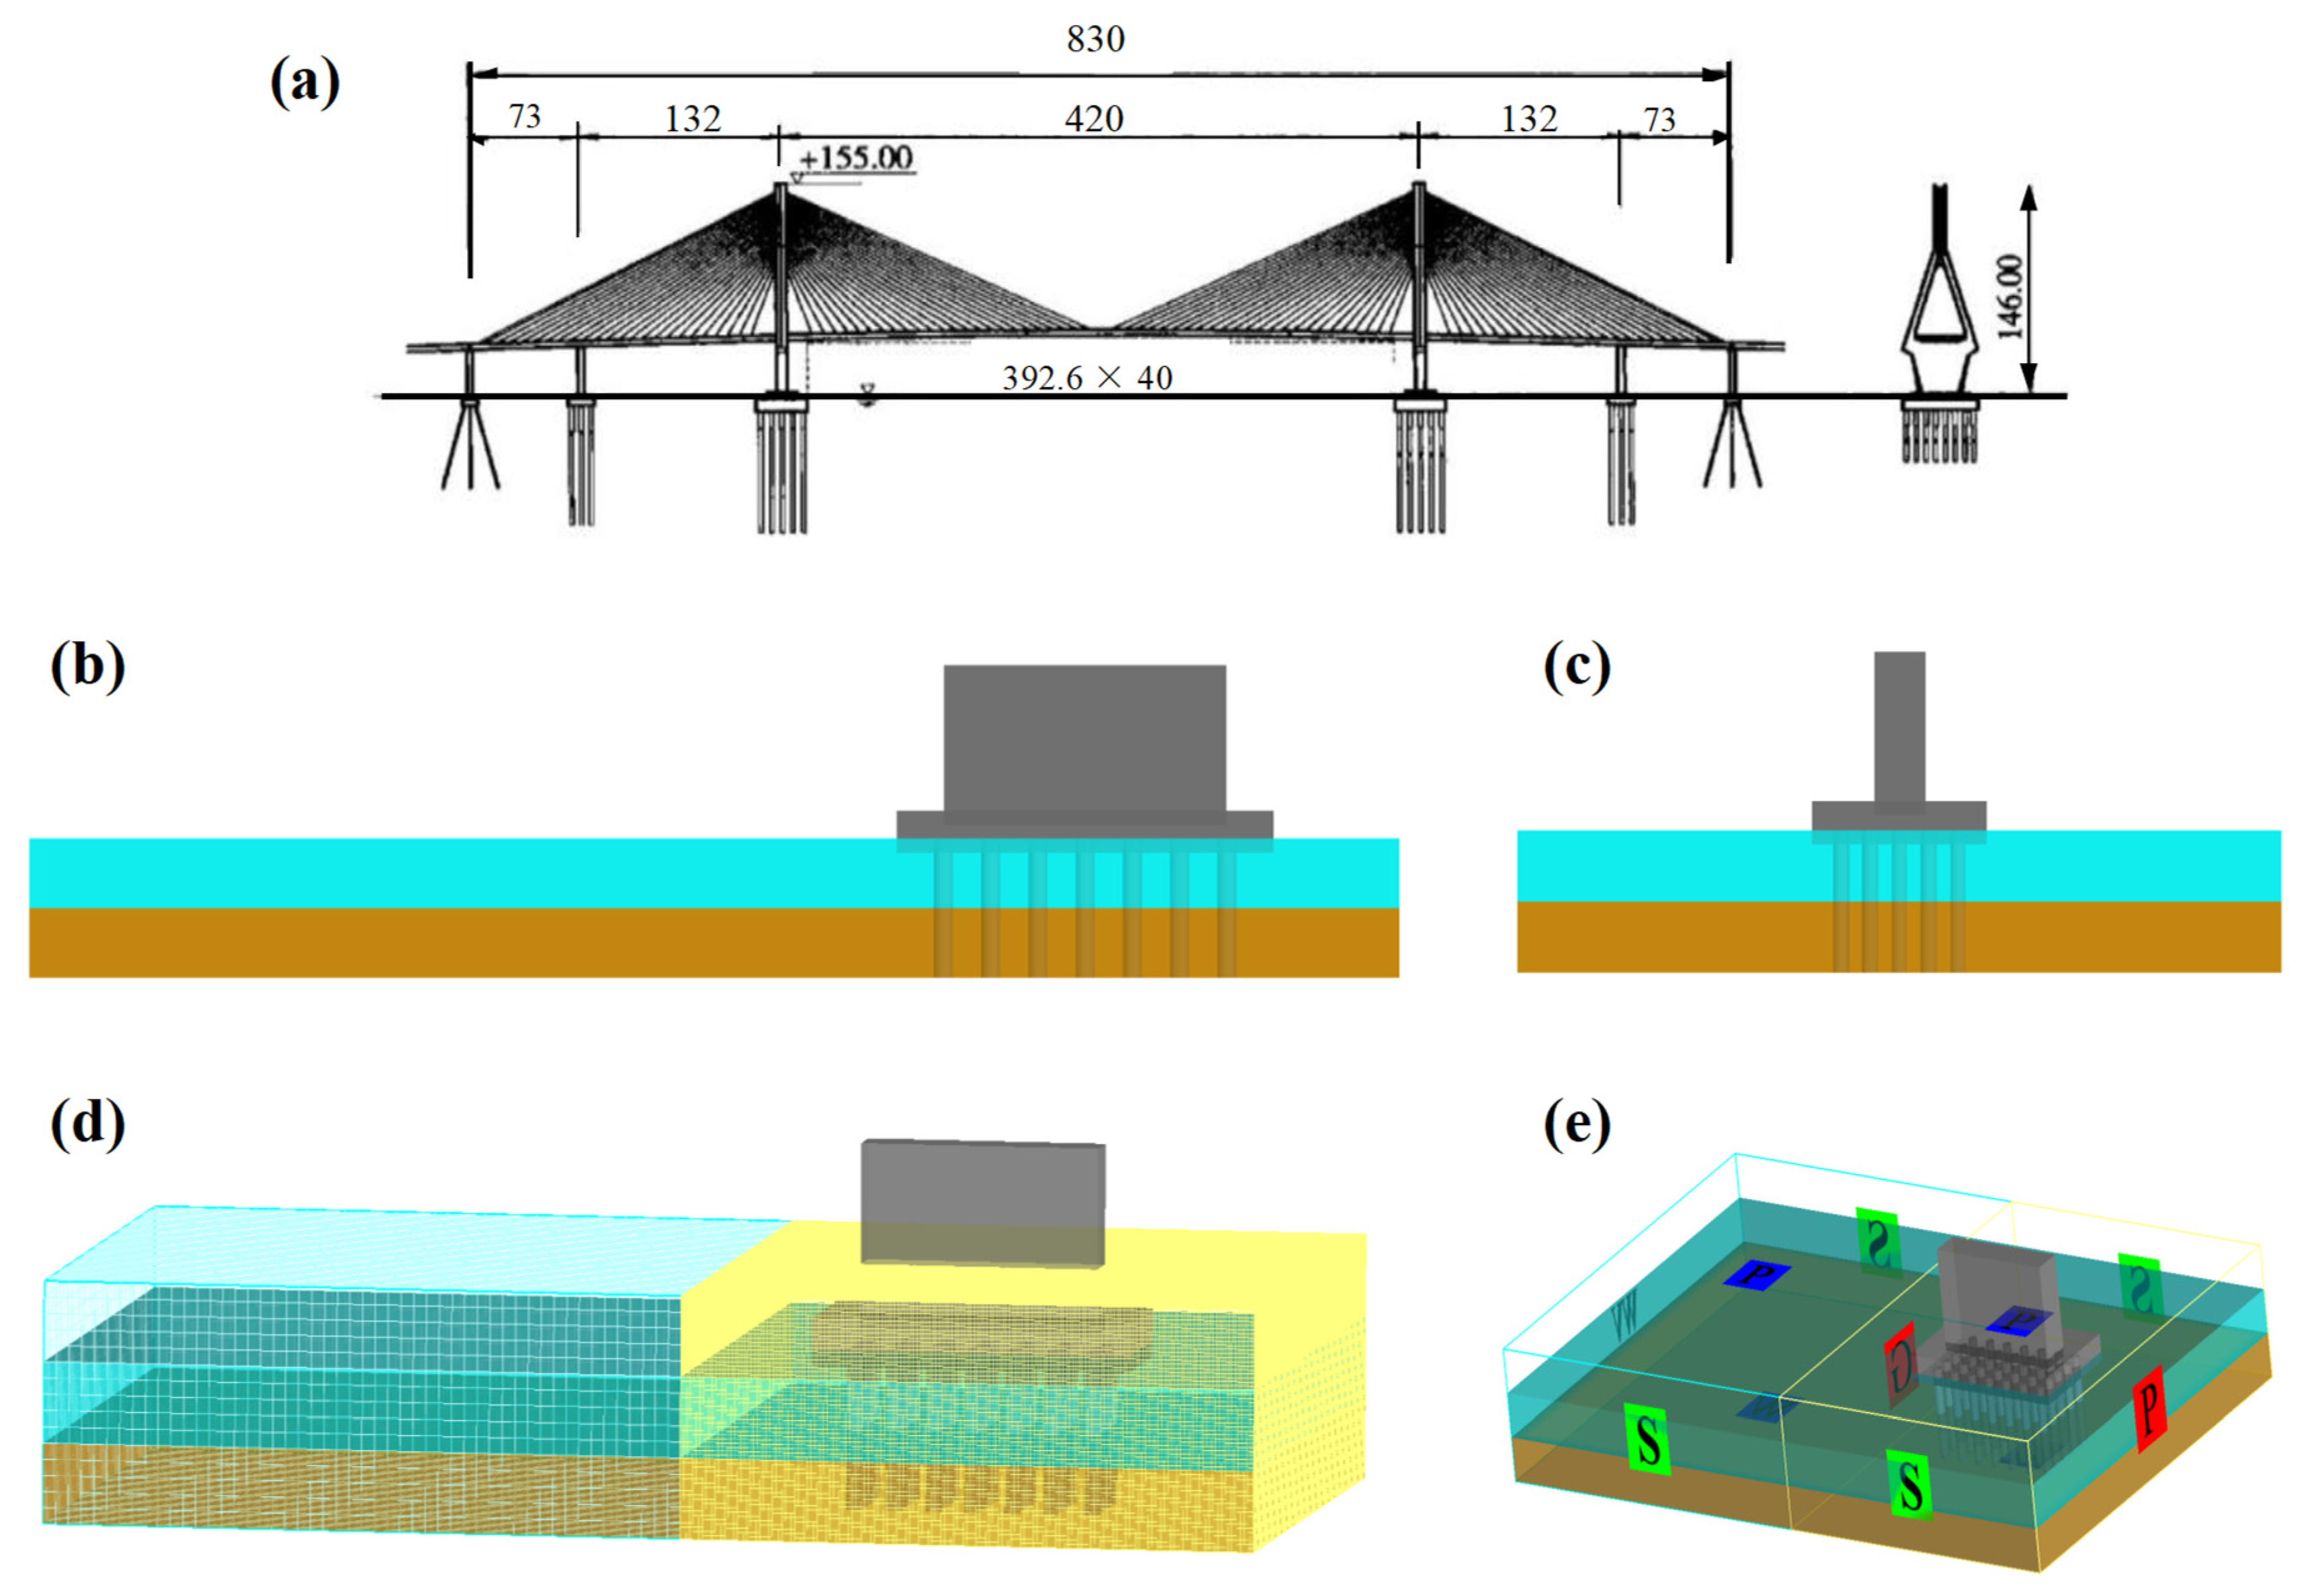
4.1. Description of the Full-Scale Model Setup

The numerical model is established based on the Donghai sea-crossing bridge in Hangzhou Bay, China, representing a full-scale model with a scaling factor of 1:1. The bridge foundation is a complex pier comprising a wall-like column, a pile-cap, and a group of piles underneath (as shown in Figure 4a). Figure 4b–e present the numerical domain, computational mesh, and boundary conditions, respectively, following the same strategy of numerical model setting as in the validation section (Section 3). However, there are two main differences: (i) higher-resolution grids are employed within the complex pier region to accurately capture the flow field and local scour characteristics between the pile groups; (ii) considering that it is a sea-crossing bridge scenario, in addition to the current condition, the wind and waves are also incorporated by adding the corresponding boundary conditions at the inlet of the numerical flume. In Figure 4b–e, the green block within the computational domain indicates the computational mesh, while the yellow block beneath it corresponds to the sediment bed. In Figure 4d, different colors indicate mesh blocks with varying grid resolutions; specifically, a dense yellow mesh is used in proximity to the pier, whereas a coarse green mesh is employed further away from it.
The computational domain utilized consists of a total number of cells to the order of 2 × 10⁶, emphasizing the significant effort invested in optimizing the convergence of the computational mesh while maintaining a reasonable computational time. To reduce the simulation time, parallel computation with domain decomposition was employed using sixteen processors. Additionally, considering that most of the computational time is dedicated to morphological simulation, this process was initiated when the wave approached the pier. This was achieved by utilizing results from rigid-bed simulation (at the moment when the wave approaches the pile) as the initial conditions for scour simulation. Each case simulation required approximately twenty days of CPU time.

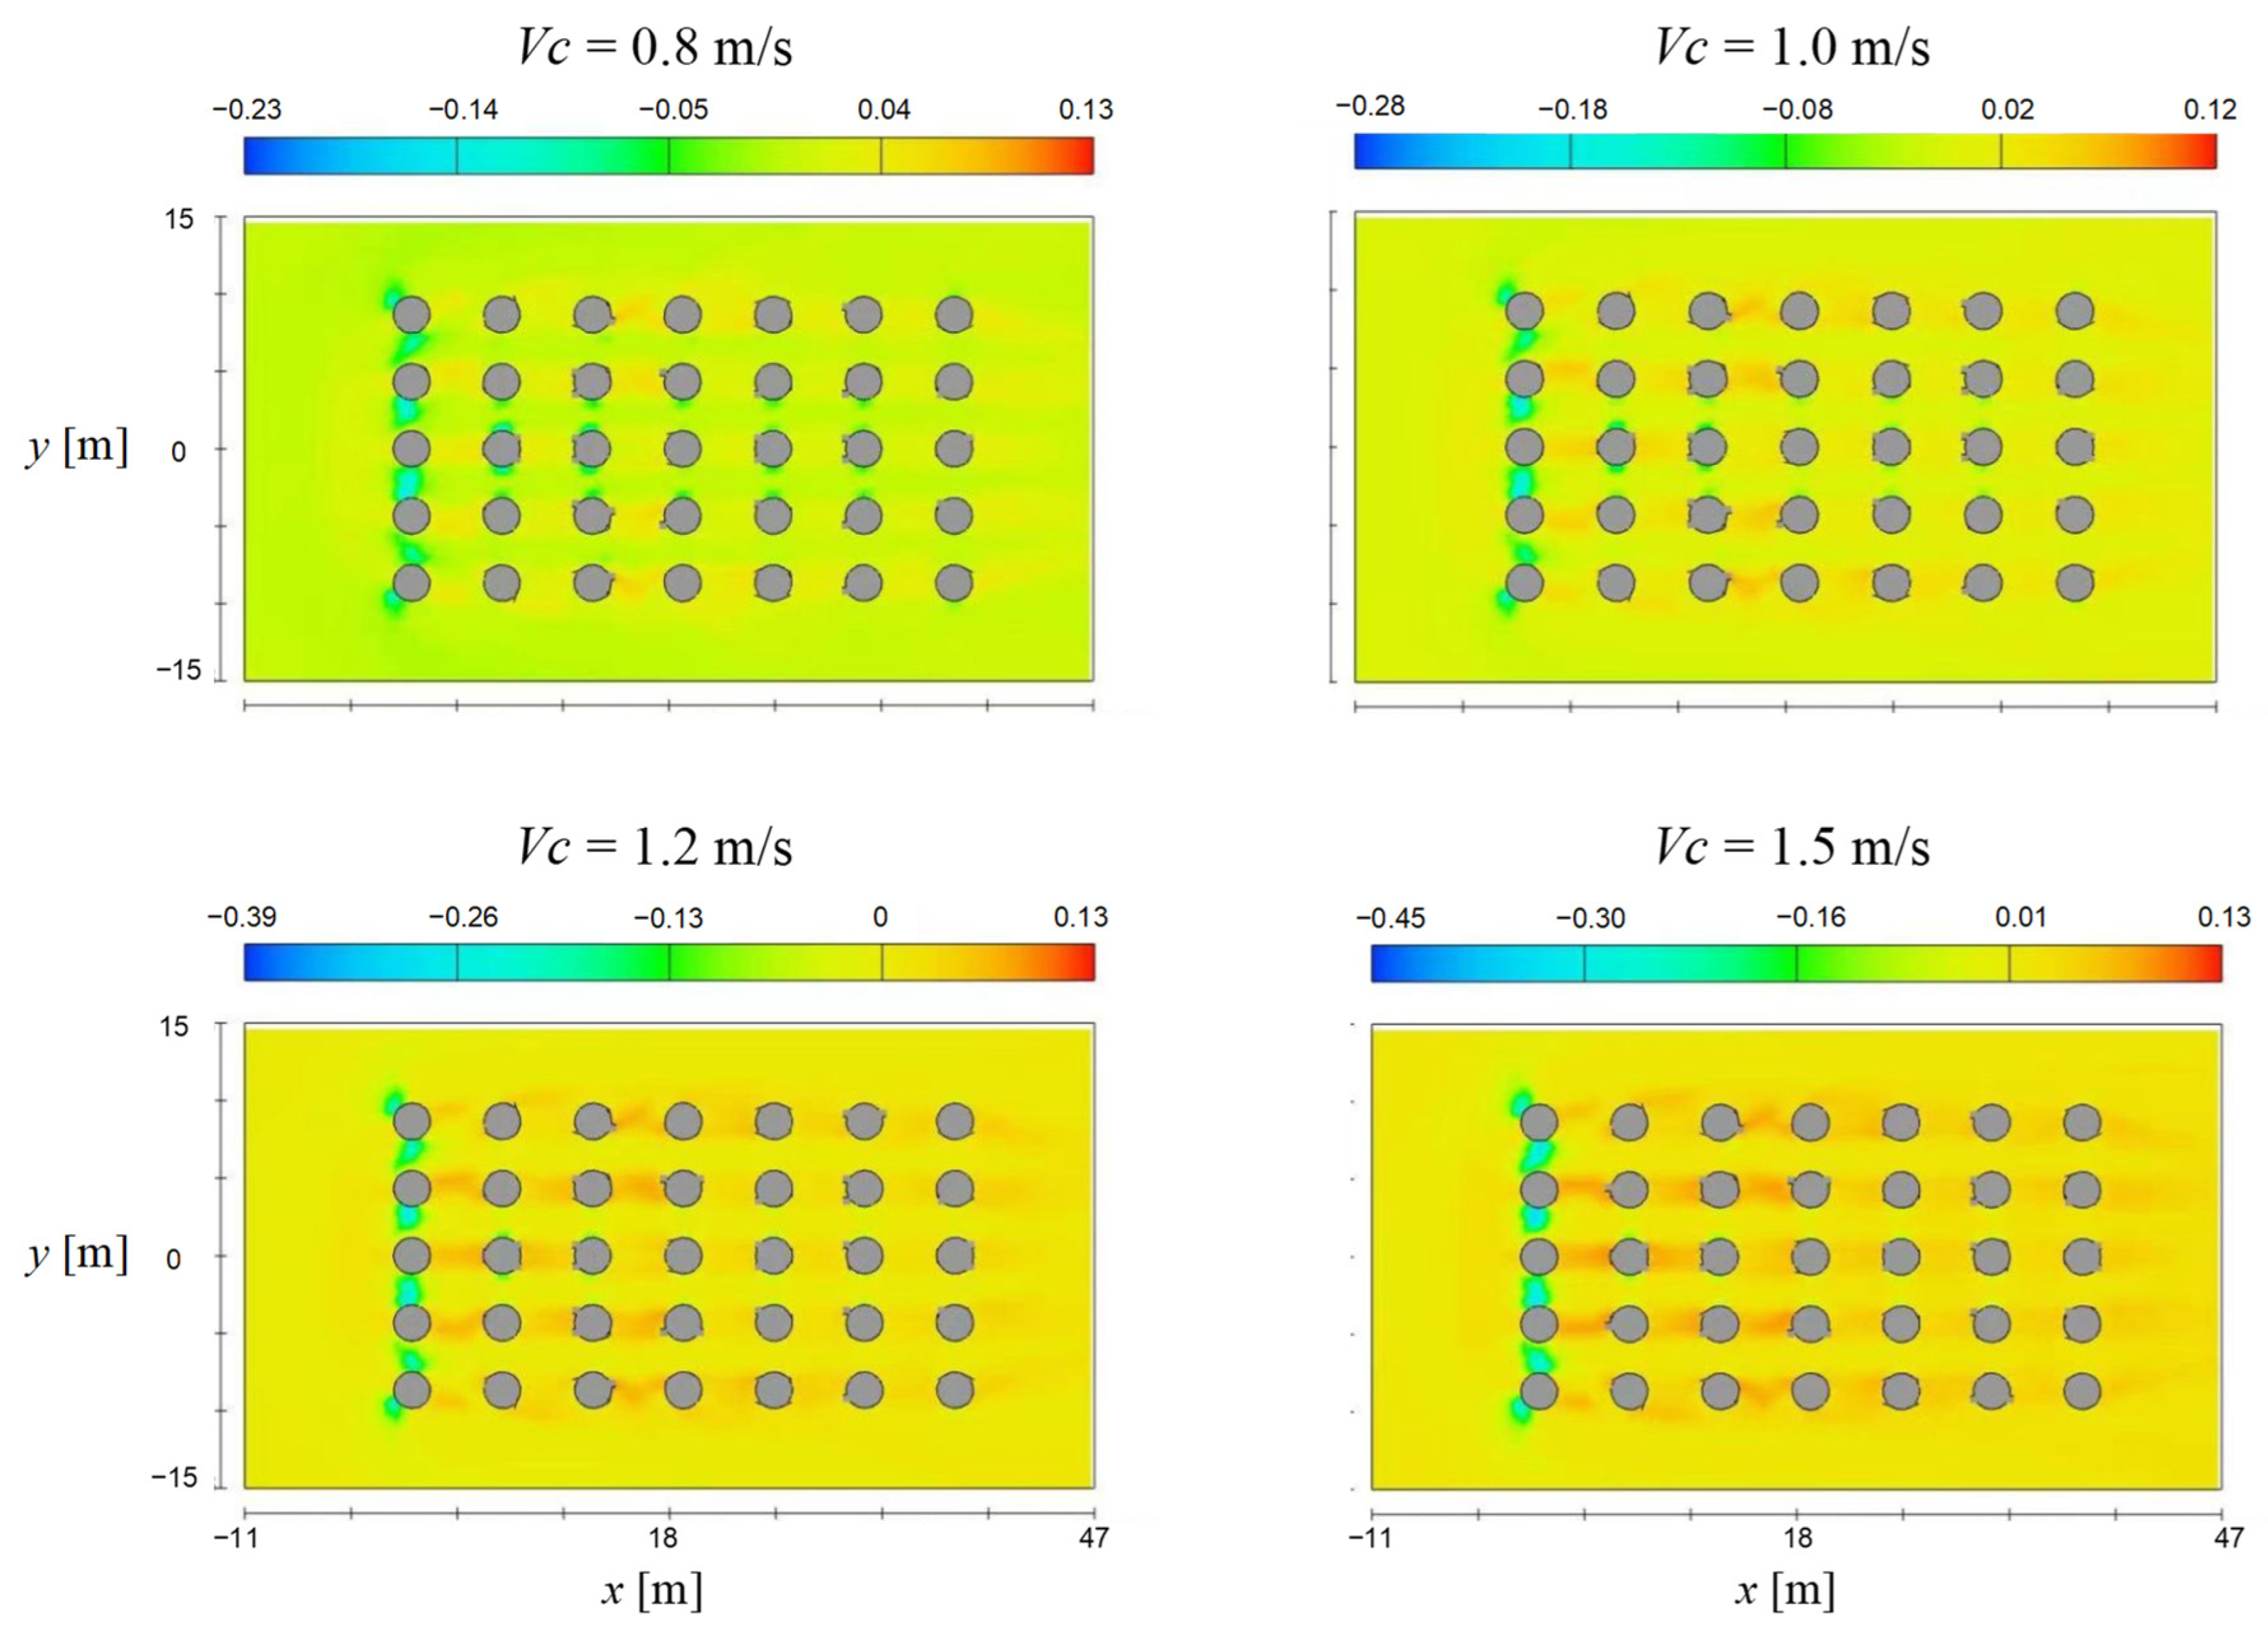
4.2. Flow Field Analysis

Figure 5 exhibits the flow field around the complex bridge pier, displaying both velocity and turbulent kinetic energy (TKE) contours. In comparison to single piers with uniform cross-sectional shape, the flow field around a complex pier is much more complicated due to the interactions between flow features caused by various pier components. It shows that the approaching flow in front of the pier undergoes downward, upward, and sideward diversion. As illustrated clearly in Figure 5a, the downward flow in front of the piles with a back flow forms a vortex that is similar to the horseshoe vortex found in the simple uniform pier case. Moreover, this vortex exhibits larger dimensions as it experiences a more pronounced blocking effect from the complex pier, resulting in increased bed scouring ahead of the structure. The upward flow impacts on the pile cap, while some water overtopping interacts with the column.
From a top-view perspective of the flow field (x-y plane in Figure 5b,c), it becomes evident that there is a sheltering phenomenon induced by upstream piles diverting and creating lee-wake areas for reducing the horseshoe vortex strength on downstream piles. Examining the TKE distribution (Figure 5d,e), it is apparent that regions with high TKE magnitude are located at the front of the piles group and downstream of the pile cap. This can be attributed to the enhanced turbulence intensity induced by the horseshoe vortex formed ahead of the piles as well as the wake vortices behind the pile cap.

4.3. Scour Analysis

The scour morphology in Figure 6a reveals that the majority of scour occurs around the first row of group piles, while the downstream piles are minimally affected by scouring. This is expected, as the first row of piles is subjected to high velocity flow with substantial energy, resulting in significant scour. The presence of the first row of piles acts as a shelter, reducing flow inundation on the downstream piles and subsequently mitigating bed scour. In essence, these first-row piles serve a sacrificial role akin to those used for scour protection measures.

4.4. Influencing Parameter Analysis

When the wind acts on the bridge, the direct impact of wind on the foundation scour is minimal. The scouring of the pier is primarily influenced by the change in wind speed and its effect on water flow: higher wind speeds result in increased water flow velocities. Wind speed also affects the height, wavelength, and speed of waves. The numerical simulations were conducted under different wind speeds (Vw) of 0 m/s, 5 m/s, 10 m/s, and 20 m/s (see Table 2 for conditions and results), with a comparison shown in Figure 7. It can be observed that there is little difference in scour depth between cases with Vw = 0 m/s and Vw = 5 m/s. As the value of Vw increases to extreme conditions of 10 m/s and 20 m/s, the increase in scour depth becomes gradual. Overall, the influence of wind speed on pier scour is not obvious. However, it is worth noting that with the increase in wind speed, the wave flow field changes significantly; specifically, the strength of the wave on the pier increases, which leads to the acceleration of flow velocity and the enhancement of flow energy.
Figure 8 clearly shows that the scour depth is increased with the increase in current velocity. When water flows through the pier, various flow phenomena, such as a horseshoe vortex, gap flow, wake vortex, and turbulence, are formed due to factors including the water speed, direction, and depth. The vortex represents a rotating flow pattern that could enhance the shear force and lift force on bed sediment grains, thereby intensifying scour evolution around the pier. Additionally, the flow turbulence is also enhanced (as can be seen from the turbulence kinetic energy) with the increase in current velocity, promoting sediment suspension and further accelerating scouring.
It is recognized that the effect of waves on bridge piers is mainly through waves impacting force on the superstructures, which could cause damage to, and collapse of, the structure. Figure 9 shows the flow field and scour around the complex pier under different wave conditions. It can be seen that the wave effect on scour is less significant compared to the current velocity but more substantial than the wind action. With the increase in the wave height H, the scour depth is also increased. Part of the reason is that the wave action mainly drives the development of water flow near the bed, subsequently influencing bed sediment transport and associated scouring process. In addition, it is crucial not to overlook the combined effects of the wave-induced impacting force and wave-induced scour on bridge structures, especially during extreme wave events.
In this study, the wind and current directions remain consistent without the consideration of the various directional components associated with the wind and current. However, it is widely acknowledged that when the wind and current flow in the same direction, they enhance the water velocity near the surface, thereby inducing a more pronounced hydrodynamic impact on piers [40]. Conversely, when the wind opposes the current direction, the water velocity decreases, leading to a reduced hydrodynamic impact. We anticipate that wind primarily influences flow near the water surface by deforming waves and affecting their impact on bridge superstructures. Regarding scouring processes, it is crucial to consider flow within the near-bed region (e.g., the boundary layer), which governs sediment transport and bed erosion. In this regard, we assume that wave-induced flow in the boundary layer can be approximated as oscillatory motion with symmetrical characteristics. Furthermore, previous studies [6] have demonstrated that under deep-water conditions, wave–current interactions result in a scour mechanism where waves lift sediment grains, while currents transport them downstream; however, currents play a more significant role in bed scouring. Overall, our study solely focuses on scenarios where the wind direction aligns with both the wave and current directions, and future research should investigate how changing angles of these factors influence outcomes further.

5. Conclusions

In this study, a numerical investigation was conducted to examine the flow and scour around complex piers exposed to wind, wave, and current conditions, and referred to a real-world sea-crossing bridge. A well-established CFD model is employed that incorporates hydrodynamic, free surface, sediment transport, and morphological considerations. The wind shear stress model is considered to simulate wind generation. The CFD model is validated through comparison with the experimental results of scour around a cylinder, demonstrating its ability to accurately reproduce scour morphology and the temporal evolution of scour depth. Subsequently, the validated CFD model is applied for the full-scale simulation of scour around a complex bridge pier based on an actual sea-crossing bridge in China. The main findings are as follows:
(1)
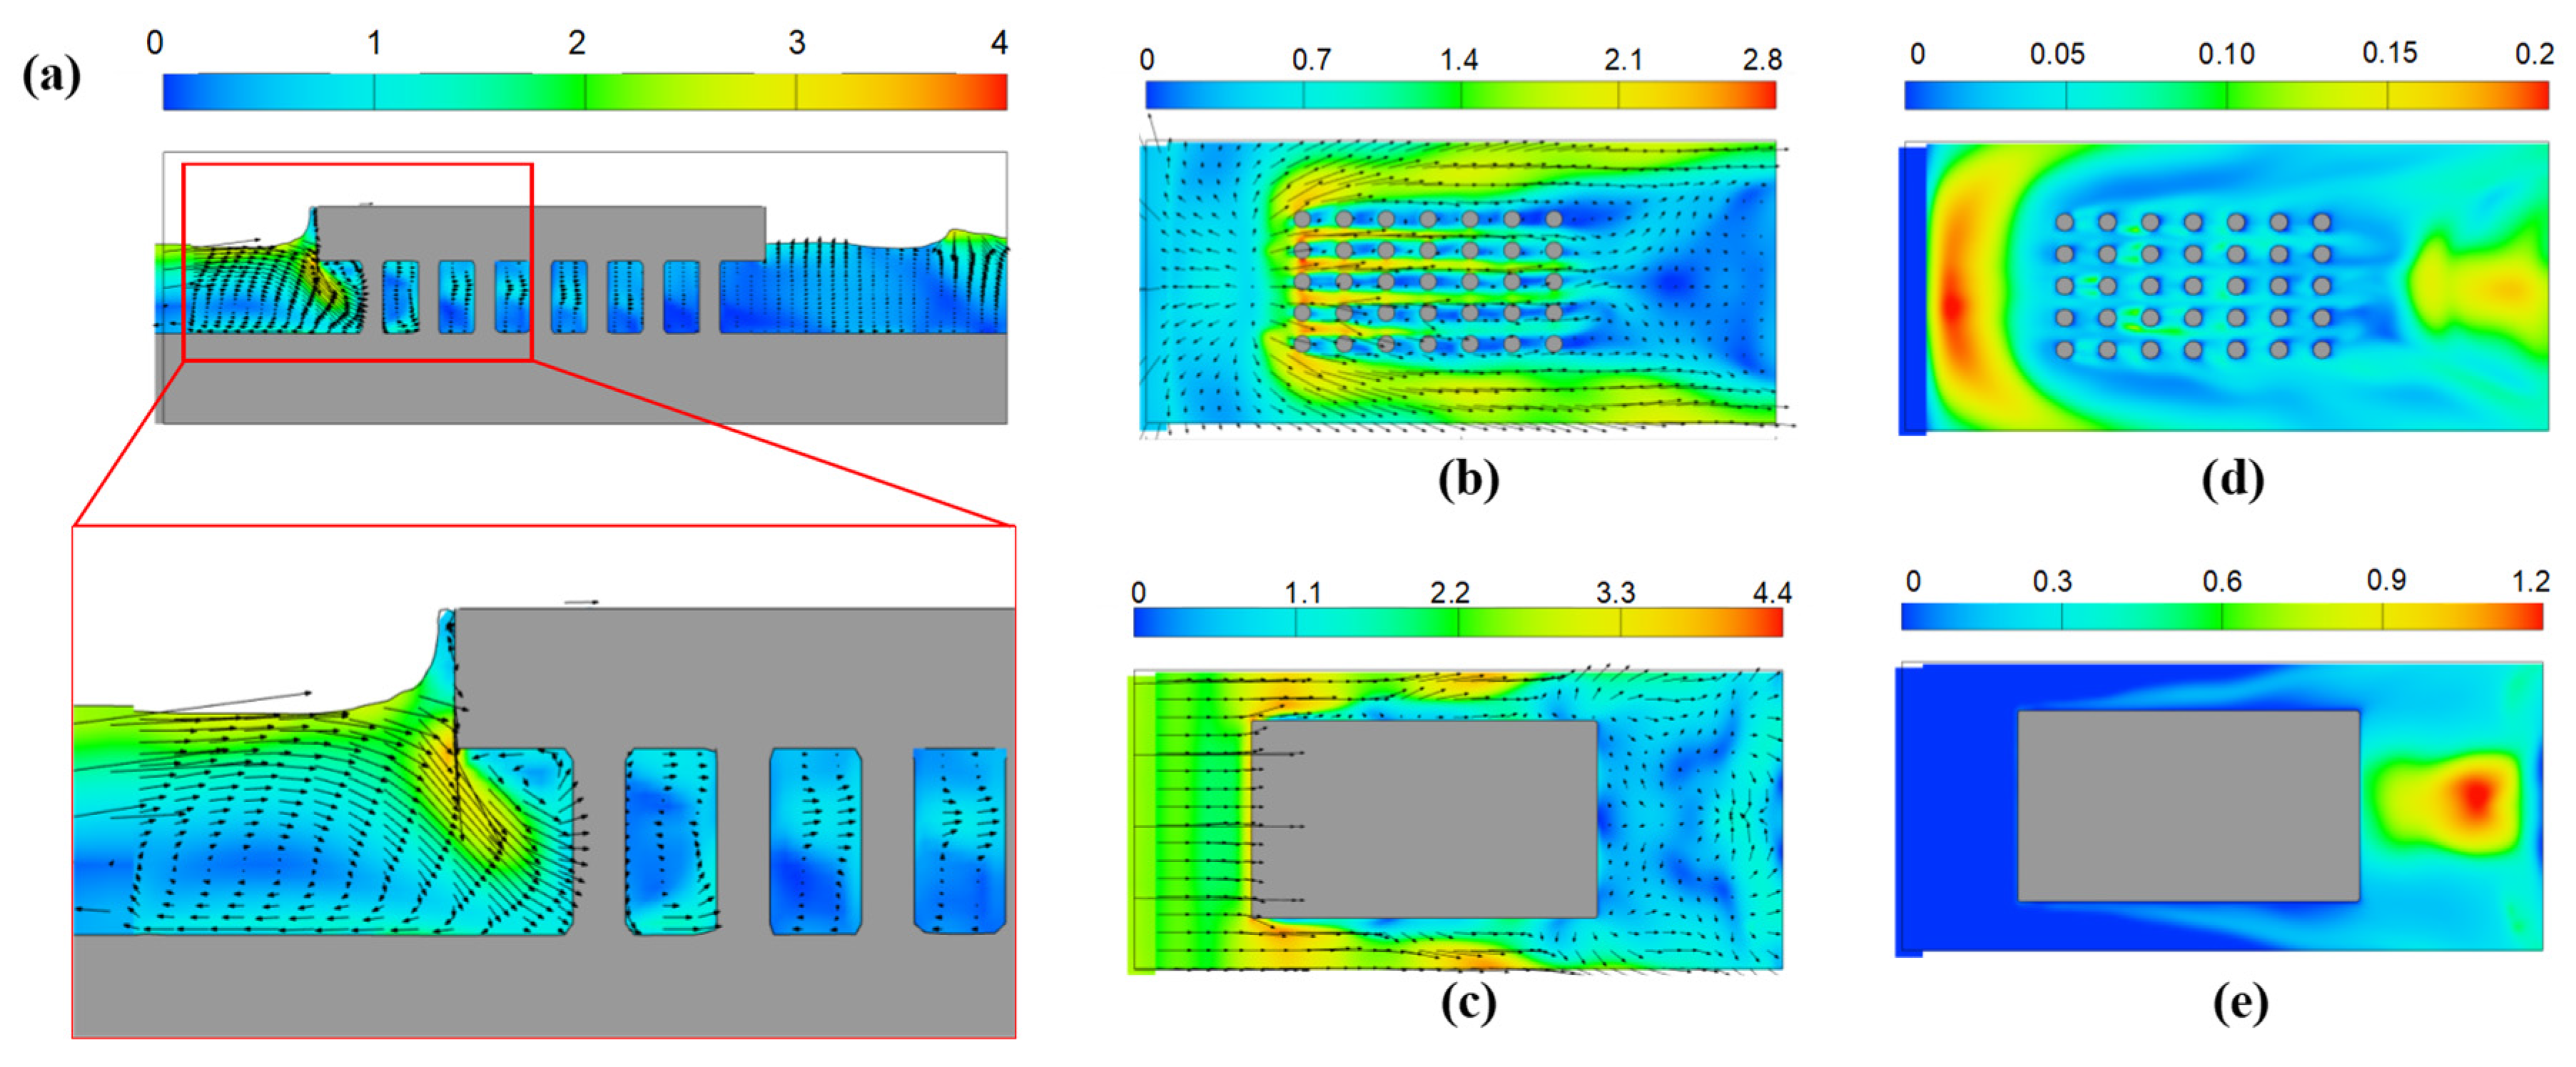
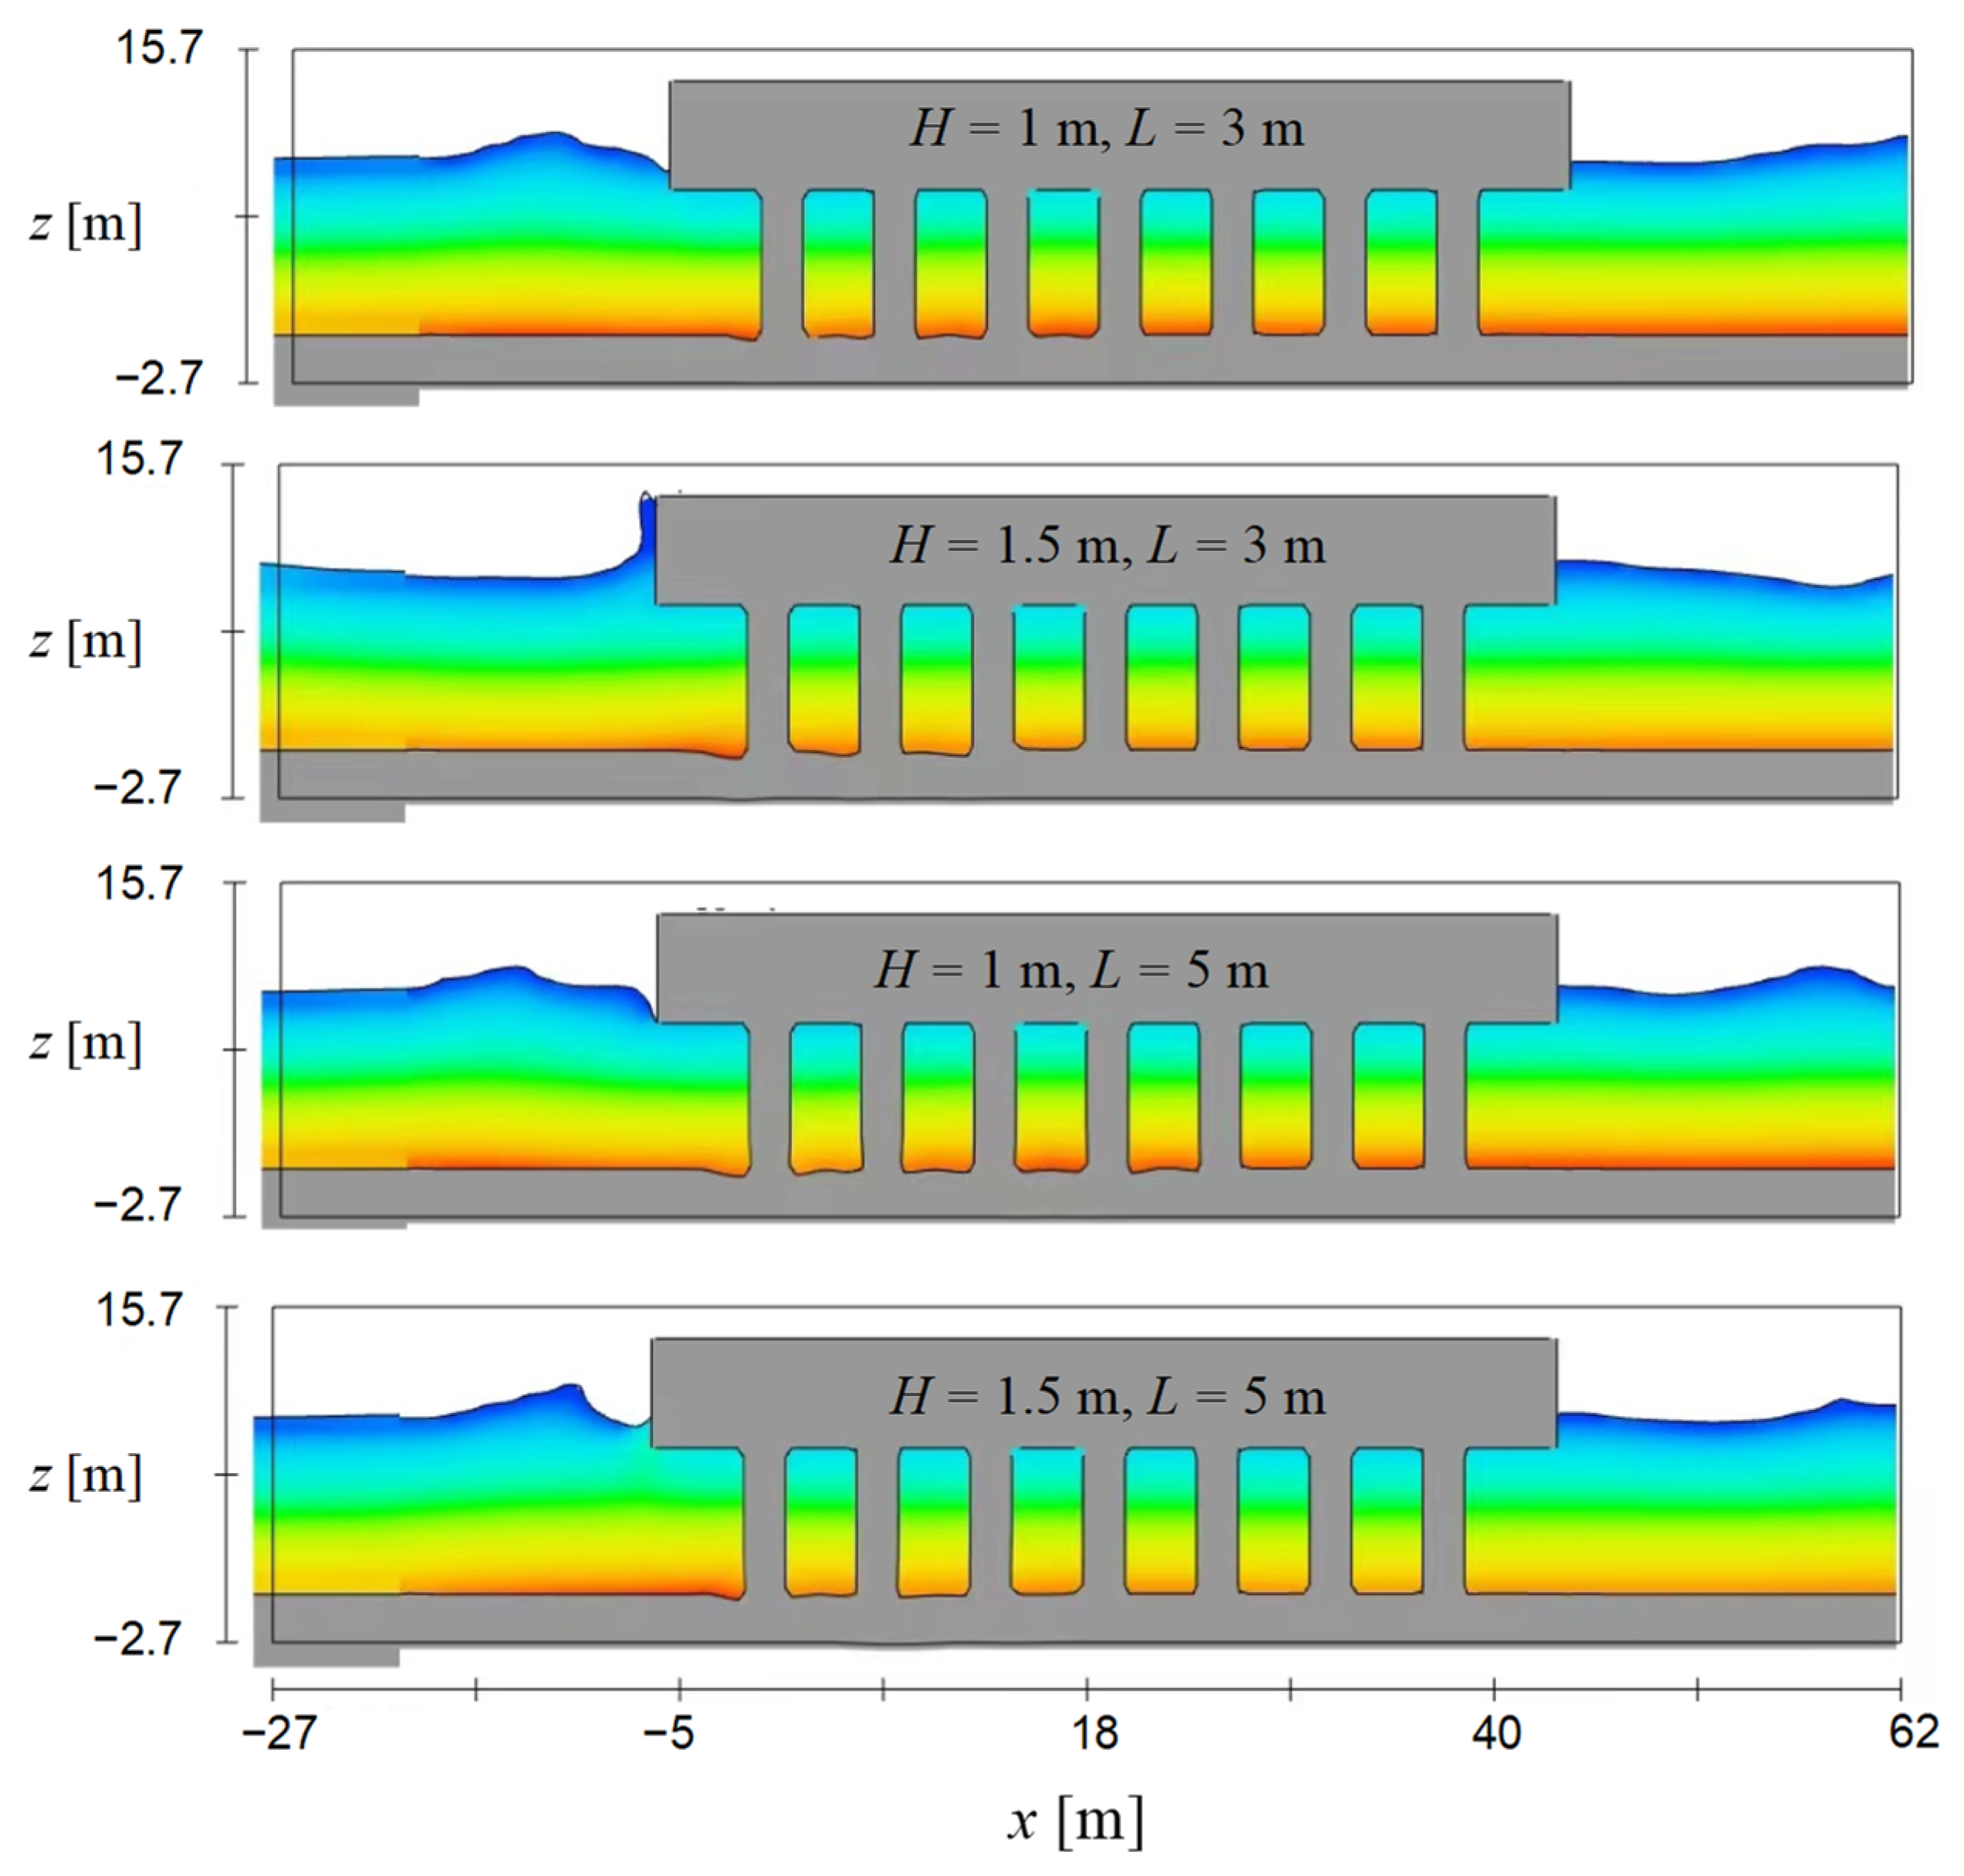
Compared to the single pier with a uniform cross-sectional shape, the flow field around a complex pier is much more complicated. A flow-sheltering phenomenon is significant within the pile group area, and the regions with high TKE are observed in front of the pile group and downstream of the pile cap.
(2)
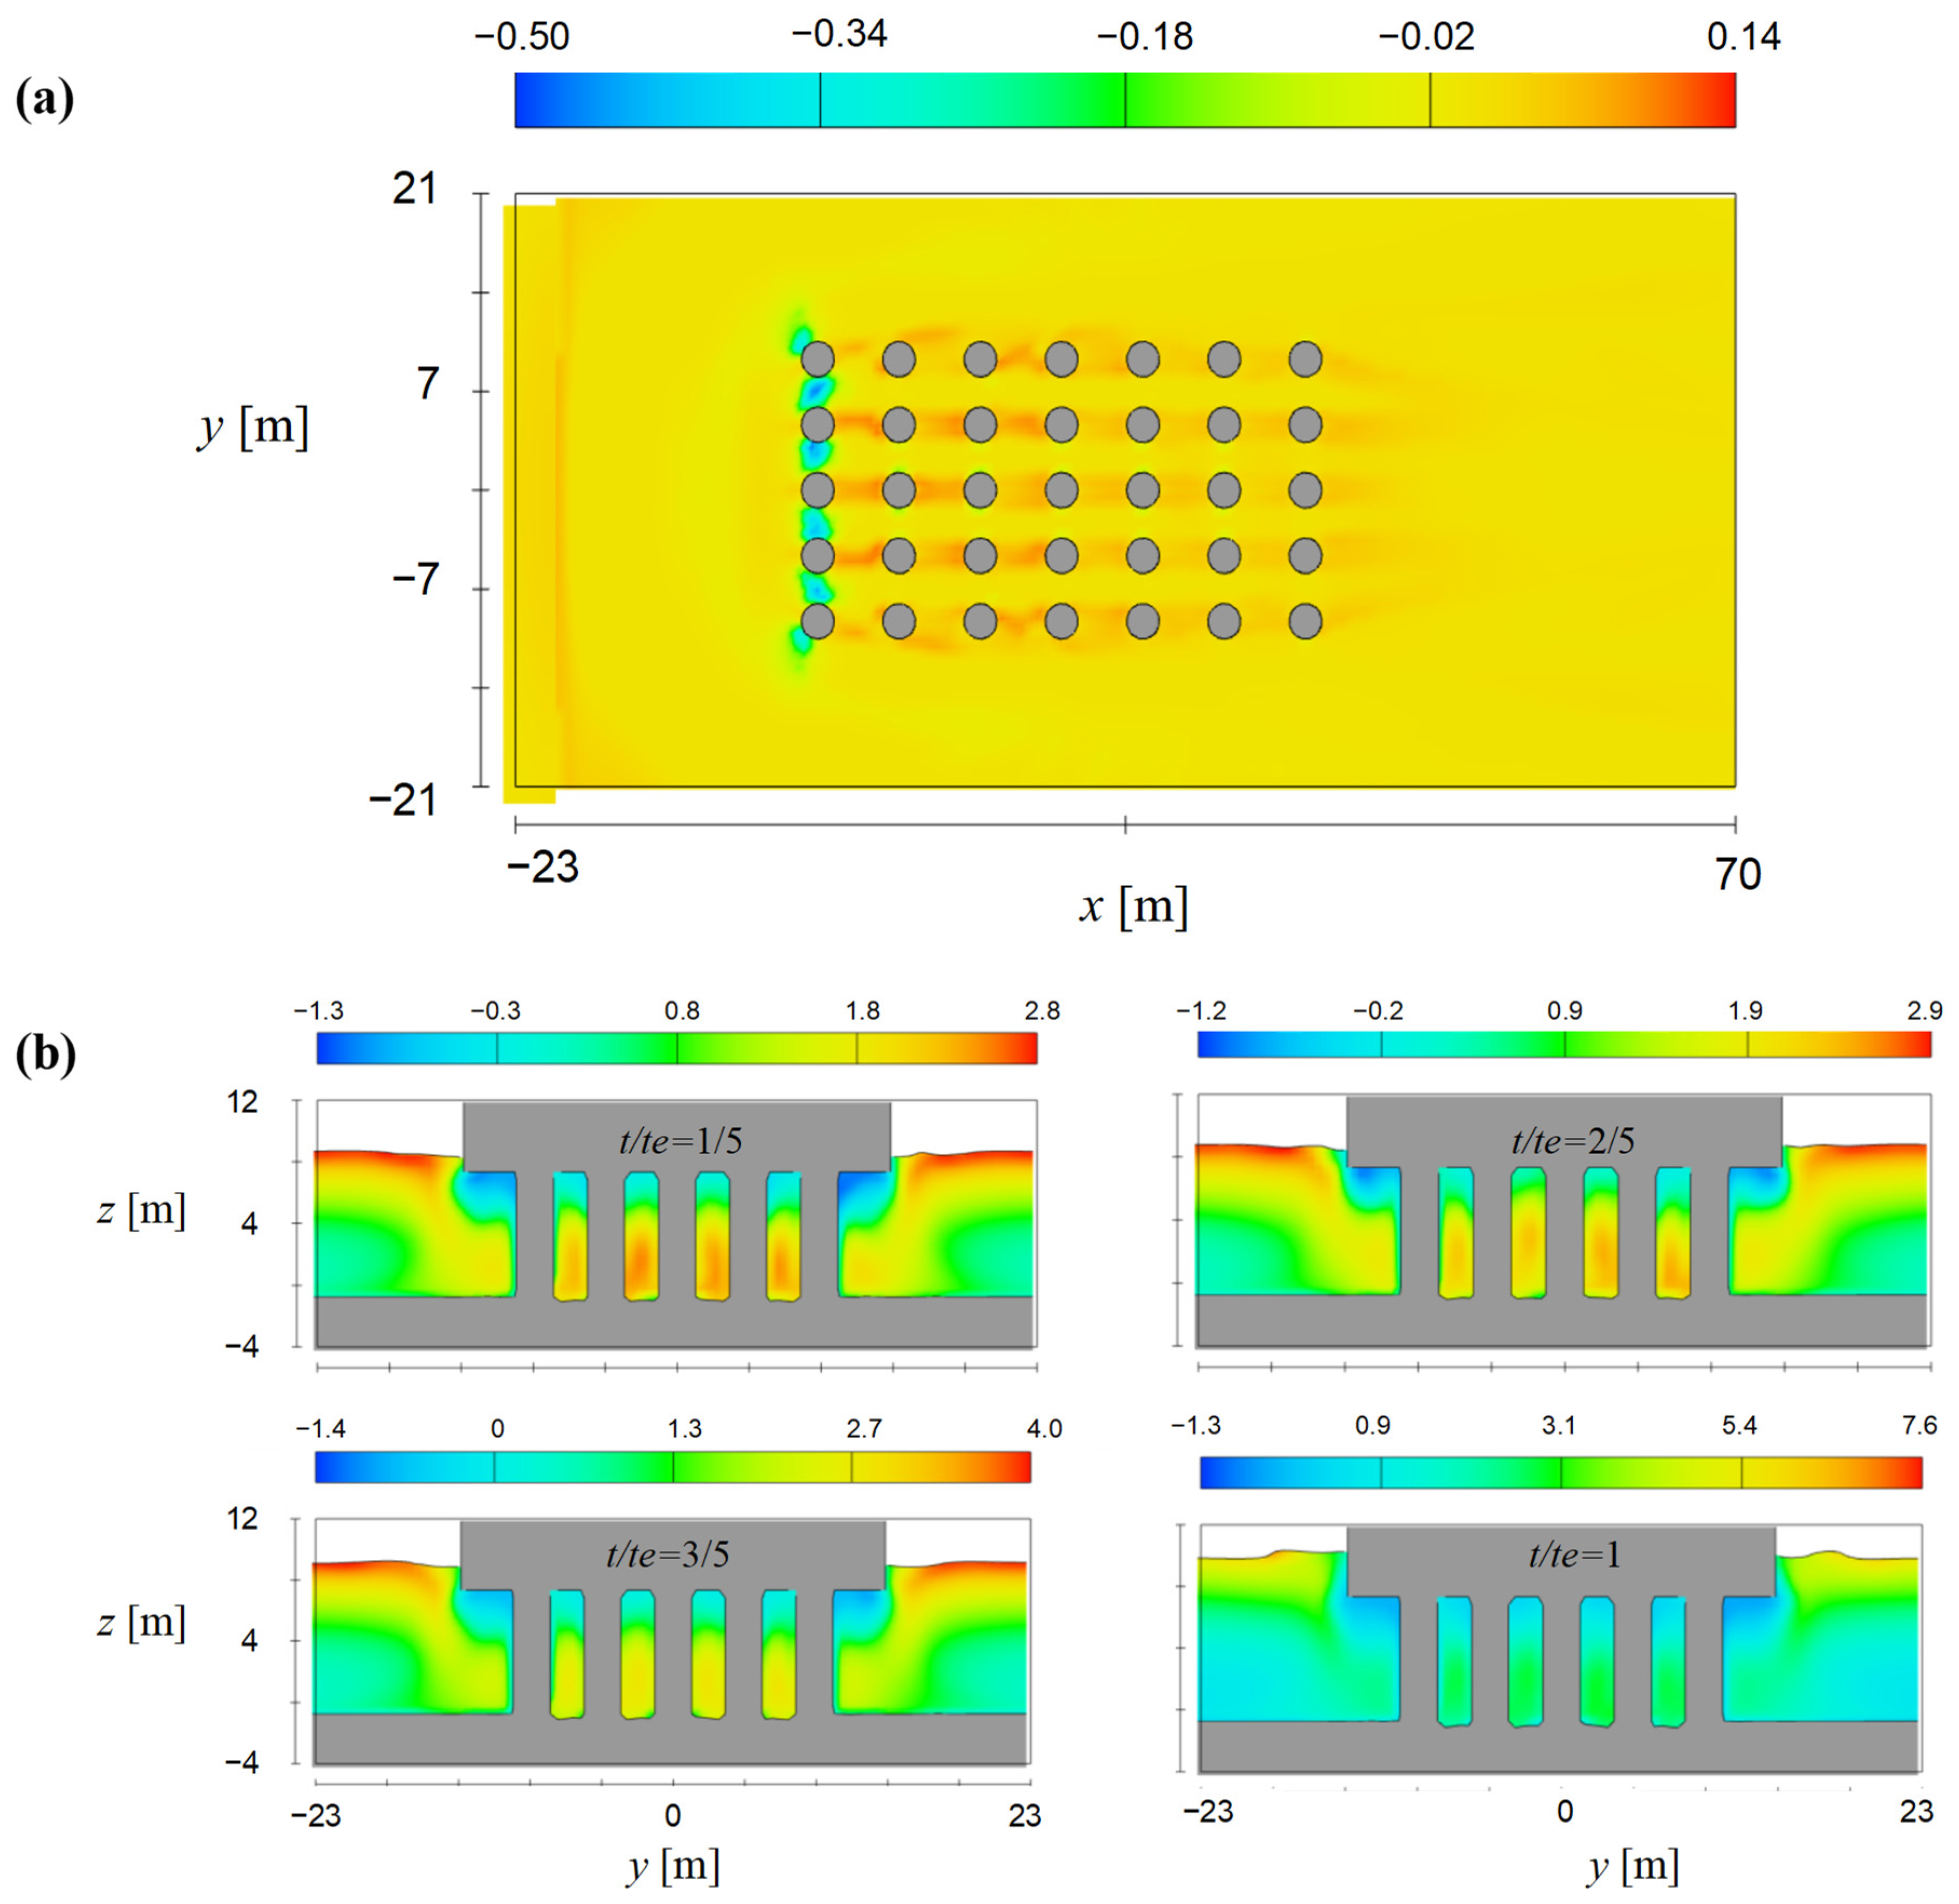
Scour predominantly occurs around the first row of piles, while the downstream piles experience a less significant impact from scour due to the sheltered position behind the first row, consequently reducing flow inundation on the downstream piles and resulting in a reduced bed scour depth.
(3)
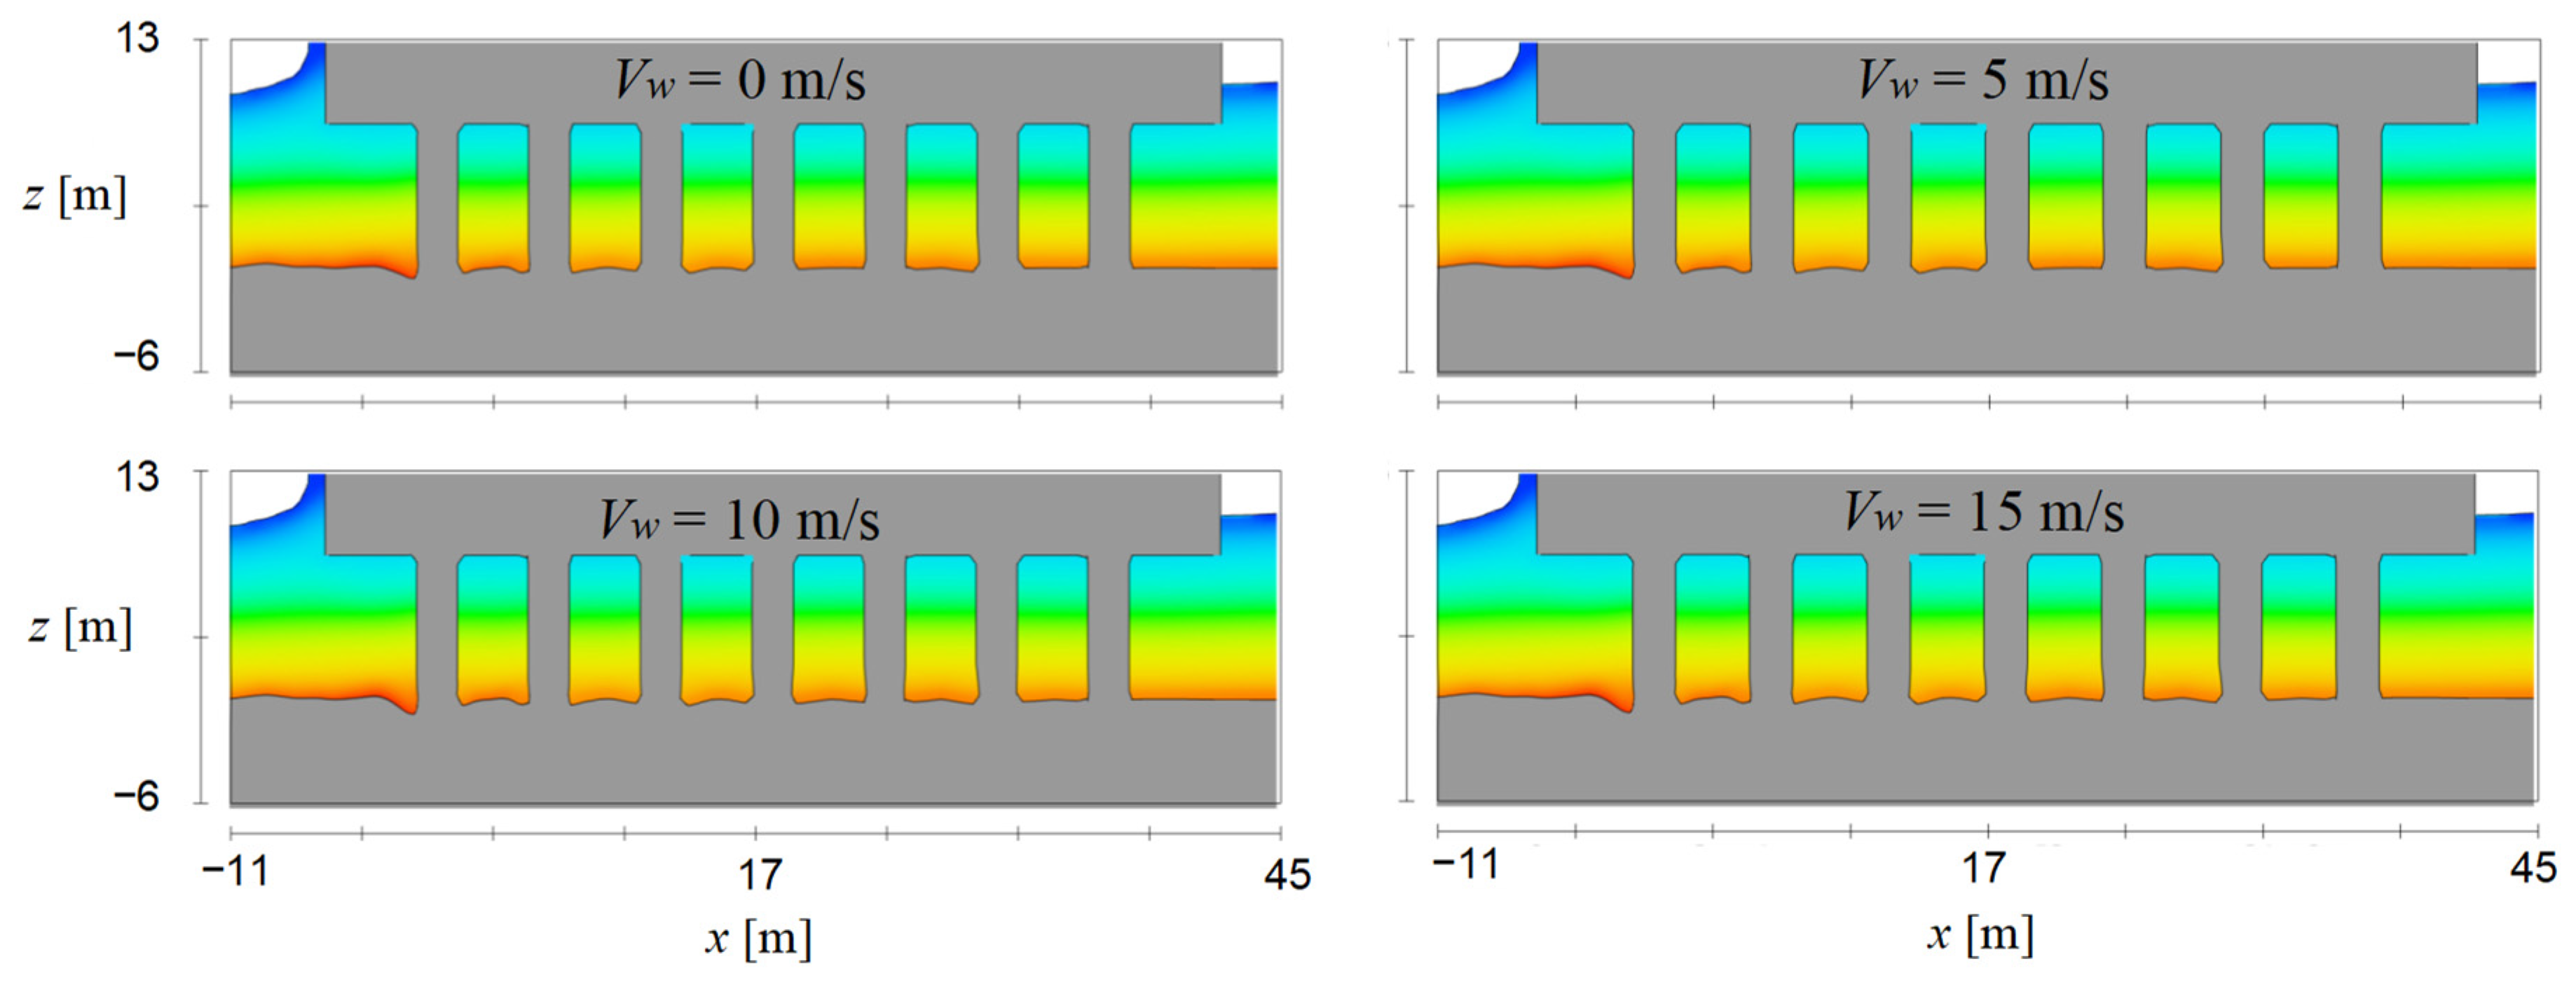
The effect of the current velocity on bridge scour is more pronounced compared to that exerted by waves or wind. The wind or wave effect primarily manifests through its impact force on the superstructure.

Author Contributions

Conceptualization, J.L. and Y.Y.; methodology, Y.Y.; software, J.L.; validation, Y.Y. and B.C.; formal analysis, W.Z.; investigation, B.C.; resources, Y.Y.; data curation, W.Z.; writing—original draft preparation, J.L.; writing—review and editing, J.L.; visualization, B.C., W.Z. and J.L.; supervision, Y.Y.; project administration, J.L. and Y.Y.; funding acquisition, J.L. and Y.Y. All authors have read and agreed to the published version of the manuscript.

Funding

This research is financially supported by the Science and Technology Research and Development Program Project of China railway group limited (Major Special Project, No. 2021-Special-04-2), National Natural Science Foundation of China (No. 52108137 and No. 52108186), Natural Science Foundation of Hunan Province (No. 2022JJ40065 and No. 2022JJ40620), Technology Plan Project of Jiangxi Bureau of Geology (No. 2021AA04), and Youth Science and Technology Leaders Training Program Project of Jiangxi Bureau of Geology (No. 2022JXDZKJRC07).

Institutional Review Board Statement

Not applicable.

Informed Consent Statement

Not applicable.

Data Availability Statement

The data presented in this study is available from the corresponding author upon request.

Acknowledgments

The authors thank the editors and anonymous reviewers for their constructive comments to improve this paper.

Conflicts of Interest

The authors declare no conflict of interest.

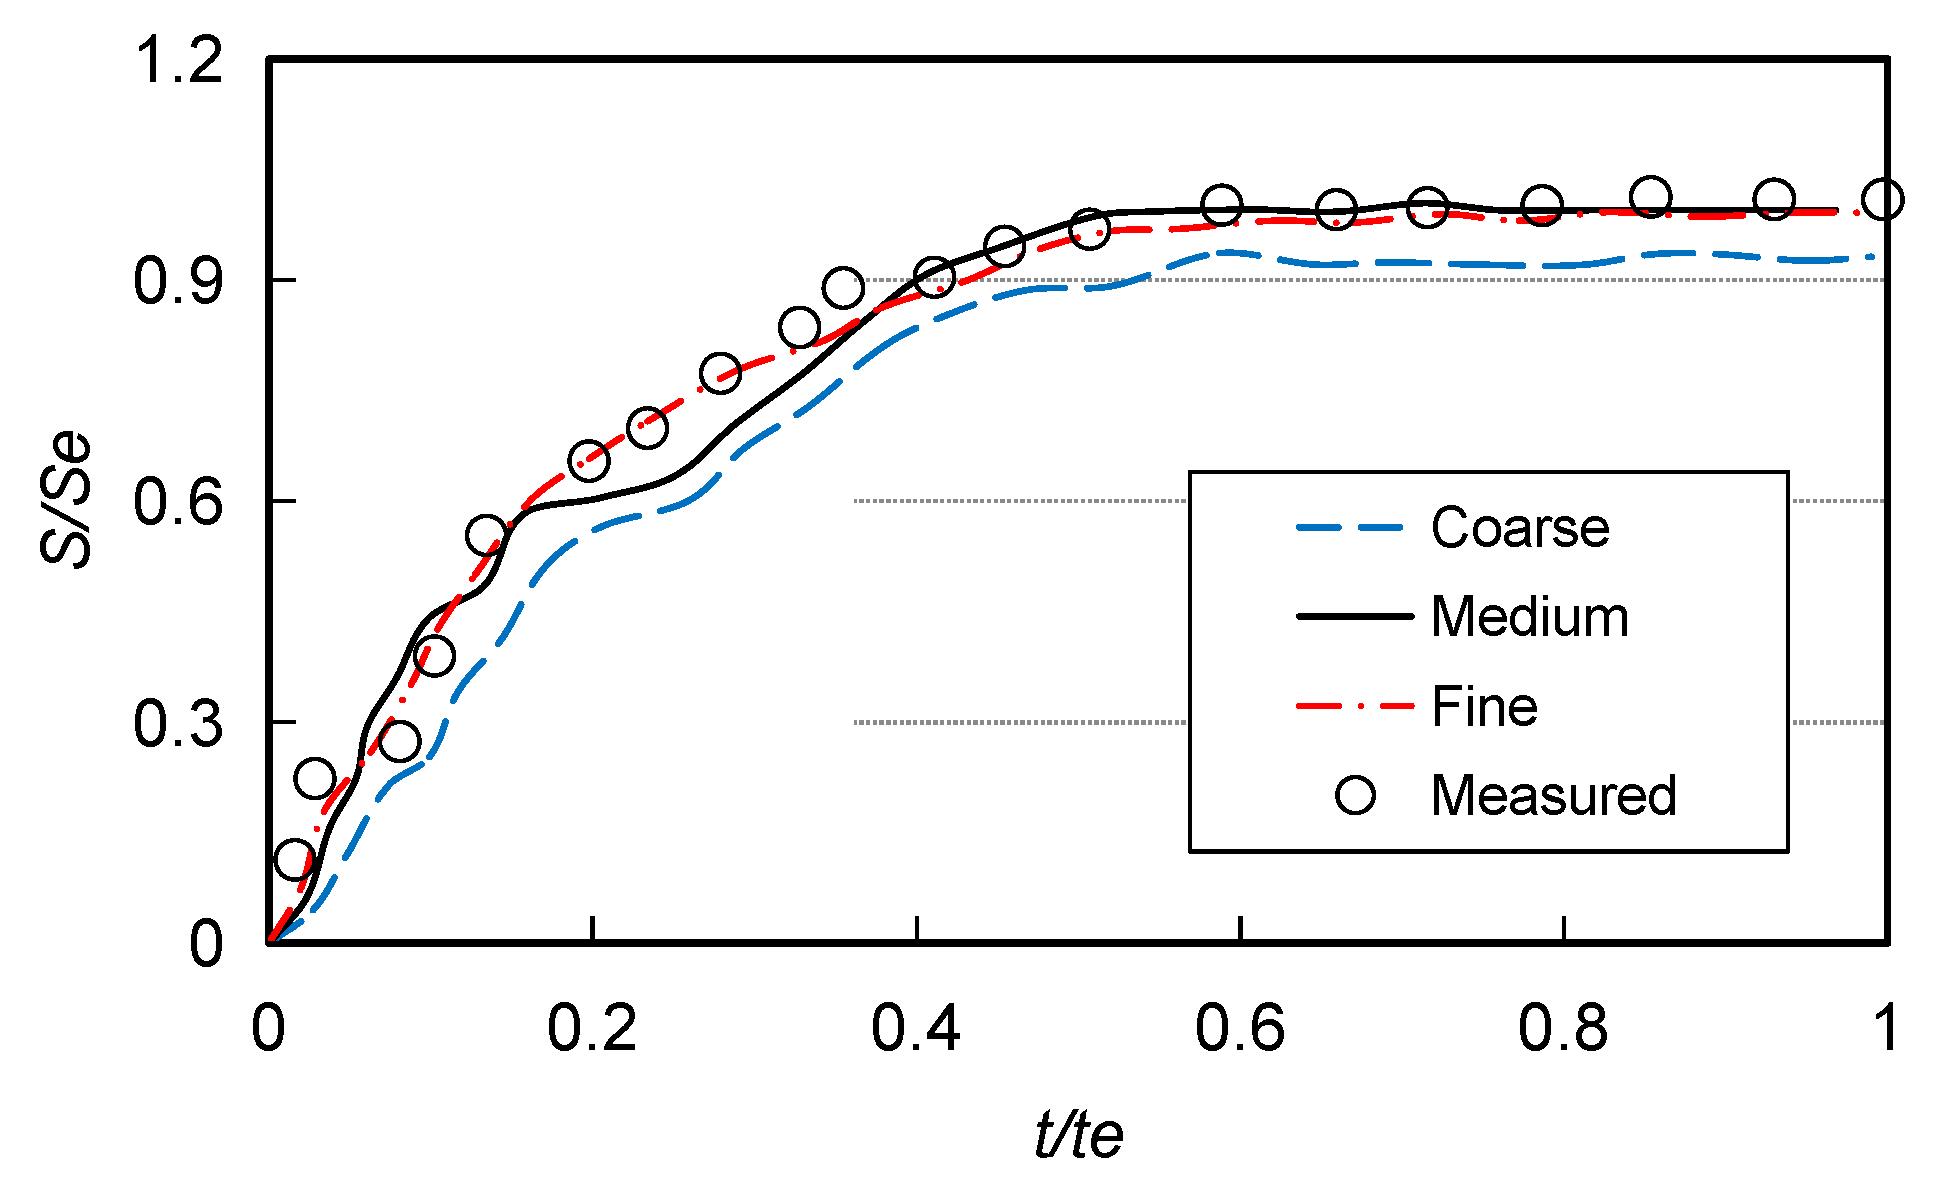
Appendix A. Mesh Convergence

To explore the impact of grid size on computational outcomes, three different meshes were utilized, as depicted in Figure A1. The fine and medium meshes underwent refinement with cells that were three times and two times smaller than those in the coarse mesh, respectively. It is evident that the computed scour development via the fine and medium meshes display remarkable similarity (almost overlapping), while there is a significant deviation from experimental data observed in the results obtained for the coarse mesh. Further refining the mesh does not lead to any substantial changes, indicating that convergence has been achieved. Therefore, considering a balance between computational accuracy and efficiency, we opted for the medium mesh for this study.
Figure A1. Comparison of scour development with different mesh resolutions.
Jmse 12 00023 g0a1

References

  1. Xu, J.; Xia, J.; Wang, L.; Zhu, H.; Avital, E.J. Direct numerical simulation on local scour around the cylinder induced by internal solitary waves propagating over a slope. Ocean. Eng. 2022, 247, 110525. [Google Scholar] [CrossRef]
  2. Li, J.; Kong, X.; Yang, Y.; Yang, Z.; Hu, J. Computer vision-based measurement of wave force on the rectangular structure. Ocean. Eng. 2023, 270, 113624. [Google Scholar] [CrossRef]
  3. Tonkin, S.; Yeh, H.; Kato, F.; Sato, S. Tsunami scour around a cylinder. J. Fluid Mech. 2003, 496, 165–192. [Google Scholar] [CrossRef]
  4. Bricker, J.D.; Francis, M.; Nakayama, A. Scour depths near coastal structures due to the 2011 Tohoku tsunami. J. Hydraul. Res. 2012, 50, 637–641. [Google Scholar] [CrossRef]
  5. McGovern, D.J.; Todd, D.; Robinson, T.; Whitehouse, R.J.S.; Monaghan, J.; Gomes, E. Experimental observations of tsunami induced scour at onshore structures. Coast. Eng. 2019, 152, 103505. [Google Scholar] [CrossRef]
  6. Sumer, B.M.; Fredsøe, J. The Mechanics of Scour in the Marine Environment; World Scientific: Singapore, 2002. [Google Scholar]
  7. Melville, B.W.; Coleman, S.E. Bridge Scour; Water Resources Publications: Highlands Ranch, CO, USA, 2000. [Google Scholar]
  8. Coleman, S.E. Clearwater local scour at complex piers. J. Hydraul. Eng. 2005, 131, 330–334. [Google Scholar] [CrossRef]
  9. Moreno, M.; Maia, R.; Couto, L. Prediction of equilibrium local scour depth at complex bridge piers. J. Hydraul. Eng. 2016, 142, 04016045. [Google Scholar] [CrossRef]
  10. Yang, Y.; Melville, B.W.; Sheppard, D.M.; Shamseldin, A.Y. Clear-water local scour at skewed complex bridge piers. J. Hydraul. Eng. 2018, 144, 0001458. [Google Scholar] [CrossRef]
  11. Yang, Y.; Li, J.; Jing, H. Experimental study of flow field and sediment suspension in the gap area of tandem piles under oscillatory flows. Ocean. Eng. 2022, 266, 113124. [Google Scholar] [CrossRef]
  12. Ramos, P.X.; Bento, A.M.; Maia, R.; Pego, J.P. Characterization of the scour cavity evolution around a complex bridge pier. J. Appl. Water Eng. Res. 2015, 4, 128–137. [Google Scholar] [CrossRef]
  13. Ettema, R.; Constantinescu, G.; Melville, B.W. Flow-Field Complexity and Design Estimation of Pier-Scour Depth: Sixty Years since Laursen and Toch. J. Hydraul. Eng. 2017, 143, 03117006. [Google Scholar] [CrossRef]
  14. Afzal, M.S.; Bihs, H.; Kamath, A.; Arntsen, Ø.A. Three-dimensional numerical modeling of pier scour under current and waves using level-set method. J. Offshore Mech. Arct. Eng. 2015, 137, V002T08A030. [Google Scholar]
  15. Baykal, C.; Sumer, B.M.; Fuhrman, D.R.; Jacobsen, N.G.; Fredosøe, J. Numerical simulation of scour and backfilling processes around a circular pile in waves. Coast. Eng. 2017, 122, 87–107. [Google Scholar] [CrossRef]
  16. Ahmad, N.; Bihs, H.; Myrhaug, D.; Kamath, A.; Arntsen, Ø.A. Three-dimensional numerical modelling of wave-induced scour around piles in a side-by-side arrangement. Coast. Eng. 2018, 138, 132–151. [Google Scholar] [CrossRef]
  17. Li, J.; Fuhrman, D.R.; Kong, X.; Xie, M.; Yang, Y. Three-dimensional numerical simulation of wave-induced scour around a pile on a sloping beach. Ocean. Eng. 2021, 233C, 109174. [Google Scholar] [CrossRef]
  18. Li, J.; Kong, X.; Yang, Y.; Deng, L.; Xiong, W. CFD investigations of tsunami-induced scour around bridge piers. Ocean. Eng. 2022, 244, 110373. [Google Scholar] [CrossRef]
  19. Gautam, S.; Dutta, D.; Bihs, H.; Afzal, M.S. Three-dimensional Computational Fluid Dynamics modelling of scour around a single pile due to combined action of the waves and current using Level-Set method. Coast. Eng. 2021, 170, 104002. [Google Scholar] [CrossRef]
  20. Hu, R.; Wang, X.; Liu, H.; Chen, D. Numerical study of local scour around tripod foundation in random waves. J. Mar. Sci. Eng. 2022, 10, 475. [Google Scholar] [CrossRef]
  21. Lai, Y.G.; Liu, X.F.; Bombardelli, F.A.; Song, Y. Three-dimensional numerical modeling of local scour: A state-of-the-art review and perspective. J. Hydraul. Eng. 2022, 148, 0312202. [Google Scholar] [CrossRef]
  22. Zhao, M. A Review on recent development of numerical modelling of local scour around hydraulic and marine structures. J. Mar. Sci. Eng. 2022, 10, 1139. [Google Scholar] [CrossRef]
  23. Qu, K.; Wen, B.H.; Ren, X.Y.; Kraatz, S.; Sun, W.Y.; Deng, B.; Jiang, C.B. Numerical investigation on hydrodynamic force of coastal bridge deck under joint action of solitary wave and wind. Ocean. Eng. 2020, 217, 108037. [Google Scholar] [CrossRef]
  24. Qu, K.; Wang, Y.; Tang, H.S.; Agrawal, A.; Shields, G.; Chien, S.I.; Gurung, S.; Imam, Y.; Chiodi, I. Extreme storms surge and waves and vulnerability of coastal bridges in New York city metropolitan region: An assessment based on hurricane sandy. Nat. Hazards 2021, 105, 2697–2734. [Google Scholar] [CrossRef]
  25. Wilcox, D.C. Turbulence Modeling for CFD, 3rd ed.; DCW Industries, Inc.: La Canada, CA, USA, 2006. [Google Scholar]
  26. Hirt, C.W. Volume-fraction techniques: Power tools for wind engineering. In Proceedings of the 1st International Symposium on Computational Wind Engineering (CWE 92), Tokyo, Japan, 21–23 August 1992; pp. 327–338. [Google Scholar]
  27. Kuai, Y.; Qi, M.; Li, J. Numerical study on the propagation of solitary waves in the near-shore. Ocean. Eng. 2018, 165, 155–163. [Google Scholar] [CrossRef]
  28. Amorocho, J.; Devries, J.J. A new evaluation of the wind stress coefficient over water surfaces. J. Geophys. Res. 1980, 85, 433–442. [Google Scholar] [CrossRef]
  29. van Rijn, L. Sediment transport, Part I: Bed load transport. J. Hydraul. Eng. 1984, 110, 1431–1456. [Google Scholar] [CrossRef]
  30. Soulsby, R.L.; Whitehouse, R.J.S. Threshold of sediment motion in coastal environments. In Pacific Coasts and Ports ’97: Proceedings of the 13th Australasian Coastal and Ocean Engineering Conference and the 6th Australasian Port and Harbour Conference, Christchurch, New Zealand, 7–11 September 1997; Centre for Advanced Engineering, University of Canterbury: Christchurch, New Zealand, 1997; Volume 1, p. 1. [Google Scholar]
  31. Paola, C.; Voller, V.R. A generalized Exner equation for sediment mass balance. J. Geophys. Res. 2005, 110, F04014. [Google Scholar] [CrossRef]
  32. Li, J.; Kong, X.; Yang, Y.; Yang, Z.; Hu, J. Numerical modeling of solitary wave-induced flow and scour around a square onshore structure. J. Mar. Sci. Eng. 2023, 11, 198. [Google Scholar] [CrossRef]
  33. Li, J.; Yang, Y.; Yang, Z. Influence of scour development on turbulent flow field in front of a bridge pier. Water 2020, 12, 2370. [Google Scholar] [CrossRef]
  34. Yang, Z.; Li, J.; Zhang, H.; Yuan, C.; Yang, H. Experimental study on 2D motion characteristics of submerged floating tunnel in waves. J. Mar. Sci. Eng. 2020, 8, 123. [Google Scholar] [CrossRef]
  35. Xie, M.; Zhang, C.; Li, J.; Li, S.; Zhang, H.; Yang, Z. Flow structure and bottom friction on the non-linear turbulent boundary layer under stormy waves. Coast. Eng. 2021, 164, 103811. [Google Scholar] [CrossRef]
  36. Alemi, M.; Maia, R. Numerical simulation of the flow and local scour process around single and complex bridge piers. Int. J. Civ. Eng. 2016, 16, 475–487. [Google Scholar] [CrossRef]
  37. Bento, A.M.; Pêgo, J.P.; Viseu, T.; Couto, L. Scour development around an oblong bridge pier: A numerical and experimental study. Water 2023, 15, 2867. [Google Scholar] [CrossRef]
  38. Simarro, G.; Fael, C.M.S.; Cardoso, A.H. Estimating equilibrium scour depth at cylindrical piers in experimental studies. J. Hydraul. Eng. 2011, 137, 1089–1093. [Google Scholar] [CrossRef]
  39. Simarro, G.; Martín, J.P. Exponential expression for time evolution in local scour. J. Hydraul. Res. 2004, 42, 663–665. [Google Scholar] [CrossRef]
  40. Xu, B.; Wei, K.; Qin, S.; Hong, J. Experimental study of wave loads on elevated pile cap of pile group foundation for sea-crossing bridges. Ocean. Eng. 2020, 197, 106896. [Google Scholar] [CrossRef]
Figure 1. Images showing the typical bridge pier forms: (a,b) single pier; (c,d) complex pier.
Jmse 12 00023 g001
Figure 2. Numerical setup for pier scour modeling: (a) computational domain and (b) computational mesh.
Jmse 12 00023 g002
Figure 3. Comparison between the numerical and experimental results for scour around the pier: (a) final scour depth; (b) final scour hole morphology; (c) scour hole evolution; (d) temporal development of scour depth.
Jmse 12 00023 g003
Figure 4. Numerical setup of complex pier scour simulation: (a) sketch up of the Donghai sea-crossing bridge; (b) side view of the numerical setup; (c) front view of the numerical setup; (d) computational mesh; (e) boundary conditions.
Jmse 12 00023 g004
Figure 5. Flow field around the complex pier: (a) vortex in front of the pier; (b) velocity field around the pile group; (c) velocity field around the cap; (d) turbulent kinetic energy around the pile group; and (e) turbulent kinetic energy around the cap.
Jmse 12 00023 g005
Figure 6. Scour evolution around the complex pier: (a) local scour around the pile groups; (b) scour development with time (front view).
Jmse 12 00023 g006
Figure 7. Influence of the wind velocity (Vw) on the scour around the pier (side view).
Jmse 12 00023 g007
Figure 8. Influence of the current velocity (Vc) on the scour around the pier (from the top view).
Jmse 12 00023 g008
Figure 9. Influence of wave parameters (wave height H and wave length L) on the scour around the pier (side view).
Jmse 12 00023 g009
Table 1. Flow conditions and result comparison for the present validation of cylinder scour simulations.
Case No.Vc [m/s]d50 [mm]Se [cm]Sn [cm]Error [−]
10.161.653.43.18.8%
20.160.626.86.28.8%
30.160.146.16.44.9%
40.211.657.56.316%
50.210.6211.19.514%
60.210.149.910.12%
Table 2. Flow conditions and results for the CFD simulation of scour for the complex pier.
Case No.Vw [m/s]Vc [m/s]H [m]L [m]Se [m]
101.01.03.00.28
251.01.03.00.28
3101.01.03.00.30
4151.01.03.00.30
550.81.03.00.23
651.21.03.00.38
751.51.03.00.45
851.01.53.00.31
951.01.05.00.29
1051.01.55.00.32
Note: Vw is wind velocity; Vc is current velocity; H is wave height; L is wave length; Se is final scour depth.
Disclaimer/Publisher’s Note: The statements, opinions and data contained in all publications are solely those of the individual author(s) and contributor(s) and not of MDPI and/or the editor(s). MDPI and/or the editor(s) disclaim responsibility for any injury to people or property resulting from any ideas, methods, instructions or products referred to in the content.

