Article

Random/Cognitive Hybrid Uncertainty Analysis of Ship Multitasking Cabin Layout

1
College of Navigation, Dalian Maritime University, Dalian 116026, China
2
College of Marine Electrical Engineering, Dalian Maritime University, Dalian 116026, China
*
Author to whom correspondence should be addressed.
J. Mar. Sci. Eng. 2024, 12(1), 120; https://doi.org/10.3390/jmse12010120
Submission received: 26 November 2023 / Revised: 31 December 2023 / Accepted: 5 January 2024 / Published: 8 January 2024

Abstract

:
Identifying the optimal cabin layout is an important way to improve the efficiency of ship systems and ensure the efficient circulation of personnel and materials. The ship task state refers to the state maintained by the joint actions of ship machinery and equipment, cargo, and personnel when facing different jobs and tasks during operation. A cabin layout that facilitates multitasking states can improve the efficiency of collaboration between systems and ensure the operation of the ship. The demand for human flow and logistics is different in multitasking states. To express the demand in mathematical form, there is a certain random uncertainty in the numerical quantification of the demand. Thus, to better meet the needs of different states, the coefficient values of each state can be integrated using special methods. Ensuring values’ initial preference to the greatest extent inevitably produces a degree of cognitive uncertainty. Therefore, uncertainty analysis is necessary for cabin layout design to be used for multitasking states. In this paper, a deterministic optimization platform of cabin layout in multitasking states is obtained. Adjacent and circulating strength coefficients are obtained through numerical quantization of the demand for human flow and logistics. The random uncertainty in the input values of two coefficients was represented by random variables, and the cognitive uncertainty was represented by interval variables. In order to solve the problem of two types of variables, a random-interval hybrid uncertainty model was established. Through random intervalization and interval randomization, three cases, of random variables, interval variables, and random variables and interval variables, were studied. The probability distribution of the model function was used to evaluate the influence of different compositions of uncertainty parameters on the robustness of the cabin layout scheme. The necessity and effectiveness of uncertainty analysis in multitasking cabin layout are discussed below.

1. Introduction

With the rapid development of computer technology, requirements for intelligent cabin layout design have also been increasing. An effective cabin layout scheme is not only beneficial to the efficiency of a ship’s various systems and the efficient circulation of personnel and materials on board, but it also has an important influence on channel layout design and the interior cabin facility layout. Scholars are conducting ongoing research in this field. Julien et al. proposed a general interactive method for cabin layout optimization. It explores the optimal layout scheme with a multiobjective modular optimization strategy [1]. Kim et al. proposed a submarine cabin and equipment layout method based on an expert system and multilevel optimization to optimize submarine cabin layout [2]. Bao et al. considered the joint arrangement of channels in the design optimization of cabin layout to explore a better cabin layout scheme [3]. Dong et al. improved the genetic algorithm based on the principle of reverse learning to optimize population generation. And it was verified in a cabin layout optimization problem [4]. Scholars have explored new optimization methods, extended analysis models, and improved optimization algorithms in cabin layout optimization problems. And most of their analyses are only compatible with one ship task state. The cabin layout optimization problem under multitasking states studied in this paper is more complicated when there is a circulation of personnel and goods. And the increase in the corresponding input parameters also leads to a risk to the effectiveness of the optimization results. Therefore, this study aims to explore the optimal solution of the cabin layout optimization problem under multitasking states.
The ship task state refers to the operation of the ship’s machinery and equipment, the movement of personnel, the flow of goods, and other aspects of the common operation and maintenance of the state in the normal operation of the ship for different work activities and tasks. When facing multitasking states, it is difficult for the traditional deterministic optimization method to take into account the needs of multiple personnel flows and cargo flows. At the same time, the variable design and parameter settings of the model are often artificially quantified. This is bound to increase the risk that the cabin layout scheme deviates from the actual state during navigation. An optimization design considering uncertainty factors can reduce this risk. Uncertainty analysis and verification should be carried out before building the optimization platform, which is also the focus of this paper.
The mainstream method of uncertainty classification is to divide it into random uncertainty and cognitive uncertainty. Random uncertainty mainly describes the inherent uncertainties in changes in physical systems or environments. Cognitive uncertainty is caused by a designer’s lack of relevant knowledge of behavior during modeling [5]. In multitasking states, each task state has a different demand for human flow and logistics. To be inserted into the mathematical model for calculation, the demand is artificially quantified, producing a certain random uncertainty. To better meet the needs of multitasking states, the coefficient values of each state are integrated through special methods to ensure their initial preferences to the greatest extent, which inevitably produces a degree of cognitive uncertainty. Regarding the hybrid uncertainty composed of these two types of uncertainty, it is crucial to analyze it to weaken its impact. In this paper, the random-interval hybrid uncertainty model is innovatively introduced in the cabin layout optimization problem to quantify and analyze the uncertainty factors.
The random-interval hybrid uncertainty model can avoid the inherent defects of the random reliability analysis model and the interval reliability analysis model. It enables the structure of the reliability analysis to avoid blind conservatism and reflects the objective randomness of uncertainty parameters [6]. Hu et al. have developed a new mixed-uncertainty robust optimization (MURO) method considering both random and interval uncertainties [7]. Jiang et al. proposed a probability-interval mixed uncertainty model considering parameter correlation and the corresponding structural reliability analysis method [8]. Most scholars use this model for reliability analysis. Based on the deterministic optimization platform, the constraints were fully considered in the optimization process, and the uncertainty mainly existed in the input parameters. Based on the random-interval hybrid uncertainty model, this paper applied the reliability analysis method to robustness analysis. It is applied and verified in the cabin layout optimization problem under multitasking states. Robustness analysis is performed to evaluate the robustness of the scheme by analyzing the kurtosis and expansion of the probability distribution of the objective function [9,10].
In order to better address the research of multitasking states, the research object of this paper is a hypothetical cruise living area cabin. First, a simplified cabin layout model was established. The deterministic optimization mathematical model was established with the cabin sequence as a design variable. And the four task states of the damage state of fixtures and machines, the escape state during danger, the maintenance and support state, and the daily navigation state were selected for optimization analysis. Second, on the basis of a deterministic optimization platform, a robustness analysis of the hybrid uncertainty of the input-adjacent and circulating strength coefficients was carried out. The functional function of the random-interval hybrid uncertainty model was established. The uncertainty parameters composed of interval variables were obtained via random intervalization. Interval randomization was conducted to obtain the uncertainty parameters composed of random variables. Finally, the influence of uncertainty parameters composed of interval variables, random variables, and random variables and interval variables on the probability distribution of the function was compared. From the perspective of kurtosis and the degree of expansion of probability distribution, the influence of different compositions of uncertainty parameters on the robustness of the cabin layout scheme was analyzed.

2. Simplified Model and Deterministic Optimization Model of Cabin Layout

2.1. Definition of Multitasking States

The ship task state refers to the flow state of personnel and materials between the cabin and the channel that is different from other states, where different work activities and tasks are performed during the normal operation of the ship. Therefore, there is a unique circulation demand among the cabins. Multitasking states mean that there are multiple task states at the same time in the operating cycle. Multiple states exist alternately, rather than there being a single task state throughout. This topic focuses on the following task states (Table 1), and tries to find a more suitable cabin layout scheme for multitasking states.

2.2. Simplif

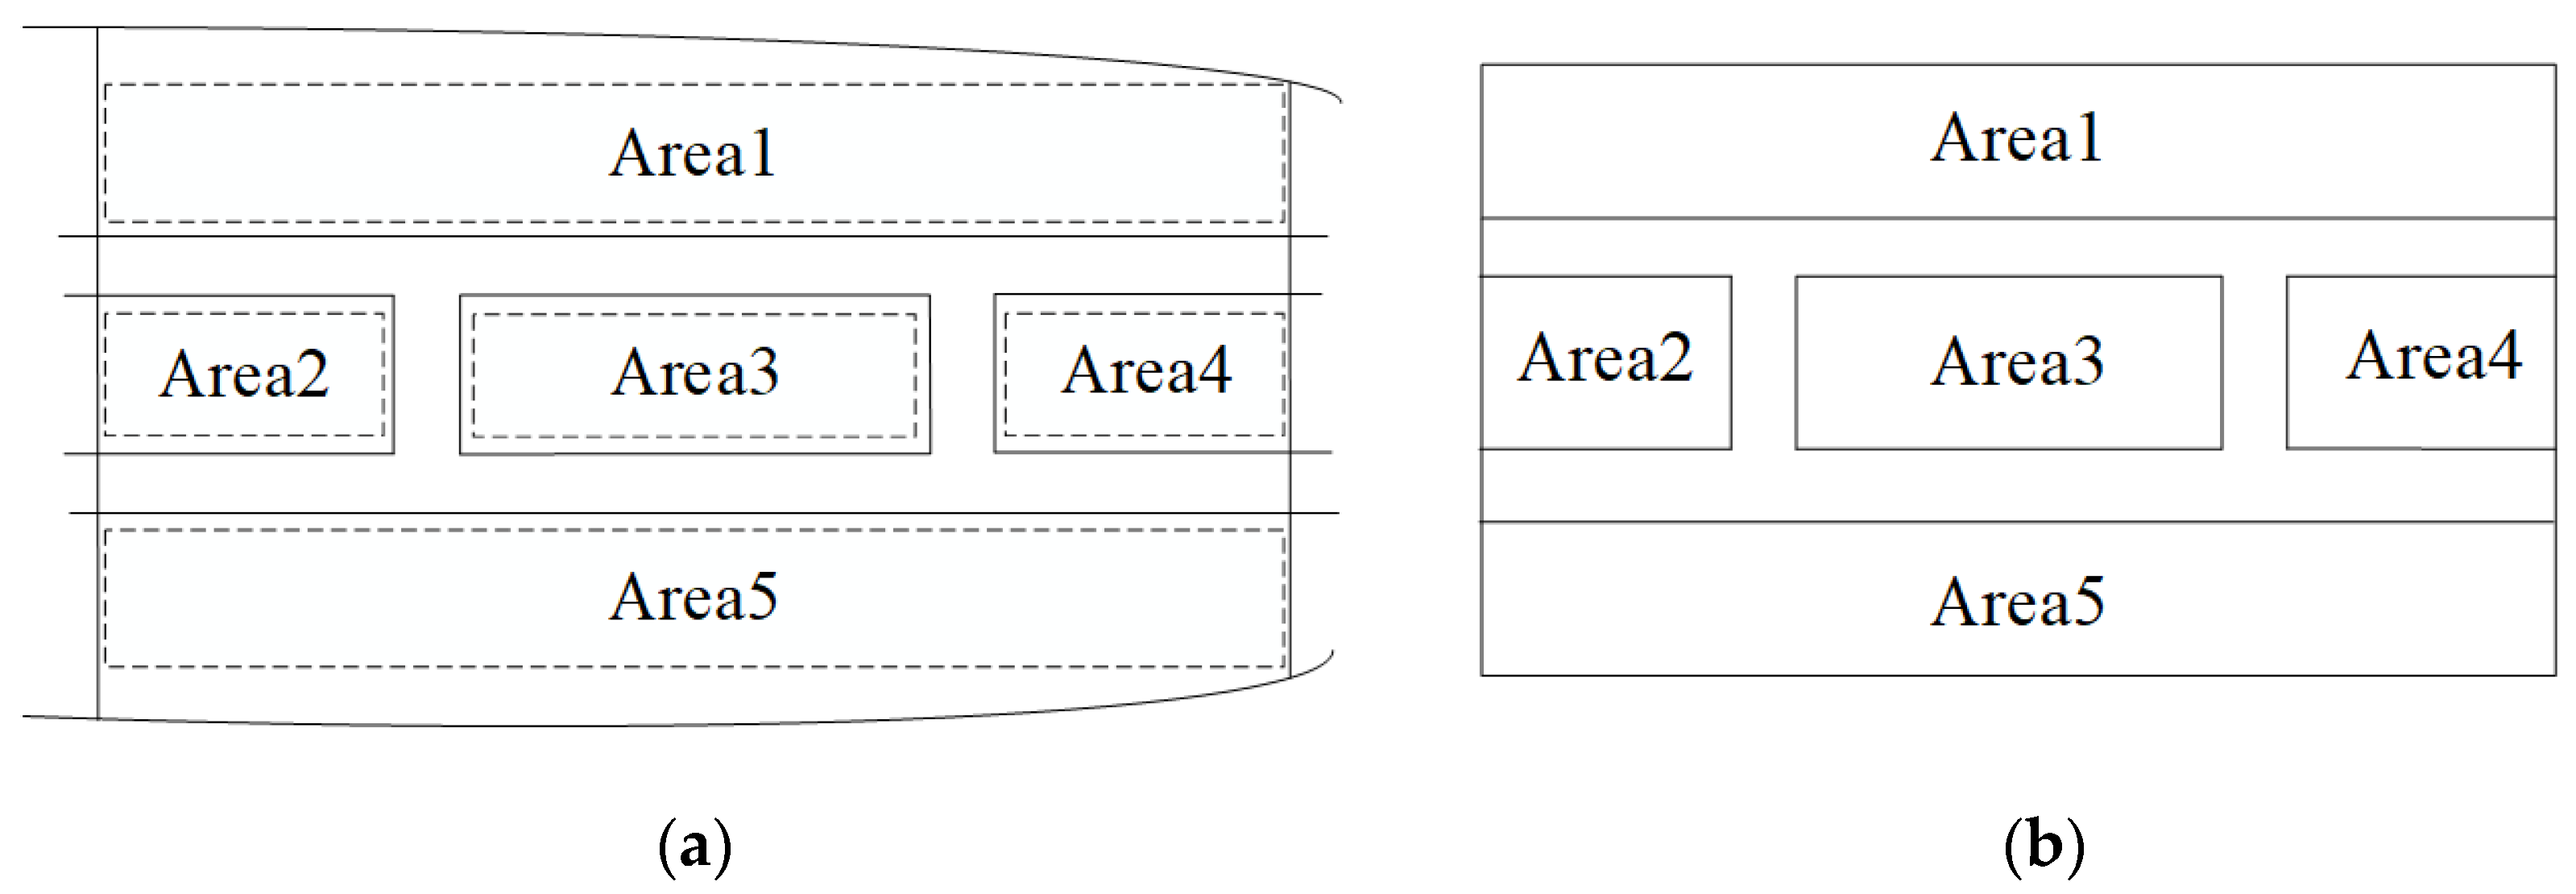
Simplified Layout Model

The tasks of the four states studied in this topic include the circulation of personnel and materials. The personnel flow in the ship’s living quarters is frequent. It has the advantages of a regular structure and small layout area in proportion to the whole ship area. At the same time, for the universality of layout optimization research, no specific ship type is selected. A simplified cabin layout model [11] is established based on the hypothetical cruise living area cabin.
The principle of layout simplification is to draw a rectangle based on the shortest and longest sides of the cabin area’s structure. Five areas were simplified into rectangles, and their layout positions remained unchanged. The simplified model of the cabin layout is shown in Figure 1.
In Figure 1a, the solid line represents the structure of the cabin areas in the living area. The dashed enclosed area represents the area to be optimized. In Figure 1b, the solid line represents the simplified cabin area structure.

2.3. Deterministic Optimization Model

The cabin sequence was used as a design variable. The sub-objective evaluation functions were constructed from the perspective of adjacent and circulating relationships between the cabins. The overall objective evaluation function is composed of linear weighting of sub-objective evaluation functions.
The sequence of the cabins is composed of the serial numbers of cabins in an array according to the sequence of the layout positions of the cabins. The cabin sequence X is expressed as
X = { x 1 , x 2 , x 3 , , x n }
and
{ x k = { x | x N * , 1 x n } , ( k = 1 , 2 , , n ) x i x j , ( i , j = 1 , 2 , , n , i j )
where n represents the total number of cabins to be deployed, and x k represents the serial numbers of the cabins corresponding to the location.
The shortest distance between cabin i and cabin j can be abstracted as the distance from point x i to point x j . There are two paths a and b between point x i and point x j , with different distances. The distance between cabins has a direct impact on the efficiency of human flow and logistics. In order to unify the calculation standard, the shortest distance is used to represent the distance between cabins in the subsequent mathematical model. The stairway node is a connection node of the two decks. And Dijkstra’s algorithm has the advantage of low complexity [12,13]. The shortest distance obtained by Dijkstra’s algorithm is stored in matrix D .
D = [ d i j ] n × n , ( i , j = 1 , 2 , , n , i j )
where d i j represents the shortest distance between cabin i and cabin j .
Adjacent strength is a parameterized expression of the degree of adjacent requirements based on the functional and usage requirements between two cabins to be arranged. The adjacent strength after numerical quantization is stored in the adjacent strength coefficient matrix B .
B = [ b i j ] n × n , ( i , j = 1 , 2 , , n , i j )
where b i j represents the value of the adjacent strength coefficient between cabins i and j .
The adjacent strength sub-objective function F 1 X is established.
F 1 ( X ) = i = 1 n 1 j = i + 1 n B × D ( X )
where D X represents the shortest distance matrix between cabins.
Circulating strength mainly considers the strength of the circulating relationship between the crew in the cabin during the daily activities of the crew on the ship. The circulating strength after numerical quantization is stored in the circulating strength coefficient matrix F .
F = [ f i j ] n × n , ( i , j = 1 , 2 , , n , i j )
where f i j represents the value of the circulating strength coefficient between cabins i and j .
The circulating strength sub-objective function F 2 X is established as follows.
F 2 ( X ) = i = 1 n 1 j = i + 1 n F × D ( X )
The location constraint refers to the requirement that the cabin to be arranged is suitable for a specific position. It should be determined based on the layout of the mother ship and combined with layout standards. For example, cabin 5 and cabin 17 are suitable to be arranged in the middle of the upper deck. Cabin 9, cabin 21, and cabin 52 are suitable to be arranged on the lower deck, etc.
{ { x 5 , x 17 } { 1 } { x 9 , x 21 , x 52 } { 2 }
where 1, 2 represent the upper and lower decks.
The available area constraint means that the cabin sequence X is sequentially arranged in the cabin area. The minimum area of the cabin arranged in each row is required to be no more than the usable area of the row:
{ α ( x 1 ) + α ( x 2 ) + α ( x 3 ) S 1 α ( x 4 ) + α ( x 5 ) + α ( x 6 ) + α ( x 7 ) S 2 α ( x n 2 ) + α ( x n 1 ) + α ( x n ) S m
where m represents the maximum number of rows divided by the longitudinal channel. α x j represents the minimum areas’ reference of the cabin corresponding to the location. S i ,   i = 1 ,   2 , m represents the available area of each row.
For the cabin sequence X that meets the available area constraints, each row may have a remaining area, which is equally distributed to each cabin. The revised cabin area is used to determine layout parameters corresponding to cabin sequence X .
{ β ( x 1 ) + β ( x 2 ) + β ( x 3 ) = S 1 β ( x 4 ) + β ( x 5 ) + β ( x 6 ) + β ( x 7 ) = S 2 β ( x n 2 ) + β ( x n 1 ) + β ( x n ) = S m
where β x j represents the area of the cabin after correction.
The overall objective function F ( X ) of cabin layout design optimization contains two sub-objective functions. In view of the uncertain importance of sub-objective functions, this research adopts linear weighting processing. The overall objective function F X can then be expressed.
min F ( X ) = min ( w 1 F 1 ( X ) + w 2 F 2 ( X ) ) = min i = 1 n 1 j = i + 1 n ( w 1 × b i j × d i j + w 2 × f i j × d i j )
and
h = 1 2 w h = 1 , X = { x 1 , x 2 , x 3 , , x n }
Many scholars have studied the deterministic optimization of cabin layout. Therefore, the calculation results of the deterministic optimization platform built above are not repeated. The following will focus on the uncertainty factors in the model.

3. Uncertainty Parameters Analysis and Model Construction

3.1. Composition of Uncertainty Parameters

Although the calculation results of deterministic optimization are usually ideal, a variety of task states exist alternately during actual navigation. It will be difficult to meet the needs of actual navigation by designing the layout scheme in a mathematical model. Considering the uncertainty factors in the model design can avoid the above risks to a certain extent. Based on the probabilistic and non-probabilistic reliability analysis theories, the random uncertainty was represented by random variables, and the cognitive uncertainty was represented by interval variables. The obtained adjacent and circulating strength matrix is described below.
B = { B ( 1 ) , B ( 2 ) } = { b i j ( 1 ) , b p q ( 2 ) }
and
F = { F ( 1 ) , F ( 2 ) } = { f i j ( 1 ) , f p q ( 2 ) } { i , j , p , q = 1 , 2 , , n , i j , p q i = j , p q p = q , i j
where B 1 represents the random variables matrix in the adjacent strength coefficient, B 2 represents the interval variables matrix. b i j 1 represents the random variables value between cabin i and cabin j in the adjacent strength coefficient, b p q 2 represents the interval variables value between cabin p and cabin q . F 1 represents the random variables matrix in the circulating strength coefficient, and F 2 represents the interval variables matrix. f i j 1 represents the random variables value between cabin i and cabin j in the circulating strength coefficient, and f p q 2 represents the interval variables value between cabin p and cabin q .

3.2. Random Variables

The random variables studied in this paper were mainly composed of adjacent and circulating strength coefficients under single-task states. The random variables were represented by random numbers without knowing their specific distribution. Given the need to introduce the Pauta criterion in the subsequent calculation, the criterion was suitable for data obeying normal distribution or approximate normal distribution. Random variables must be processed using equivalent normalization. To reduce the calculation process, random variables of adjacent and circulating strength are assumed to obey normal distribution.
b i j ( 1 ) N ( μ b i j ( 1 ) , σ b i j ( 1 ) )
f i j ( 1 ) N ( μ f i j ( 1 ) , σ f i j ( 1 ) )
where μ b i j 1 ,   μ f i j 1 are means of random variables obeying normal distribution, and σ b i j 1 ,   σ f i j 1 are standard deviations.
Random variables in uncertainty parameters are expressed as follows:
Y = { B ( 1 ) , F ( 1 ) } = { b i j ( 1 ) , f i j ( 1 ) }

3.3. Interval Variables

Interval variables are mainly composed of different adjacent and circulating strength coefficients in multitasking states. Interval variables are expressed by interval numbers. The interval endpoint is determined according to different state weights and expert opinions. The interval number expression can be described as follows:
b p q ( 2 ) = [ A b p q ( 2 ) l , A b p q ( 2 ) r ]
f p q ( 2 ) = [ A f p q ( 2 ) l , A f p q ( 2 ) r ]
where A b p q 2 l , A b p q 2 r represent the upper and lower limits of the interval number of the adjacent strength coefficient. A f p q 2 l , A f p q 2 r represent the upper and lower limits of the interval number of the circulating strength coefficient. A b p q 2 l , A b p q 2 r R , and A b p q 2 l A b p q 2 r ; when A b p q 2 l = A b p q 2 r , b p q 2 is a real number. The interval number of the circulating strength coefficient also meets the above conditions, and is not repeated here.
According to interval mathematics theory, the probability that interval variables are endowed with a value in a given interval range is the same. It can be understood that interval variables satisfy uniform distribution. Therefore, interval variables of adjacent and circulating strengths satisfy uniform distribution.
b p q ( 2 ) U ( A b p q ( 2 ) l , A b p q ( 2 ) r )
f p q ( 2 ) U ( A f p q ( 2 ) l , A f p q ( 2 ) r )
Interval variables in uncertainty parameters are expressed as
Z = { B ( 2 ) , F ( 2 ) } = { b p q ( 2 ) , f p q ( 2 ) }

3.4. Random-Interval Hybrid Uncertainty Model

The uncertainty parameters studied in this paper were composed of random variables and interval variables. For this structure, the random-interval hybrid uncertainty model was used to solve both random variables and interval variables. The functional function of the model can be expressed as follows:
M = f ( Y , Z ) = f ( y 1 , y 2 , , y n , z 1 , z 2 , , z n )
where Y = y 1 , y 2 , , y n represents random variables, and Z = z 1 , z 2 , , z n represents interval variables.
The functional function takes random variable Y and interval variable Z as the design variables. The function constraint was represented by constraints of deterministic optimization in Section 3.3. The objective function was represented by Formula (23).
M =   f ( Y , Z ) = w y × Y × D ( Y ) + w z × Z × D ( Z )   =   w y i = 1 n 1 j = i + 1 n ( b i j ( 1 ) + f i j ( 1 ) ) × d i j + w z p = 1 n 1 q = p + 1 n ( b p q ( 2 ) + f p q ( 2 ) ) × d p q
where w y is the weight of the random variable, and w z is the weight of the interval variable, which is determined by the actual input value and expert opinions.

3.5. Model Solving Methods

The functional function included two possible methods to solve the random-interval hybrid uncertainty model. When conducting robustness analysis based on probability reliability theory, the hybrid uncertainty parameters were processed via interval randomization. When conducting robustness analysis based on non-probabilistic reliability theory, the hybrid uncertainty parameters were processed via random intervalization.

3.5.1. Random Intervalization Process

Random intervalization is the equivalent treatment of random variables to obtain interval variables. Interval variables were brought into the functional function to solve the probability distribution. Most scholars establish the functional function after equivalent treatment. Based on non-probabilistic reliability theory, the performance index was solved using the mean and deviation corresponding to the function. Model performance was evaluated according to the value of the performance index [14]. This method had poor applicability in the cabin layout problem.
According to the Pauta criterion, when random variables obey normal distribution x ~ N μ , σ , the probability of variable x falling in the range of μ 3 σ ~ μ + 3 σ is 99.7%. The values outside this range are considered gross errors and should be eliminated. Thus, we can regard random variable x as the interval variable of μ 3 σ , μ + 3 σ .
The interval variable Y is obtained after random intervalization of random variable Y .
Y = { B ( 1 ) , F ( 1 ) } = { b i j ( 1 ) , f i j ( 1 ) }
and
{ b i j ( 1 ) U ( μ b i j ( 1 ) 3 σ b i j ( 1 ) , μ b i j ( 1 ) + 3 σ b i j ( 1 ) ) f i j ( 1 ) U ( μ f i j ( 1 ) 3 σ f i j ( 1 ) , μ f i j ( 1 ) + 3 σ f i j ( 1 ) )
where B 1 , F 1 represent the interval variables matrix of adjacent and circulating strength coefficients obtained after random intervalization. b i j 1 , f i j 1 represent the interval variable values of adjacent and circulating strength coefficients obtained after random intervalization.

3.5.2. Interval Randomization Process

Interval randomization is the equivalent treatment of interval variables to obtain random variables. Most scholars use the mean primary second-moment method to deal with the functional function. The function was expanded by the Taylor series at the mean point to solve the equivalent random variables [15].
Based on the random intervalization process in Section 3.2, the inverse application of the Pauta criterion was carried out to obtain the random variables. The interval variables obeyed uniform distribution y ~ U a , b . According to the endpoint values a , b , the mean value a + b / 2 of uniform distribution was calculated. According to the Pauta criterion, it is assumed that the mean of the equivalent random variable is consistent with the mean of the interval variable before the equivalent treatment. According to the interval endpoint values of the interval variables, the standard deviation ( b a ) / 6 of the random variables was calculated. The random variables after interval randomization followed normal distribution x ~ N a + b / 2 , ( b a ) / 6 .
The random variable Z’ is obtained after the interval randomization of interval variable Z.
Z = { B ( 2 ) , F ( 2 ) } = { b p q ( 2 ) , f p q ( 2 ) }
and
{ b p q ( 2 ) N ( ( A b p q ( 2 ) l + A b p q ( 2 ) r ) / 2 , ( A b p q ( 2 ) r A b p q ( 2 ) l ) / 6 ) f p q ( 2 ) N ( ( A f p q ( 2 ) l + A f p q ( 2 ) r ) / 2 , ( A f p q ( 2 ) r A f p q ( 2 ) l ) / 6 )
where B 2 , F 2 represent the random variables matrix of adjacent and circulating strength coefficients obtained after interval randomization. b p q 2 , f p q 2 represent the random variable values of adjacent and circulating strength coefficients obtained after interval randomization.

4. Robustness Analysis

4.1. Evaluation Indexes of Robustness Analysis

The uncertainty analysis is mainly composed of reliability analysis and robustness analysis.
(1)
Reliability analysis mainly focuses on the influence of uncertain factors on design constraints. It analyzes the possibility of performance failure under potentially dangerous conditions.
(2)
Robustness analysis mainly focuses on the influence of uncertain factors on the objective function. It reduces the sensitivity of the scheme’s performance to external changes.
This analysis starts with the deterministic optimization platform. The constraints have been fully considered in the optimization process. The uncertainty of the input parameters is mainly concentrated in the adjacent and circulating strength coefficients. The uncertainty value will have a direct impact on the objective function. Therefore, this topic uses the method of robustness analysis to carry out uncertainty analysis.
The random-interval hybrid uncertainty model described in Section 3 is combined with the robustness analysis method to explore the best cabin layout design. It aims to provide readers with new ideas for cabin layout optimization design. The evaluation indexes included kurtosis and the expansion degree of probability distribution of the functional function. The main principle in assessing robustness is that the more concentrated the value near the mean value, the less potential performance loss there will be related to the distribution tail and the higher the robustness. The evaluation principles are shown in Figure 2.
Here, the transverse axis represents the different values of the objective function f that need to be minimized, and the longitudinal axis represents the frequency density of f at different values.
In Figure 2a, the evaluation index of kurtosis is represented by the peak. The peak p 2 of the f 2 curve at the mean μ was less than the peak p 1 of the f 1 curve at the mean. The f 2 scheme had higher robustness than the f 1 scheme. In Figure 2b, the evaluation index of the expansion degree is the distribution range based on the Pauta criterion. The distribution range of the f 2 curve was obviously smaller than that of the f 1 curve. The robustness of the f 2 scheme was thus better.

4.2. Calculation Cases

Based on the cabin layout optimization model built in Section 2, for artificially quantified parameters, such as adjacent strength coefficient and circulating strength coefficient, four cases of uncertainty parameters were set, respectively. The hybrid uncertainty in the input parameters was processed using random intervalization. The interval variable group of the uncertainty parameters composed of interval variables was obtained. The hybrid uncertainty in the input parameters was processed via interval randomization. The random variable group was obtained. The random and interval variable group was composed of unprocessed random variables and interval variables, and it was regarded as the control group. The three groups of variables were set up as three cases. The cases were taken into the functional function of the random-interval hybrid uncertainty model for calculation.

4.2.1. Input Parameters

Based on the actual frequency of task state during navigation and the arrangement relationship between various types of cabins, the initial values of the weight and strength coefficients are randomly generated for cabin groups, distribution characteristics, and other parameters of the input random variables (Table 2).
Table 5 shows the cabin groups and distribution characteristics of the random variables obtained via group interval randomization.

4.2.2. Comparative Calculation Method

The probability distribution of the functional function was calculated using the method of mean value (MMV) and the Monte Carlo sampling (MCS) method. In the three cases, using the two methods to calculate the functional function of the robustness, the analysis curve results were almost the same, with only a small gap present (Figure 3). MMV performed fewer calculations and had higher calculation efficiency. In this paper, MMV was selected for subsequent calculation.

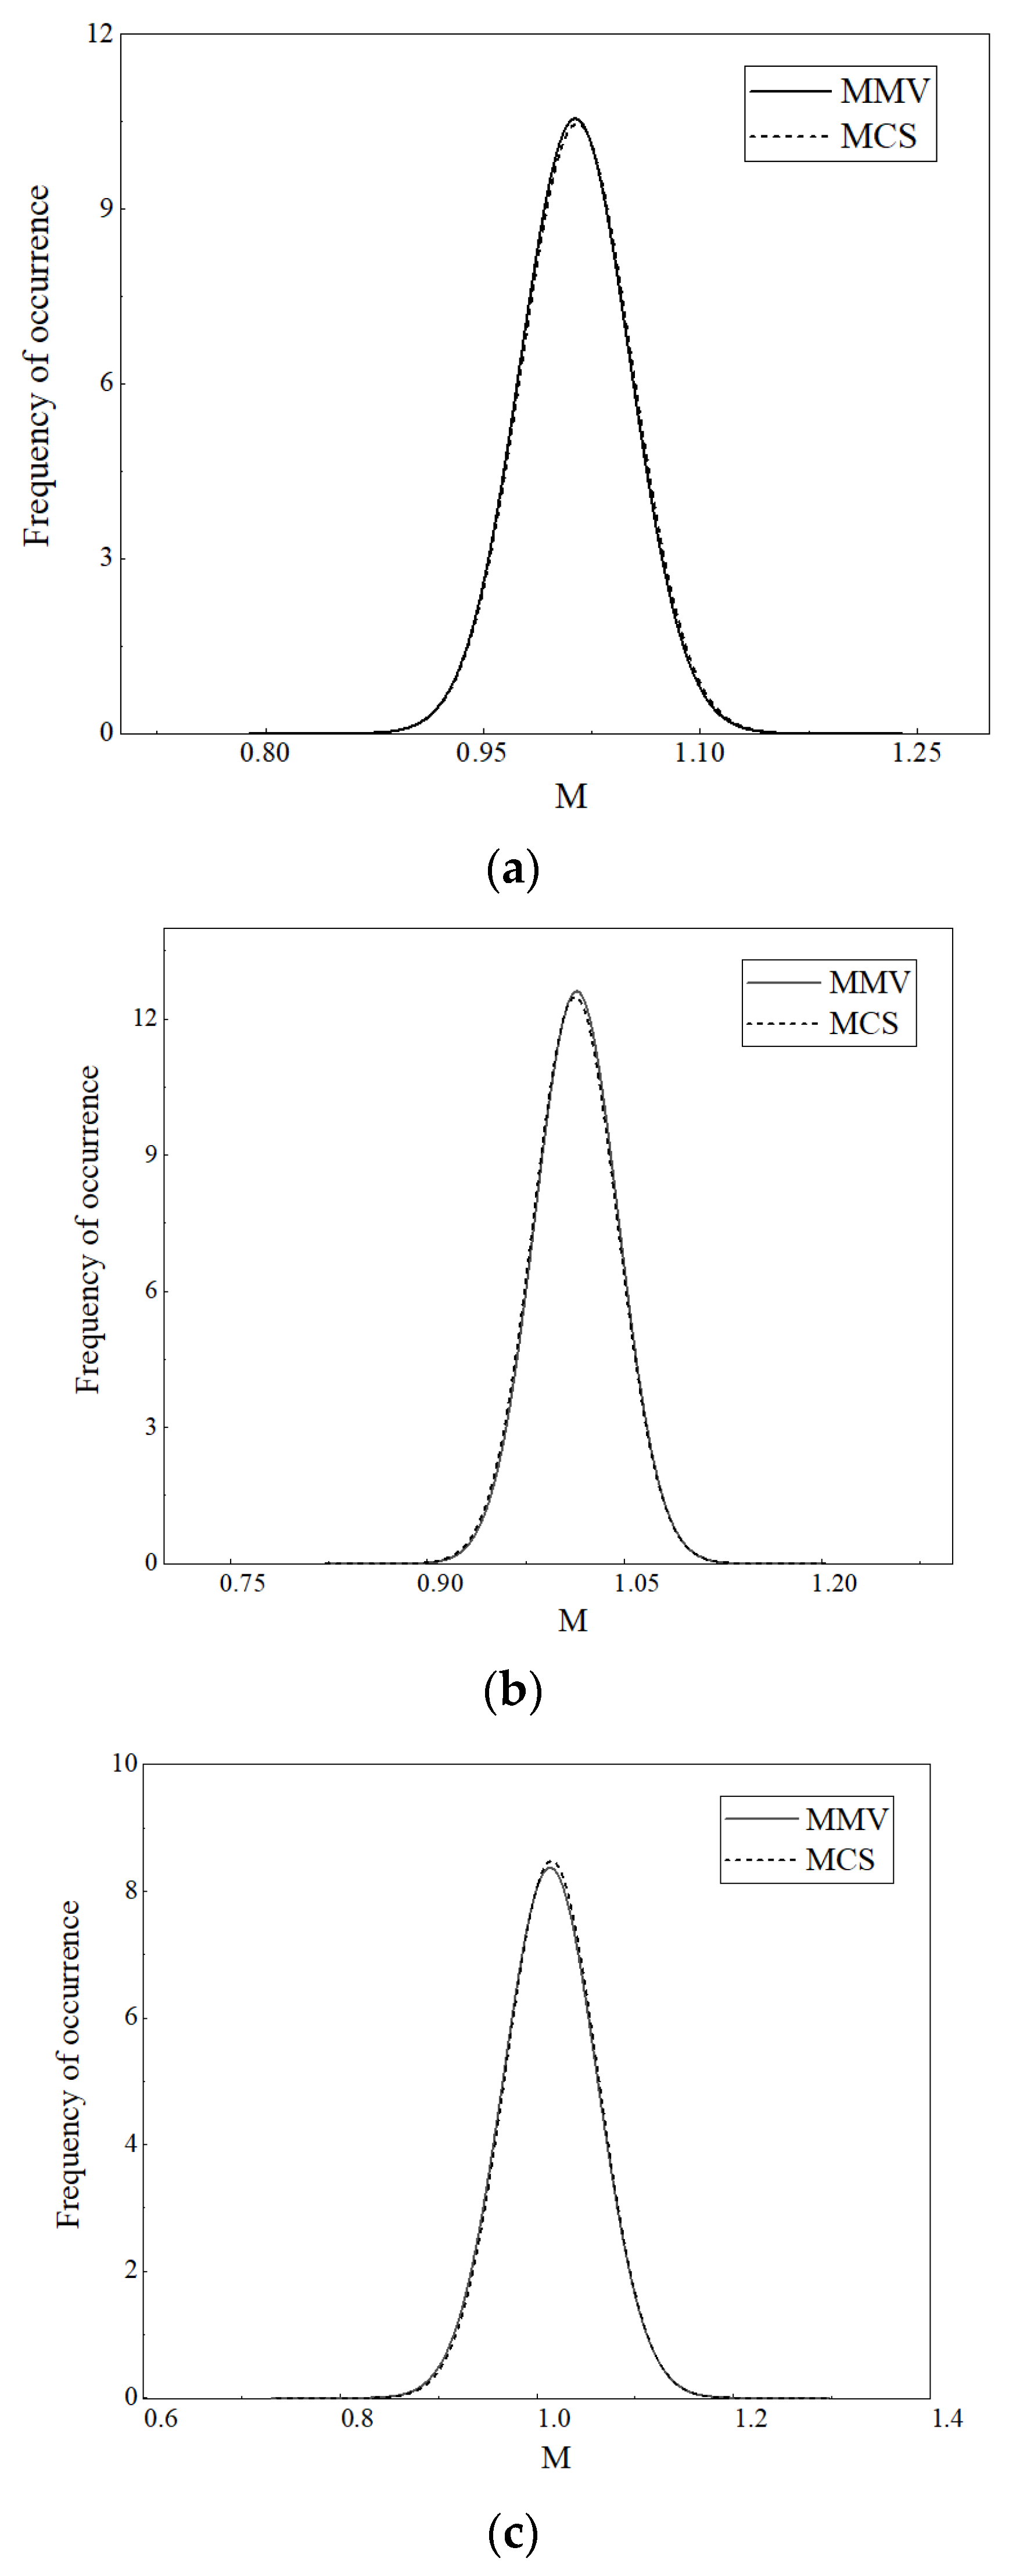
4.2.3. Comparative Calculation Results

Three cases were substituted into the functional function of the random-interval hybrid uncertainty model, and the mathematical characteristics of the probability distribution were obtained using the mean method (Table 6).
After calculation for the three cases, the mean values were equal, and the standard deviation differences were small. The standard deviation of C2# was minimal. The standard deviation of C1# was larger than C2 #. The standard deviation of C3# was the largest. From a numerical point of view, the discrete degree of the probability distribution of the three cases was small and the numerical value was concentrated. The possibility of deviation from the mean value of the calculation results was also low, and the ability to resist the uncertainty of external input was strong. These three cases all had high robustness, with C2# being the most robust.

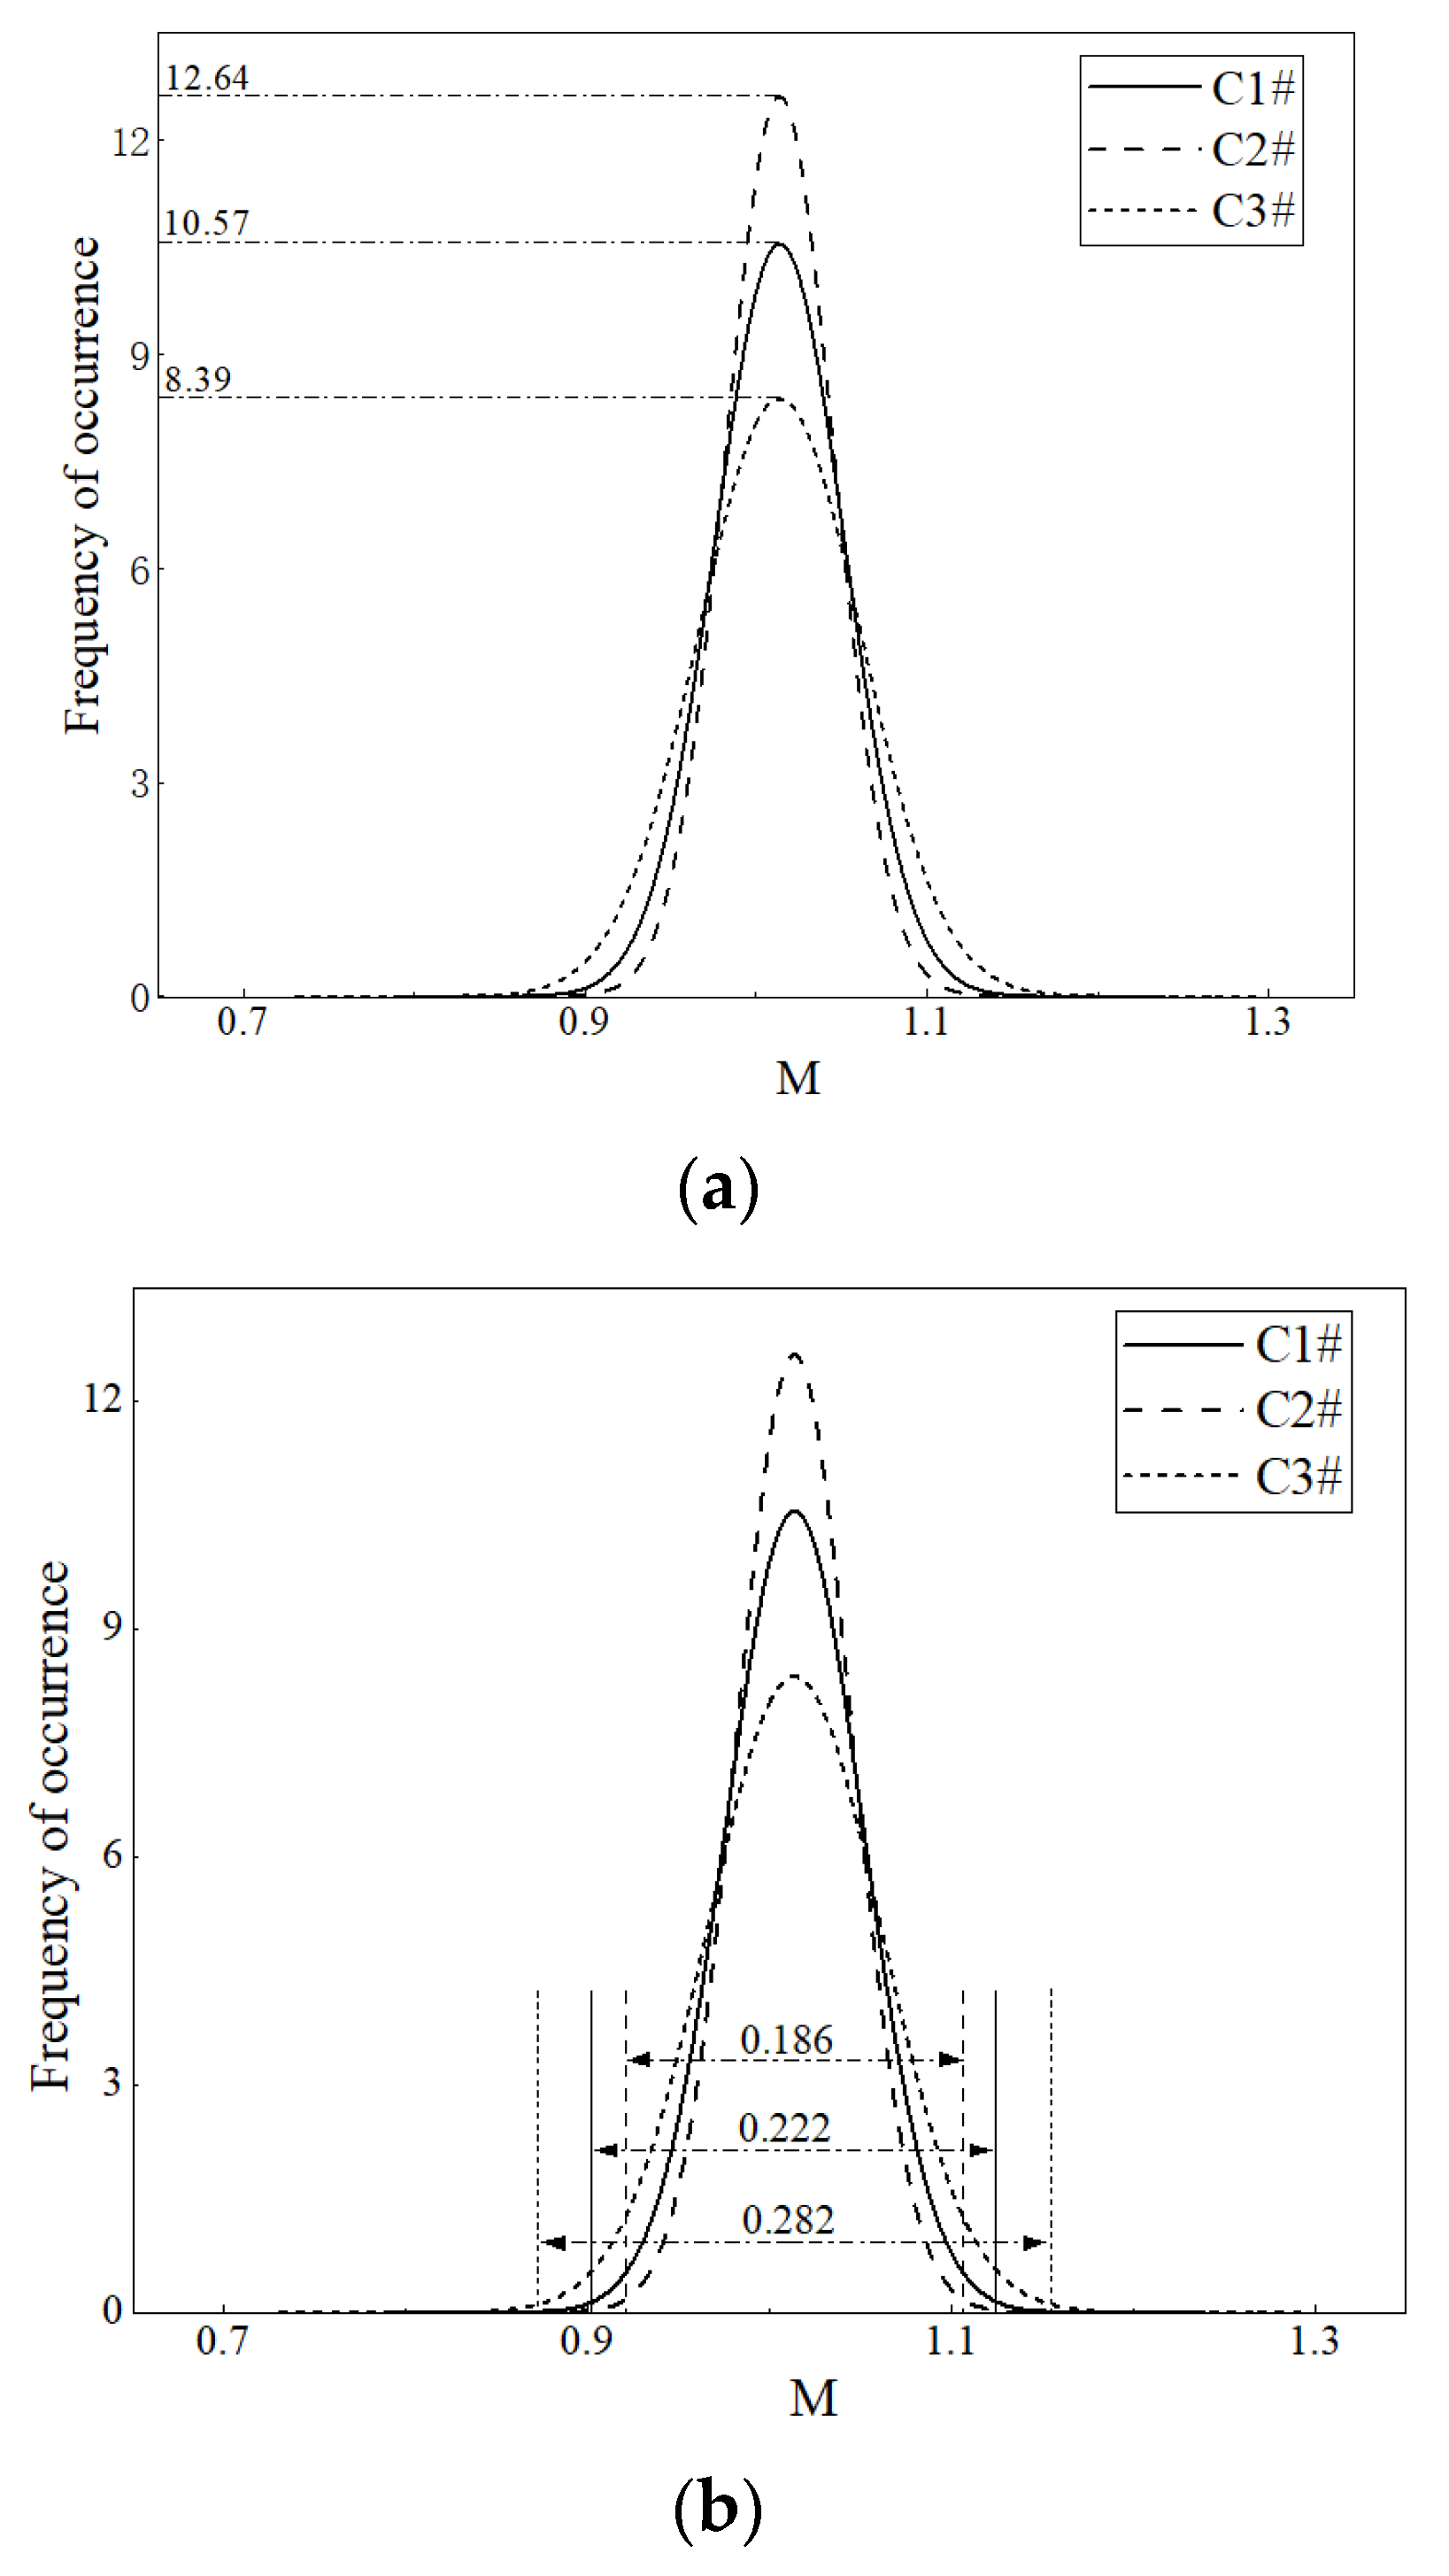
4.2.4. Comparative Evaluation Indexes of Robustness Analysis

After calculation, the evaluation indexes of kurtosis and the expansion degree of the three cases were compared (Figure 4).
In Figure 4a, the peak value of C2# is 12.64, which was the highest value in the three cases. The kurtosis of C2# was also the largest. The numerical value of the functional function was more concentrated near the mean value, and the possibility of deviation from the mean value was the lowest. The insensitivity to parameter perturbation was the highest. In Figure 4b, the distribution range of C2# is 0.186, which was the lowest in the three cases. The tail-related potential performance loss of the function probability distribution was the lowest. The ability to resist the uncertainty of external input was strongest.
In the face of uncertainty in terms of input parameters, C2#, the random variable group, could better ensure the robustness of the cabin layout scheme compared to the other two groups of uncertainty parameters. Its resistance to the impact of input uncertainty was the highest. When the input value fluctuated, its ability to output results to maintain stability was better. The uncertainty parameters composed of interval variables were able to maximize the robustness of the cabin layout scheme.
Therefore, when considering the uncertainty factors of the cabin layout optimization design, the artificial quantification parameters represented by random variables can ensure the robustness of the cabin layout scheme to the greatest extent, reducing the risk of the cabin layout scheme deviating from the actual use.

5. Conclusions

This paper focuses on the cabin layout design problem for multitasking states. Based on the deterministic optimization platform, the random-interval hybrid uncertainty model was used to establish the functional function. The robustness of the input parameters of the adjacent and circulating strength coefficients was analyzed and the following conclusions were obtained:
(1)
In the cabin layout design problem, the influence of uncertainty factors is considered, and the random-interval hybrid uncertainty model could fully consider the uncertainty of input parameters. In addition, it was able to ensure the robustness of the cabin layout scheme. The model dealt with parameters from two areas: probabilistic reliability theory and non-probabilistic reliability theory. It not only overcame the defect that the probability model was too dependent on the sample data, but it also reduced the blind conservatism of the non-probability model. It is of practical significance to apply this model to the layout design of ship cabins.
(2)
From the results of the robustness analysis, the robustness of the random variable group is the highest among the four cases of uncertain parameter schemes. Therefore, using random variables to describe artificially quantified parameters in the cabin layout optimization model can ensure the robustness of the optimization scheme to a greater extent. And it reduces the risk of uncertainty factors in the cabin layout design for multitasking states and better guarantees the efficiency of personnel and cargo circulation.
(3)
Compared with previous research by scholars, this paper expands the scope of cabin layout optimization from the single-task state to the multitasking state. And the uncertainty analysis of cabin layout optimization design is carried out. The advantages and disadvantages of different variables are explored. However, the variables are not designed in the optimization model. An uncertainty optimization platform can be established in the future. By comparing the solutions of the deterministic optimization and uncertainty optimization models, the advantages of uncertainty optimization are explored. At the same time, this paper also provides readers with new ideas. In future work on cabin layout optimization design, random variables can be considered to describe the artificially quantified parameters so as to improve the effectiveness of the cabin layout scheme.

Author Contributions

H.X.: conceptualization, methodology, software. Y.H.: data curation, writing—review and editing. H.L. (Haonan Li): formal analysis, methodology. M.B.: funding acquisition, software. H.L. (Haishang Liu): writing—review and editing. All authors have read and agreed to the published version of the manuscript.

Funding

This work is supported by the Open Fund of Key Laboratory of High-Performance Ship Technology (Wuhan University of Technology), Ministry of Education (no. gxnc23052803).

Institutional Review Board Statement

Not applicable.

Informed Consent Statement

Not applicable.

Data Availability Statement

Data are contained within the article.

Conflicts of Interest

The authors declare no conflicts of interest.

References

  1. Benabes, J.; Poirson, E.; Bennis, F. Integrated and interactive method for solving layout optimization problems. Expert Syst. Appl. 2013, 40, 5796–5803. [Google Scholar] [CrossRef]
  2. Kim, K.-S.; Roh, M.-I. A submarine arrangement design program based on the expert system and the multistage optimization. Adv. Eng. Softw. 2016, 98, 97–111. [Google Scholar] [CrossRef]
  3. Bao, M.; Hou, Y.H.; Chen, W.; Wu, T.; Hu, Y.L. Joint optimization of ship cabin channel layout based on genetic algorithm. J. Dalian Marit. Univ. 2021, 47, 23–30. [Google Scholar] [CrossRef]
  4. Dong, Z.C.; Liu, Y.D. Optimization method of ship cabin layout based on reverse learning genetic algorithm. J. Dalian Marit. Univ. 2021, 47, 16–22. [Google Scholar] [CrossRef]
  5. Oberkampf, W.L.; Helton, J.C.; Joslyn, C.A.; Wojtkiewicz, S.F.; Ferson, S. Challenge problems: Uncertainty in system response given uncertain parameters. Reliab. Eng. Syst. Saf. 2004, 85, 11–19. [Google Scholar] [CrossRef]
  6. Wu, X.X. Research on solving strategy of structural reliability index based on probabilistic interval hybrid model. IOP Conf. Ser. Earth Environ. Sci. 2021, 791, 012113. [Google Scholar] [CrossRef]
  7. Hu, N.G.; Duan, B.Y. An efficient robust optimization method with random and interval uncertainties. Struct. Multidiscip. Optim. 2018, 58, 229–243. [Google Scholar] [CrossRef]
  8. Jiang, C.; Zheng, J.; Ni, B.Y.; Han, X. A probabilistic and interval hybrid reliability analysis method for structures with correlated uncertain parameters. Int. J. Comput. Methods 2015, 12, 1540006. [Google Scholar] [CrossRef]
  9. Baril, C.; Yacout, S.; Clément, B. Design for Six Sigma through collaborative multiobjective optimization. Comput. Ind. Eng. 2010, 60, 43–55. [Google Scholar] [CrossRef]
  10. Koch, P.N.; Yang, R.-J.; Gu, L. Design for six sigma through robust optimization. Struct. Multidiscip. Optim. 2004, 26, 235–248. [Google Scholar] [CrossRef]
  11. Kirtley, N. Fuzzy optimal general arrangements in naval surface ship design. Ship Technol. Res. 2009, 56, 121–141. [Google Scholar] [CrossRef]
  12. Wu, H.F. The shortest path algorithm-Dijkstra and Floyd algorithm. New China Commun. 2019, 21, 32–33. [Google Scholar]
  13. Rahayuda, I.G.S.; Santiari, N.P.L. Dijkstra and bidirectional dijkstra on determining evacuation routes. J. Phys. Conf. Ser. 2021, 1803, 012018. [Google Scholar] [CrossRef]
  14. Hua, L.; Wu, F.; Mou, J.L. Reliability analysis of yield strength of hull structure under random-non-probabilistic model. J. Natl. Univ. Def. Technol. 2018, 40, 177–182. [Google Scholar]
  15. Qiu, Z.P.; Wang, J. The interval estimation of reliability for probabilistic and non-probabilistic hybrid structural system. Eng. Fail. Anal. 2010, 17, 1142–1154. [Google Scholar] [CrossRef]
Figure 1. Simplified process of cabin layout. (a) Structural frame of living area cabin. (b) Simplified model of cabin layout.
Jmse 12 00120 g001
Figure 2. Evaluation indexes of robustness analysis. (a) Evaluation index of kurtosis. (b) Evaluation index of expansion degree.
Jmse 12 00120 g002
Figure 3. Robustness analysis curve results of three cases. (a) Robustness analysis curve of random and interval variable group. (b) Robustness analysis curve of random variable group. (c) Robustness analysis curve of interval variable group.
Jmse 12 00120 g003
Figure 4. Comparison of evaluation indexes for robustness analysis of cases. (a) Comparison of kurtosis evaluation indexes. (b) Comparison of evaluation indexes of expansion degree.
Jmse 12 00120 g004
Table 1. Multitasking states and main tasks.
Task StatesMain Tasks
The damage state of fixtures and machinesRepair and replace damaged instruments or equipment
The escape state during dangerEnsure the smooth evacuation of all personnel to the upper deck
The maintenance and support stateAuxiliary ship repair and maintenance work
The daily navigation stateEnsure the normal operation of ship equipment and the normal development of crew work during sea navigation.
Table 2. Parameters of random variables.
Cabin GroupsMean ValueStandard DeviationCoefficient of Variation
The coefficient of adjacent strength(1, 7)0.40.057The mean value of variation coefficient of interval variables 0.1425
(9, 15)0.60.0855
(17, 27)0.30.0428
(33, 46)10.1425
(77, 78)0.50.0713
The coefficient of circulating strength(1, 4)0.60.0855The mean value of variation coefficient of interval variables 0.1425
(13, 31)10.1425
(27, 67)0.50.0713
(70, 80)0.40.057
(72, 73)0.20.0285
Cabin groups, distribution characteristics, and other parameters of the input interval variables (Table 3).
Table 3. Parameters of interval variables.
Cabin GroupsEndpoint ValuesCoefficient of Variation
The coefficient of adjacent strength(2, 11)(0.427, 0.727)0.1501
(35, 39)(0.29, 0.49)0.148
(56, 60)(0.414, 0.514)0.062
(66, 79)(0.555, 1)0.165
The coefficient of circulating strength(9, 10)(0.683, 0.783)0.039
(41, 46)(0.48, 0.98)0.1977
(44, 55)(0.39, 0.59)0.1178
(50, 60)(0.366, 0.966)0.260
Cabin groups and distribution characteristics of the interval variable group obtained via random intervalization (Table 4).
Table 4. Interval variable parameters after random internalization.
Cabin GroupsEndpoint ValuesCoefficient of Variation
The coefficient of adjacent strength (1, 7)(0.229, 0.571)0.2468
(9, 15)(0.344, 0.857)0.2468
(17, 27)(0.172, 0.428)0.2468
(33, 46)(0.999, 1.000)0.0001
(77, 78)(0.286, 0.714)0.2468
The coefficient of circulating strength (1, 4)(0.344, 0.857)0.2468
(13, 31)(0.999, 1.000)0.0001
(27, 67)(0.286, 0.714)0.2468
(70, 80)(0.229, 0.571)0.2468
(72, 73)(0.115, 0.286)0.2468
Table 5. Random variable parameters after interval randomization.
Cabin GroupsMean ValueStandard DeviationCoefficient of Variation
The coefficient of adjacent strength(2, 11)0.5770.0050.0867
(35, 39)0.390.03330.0854
(56, 60)0.4640.01670.0359
(66, 79)0.77750.07330.0943
The coefficient of circulating strength(9, 10)0.7330.01670.0227
(41, 46)0.730.08330.1142
(44, 55)0.03330.03330.068
(50, 60)0.6660.10.1502
Table 6. Calculation results of three cases.
CaseInput ParametersMean ValueStandard Deviation
C1# ( Y ,   Z ) 1.0140.037
C2# ( Y ,   Z ) 1.0140.031
C3# ( Y ,   Z ) 1.0140.047
Here, C1# is the random and interval variable group, C2# is the random variable group, C3# is the interval variable group.
Disclaimer/Publisher’s Note: The statements, opinions and data contained in all publications are solely those of the individual author(s) and contributor(s) and not of MDPI and/or the editor(s). MDPI and/or the editor(s) disclaim responsibility for any injury to people or property resulting from any ideas, methods, instructions or products referred to in the content.

