Article

Towards the Early Detection of Gymnodinium catenatum Algal Blooms in the Northern Gulf of California

by
Gabriela Reséndiz-Colorado
1,
Ernesto García-Mendoza
1,*,
Antonio Almazán-Becerril
2,
Jennifer Medina-Elizalde
3,
Jushiro A. Cepeda-Morales
4 and
Juan P. Rivera-Caicedo
5
1
Departamento Oceanografía Biológica, Centro de Investigación Científica y de Educación Superior de Ensenada, Baja California, Carretera Ensenada—Tijuana No. 3918, Zona Playitas, Ensenada C.P. 22860, Baja California, Mexico
2
Centro de Investigación Científica de Yucatán, Unidad de Ciencias del Agua, Calle 8, No. 39, Mz. 29, S.M. 64, Cancún C.P. 77500, Quintana Roo, Mexico
3
Laboratorio FICOTOX, Centro de Investigación Científica y de Educación Superior de Ensenada, Baja California, Carretera Ensenada—Tijuana No. 3918, Zona Playitas, Ensenada C.P. 22860, Baja California, Mexico
4
Unidad Especializada en Percepción Remota Satelital de Ecosistemas Continentales y Oceánicos (PERSEO), Centro Nayarita de Innovación y Transferencia de Tecnología, Universidad Autónoma de Nayarit, Calle 3 S/N, Tepic C.P. 63173, Nayarit, Mexico
5
CONACYT-UAN, Secretary of Research and Postgraduate, Autonomous University of Nayarit, Tepic C.P. 63155, Nayarit, Mexico
*
Author to whom correspondence should be addressed.
J. Mar. Sci. Eng. 2023, 11(9), 1793; https://doi.org/10.3390/jmse11091793
Submission received: 16 August 2023 / Revised: 6 September 2023 / Accepted: 7 September 2023 / Published: 14 September 2023
(This article belongs to the Special Issue Advanced Research in Harmful Algal Blooms and Eutrophication)

Abstract

:
The annual occurrence of harmful algal blooms (HABs) of the dinoflagellate Gymnodinium catenatum in the northern Gulf of California (NGC) during winter and spring has negative ecological, economic, and social impacts on the local coastal population. G. catenatum produces paralytic shellfish toxins, and a robust monitoring program of the species is necessary to sustain mitigation actions against their detrimental effects. Here, we applied the maximum-likelihood classification (MLC) method to classify satellite images from MODIS and Sentinel-3 to evaluate their effectiveness to detect G. catenatum. Different classes associated with the presence of the species were developed from data of two HABs that occurred in 2015 and 2017. Two classes derived from Sentinel-3 data from the 2017 HAB allowed the detection of this species. These Sentinel-3 classes adequately represented the temporal and geographical distribution of G. catenatum in the region and the no-bloom condition during the summer. The concordance between the detection of the Sentinel-3 classes on the west coast of the NGC and the recorded presence of G. catenatum (75% of concordance) in the area indicates that the MLC method could be applied for early detection of the species in the NGC, using Sentinel-3 full resolution images.

1. Introduction

Harmful algal blooms (HABs) are natural phenomena occurring with increasing frequency and magnitude in numerous coastal zones and continental water bodies [1]. The noxious character of HABs is associated with hypoxia or anoxia events, degradation of water quality, presence of toxic substances in the environment, and mechanical damage caused by some phytoplankton species to other marine species [1,2]. Consequently, HABs affect public health [3], cause economic losses due to their negative effect on coastal activities, and have important ecological impacts associated with mass mortalities of wild organisms [1,4].
Recurrent HABs of the paralytic shellfish toxin (PST)-producer dinoflagellate G. catenatum have been documented since 2015 in the northern Gulf of California (NGC) [5]. The consumption of shellfish contaminated with PSTs (saxitoxin and its analogs) causes paralytic shellfish poisoning in humans (PSP). This is one of the most important toxic syndromes associated with HABs in Mexico. Thirty-seven persons intoxicated and four deaths associated with PSTs produced by G. catenatum have been officially recognized between 1979 and 2015 [6]. G. catenatum HABs in the NGC have been associated with human poisoning, massive mortality of birds and marine mammals, and with negative socioeconomic impacts due to the prohibition of the extraction and consumption of bivalve mollusks [6,7,8,9]. Therefore, it is necessary to establish an early warning system (EWS) to mitigate the negative effects of G. catenatum HABs in the NGC.
EWSs are based on a robust monitoring program of potentially noxious microalgae species. Also, remote sensing using different available satellite products has been incorporated into EWSs for monitoring and identifying HABs.
The most used satellite product is the analysis of the distribution of chlorophyll-a concentration (Chla) estimated from ocean color images [10]. The evaluation of Chla concentration using satellite data has been used principally to identify processes that control primary production in different oceanic regions. However, Chla satellite-derived concentration does not give information about the species responsible for the phytoplankton biomass accumulation [11,12]. For risk evaluation, it is essential to identify the species associated with a HAB. Therefore, different analytical approaches of satellite spectral data have been investigated. It is assumed the specific spectral characteristics will reflect the dominance of a species during a HAB. Amin et al. [13] used the difference in the normalized water-leaving radiance (nLw) between 667 nm and 678 nm (red band difference) to monitor Karenia brevis HABs. Also, these authors developed the K. brevis bloom index, which is the quotient between the red band difference and the sum of the 667 and 678 nm nLw. Other indexes have been developed to identify some harmful species, like the Prorocentrum donghaiense index (PDI) and the diatom index (DI) that were implemented with in situ and remote sensing from the Moderate-Resolution Imaging Spectroradiometer (MODIS) reflectance (Rrs) [14]. The use of indexes allowed differentiating between HABs of the dinoflagellate P. donghaiense and those produced by diatoms in the Yangtze River Estuary [14]. Besides the use of indexes, other approaches for HAB detection and monitoring are based on algorithms to classify the spectral characteristics of satellite images. Cannizzaro et al. [15] developed an algorithm to detect K. brevis HABs using chlorophyll-a and backscattering data. Another example is the optical water type (OWT) classifier used to identify optical water types through satellite images modified by Moore et al. [16] to detect coccolithophore blooms.
There are algorithms and classification techniques for the spectral characteristics of satellite images developed for other fields of application that have been used for monitoring HABs. The forward principal component analysis and minimal spectral distance (MSD) techniques were used to detect Cochlodinium polykrikoides blooms in coastal zones of the Korean Southeast Sea [17]. The multivariate classification of ocean color data from the Sea-viewing Wide Field-of-view Sensor (SeaWiFS) was also used to generate three classifiers for the identification of Karenia mikimotoi, Chattonella spp., and cyanobacteria HABs [18]. Kurekin et al. [19] identified blooms of Phaeocystis globosa in the North Sea and of Karenia mikimotoi in the western English Channel by linear discriminant analysis (LDA).
One method that has not been used to detect HABs is the maximum-likelihood classification (MLC) for the supervised classification of images. MLC determines the probability that a pixel belongs to a specific spectral class among a set of different classes previously generated by a training process. The MLC assigns a pixel to the training derived class with the maximum probability of belonging [20,21]. The MLC method has been used and proved to be effective for the identification of kelp beds in highly turbid waters [22] and for mapping macroalgae communities in Ria Corcubión, located in the northwest region of Spain [23]. Also, it has been applied to characterize the change in land use and mangrove cover [24] and to document temporal variations in the floating vegetation of continental water bodies [25]. The good results obtained with this technique in other ecological studies and its relatively easy application compared to other methods sustain its application in HAB detection. Here, we evaluate the potential application of MLC in the supervised classification of MODIS and Sentinel-3 images to identify G. catenatum as the principal HABs forming species in the northern Gulf of California (NGC).

2. Materials and Methods

2.1. Study Area

The study area was the NGC and the upper Gulf of California (UGC) located north of Isla Ángel de la Guarda (Figure 1, solid black line). The NGC is a basin with depths between 50 m and 500 m. The UGC is the oceanic area located from the 31° N to the Colorado River delta in the north, and it is a shallow area with maximum depths of 30 m [26].
The NGC is a highly productive area and the habitat of endemic species like the Vaquita (Phocoena sinus), the Totoaba (Totoaba macdonaldi), and the Gulf Corvina (Cynoscion othonopterus), the former two being critically endangered species [27,28]. The NGC supports one of the largest fisheries in Mexico with nearly 70 commercial species [28]. Extraction of the geoduck clam (Panopea globosa) is a commercially important fishery activity that contributes to the economy of the region [29].

2.2. In Situ Data

Two G. catenatum HAB datasets were used to establish the training zones. In January 2015, a HAB occurred on the NGC; for this event, water samples collected at surface were obtained on 17 and 18 of January in the coastal area between San Felipe and Punta Estrella (Figure 1). Samples from 22 stations were obtained during this sampling campaign (Figure 1, 2015 sample points). The second data set corresponds to an HAB that occurred in January 2017 that impacted geoduck clam extraction polygons south of San Felipe [5]. Samples from three of these polygons were obtained (Figure 1, extraction areas). The Utermöhl technique [30] was used to identify and enumerate phytoplankton cell abundance. The abundance of G. catenatum (in cells/L) was calculated according to the sedimented volume. The abundance of G. catenatum in surface samples from the 2017 HAB was 311,000 cells/L for polygon 1, representing 96% of the phytoplankton community, 149,200 cells/L for polygon 2, and 95,400 cells/L for polygon 3 [31].
In 2010, the Mexican health authorities (COFEPRIS; Federal Commission for the Protection against Sanitary Risks) established the monitoring of the PSTs in geoduck clams harvested in certified extraction areas of the NGC. PST data were obtained and normalized to the highest toxin concentration per year. Then, the normalized values were plotted with the ODV v 5.2.1 software [32] to observe the distribution of toxicity over time. The DIVA function included in the software (data-interpolating variational analysis) was used to interpolate the data.

2.3. Maximum-Likelihood Classification

The use of remote sensing considers that a HAB dominated by a particular species will have a characteristic spectral signature that can be detected by satellite sensors [33]. Therefore, satellite color data can be used to monitor the presence and extension of the algal blooms of this species. In this work, we implemented a supervised classification of color satellite images using the maximum-likelihood classification (MLC).
MLC is a method based on Bayesian classification, which determines the probability that a pixel belongs to a specific predefined class based on a conditional probability function calculated from classes generated in defined areas or training zones. Thus, an unclassified pixel is assigned to the class that it has the maximum probability of belonging to [20,21].
The classification was implemented with the ArcGIS Pro 2.5 software using the maximum-likelihood classification tool, which requires a file containing the spectral signatures of specific classes generated through the selection of training areas. In this work, the classification was performed with the selection of training areas based on the sampling campaigns during two HABs of G. catenatum. Figure 2 describes the general process of method implementation.

2.4. Satellite Data

A satellite database was used for each HAB event to implement the supervised classification, and both databases correspond to the reflectance between 412 and 678 nm wavelengths. The G. catenatum class related to the 2015 HAB was established using MODIS data with a spatial resolution of 1 km downloaded from (https://oceancolor.gsfc.nasa.gov/ accessed on 13 March 2021). A database of images from the 2017 HAB and 2018 to 2020 period was obtained; the noisy images with less than 80% of valid data were excluded, and we obtained 353 images that fulfilled these quality criteria for the 2018 to 2020 period.
To analyze the 2017 HAB, data from Sentinel-3A and B with 300 m of the resolution were used. Data for the 2017 event and from 2018 to 2022 were downloaded from the EUMETSAT data center (https://www.eumetsat.int/eumetsat-data-centre accessed on 10 May 2021). The data corresponds to Level 2 Water Full Resolution daily scenes from the Ocean and Land Color Instrument (OLCI) in the Sentinel-3A and 3B satellites. These images were automatically processed through bash scripts to generate daily mosaics of water-leaving reflectance of the study area using the cropping, reprojection, and mosaic generation tools contained in the Sentinel Applications Platform (SNAP) software through the command line option. The resulting images were filtered to select only those containing a minimum of 70% valid data for the study area. After applying this protocol, we obtained 432 images for January 2018 to March 2022 period.

2.5. Training Area Selection

The maximum-likelihood classification training zones to generate the G. catenatum related classes were localized where the dinoflagellate was detected during two HAB events. Two groups of spectral classes were generated, a first class from the MODIS (17 January 2015) and 2015 campaign in situ data. This class was generated from the location of the stations of the 2015 sampling campaign (Figure 1) and was assigned as a training polygon labeled catenatumMODIS class.
The second group corresponds to the 2017 HAB event; data from 18 January of Sentinel-3 were used for this event. Due to the variability in G. catenatum in each extraction polygon affected in this event, a spectral class was obtained for each polygon; the classes were labeled as Class 1, Class 2, and Class 3, associated with the respective extraction areas (Figure 1).
No other HAB classes were generated to evaluate the classification process. For this, other training areas were used to generate spectral classes associated with different hydrographic characteristics from those present on the west coast of the study area where the HABs were detected. For example, a spectral class was obtained with satellite information from the shallow, highly turbid Colorado River delta zone in the Upper Gulf of California due to the input of terrigenous material; also, classes for the center and the coastal zones were implemented. To obtain spectral information for conditions in which G. catenatum was absent, we defined training zones during the summer using identical polygons formerly used for generating the above-described spectral classes. An image from the MODIS dataset for 3 June 2018 and 20 June 2018 for Sentinel-3 was used to create these classes. G. catenatum has not been detected in summer in the NGC [34], and the species was not detected in San Felipe surface water samples for the dates used. The spectral information of the summer classes of each dataset was combined with the spectral information of the HAB day classes in a unique signature file to classify the images of each sensor. This modification allows the use of spectral information of two images of different days as source information.

2.6. Evaluation of Classification

The results of each classification were evaluated using the kappa coefficient (k) developed by Cohen [35], which is a discrete multivariate technique to measure the proportion of agreement after chance agreements have been removed [36]. To calculate the kappa coefficient, the following equation was used [37].
ρ o = i = 1 κ ρ i i
ρ c = i = 1 κ ρ i + ρ + j
Κ ^ = ρ o ρ c 1 ρ c
where ρ o indicates the accuracy of observed agreement and ρ c the estimate of chance agreement.
A value of Κ ^ = 1 indicates perfect coincidence within the class labeled during training and how it was classified, and Κ ^ = 0 represents a null concordance [38,39].
After evaluating the results of each classification, the maximum-likelihood classification method was applied with the spectral signatures files to classify MODIS daily images from 2018 to 2020 and Sentinel-3 from 2018 to 2022.
To assess the quality of detection of Gymnodinium catenatum throughout the time using the maximum-likelihood classification with the series of MODIS and Sentinel-3 images, a database of a time series of G. catenatum was used. This database corresponds to the monitoring program of the FICOTOX laboratory of the CICESE research center. FICOTOX has monitored the phytoplankton community weekly in a coastal station near the port of San Felipe since January 2017 (Figure 1). To generate the time series of image classifications results a polygon between San Felipe and Punta Estrella, and 15 km offshore was delimited, and the percentage of this area classified as HAB in each image was calculated (Figure 1, yellow polygon).
Additionally, we compared quantitatively the detection of G. catenatum with the Sentinel-3 classes when the relative abundance of G. catenatum was equal to or above 5% of the phytoplankton community in San Felipe. The comparison was performed for the dates on which there was information on the species and satellite images one day before, during, or one day after the sampling date. Thus, we obtained the data when G. catenatum was registered and Sentinel-3 images were available (Appendix A, Table A1). To consider the detection of the Sentinel-3 classes related to the G. catenatum presence detected, a limited distance of 15 km from the San Felipe sampling site was established.

3. Results

The phytoplankton community was characterized in 22 sampling stations located south of San Felipe Bay in the NGC on 17 and 18 March 2015. The surface abundance of G. catenatum varied between sampling sites, with a minimum of 1500 cells/L and a maximum of 266,333 cells/L. The species was heterogeneously distributed in the sampling area (Figure 3). Higher abundances were located near the coast near San Felipe, and lower abundances were detected offshore.

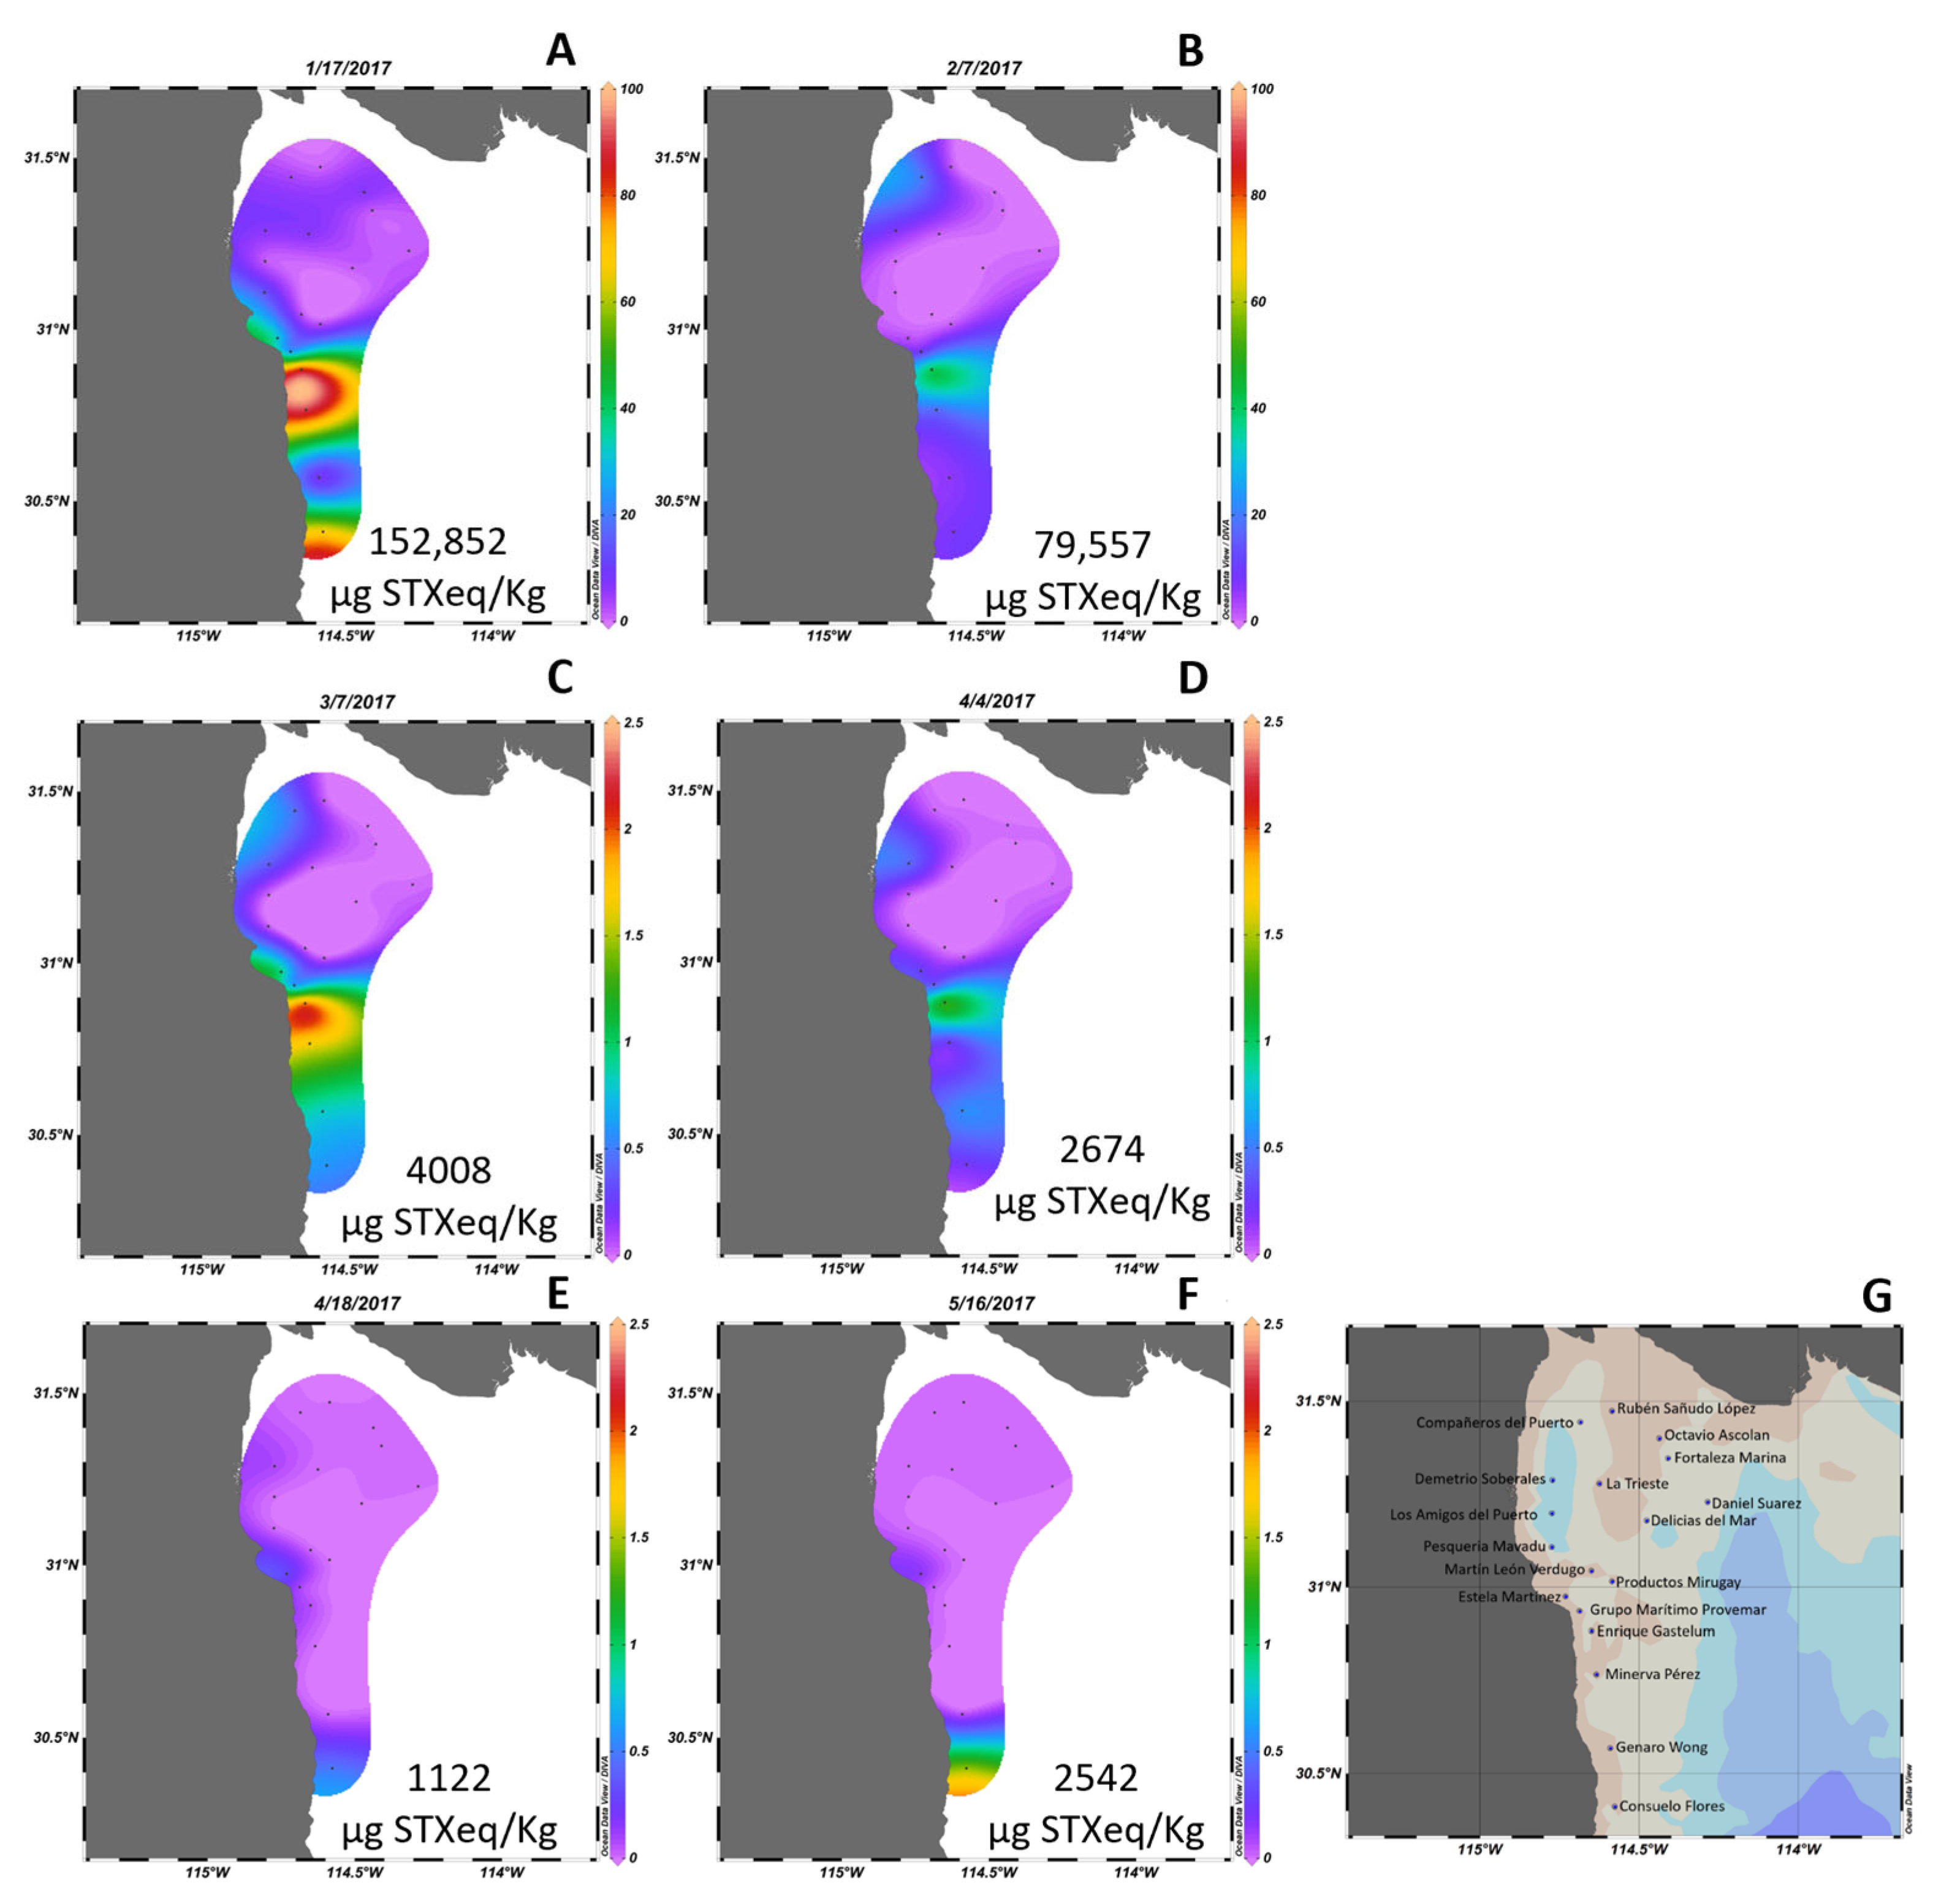
3.1. Presence of Paralytic Shellfish Toxins in the Northern Gulf of California

High concentrations of toxins were detected following the G. catenatum blooms of 2015 and 2017. The spatial distribution of PSTs during the two years was analyzed. In 2015, PSTs were detected in geoduck samples collected from January to May (Figure 4). The highest concentration of PSTs, reaching 18,824 µg STXeq/Kg, was detected at the end of January within the harvesting area located south from San Felipe (Figure 4B). Although PSTs were also detected in samples from adjacent zones, their concentrations were relatively low. North of San Felipe, the PST level reached 3,840 µg STXeq/Kg between February 10 and March 3 (Figure 4D). Subsequently, from late April to the end of June, PSTs were found in the geoduck harvesting region close to the coast, with concentrations up to 2,400 µg STXeq/Kg. Similar to the findings of 2015, the maximum toxin concentration in 2017 was detected in harvesting areas south from San Felipe (Figure 5). This year marked the record for the highest toxin content ever reported in a mollusk in Mexico, with 152,852 µg STXeq/Kg detected in geoduck samples from an area in southern San Felipe on January 17. High toxin concentrations were reported in all harvesting areas within the same region, including the Consuelo Flores area at 109,000 µg STXeq/Kg and the Estela Martinez area at 68,000 µg STXeq/Kg. These areas are located approximately 80 km south from San Felipe.

3.2. MODIS Classification

The image classification for the 17 January of 2015 from MODIS was evaluated with the kappa coefficient (k), with a result of 0.72. This value indicates a high consistency between the labeled classes and how they were classified [38]. The general precision for this classification was 78%, and the confusion matrix analysis (Appendix B, Table A2) showed that the catenatumMODIS class presented minor classification errors.
Pixels recognized as the catenatumMODIS class are highlighted in Figure 6. The distribution of this class shows the probable distribution of G. catenatum on this date. According to this, the species was present on the west coast of the NGC between the San Felipe-Punta Estrella and the Puertecitos coastal area. Also, we found the catenatumMODIS class in coastal areas of Bahía Adair and Puerto Peñasco along the east coast of the NGC. Here, the class was detected offshore compared to the Baja California coastal area. The distribution of the catenatumMODIS class on the west coast of the NGC coincided with the distribution of G. catenatum during the HAB event of January and February of 2015 [5] and, most importantly, coincided with the areas of extraction of P. globlosa which were closed during this event related to the accumulation of PSTs in the clams above the regulatory action limit [9,40].
G. catenatum, but principally the presence of PST toxins in bivalves in the last 7 years, has been detected principally in San Felipe–Punta Estrella to the Puertecitos coastal area and in coastal areas in front of Bahía Adair and Puerto Peñasco on the east coast of the NGC [5,31]. The distribution of resting cysts has the same distribution pattern with large seedbeds found in the mentioned areas on the west and east coasts of the NGC [31].
Then, to evaluate if the catenatumMODIS class follows this distribution, we classified MODIS images for the 2018–2020 period. The frequency of detection of the catenatumMODIS class in the same pixel during the period was high (12 times) in the Punta Estrella and Bahía Adair areas (Figure 7) where recurrent sanitary bans have been implemented [40], and as consequence, it can be established that these sites are areas of distribution of G. catenatum. Interestingly, the catenatumMODIS class was also detected from Bahía Adair close to Puerto Lobos and Puerto Libertad on the east coast and in San Luis Gonzaga on the west. The highest frequency (36) of detection of the class was found on this site (Figure 7).

3.3. Sentinel-3 Classification

For the Sentinel-3 classification, three spectral classes were developed based on the presence of G. catenatum on the HAB of 2017. The kappa coefficient was also used to evaluate the precision of the classification of 18 January 2017. The classification of the Sentinel-3 images had a k value of 0.70 and a total accuracy of 74%. The confusion matrix (Appendix B, Table A3) showed fewer errors in identifying Sentinel-3 class 1 and class 2, and the errors in the identification of this class were associated with pixels classified to other HAB classes. The detection of the three Sentinel-3 classes (Class 1, Class 2, and Class 3) associated with the presence of G. catenatum for the 18 January 2017 image is presented in Figure 8. The G. catenatum-related classes were distributed in the San Felipe to Punta Estrella area near the coast and the east coast in front of Bahía Adair to Puerto Lobos (Figure 8). Class 3 was mainly detected in this last area and in southern Punta Estrella (Figure 8).
The images from January 2018 to April 2021 were analyzed to describe the temporal detection of pixels classified as G. catentum classes. Sentinel-3 Class 1, and Class 2 presented a similar distribution pattern (Figure 9A,B). These classes were detected mainly in the Punta Estrella to Puertecitos coastal area, and their distribution extended to the northeast and was present also in the Bahía Adair and Puerto Peñasco zones (Figure 9A,B). The highest frequency of detection (12) was in the coastal zone between San Felipe and Puertecitos and the Bahía Adair coastal zone. The detection of these classes was low or not detected in other areas of the NGC (Figure 9A,B). In contrast, Sentinel-3 Class 3 was distributed throughout most of the NGC but not in the Colorado River delta and western and eastern coastal zones (Figure 9C). G. catenatum Sentinel-3 Class 3 did not represent this species temporal and spatial distribution.

3.4. Temporal Detection of G. catenatum Satellite-Derived Classes

The supervised classification results were evaluated by the qualitative comparison of the detection of the G. catenatum-related classes with the abundance of this species in superficial water samples taken at the San Felipe sampling point. The potential detection of G. catenatum by remote sensing is presented as the percentage of the area detected by the classes developed to detect this species (MODIS and Sentinel-3) in the coastal area between San Felipe and Puertecitos and 15 km offshore (see Figure 1). We consider that this ratio indicates the presence and possible extension of the distribution of G. catenatum close to the sampling point in San Felipe Bay (Figure 10).
G. catenatum was found recurrently from the October–November to April–May period in all the sampled years, with a maximum abundance of 23,000 cellsl/L in 2019 in the San Felipe monitoring point (Figure 10A). This cell abundance represented a relative abundance of approximately 25% of the phytoplankton community (Figure 10B). G. catenatum was not detected from May to September during the sampling period.
The detection of the catenatumMODIS class matched the temporal appearance of G. catenatum in the sampling site, at least during winter. The area classified as catenatumMODIS class (above 5% of the total area analyzed) was present between November and March–April of every year (Figure 10C). A relatively high percentage of the catenatumMODIS class (40 to 50%) was detected during the first weeks of each year (Figure 10). The highest percentage of the area classified as catenatumMODIS was approximately 59% and was detected in January 2018. The presence of the catenatumMODIS class was not compared with the presence of G. catenatum from December 2018 to January 2019 because no images were available during this period due to the cloud coverage over the region (Figure 10C). In contrast to the winter months, there was no coincidence between the presence of G. catenatum and catenatumMODIS class from May to October. The catenatumMODIS class was present, while G. catenatum was not detected during this period.
The performance of Sentinel-3 classes to detect G. catenatum was also evaluated for the 2018–2020 period, and we extended the classification to images up to March 2022. The general temporal patterns of detection of G. catenatum with Sentinel-3 classes were similar to the detection of the species in surface water samples from San Felipe. Class 1 and 2 (and the sum of both classes) were detected from October and November to April and May each year (Figure 11C–E). These classes were not present from May to September (Figure 11C–E). This pattern of appearance matches the period of the presence of G. catenatum in the San Felipe sampling point (Figure 11A,B).
High abundances of G. catenatum were detected in the 2018–2019 winter. Unfortunately, cloud coverage in the NGC during this period did not permit the analysis of images (Figure 11). The major discrepancy between G. catenatum-related Sentinel classes and the presence of this species was evident for the winter period of 2021–2022. This was probably related to the geographical location of the dinoflagellate bloom. G. catentum abundance was probably higher south of San Felipe.
The recurrent occurrence of G. catenatum in the NGC and its presence for more than 10 weeks during winter is evident from the analysis of Sentinel-3 classes. This analysis also indicates a probable relatively large extension of the blooms in the region (Figure 11).

4. Discussion

HABs of G. catenatum have become recurrent in the NGC. The presence of this species and the subsequent occurrence of PSTs have generated multi-level affectations in the region, including risks to food safety and public-health-adverse socio-economic effects and deleterious impacts on local wildlife [9].
The fishery of the geoduck clam is one of the main economic activities in the NGC and has been subject to recurrent sanitary bans associated with G. catenatum HABs. In January 2015, clams harvested from certified extraction areas presented toxin concentrations up to 18,800 µg STXeq/Kg, 23 times the regulatory level. In 2017, toxin levels were as high as 152,852 µg STXeq/Kg, exceeding the regulatory limit by 190 times. In response to these high levels of toxins, multiple and extensive sanitary bans were enforced. The harvesting areas located southern San Felipe were the most impacted during the 2015 HAB (Figure 4). These areas were closed for a cumulative 184 days throughout the year. Considering all extraction areas without overlapping closures, the geoduck fishery in the NGC was banned for 294 days in 2015. Similarly, in 2017, clam extraction was restricted for 244 days across the NGC, with southern San Felipe zones experiencing closures for 156 days. In the NGC, approximately 40% to 50% of the total geoduck clam annual quota is harvested between May and September, with December and January being crucial months for export of the product to China [41]. The presence of G. catenatum blooms during this period affects the economy of the region that in part is sustained with the extraction of bivalves. These blooms have also affected public health and wildlife [7]. Therefore, it is necessary to have an EWS in the area with the implementation of different tools to monitor the presence of G. catenatum. Monitoring of the phytoplankton community has been implemented, but it is restricted to only one coastal location. In this work, we demonstrate that the supervised classification of satellite images using the maximum-likelihood method has a high potential for monitoring G. catenatum HABs in the NGC. Evaluation of our results with the kappa coefficient according to the scale of Landis and Koch [37] showed a high agreement (k = 0.72 for MODIS, and k = 0.70 for Sentinel-3 images) between the labeled areas and their classification.
The distribution of catenatumMODIS class and G. catenatum Sentinel-3-related classes during HAB events of this species in 2015 and 2017 further supports our methodological approach. Specifically, the distribution of Sentinel-3 Classes 1 and 2 were detected in the Punta Estrella to Puertecitos area and on the east coast of the NGC. Also, these classes represent the geographical distribution of the species during the recurrent HABs in the region. The classes were detected in areas recurrently impacted by G. catenatum HABs that have caused the accumulation of PSTs above the regulatory limit [40] and the consequent temporal closure of bivalve mollusk extraction [9,40].
Although the catenatumMODIS class represented the areas of occurrence of the 2015 HAB, the classification of images for the 2018–2020 period revealed high detection frequencies of the class in locations where no reports of G. catenatum exist and during the summer, the season in which the species is absent from the records [9,31,40]. Also, the distribution of the Sentinel-3 Class 3 differs from the known distribution of the G. catenatum HABs deduced by their impact on the P. globosa fishery [5], and by the hydrodynamic circulation, and resting cyst distribution of this species [31]. Therefore, Class 3 does not represent the distribution of G. catenatum in the NGC.
The probable cause for the inaccurate representation of the presence of G. catenatum by the catenatumMODIS class could be that the training was performed within areas having a heterogeneous abundance of the species. The average cell abundance was 33,984 cells/L. In the case of the G. catenatum Sentinel-3 Class 3, the training area was established with the lowest abundance of the species (95,000 cells/L) during the 2017 HAB. Probably, G. catenatum represented by this abundance during the HABs did not represent the optical characteristics related to the accumulation and dominance of the species. Other components with a stronger influence on the optical properties of the water than the presence of the microalga could also be present. This suggests that the training areas chosen for defining a G. catenatum class from satellite images must have a high relative or absolute abundance of the species.
There are important advantages of using Sentinel-3 in comparison to MODIS data. The Sentinel-3 data have greater resolution than MODIS (300 m vs. 1 km, respectively), which provides more spectral information from the same site and therefore better detection. Therefore, less information is lost close to the coast where the majority of the HABs occur, or the impact of these phenomena is manifested. Another important advantage of the use of Sentinel-3 is that the information is readily available as images and data can be downloaded the same day of its generation. This is important for monitoring the development of HABs almost in real time. The disadvantage is that Sentinel-3 data are only available after 2017.
According to the validation method used in this work, the presence of G. catenatum and Sentinel-3 HAB Classes 1 and 2 matches 75% of the occasions where the microalga was detected in surface water samples. Also, temporal detection of the Sentinel-3 HAB Classes 1 and 2 classes matched accurately the temporal appearance of the species in the NGC. These could be considered good results when compared to other approximations. The detection of Karenia mikimotoi HABs in the southwestern UK, cyanobacteria HABs in the Baltic Sea, and Chattonella verruculosa HABs in the North Sea through supervised classification has 97% exactness [18]. This exactness was evaluated by the comparison of the extension of the blooms with satellite data derived class of each species. In other work [19], supervised classification of MODIS and MERIS data [19] correctly detected 89% of Phaeocystis globosa HABs in the southern North Sea and 88% of Karenia mikimotoi HABs in the eastern English Channel. The application of more complex approaches, like a hybrid scheme of empirical and bio-optical approximations, succeeded in approximately 80% of the detection of K. brevis blooms and had a sensitivity of over 70% to predict HABs of this species with abundances greater than or equal to 1.5 × 10⁴ cells/L [42]. Machine learning using space and time data mining, kernel principal component analysis (KPCA), and support vector machine (SVM) classification with heavy-tailed radial basis kernel function obtained cross-validation kappa coefficients of 0.75 for SeaWiFS and 0.60 for MODIS-Aqua data [43]. In the present work, the performance of the MLC classification with a limited set of data was comparable with other more complex methods.
No remote perception method can be applied globally to monitor HABs. The diversity of species that proliferate in different areas, the optical type of water in which HABs take place, and other species in the phytoplankton community during HAB events complicate applying a general approach. Therefore, regional approximations must be implemented. The application of maximum-likelihood classification for image classification represents the first attempt to use satellite information to detect and monitor G. catenatum HABs in the NGC. The supervised classification using MLC has evident potential for its incorporation into an EWS for the NGC, a remote region that represents a challenge for its monitoring. A high abundance of organisms is needed to generate classes that can detect G. catenatum in the NGC. However, the agreement between the detection of Sentinel-3 and classes with the presence of G. catenatum in the sampling site at low abundances indicates that the method could be applied for early detection of the species in the NGC.
Considering these complex challenges, it is important to establish an effective detection and monitoring program to address the presence of potentially toxic microalgae in the NGC. Such a program would not only manage and mitigate impacts but also safeguard public health and the region’s economic activities.

5. Conclusions

The results derived from the present work demonstrate that a classic supervised classification method like the maximum-likelihood classification has a high potential to be implemented in the detection of Gymnodinium catenatum HABs in optically complex waters, such as the northern Gulf of California. The derived classification to detect G. catenatum with Sentinel-3 data showed a good agreement with the temporal and spatial detection of the species. The good results obtained using a limited database of the presence of the species to generate the training zones support the use of the MLC classification method to detect G. catenatum HABs in an early warning system in the northern Gulf of California, where recurrent affections occur associated with proliferations of this species.

Author Contributions

Conceptualization, G.R.-C., E.G.-M. and A.A.-B.; methodology, G.R.-C.; software, G.R.-C.; validation, G.R.-C., E.G.-M. and A.A.-B.; formal analysis, G.R.-C. and J.M.-E.; investigation, G.R.-C.; resources, E.G.-M.; data curation, J.A.C.-M., J.P.R.-C. and G.R.-C.; writing—original draft preparation, G.R.-C.; writing—review and editing, E.G.-M., A.A-B., J.M.-E., J.A.C.-M. and J.P.R.-C.; visualization, G.R.-C.; supervision, E.G.-M. and A.A.-B.; project administration, E.G.-M.; funding acquisition, E.G.-M. All authors have read and agreed to the published version of the manuscript.

Funding

This research was funded by Consejo Nacional de Humanidades Ciencias y Tecnologías (CONAHCYT) grant number PRONAII/PRONACES 319304. G.R.-C. (CVU 815013) received a PhD. Scholarship from CONAHCYT.

Institutional Review Board Statement

Not applicable.

Informed Consent Statement

Not applicable.

Data Availability Statement

Inquiries regarding the source data can be directed to the corresponding author.

Acknowledgments

The authors are grateful to the project PRONAII/PRONACES 319304: Attention to the problems associated with harmful algal blooms in Baja California: integration of knowledge to socio-environmental and economic needs and to the EUMETSAT, NASA Ocean Color. Gabriela Reséndiz-Colorado is grateful to the Consejo Nacional de Ciencia y Tecnología (CONACYT) for the full Ph.D. scholarship.

Conflicts of Interest

The authors declare no conflict of interest.

Appendix A

In general, we observed that the areas we detected as belonging to a Sentinel-3 HAB class were not located exactly at the sampling site but at distances ranging from 1 to 15 km away in variable directions, mostly towards the east and south, the latter direction associated with the presence of the HAB class towards Punta Estrella. The days when we detected the presence of the Sentinel-3 HAB class matched the days with maximum relative abundance.
Table A1. Results of the analysis of detection of Sentinel-3 HAB classes associated with G. catenatum presence in the San Felipe monitoring point.
Sampling DateAbsolute
Abundance
Relative
Abundance
Sentinel-3
Detection
13 January 2018383012.735.47 km NE
20 January 201824449.988.44 km
24 February 2018210018.585–6 km NE
2 March 20187945.69Undetected
24 March 20187889.2615 km S
23 November 2018200014.70Undetected
2 December 20187865.425 km S
9 December 201811078.47Undetected
23 December 201817145.918–15 km S
7 March 201917179.2013–15 km SE
13 November 2020607834.489.06 km E
31 December 2020464312.7715 km S, P.E.
8 January 2021388718.371 km E
29 January 2021618418.9615 km S, PE
26 February 20216435.6113 km SE
6 March 2021132120.67Undetected
13 December 202197410.21Undetected
21 January 202220009.9615 km SE
10 February 202216676.832.8 km S
25 February 202210718.455 km S, P.E.
The table includes the date of sampling, the absolute and relative abundances, and data about detection, distance, and direction from the sampling point. S = south, E = east, SE = southeast, NE = northeast, and P.E. = Punta Estrella.

Appendix B

Table A2. MODIS 2015 HAB classification confusion matrix. The green class corresponds to the MODIS HAB class, the gray classes are the rest of the classes used to characterize the NGC.
Class #12345678910111213
1210012000002700
20104008000000000
30223004003300180
40001948778000001000
5000851696700000000
60000463890000020
7000401630001600
80000000225238000
9018000000972402100
100000000032318282490
1100081000004244893460
121000400000153110
1300000000002859
Table A3. Sentinel-3 2017 HAB classification confusion matrix. The green classes correspond to the Sentinel-3 HAB classes, the gray classes are the rest of the classes used to characterize the NGC. The classes associated with the HAB were classified as HAB; however, some pixels were assigned to other HAB classes. This error indicates the closeness between HAB classes.
Classs #133456789101112131415
11462900992000000000
2231337032001000000
3030253002130008000
40004100000000000
5000155816000700000
6540036576960324607000
700000015957181500004213
80000009143986310000233
9001001221020538120402629
1000002000382411001
110000000000380000
120000210102490949489
13000000000003215517070
14000000000000379274929
150000031073030640168537

References

  1. IOGCC. Observation of Harmful Algal Blooms with Ocean Colour Radiometry; International Ocean Colour Coordinating Group (IOCCG): Dartmouth, NS, Canada, 2021. [Google Scholar]
  2. Hallegraeff, G.M.; Anderson, D.M.; Cembella, A.D.; Enevoldsen, H.O. Manual on Harmful Marine Microalgae, 2nd ed.; Revised Edition; UNESCO: Paris, France, 2004. [Google Scholar]
  3. Sellner, K.G.; Doucette, G.J.; Kirkpatrick, G.J. Harmful algal blooms: Causes, impacts and detection. J. Ind. Microbiol. Biotechnol. 2003, 30, 383–406. [Google Scholar] [CrossRef] [PubMed]
  4. Larkin, S.L.; Adams, C.M. Harmful Algal Blooms and Coastal Business: Economic Consequences in Florida. Soc. Nat. Resour. 2007, 20, 849–859. [Google Scholar] [CrossRef]
  5. Medina Elizalde, J. Effects of Paralytic Shellfish Toxins on Marine Mammals, Seabirds and Geoduck Fisheries in the Northern Gulf of California during 2015–2019. Ph.D. Thesis, Center for Scientific Research and Higher Education at Ensenada (CICESE), Ensenada, Mexico, 2021. [Google Scholar]
  6. Band-Schmidt, C.J.; Durán-Riveroll, L.M.; Bustillos-Guzmán, J.J.; Leyva-Valencia, I.; López-Cortés, D.J.; Núñez-Vázquez, E.J.; Hernández-Sandoval, F.E.; Ramírez-Rodríguez, D.V. Paralytic Toxin Producing Dinoflagellates in Latin America: Ecology and Physiology. Front. Mar. Sci. 2019, 6, 42. [Google Scholar] [CrossRef]
  7. Núñez-Vázquez, E.J.; Lizarraga, I.G.; Band-Schmidt, C.; Tapia, A.C.; Cortes, D.J.L.; Sandoval, F.E.H.; Tapia, A.H.; Guzman, J.J.B. Impact of harmful algal blooms on wild and cultured animals in the Gulf of California. J. Environ. Biol. 2011, 32, 413–423. [Google Scholar] [PubMed]
  8. Núñez-Vazquez, E.J.; Band-Schmidt, C.J.; Bustillos-Guzmán, J.J.; López-Cortés, D.J.; Cordero-Tapia, A.; Heredia-Tapia, A.; García-Mendoza, E.; Ruíz-de la Torre, M.C.; Medina-Elizalde, J.J. Impactos de los FAN en la Salud Pública y Animal (Silvestres y de Cultivo) en el Golfo de California. In Florecimientos Algales Nocivos en México; García-Mendoza, E., Quijano-Scheggi, S.I., Olivos-Ortiz, A., Núñez-Vazquez, E.J., Eds.; CICESE: Ensenada, Mexico, 2016; ISBN 978-607-95688-5-6. [Google Scholar]
  9. Medina-Elizalde, J.; García-Mendoza, E.; Turner, A.D.; Sánchez-Bravo, Y.A.; Murillo-Martínez, R. Transformation and Depuration of Paralytic Shellfish Toxins in the Geoduck Clam Panopea globosa From the Northern Gulf of California. Front. Mar. Sci. 2018, 5, 335. [Google Scholar] [CrossRef]
  10. Stumpf, R.P.; Culver, M.E.; Tester, P.A.; Tomlinson, M.; Kirkpatrick, G.J.; Pederson, B.A.; Truby, E.; Ransibrahmanakul, V.; Soracco, M. Monitoring Karenia brevis blooms in the Gulf of Mexico using satellite ocean color imagery and other data. Harmful Algae 2003, 2, 147–160. [Google Scholar] [CrossRef]
  11. Pettersson, L.H.; Pozdnyakov, D. Biology and Ecology of Harmful Algal Species. In Monitoring of Harmful Algal Blooms; Springer: Berlin/Heidelberg, Germany, 2013; pp. 25–47. ISBN 978-3-540-22892-9. [Google Scholar]
  12. Glibert, P.M.; Berdalet, E.; Burford, M.A.; Pitcher, G.C.; Zhou, M. (Eds.) Ecological Studies; Springer International Publishing: Cham, Switzerland, 2018; Volume 232, ISBN 978-3-319-70068-7. [Google Scholar]
  13. Amin, R.; Zhou, J.; Gilerson, A.; Gross, B.; Moshary, F.; Ahmed, S. Novel optical techniques for detecting and classifying toxic dinoflagellate Karenia brevis blooms using satellite imagery. Opt. Express 2009, 17, 9126–9144. [Google Scholar] [CrossRef]
  14. Tao, B.; Mao, Z.; Lei, H.; Pan, D.; Shen, Y.; Bai, Y.; Zhu, Q.; Li, Z. A novel method for discriminating Prorocentrum donghaiense from diatom blooms in the East China Sea using MODIS measurements. Remote. Sens. Environ. 2015, 158, 267–280. [Google Scholar] [CrossRef]
  15. Cannizzaro, J.P.; Carder, K.L.; Chen, F.R.; Heil, C.A.; Vargo, G.A. A novel technique for detection of the toxic dinoflagellate, Karenia brevis, in the Gulf of Mexico from remotely sensed ocean color data. Cont. Shelf Res. 2008, 28, 137–158. [Google Scholar] [CrossRef]
  16. Moore, T.S.; Dowell, M.D.; Franz, B.A. Detection of coccolithophore blooms in ocean color satellite imagery: A generalized approach for use with multiple sensors. Remote. Sens. Environ. 2012, 117, 249–263. [Google Scholar] [CrossRef]
  17. Ahn, Y.-H.; Shanmugam, P. Detecting the red tide algal blooms from satellite ocean color observations in optically complex Northeast-Asia Coastal waters. Remote. Sens. Environ. 2006, 103, 419–437. [Google Scholar] [CrossRef]
  18. Miller, P.I.; Shutler, J.D.; Moore, G.F.; Groom, S.B. SeaWiFS discrimination of harmful algal bloom evolution. Int. J. Remote. Sens. 2006, 27, 2287–2301. [Google Scholar] [CrossRef]
  19. Kurekin, A.A.; Miller, P.I.; Van der Woerd, H.J. Satellite discrimination of Karenia mikimotoi and Phaeocystis harmful algal blooms in European coastal waters: Merged classification of ocean colour data. Harmful Algae 2014, 31, 163–176. [Google Scholar] [CrossRef]
  20. Hogland, J.; Billor, N.; Anderson, N. Comparison of standard maximum likelihood classification and polytomous logistic regression used in remote sensing. Eur. J. Remote. Sens. 2013, 46, 623–640. [Google Scholar] [CrossRef]
  21. Richards, J.A. Remote Sensing Digital Image Analysis; Springer International Publishing: Cham, Switzerland, 2022; ISBN 978-3-030-82326-9. [Google Scholar]
  22. Casal, G.; Sánchez-Carnero, N.; Sánchez-Rodríguez, E.; Freire, J. Remote sensing with SPOT-4 for mapping kelp forests in turbid waters on the south European Atlantic shelf. Estuarine. Coast. Shelf Sci. 2011, 91, 371–378. [Google Scholar] [CrossRef]
  23. Casal, G.; Kutser, T.; Domínguez-Gómez, J.A.; Sánchez-Carnero, N.; Freire, J. Mapping benthic macroalgal communities in the coastal zone using CHRIS-PROBA mode 2 images. Estuarine. Coast. Shelf Sci. 2011, 94, 281–290. [Google Scholar] [CrossRef]
  24. Gevana, D.; Camacho, L.; Carandang, A.; Camacho, S.; Im, S. Land use characterization and change detection of a small mangrove area in Banacon Island, Bohol, Philippines using a maximum likelihood classification method. For. Sci. Technol. 2015, 11, 197–205. [Google Scholar] [CrossRef]
  25. Hossen, H.; Negm, A. Change Detection in the Water Bodies of Burullus Lake, Northern Nile Delta, Egypt, Using RS/GIS. Procedia Eng. 2016, 154, 951–958. [Google Scholar] [CrossRef]
  26. Lavín, M.F.; Marinone, S.G. An Overview of the Physical Oceanography of the Gulf of California. In Nonlinear Processes in Geophysical Fluid Dynamics; Velasco Fuentes, O.U., Sheinbaum, J., Ochoa, J., Eds.; Springer Netherlands: Dordrecht, The Netherlands, 2003; pp. 173–204. ISBN 978-94-010-3996-3. [Google Scholar]
  27. Wilkinson, T.; Wiken, E.; Bezaury Creel, J.; Hourigan, T.; Agardy, T.; Herrmann, H.; Janishevski, L.; Madden, C.; Morgan, L.; Padilla, M. Ecorregiones Marinas de América del Norte; Comisión para la Cooperación Ambiental: Montreal, QC, Canada, 2009; ISBN 978-2-923358-71-0. [Google Scholar]
  28. PROFEPA La Importancia del Alto Golfo. 2019. Available online: https://www.gob.mx/profepa/articulos/la-importancia-del-alto-golfo?idiom=es#:~:text=El%20Alto%20Golfo%20de%20California%20es%20una%20de%20las%20zonas,Santa%20Clara%20y%20San%20Felipe (accessed on 21 October 2019).
  29. Aragón-Noriega, E.A.; Alcántara-Razo, E.; Calderon-Aguilera, L.E.; Sánchez-Fourcade, R. Status of Geoduck Clam Fisheries in Mexico. J. Shellfish. Res. 2012, 31, 733–738. [Google Scholar] [CrossRef]
  30. Sournia, A. (Ed.) Phytoplankton Manual; Monographs on Oceanographic Methodology; UNESCO: Paris, France, 1978; ISBN 978-92-3-101572-4. [Google Scholar]
  31. Castañeda-Quezada, R.; García-Mendoza, E.; Ramírez-Mendoza, R.; Helenes, J.; Rivas, D.; Romo-Curiel, A.E.; Lago-Lestón, A. Distribution of Gymnodinium catenatum Graham cysts and its relation to harmful algae blooms in the northern Gulf of California. J. Mar. Biol. Assoc. UK 2021, 101, 895–909. [Google Scholar] [CrossRef]
  32. Schlitzer, Reiner, Ocean Data View, odv.awi.de. 2023. Available online: https://odv.awi.de/ (accessed on 1 September 2023).
  33. Shen, L.; Xu, H.; Guo, X. Satellite Remote Sensing of Harmful Algal Blooms (HABs) and a Potential Synthesized Framework. Sensors 2012, 12, 7778–7803. [Google Scholar] [CrossRef] [PubMed]
  34. Ramírez Castillo, A.M. Comunidad Fitoplanctónica y Presencia de Gymnodinium Catenatum con Relación a la Temperatura en la Bahía de San Felipe, Baja California, México. Bachelor’s Thesis, Universidad de Colima, Colima, Mexico, 2020. [Google Scholar]
  35. Cohen, J. A Coefficient of Agreement for Nominal Scales. Educ. Psychol. Meas. 1960, 20, 37–46. [Google Scholar] [CrossRef]
  36. Banko, G. A Review of Assessing the Accuracy of Classifications of Remotely Sensed Dataand of Methods Including Remote Sensing Data in Forest Inventory; International Institute for Applied Systems Analysis: Laxenburg, Austria, 1998. [Google Scholar]
  37. Congalton, R.G.; Green, K. Assessing the Accuracy of Remotely Sensed Data: Principles and Practices, 3rd ed.; CRC Press: Boca Raton, FL, USA; London, UK; New York, NY, USA, 2019; ISBN 978-0-367-65667-6. [Google Scholar]
  38. Landis, J.R.; Koch, G.G. The Measurement of Observer Agreement for Categorical Data. Biometrics 1977, 33, 159–174. [Google Scholar] [CrossRef] [PubMed]
  39. Rwanga, S.S.; Ndambuki, J.M. Accuracy Assessment of Land Use/Land Cover Classification Using Remote Sensing and GIS. Int. J. Geosci. 2017, 08, 611–622. [Google Scholar] [CrossRef]
  40. COFEPRIS. Vedas Sanitarias 2013–2023, Cierres Precautorios y Eventos de Marea Roja en Áreas sin Producción de Moluscos Bivalvos 2023; Gobierno de Mexico, Comisión Federal para la Protección contra Riesgos Sanitarios: Mexico City, Mexico, 2022.
  41. Diario Oficial de la Federación de México. Plan de Manejo Para La Pesquería de Almeja Generosa (Panopea spp.): En las Costas de Baja California, México; Diario Oficial de la Federación de México: Mexico City, Mexico, 2012.
  42. Carvalho, G.A.; Minnett, P.J.; Fleming, L.E.; Banzon, V.F.; Baringer, W. Satellite remote sensing of harmful algal blooms: A new multi-algorithm method for detecting the Florida Red Tide (Karenia brevis). Harmful Algae 2010, 9, 440–448. [Google Scholar] [CrossRef] [PubMed]
  43. Gokaraju, B.; Durbha, S.S.; King, R.L.; Younan, N.H. A Machine Learning Based Spatio-Temporal Data Mining Approach for Detection of Harmful Algal Blooms in the Gulf of Mexico. IEEE J. Sel. Top. Appl. Earth Obs. Remote. Sens. 2011, 4, 710–720. [Google Scholar] [CrossRef]
Figure 1. Location of the 2015 sampling stations in the study area. The geoduck clam extraction polygons impacted by the 2017 Gymnodinim catenatum HAB and the area considered for the generation of the time series of the classification process are also presented. The star denotes the location of the weekly sampling station in San Felipe Bay. The solid black line indicates the southern limit of the northern Gulf of California area.
Jmse 11 01793 g001
Figure 2. Diagram of the implementation of the supervised classification of MODIS and Sentinel-3 images to identify G. catenatum in the northern Gulf of California.
Jmse 11 01793 g002
Figure 3. Gymnodinium catenatum surface cell abundance (cells/L) during the 2015 HAB. Sampling sites (black dots) are indicated and the data were interpolated by the natural neighbor method.
Jmse 11 01793 g003
Figure 4. Spatial distribution of paralytic shellfish toxins presented as percentage of the maximum value detected at each date (panels AG) in 18 certified areas (H) for clam extraction in the northern Gulf of California in 2015. Data obtained from COFEPRIS. The highest concentration of PSTs by date is shown in each image and black dots represent the location of each certified area.
Jmse 11 01793 g004
Figure 5. Spatial distribution of paralytic shellfish toxins (presented as percentage of the maximum value detected at each date (panels AF) in 18 certified areas (G) for clam extraction in the northern Gulf of California in 2017. Data obtained from COFEPRIS. The highest concentration of PSTs by date is shown in each image and black dots represent the location of each certified area.
Jmse 11 01793 g005
Figure 6. Distribution of the catenatumMODIS class in the 17 January 2015 MODIS image.
Jmse 11 01793 g006
Figure 7. Distribution and frequency of detection of the catenatumMODIS class in images for January 2018 to December 2020 period. Colors indicate the frequency at which a pixel was classified as catenatumMODIS class. The areas where the presence of G. catenatum is potentially recurrent are highlighted in green.
Jmse 11 01793 g007
Figure 8. Distribution of the G. catenatum Sentinel-3 classes on 18 January 2017, Sentinel-3 image.
Jmse 11 01793 g008
Figure 9. Distribution and frequency of detection of the G. catenatum Sentinel-3 Class 1 (A), Class 2 (B), and Class 3 (C) in images for January 2018 to April 2021 period. Colors indicate the frequency at which a pixel was classified as the G. catenatum Sentinel-3 classes.
Jmse 11 01793 g009
Figure 10. Absolute (A) and relative (B) abundance of G. catenatum in San Felipe Bay from 1 January 2018 to 31 December 2020. The detection of catenatumMODIS class in imagines from the same period is presented in panel (C). The green area represents a period in which satellite images were not available due to cloud coverage in the region.
Jmse 11 01793 g010
Figure 11. Absolute (A) and relative (B) abundance of G. catenatum in San Felipe from 1 January 2017 to 17 March 2022. The detection of Sentinel-3 Class 1 is presented in panel (C), Class 2 in panel (D), and panel (E) shows the sum of the detection of both classes in images from the same period. The green area represents a period in which satellite images associated with cloud coverage in the region were not available.
Jmse 11 01793 g011
Disclaimer/Publisher’s Note: The statements, opinions and data contained in all publications are solely those of the individual author(s) and contributor(s) and not of MDPI and/or the editor(s). MDPI and/or the editor(s) disclaim responsibility for any injury to people or property resulting from any ideas, methods, instructions or products referred to in the content.

