Stress Response in Toxic Diatoms: The Effects of Abiotic Factors on Growth and RNA Content in Pseudo-nitzschia calliantha and in Pseudo-nitzschia multistriata

 ,
,  ,
,  , , and
Abstract
:1. Introduction
2. Materials and Methods
2.1. Cultivation of Pseudo-nitzschia Strains
2.2. Experimental Design
2.3. Cell Counts
2.4. RNA Extraction
2.5. Statistical Analysis
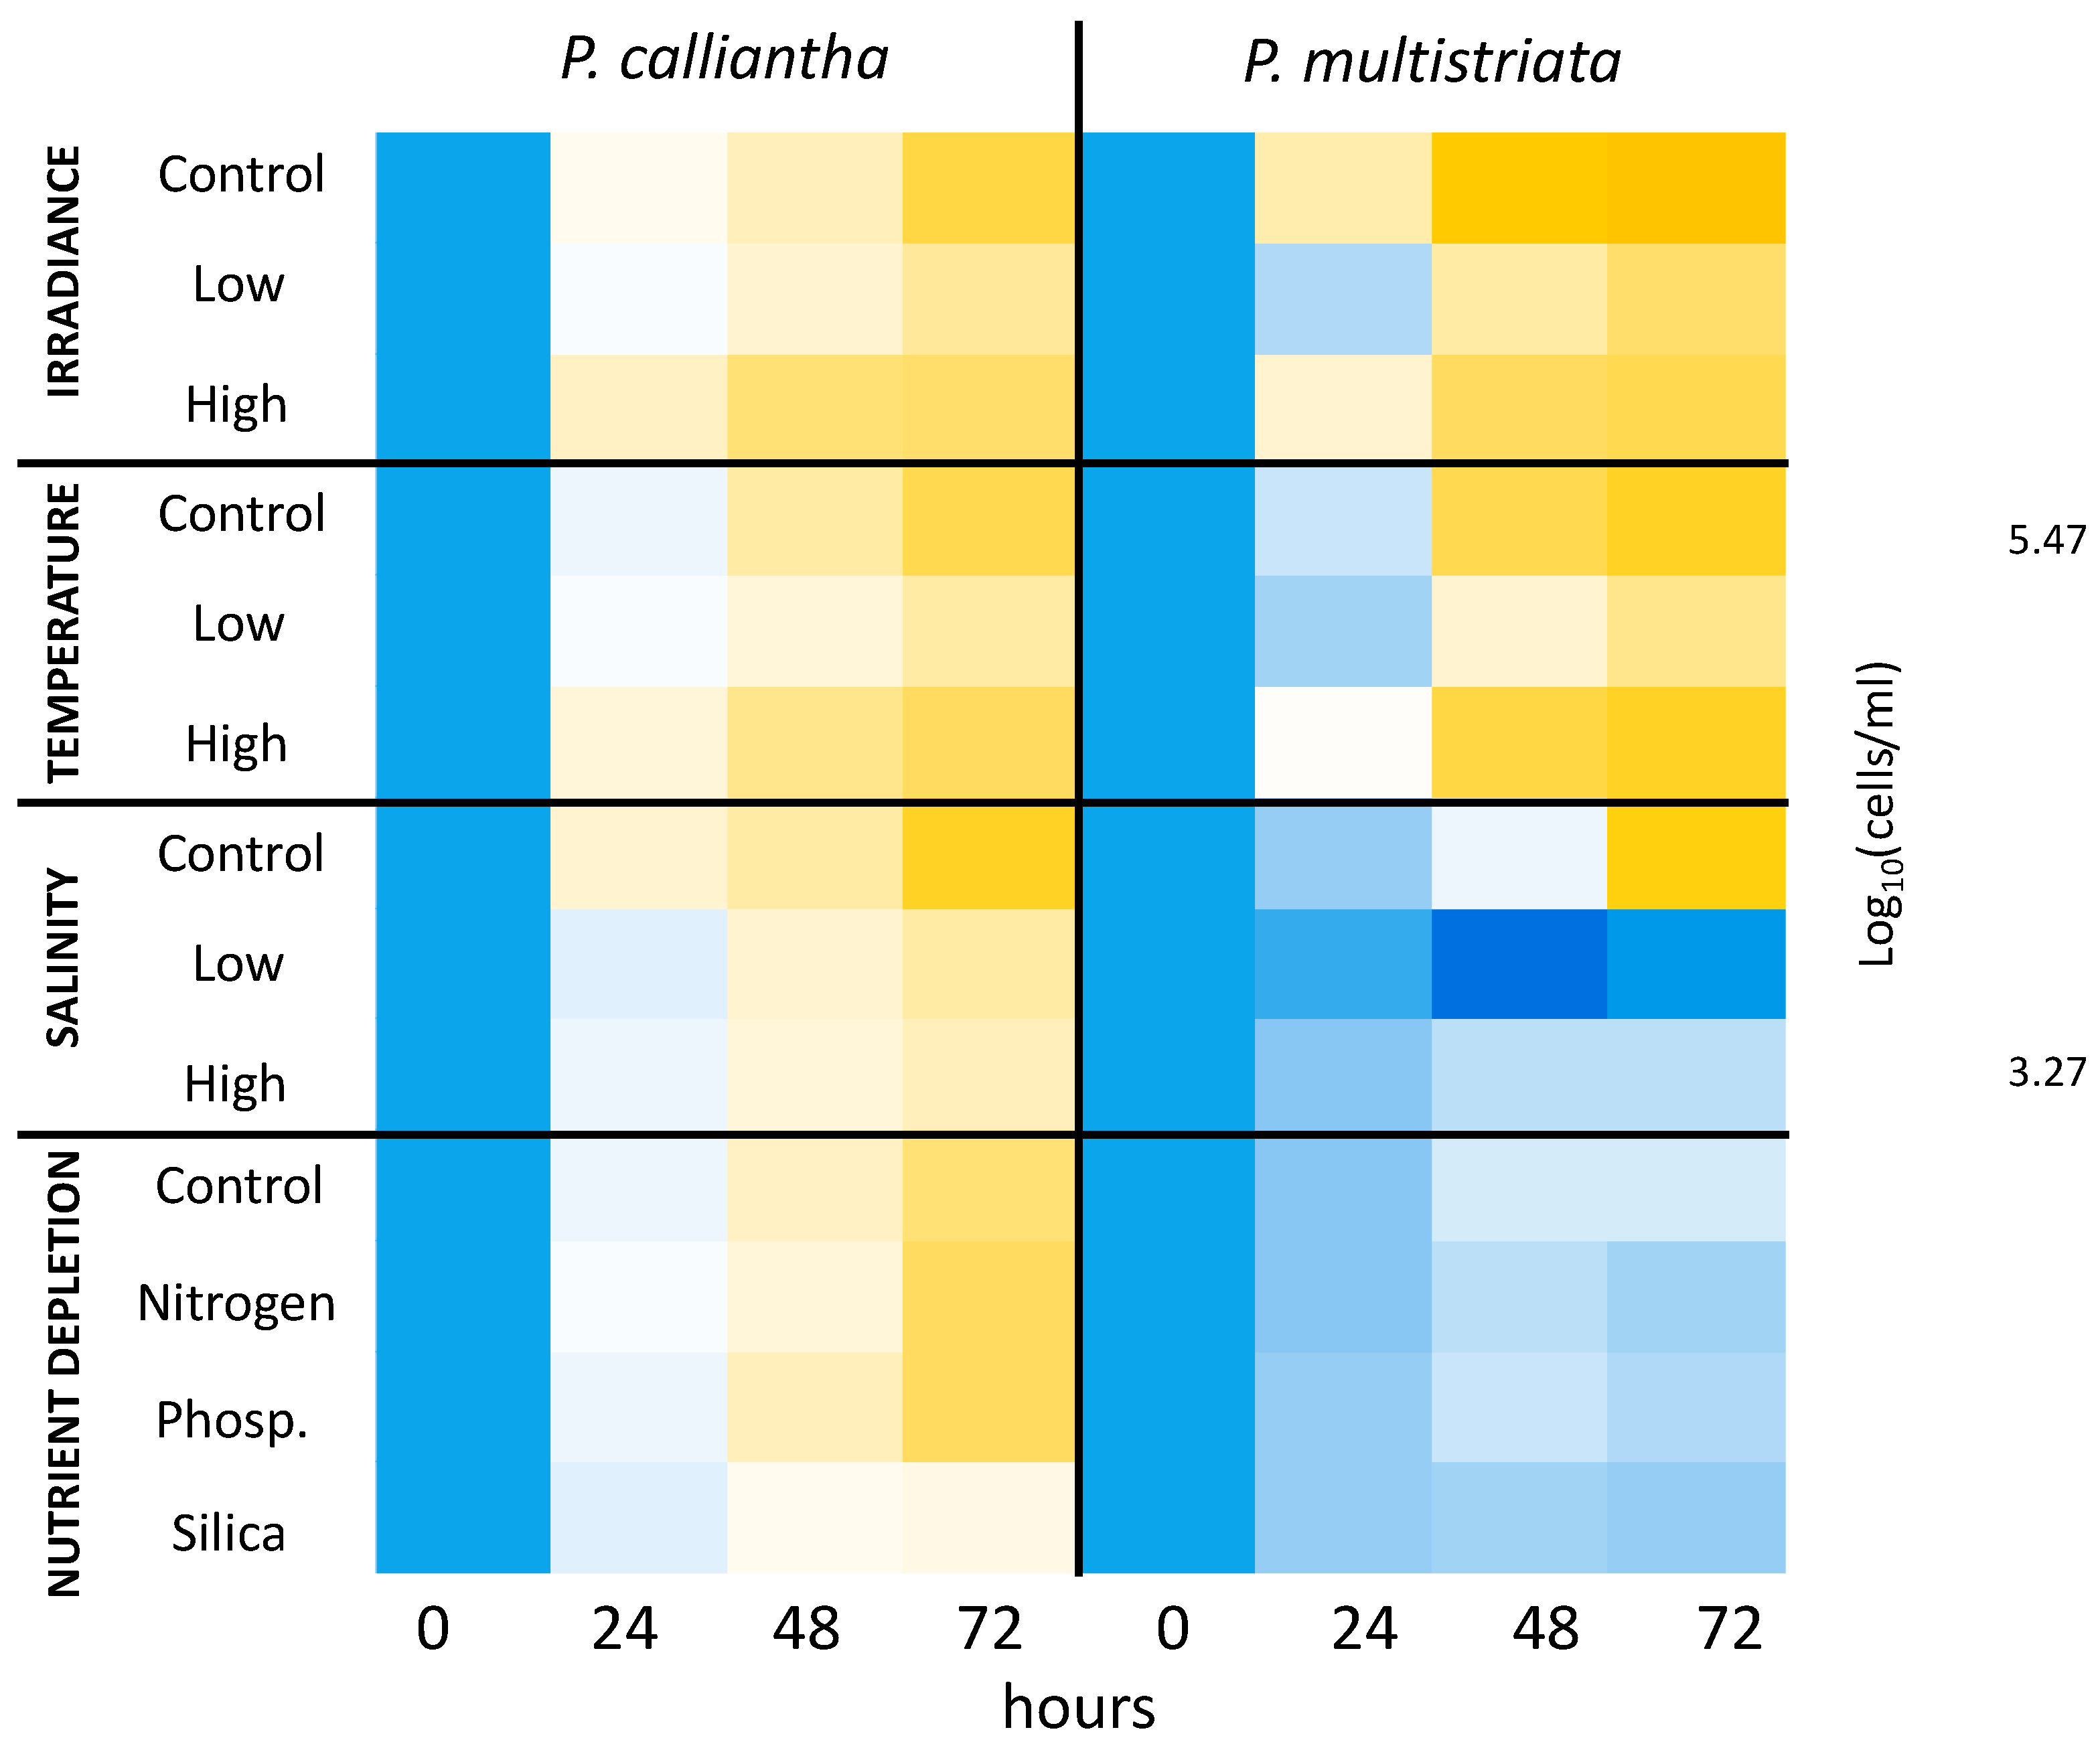
3. Results
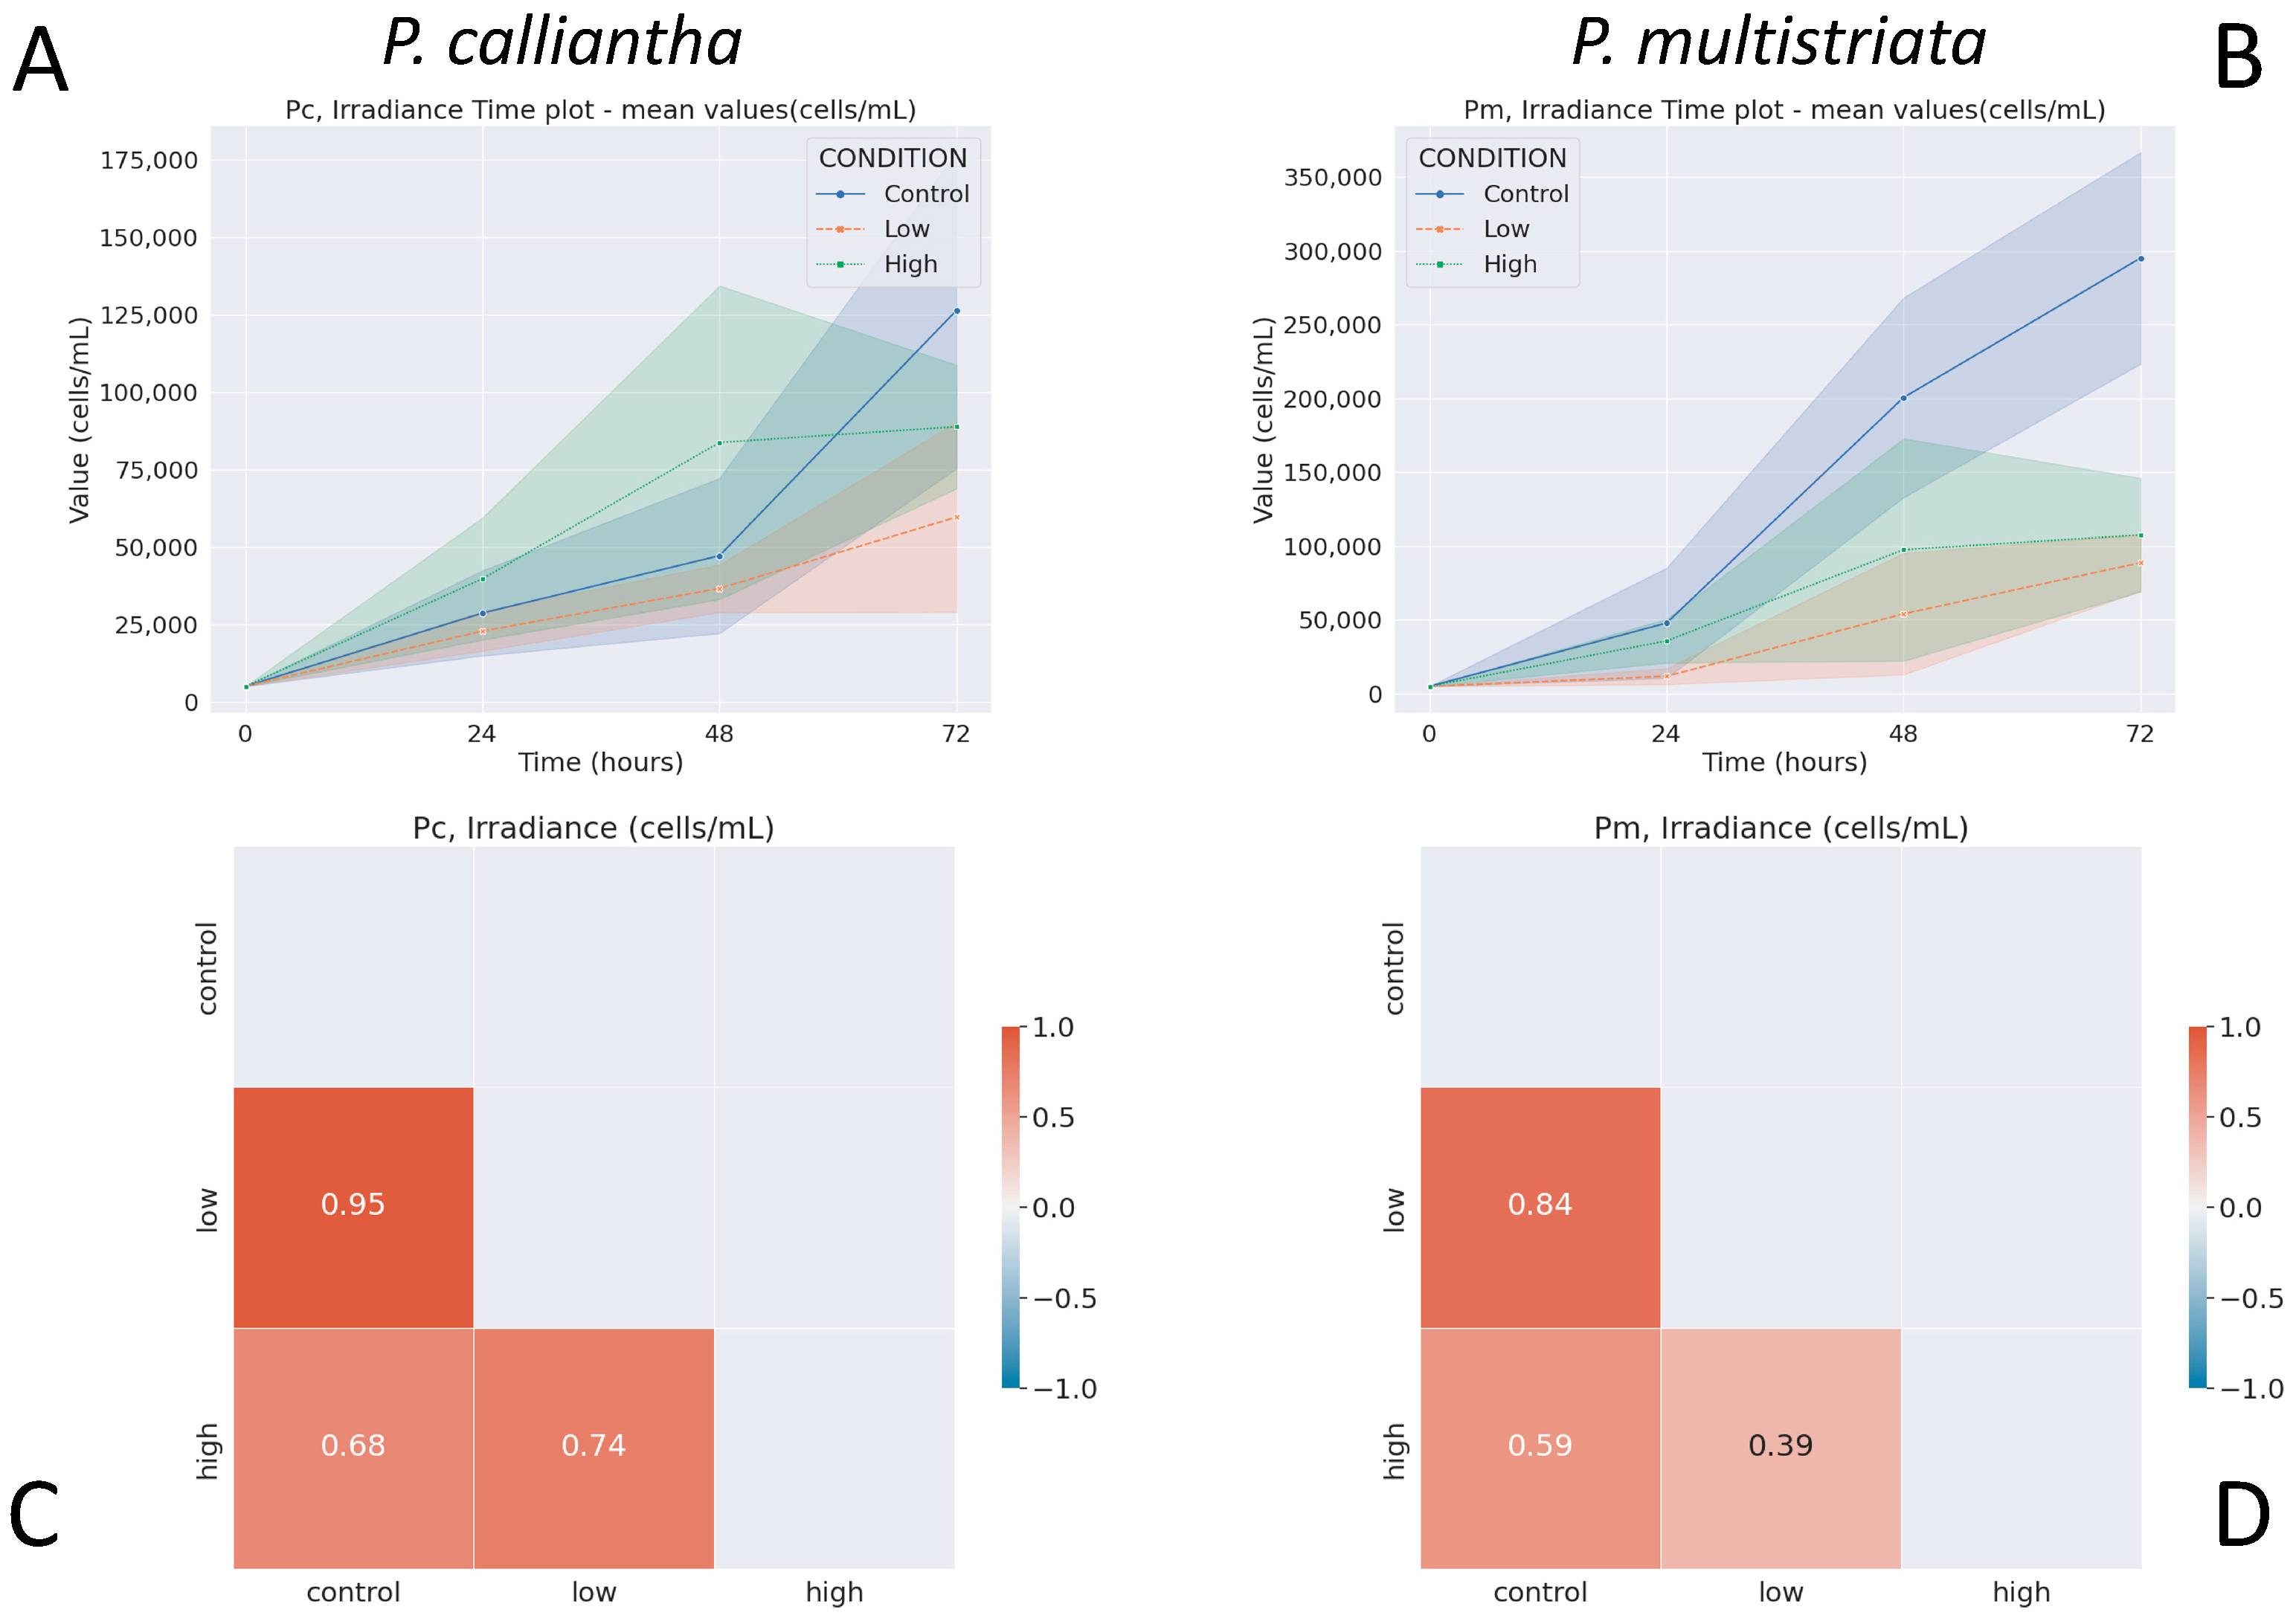
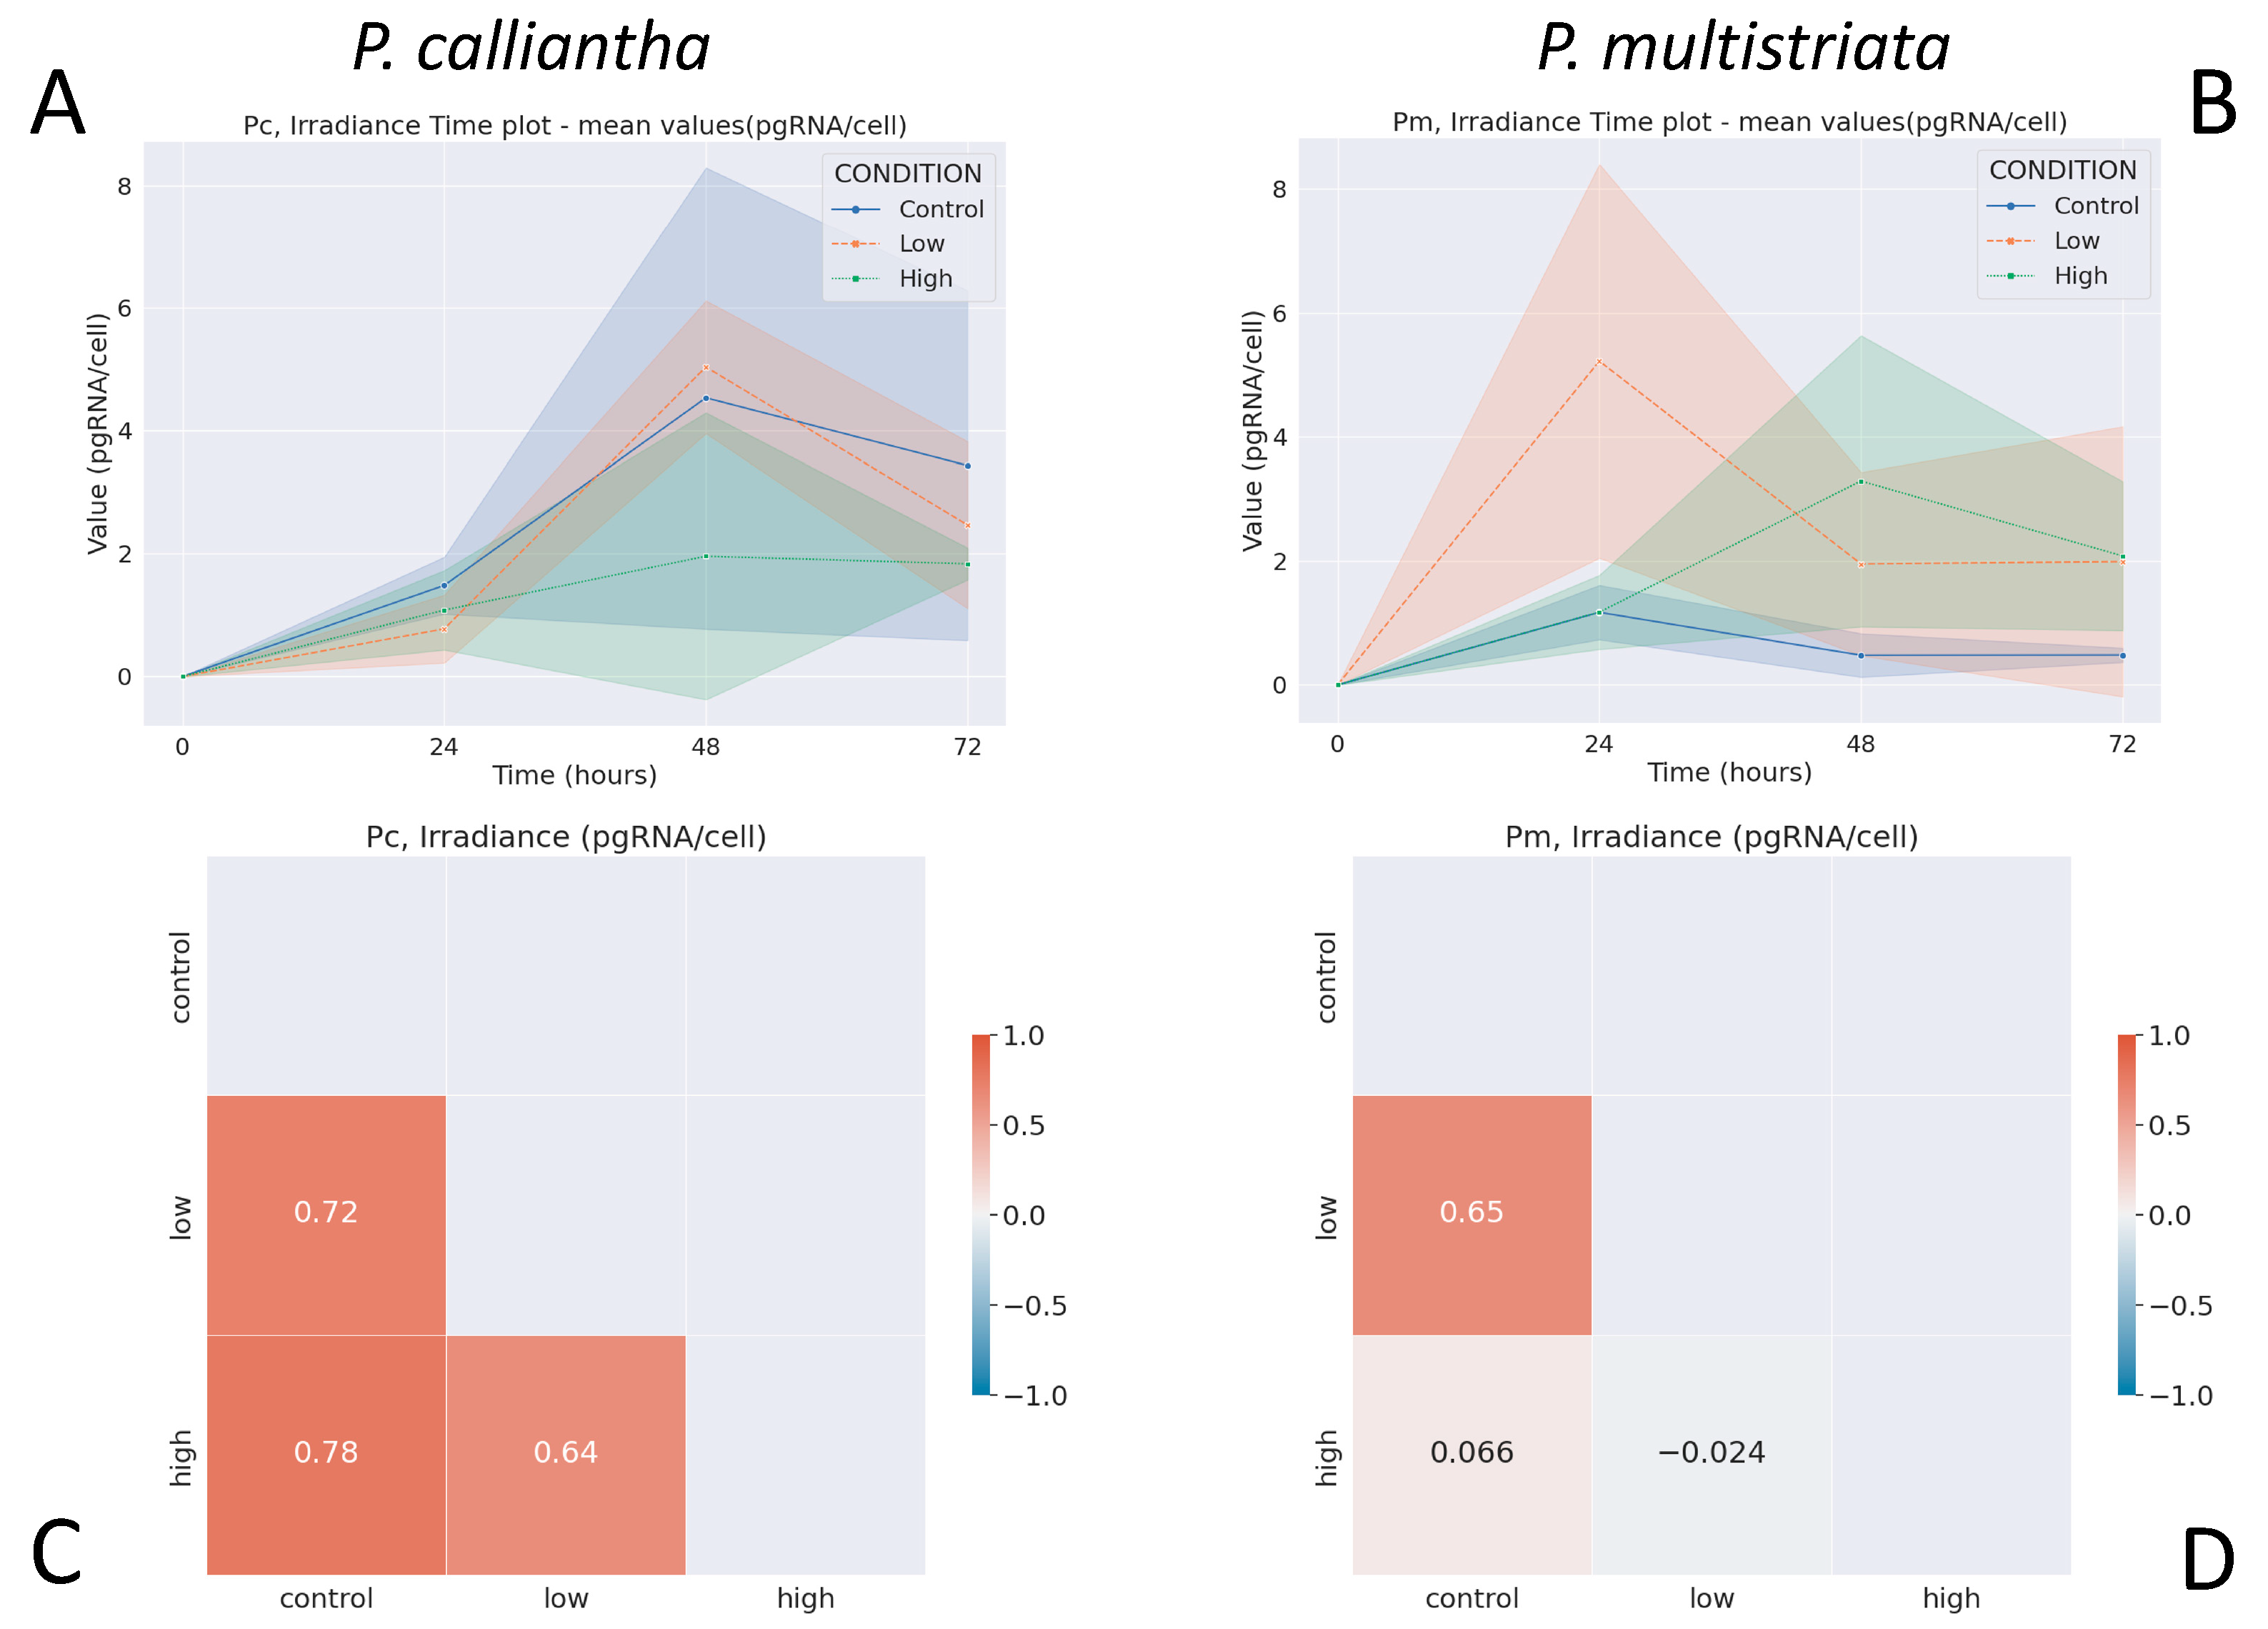
3.1. Irradiance
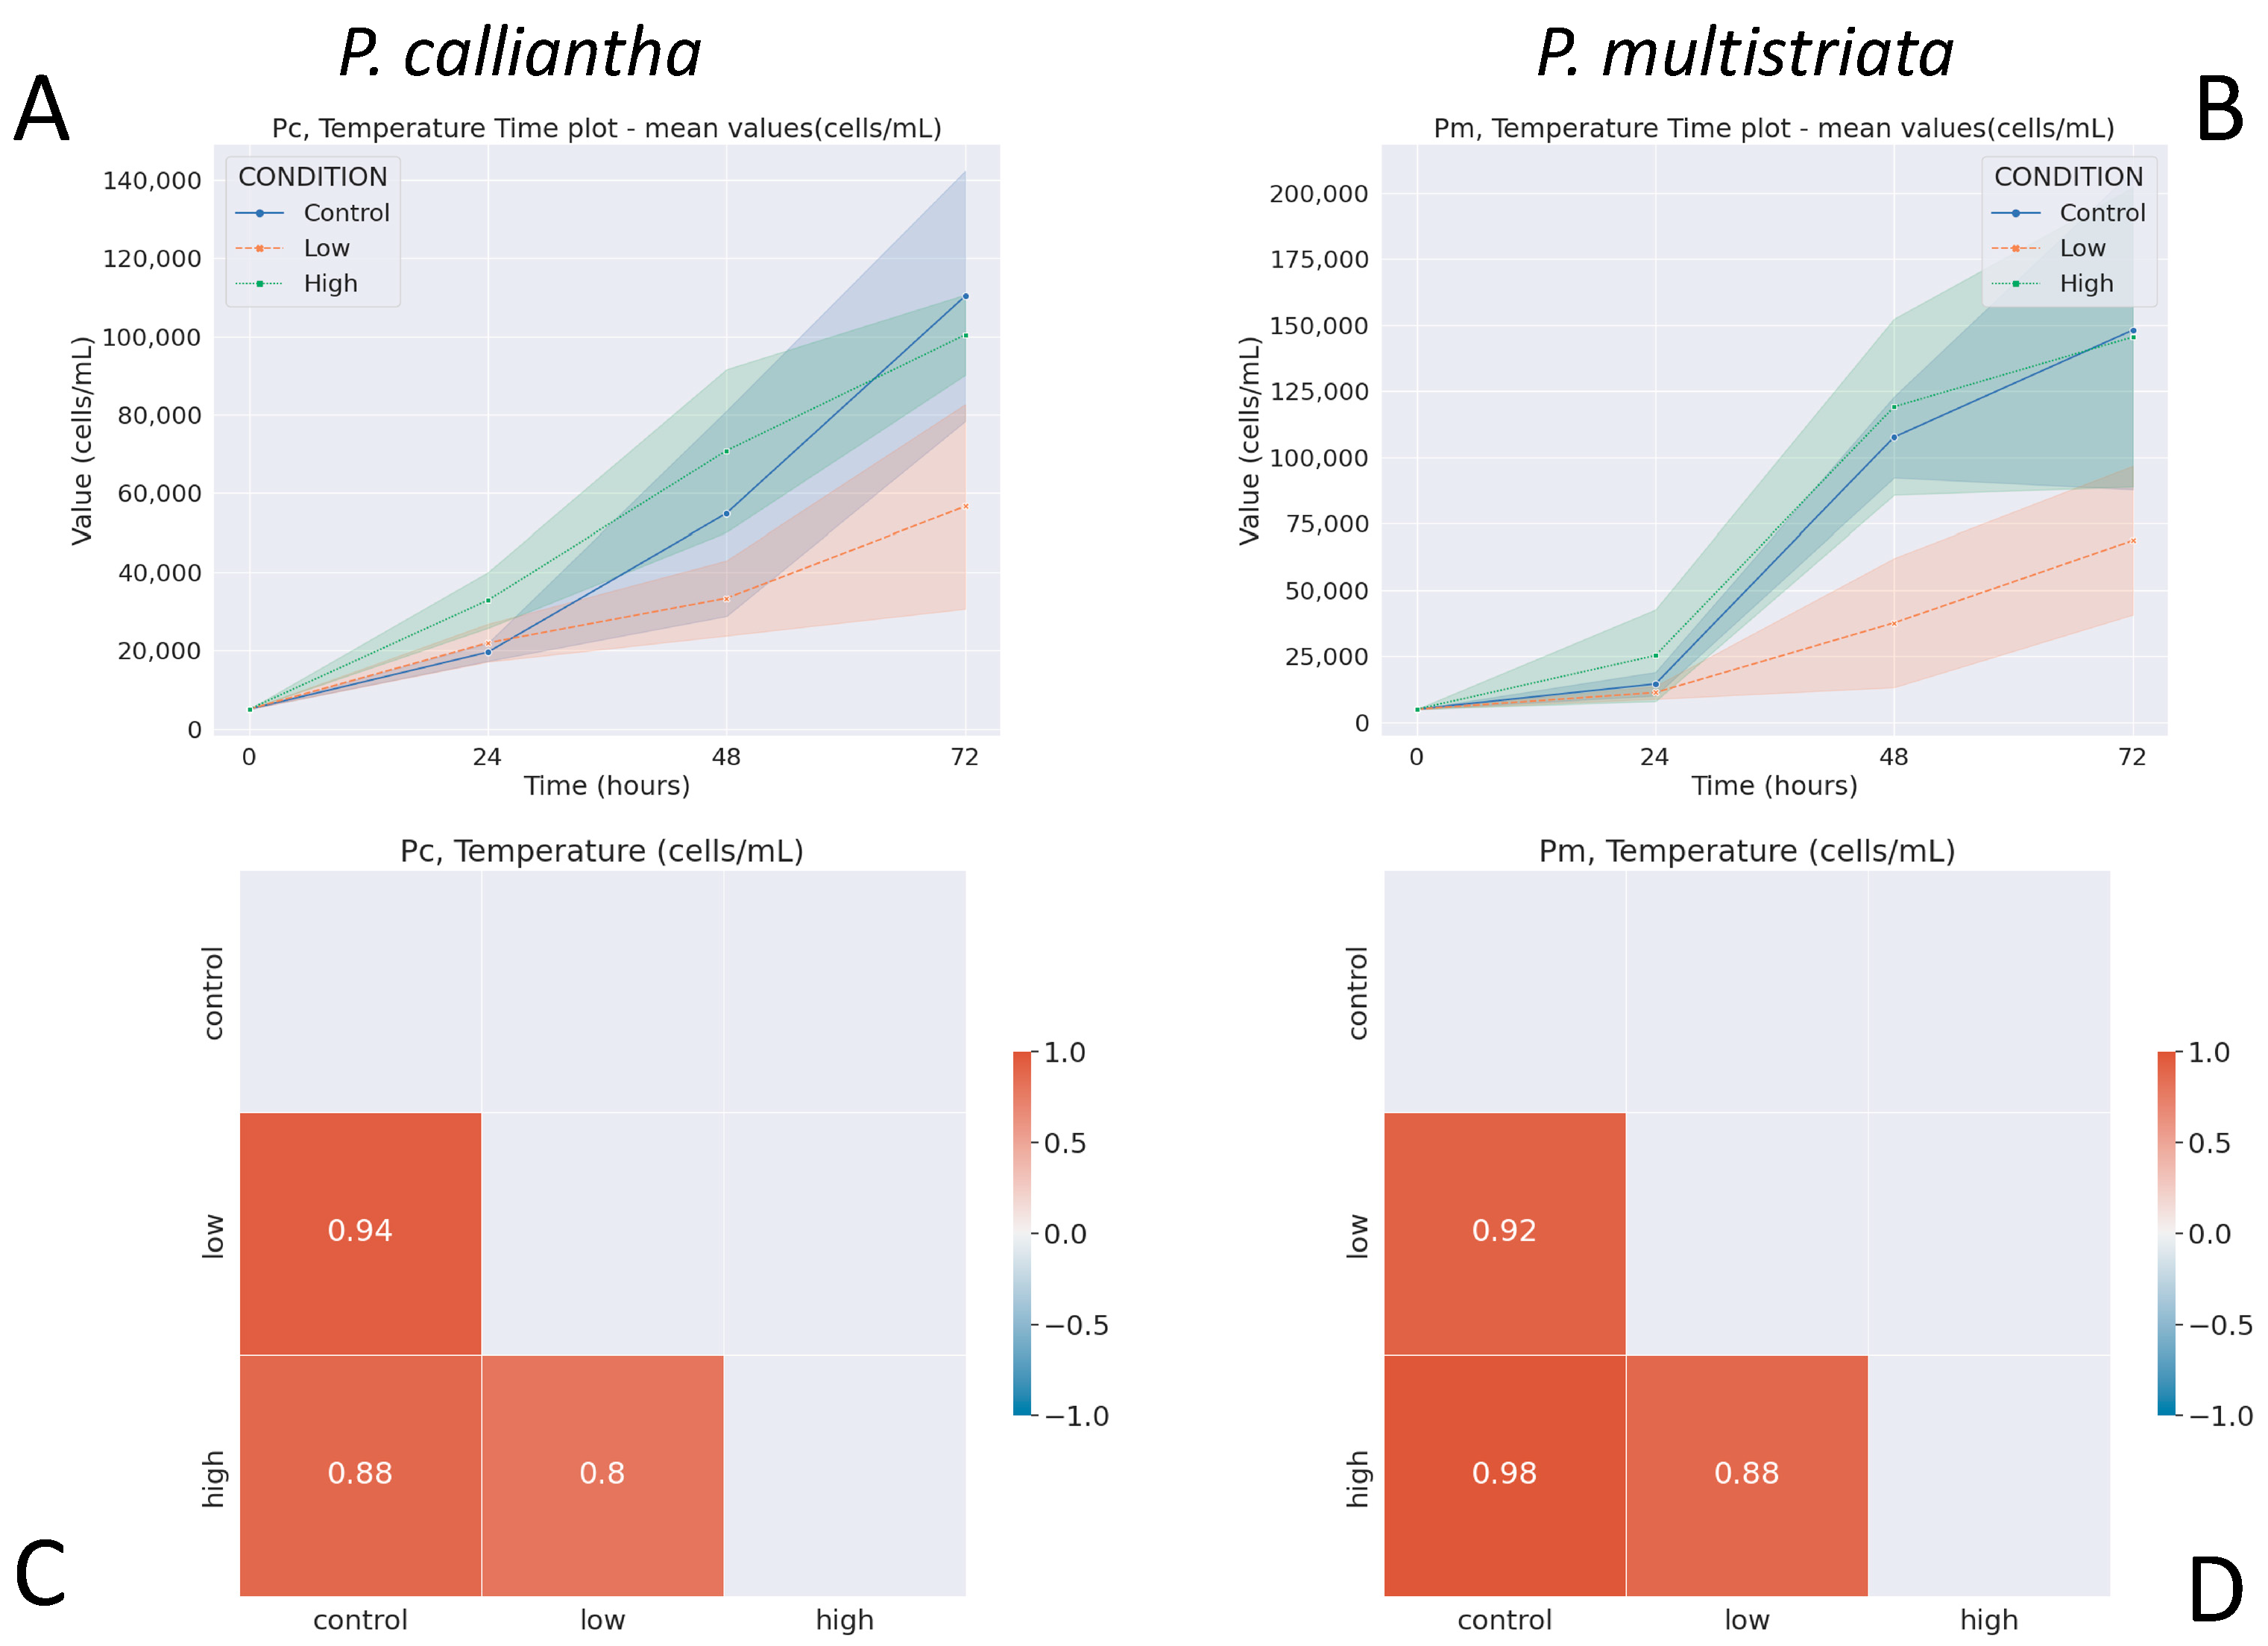
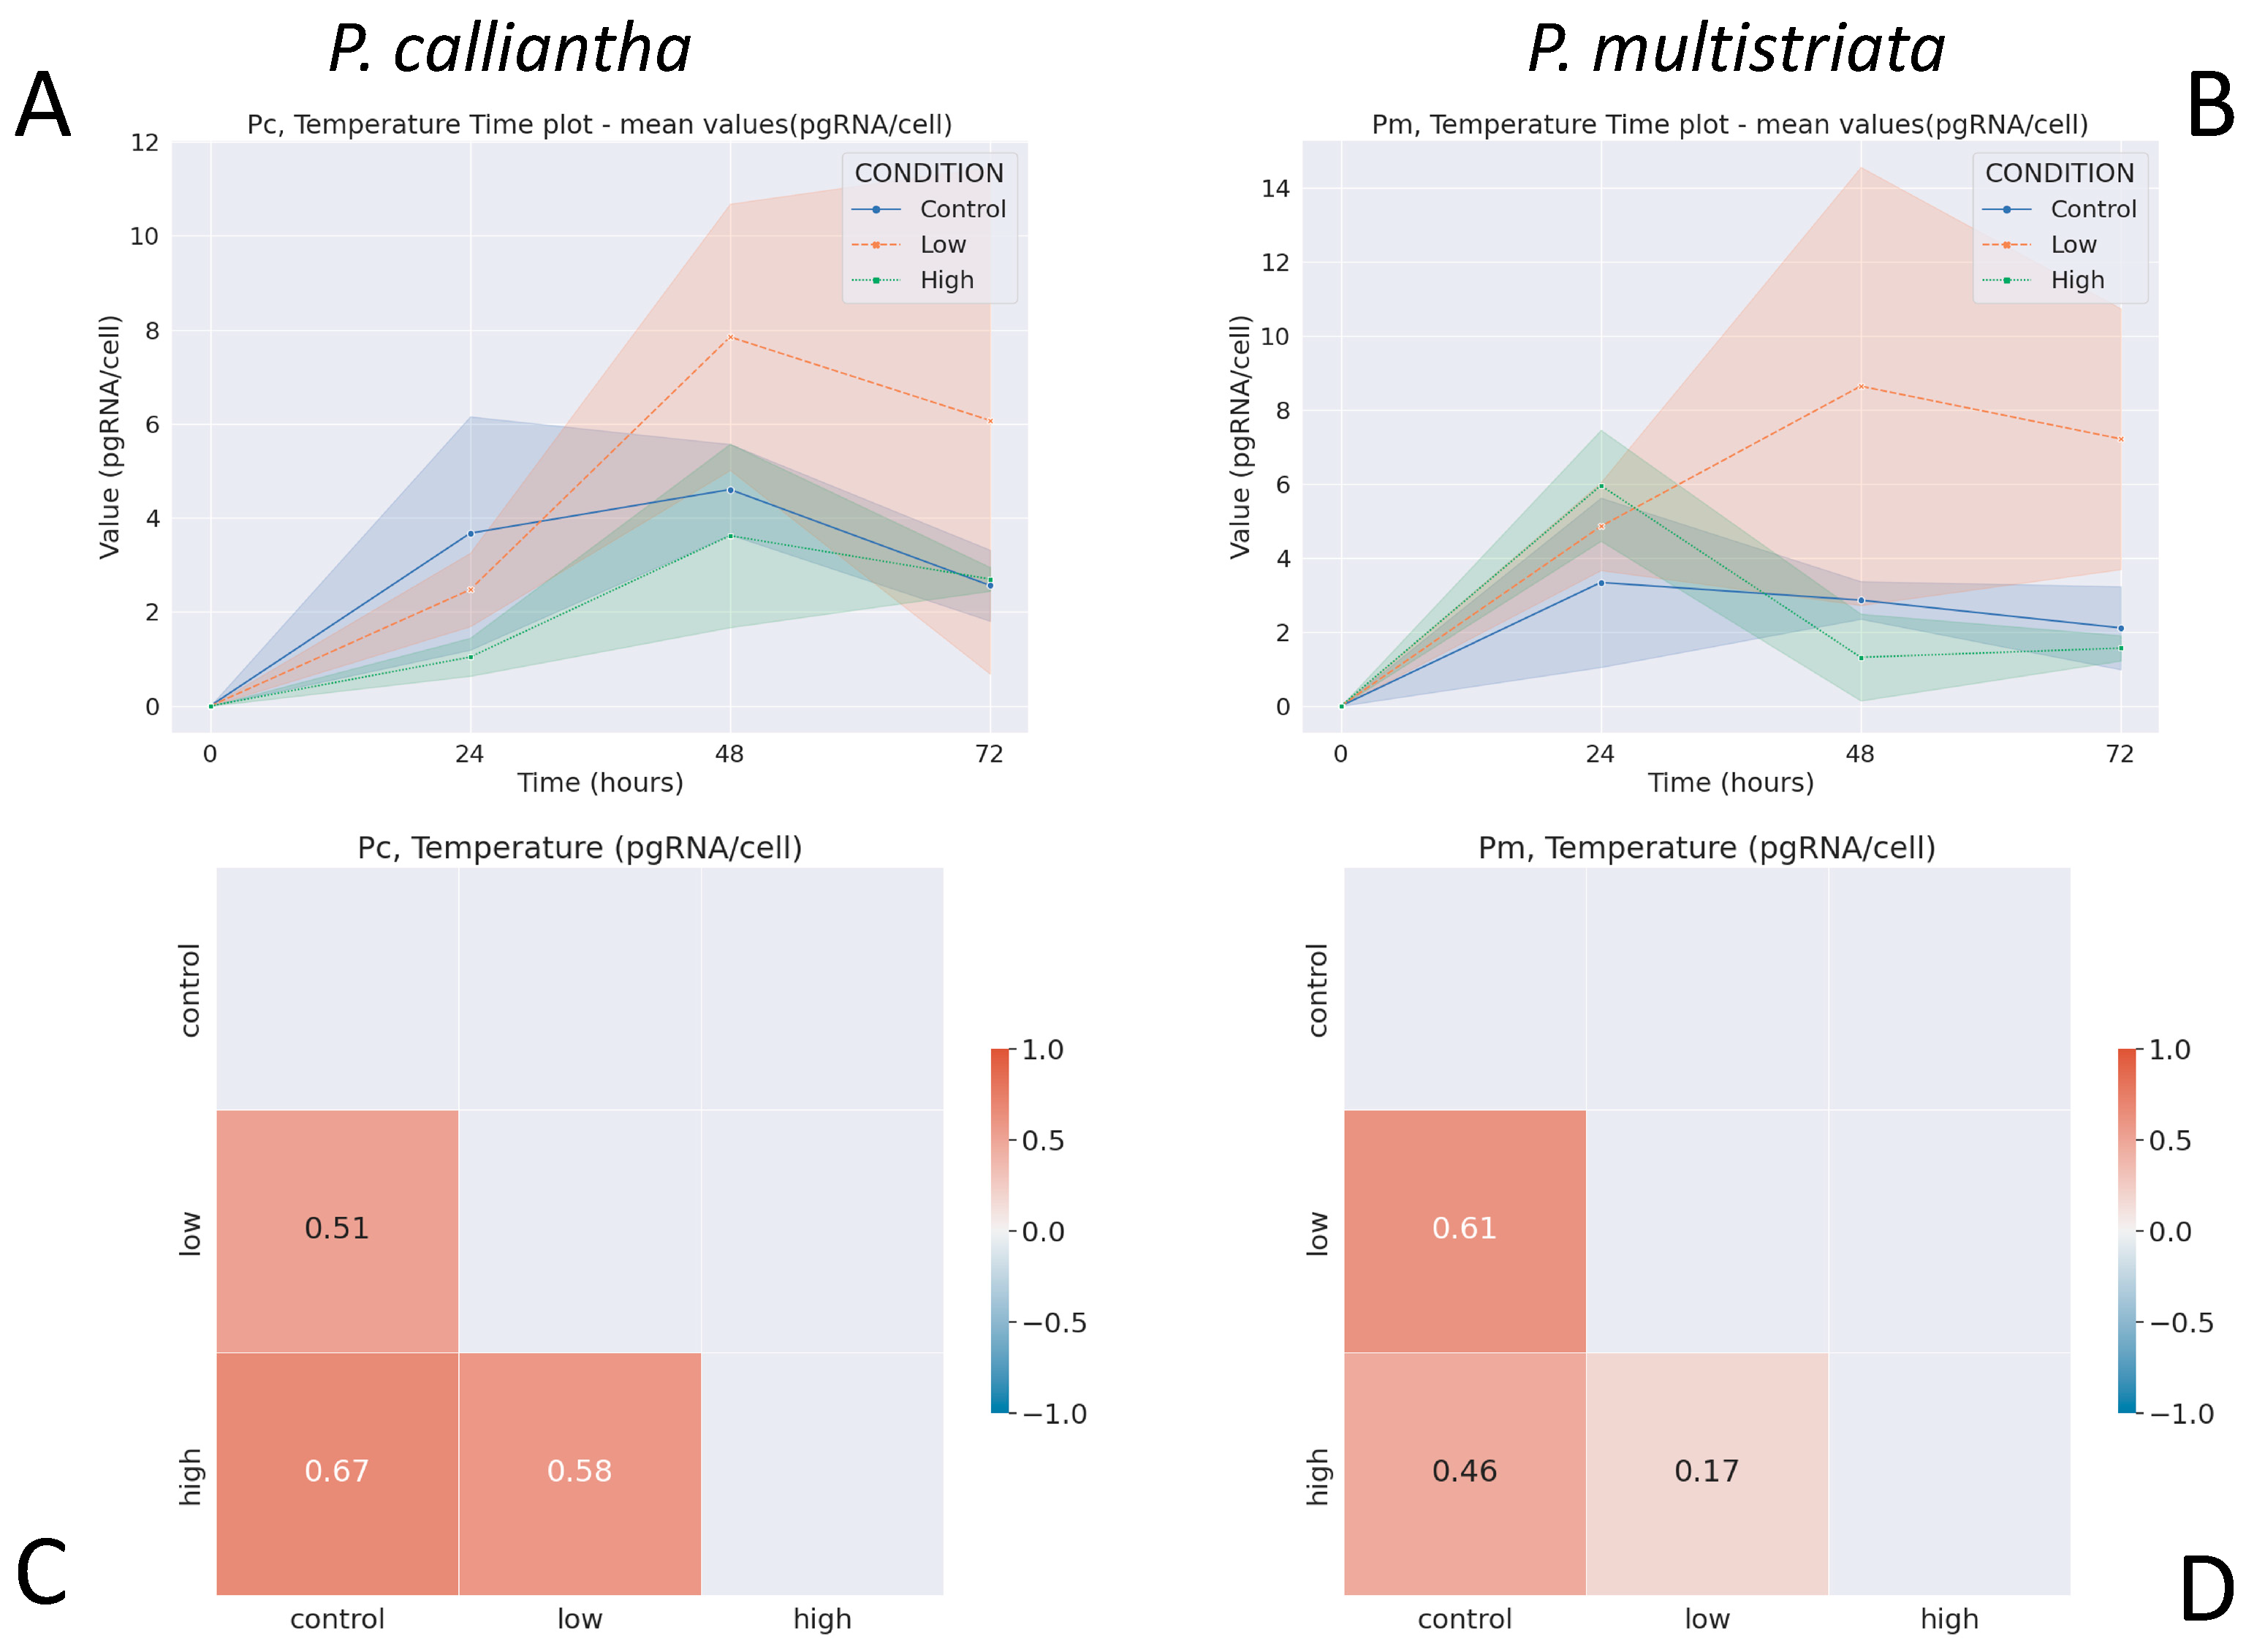
3.2. Temperature
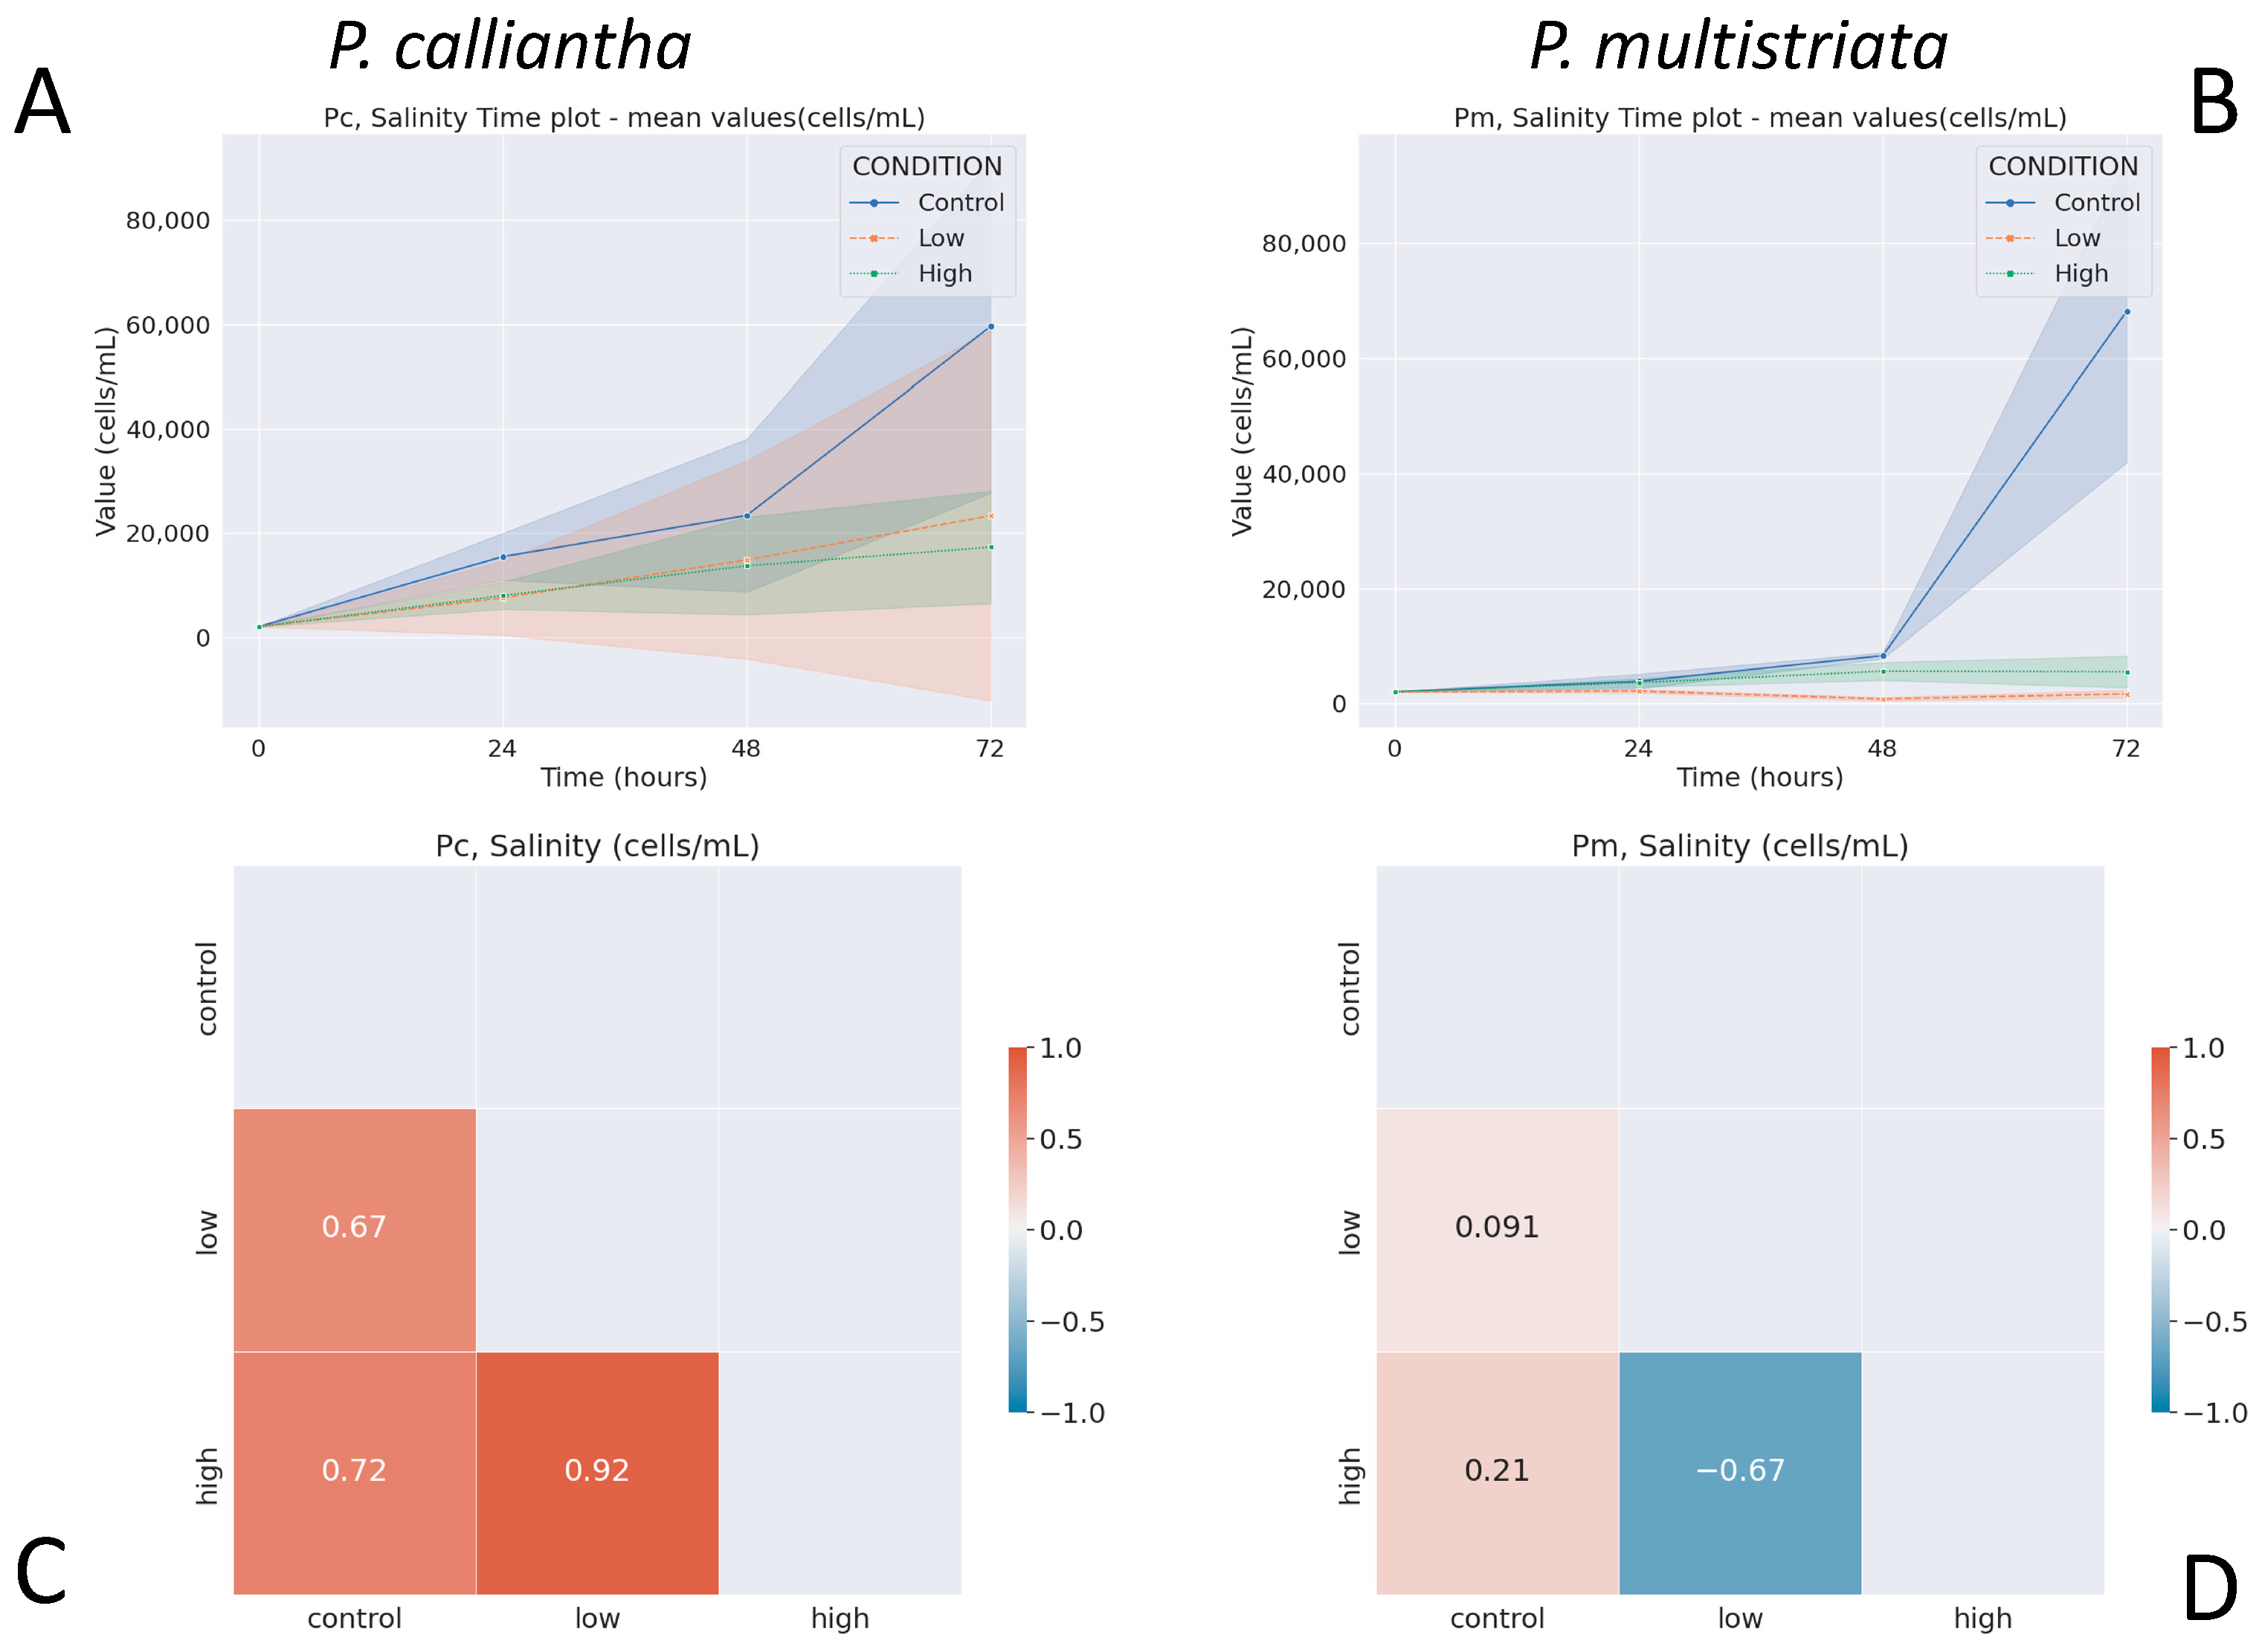
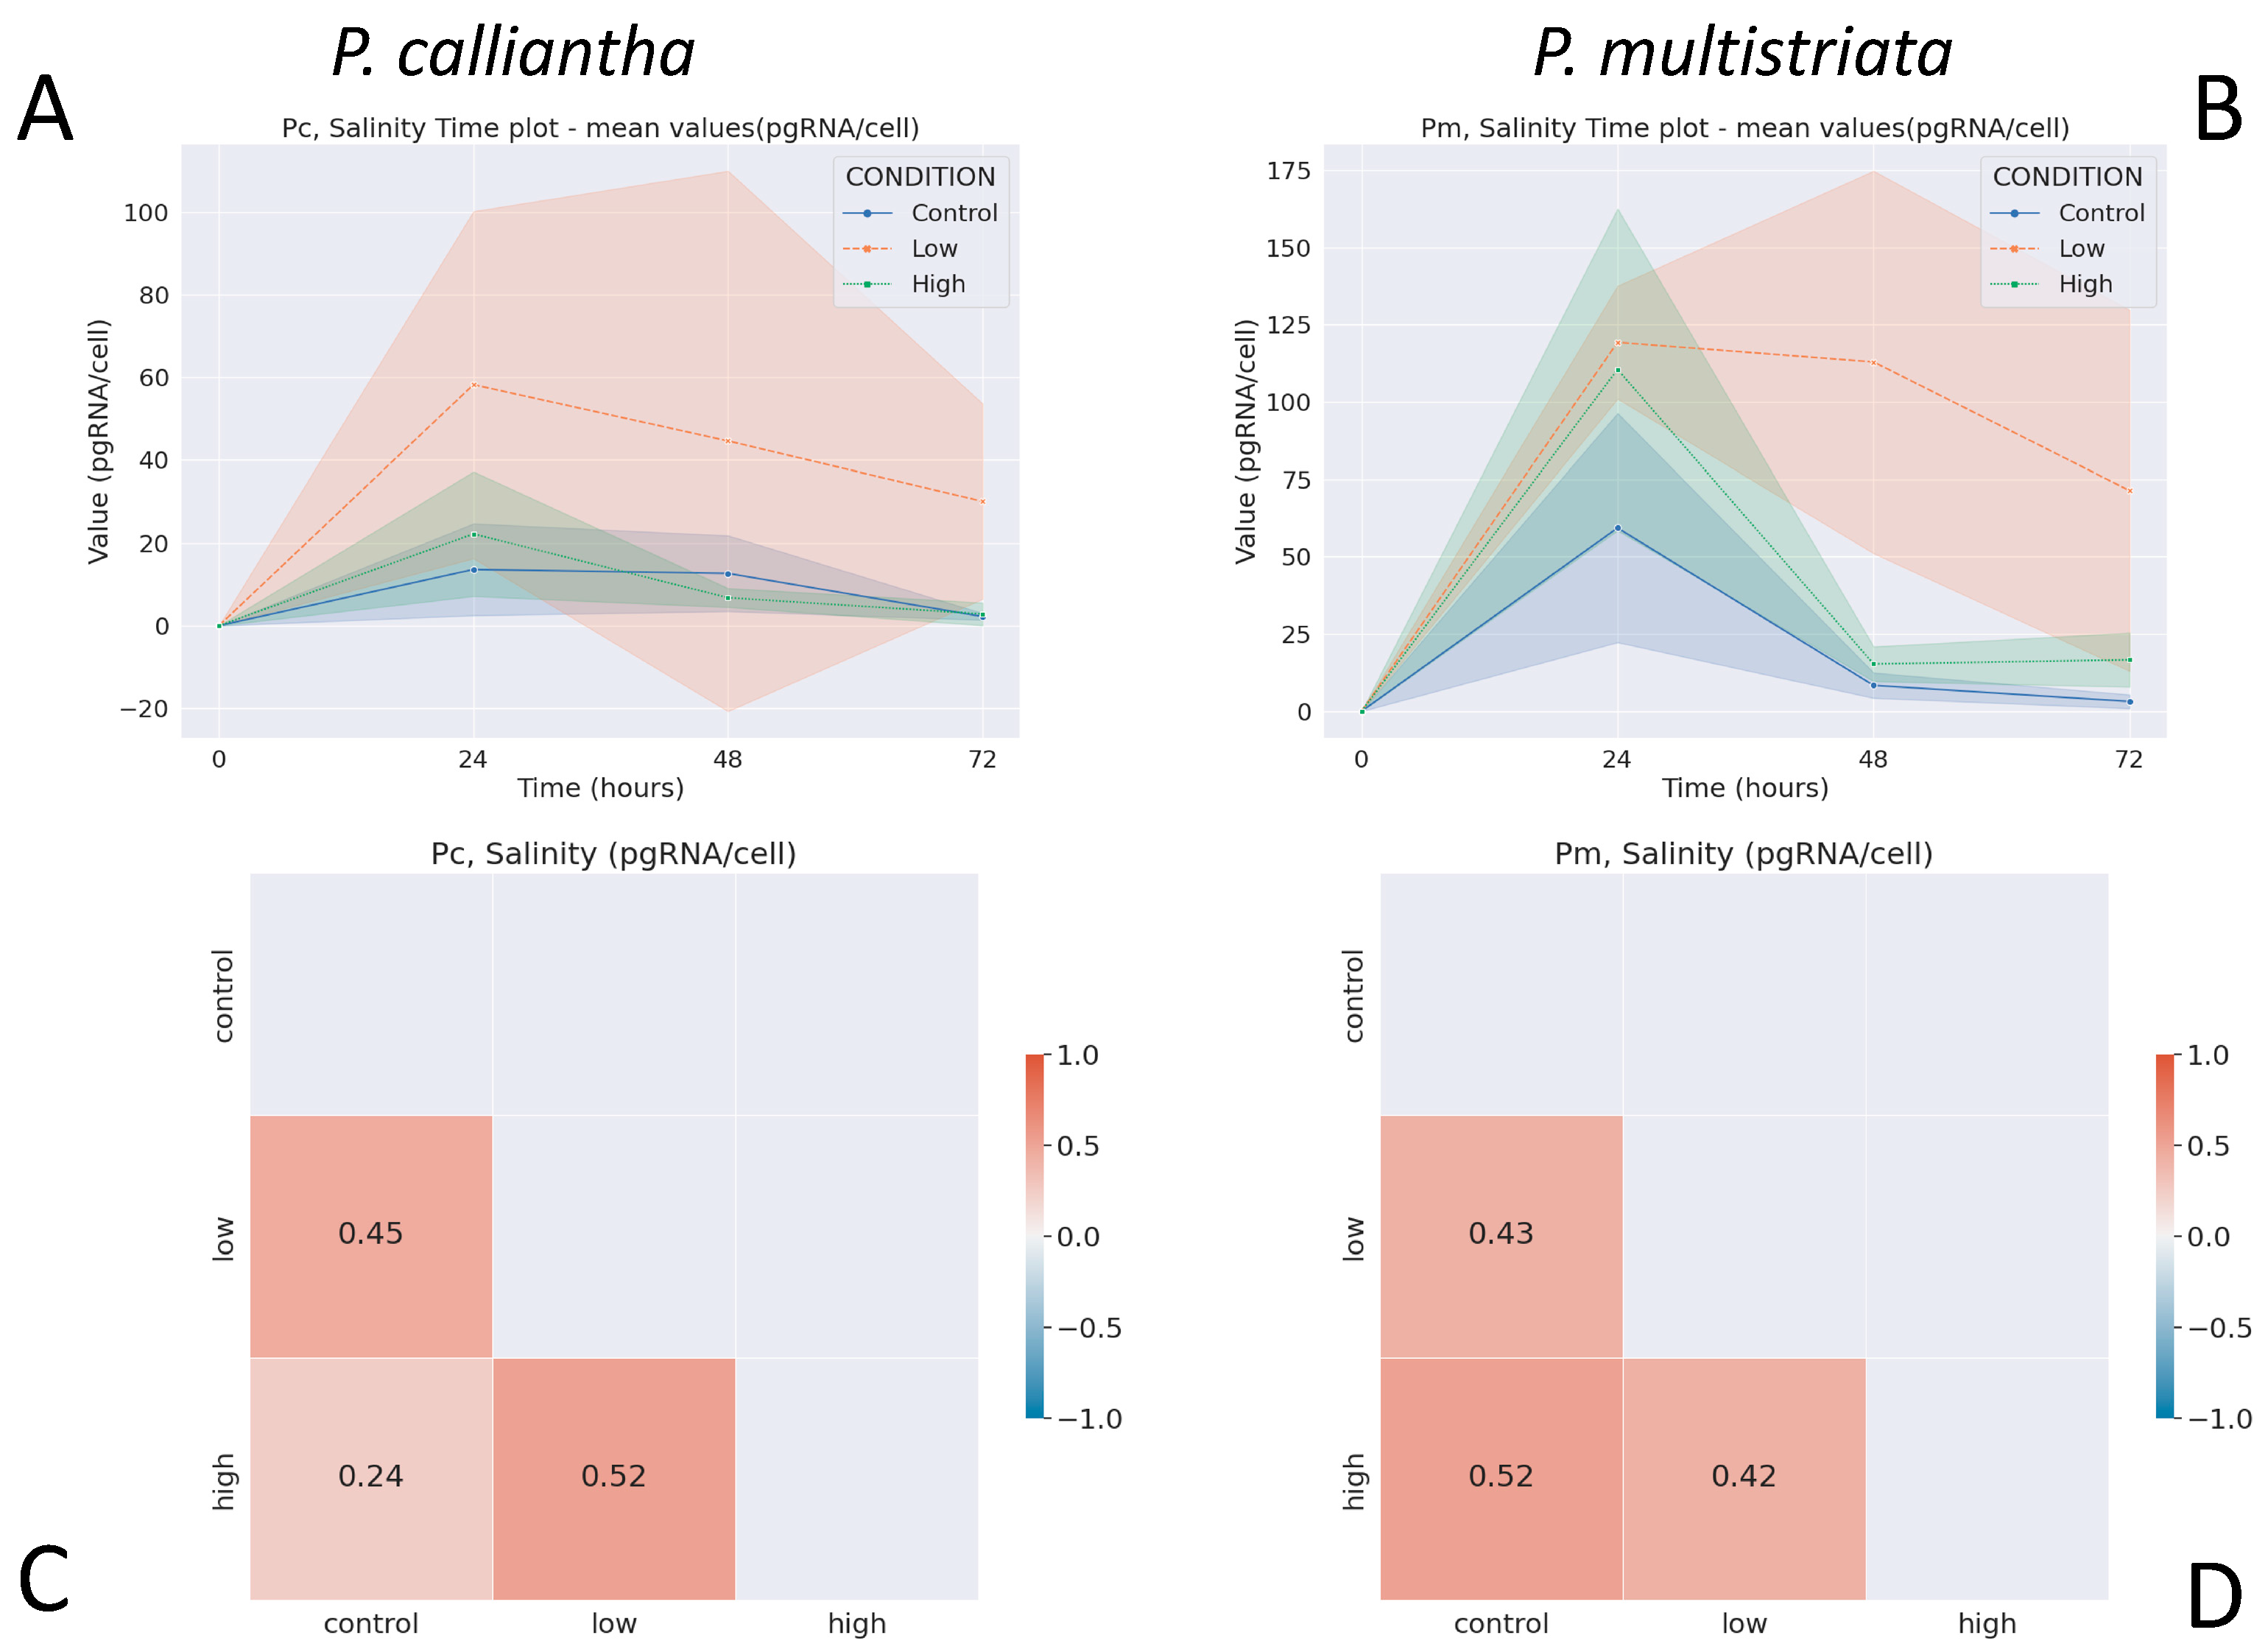
3.3. Salinity
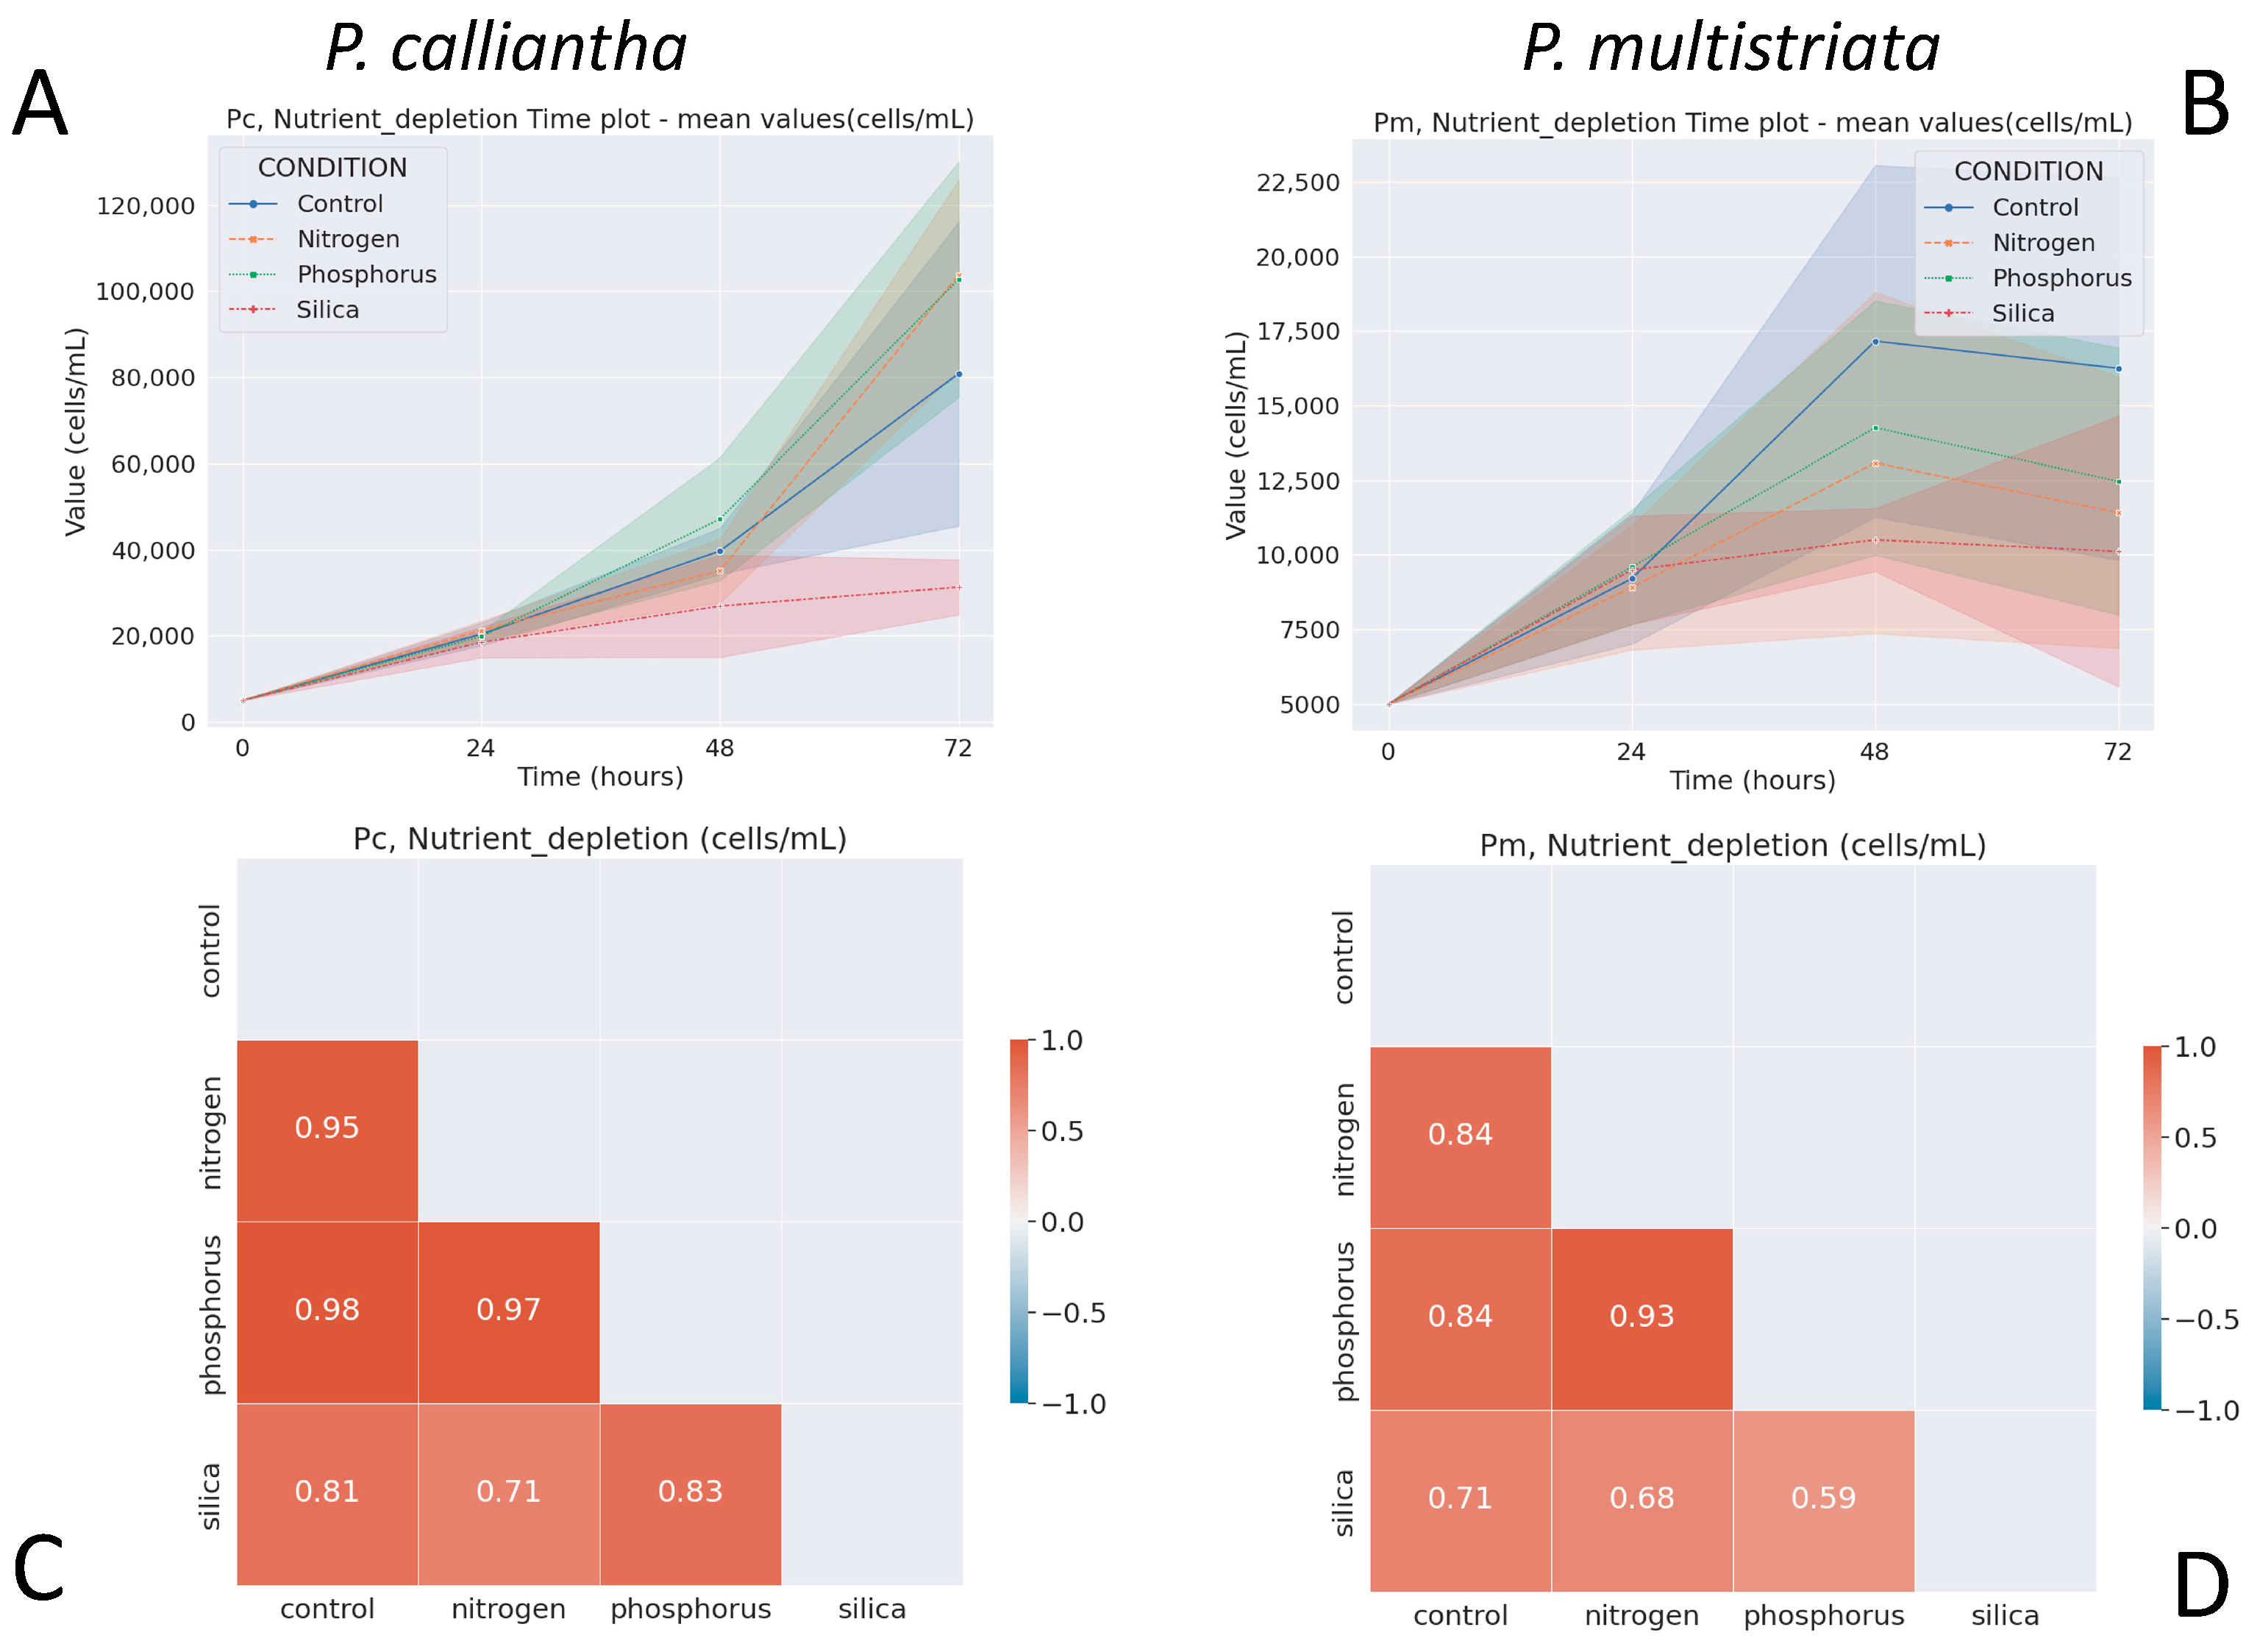
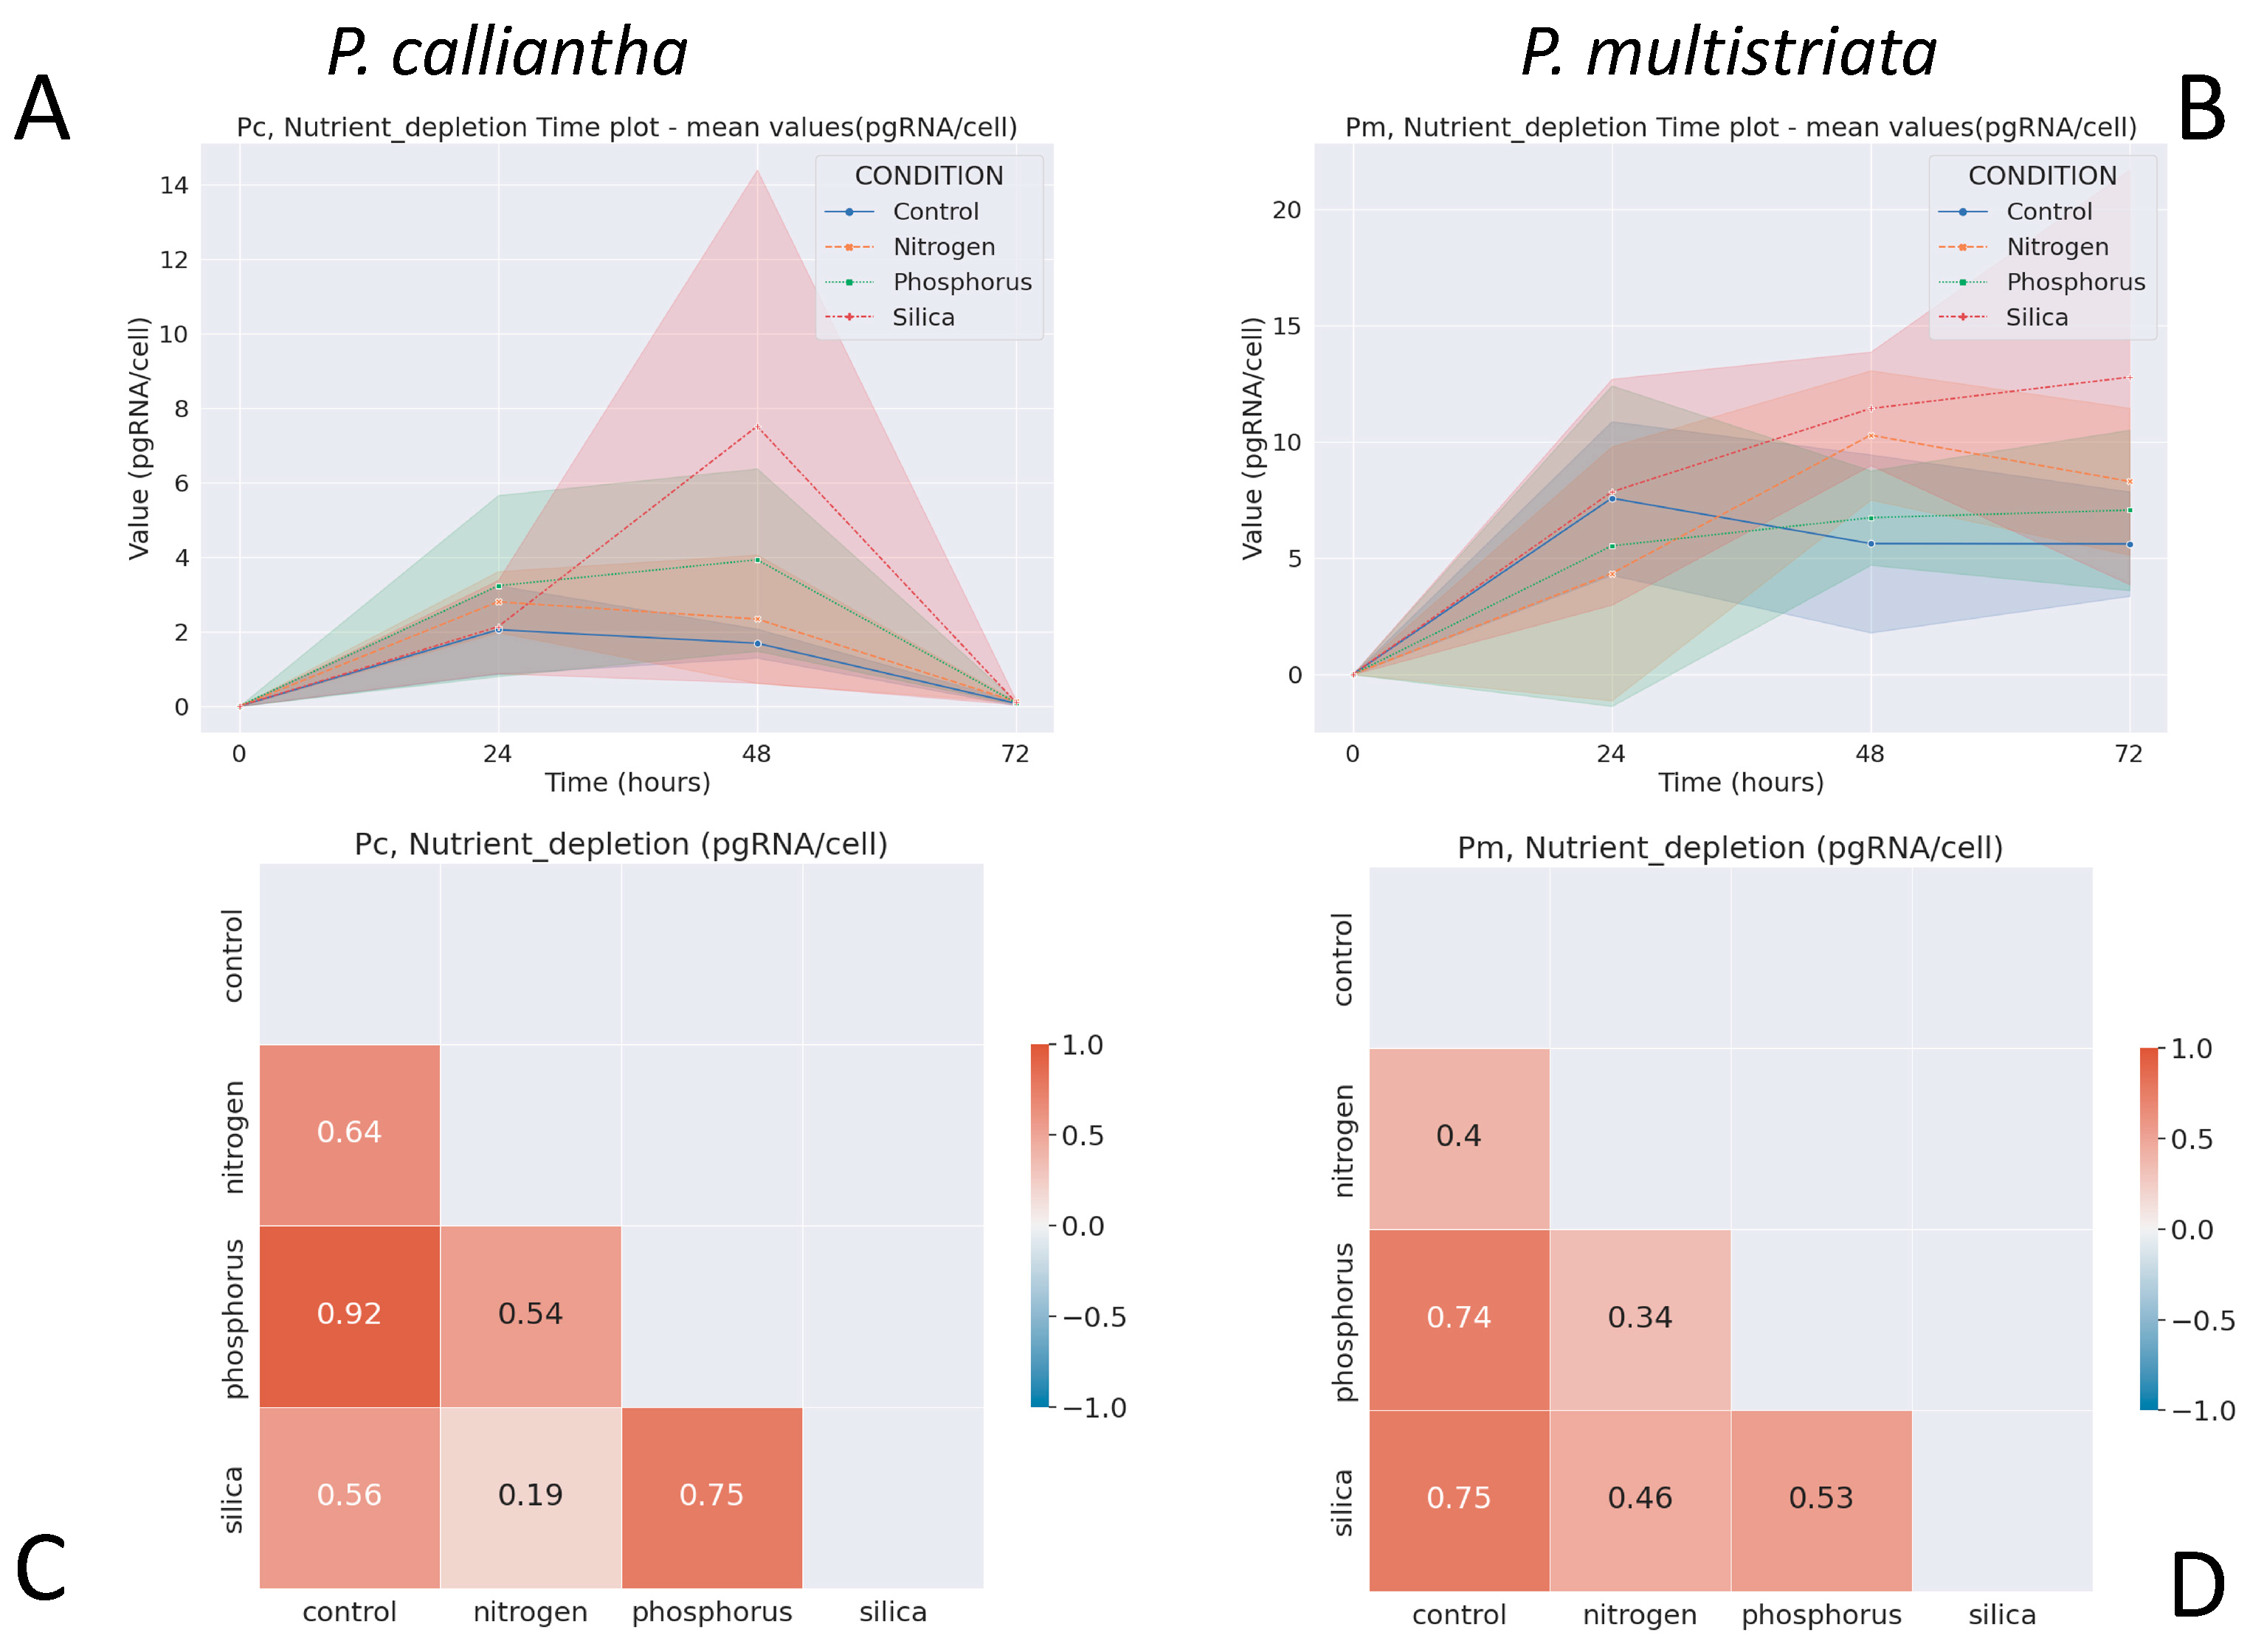
3.4. Nutrient Depletion
4. Discussion
5. Conclusions
Supplementary Materials
Author Contributions
Funding
Institutional Review Board Statement
Informed Consent Statement
Acknowledgments
Conflicts of Interest
References
- Kaparapu, J. Application of Microalgae in Aquaculture. Phykos 2008, 48, 21–26. [Google Scholar]
- Fernández-Rodríguez, M.J.; Hidalgo-Lara, C.; Jiménez-Rodríguez, A.; Serrano, L. Bloom-Forming Microalgae in High-Species Phytoplankton Assemblages Under Light-Fluctuating and Low Phosphate Conditions. Estuaries Coasts 2015, 38, 1642–1655. [Google Scholar] [CrossRef]
- Watson, S.B.; Whitton, B.A.; Higgins, S.N.; Paerl, H.W.; Brooks, B.W.; Wehr, J.D. Harmful Algal Blooms. In Freshwater Algae of North America; Wehr, J.D., Sheath, R.G., Kociolek, J.P., Eds.; Academic Press: Boston, MA, USA, 2015; pp. 873–920. [Google Scholar]
- Masó, M.; Garcés, E. Harmful microalgae blooms (HAB); problematic and conditions that induce them. Mar Pollut. Bull. 2006, 53, 620–630. [Google Scholar] [CrossRef] [PubMed]
- Pulido, O.M. Domoic acid toxicologic pathology: A review. Mar. Drugs. 2008, 6, 180–219. [Google Scholar] [CrossRef]
- Bates, S.S.; Trainer, V.L. The Ecology of Harmful Diatoms. In Ecology of Harmful Algae; Granéli, E., Turner, J.T., Eds.; Springer: Berlin/Heidelberg, Germany, 2006; pp. 81–93. [Google Scholar]
- Trainer, V.L.; Hickey, B.M.; Bates, S.S. (Eds.) Toxic Diatoms; Elsevier: New York, NY, USA, 2008; pp. 219–239. [Google Scholar]
- Stocker, T.F.; Qin, D.; Plattner, G.K.; Alexander, L.V.; Allen, S.K.; Bindoff, N.L.; Bréon, F.M.; Church, J.A.; Cubasch, U.; Emori, S.; et al. Technical Summary. In Climate Change 2013—The Physical Science Basis: Working Group I Contribution to the Fifth Assessment Report of the Intergovernmental Panel on Climate Change; Intergovernmental Panel on Climate, Ed.; Cambridge University Press: Cambridge, UK, 2014; pp. 31–116. [Google Scholar]
- Dashkova, V.; Malashenkov, D.V.; Baishulakova, A.; Davidson, T.A.; Vorobjev, I.A.; Jeppesen, E.; Barteneva, N.S. Changes in Phytoplankton Community Composition and Phytoplankton Cell Size in Response to Nitrogen Availability Depend on Temperature. Microorganisms 2022, 10, 1322. [Google Scholar] [CrossRef] [PubMed]
- Anderson, D.M.; Glibert, P.M.; Burkholder, J.M. Harmful algal blooms and eutrophication: Nutrient sources, composition, and consequences. Estuaries 2002, 25, 704–726. [Google Scholar] [CrossRef]
- Glibert, P.M.; Allen, J.I.; Bouwman, A.F.; Brown, C.W.; Flynn, K.J.; Lewitus, A.J.; Madden, C.J. Modeling of HABs and eutrophication: Status, advances, challenges. J. Mar. Syst. 2010, 83, 262–275. [Google Scholar] [CrossRef]
- Glibert, P.M.; Seitzinger, S.; Heil, C.A.; Burkholder, J.M.; Parrow, M.W.; Codispoti, L.A.; Kelly, V. The role of eutrophication in the global proliferation of harmful algal blooms new perspectives and new approaches. Oceanography 2005, 18, 198–209. [Google Scholar] [CrossRef]
- McCoy, G.R.; Touzet, N.; Fleming, G.T.; Raine, R. An evaluation of the applicability of microarrays for monitoring toxic algae in Irish coastal waters. Environ. Sci. Pollut. Res. 2013, 20, 6751–6764. [Google Scholar] [CrossRef]
- Trainer, V.L.; Bates, S.S.; Lundholm, N.; Thessen, A.E.; Cochlan, W.P.; Adams, N.G.; Trick, C.G. Pseudo-nitzschia physiological ecology, phylogeny, toxicity, monitoring and impacts on ecosystem health. Harmful Algae 2012, 14, 271–300. [Google Scholar] [CrossRef]
- Lewis, J.; Medlin, L.; Raine, R. MIDTAL (Microarrays for the Detection of Toxic Algae): A Protocol for a Successful Microarray Hybridisation and Analysis. Phytotaxa 2013, 127, 201–210. [Google Scholar]
- McCoy, G.R.; Kegel, J.U.; Touzet, N.; Fleming, G.T.A.; Medlin, L.K.; Raine, R. An assessment of RNA content in Prymnesium parvum, Prymnesium polylepis, cf. Chattonella sp. and Karlodinium veneficum under varying environmental conditions for calibrating an RNA microarray for species detection. FEMS Microbiol. Ecol. 2014, 88, 140–159. [Google Scholar] [CrossRef]
- Kegel, J.U.; Del Amo, Y.; Medlin, L.K. Introduction to project MIDTAL: Its methods and samples from Arcachon Bay, France. Environ. Sci. Pollut. Res. 2013, 20, 6690–6704. [Google Scholar] [CrossRef] [PubMed]
- Barra, L.; Ruggiero, M.V.; Sarno, D.; Montresor, M.; Kooistra, W. Strengths and weaknesses of microarray approaches to detect Pseudo-nitzschia species in the field. Environ. Sci. Pollut. Res. 2013, 20, 6705–6718. [Google Scholar] [CrossRef] [PubMed]
- Dittami, S.M.; Edvardsen, B. Culture conditions influence cellular rna content in ichthyotoxic flagellates of the genus Pseudochattonella (dictyochophyceae) 1. J. Phycol. 2012, 48, 1050–1055. [Google Scholar] [CrossRef] [PubMed]
- Kegel, J.U.; Del Amo, Y.; Costes, L.; Medlin, L.K. Testing a microarray to detect and monitor toxic microalgae in Arcachon Bay in France. Microarrays 2013, 2, 1–23. [Google Scholar] [CrossRef] [PubMed]
- Guillard, R.R. Culture of phytoplankton for feeding marine invertebrates. In Culture of Marine Invertebrate Animals; Smith, W.L., Chanley, M.H., Eds.; Springer: Boston, MA, USA, 1975; pp. 29–60. [Google Scholar]
- Van Rossum, G.; Drake, F. Python 3 Reference Manual; CreateSpace: Scotts Valley, CA, USA, 2009. [Google Scholar]
- Harris, C.R.; Millman, K.J.; Van Der Walt, S.J.; Gommers, R.; Virtanen, P.; Cournapeau, D.; Wieser, E.; Taylor, J.; Berg, S.; Smith, N. Array programming with NumPy. Nature 2020, 585, 357–362. [Google Scholar] [CrossRef]
- McKinney, W. Data structures for statistical computing in python. In Proceedings of the 9th Python in Science Conference, Austin, TX, USA, 28 June–3 July 2010; pp. 51–56. [Google Scholar]
- Waskom, M.L. Seaborn: Statistical Data Visualization. J. Open Source Softw. 2021, 6, 3021. [Google Scholar] [CrossRef]
- Babicki, S.; Arndt, D.; Marcu, A.; Liang, Y.; Grant, J.R.; Maciejewski, A.; Wishart, D.S. Heatmapper: Web-enabled heat mapping for all. Nucleic Acids Res. 2016, 44, W147–W153. [Google Scholar] [CrossRef]
- Gobler, C.J. Climate Change and Harmful Algal Blooms: Insights and perspective. Harmful Algae 2020, 91, 101731. [Google Scholar] [CrossRef]
- d’Ippolito, G.; Sardo, A.; Paris, D.; Vella, F.M.; Adelfi, M.G.; Botte, P.; Gallo, C.; Fontana, A. Potential of lipid metabolism in marine diatoms for biofuel production. Biotechnol. Biofuels 2015, 8, 28. [Google Scholar] [CrossRef] [PubMed]
- Martin-Jézéquel, V.; Hildebrand, M.; Brzezinski, M.A. Silicon metabolism in diatoms: Implications for growth. J. Phycol. 2000, 36, 821–840. [Google Scholar] [CrossRef]
- Botte, P.; d’Ippolito, G.; Gallo, C.; Sardo, A.; Fontana, A. Combined exploitation of CO2 and nutrient replenishment for increasing biomass and lipid productivity of the marine diatoms Thalassiosira weissflogii and Cyclotella cryptica. J. Appl. Phycol. 2018, 30, 243–251. [Google Scholar] [CrossRef]
- Levitan, O.; Dinamarca, J.; Zelzion, E.; Lun, D.S.; Guerra, L.T.; Kim, M.K.; Kim, J.; Van Mooy, B.A.; Bhattacharya, D.; Falkowski, P.G. Remodeling of intermediate metabolism in the diatom Phaeodactylum tricornutum under nitrogen stress. Proc. Natl. Acad. Sci. USA 2015, 112, 412–417. [Google Scholar] [CrossRef]
- Wiśniewska, K.; Śliwińska-Wilczewska, S.; Lewandowska, A.; Konik, M. The effect of abiotic factors on abundance and photosynthetic performance of airborne cyanobacteria and microalgae isolated from the southern Baltic Sea region. Cells 2021, 10, 103. [Google Scholar] [CrossRef] [PubMed]
- Hessen, D.O.; Hafslund, O.T.; Andersen, T.; Broch, C.; Shala, N.K.; Wojewodzic, M.W. Changes in stoichiometry, cellular RNA, and alkaline phosphatase activity of Chlamydomonas in response to temperature and nutrients. Front. Microbiol. 2017, 8, 18. [Google Scholar] [CrossRef] [PubMed]
- Olson, R.J.; Vaulot, D.; Chisholm, S.W. Effects of environmental stresses on the cell cycle of two marine phytoplankton species. Plant Physiol. 1986, 80, 918–925. [Google Scholar] [CrossRef]
- Maumus, F.; Allen, A.E.; Mhiri, C.; Hu, H.H.; Jabbari, K.; Vardi, A.; Grandbastien, M.A.; Bowler, C. Potential impact of stress activated retrotransposons on genome evolution in a marine diatom. BMC Genom. 2009, 10, 624. [Google Scholar] [CrossRef]

| Stress Conditions | |||||
|---|---|---|---|---|---|
| Experiment Number | Control Conditions | Abiotic Stress | Low | High | Culture Stage to Apply Stress |
| 1 | 20 °C | Temperature | 12 °C | 28 °C | Exponential |
| 2 | 100 µmol photons m−2s−1 | Light | 45 µmol photons m−2s−1 | 350 µmol photons m−2s−1 | Exponential |
| 3 | 36 PSU | Salinity | 34 PSU | 38 PSU | Exponential |
| 4 | f/2 modified medium * | Nitrogen depletion | 0 µM | - | Late exponential |
| 5 | f/2 modified medium * | Phosphorous depletion | 0 µM | - | Late exponential |
| 6 | f/2 modified medium * | Silicon depletion | 0 µM | - | Late exponential |
| µ | P. calliantha | P. multistriata | |
|---|---|---|---|
| Irradiance | Control | 1.06 ± 0.15 | 1.35 ± 0.08 |
| Low | 0.80 ± 0.18 | 0.95 ± 0.08 | |
| High | 0.95 ± 0.08 | 1.01 ± 0.13 | |
| Temperature | Control | 1.02 ± 0.10 | 1.11 ± 0.13 |
| Low | 0.79 ± 0.14 | 0.85 ± 0.15 | |
| High | 1.00 ± 0.03 | 1.11 ± 0.12 | |
| Salinity | Control | 1.10 ± 0.18 | 1.16 ± 0.15 |
| Low | 0.42 ± 0.68 | −0.09 ± 0.16 | |
| High | 0.68 ± 0.20 | 0.31 ± 0.18 | |
| Nutrient depletion | Control | 0.90 ± 0.15 | 0.37 ± 0.15 |
| Nitrogen | 1.01 ± 0.07 | 0.25 ± 0.16 | |
| Phosphorous | 1.00 ± 0.09 | 0.29 ± 0.11 | |
| Silicon | 0.61 ± 0.06 | 0.21 ± 0.17 |
Disclaimer/Publisher’s Note: The statements, opinions and data contained in all publications are solely those of the individual author(s) and contributor(s) and not of MDPI and/or the editor(s). MDPI and/or the editor(s) disclaim responsibility for any injury to people or property resulting from any ideas, methods, instructions or products referred to in the content. |
© 2023 by the authors. Licensee MDPI, Basel, Switzerland. This article is an open access article distributed under the terms and conditions of the Creative Commons Attribution (CC BY) license (https://creativecommons.org/licenses/by/4.0/).
Share and Cite
Ambrosino, L.; Miralto, M.; Barra, L.; Sardo, A.; Chiusano, M.L.; Cozza, R.; Ferrari, M.; Greco, S. Stress Response in Toxic Diatoms: The Effects of Abiotic Factors on Growth and RNA Content in Pseudo-nitzschia calliantha and in Pseudo-nitzschia multistriata. J. Mar. Sci. Eng. 2023, 11, 1743. https://doi.org/10.3390/jmse11091743
Ambrosino L, Miralto M, Barra L, Sardo A, Chiusano ML, Cozza R, Ferrari M, Greco S. Stress Response in Toxic Diatoms: The Effects of Abiotic Factors on Growth and RNA Content in Pseudo-nitzschia calliantha and in Pseudo-nitzschia multistriata. Journal of Marine Science and Engineering. 2023; 11(9):1743. https://doi.org/10.3390/jmse11091743
Chicago/Turabian StyleAmbrosino, Luca, Marco Miralto, Lucia Barra, Angela Sardo, Maria Luisa Chiusano, Radiana Cozza, Michele Ferrari, and Silvestro Greco. 2023. "Stress Response in Toxic Diatoms: The Effects of Abiotic Factors on Growth and RNA Content in Pseudo-nitzschia calliantha and in Pseudo-nitzschia multistriata" Journal of Marine Science and Engineering 11, no. 9: 1743. https://doi.org/10.3390/jmse11091743
APA StyleAmbrosino, L., Miralto, M., Barra, L., Sardo, A., Chiusano, M. L., Cozza, R., Ferrari, M., & Greco, S. (2023). Stress Response in Toxic Diatoms: The Effects of Abiotic Factors on Growth and RNA Content in Pseudo-nitzschia calliantha and in Pseudo-nitzschia multistriata. Journal of Marine Science and Engineering, 11(9), 1743. https://doi.org/10.3390/jmse11091743