Article

Littoral Drift Impoundment at a Sandbar Breakwater: Two Case Studies along the Bight of Benin Coast (Gulf of Guinea, West Africa)

1
Department of Civil and Environmental Engineering, Tohoku University, 6-6-06 Aoba, Sendai 980-8579, Japan
2
Institute of Liberal Arts and Sciences, Tohoku University, 41 Kawauchi, Aoba-ku, Sendai 980-8579, Japan
*
Author to whom correspondence should be addressed.
J. Mar. Sci. Eng. 2023, 11(9), 1651; https://doi.org/10.3390/jmse11091651
Submission received: 29 July 2023 / Revised: 15 August 2023 / Accepted: 22 August 2023 / Published: 24 August 2023
(This article belongs to the Special Issue Tenth Anniversary of JMSE – Recent Advances and Future Perspectives)

Abstract

:
This study assessed the deposition of sediment and shoreline evolution at two newly constructed port facilities in the Bight of Benin, West Africa. Based on the Building with Nature approach, the concept of a sandbar breakwater was implemented at the study sites. The coastal system of the bight is characterized by a sand barrier-lagoon system and a uniform prevailing wave climate, making it a favorable location for this innovative port solution. The case studies were undertaken at the Port of Lomé, Togo, and the Lekki Deep Sea Port (Dangote Sea Port), Nigeria, using remotely sensed shoreline positions and the one-line coastline change model for different periods. After construction of the breakwater, we estimated that the updrift coastline at the two locations accreted in the range of 10–23 m/year and the rates of sediment deposition were estimated to be in the magnitude of 1.0–7.0 × 10⁵ m3/year. The comparative study conducted also showed that these rates could further reach a magnitude of 106 m3/year at other sediment-accreting landforms within the bight. We found that these large magnitudes of longshore sediment transport generated from very oblique incident waves (10°–20°) and sediment input from rivers (in orders of 106 m3/year) have enabled the realization of expected morphodynamic changes on the updrift shoreline of the ports. From these results, downdrift morphological changes should not be underestimated due to potential imbalances induced in the sedimentary budget along the coastline. Future developmental plans within the bight should also continuously aim to adopt nature-based solutions to protect the ecosystem while mitigating unforeseen implications.

1. Introduction

Within the last decade, the global drive for sustainable and resilient coastal infrastructural technologies has been met with a tremendous change in policy formulation, project execution, and academic research outputs [1,2,3,4]. In relation to offshore ports, new design approaches are continuously investigated and developed with an ardent emphasis on considerations of nature-based solutions [3,4,5]. Adopting environmentally friendly approaches alleviates associated engineering risks pertaining to coastal flooding, downdrift beach erosion, loss of biodiversity, and socio-economic losses in the vicinity of these structures [6,7].
Typically, port structures induce low to severe morphological changes within their environs. These may include but are not limited to: (i) sedimentation and entrance dredging problems [8,9,10,11,12], (ii) downdrift erosion [13,14], (iii) changes to wave climate [15,16], and (iv) environmental pollution [17]. Among these issues, updrift sediment deposition and downdrift erosion relative to the port location appear to be the most pressing issues discussed in previous literature. A conventional way to mitigate downdrift erosion is to design port breakwaters to enable sediment bypassing after a specified period [15,18]. Sediment traps have also been found to be a useful approach [19,20]. The accumulated sediment is repurposed in the nourishment of the eroding downdrift section of the port, although it might be considered an expensive approach in the long term.
To this end, designing and implementing a sandbar breakwater is considered a nature-based solution that can potentially mitigate some coastal, financial, and environmental constraints associated with conventional port breakwaters [3,21]. The sandbar breakwater follows an unconventional design regarding its geometry, orientation, and stability requirements (Figure 1).
It comprises two main structural components, i.e., a sand body made up of minimal artificial nourishment and a shortened rock groyne at the tip of the sandbar (green line in Figure 1). Feasibility studies by [21,22,23] indicate that the design specifications adopted in the sandbar breakwater technology provide the following advantages:
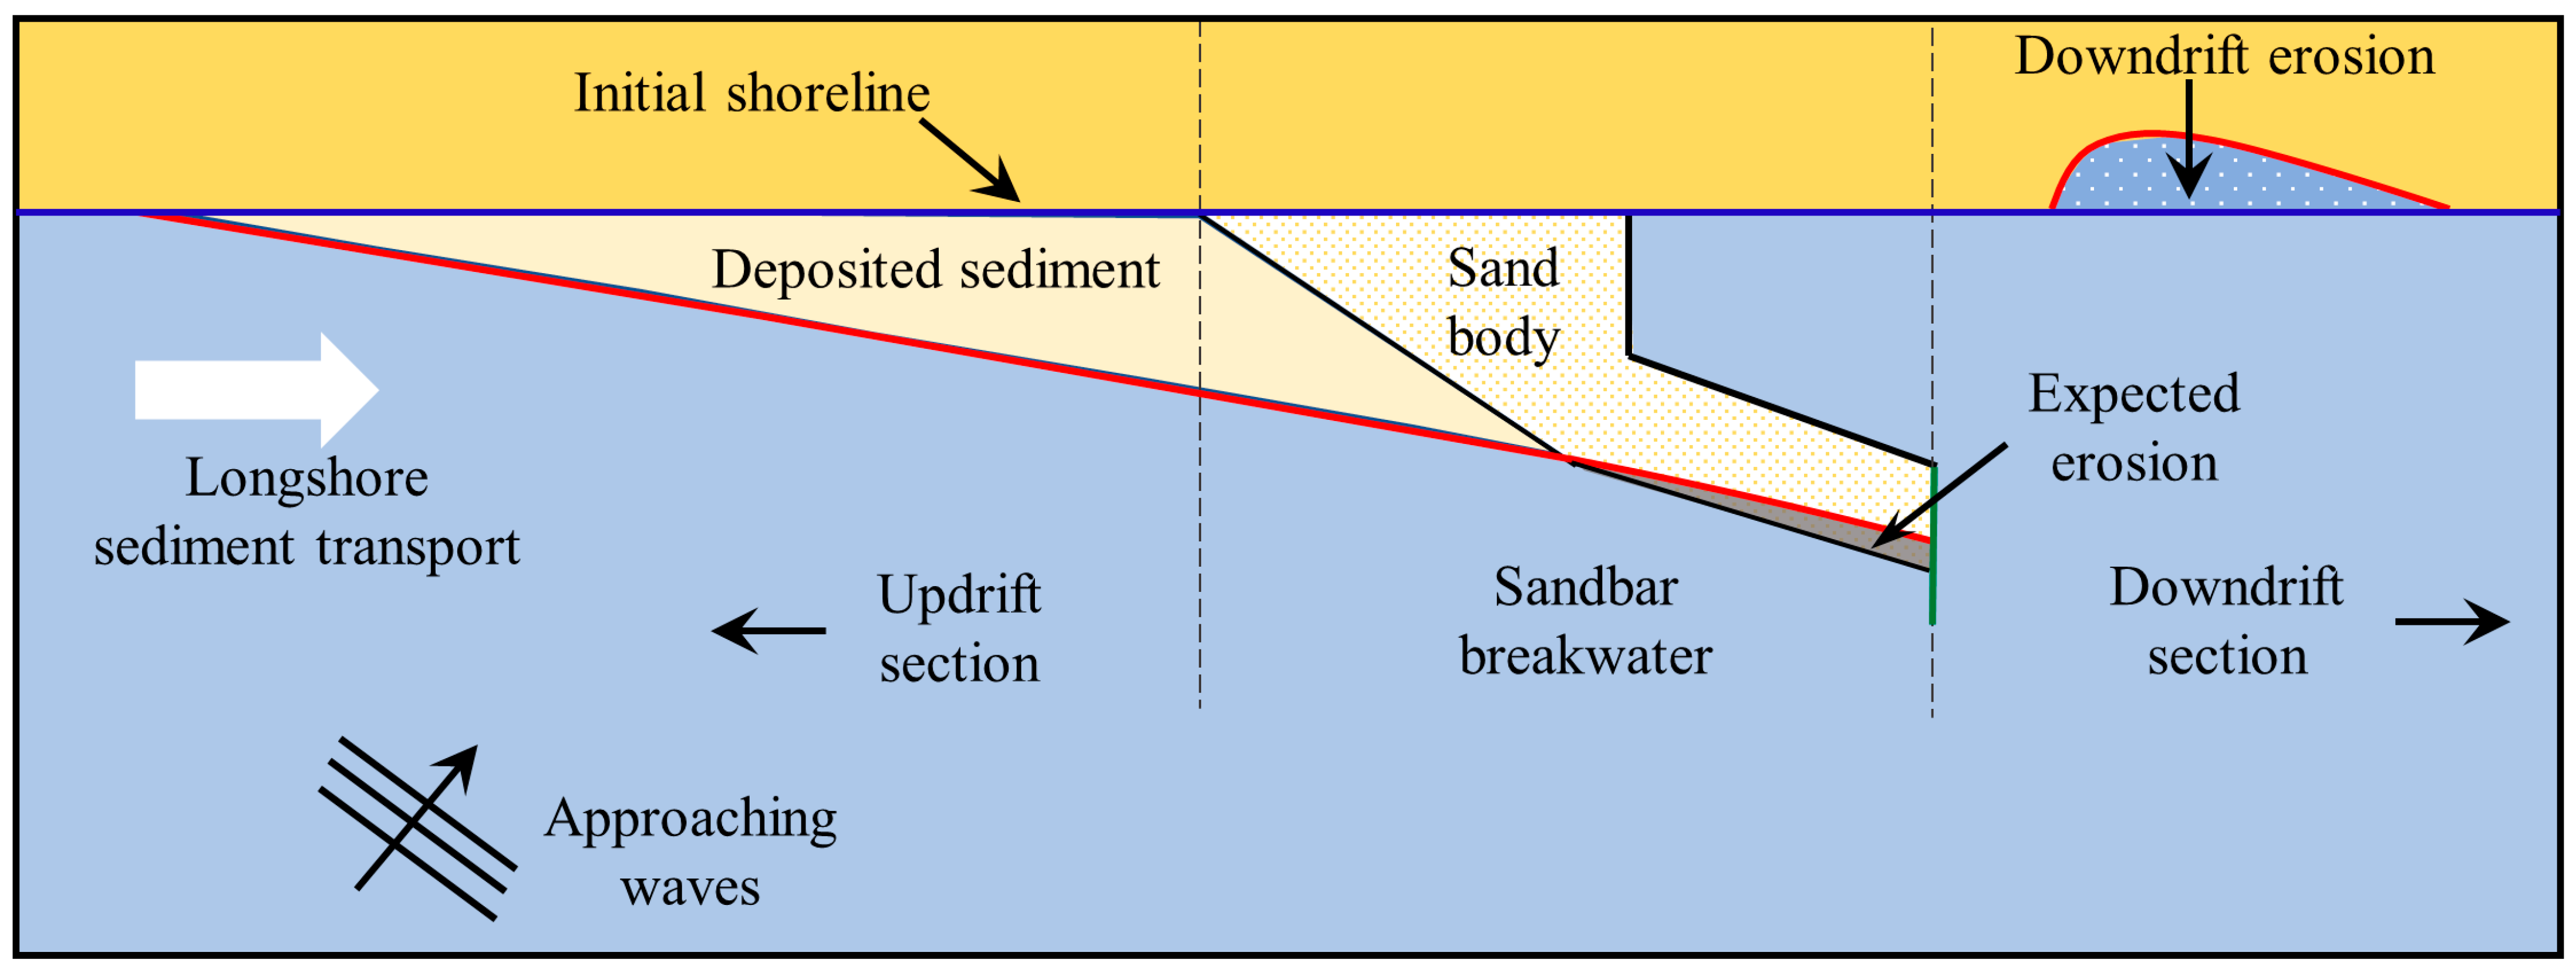
  • A reduction in the overall construction cost and a significant decrease in project execution time due to the minimal need for hard structure installations and the availability of large magnitudes of longshore sediment transport.
  • A decrease in quarrying activities and transportation, subsequently reducing air pollution, accidents, and carbon emissions.
  • Effective wave sheltering by the shortened groynes reduces the wave energy entering the main port basin.
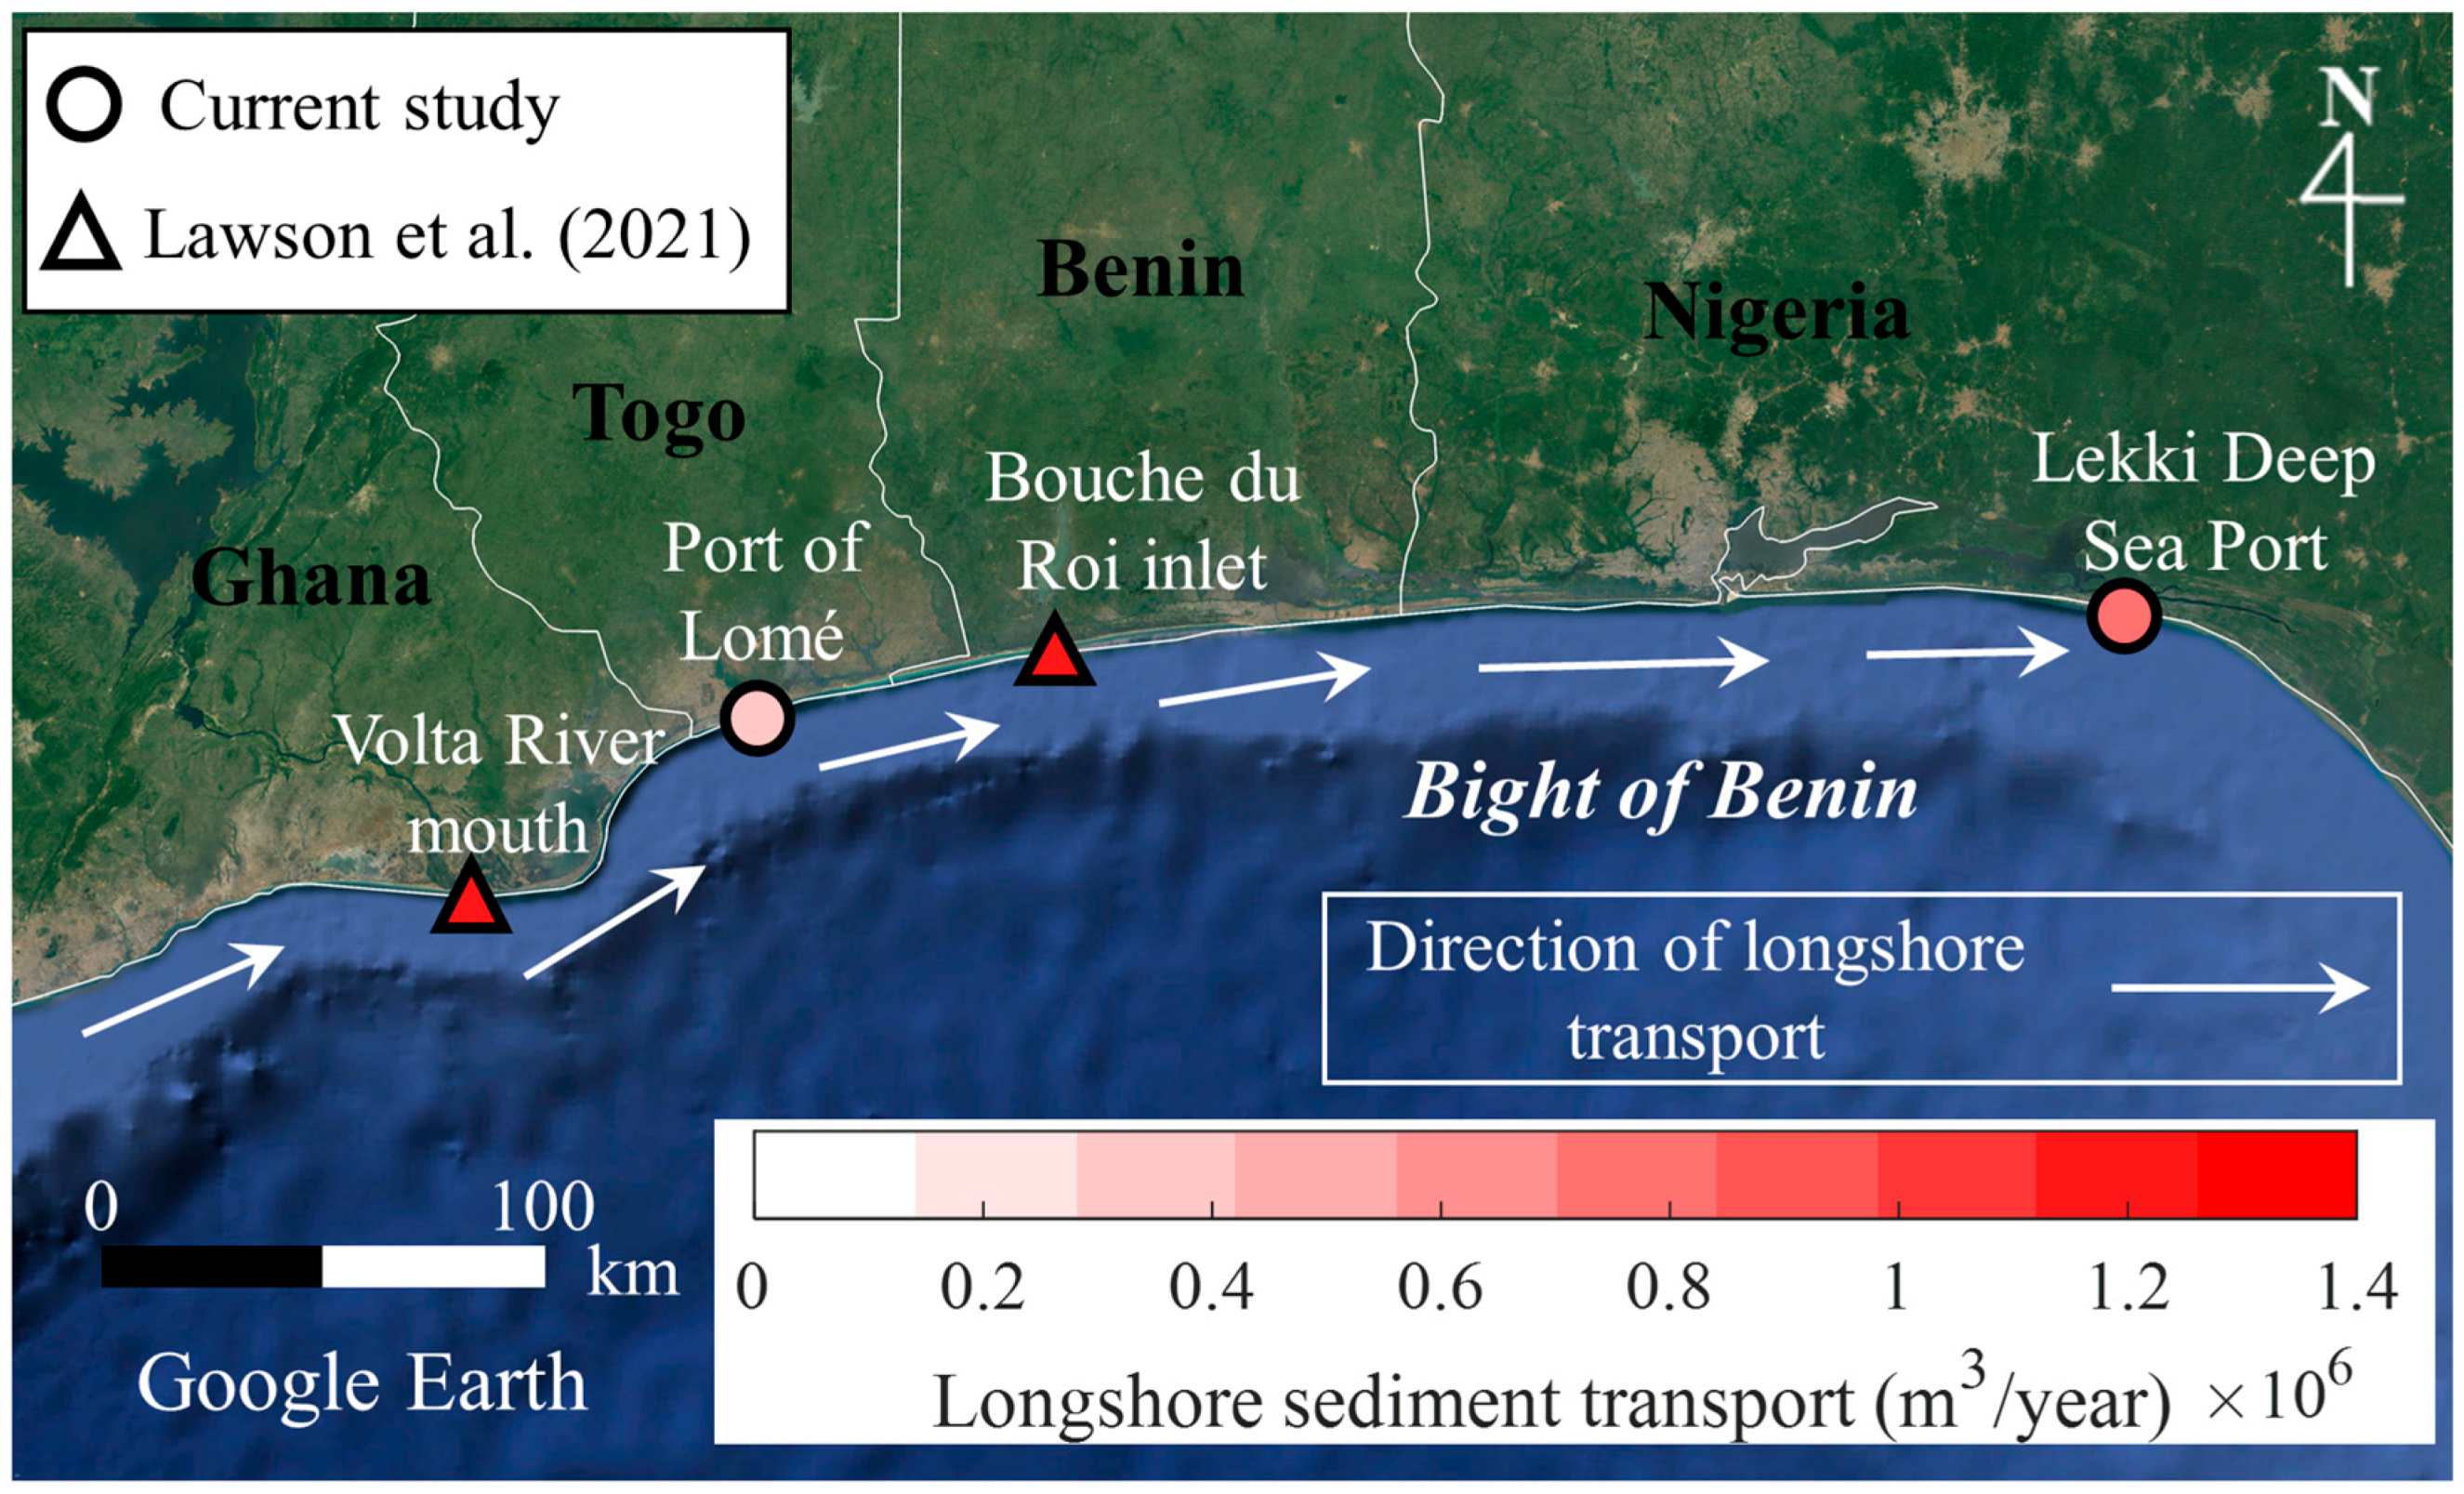
Easy future port expansion due to the flexibility of the design.
Bearing these benefits in mind, the Bight of Benin coast in West Africa proved to be a suitable location for implementing the sandbar breakwater technology. The bight is bounded by the Volta Delta in Ghana and the Niger Delta in Nigeria (Figure 2). It serves as the outfall for two of the five major rivers in West Africa (Volta and Niger Rivers; Figure 2). Sediment transport along the entire coastline is generally deemed abundant and driven by a unidirectional longshore current. In recent years, port construction and expansion projects in Africa have risen due to the growing need to increase import and export trading activities [24,25,26]. Boer et al.’s [7] investigation of 130 selected African seaports showed that West African ports and those near the Nile Delta accounted for more than 65% of the coastal system’s observed accretions and erosions. At a regional scale, studies such as the current one provides a detailed insight into coastline evolution and sedimentation processes around port facilities which could be helpful in localized policy planning of coastal projects.
In this study, we assessed the shoreline evolution and sediment deposition rates along the updrift coast of the newly constructed sandbar breakwaters located in two West African countries, i.e., the Port of Lomé in Togo and the Lekki Deep Sea Port (Dangote Sea Port) in Nigeria (Figure 2). The estimation of longshore sediment transport rates from impounded sediment at port breakwaters, sandspits, jetties, or dispositional basins is known to provide the closest amounts related to the total transport (i.e., bed load and suspended load transport) provided they are conducted on a long-term scale [27]. Longshore sediment transport rates within the study areas have mainly been estimated using empirical formulas based on the energy flux, longshore current, or hindcast wave data approaches [28,29,30]. Therefore, this study provides an alternative perspective on sediment transport rates within the Bight of Benin. Furthermore, knowledge of the sediment transport rates serves as a basis for developing littoral budgets in the vicinity of these port structures, subsequently strengthening our understanding of the overall behavior of the respective coastal cells.
To achieve the objectives mentioned above, we examined the changes in the shoreline positions using remotely sensed images from the Landsat collections. These shoreline positions were used to determine their rates of change and variations in beach surface areas (Section 4.1 and Section 4.2). With regards to the volume of deposited sediment, it was estimated based on the one-line shoreline change theory (Section 4.3). A major setback for extensive coastal research within the Bight of Benin and other coastal African countries is the lack of comprehensive and up-to-date field-measured datasets (viz., bathymetry, waves, sediment characteristics/input, tides). Therefore, the remote sensing approach adopted in this study provides an alternative to these limitations, with the utmost attention given to possible sources of errors (georeferencing error, pixel size, and seasonal variations of wave energy) for all estimated quantities. We also perform a comparative study on the variation of longshore sediment transport along the Bight of Benin (Section 4.4) and discuss the role of river sediment and wave climate in the transport processes (Section 5.2). Additionally, a comparison of sediment transport around ports in other parts of the world was conducted (Section 5.3). As a final point, we highlight the lessons learned from current coastal management activities that could benefit future management strategies (Section 5.4).

2. Study Areas

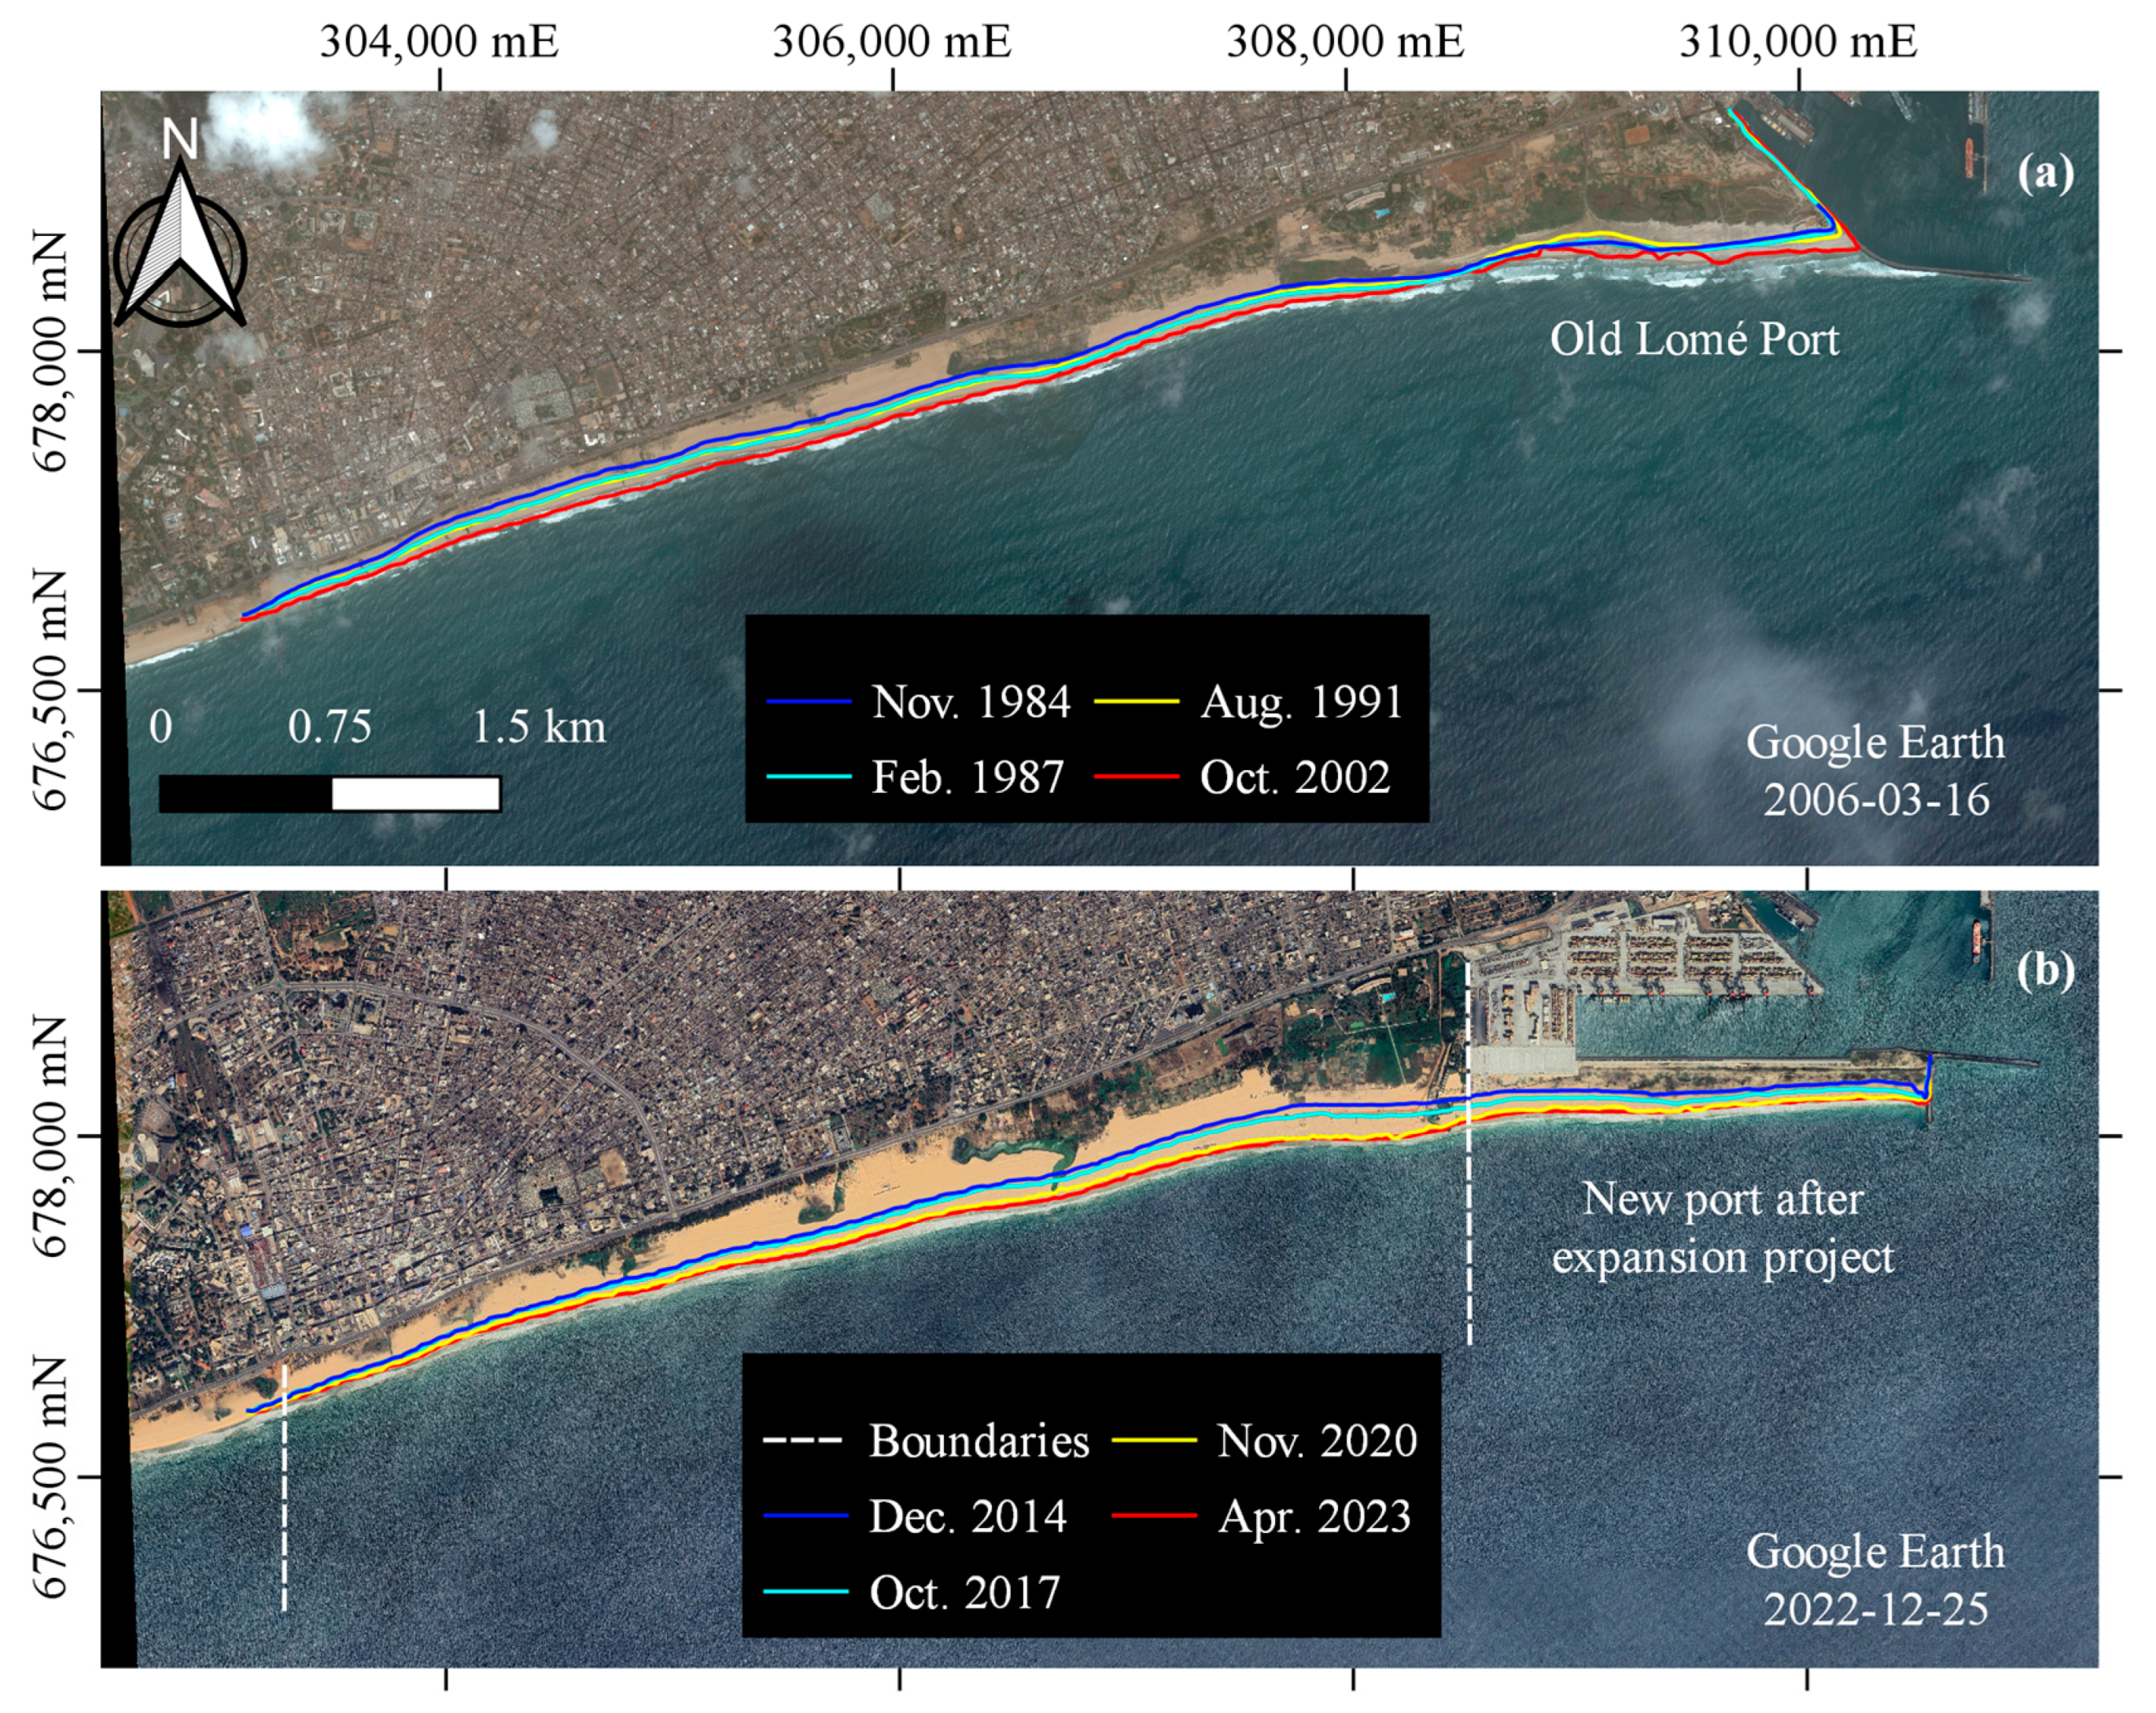
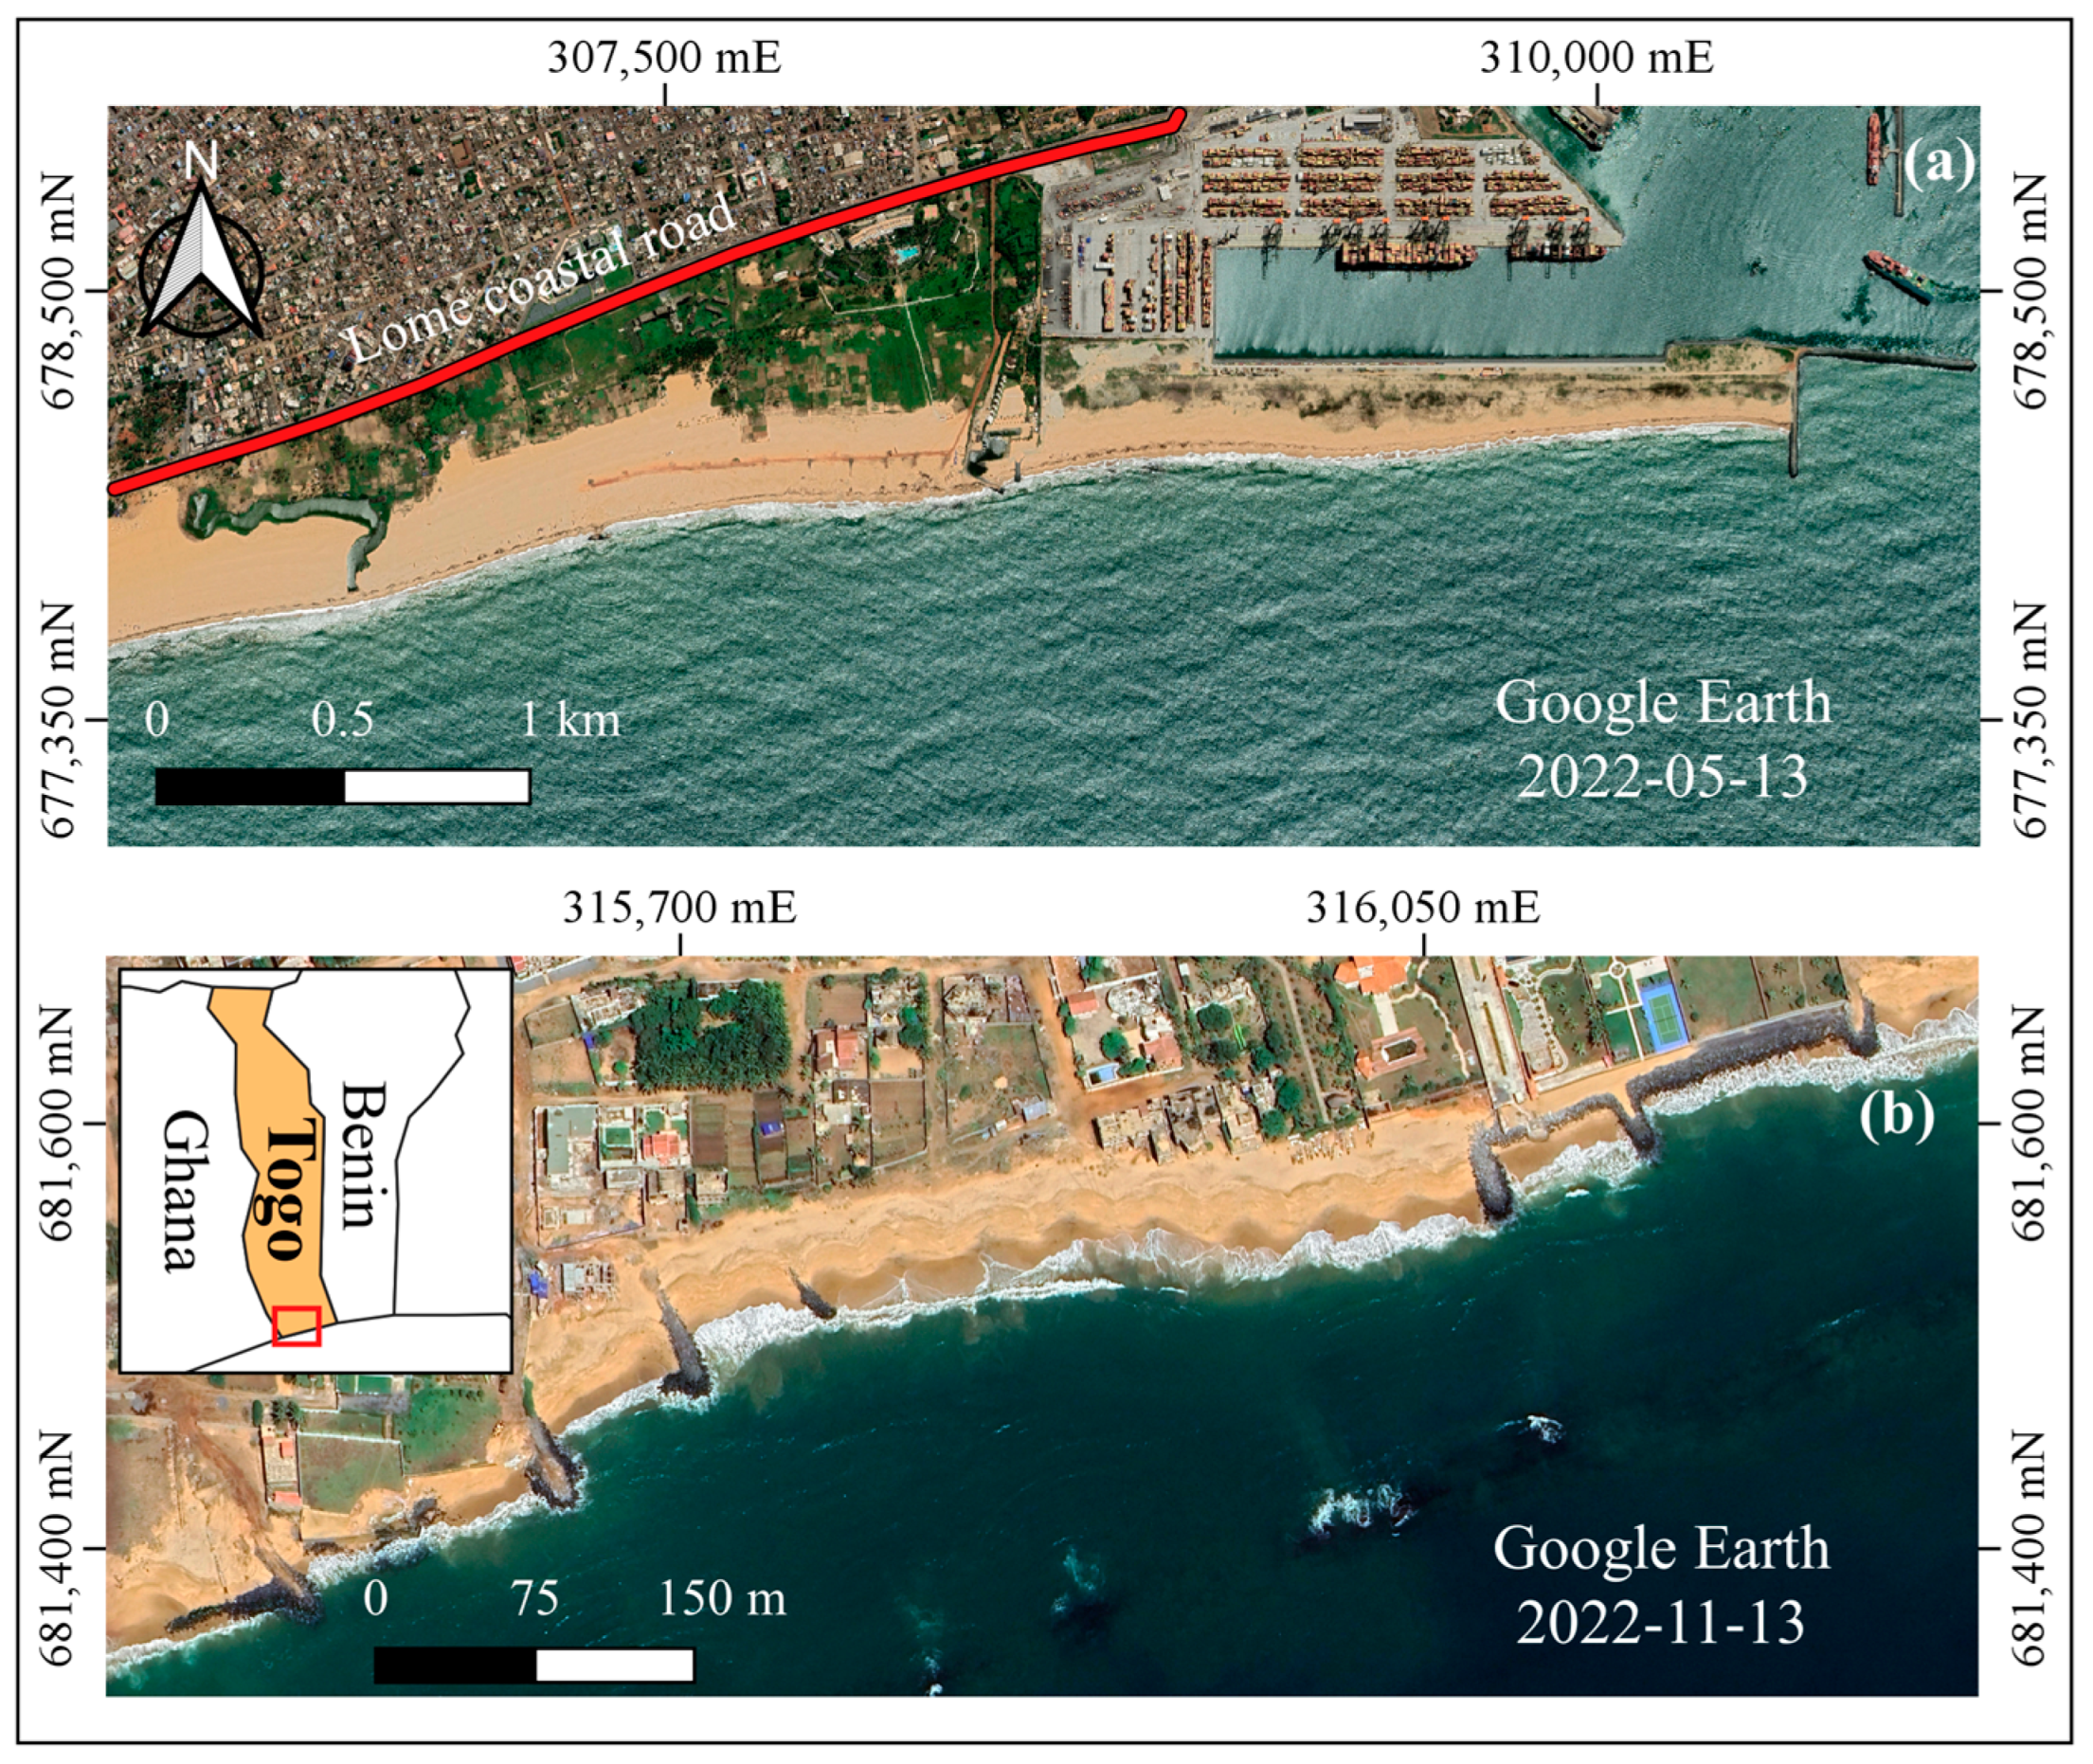
2.1. Port of Lomé, Togo

Located in the southwestern part of Togo, the Port of Lomé plays a crucial role in the socio-economic development within the Bight of Benin countries (Figure 3). The port was constructed between 1964–1968 and has undergone several expansions and modifications to date. A notable upgrade to the port in recent years has been its expansion using the sandbar breakwater design. Historically, rapid sediment impoundment at the port has been observed. From 1964–1967, the updrift shoreline of the port accreted at a rate of c.a. 100 m/year [31]. Further accretion was also observed between 1970–1972 but at a slower rate (~80 m/year) [31]. The rapid accretion of the initial coastline westward of the port indicates a large amount of longshore sediment transport along the Bight of Benin coast. As any coastal engineer or researcher would expect, the presence of a sediment-accumulating structure (viz., groynes, jetties, breakwaters) induces some level of erosion along the downdrift shoreline of the structure. As a result, several shore protection structures can be identified on the eastern side of the Lomé port (Figure 3b). Guerrera et al. [32] comprehensively analyzed shoreline changes along the coast of Togo and reported an erosion rate of ~5 m/year downdrift of the Port of Lomé over 40 years (1981–2021). Additionally, these recession rates have been exacerbated by other anthropogenic factors such as coastal urbanization, sand and gravel mining, and modifications to the natural hydrographic systems within the lagoon and barrier beach system [32,33,34]. Land subsidence due to groundwater extraction and induced sedimentary imbalances are also critical issues threatening the sustainability of the Togolese coastal system and the Bight of Benin [35].

2.2. Lekki Deep Sea Port (Dangote Sea Port), Nigeria

Unlike the Port of Lomé, whose original breakwater has been redesigned, the Lekki Deep Sea Port (LDSP) is being built from scratch using sandbar breakwater technology. The LDSP is located ~76 km east of the mouth of the Ogun River/Lagos Lagoon. It is worth pointing out that two ports are being constructed along the Lekki coastline, and this study focuses solely on the LDSP (Dangote Sea Port), which utilizes sandbar breakwater technology (Figure 4). The main sandbar body was constructed between 2017 and 2018. To our knowledge, this study is among the first to examine sedimentation at the sandbar breakwater while other project components are still ongoing. A long-term shoreline analysis by Osanyintuyi et al. [36] indicates that erosion along the port’s downdrift shoreline has intensified due to the presence of these coastal structures and increased population density/urbanization. This inevitable phenomenon has been identified as part of the project, with proposals to protect the downdrift shoreline using a “Sand Engine” approach and repetitive nourishment [21,37].

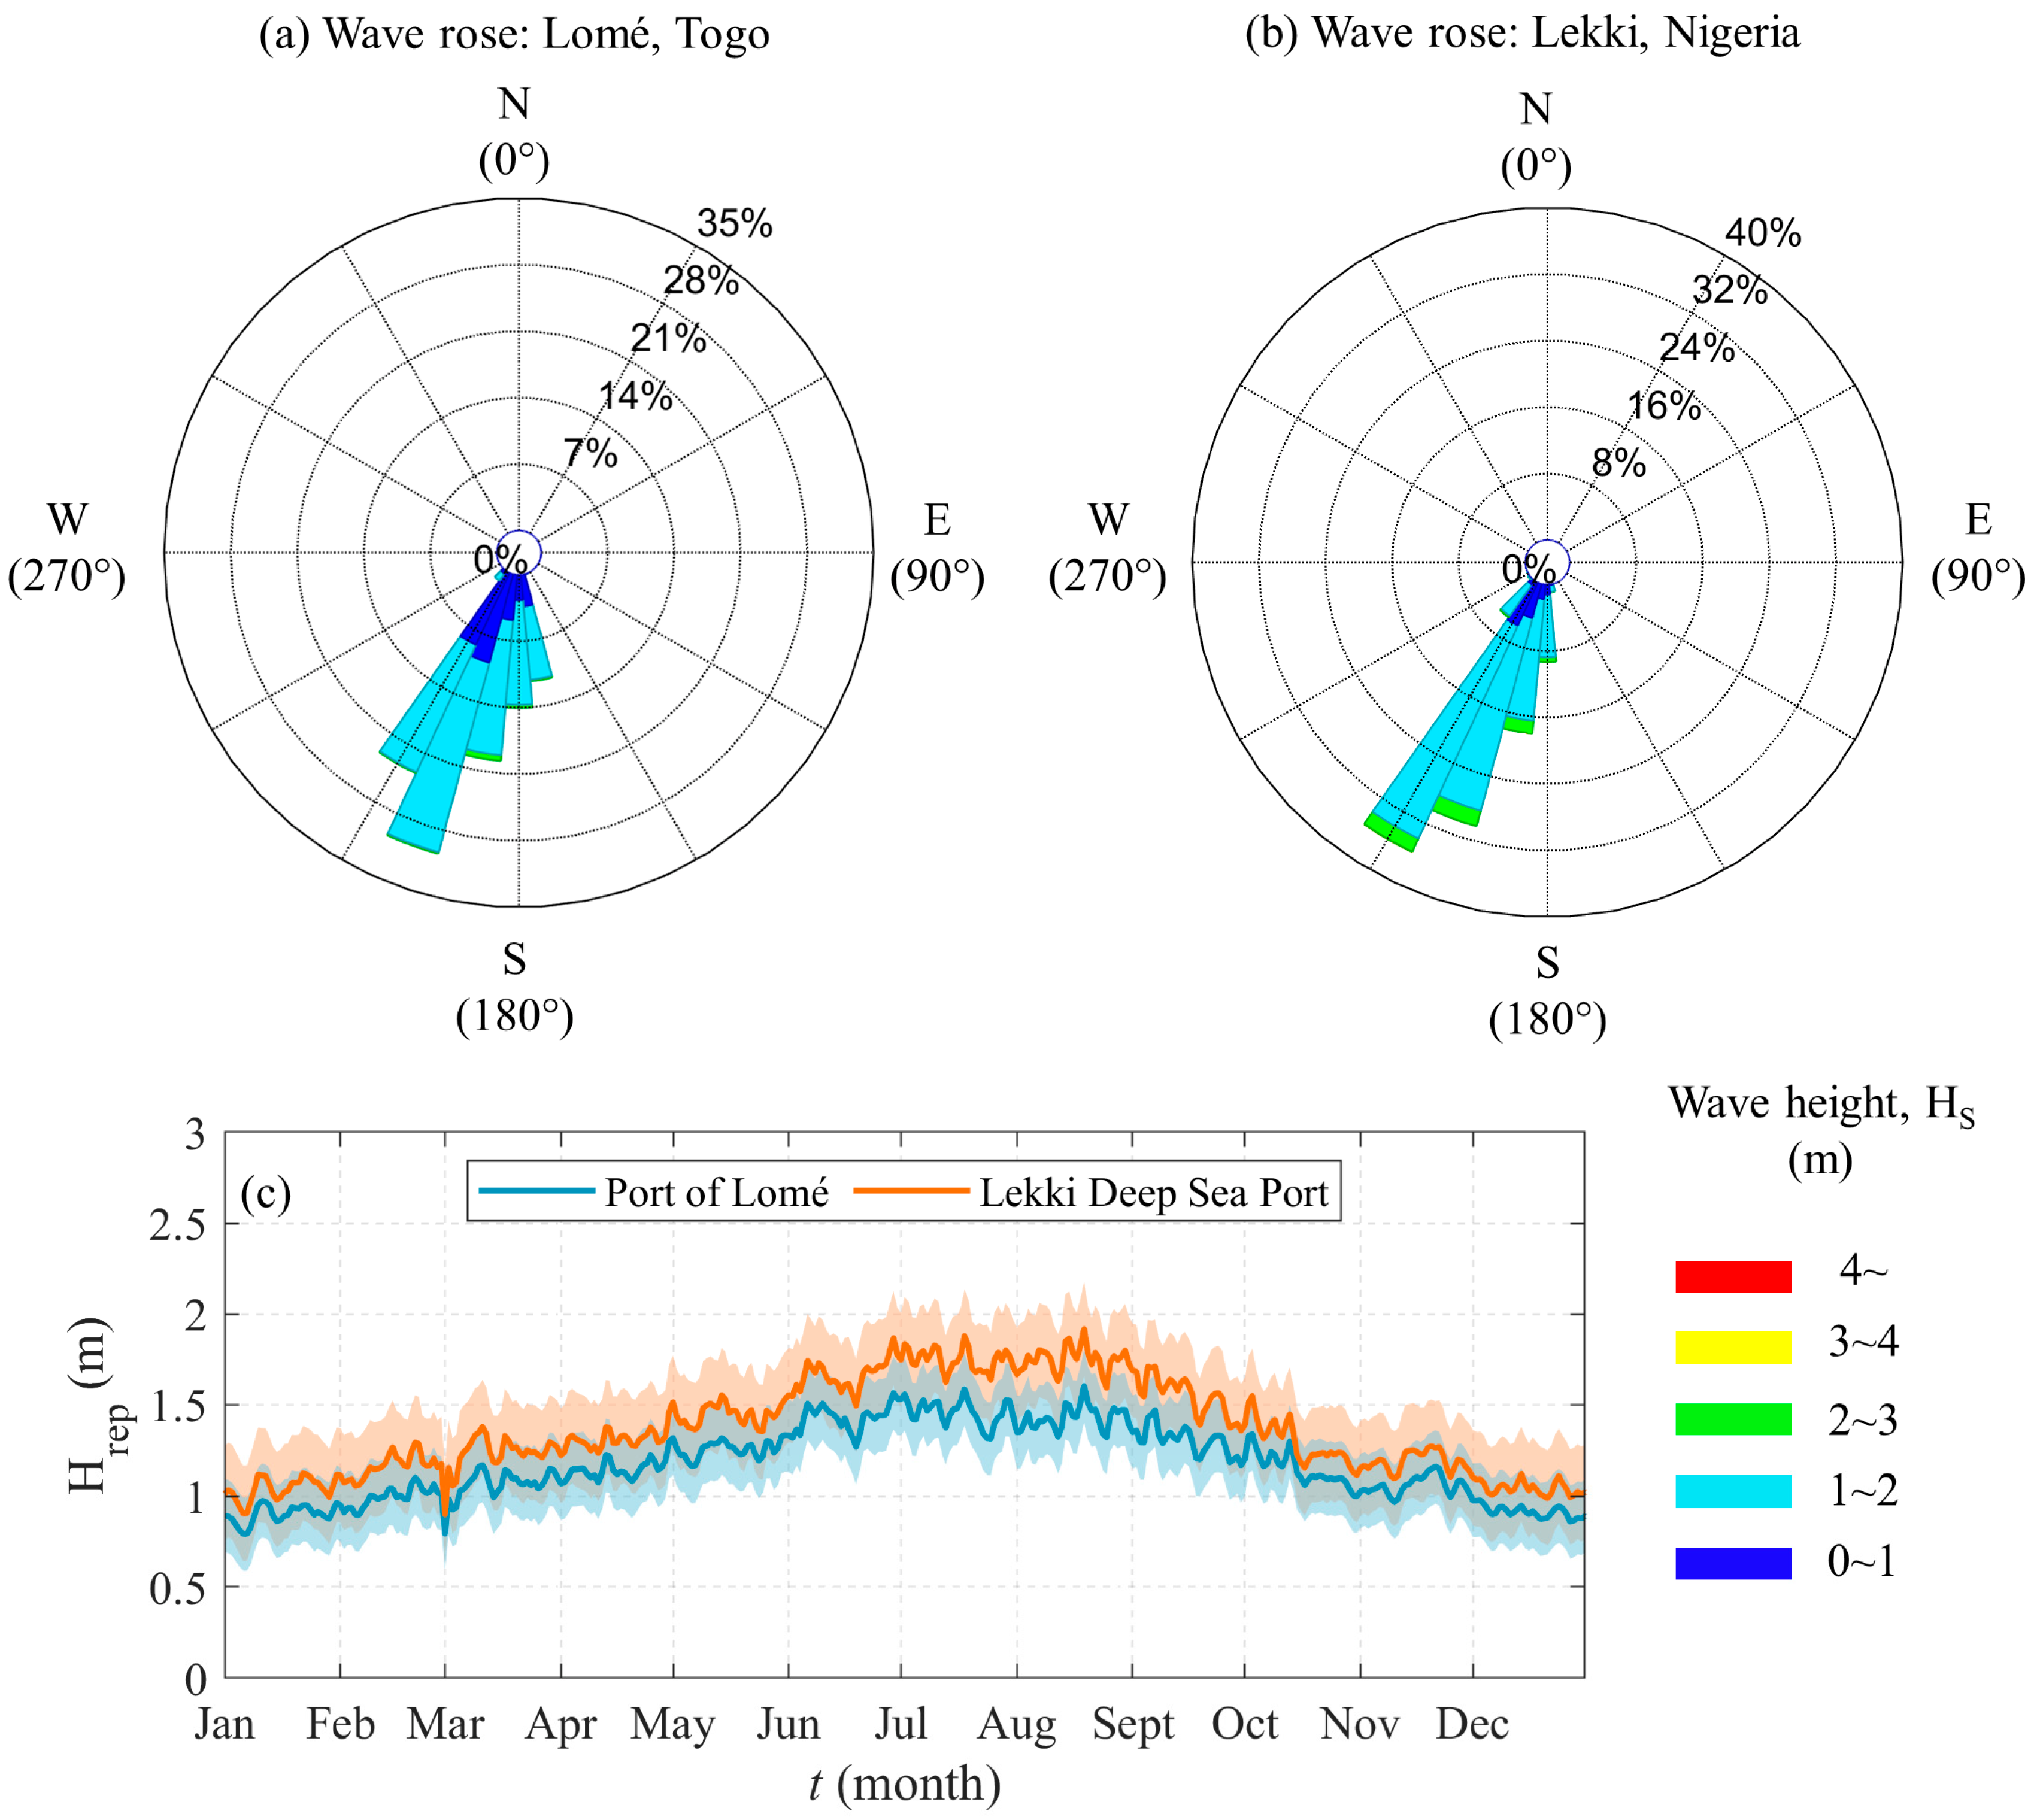
2.3. Oceanographic Settings

The marine environment of the Bight of Benin is situated on a narrow continental shelf with no offshore islands sheltering the coastal system against oceanic forces [38]. Most of the coastal system is characterized by a wave-dominated sand barrier and lagoon system [39,40]. Oceanic currents here are dominated by the Guinea current that flows offshore from west to east with speeds varying between 0.5–1.0 m/s [28,38,41]. These currents generally have a minimal influence on sediment transport processes but can enhance wave-driven transport [42].
The typical waves approaching the two study areas originate from locally weak wind waves and storm-generated swells from the South Atlantic Ocean. These swells persistently arrive from the southwest direction (Figure 5a,b). The wave climate presented here corresponds to datasets obtained from 2006–2017 using the WaveWatch III model [43] and extracted at offshore distances of 28 and 46 km for Lomé and Lekki, respectively. Wave heights exceeding 3.0 m are seldom observed, and wave periods are usually in the range of 10–14 s. Additionally, the wave heights exhibit a seasonal variation, with relatively higher wave heights observed from May to October (Figure 5). This seasonality can be attributed to the modifications of the West African Monsoon by land and sea breezes in the coastal zones [28,38,39].
The Bight of Benin coast can be classified as a micro-tidal coastal environment [28,29]. At Lomé, the tides are semi-diurnal, with a tidal range of ~1.0 m and a maximum spring tide of 1.32 m [38]. The tidal range slightly reduces along the Lagos Lagoon barrier (Lekki) to ~0.74 m with a maximum spring tide of 1.0 m. Induced currents from these tides are weak since the phase of the tide is almost the same along the entire coast [38,42]. However, the influence of flood tidal currents at inlets and river mouths along the coast becomes stronger.

3. Materials and Methods

3.1. Shoreline Detection

The primary datasets used in this study are the Landsat data products (i.e., Landsat 5 (TM), Landsat 7 (EMT+), and Landsat 8 (OLI)), retrieved from the Google Earth Engine (GEE) via the CoastSat python toolkit [44]. The images were retrieved for the 1984 to 2023 period and used to examine the shoreline variability at the two study areas. All the satellite images were analyzed using a uniform coordinate system (WGS-84/UTM Zone 31N) with no further geometric corrections as retrieved from the GEE.
Based on the current study’s scope, each site’s temporal scale was modified to align with observed morphological patterns before and after the construction of the sandbar breakwater. Details on the periods considered are outlined in Section 4.1 and Section 4.2.
As a first step in the shoreline change analysis, the shorelines were extracted in the CoastSat toolkit. The CoastSat toolkit is a popular and convenient tool for coastal researchers which has been applied in a wide range of studies in recent years [45,46,47,48]. Images retrieved from the GEE are taken through a pre-processing step (cloud masking and pan-sharpening/down sampling) for spatial enhancement (30 m/pixel→15 m/pixel). In the shoreline detection step, the water–land boundary is defined using the Modified Normalized Difference Water Index (MNDWI) [49], which is defined as follows:
M N D W I = S W I R 1 G S W I R 1 + G
where SWIR1 and G represent the short-wave infrared and green bands, respectively. For a detailed explanation of the shoreline extraction process and validation of the CoastSat toolkit, readers are kindly referred to Vos et al. [44,50].

3.2. Shoreline Change Analysis

The extracted shorelines were analyzed using the Digital Shoreline Analysis System (DSAS) developed by the United States Geological Service (USGS) [51]. In this study, version 5.1 of the DSAS was used within the ArcGIS software version 10.8. The DSAS has been extensively used for shoreline change analysis because it performs detailed statistical analysis on rate calculations using multiple approaches and data sources [52,53,54]. A step-by-step guide and detailed explanation of shoreline change analysis within the software can be found in Himmelstoss et al. [51] and Hapke et al. [55].
In our analysis, we selected a single shoreline for each year using a criterion for the seasonal variation of the wave climate. The analyzed images were selected during periods of relatively low wave heights (October–May; Figure 5c) to minimize the influence of the seasonal variation of the wave energy. Periods with higher wave energies influence the presence of whitewater, which is recognized as noise in the sub-pixel segmentation algorithm in the CoastSat toolkit. However, exceptions were made for study periods without cloud-free images.
The shoreline position uncertainty in this study considered the satellite image georeferencing error ( E g ), which is the root-mean-squared error (RMSE) for the horizontal accuracy of the images, and the pixel size ( E p ). A geometric RMSE threshold of 10 m was set in the CoastSat toolkit and images with values above this limit were discarded. Therefore, the total shoreline position error ( E x ) for the retrieved satellite images were calculated in a similar way to the method utilized by Hapke et al. [55], which is given by the following:
E x = E g 2 + E p 2
Also, tidal corrections for the extracted shorelines were omitted because of the low tidal range and steep/narrow beach profile along the Bight of Benin coast [38,39,42]. Further checks with tide datasets also revealed that the retrieved satellite images were captured during the high tide period of the spring tide. Hence, the standard practice of defining the high tide line as the shoreline for coastal delineations [56] was achieved.
The baseline for the change analysis was established by merging all shorelines for each period considered and with a 150 m landward buffer. We also constructed the transects at a 20 m interval which were used in computing the various quantities (i.e., shoreline change rates and shoreline movement). The Net Shoreline Movement (NSM) and Linear Regression Rates (LRR) statistical outputs were calculated as the last step of the analysis. The NSM depicts the total horizontal movement between successive shorelines and the LRR indicates the shoreline change rate over a specified period. For our reported LRR, the standard error of the associated rates is based on a 90% confidence interval of linear regression (LCI90).

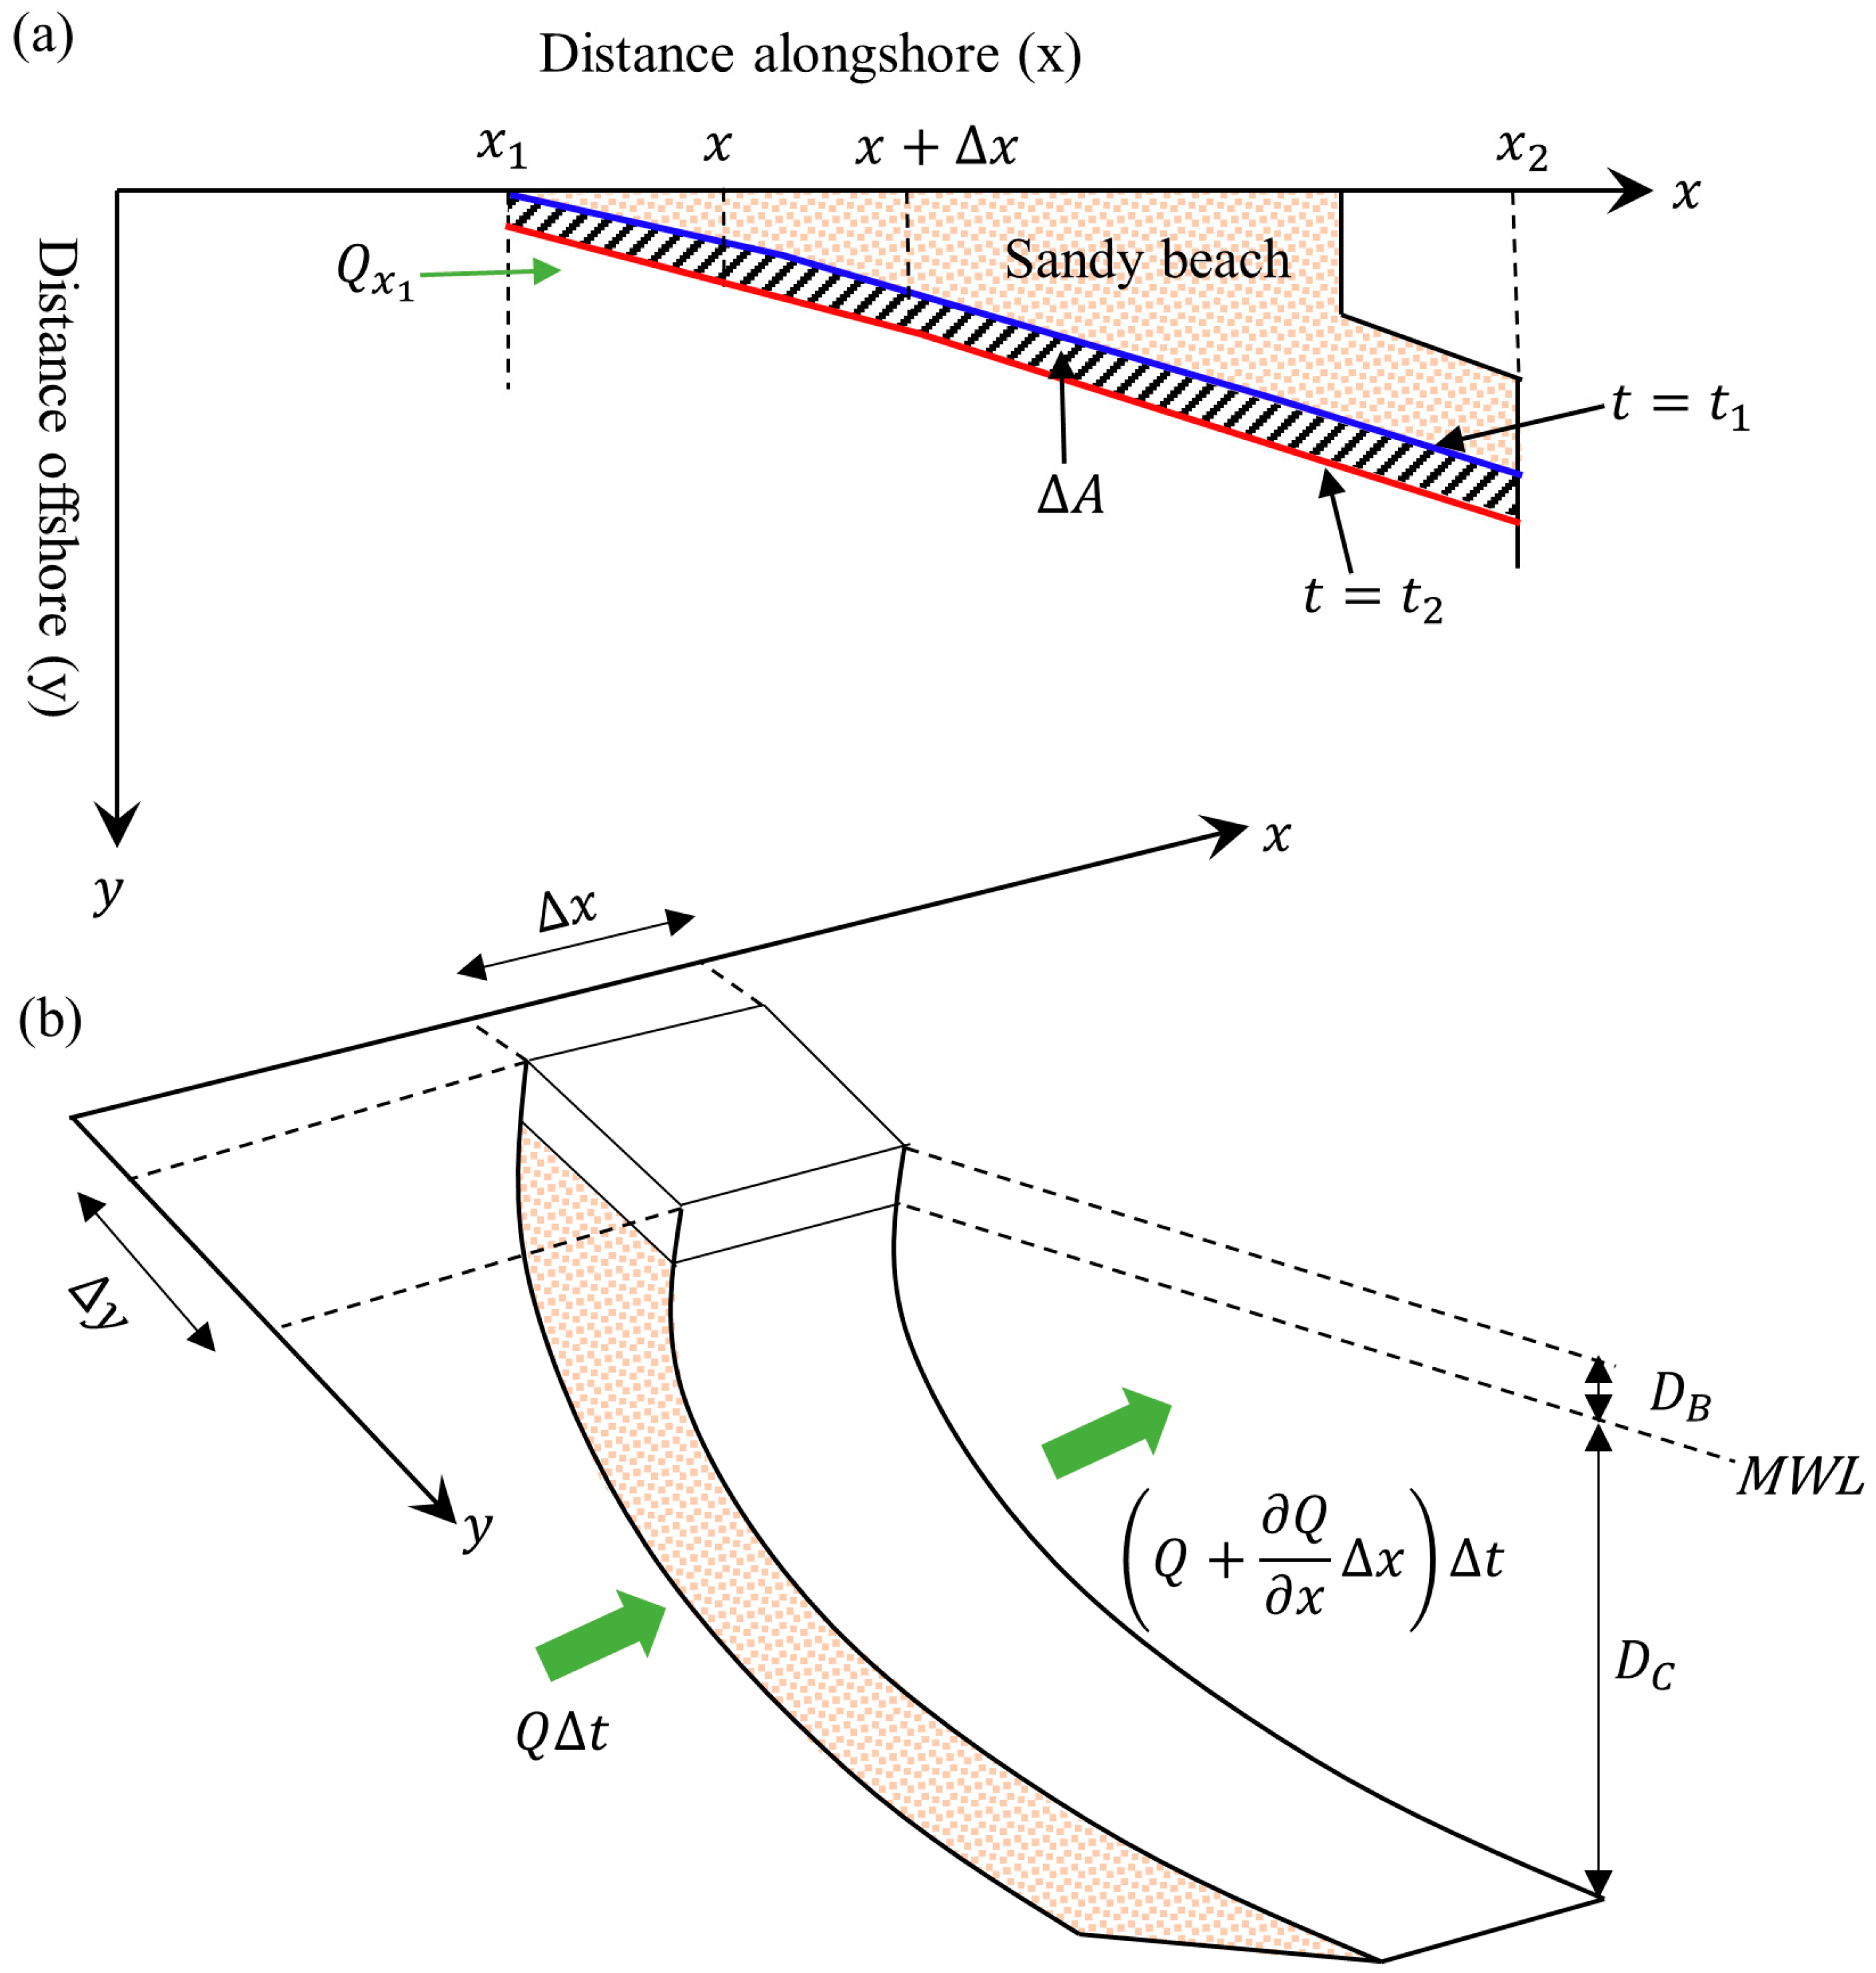
3.3. Longshore Sediment Transport

The amount of littoral drift impounded at the study sites was calculated using the one-line shoreline change model presented by Pelnard-Considere [57] (Figure 6). The model describes the long-term shoreline evolution by assuming that the beach profile maintains an equilibrium shape with parallel bottom contours [58]. Based on these assumptions and the conservation of sediment volume, the long-term shoreline variation can be expressed as follows:
y t = 1 D Q x + q
where y is the shoreline position, t is time, D is the depth of active sediment motion given as the sum of the depth of closure ( D C ) and the berm height ( D B ), Q is the longshore sediment transport rate, x is the alongshore coordinate, and q is the cross-shore sediment transport.
In the model, short-term variations induced by storms or rip currents are assumed to be negligible concerning the main trend in shoreline evolution. Hence, cross-shore transport is neglected (i.e., q = 0 ). Based on this assumption and considering the defined alongshore boundaries ( x 1 and x 2 ; Figure 6a), the time variation of sediment volume ( d V / d t ) can be obtained as follows:
d V d t = D x 1 x 2 y t x
In our calculations, the rates of shoreline change ( y / t ) were obtained from the LRR analysis performed in the DSAS software.
From Equation (4), the time variation of sediment volume ( d V / d t ) can be related to the change in the beach surface area ( A ), which is directly measured between successive shoreline positions over a defined period ( t 1 and t 2 ). Hence, the volumetric change rate of sediment can also be calculated by the following:
d V d t = A t × D
In this study, we estimated the longshore sediment transport rates (LSTR) for the two study areas using Equations (4) and (5), which enables a comparison of the estimated LSTR using two methods (i.e., shoreline and beach area change rates). Although both equations seem identical, some differences in the estimated LSTR were observed, as presented in Section 4.3.

3.4. Depth of Closure and Berm Height

Here, we calculated the depth of closure using the Hallermeier equation [59]:
D C = 2.28 H s 68.5 H s 2 g T s 2
where H s and T s are the non-breaking significant wave height and period for an exceedance probability of 0.137% in a year, respectively, and g is the acceleration due to gravity. The offshore wave data extracted from the WaveWatch III model [43] were transformed to the nearshore using the COASTEXCEL tool [60]. Duy et al. [61] applied and validated the wave transformation tool at the Phu Quoc island in Vietnam, which showed good agreement with measured datasets. Furthermore, inaccuracies in estimating the depth of closure may also arise from Equation (6) coefficients, wave reanalysis products, and coastal structures’ presence [62,63,64]. Therefore, we applied an error margin of ±20% to the calculated depth of closure values obtained from Equation (6).
The berm height was calculated using an empirical relationship derived by Uda [65], which was derived using measured datasets along the Japanese coastline:
D B = 0.32 × D C
Although field measurements of the beach profile should be a suitable approach for determining the berm height, the relationship by Uda [65] is an alternative for data-scarce locations. It must also be noted that the berm height is dependent on the grain size in the foreshore, beach slope, and wave action [65]. Hence, the coefficient in Equation (7) is another limitation of the current study. Further data collection of beach profiles within the study areas would be needed to accurately calibrate the relationship provided in Equation (7).

4. Results

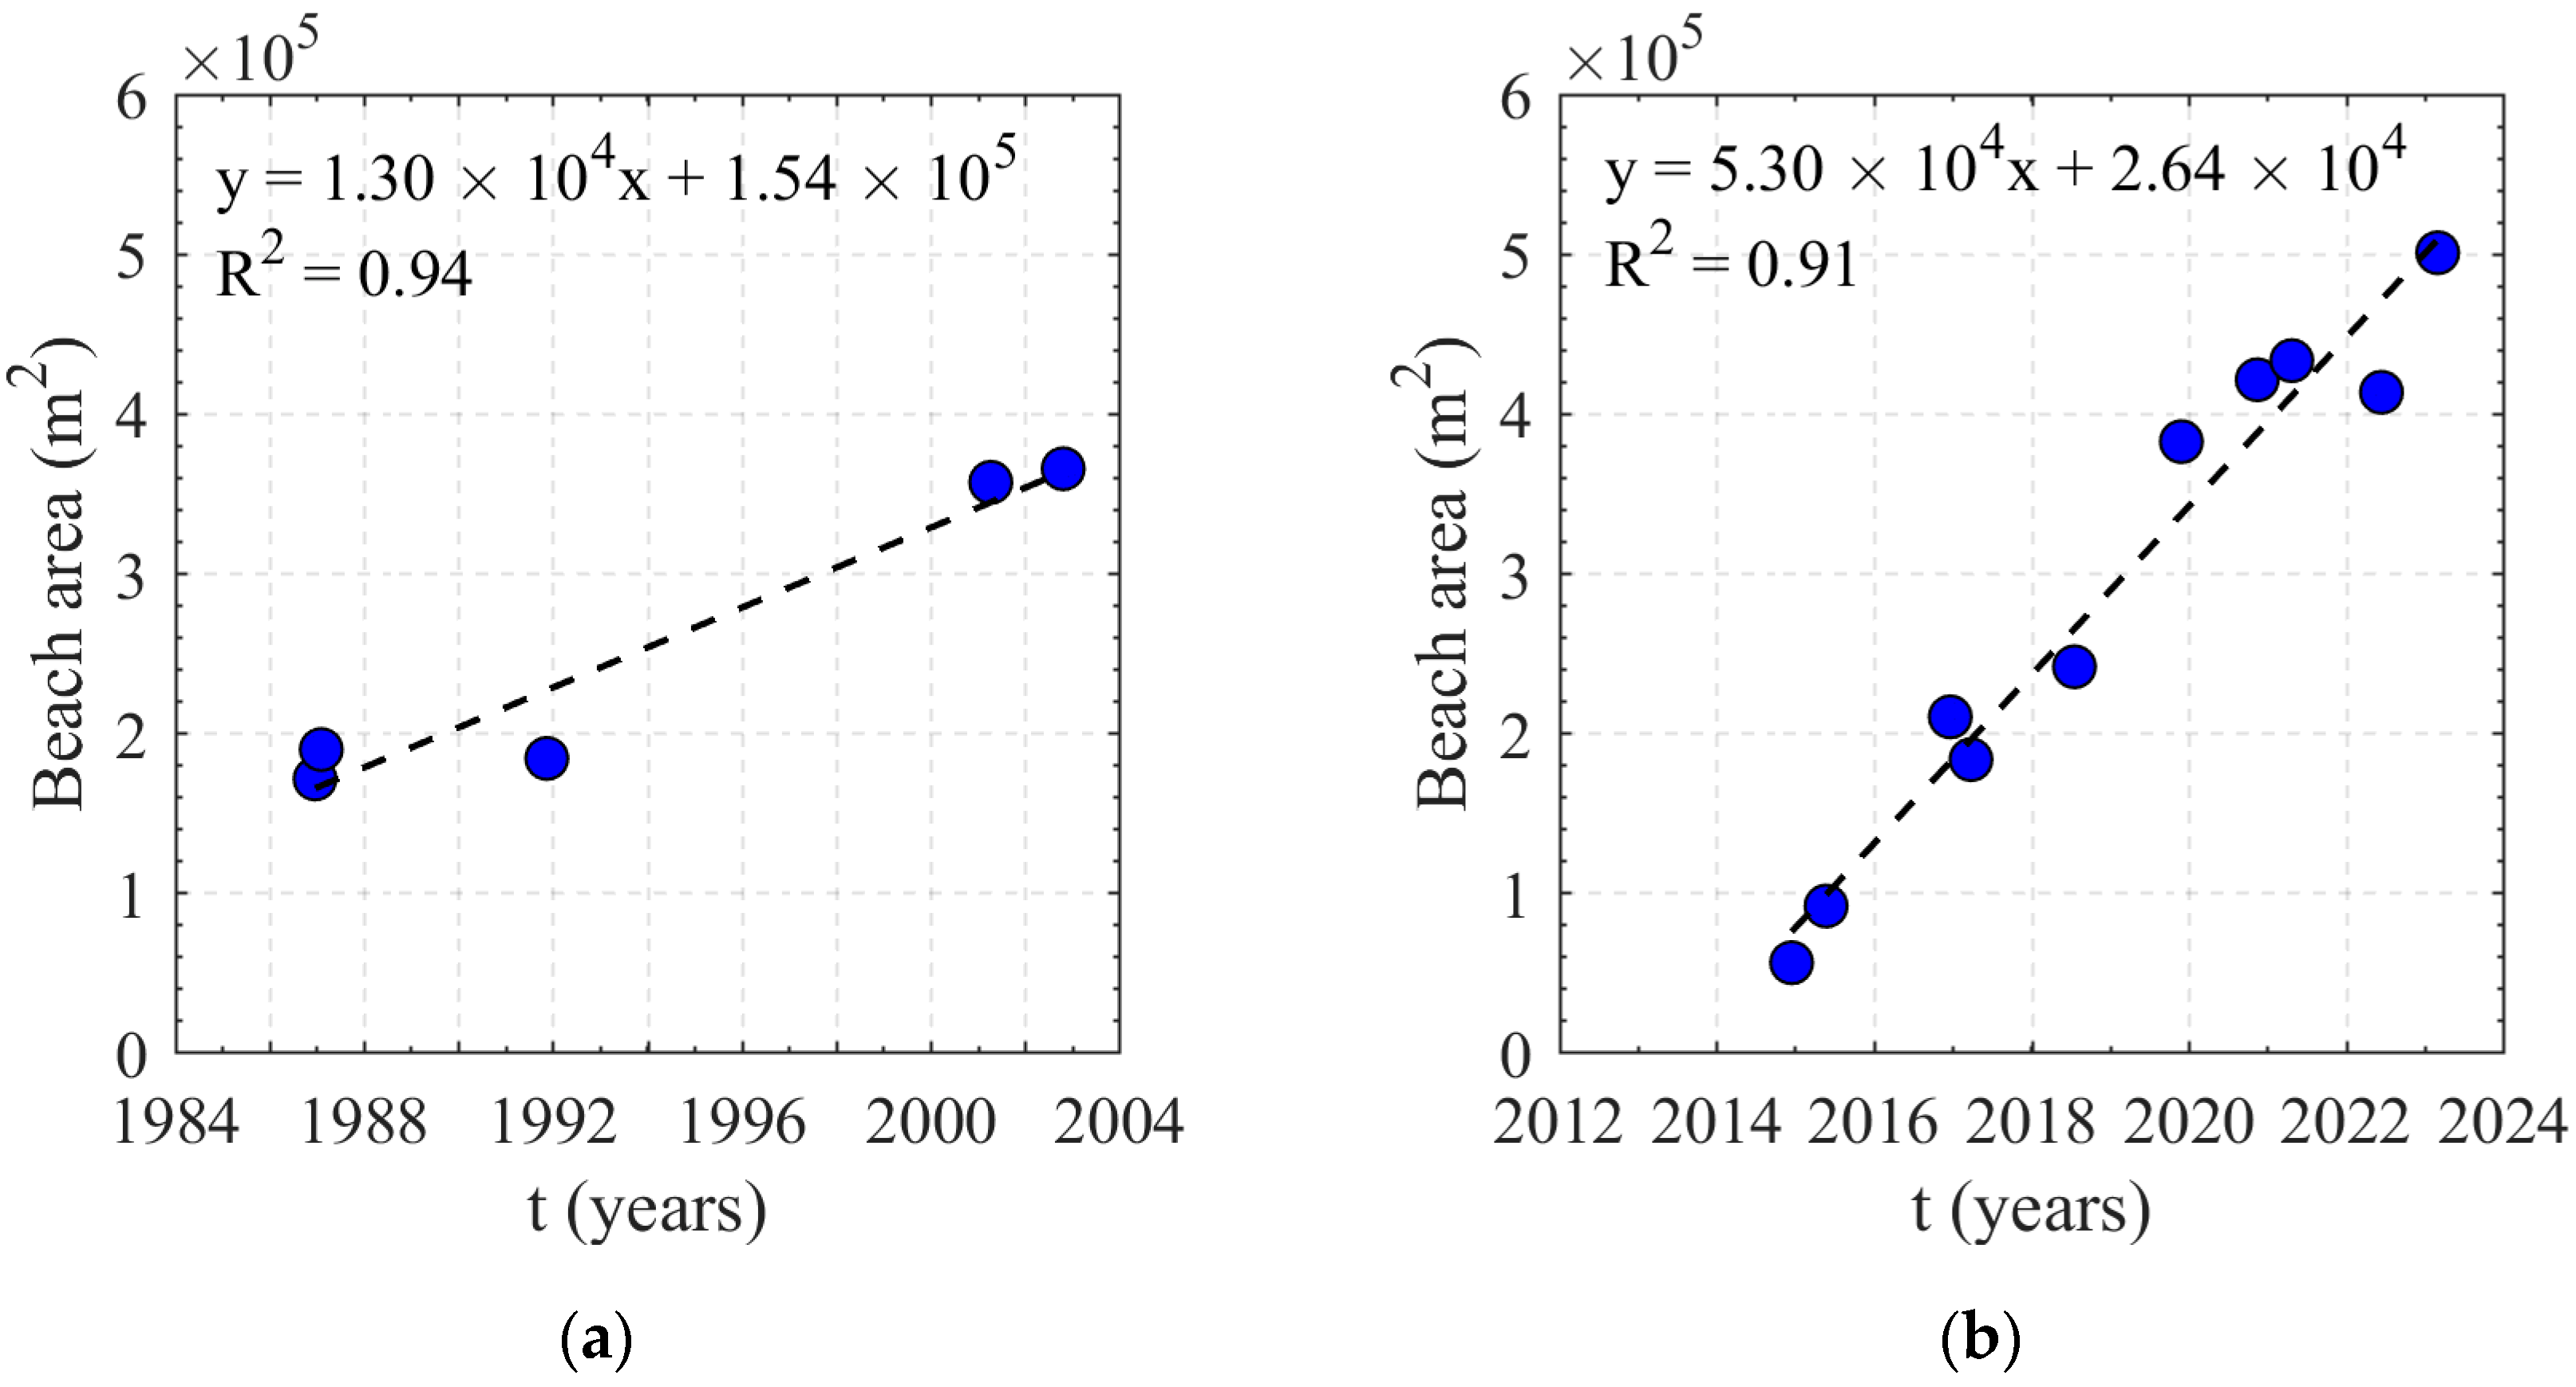
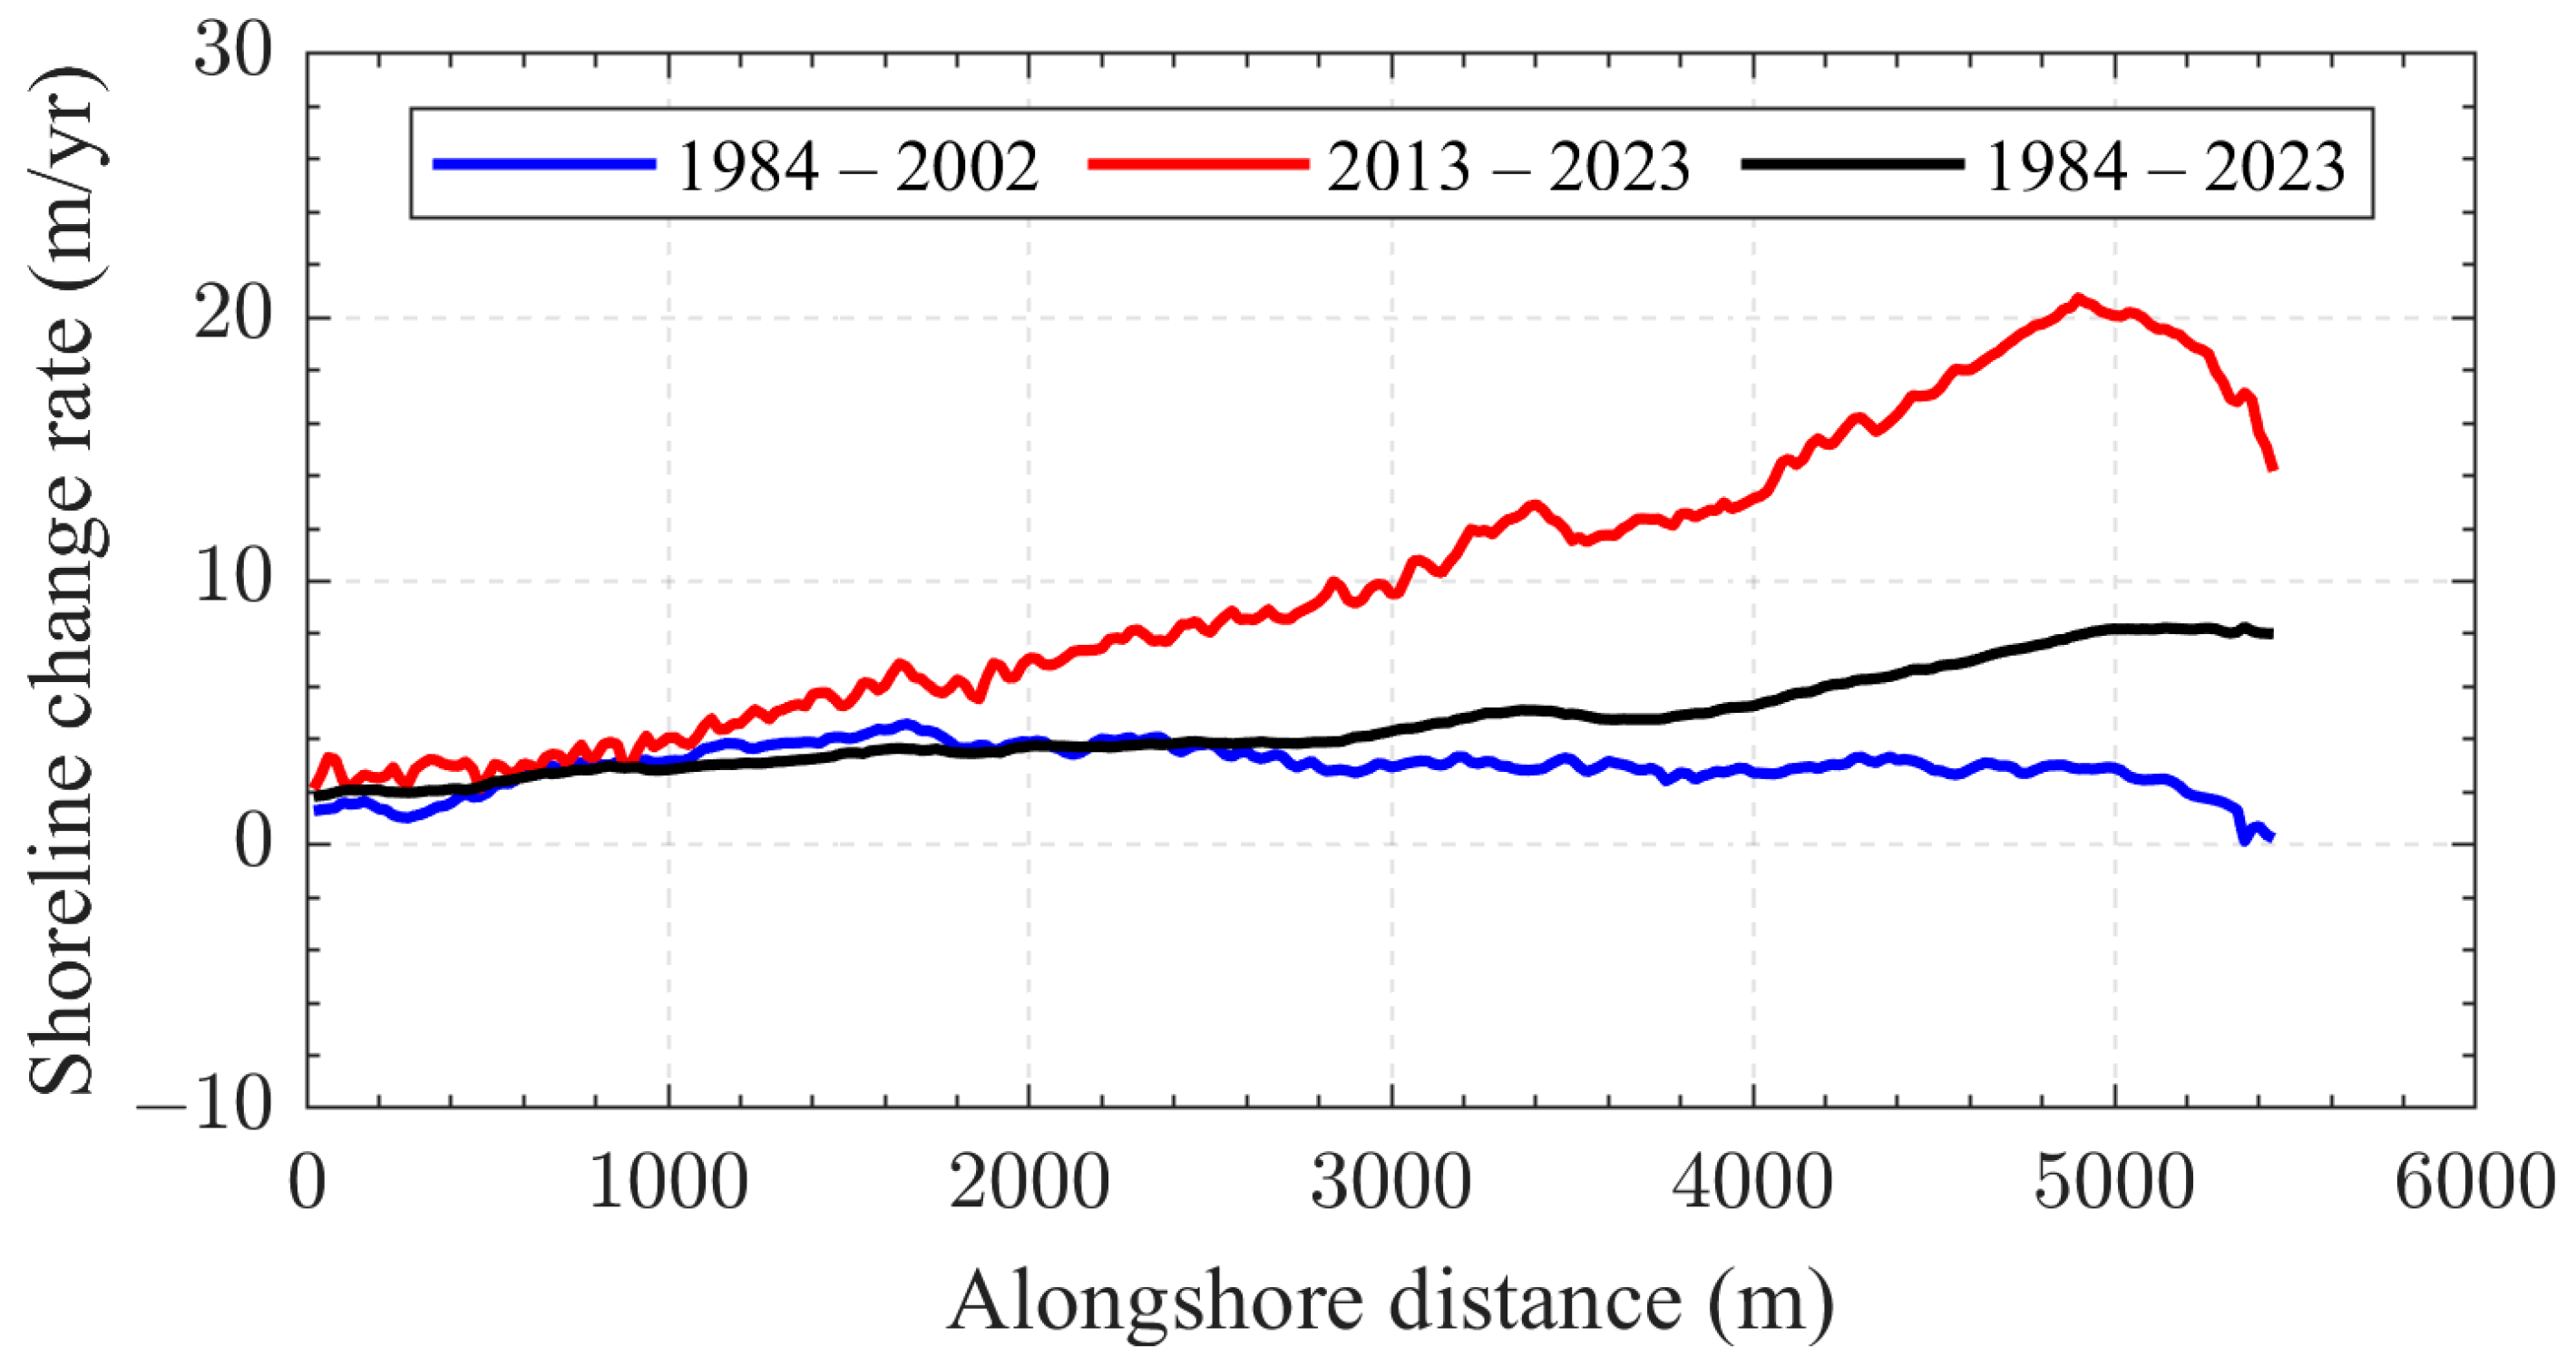
4.1. Case Study 1: Port of Lomé

Two time periods were distinguished to analyze the shoreline and sediment disposition patterns at the Port of Lomé from 1984–2021. The first period (1984–2002) represents the era before the port expansion project (Figure 7a), whereas the period between 2014 and 2023 corresponds to the post-sandbar construction period (Figure 7b). By doing so, a comprehensive comparison can be made to determine the effectiveness of the sandbar breakwater technology. The eastern boundary was chosen to prevent the inclusion of portions of the sandbar breakwater where land reclamation and beach nourishment were conducted (Figure 7b). We also defined the western boundary using the Wharf Allemand landmark where minimal shoreline change was observed during the study period. Based on these predefined spatial boundaries, a total of 5460 m shoreline length was analyzed.
Figure 8 shows the results of the net shoreline movement (NSM), indicating the changes in total horizontal shoreline position. Although two periods were defined for the Lomé port, the NSM results in Figure 8 depict changes in the shoreline positions within the predefined spatial boundaries in the analysis from 1984–2023. Over these 39 years, this study area experienced a 100% seaward shoreline movement, with the average and maximum NSM being ~203 m and ~327 m, respectively.
In addition to the NSM, the shoreline change rate estimated using the linear regression rate (LRR) shows dominant seaward shoreline trends, with 100% of the transects recording positive distances (Figure 9). From 1984–2002, the maximum accretion rate is estimated to be ~4.60 ± 1.40 m/year and an average of ~3.0 ± 0.35 m/year for all the transects. After the construction of the sandbar breakwater (Period 2: 2013–2023), as expected, the positive shoreline change rate increased drastically. A maximum positive rate of ~20.75 ± 2.62 m/year is recorded, with an average rate of ~10.02 ± 0.71 m/year for this period.
Even though shoreline change rates provide detailed trends in coastal morphological processes, the change in the beach area is an equally important quantity that can supplement these results [66]. Here, we set the oldest shoreline as the landward boundary for each defined period (1984 for Period 1 and 2013 for Period 2) and performed linear regression analysis to obtain the beach area change rate in m2/year. The estimated beach area change rates were 13,000 ± 2000 m2/year and 53,000 ± 4000 m2/year for Periods 1 and 2, respectively (Figure 10).

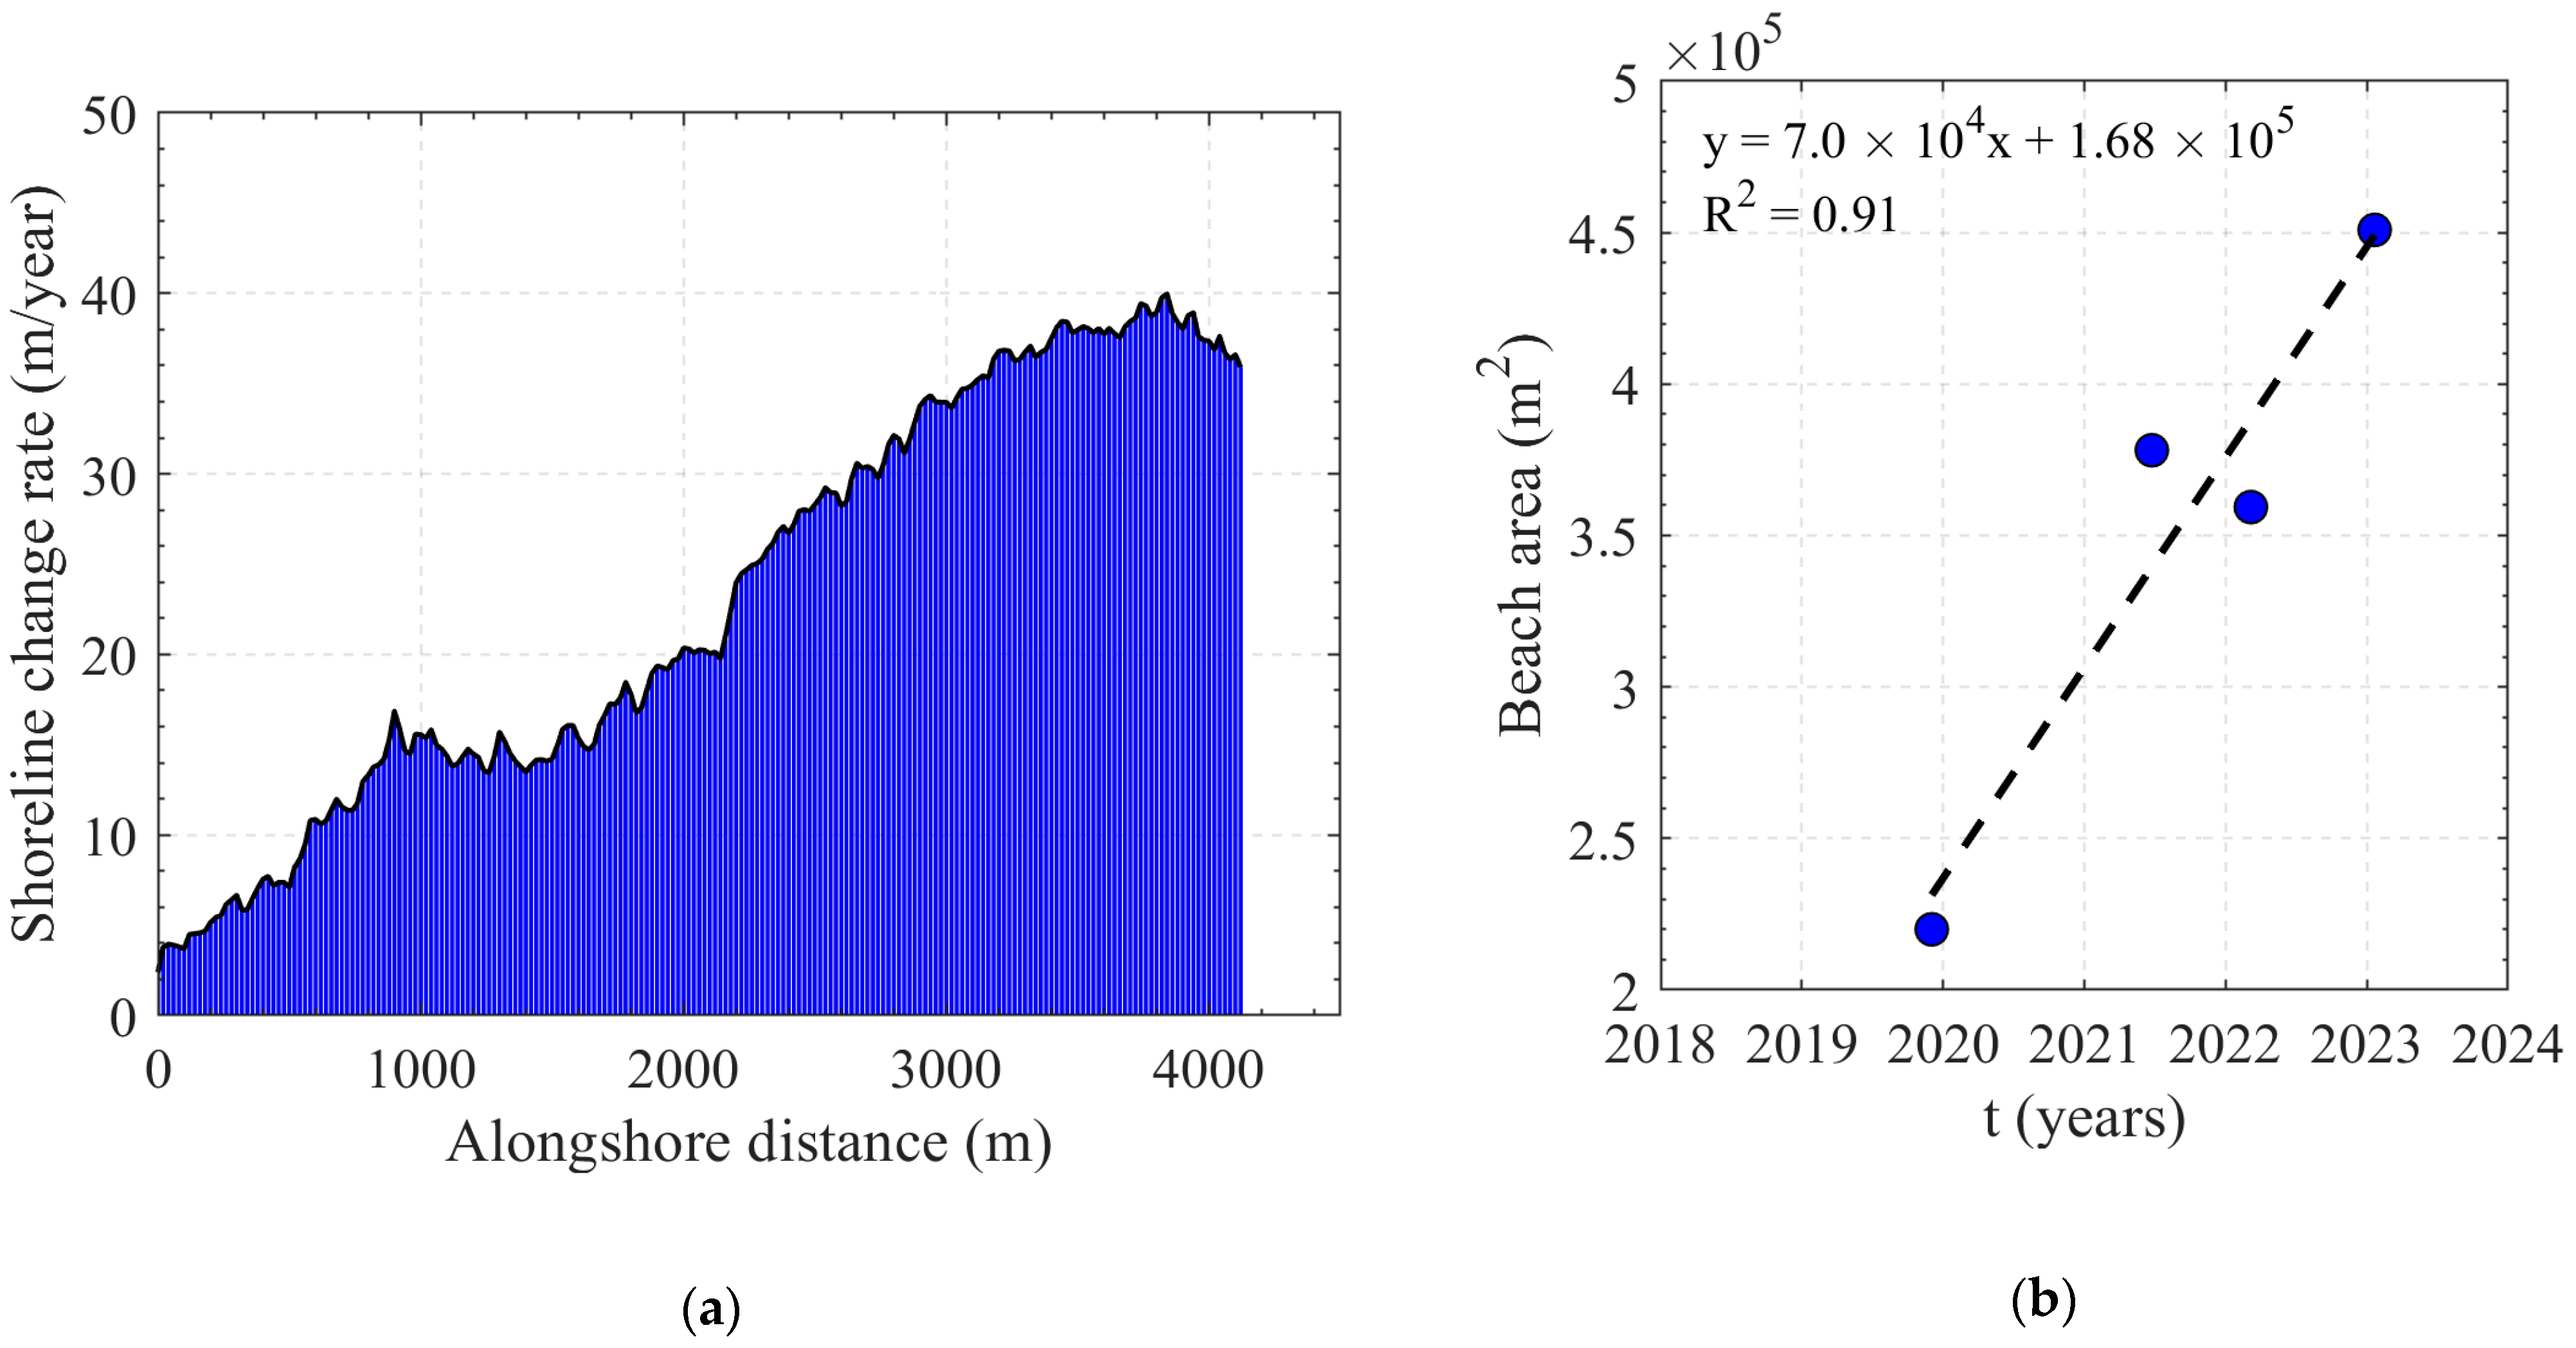
4.2. Case Study 2: Lekki Deep Sea Port (LDSP), Nigeria

For the LDSP, only one period was considered when preparing this paper given that it is a more recent, ongoing project. The analysis conducted here spans from 2018–2023 and represents a case where the sandbar breakwater is constructed from scratch on a rectilinear coastline. Here, the eastern boundary for the analysis was selected using the same criteria as for the Port of Lomé (Figure 11). The western boundary was placed ~4.20 km away from the Lekki Port to prevent the inclusion of possible erosion trends initiated by the ongoing construction (Figure 4). The total shoreline analyzed at the LDSP is ~4120 m.
The results of the NSM analysis for the second case study also show a 100% shoreline advancement due to deposited sediment along the updrift shore of the sandbar breakwater. A maximum and average net shoreline movement of ~191 m and ~110 m was estimated, respectively, for the 5-year study period considered (Figure 12).
Concerning the shoreline change rates, all transects recorded accretional trends with a maximum change rate of 39.97 ± 17.15 m/year and an average rate of 22.83 ± 4.43 m/year (Figure 13a). The beach area for the LDSP was estimated using the 2018 shoreline as the reference landward boundary, which yielded a change rate of 70,000 ± 15,000 m2/year (Figure 13b).

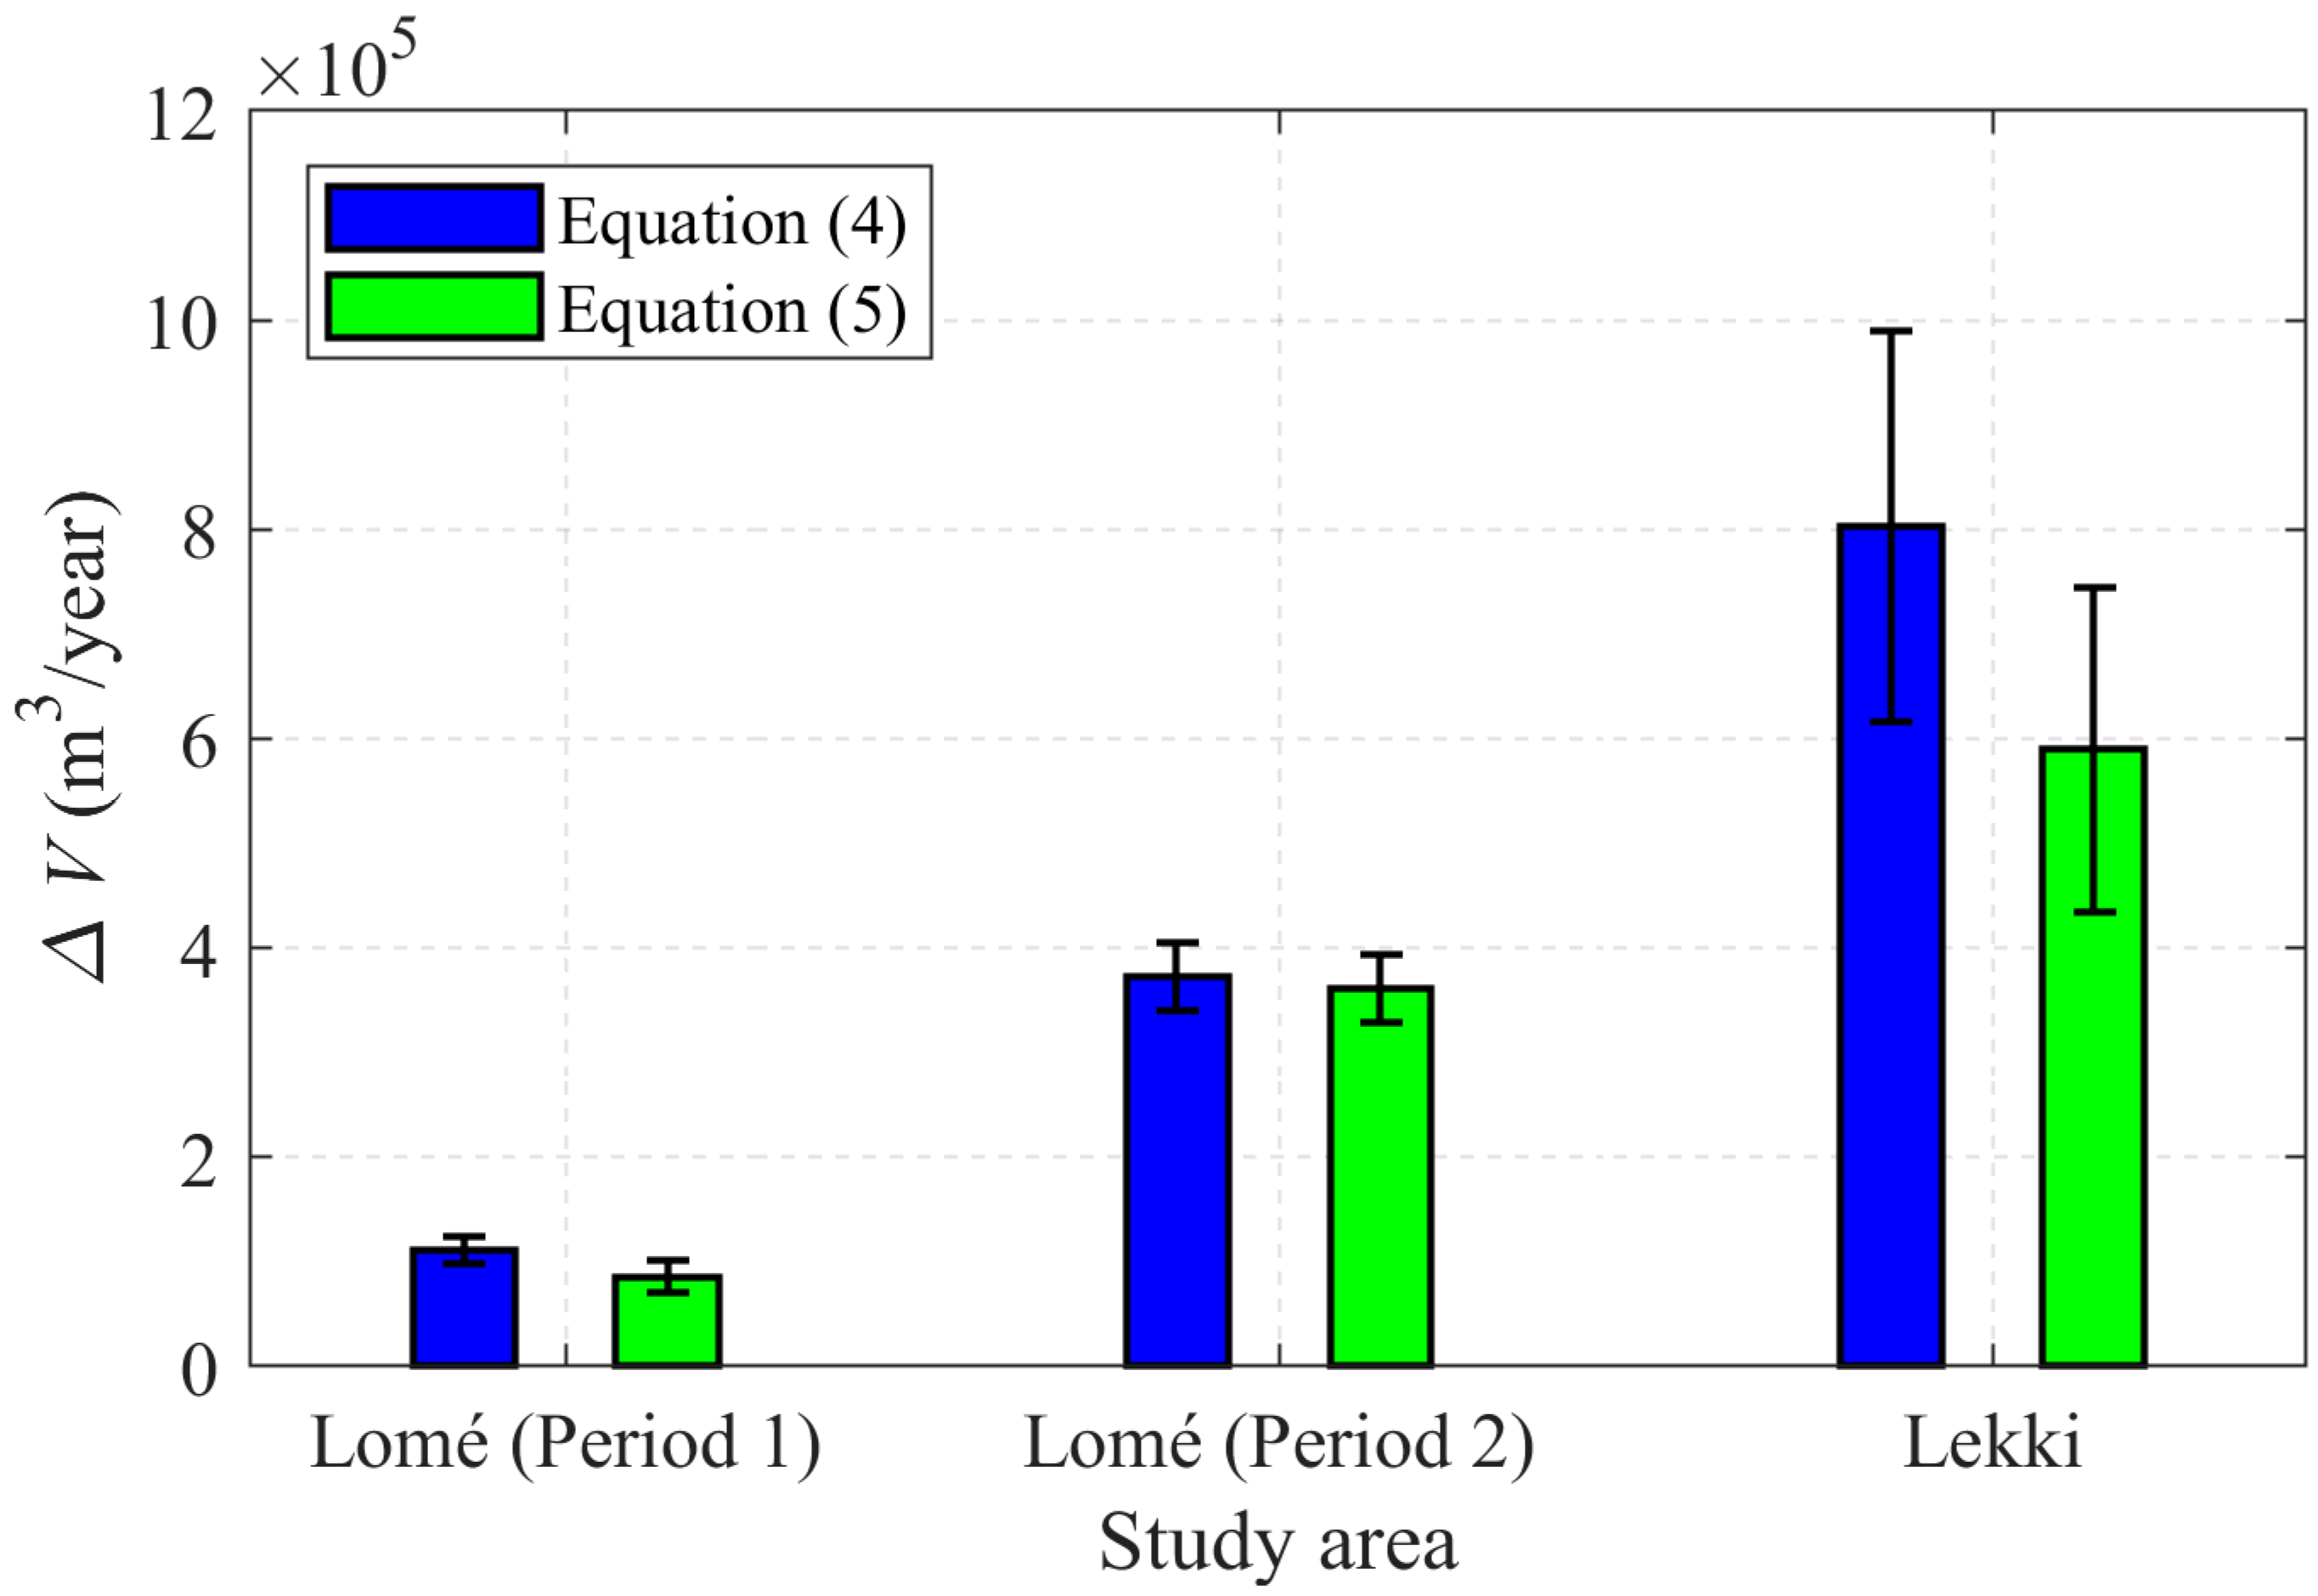
4.3. Impounded Longshore Sediment Transport

As mentioned in Section 3.3, the deposited sediment at the two study sites was estimated using Equations (4) and (5). The results of the calculated LSTR for the two case studies are presented in Figure 14. The error bars (black) in Figure 14 account for uncertainties in the shoreline positions and the calculated depth of active sediment motion.
At the Port of Lomé, we estimated D C and D B to be 4.60 m and 1.47 m, respectively. Between 1984 and 2002 (Period 1), deposition volume rates of 9.84 × 10⁴ and 7.58 × 10⁴ m3/year of sediment were estimated using Equations (4) and (5), respectively (i.e., an average of ~8.71 × 10⁴ m3/year within the study period considered). On the other hand, estimates of deposited sediment in the post-port expansion period (2013–2023) are ~3.30 × 10⁵ and ~3.20 × 10⁵ m3/year as calculated from Equations (4) and (5), respectively. Hence, the average LSTR deposited post-port expansion is estimated at ~3.25 × 10⁵ m3/year.
Considering the LDSP, we estimated the depth of active sediment motion to be 7.43 m ( D C = 5.63 m and D B = 1.80 m). Consequently, the calculated amount of impounded sediment at the sandbar breakwater using Equations (4) and (5) was ~8.03 × 10⁵ and ~5.90 × 10⁵ m3/year, respectively, resulting in an average sediment deposition of ~7.0 × 10⁵ m3/year from the 2018–2023 period.

4.4. Comparisons with Other Sediment-Accreting Landforms

Longshore sediment transport sequestering at sandspits formed at river mouths or inlets also offers a way to quantify transport rates. At these locations, hydrodynamic interactions are far more complicated than those on open coasts but exhibit, to a great extent, the general morphological trends along the coast on a regional scale [18]. In this section, we performed a comparative study of sediment accretion rates using the sandspits at the Volta River mouth, Ghana, and the Bouche du Roi inlet, Benin, as estimated by Lawson et al. [67]. These rates were estimated using satellite images and a sandpit elongation model based on the conservation of sand volume [68,69]. The sandbar breakwater can be likened to a “restricted flying spit” in terms of its design orientation and sediment accretion properties. Thus, it allows for comparing estimated LSTR (after sandbar breakwater construction) at the respective locations.
The sediment transport building up the Volta River mouth and Bouche du Roi inlet spits were estimated to be ~1.25 × 10⁶ m3/year (1984–2012) and ~1.20 × 10⁶ m3/year (1984–2019), respectively [67]. It is worth mentioning that the spit at the Volta River mouth was restricted as part of a sea defense project in 2013. Therefore, current morpho-sedimentary processes may differ from those reported in previous studies [70]. Figure 15 compares four major sediment accretion locations within the Bight of Benin. The differences in the magnitude of LSTR can be attributed to the variations in hydrodynamic interactions at the respective locations. In wave-dominated coastal environments, sediment supplied from rivers is reworked and transported by wave-driven currents, which are often trapped by river mouths or inlets to form spits [71]. In most cases, sediment bypassing depends on the river discharge or the magnitude of the littoral drift [18]. Hence, sediment supplied from the Volta and Mono Rivers, whose outlets are the location of the two spits considered in this part of the discussion, heavily influences the large magnitude of LSTR (Figure 2). This condition is also supported by the south-westerly swells approaching the coast.

5. Discussions

5.1. Summary of Case Studies

This paper uses the one-line model and remotely sensed images to quantify the deposited longshore sediment transport volume at two sandbar breakwaters along the Bight of Benin coast in West Africa. At the Port of Lomé, significant differences in the amount of deposited sediment can be observed before and after the sandbar breakwater introduction (Figure 14). After the construction of the first port breakwater in 1967, the deposited volume was estimated to be between 1.2–1.4 × 10⁶ m3 [72]. In 1984, a large amount of sediment dredging (~5.50 × 10⁵ m3) was warranted at the port, to maintain suitable water depths needed to access the port [31]. The relatively low magnitude of impounded LSTR from 1984 to 2002 (~8.71 × 10⁴ m3/year) indicates that a significant portion of sedimentation at the port occurred in the first two decades upon its completion. Owing to the port expansion project in 2012, the LSTR increased by ~79% as the breakwater and shoreline orientations were altered. Installing a groyne ~2.2 km west of the breakwater tip also facilitated the sedimentation process mentioned before. These temporal changes can also be attributed to a decrease in the frequency of swell-generating storms in the Atlantic Ocean within the first period (1984–2002) [28]. In the second case study at the Lekki Deep Sea Port (LDSP), we estimated the LSTR to be in the order of 105 m3/year at the newly built port. Also, the shoreline has advanced seaward by an average distance of ~110 m. The sediment transport magnitudes computed using the adopted approaches are in good agreement with previous studies that used other methods at the case study sites [21,28,73,74].

5.2. Influence of River Sediment Supply and Wave Climate

The results presented in the comparative study suggest that the littoral drift along the Bight of Benin coast is high resulting from a combination of sediment input from rivers and the prevailing wave climate. Sediment supply to the coastal system of the study area is mainly driven by five rivers, viz., Volta, Mono, Ouèmè, Ogun, and Niger Rivers (Figure 2). The magnitude of sediment from these rivers is in the order of 106 m3/year [34,38,73,75,76]. As such, the importance of these rivers to the coastal system cannot be overemphasized. Hydrologic modifications to these rivers have been reported to significantly reduce river sediment supply, especially from the Volta [77], Mono [76], and Niger [34] rivers. These changes have also induced significant changes within the coastal system (sediment imbalances, shoreline erosion, delta evolution) [34,67,74,78,79,80]. Similar trends observed in other study areas suggest the need to carefully consider the modifications to river and estuarine systems [81,82,83].
Also, the prevailing wave climate within the Bight of Benin is uniform concerning its wave period and direction throughout the year. The average of all the wave data extracted from the WaveWatch III model yields a wave period of 12.5 s and a dominant direction of 198° clockwise from the north. The rectilinear nature of the coastline within the bight means that incident waves are significantly oblique (10°–20°). These wave conditions and a significant river sediment supply allow for a large longshore transport along the coast. According to Almar et al. [28], swell-generated sediment transport rates are usually an order of magnitude larger than those generated by wind waves.
A major requirement in the design of the sandbar breakwater is the need for a uniform wave climate, which makes the Bight of Benin a suitable location. With these uniform conditions, accurate predictions of longshore morphological variations are possible, thus, preventing unforeseen damage to the structural integrity of the breakwater [21].

5.3. Sediment Transport around Ports in Other Coastal Areas

The hydrodynamic and geographic similarities between the two case study sites have enabled the investigation and comparison of induced coastal evolution by the sandbar port breakwater at these locations. To build on this knowledge, we compared the observed morphological changes in the current study to three ports with conventional breakwaters in different geographic locations. We used results in previous literature for the Sendai Port, Japan [84,85], the Port of Klaipėda, Lithuania [86,87], and the Visakhapatnam Port, India [88,89].
At the Sendai Port, sediment trapping by the main breakwater was expected on the updrift coastline after its completion. However, a sediment volumetric loss of c.a. −3.20 × 10⁴ m3/year was recorded on the updrift coastline (~1.2 km) after its construction (1964–1983). Further analysis of aerial photographs from 1983–2009 revealed accretion rates of c.a. 1.30 × 10⁴ m3/year. Here, the proximity of the Nanakita River mouth to the Sendai Port, which is located on the updrift section of the port (~1.6 km from the port) plays a vital role as a source (river sediment supply) and a sink (sandspit elongation) along this coastline. The episodic change of sediment transport rates at this port greatly differs from observations in the current study where rapid sediment deposition was recorded after the port construction/expansion. Another example of this episodic coastal evolution is the Port of Klaipėda. Sediment accretion trends were observed after the start of its construction from 1935–1910 on the updrift section of the breakwater (~750 m). However, the shoreline began to retreat as a result of channel entrance dredging around the breakwater from 1910–2004, even though sufficient longshore sediment transport was available.
Monsoon-induced changes in the direction of the longshore sediment transport also play an important role in the coastline evolution, especially around port breakwaters and other coastal infrastructure. For instance, the littoral drift near the Visakhapatnam Port is typically in the range of ~4.90 to 8.80 × 10⁴ m3/month from November to February (southward-oriented drift). Due to changes in the wave direction, the sediment transport from March to October ranges between 0.34 to 1.70 × 10⁵ m3/month (northward-oriented drift). Coupled with storm surges, these seasonal variations of sediment transport cause cyclic beach morphology near the port. With storms seldom occurring in the Bight of Benin and a prevailing unidirectional longshore current, it is evident that the sandbar breakwater concept is an ideal port solution for the Bight coast.

5.4. Lessons for Future Coastal Management

As the final part of our discussions, we identified lessons that could be drawn from current coastal management activities in West Africa based on literature [73,80,90,91,92,93] and the results/limitations of this study. The two key lessons include the following:
  • Continuous adoption of sustainable and modern technologies in coastal infrastructure.
Implementing the sandbar breakwater concept at Lomé (Togo) and Lekki (Nigeria) allows other West African countries, particularly in the Bight of Benin, to explore this technology in future port projects. For instance, the proposed construction of a port at Keta (Ghana) should properly consider its implications on downdrift areas. Although erosion is inevitable on the downdrift shoreline of a port breakwater, provisions for nourishment campaigns enable the stabilization of the coastline. The “Sand Engine” approach utilized in the sandbar breakwater design also uniquely protects vulnerable coastal zones along the downdrift shores.
2.
Creating and promoting a unified coastal network for knowledge sharing and joint field surveys to minimize over-dependence on global datasets.
Field datasets are undoubtedly the most reliable datasets required for comprehensive research activities. With such a unified ground data collection/observation system, the numerous uncertainties arising from using global datasets would be avoidable. The efforts and collaborations of institutions/programs such as the Africa Centre of Excellence in Coastal Resilience (ACECoR), West African Regional Coastal Observatory (ORLOA), the World Bank-funded West Africa Coastal Areas (WACA) program, and the African coastal camera network monitoring project by Abessolo et al. [91] are highly commendable in promoting this goal within the Bight of Benin and Africa as a whole. Regional or continental-based studies are also crucial for understanding general coastal processes and the impact of localized engineering projects.

6. Conclusions

The recent coastal developments along the Bight of Benin offer a unique opportunity to examine how the natural environment responds to changes in sedimentary and hydrodynamic conditions. Nature-based solutions are usually hailed as the way forward to promoting the sustainability of the coastal environment. The two case studies presented in this paper are typical examples of how prevailing hydrodynamic and sedimentary conditions can be utilized to the advantage of coastal projects. In other words, the sandbar breakwater can be described as a solution that uses hard and soft engineering techniques. In its design, a large amount of sediment deposition was expected along the updrift shoreline of the sandbar breakwater and has been quantified in the current study.
The longshore sediment transport reported in this paper corroborates the assertions that the magnitude of transport rates along the Bight of Benin coast is one of the largest in the world [28,39,67]. Sediment impoundment at the two study sites provided a means to conduct our LSTR analysis. The introduction of the sandbar breakwater design at the Port of Lomé (Togo) as part of an expansion project resulted in sediment deposition at an average rate of 3.25 × 10⁵ m3/year over ten years (2013–2023). Elsewhere in Lekki, Nigeria, the calculated transport rates yielded an average of 7.0 × 10⁵ m3/year over 5 years (2018–2023) after the breakwater construction. It is worth noting that the sediment availability within the bight is abundant due to large sediment input from rivers and a uniform wave climate. The sandbar breakwater concept proves that socio-economic benefits could be derived from the prevailing morphodynamic settings within the study sites. Although assurances have been given to maintaining a nourishment program at locations downdrift to the ports, it should be ensured that these activities are implemented without compromise [37]. By doing so, the sustainability of the coastal environment and the livelihood of fisherfolks can be protected.
The findings from the case studies in this paper provide a further understanding of sediment transport processes and morphological evolution in the Bight of Benin, West Africa. It could serve as a basis for conducting detailed field studies for further analysis concerning changes in beach profiles, sediment size distribution, and other relevant hydrodynamic processes. Additionally, the quantified amount of deposited sediment would be helpful in dredging projects at the study sites, should such a necessity arise in future. From a broader perspective, the paper discusses how policymakers and coastal engineers can adopt new technologies to meet socio-economic demands in developing countries while emphasizing the need to protect the natural environment. In other coastal environments, conventional port or shore-protection designs could be modified to fit prevailing hydrodynamic and sediment transport conditions to support the concept of Building with Nature.

Author Contributions

Conceptualization, S.K.L. and H.T.; methodology, S.K.L. and H.T.; software, S.K.L. and J.B.; formal analysis, S.K.L. and H.T.; investigation, S.K.L.; data curation, S.K.L.; writing—original draft preparation, S.K.L.; writing—review and editing, K.U., H.T. and J.B.; visualization, S.K.L.; supervision, K.U., H.T. and J.B. All authors have read and agreed to the published version of the manuscript.

Funding

This research received no external funding.

Institutional Review Board Statement

Not applicable.

Informed Consent Statement

Not applicable.

Data Availability Statement

The satellite images used in this study can be retrieved from the Google Earth Engine (GEE) via the CoastSat toolkit (https://github.com/kvos/CoastSat; accessed on 29 May 2023). Further data requests should be addressed to the corresponding author or S.K.L. ([email protected]).

Conflicts of Interest

The authors declare no conflict of interest.

References

  1. Moraes, R.P.L.; Reguero, B.G.; Mazarrasa, I.; Ricker, M.; Juanes, J.A. Nature-Based Solutions in Coastal and Estuarine Areas of Europe. Front. Environ. Sci. 2022, 10, 829526. [Google Scholar] [CrossRef]
  2. Davis, M.; Krüger, I.; Hinzmann, M. Coastal Protection and Suds-Nature-Based Solutions: Policy Brief No.4; Ecologic Institute: Berlin, Germany, 2015. [Google Scholar]
  3. Slinger, J.; Stive, M.; Luijendijk, A. Nature-Based Solutions for Coastal Engineering and Management. Water 2021, 13, 976. [Google Scholar] [CrossRef]
  4. de Boer, W.P.; Slinger, J.H.; wa Kangeri, A.K.; Vreugdenhil, H.S.I.; Taneja, P.; Appeaning Addo, K.; Vellinga, T. Identifying Ecosystem-Based Alternatives for the Design of a Seaport’s Marine Infrastructure: The Case of Tema Port Expansion in Ghana. Sustainability 2019, 11, 6633. [Google Scholar] [CrossRef]
  5. European Sea Ports Organisation. The ESPO Green Guide; Towards Excellence in Port Environmental Management and Sustainability; EcoPorts: Brussels, Belgium, 2012. [Google Scholar]
  6. PIANC. “Sustainable Ports”: A Guide for Port Authorities; PIANC Secrétariat Général: Brussels, Belgium, 2014. [Google Scholar]
  7. de Boer, W.; Mao, Y.; Hagenaars, G.; de Vries, S.; Slinger, J.; Vellinga, T. Mapping the Sandy Beach Evolution around Seaports at the Scale of the African Continent. J. Mar. Sci. Eng. 2019, 7, 151. [Google Scholar] [CrossRef]
  8. Wu, W. Coastline Evolution Monitoring and Estimation—A Case Study in the Region of Nouakchott, Mauritania. Int. J. Remote Sens. 2007, 28, 5461–5484. [Google Scholar] [CrossRef]
  9. Manohar, M. Sediment Movement at Indian Ports. Coast. Eng. Proc. 1960, 1, 21. [Google Scholar] [CrossRef]
  10. Poulos, S.; Chronis, G. Coastline Changes in Relation to Longshore Sediment Transport and Human Impact, along the Shoreline of Kato Achaia (NW Peloponnese, Greece). Mediterr. Mar. Sci. 2001, 2, 5–13. [Google Scholar] [CrossRef]
  11. Samsami, F.; Haghshenas, S.A.; Soltanpour, M. Physical and Rheological Characteristics of Sediment for Nautical Depth Assessment in Bushehr Port and Its Access Channel. Water 2022, 14, 4116. [Google Scholar] [CrossRef]
  12. Griggs, G.B. Littoral Cells and Harbor Dredging along the California Coast. Environ. Geol. Water Sci. 1987, 10, 7–20. [Google Scholar] [CrossRef]
  13. Jean-Baptiste, K.A.; Atcha, A.D.; Damien, K.A.K. Comparative Analysis of DSAS and MobiTC in Coastal Coastline Dynamics of Baguida and Agbodrafo Cantons (South-East Togo) from 1986 to 2017. Int. J. Comput. Trends Technol. 2018, 56, 32–37. [Google Scholar] [CrossRef]
  14. Wang, X.H.; Andutta, F.P. Sediment Transport Dynamics in Ports, Estuaries and Other Coastal Environments. In Sediment Transport Processes and Their Modelling Applications; Manning, A.J., Ed.; InTechOpen Limited: London, UK, 2013; Volume 11, p. 35. [Google Scholar] [CrossRef]
  15. Bruun, P. The Development of Downdrift Erosion. J. Coast. Res. 1995, 11, 1242–1257. [Google Scholar]
  16. Kim, I.H.; Lee, J.L. Changes in the Sediment Transport Pattern after Breakwater Extension at Anmok Port, Korea. J. Coast. Res. 2007, 50, 1046–1050. [Google Scholar]
  17. Naik, D.; Kunte, P.D. Impact of Port Structures on the Shoreline of Karnataka, West Coast, India. Int. J. Adv. Remote Sens. GIS 2016, 5, 1726–1746. [Google Scholar] [CrossRef]
  18. Bosboom, J.; Stive, M.J.F. Coastal Dynamics; Delft University of Technology: Delft, The Netherlands, 2023. [Google Scholar] [CrossRef]
  19. Di Natale, M.; Di Ronza, S.; Eramo, C.; Vigliotti, M.; Ruberti, D. A Sediment Trap to Mitigate Port Silting Due to Longshore Transport. The Case of Pinetamare Marina (Southern Italy). J. Coast. Conserv. 2017, 21, 803–812. [Google Scholar] [CrossRef]
  20. Schoonees, J. Annual Variation in the Net Longshore Sediment Transport Rate. Coast. Eng. 2000, 40, 141–160. [Google Scholar] [CrossRef]
  21. van der Spek, B.-J.; Bijl, E.; van de Sande, B.; Poortman, S.; Heijboer, D.; Bliek, B. Sandbar Breakwater: An Innovative Nature-Based Port Solution. Water 2020, 12, 1446. [Google Scholar] [CrossRef]
  22. Moesker, N. Sandbar Breakwaters: Analysis of the Effects of Variations in Wave Climate on the Morphological Development of Sandbar Breakwaters by Using the Lekki Sandbar Breakwater Case Study. Master’s Thesis, Delft University of Technology, Delft, The Netherlands, December 2019. [Google Scholar]
  23. Peters, J.H.J. The Determination of the Feasibility of a ‘Sand Breakwater’ on the Nigerian Coastline at Badagry. Master’s Thesis, Delft University of Technology, Delft, The Netherlands, March 2018. [Google Scholar]
  24. Mlambo, C. The Impact of Port Performance on Trade: The Case of Selected African States. Economies 2021, 9, 135. [Google Scholar] [CrossRef]
  25. African Development Bank. African Development Report: Ports, Logistics, and Trade in Africa; Oxford University Press: New York, NY, USA, 2010. [Google Scholar]
  26. African Union. Maritime Transport: Increasing African Ports Capacity and Efficiency for Economic Growth; African Union: Addis Abba, Ethiopia, 2017. [Google Scholar]
  27. U.S. Army Corps of Engineers (USACE). Longshore Sediment Transport. In Coastal Engineering Manual; EM 110-2-1100; U.S. Army Corps of Engineers: Washington, DC, USA, 2002. [Google Scholar]
  28. Almar, R.; Kestenare, E.; Reyns, J.; Jouanno, J.; Anthony, E.J.; Laibi, R.; Hemer, M.; Du Penhoat, Y.; Ranasinghe, R. Response of the Bight of Benin (Gulf of Guinea, West Africa) Coastline to Anthropogenic and Natural Forcing, Part1: Wave Climate Variability and Impacts on the Longshore Sediment Transport. Cont. Shelf Res. 2015, 110, 48–59. [Google Scholar] [CrossRef]
  29. Laïbi, R.A.; Anthony, E.J.; Almar, R.; Castelle, B.; Senechal, N.; Kestenare, E. Longshore Drift Cell Development on the Human-Impacted Bight of Benin Sand Barrier Coast, West Africa. J. Coast. Res. 2014, 70, 78–83. [Google Scholar] [CrossRef]
  30. Aagaard, T.; Anthony, E.J.; Gillies, B.; Laursen, S.N.; Sukstorf, F.N.; Breuning-Madsen, H. Holocene Development and Coastal Dynamics at the Keta Sand Spit, Volta River Delta, Ghana. Geomorphology 2021, 387, 107766. [Google Scholar] [CrossRef]
  31. Rossi, G. L’erosion Du Littoral Dans Le Golfe de Benin: Un Exemple de Perturbation d’un Equilibre Morphodynamique. Zeitschrift Fur Geomorphol. Suppl. 1989, 73, 139–165. (In French) [Google Scholar]
  32. Guerrera, F.; Martín-Martín, M.; Tramontana, M.; Nimon, B.; Essotina Kpémoua, K. Shoreline Changes and Coastal Erosion: The Case Study of the Coast of Togo (Bight of Benin, West Africa Margin). Geosciences 2021, 11, 40. [Google Scholar] [CrossRef]
  33. Ayenagbo, K.; Kimatu, J.N.; Gondwe, J.; Rongcheng, W. The Transportation and Marketing Implications of Sand and Gravel and Its Environmental Impact in Lome-Togo. J. Econ. Int. Financ. 2011, 3, 125–138. [Google Scholar]
  34. Dada, O.A.; Li, G.; Qiao, L.; Asiwaju-Bello, Y.A.; Anifowose, A.Y.B. Recent Niger Delta Shoreline Response to Niger River Hydrology: Conflict between Forces of Nature and Humans. J. Afr. Earth Sci. 2018, 139, 222–231. [Google Scholar] [CrossRef]
  35. Alves, B.; Angnuureng, D.B.; Morand, P.; Almar, R. A Review on Coastal Erosion and Flooding Risks and Best Management Practices in West Africa: What Has Been Done and Should Be Done. J. Coast. Conserv. 2020, 24, 38. [Google Scholar] [CrossRef]
  36. Osanyintuyi, A.J.; Wang, Y.; Mokhtar, N.A.H. Nearly Five Decades of Changing Shoreline Mobility along the Densely Developed Lagos Barrier-Lagoon Coast of Nigeria: A Remote Sensing Approach. J. Afr. Earth Sci. 2022, 194, 104628. [Google Scholar] [CrossRef]
  37. Dangote Promises to Protect Shoreline, Fishing Activities in Lekki Communities. Available online: https://www.thisdaylive.com/index.php/2021/02/26/sheikh-gumi-bandits-and-related-matters-2 (accessed on 13 July 2023).
  38. Allersma, E.; Tilmans, W.M.K. Coastal Conditions in West Africa—A Review. Ocean Coast. Manag. 1993, 19, 199–240. [Google Scholar] [CrossRef]
  39. Anthony, E.J.; Blivi, A.B. Morphosedimentary Evolution of a Delta-Sourced, Drift-Aligned Sand Barrier–Lagoon Complex, Western Bight of Benin. Mar. Geol. 1999, 158, 161–176. [Google Scholar] [CrossRef]
  40. Giardino, A.; Schrijvershof, R.; Briere, C.; Nederhoff, K.; Tonnon, P.K.; Nunes De Caires, S. Human Interventions and Climate Change Impacts on the West African Coastal Sand River; World Bank Group: Washington, DC, USA, 2017. [Google Scholar]
  41. Dada, O.; Almar, R.; Morand, P.; Menard, F. “Towards West African Coastal Social-Ecosystems Sustainability: Interdisciplinary Approaches”. Ocean Coast. Manag. 2021, 211, 105746. [Google Scholar] [CrossRef]
  42. Roest, L.W.M. The Coastal System of the Volta Delta, Ghana: Strategies and Opportunities for Development; TU Delft Delta Infrastructures and Mobility Initiative (DIMI): Delft, The Netherlands, 2018. [Google Scholar]
  43. Tolman, H.L. User Manual and System Documentation of WAVEWATCH-III Version 3.14; NOAA/NWS/NCEP/MMAB: Prince George’s County, MD, USA, 2009. [Google Scholar]
  44. Vos, K.; Splinter, K.D.; Harley, M.D.; Simmons, J.A.; Turner, I.L. CoastSat: A Google Earth Engine-Enabled Python Toolkit to Extract Shorelines from Publicly Available Satellite Imagery. Environ. Model. Softw. 2019, 122, 104528. [Google Scholar] [CrossRef]
  45. Murray, J.; Adam, E.; Woodborne, S.; Miller, D.; Xulu, S.; Evans, M. Monitoring Shoreline Changes along the Southwestern Coast of South Africa from 1937 to 2020 Using Varied Remote Sensing Data and Approaches. Remote Sens. 2023, 15, 317. [Google Scholar] [CrossRef]
  46. Warrick, J.A.; Vos, K.; Buscombe, D.; Ritchie, A.C.; Curtis, J.A. A Large Sediment Accretion Wave Along a Northern California Littoral Cell. J. Geophys. Res. Earth Surf. 2023, 128, e2023JF007135. [Google Scholar] [CrossRef]
  47. Vitousek, S.; Vos, K.; Splinter, K.D.; Erikson, L.; Barnard, P.L. A Model Integrating Satellite-derived Shoreline Observations for Predicting Fine-scale Shoreline Response to Waves and Sea-level Rise across Large Coastal Regions. J. Geophys. Res. Earth Surf. 2023, 128, e2022JF006936. [Google Scholar] [CrossRef]
  48. Taveneau, A.; Almar, R.; Bergsma, E.W.J.; Sy, B.A.; Ndour, A.; Sadio, M.; Garlan, T. Observing and Predicting Coastal Erosion at the Langue de Barbarie Sand Spit around Saint Louis (Senegal, West Africa) through Satellite-Derived Digital Elevation Model and Shoreline. Remote Sens. 2021, 13, 2454. [Google Scholar] [CrossRef]
  49. Xu, H. Modification of Normalised Difference Water Index (NDWI) to Enhance Open Water Features in Remotely Sensed Imagery. Int. J. Remote Sens. 2006, 27, 3025–3033. [Google Scholar] [CrossRef]
  50. Vos, K.; Harley, M.D.; Splinter, K.D.; Simmons, J.A.; Turner, I.L. Sub-Annual to Multi-Decadal Shoreline Variability from Publicly Available Satellite Imagery. Coast. Eng. 2019, 150, 160–174. [Google Scholar] [CrossRef]
  51. Himmelstoss, E.A.; Henderson, R.E.; Kratzmann, M.G.; Farris, A.S. Digital Shoreline Analysis System Version 5.1: User Guide; U.S. Geological Survey Software Release: Reston, VA, USA, 2021; p. 104. [Google Scholar] [CrossRef]
  52. Aedla, R.; Dwarakish, G.S.; Reddy, D.V. Automatic Shoreline Detection and Change Detection Analysis of Netravati-GurpurRivermouth Using Histogram Equalization and Adaptive Thresholding Techniques. Aquat. Procedia 2015, 4, 563–570. [Google Scholar] [CrossRef]
  53. Kaddour, S.; Hemdane, Y.; Kessali, N.; Belabdi, K.; Sallaye, M. Study of Shoreline Changes Through Digital Shoreline Analysis System and Wave Modeling: Case of the Sandy Coast of Bou-Ismail Bay, Algeria. Ocean Sci. J. 2022, 57, 493–527. [Google Scholar] [CrossRef]
  54. Vu, M.T.; Lacroix, Y.; Vu, Q.H. Assessment of the Shoreline Evolution at the Eastern Giens Tombolo of France. In Proceedings of the International Conference on Innovations for Sustainable and Responsible Mining; Bui, D.T., Tran, H.T., Bui, X.-N., Eds.; Springer International Publishing: Hanoi, Vietnam, 2020; Volume 108, pp. 349–372. [Google Scholar]
  55. Hapke, C.J.; Reid, D.; Richmond, B.M.; Ruggiero, P.; List, J. National Assessment of Shoreline Change, Part 3: Historical Shoreline Change and Associated Coastal Land Loss along Sandy Shorelines of the California Coast; Marine Science Faculty Publications, South Florida: Tampa, FL, USA, 2006. [Google Scholar]
  56. Pajak, M.J.; Leatherman, S. The High Water Line as Shoreline Indicator. J. Coast. Res. 2002, 18, 329–337. [Google Scholar]
  57. Pelnard-Considere, R. Essai de Theorie de l’evolution Des Formes de Rivage En Plages de Sable et de Galets. In Les Energies la Mer Compte Rendu Des Quatr. Journ. L’Hydraulique, Paris 13, 14 15 Juin 1956; Quest. III, Rapp. 1, 74-1-10; Société Hydrotechnique de France: Paris, France, 1956; Volume 4, pp. 289–298. (In French) [Google Scholar]
  58. Larson, M.; Hanson, H.; Kraus, N.C. Analytical Solutions of the One-Line Model of Shoreline Change; Defense Technical Information Center: Washington, DC, USA, 1987. [Google Scholar]
  59. Hallermeier, R.J. Uses for a Calculated Limit Depth To Beach Erosion. Proc. Coast. Eng. Conf. 1979, 2, 1493–1512. [Google Scholar] [CrossRef]
  60. Sana, A. Teaching Fundamental Concepts of Coastal Engineering Using Excel Spreadsheet. Comput. Appl. Eng. Educ. 2017, 25, 304–310. [Google Scholar] [CrossRef]
  61. Van Duy, D.; Van Ty, T.; Thanh, T.N.; Minh, H.V.T.; Van De, C.; Duong, V.H.T.; Dan, T.C.; Viet, N.T.; Tanaka, H. Sand Spit Morphology at an Inlet on Phu Quoc Island, Vietnam. Water 2023, 15, 1941. [Google Scholar] [CrossRef]
  62. Udo, K.; Ranasinghe, R.; Takeda, Y. An Assessment of Measured and Computed Depth of Closure around Japan. Sci. Rep. 2020, 10, 2987. [Google Scholar] [CrossRef] [PubMed]
  63. Razak, M.A.; Khan, A. Development of a Predictive Closure Depth Equation Using Field Data and Wave Refraction Modelling. IOP Conf. Ser. Mater. Sci. Eng. 2020, 849, 012093. [Google Scholar] [CrossRef]
  64. Aragonés, L.; Pagán, J.I.; López, I.; Serra, J.C. Depth of Closure: New Calculation Method Based on Sediment Data. Int. J. Sediment Res. 2018, 33, 198–207. [Google Scholar] [CrossRef]
  65. Uda, T. Beach Erosion in Japan; Sankaido Press: Tokyo, Japan, 1997; p. 242. (In Japanese) [Google Scholar]
  66. Anthony, E.J.; Almar, R.; Besset, M.; Reyns, J.; Laibi, R.; Ranasinghe, R.; Abessolo Ondoa, G.; Vacchi, M. Response of the Bight of Benin (Gulf of Guinea, West Africa) Coastline to Anthropogenic and Natural Forcing, Part 2: Sources and Patterns of Sediment Supply, Sediment Cells, and Recent Shoreline Change. Cont. Shelf Res. 2019, 173, 93–103. [Google Scholar] [CrossRef]
  67. Lawson, S.K.; Tanaka, H.; Udo, K.; Hiep, N.T.; Tinh, N.X. Morphodynamics and Evolution of Estuarine Sandspits along the Bight of Benin Coast, West Africa. Water 2021, 13, 2977. [Google Scholar] [CrossRef]
  68. Kraus, N.C. Analytical Model of Spit Evolution at Inlets. In Proceedings of the Coastal Sediments 99; American Society of Civil Engineers (ASCE): Long Island, NY, USA, 21–23 June 1999; pp. 1739–1754. [Google Scholar]
  69. Tanaka, H.; Kabutoyama, H.; Shuto, N. Numerical Model for Predicting the Seasonal Migration of a River Mouth. Comput. Model. Seas Coast. Reg. II 1995, 10, 345–352. [Google Scholar] [CrossRef]
  70. Lawson, S.K.; Tanaka, H.; Udo, K.; Hiep, N.T.; Xuan, N. Assessment of River Mouth Variability after Jetty and Groyne Construction: A Case Study of the Volta River Mouth, Ghana. Tohoku J. Nat. Disaster Sci. 2022, 58, 111–116. [Google Scholar]
  71. Nienhuis, J.H.; Ashton, A.D.; Nardin, W.; Fagherazzi, S.; Giosan, L. Alongshore Sediment Bypassing as a Control on River Mouth Morphodynamics. J. Geophys. Res. Earth Surf. 2016, 121, 664–683. [Google Scholar] [CrossRef]
  72. Blivi, A.B. Géomorphologie et Dynamique Actuelle Du Littoral Du Golfe Du Benin (Afrique de l’Ouest). Ph.D. Thesis, Université Bordeaux Montaigne, Pessac, France, July 1993. (In French). [Google Scholar]
  73. Giardino, A.; Schrijvershof, R.; Nederhoff, C.M.; de Vroeg, H.; Brière, C.; Tonnon, P.-K.; Caires, S.; Walstra, D.J.; Sosa, J.; van Verseveld, W.; et al. A Quantitative Assessment of Human Interventions and Climate Change on the West African Sediment Budget. Ocean Coast. Manag. 2018, 156, 249–265. [Google Scholar] [CrossRef]
  74. Abessolo, G.O.; Hoan, L.X.; Larson, M.; Almar, R. Modeling the Bight of Benin (Gulf of Guinea, West Africa) Coastline Response to Natural and Anthropogenic Forcing. Reg. Stud. Mar. Sci. 2021, 48, 101995. [Google Scholar] [CrossRef]
  75. Amenuvor, M.; Gao, W.; Li, D.; Shao, D. Effects of Dam Regulation on the Hydrological Alteration and Morphological Evolution of the Volta River Delta. Water 2020, 12, 646. [Google Scholar] [CrossRef]
  76. Rossi, G. Les Conséquences Des Aménagements Hydrauliques de La Vallée Du Mono (Togo-Bénin). Saura-t-on Gérer l’avenir ? Cah. d’outre-mer 1995, 48, 435–452. [Google Scholar] [CrossRef]
  77. Boateng, I.; Bray, M.; Hooke, J. Estimating the Fluvial Sediment Input to the Coastal Sediment Budget: A Case Study of Ghana. Geomorphology 2012, 138, 100–110. [Google Scholar] [CrossRef]
  78. Anthony, E.; Almar, R.; Aagaard, T. Recent Shoreline Changes in the Volta River Delta, West Africa: The Roles of Natural Processes and Human Impacts. Afr. J. Aquat. Sci. 2016, 41, 81–87. [Google Scholar] [CrossRef]
  79. Addo, K.A.; Nicholls, R.J.; Codjoe, S.N.A.; Abu, M. A Biophysical and Socioeconomic Review of the Volta Delta, Ghana. J. Coast. Res. 2018, 345, 1216–1226. [Google Scholar] [CrossRef]
  80. Ly, C.K. The Role of the Akosombo Dam on the Volta River in Causing Coastal Erosion in Central and Eastern Ghana (West Africa). Mar. Geol. 1980, 37, 323–332. [Google Scholar] [CrossRef]
  81. Bamunawala, J.; Ranasinghe, R.; Dastgheib, A.; Nicholls, R.J.; Murray, A.B.; Barnard, P.L.; Sirisena, T.A.J.G.; Duong, T.M.; Hulscher, S.J.M.H.; van der Spek, A. Twenty-First-Century Projections of Shoreline Change along Inlet-Interrupted Coastlines. Sci. Rep. 2021, 11, 14038. [Google Scholar] [CrossRef]
  82. Bamunawala, J.; Dastgheib, A.; Ranasinghe, R.; van der Spek, A.; Maskey, S.; Murray, A.B.; Duong, T.M.; Barnard, P.L.; Sirisena, T.A.J.G. A Holistic Modeling Approach to Project the Evolution of Inlet-Interrupted Coastlines Over the 21st Century. Front. Mar. Sci. 2020, 7, 542. [Google Scholar] [CrossRef]
  83. Bamunawala, J.; Maskey, S.; Duong, T.M.; van der Spek, A. Significance of Fluvial Sediment Supply in Coastline Modelling at Tidal Inlets. J. Mar. Sci. Eng. 2018, 6, 79. [Google Scholar] [CrossRef]
  84. Pradjoko, E.; Tanaka, H.; Henry, E. The Effect of Sendai Port Breakwater to Sediment Movement on Its Vicinity. In Proceedings of the Coastal Structures 2011, the 6th International Conference, Yokohama, Japan, 6–8 September 2011. [Google Scholar]
  85. Ritphring, S.; Tanaka, H. Morphology Variability in the Vicinity of Coastal Structures. In Proceedings of the 32nd Conference on Coastal Engineering, Shanghai, China, 30 June–5 July 2010. [Google Scholar]
  86. Kondrat, V.; Šakurova, I.; Baltranaitė, E.; Kelpšaitė-Rimkienė, L. Natural and Anthropogenic Factors Shaping the Shoreline of Klaipėda, Lithuania. J. Mar. Sci. Eng. 2021, 9, 1456. [Google Scholar] [CrossRef]
  87. Žilinskas, G.; Janušaitė, R.; Jarmalavičius, D.; Pupienis, D. The Impact of Klaipėda Port Entrance Channel Dredging on the Dynamics of Coastal Zone, Lithuania. Oceanologia 2020, 62, 489–500. [Google Scholar] [CrossRef]
  88. Sarma, K.G.S.; Reddy, B.S.R. Longshore Sediment Transport near Visakhapatnam Port, India. Ocean Shorel. Manag. 1988, 11, 113–127. [Google Scholar] [CrossRef]
  89. Rao, V.R.; Prasad, K.V.S.R.; Ramu, V.; Acharyulu, P.S.N.; Mohan, R.; Rao, V.D. Nearshore Circulation and Sediment Transport Pattern along Gangavaram—Visakhapatnam Coast, East Coast of India. Int. J. Earth Sci. Eng. 2014, 7, 405–409. [Google Scholar]
  90. Dada, O.A.; Almar, R.; Minderhoud, P.S.J. Future Socioeconomic Development along the West African Coast Forms a Larger Hazard than Sea Level Rise. Commun. Earth Environ. 2023, 4, 150. [Google Scholar] [CrossRef]
  91. Abessolo, G.O.; Almar, R.; Angnuureng, D.B.; Bonou, F.; Sohou, Z.; Camara, I.; Diouf, A.; Alory, G.; Onguéné, R.; Mama, A.C.; et al. African Coastal Camera Network Efforts at Monitoring Ocean, Climate, and Human Impacts. Sci. Rep. 2023, 13, 1514. [Google Scholar] [CrossRef]
  92. Ndour, A.; Laïbi, R.A.; Sadio, M.; Degbe, C.G.E.; Diaw, A.T.; Oyédé, L.M.; Anthony, E.J.; Dussouillez, P.; Sambou, H.; Dièye, E. hadji B. Management Strategies for Coastal Erosion Problems in West Africa: Analysis, Issues, and Constraints Drawn from the Examples of Senegal and Benin. Ocean Coast. Manag. 2018, 156, 92–106. [Google Scholar] [CrossRef]
  93. Almar, R.; Stieglitz, T.; Appeaning, K.; Kader, A. Coastal Zone Changes in West Africa: Challenges and Opportunities for Satellite Earth Observations. Surv. Geophys. 2022, 44, 249–275. [Google Scholar] [CrossRef]
Figure 1. Schematic diagram of the sandbar breakwater and corresponding morphological changes in its environs (redrawn from Moesker, 2019 [22]). The blue line indicates the initial shoreline orientation and the red line shows the shoreline evolution after construction of the sandbar breakwater.
Jmse 11 01651 g001
Figure 2. The Bight of Benin in the Gulf of Guinea, West Africa. Offshore ports within the Bight of Benin are located in the cities of Lomé (Togo), Cotonou (Benin), and Lekki (Nigeria).
Jmse 11 01651 g002
Figure 3. A section of the Togolese coastline showing (a) the updrift coastline of the Port of Lomé, and (b) coastal protection structures on the downdrift shoreline of the port (~5 km east of the port).
Jmse 11 01651 g003
Figure 4. Location of the Lekki Deep Sea Port (Dangote Sea Port) in the blue bounding box considered in this study. The Lekki port (green box) follows a conventional seaport design.
Jmse 11 01651 g004
Figure 5. Wave climate at the study sites obtained from the WaveWatch III model [43] from 2006–2017 showing (a,b) wave rose for significant wave height approaching the Lomé and Lekki ports, and (c) seasonal variation of mean significant wave heights and their standard deviations.
Jmse 11 01651 g005
Figure 6. (a) Schematic diagram showing the shoreline evolution of a sandbar breakwater over a given period ( t 1 and t 2 ), and (b) a hypothetical equilibrium beach profile showing the definition of the depth of closure ( D C ) and berm height ( D B ) (redrawn from Larson et al. [58]).
Jmse 11 01651 g006
Figure 7. Shoreline positions at the Port of Lomé (a) before the port expansion project, and (b) after the construction of the sandbar breakwater.
Jmse 11 01651 g007
Figure 8. Net shoreline movement (NSM) on the updrift shoreline of the Port of Lomé within the spatial boundaries considered in the analysis from 1984–2023.
Jmse 11 01651 g008
Figure 9. Shoreline evolution based on the Linear Regression Rates (LRR) for the two study periods and the overall evolution before and after the port expansion project. The alongshore distance begins updrift to the port at the Wharf Allemand landmark (western boundary).
Jmse 11 01651 g009
Figure 10. Beach area changes (a) before the port expansion project (1984–2002), and (b) after the construction of the sandbar breakwater (2013–2023). The equations in these figures correspond to the linear regression analysis for the beach area change rates.
Jmse 11 01651 g010
Figure 11. Shoreline evolution at the Lekki Deep Sea Port (LSDP) before and after the introduction of the sandbar breakwater.
Jmse 11 01651 g011
Figure 12. Net shoreline movement (NSM) at the Lekki Deep Sea Port within the spatial boundaries considered in the analysis from 2018–2023.
Jmse 11 01651 g012
Figure 13. Results of the linear regression analysis at the Lekki Deep Sea Port for (a) shoreline change rates between the two defined alongshore boundaries, and (b) changes in beach area from 2018–2023.
Jmse 11 01651 g013
Figure 14. Estimated volumetric change of sediment deposition at the Port of Lomé, Togo (Period 1: before port expansion and Period 2: after port expansion), and the Lekki Deep Sea Port (Nigeria).
Jmse 11 01651 g014
Figure 15. Comparison of longshore sediment transport rates at sediment-accreting units (sandspits and offshore ports) in the Bight of Benin coast. The LSTR at the sandspits were obtained from Lawson et al. [67].
Jmse 11 01651 g015
Disclaimer/Publisher’s Note: The statements, opinions and data contained in all publications are solely those of the individual author(s) and contributor(s) and not of MDPI and/or the editor(s). MDPI and/or the editor(s) disclaim responsibility for any injury to people or property resulting from any ideas, methods, instructions or products referred to in the content.

