
Heavy Metal Content in Macroalgae as a Tool for Environmental Quality Assessment: The Eastern Gulf of Finland Case Study

 ,
, 

Abstract
:1. Introduction
2. Material and Methods
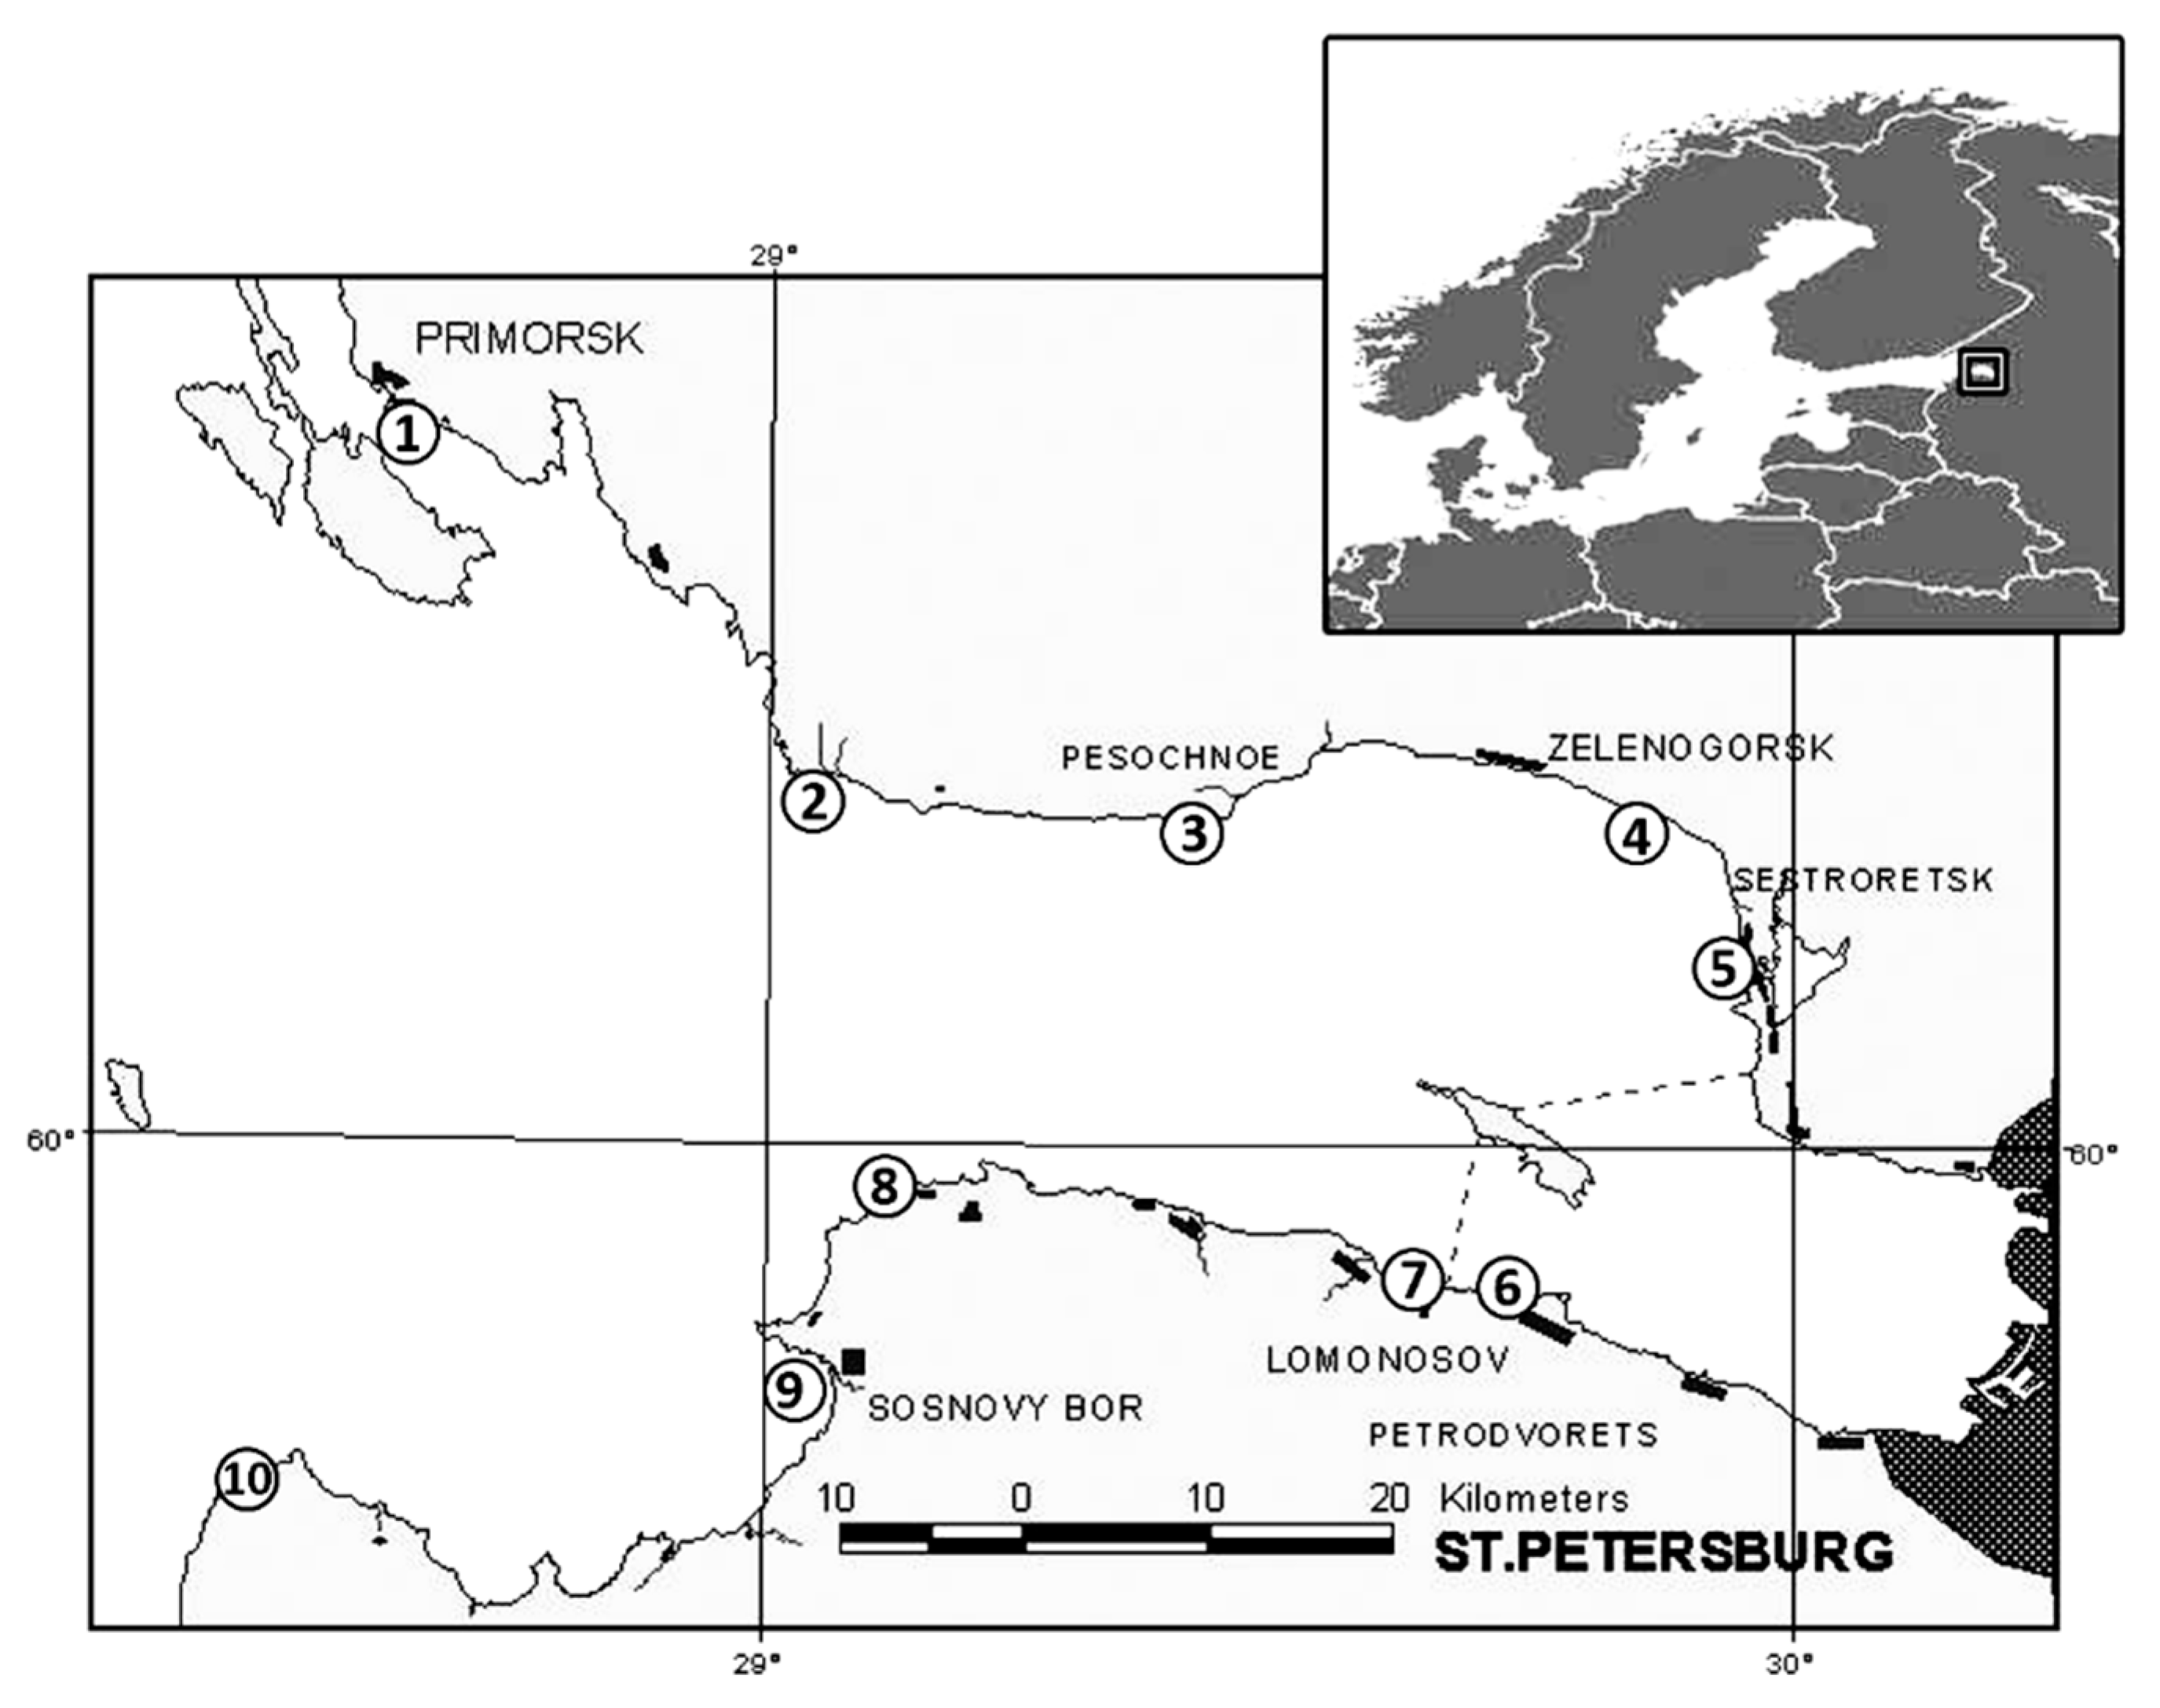
2.1. Study Area
2.2. Sampling Design
2.3. Data Analyses
3. Results
3.1. Hydrochemical Parameters
3.2. Metal Concentrations in the Water and Sediments
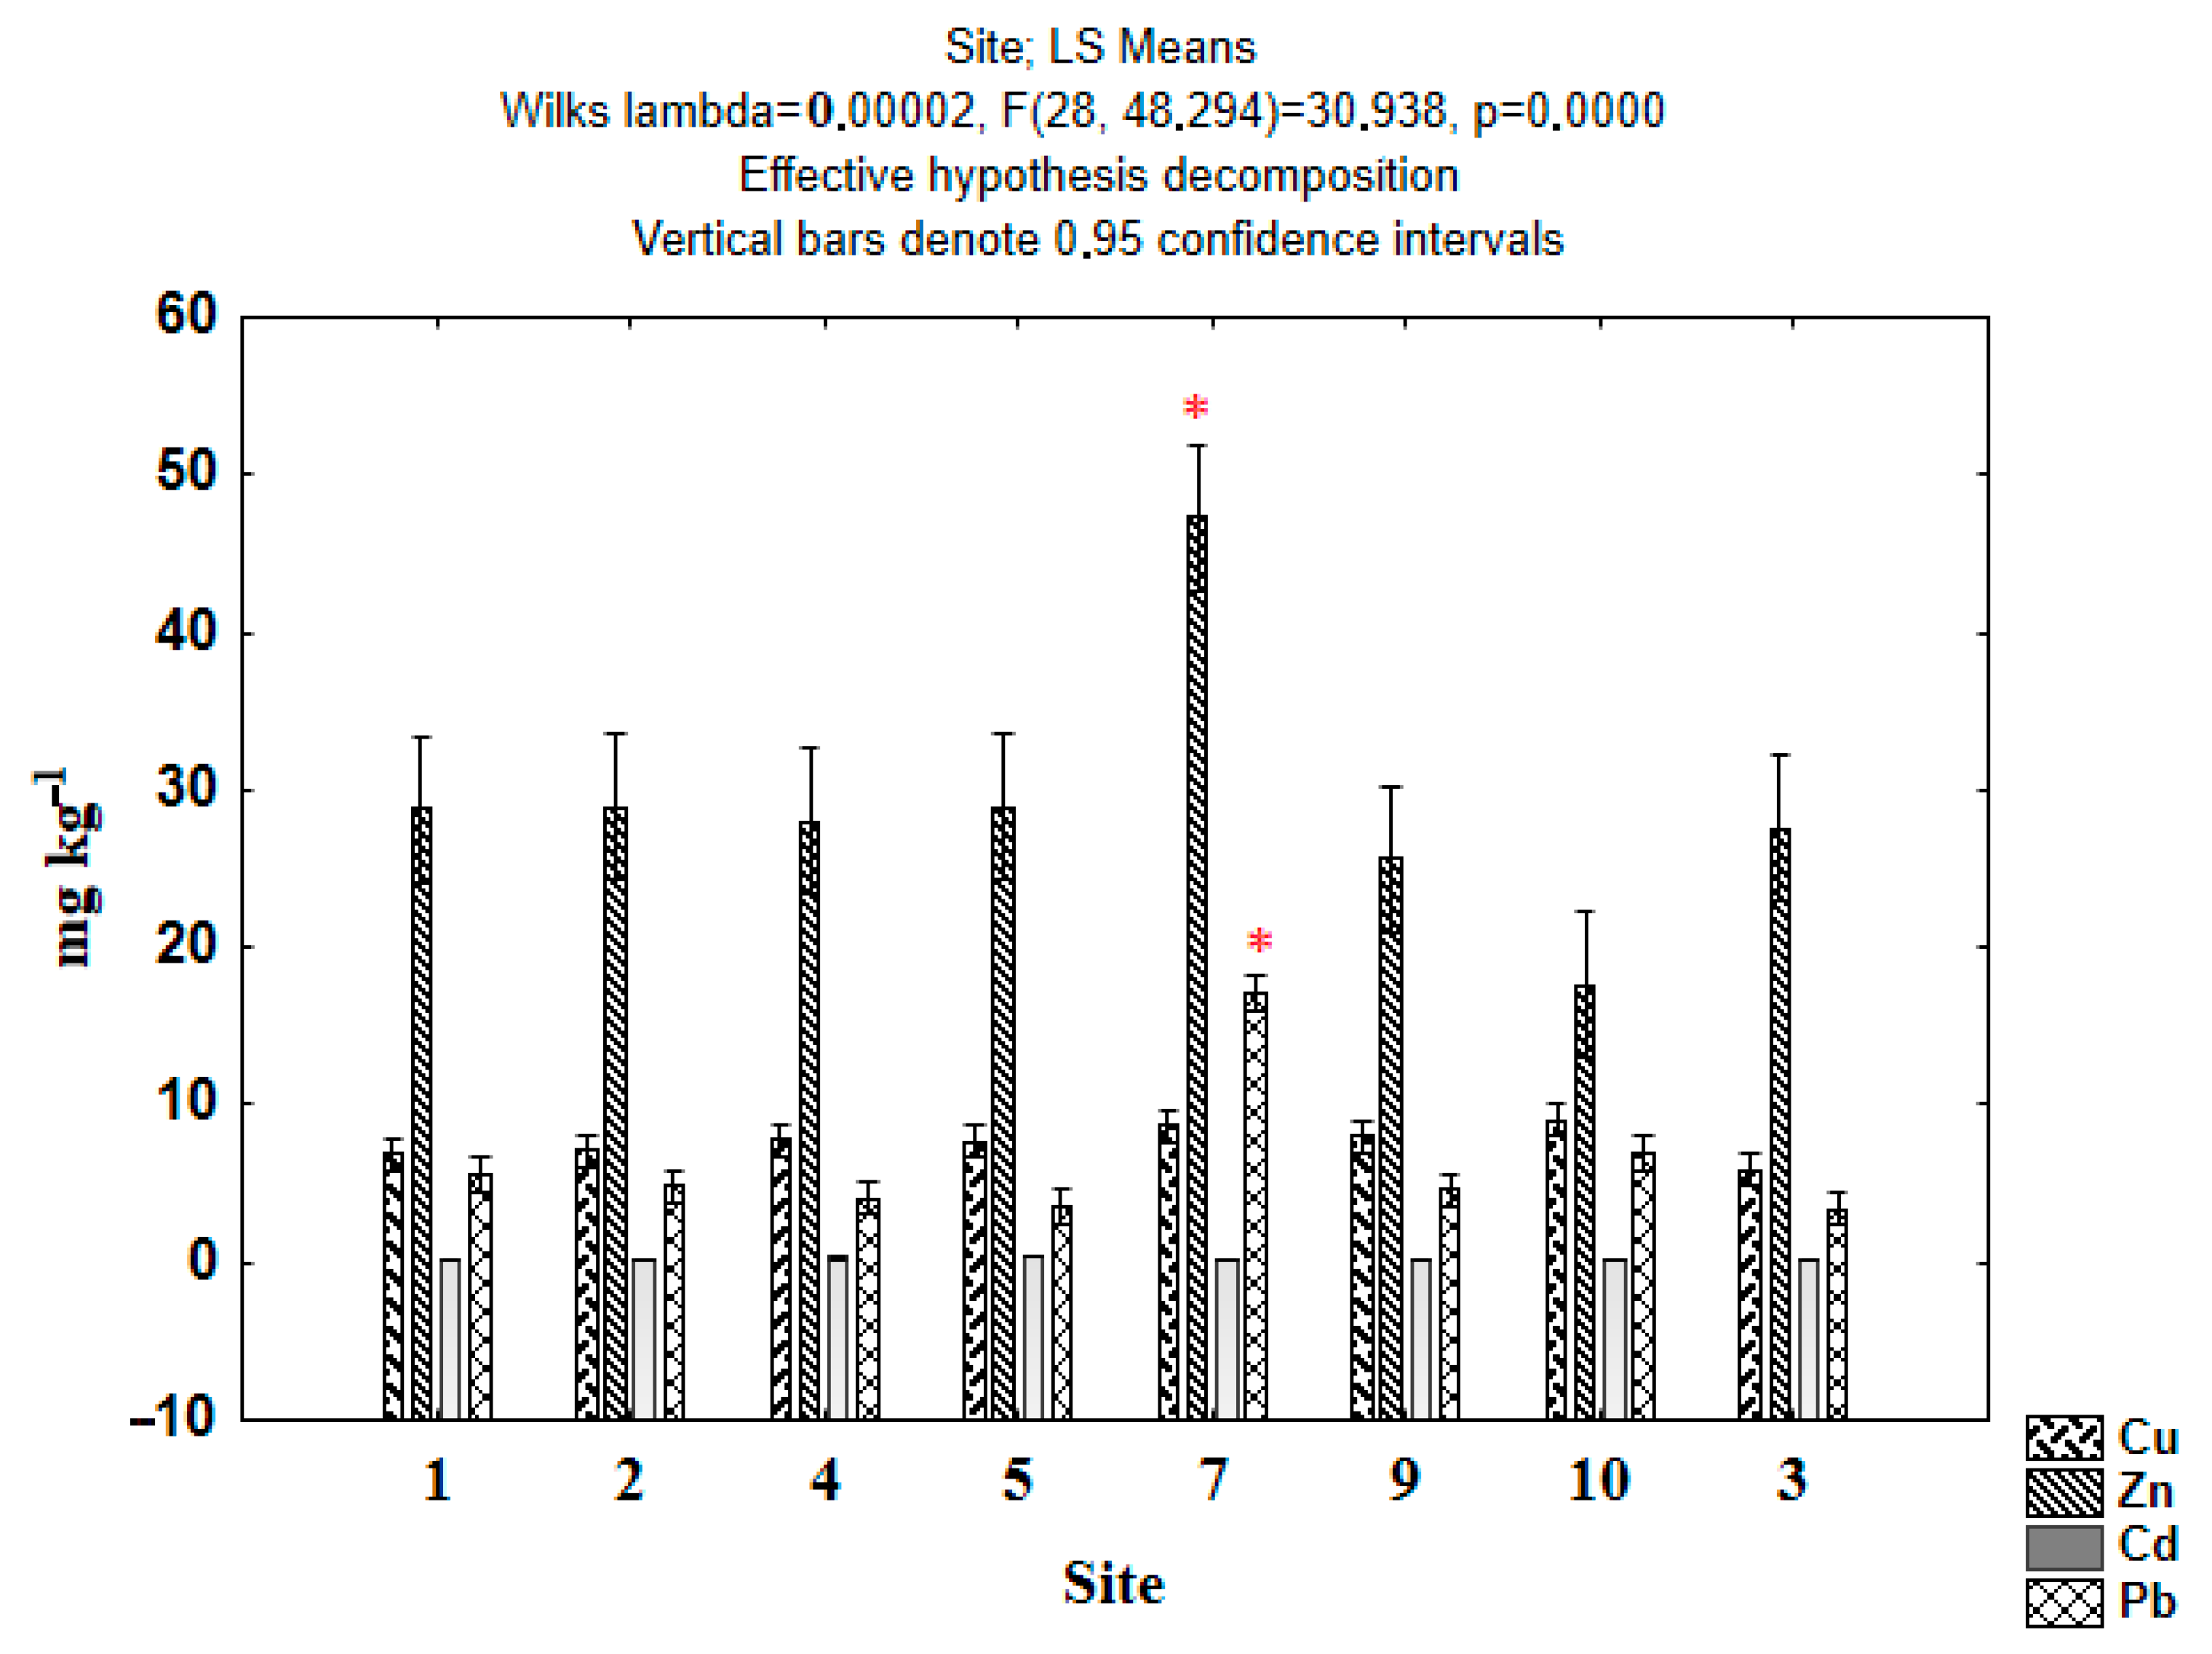
3.3. Macroalgae Biomass and Metal Accumulation
3.4. Comparison of Spearman Rank Correlations between Metals in the Pore Water, the Water Column, and Algae
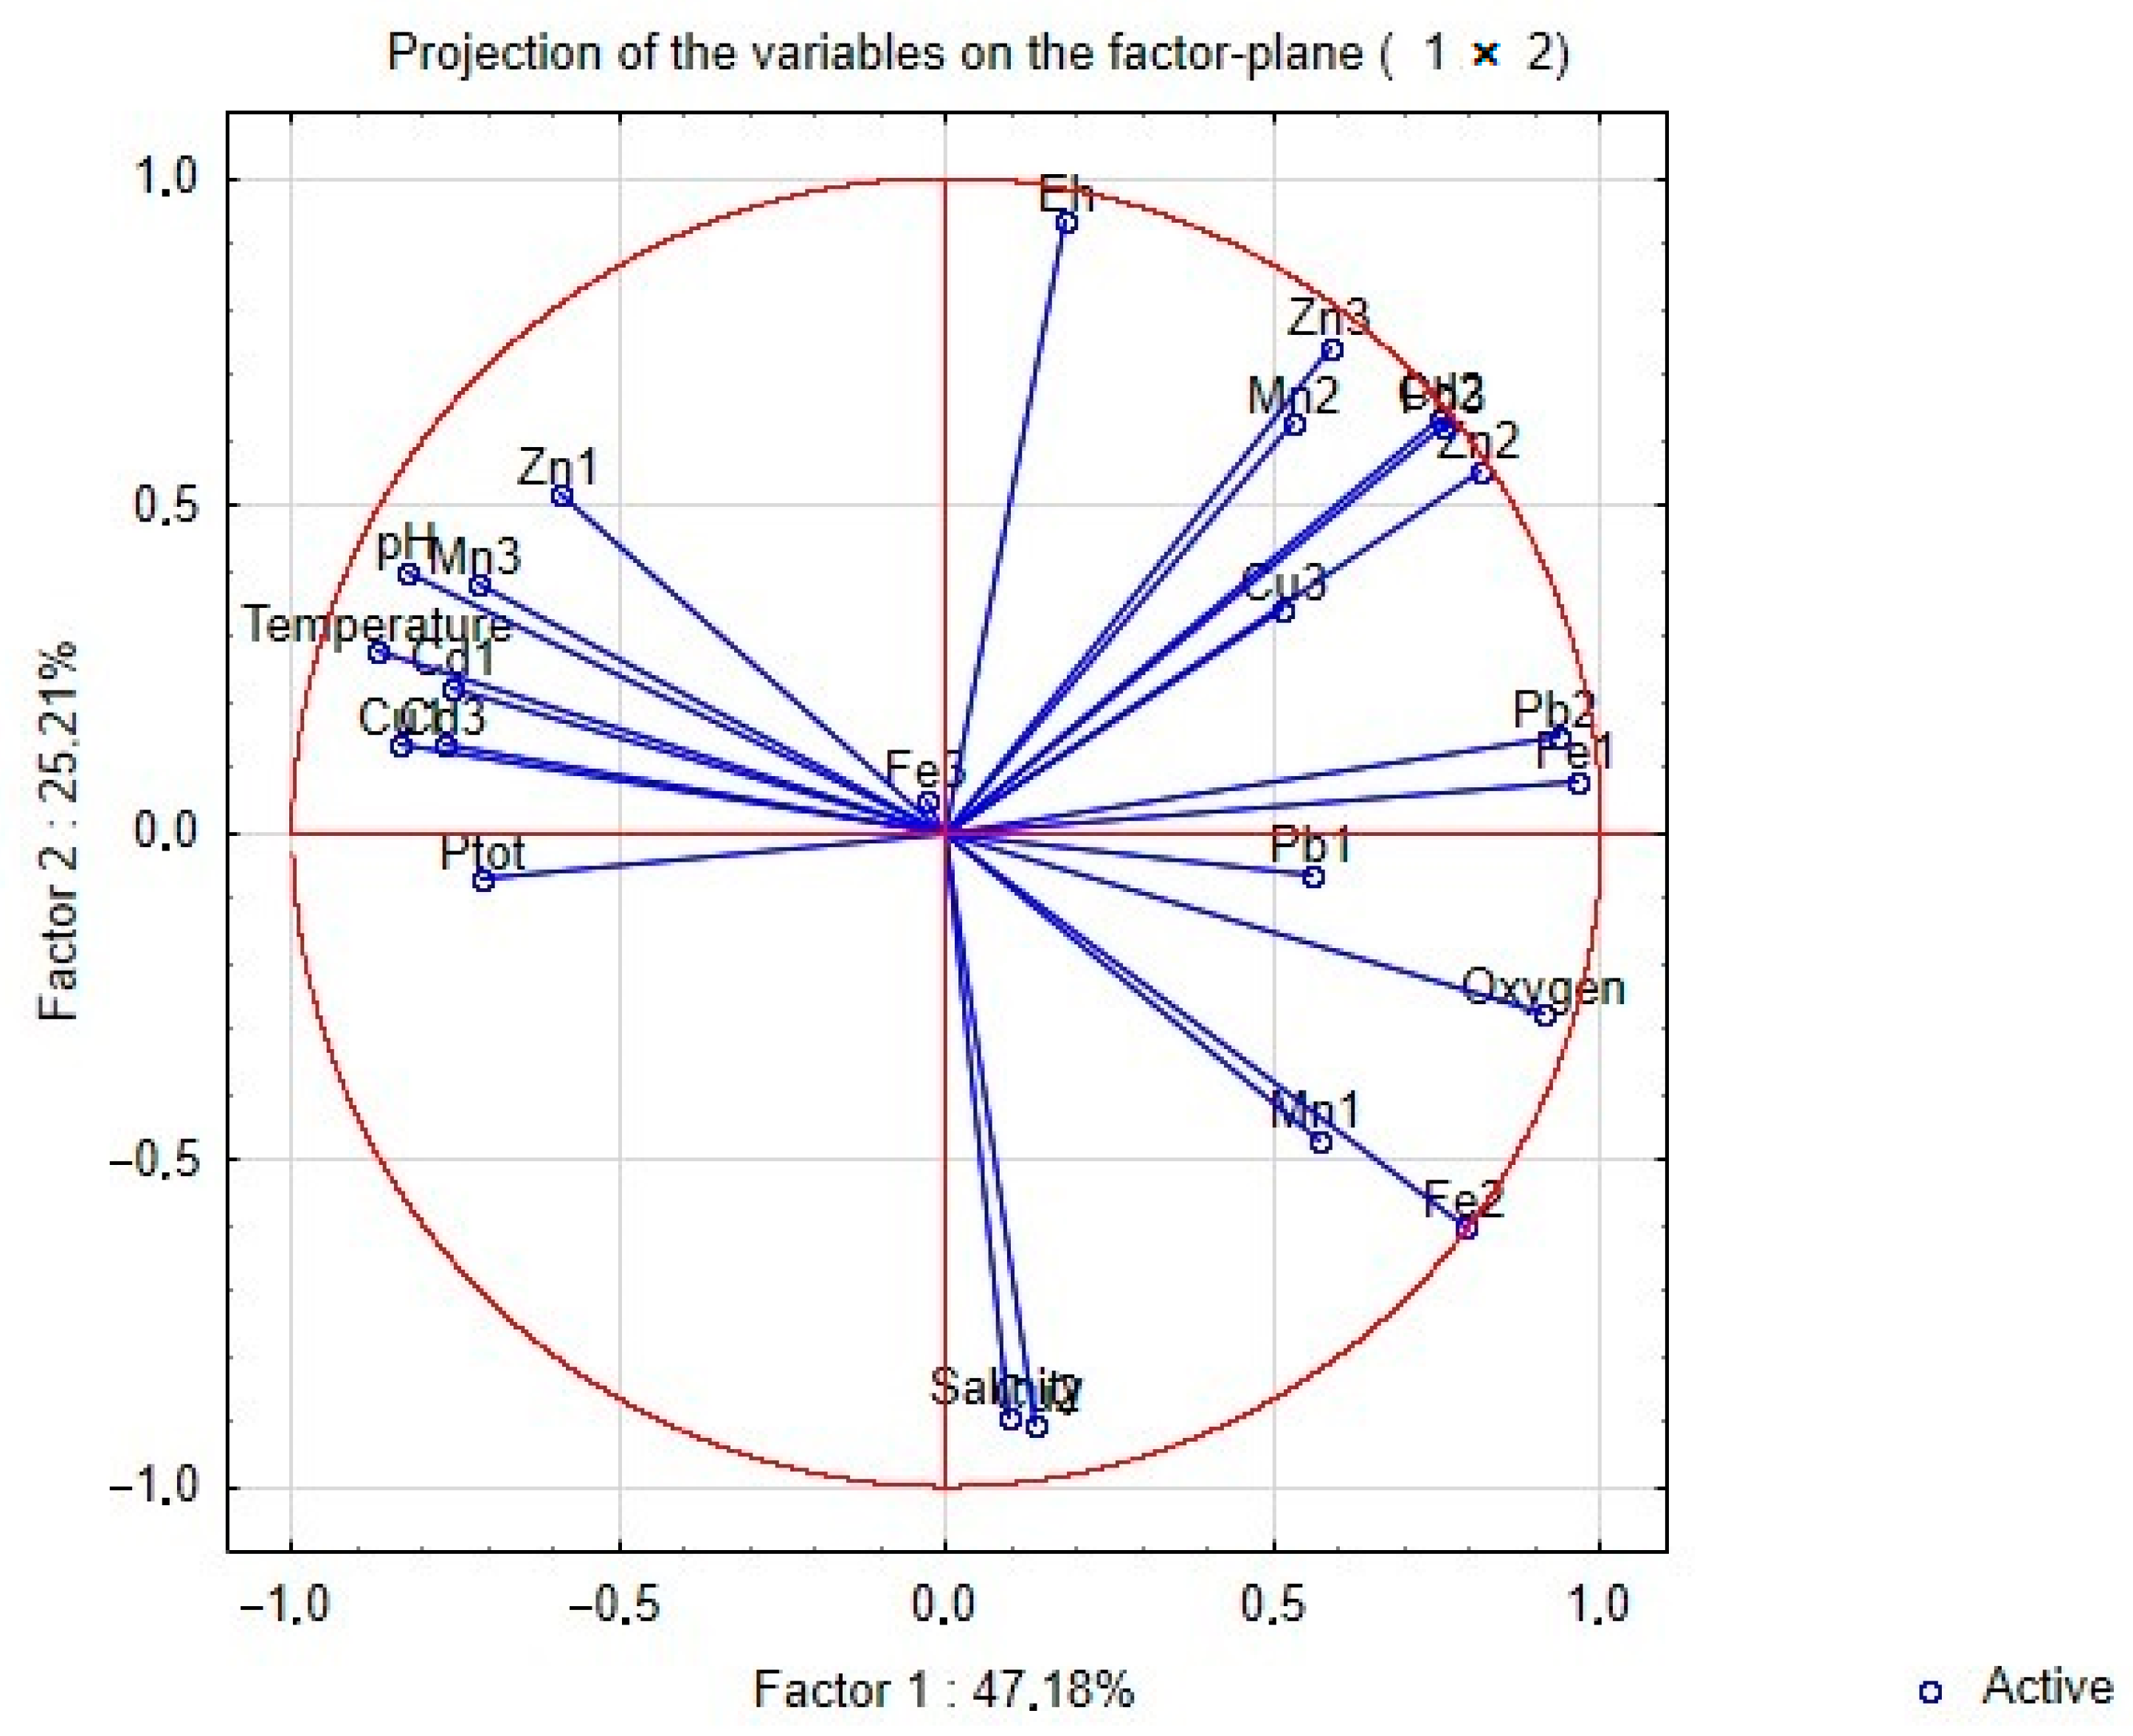
3.5. Results of Principal Component and Classification Analysis
3.6. Calculated Bioconcentration Factor (BCF) and Environmental Quality Standard (EQS) for Macroalgae Cladophora Glomerata in the Eastern Gulf of Finland
4. Discussion
4.1. Hydrochemical Parameters
4.2. Metals in Water and Sediments
4.3. Correlations between Metals in the Sediments, the Pore Water, the Water Column, and Algae
4.4. Bioconcentration Factor and Environmental Quality Standard
5. Conclusions
Author Contributions
Funding
Institutional Review Board Statement
Informed Consent Statement
Data Availability Statement
Conflicts of Interest
References
- Smetacek, V.; Zingone, A. Green and golden seaweed tides on the rise. Nature 2013, 504, 84–88. [Google Scholar] [CrossRef] [PubMed]
- Farias, D.R.; Hurd, C.L.; Eriksen, R.S.; Macleod, C.K. Macrophytes as bioindicators of heavy metal pollution in estuarine and coastal environments. Mar. Pollut. Bull. 2018, 128, 175–184. [Google Scholar] [CrossRef] [PubMed]
- Bonanno, G.; Veneziano, V.; Raccuia, S.A.; Orlando-Bonaca, M. Seagrass Cymodocea nodosa and seaweed Ulva lactuca as tools for trace element biomonitoring. A comparative study. Mar. Pollut. Bull. 2020, 161, 111743. [Google Scholar] [PubMed]
- Rakib, M.J.; Jolly, Y.N.; Dioses-Salinas, D.C.; Pizarro-Ortega, C.I.; De-la-Torre, G.E.; Khandaker, M.U.; Alsubaie, A.; Almalki, A.S.A.; Bradley, D.A. Macroalgae in biomonitoring of metal pollution in the Bay of Bengal coastal waters of Cox’s Bazar and surrounding areas. Sci. Rep. 2021, 11, 20999. [Google Scholar] [CrossRef]
- Gubelit, Y.I.; Polyak, Y.M.; Shigaeva, T.D.; Bakina, L.G.; Kudryavtseva, V.A. Can the “Green Tides” Affect the Metal Distribution in the Coastal Sediments? A Case Study in the Eastern Gulf of Finland, Baltic Sea. Contemp. Probl. Ecol. 2020, 13, 113–126. [Google Scholar] [CrossRef]
- European Environment Agency. Directive 2000/60/EC of the European Parliament and the Council Establishing a Framework for Com-munity Action in the Field of Water Policy; European Environment Agency: Copenhagen, Denmark, 2000. [Google Scholar]
- European Parliament; Council of the European Union. Directive 2008/56/EC of the European Parliament and of the Council of 17 June 2008 Establishing a Framework for Community Action in the Field of Marine Environmental Policy (Marine Strategy Framework Directive). Off. J. Eur. Union 2008, 164, 19–41. [Google Scholar]
- Villares, R.; Puente, X.; Carballeira, A. Ulva and Enteromorpha as indicators of heavy metal pollution. Hydrobiologia 2001, 462, 221–232. [Google Scholar] [CrossRef]
- Rajfur, M. Algae—Heavy metal biosorbernt. Ecol. Chem. Eng. S 2013, 20, 23–40. [Google Scholar]
- Chakraborty, S.; Bhattacharya, T.; Singh, G.; Maity, J.P. Benthic macroalgae as biological indicators of heavy metal pollution in the marine environments: A biomonitoring approach for pollution assessment. Ecotoxicol. Environ. Saf. 2014, 100, 61–68. [Google Scholar]
- Parus, A.; Karbowska, B. Marine Algae as Natural Indicator of Environmental Cleanliness. Water Air Soil Pollut. 2020, 231, 97. [Google Scholar] [CrossRef]
- Zalewska, T.; Danowska, B. Marine environment status assessment based on macrophytobenthic plants as bio-indicators of heavy metals pollution. Mar. Pollut. Bull. 2017, 118, 281–288. [Google Scholar] [CrossRef] [PubMed]
- Chernova, E.N.; Shulkin, V.M. Concentrations of Metals in the Environment and in Algae: The Bioaccumulation Factor. Russ. J. Mar. Biol. 2019, 45, 191–201. [Google Scholar] [CrossRef]
- Bilal, M.; Rasheed, T.; Sosa-Hernández, J.E.; Raza, A.; Nabeel, F.; Iqbal, H.M.N. Biosorption: An interplay between marine algae and potentially toxic elements—A Review. Mar. Drugs. 2018, 16, 65. [Google Scholar] [CrossRef]
- Rinne, H.; Korpinen, S.; Mattila, J.; Salovius-Laurén, S. Functionality of potential macroalgal indicators in the northern Baltic Sea. Aquat. Bot. 2018, 149, 52–60. [Google Scholar] [CrossRef]
- Berezina, N.A.; Gubelit, Y.I.; Polyak, Y.M.; Sharov, A.N.; Kudryavtseva, V.A.; Lubimtsev, V.A.; Petukhov, V.A.; Shigaeva, T.D. An integrated approach to the assessment of the eastern Gulf of Finland health: A case study of coastal habitats. J. Mar. Syst. 2017, 171, 159–171. [Google Scholar] [CrossRef]
- Gubelit, Y.; Polyak, Y.; Dembska, G.; Pazikowska-Sapota, G.; Zegarowski, L.; Kochura, D.; Krivorotov, D.; Podgornaya, E.; Burova, O.; Maazouzi, C. Nutrient and metal pollution of the eastern Gulf of Finland coastline: Sediments, macroalgae, microbiota. Sci. Total Environ. 2016, 550, 806–819. [Google Scholar] [CrossRef]
- Michalak, I.; Messyasz, B. Concise review of Cladophora spp.: Macroalgae of commercial interest. J. Appl. Phycol. 2021, 33, 133–166. [Google Scholar] [CrossRef]
- Karandashev, V.K.; Turanov, A.N.; Orlova, T.A.; Lezhnev, A.E.; Nosenko, S.V.; Zolotareva, N.I.; Moskvitina, I.R. Use of the inductively coupled plasma mass spectrometry for element analysis of environmental objects. Inorg. Mater. 2008, 44, 1491–1500. [Google Scholar] [CrossRef]
- Persaud, D.; Jaagumagi, R.; Hayton, A. Guidelines for Protection and Management of Aquatic Sediment Quality in Ontario; Water Resources Branch, Ontario Ministry of the Environment: Toronto, ON, Canada, 1993; 27p. [Google Scholar]
- FAO; FAOLEX. Directive 2013/39/EU of the European Parliament and of the Council of 12 August 2013 Amending Direc-tives 2000/60/EC and 2008/105/EC as Regards Priority Substances in the Field of Water Policy. Off. J. Eur. Union 2013, 226, 2–18. [Google Scholar]
- Nguyen, L.H.; Leermakers, M.; Elskens, M.; Ridder, D.F.; Doan, H.T.; Baeyens, W. Correlations, partitioning and bio-accumulation of heavy metals between different compartments of Lake Balaton. Sci. Total Environ. 2005, 341, 211–226. [Google Scholar] [CrossRef]
- Ministry of Agriculture of the Russian Federation. Order of the Ministry of Agriculture of the Russian Federation of December 13, 2016 N 552 “On Approval of Water Quality Standards for Fishery Water Bodies, Including Standards for Maximum Permissible Concentrations of Harmful Substances in the Waters of Fishery Water Bodies” (with Amendments and Additions from 12 October 2018 and 10 March 2020). Ministry of Agriculture of the Russian Federation: Moscow, Russia, 2020; 217p, Available online: http://ivo.garant.ru/#/document/71586774/paragraph/8:0 (accessed on 20 March 2023).
- Weiner, E.R. Applications of Environmental Aquatic Chemistry. A Practical Guide, 3rd ed.; CRC Press: Boca Raton, FL, USA, 2013; 618p. [Google Scholar] [CrossRef]
- Lozano-Bilbao, E.; Hernández, J.C.; Hardisson, A.; Rubio, C.; González-Weller, D.; Gutiérrez, A.J. Structuring algae as buffers for heavy metals and trace elements in the Canary Islands intertidal habitat. Mar. Pollut. Bull. 2023, 190, 114890. [Google Scholar] [CrossRef] [PubMed]
- Farid, N.; Ullah, A.; Khan, S.; Butt, S.; Khan, A.Z.; Afsheen, Z.; El-Serehy, H.A.; Yasmin, H.; Ayaz, T.; Ali, Q. Algae and Hydrophytes as Potential Plants for Bioremediation of Heavy Metals from Industrial Wastewater. Water 2023, 15, 2142. [Google Scholar] [CrossRef]
- Moiseenko, T.I. Effects of Acidification on Aquatic Ecosystems. Russ. J. Ecol. 2005, 36, 93–102. [Google Scholar] [CrossRef]
- James, R.K.; van Katwijk, M.M.; van Tussenbroek, B.I.; van der Heide, T.; Dijkstra, H.A.; van Westen, R.M.; Pietrzak, J.D.; Candy, A.S.; Klees, R.; Riva, R.E.M.; et al. Water motion and vegetation control the pH dynamics in seagrass-dominated bays. Limnol. Oceanogr. 2020, 65, 349–362. [Google Scholar] [CrossRef]
- Gubelit, Y.I. Climatic impact on community of filamentous macroalgae in the Neva estuary (eastern Baltic Sea). Mar. Pollut. Bull. 2015, 91, 166–172. [Google Scholar] [CrossRef] [PubMed]
- Lenzi, M. Cacciatori di Solfaie—Ambienti Lagunari Atidali Eutrofici e Meccaniche Distrofiche; Pandion Edizioni: Roma, Italy, 2019; 117p. [Google Scholar]
- Pini, J.M.; Richir, J.; Watson, G.J. Metal bioavailability and bioaccumulation in the polychaete Nereis (Alitta) virens (Sars): The effects of site-specific sediment characteristics. Mar. Pollut. Bull. 2015, 95, 565–575. [Google Scholar] [CrossRef]
- Guerrero Aguilar, A.; Schüth, C.; Rodriguez Castrejon, U.E.; Noriega Luna, B.; Serafin Muñoz, A.H. Statistical analysis and assessment of water quality parameters in relation to the use of algae as bioindicators in contaminated reservoirs. Water Air Soil Pollut. 2023, 234, 98. [Google Scholar] [CrossRef]
- Harmsen, K.; Van Breemen, N. Translocation of iron in acid sulphate soils: II. Production and diffusion of dissolved ferrous iron. Soil Sci. Soc. Am. Proc. 1975, 39, 1148–1153. [Google Scholar] [CrossRef]
- Vallius, H.; Leivuori, M. Classification of heavy metal contaminated sediments of the Gulf of Finland. Baltica 2003, 16, 3–12. [Google Scholar]
- Remeikaitė-Nikienėa, N.; Garnaga-Budrėa, G.; Lujanienėb, G.; Jokšas, K.; Stankevičius, A.; Malejevas, V.; Barisevičiūtė, R. Distribution of metals and extent of contamination in sediments from the south-eastern Baltic Sea (Lithuanian zone). Oceanologia 2018, 60, 193–206. [Google Scholar] [CrossRef]
- Yemelianov, E.M.; Kravtsov, V.A. Transient and Heavy Metals in Waters of the Gulf of Finland. Problems of Research and Mathematical Modelling of the Baltic Sea Ecosystem. Issue 5. Ecosystem Models. Assessment of the Modern State of the Gulf of Finland. Part II; Hydrometeoizdat: Saint Petersburg, Russia, 1997; pp. 329–331. (In Russian) [Google Scholar]
- Kang, M.; Tian, Y.; Peng, S.; Wang, M. Effect of dissolved oxygen and nutrient levels on heavy metal contents and fractions in river surface sediments. Sci. Total Environ. 2019, 648, 861–870. [Google Scholar] [CrossRef] [PubMed]
- Khalid, R.A.; Patrick, W.H., Jr.; Gambrell, R.P. Effect of dissolved oxygen on chemical transformations of heavy metals, phosphorus, and nitrogen in an estuarine sediment. Estuar. Coast. Mar. Sci. 1978, 6, 21–35. [Google Scholar] [CrossRef]
- Brinza, L.; Geraki, K.; Cojocaru, C.; Løvstad Holdt, S.; Neamtu, M. Baltic Fucus vesiculosus as potential bio-sorbent for Zn removal: Mechanism insight. Chemosphere 2020, 238, 124652. [Google Scholar] [CrossRef]
- The European Commision. Commission Decision 2010/477/EU of 1 September 2010 on Criteria and Methodological Standards on Good Environmental Status of Marine Waters. Off. J. Eur. Union 2010, 232, 14–24. [Google Scholar]


| Site | pH Water | pH Sediments | Eh, mv (sat. Ag/AgCl Electrode) | Salinity | Ptot mg/L | Oxygen ml/L | |||
|---|---|---|---|---|---|---|---|---|---|
| May | July | May | July | May | July | July | July | July | |
| 1 | 8.3 ± 0.05 | 7.23 ± 0.07 | 7.23 ± 0.06 | 6.77 ± 0.09 | −252 | −178 | 2.2 | 125 | 7.2 |
| 2 | 7.5 ± 0.05 | 7.43 ± 0.6 | 6.8 ± 0.06 | 6.67 ± 0.07 | −19 | −200 | 1.5 | 60 | 7.08 |
| 2 under algae | 7.5 ± 0.06 | 7.6 ± 0.05 | n.d. | 6.7 ± 0.06 | n.d. | −210 | n.d. | n.d. | n.d. |
| 3 | n.d. | 7.3 ± 0.06 | n.d. | 7.27 ± 0.07 | n.d. | −189 | 1 | 50 | 7.2 |
| 4 | 7.4 ± 0.05 | 8.4 ± 0.07 | 6.77 ± 0.03 | 7.17 ± 0.03 | −256 | −142 | 0.45 | 102 | 7.2 |
| 5 | 8.03 ± 0.03 | 7.53 ± 0.05 | 6.63 ± 0.03 | 6.77 ± 0.03 | −196 | −154 | 0.08 | 98 | 7 |
| 6 | 7.47 ± 0.03 | 8.13 ± 0.04 | 7.13 ± 0.03 | 6.97 ± 0.03 | −226 | −231 | 0.108 | 88 | 7.2 |
| 7 | 7.03 ± 0.03 | 7.13 ± 0.03 | 6.10 ± 0.06 | 6.9 ± 0.06 | −216 | −33 | 1.6 | 45 | 7.3 |
| 8 | 6.7 ± 0.2 | 6.7 ± 0.3 | 6.27 ± 0.3 | 6.8 ± 0.02 | −301 | −240 | 2.16 | 148 | 7.3 |
| 8 under algae | 6.6 ± 0.05 | 6.7 ± 0.05 | 6.8 ± 0.3 | 6.43 ± 0.03 | −290 | −225 | n.d. | n.d. | n.d. |
| 9 | 7.47 ± 0,03 | 7.07 ± 0.03 | 7.3 ± 0.06 | 7.33 ± 0.03 | −287 | −315 | 2.2 | 50 | 7.3 |
| 9 under algae | 7.57 ± 0.03 | 7.13 ± 0.03 | 6.73 ± 0.03 | 6.77 ± 0.03 | −292 | −225 | n.d. | n.d. | n.d. |
| 10 | 7.27 ± 0.03 | 7.37 ± 0.03 | 6.8 ± 0.06 | 6.87 ± 0.03 | −121 | −133 | 3.2 | 42 | 7.3 |
| Site | Pore Water | ||||
|---|---|---|---|---|---|
| Month | Cu | Zn | Cd | Pb | |
| 1 | May | 3.61 ± 0.14 | 8.11 ± 0.3 | 0.07 ± 0.004 | 2.67 ± 0.16 |
| July | 5.8 ± 0.15 | 1.96 ± 0.06 | 0.082 ± 0.005 | 1.18 ± 0.05 | |
| 2 | May | n.d. | n.d. | n.d. | n.d. |
| July | 2.45 ± 0.07 | 2.41 ± 0.08 | 0.048 ± 0.0014 | 0.94 ± 0.04 | |
| 3 | May | n.d. | n.d. | 0.049 ± 0.001 | n.d. |
| July | 2.99 ± 0.09 | 0.84 ± 0.03 | 0.014 ± 0.0003 | 0.77 ± 0.03 | |
| 4 | May | n.d. | n.d. | n.d. | n.d. |
| July | n.d. | n.d. | n.d. | n.d. | |
| 5 | May | n.d. | n.d. | n.d. | n.d. |
| July | 3.54 ± 0.12 | 0.87 ± 0.04 | 0.018 ± 0.001 | 0.79 ± 0.03 | |
| 6 | May | 18.2 ± 0.65 | 15.1 ± 0.53 | 0.17 ± 0.009 | 2.29 ± 0.13 |
| July | 5.55 ± 0.15 | 1.97 ± 0.06 | 0.022 ± 0.001 | 1.59 ± 0.07 | |
| 7 | May | 4.98 ± 0.18 | 21.93 ± 0.82 | 0.18 ± 0.009 | 1.37 ± 0.08 |
| July | 1.83 ± 0.03 | 10.4 ± 0.29 | 0.58 ± 0.02 | 1.67 ± 0.08 | |
| 8 | May | 6.13 ± 0.24 | 8.49 ± 0.35 | 0.12 ± 0.006 | 2.15 ± 0.12 |
| July | 3.25 ± 0.09 | 2.34 ± 0.07 | 0.029 ± 0.001 | 0.77 ± 0.03 | |
| 9 | May | 4.41 ± 0.17 | 9.21 ± 0.33 | 0.01 ± 0.006 | 1.25 ± 0.07 |
| July | 10.49 ± 0.3 | 2.59 ± 0.07 | 0.049 ± 0.003 | 1.3 ± 0.05 | |
| 10 | May | n.d. | n.d. | n.d. | n.d. |
| July | n.d. | n.d. | n.d. | n.d. | |
| Metal | Cu Pore | Zn Pore | Cd Pore | Pb Pore |
|---|---|---|---|---|
| Cu sed | n.s | n.s | n.s | n.s |
| Zn sed | n.s | −0.73 | n.s | n.s |
| Cd sed | n.s | n.s | −0.62 | n.s |
| Pb sed | n.s | n.s | n.s | 0.85 |
| Cu w | n.s | n.s | n.s | n.s |
| Zn w | n.s | 0.62 | n.s | n.s |
| Cd w | n.s | n.s | 0.62 | n.s |
| Pb w | n.s | n.s | n.s | 0.79 |
| Cu alg | 1.00 | 0.98 | 1.00 | n.s |
| Zn alg | 1.00 | 0.98 | 1.00 | n.s |
| Cd alg | 1.00 | 0.98 | 1.00 | n.s |
| Pb alg | n.s | n.s | n.s | 0.98 |
| Metal | Cu Pore | Zn Pore | Cd Pore | Pb Pore |
|---|---|---|---|---|
| Cu w | 0.52 | n.s | n.s | n.s |
| Zn w | −0.66 | n.s | −0.57 | n.s |
| Cd w | −0.51 | −0.45 | −0.83 | n.s |
| Pb w | n.s | n.s | −0.67 | n.s |
| Cu alg | n.s | 0.74 | 0.63 | 0.73 |
| Zn alg | −0.47 | n.s | 0.54 | n.s |
| Cd alg | 0.51 | n.s | n.s | n.s |
| Pb alg | n.s | 0.80 | 0.95 | 0.88 |
| Metal | Cu | Zn | Cd | Pb |
|---|---|---|---|---|
| EQSW | 0.001 | 0.01 | 0.00008 | 0.00012 |
| BCF, May | 9.4 × 10³ | 2.9 × 10⁴ | 4.8 × 10³ | 3.5 × 10⁴ |
| BCF, July | 1.6 × 10⁴ | 2.8 × 10⁴ | 3.2 × 10⁴ | 1 × 10⁴ |
| EQSMPC May | 9.41 | 285.97 | 0.39 | 4.1 |
| EQSMPC July | 16.29 | 282.3 | 2.58 | 1.2 |
| Cclad May | 10.8–28.3 | 38–105.17 | 0.15–0.56 | 6.02–31.07 |
| Cclad July | 5.87–9.02 | 17.67–47.3 | 0.14–0.32 | 3.41–17.01 |
| Year | Cu | Zn | Cd | Pb |
|---|---|---|---|---|
| 2012 [17] | 1.46–67.37 | 10.29–83.83 | <0.05–0.20 | 2.45–31.6 |
| 2014 [16] | 1.90–55.7 | 7.13–66.12 | 0.04–0.29 | 6.22–32.67 |
| 2017 [5] | 1.63–22.91 | 7.81–77.61 | 0.03–0.53 | 8.05–240 |
| 2019 | 2.66–10.33 | 6.61–36.22 | 0.05–0.3 | 7.12–23.9 |
| Low Effect Level [20] | 16 | 120 | 0.6 | 31 |
Disclaimer/Publisher’s Note: The statements, opinions and data contained in all publications are solely those of the individual author(s) and contributor(s) and not of MDPI and/or the editor(s). MDPI and/or the editor(s) disclaim responsibility for any injury to people or property resulting from any ideas, methods, instructions or products referred to in the content. |
© 2023 by the authors. Licensee MDPI, Basel, Switzerland. This article is an open access article distributed under the terms and conditions of the Creative Commons Attribution (CC BY) license (https://creativecommons.org/licenses/by/4.0/).
Share and Cite
Gubelit, Y.I.; Shigaeva, T.D.; Kudryavtseva, V.A.; Berezina, N.A. Heavy Metal Content in Macroalgae as a Tool for Environmental Quality Assessment: The Eastern Gulf of Finland Case Study. J. Mar. Sci. Eng. 2023, 11, 1640. https://doi.org/10.3390/jmse11091640
Gubelit YI, Shigaeva TD, Kudryavtseva VA, Berezina NA. Heavy Metal Content in Macroalgae as a Tool for Environmental Quality Assessment: The Eastern Gulf of Finland Case Study. Journal of Marine Science and Engineering. 2023; 11(9):1640. https://doi.org/10.3390/jmse11091640
Chicago/Turabian StyleGubelit, Yulia I., Tatiana D. Shigaeva, Valentina A. Kudryavtseva, and Nadezhda A. Berezina. 2023. "Heavy Metal Content in Macroalgae as a Tool for Environmental Quality Assessment: The Eastern Gulf of Finland Case Study" Journal of Marine Science and Engineering 11, no. 9: 1640. https://doi.org/10.3390/jmse11091640
APA StyleGubelit, Y. I., Shigaeva, T. D., Kudryavtseva, V. A., & Berezina, N. A. (2023). Heavy Metal Content in Macroalgae as a Tool for Environmental Quality Assessment: The Eastern Gulf of Finland Case Study. Journal of Marine Science and Engineering, 11(9), 1640. https://doi.org/10.3390/jmse11091640