Article

Experimental Characteristics of Hydrocarbon Generation from Scandinavian Alum Shale Carbonate Nodules: Implications for Hydrocarbon Generation from Majiagou Formation Marine Carbonates in China’s Ordos Basin

1
Hubei Key Laboratory of Petroleum Geochemistry and Environment, College of Resources and Environment, Yangtze University, Wuhan 430100, China
2
Research Institute of Petroleum Exploration & Development-Northwest, PetroChina, Lanzhou 730020, China
3
Jiangsu Design Institute of Geology for Mineral Resources, The Testing Center of China National Administration of Coal Geology, Xuzhou 221006, China
4
Guangzhou Institute of Energy Testing, Guangzhou 511447, China
*
Author to whom correspondence should be addressed.
J. Mar. Sci. Eng. 2023, 11(8), 1616; https://doi.org/10.3390/jmse11081616
Submission received: 3 July 2023 / Revised: 10 August 2023 / Accepted: 12 August 2023 / Published: 18 August 2023
(This article belongs to the Special Issue High-Efficient Exploration and Development of Oil & Gas from Ocean)

Abstract

:
The hydrocarbon source rocks of the marine carbonates of the Ordovician Majiagou Formation in the Ordos Basin are generally in the high-overmature stage and are, therefore, not suitable for hydrocarbon thermal simulation experiments. Their hydrocarbon generation potential and hydrocarbon generation characteristics are not clearly understood. Meanwhile, Nordic Cambrian carbonates are similar in lithology, parent material type, and sedimentary age, and are in the low evolution stage, which is suitable for hydrocarbon thermal simulation experiments. Therefore, in this study, we selected the Nordic carbonates for the gold tube thermal simulation experiment to analyze the content and geochemical characteristics of the thermal simulation products. The experimental results are also compared and analyzed with the characteristics of thermal simulation products of Pingliang Formation mud shale (contemporaneous with the Majiagou Formation) and Shanxi Formation coal (in the upper part of the Majiagou Formation), which are similar to the Majiagou Formation in the Ordos Basin. The results showed that the Nordic carbonate has different hydrocarbon production characteristics from the mud shale of the Pingliang Formation of the same parent material type, and although the hydrocarbon production yields of the two are not very different, the carbonate still produces methane at 600 °C. The hydrocarbon production yield of the Nordic carbonates is almost equivalent to that of type-II2 kerogen, indicating that the hydrocarbon production yield is not related to lithology and only to the organic matter type; however, the Nordic carbonate can produce a large amount of H2S. The alkane carbon isotope changes are mainly controlled by the degree of thermal evolution, showing gradual heaviness with increasing temperature. No carbon isotope sequence reversal occurred during the thermal simulation, and its distribution range is roughly the same as that of the alkane carbon isotope composition of the mud shale of the Pingliang Formation. The ethane carbon isotope composition is as heavy as −21.2‰ at the high-temperature stage, showing similar coal-type gas characteristics. The addition of calcium sulphate (CaSO4) causes the TSR reaction to occur, which has a significant impact on the methane content under high maturity conditions, reducing its content by more than 50% at 600 °C. However, the addition of CaSO4 increases the yield of heavy hydrocarbon gases, such as ethane, and promotes the production of C6-14 hydrocarbons and C14+ hydrocarbons at high-temperature stages, and the addition of CaSO4 substantially increases the yield of H2, CO2, and H2S. The thermal simulation results have implications for the hydrocarbon formation mechanism of the early Paleozoic marine carbonate formation system in the stacked basins of the Ordos Basin and the Tarim Basin in China.

1. Introduction

The carbonate sequence has a pivotal position in the global oil and gas exploration field, with rich hydrocarbon resources and great exploration potential [1,2,3,4,5]. The Ordos Basin, in the central part of the Chinese mainland, is the basin with the largest natural gas distribution area and the largest natural gas accumulation in China, and its Lower Paleozoic Ordovician marine carbonate formation system is an important formation system for natural gas exploration [6,7]. Since the discovery of the Jingbian gas field in the Lower Paleozoic Ordovician in the central part of the basin at the end of the last century, after years of continuous exploration and development, the Jingbian gas field in the central part of the basin and the surrounding areas have been explored to a high degree, but their origin is still controversial [8,9,10]. It is speculated whether the carbonate rocks of the Ordovician Majiagou Formation can be used as hydrocarbon source rocks to form large gas fields.
The marine carbonate formations of the Majiagou Formation are dominated by sapropel-type kerogen with an average of 0.24 wt.% total organic carbon, which is considered by local scholars [11,12] to be below the lower limit of organic carbon of carbonate hydrocarbon source rocks and not an effective gas source rock with high maturity (vRo = 2.07–2.68%), having reached the past maturity stage. Kerogen, crude oil, and soluble organic matter are dominated by cracked gas, and therefore, the hydrocarbon products of the lower Paleozoic marine strata are dominated by natural gas [13,14]. The same is true for the Lower Paleozoic marine hydrocarbon source rocks in the Sichuan and Tarim basins, neither of which is suitable for hydrocarbon thermal simulation experiments to reflect their hydrocarbon production characteristics, mechanisms, and hydrocarbon generation potential. Therefore, when studying the hydrocarbon generation mechanism of carbonate rocks, carbonate rock samples from other strata have been chosen as substitutes, such as Jurassic marine carbonates from the Qiangtang Basin of the Qinghai-Tibet Plateau (Ro approximately 0.25–1.05%) [15], shales and marls from the Upper Paleozoic Xiamaling Formation in the Xiahuayuan area of Hebei Province (Ro approximately 0.50–0.65%) [16], Devonian shales and marls from the Luquan area of Yunnan Province (Ro approximately 0.45~0.60%) [17], or mud shales from the Ordovician, which were selected for thermal simulation experiments, such as low-maturity Estonian shales, mature-overmaturity Indogan shales, Sargan shales, and Pingliang shales [18].
However, the above samples differ significantly from the characteristics of Ordovician marine hydrocarbon source rocks in the Ordos Basin, such as inconsistent lithology (carbonates versus mud shales) or large differences in stratigraphic age, causing the hydrocarbon generation parent material to be variable. Several decades of organic geochemical work, including significant advancements in biomarker analysis, have demonstrated organic geochemical indicators of source rock age, terrestrial versus marine source rock organic matter, source rock depositional environments including water column chemistry and toxicity, source rock sedimentary facies, and myriad other paleoclimatic and paleoenvironmental conditions associated with a source rock and its deposition, not to mention indicators of oil thermal maturity, mixing, and biodegradation [19,20,21,22,23]. Therefore, several factors, such as lithology, stratigraphic age, thermal maturity, and hydrocarbon generation parent material, need to be considered when selecting samples for thermal simulation experiments.
In this study, carbonate nodules in the Scandinavian Middle Cambrian–Lower Ordovician Alum Shale of the Baltic Sea were selected for thermal simulation experiments. This carbonate nodule sample has the same lithology and similar parent material type and sedimentary age, and is at a low evolutionary stage compared with the carbonates of the Majiagou Formation in the Ordos Basin. Therefore, we selected it for hydrocarbon generation thermal simulation experiments, and the experimental results are valuable references for the hydrocarbon generation mechanism, characteristics, and hydrocarbon generation potential of the carbonate rocks of the Majiagou Formation in the Ordos Basin.

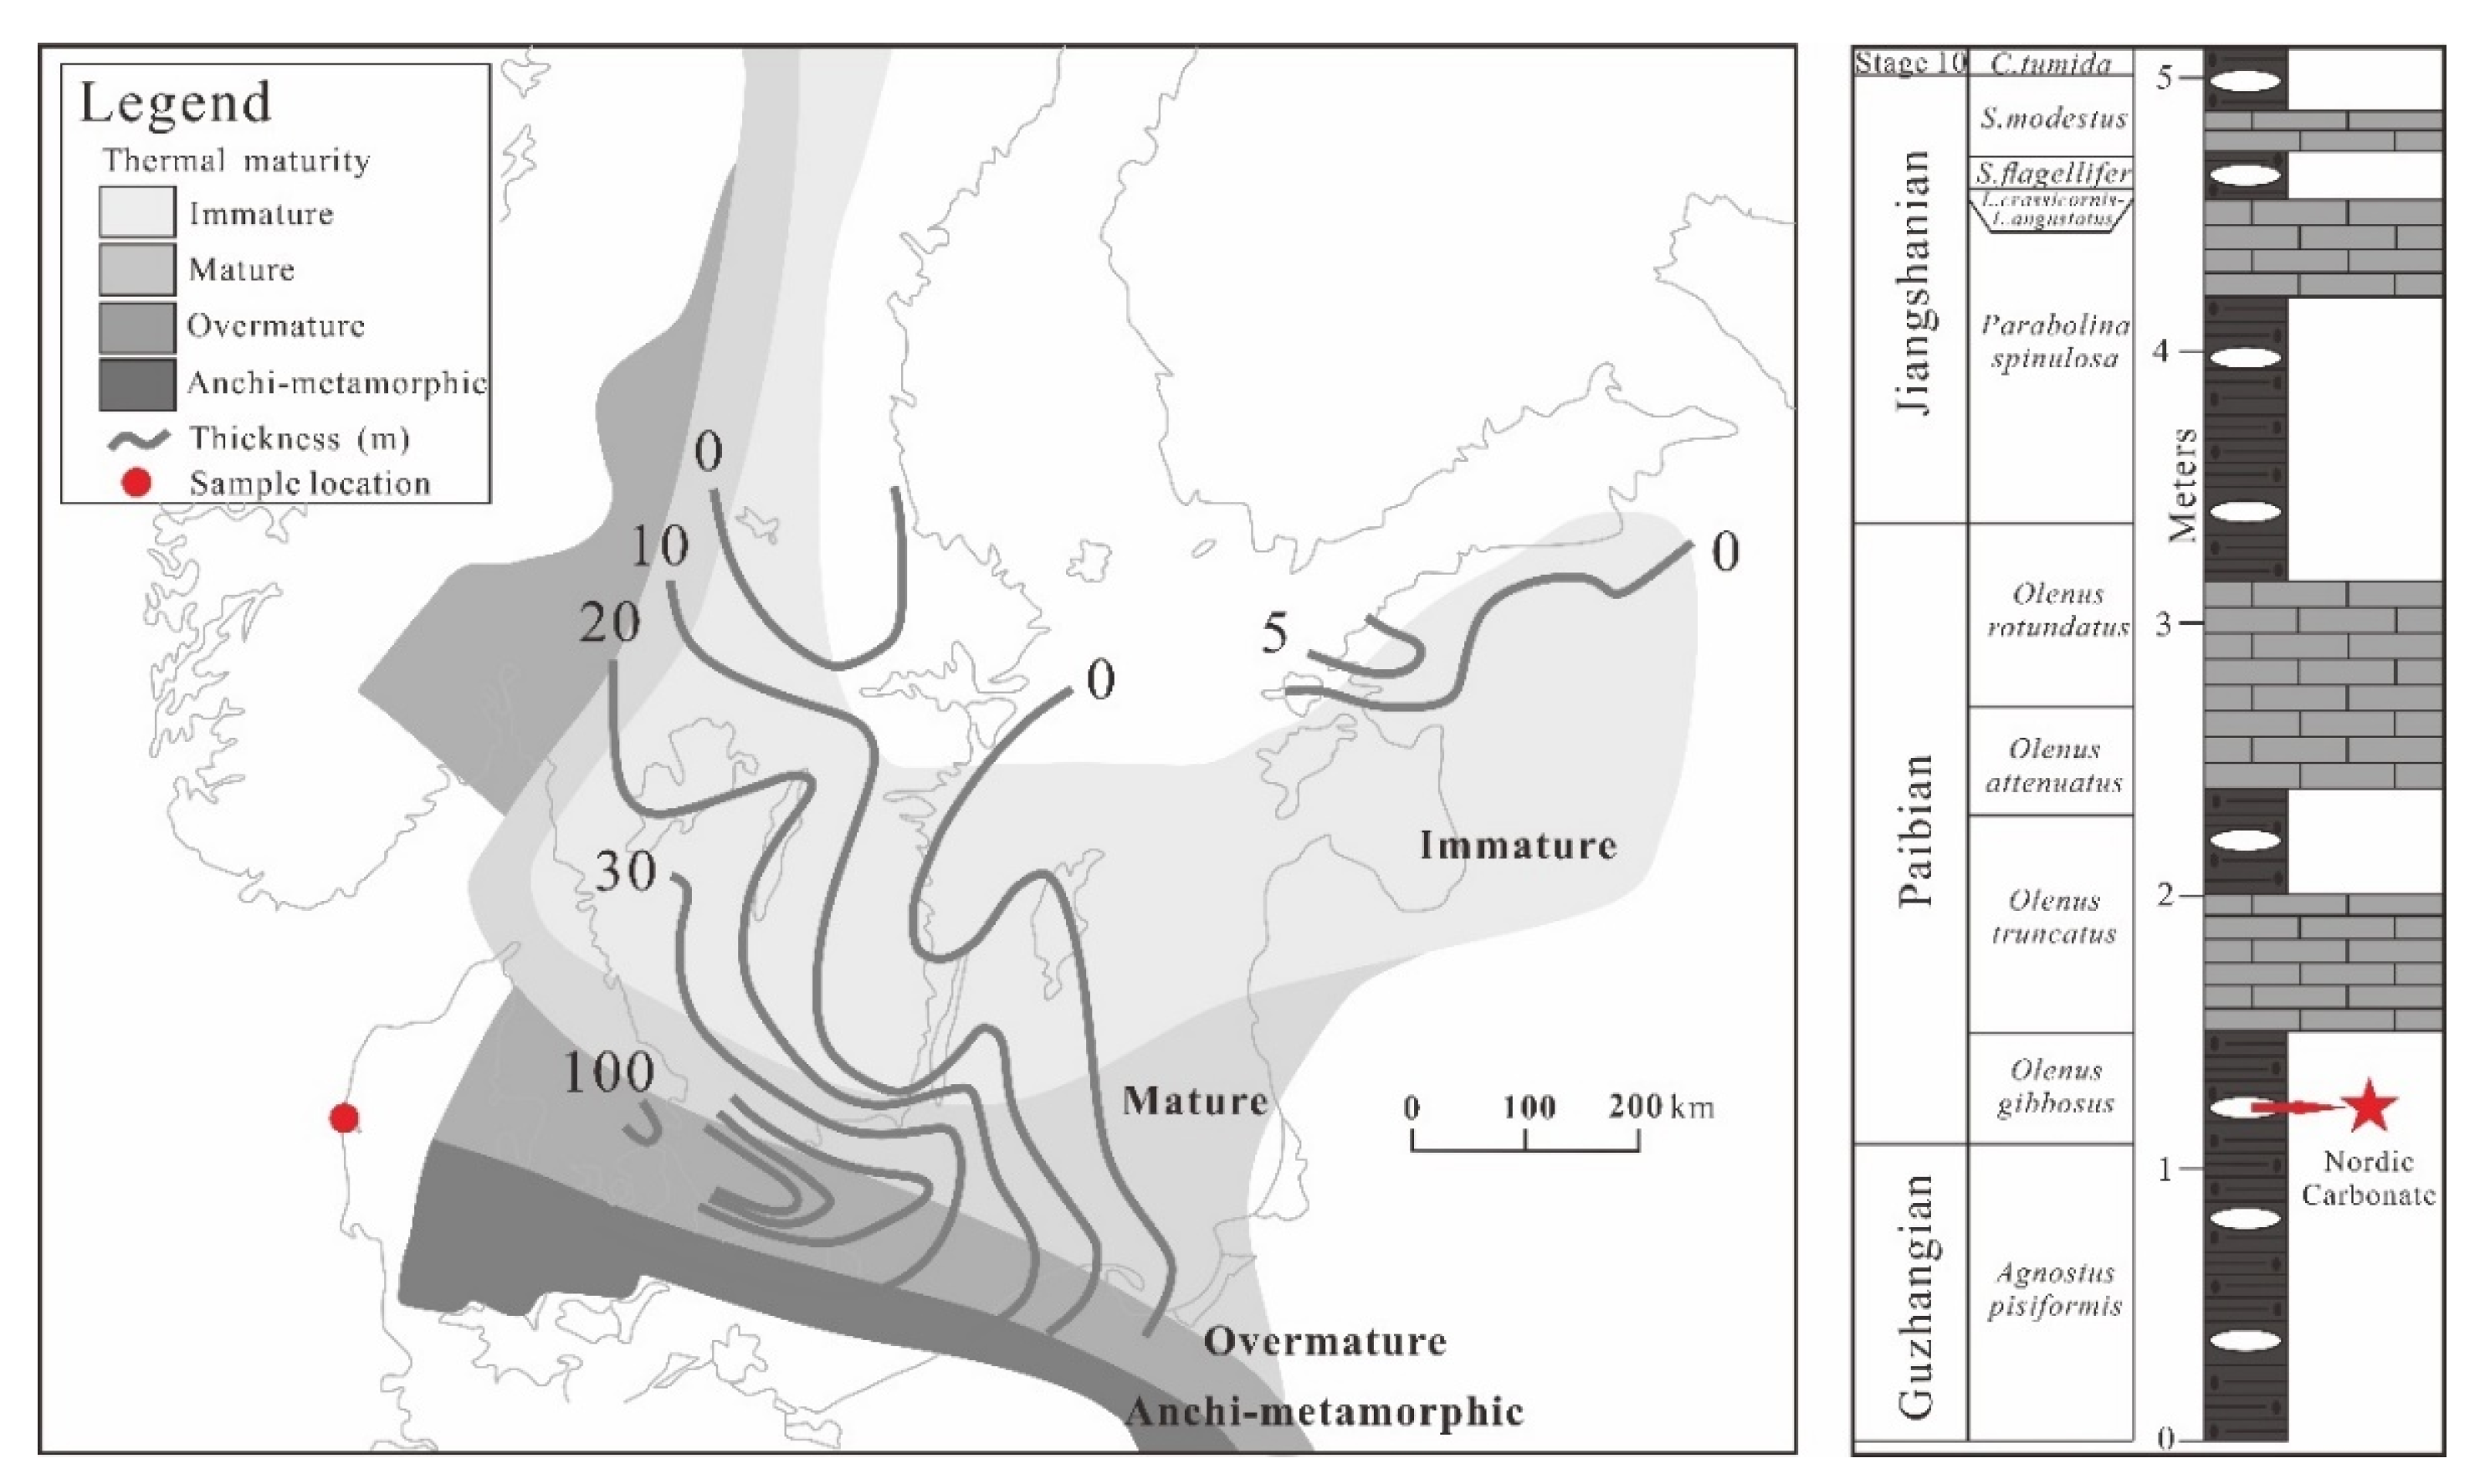
2. Geological Setting

The Alum Shale Formation in northwestern Europe was deposited from the Middle Cambrian (Miaolingian) to the Early Ordovician (Tremadoc) in the Baltic Basin and surrounding countries. It is a conventional source of oil from Cambrian, Ordovician, and Silurian carbonates and also has potential for shale oil and biogenic or thermogenic shale gas [24] (Figure 1).
Alum Shale is an important hydrocarbon source rock in the Baltic Basin that varies in maturity from immature to overmature and is dominated by marine organic matter, such as algae and bacteria [24,25]. Approximately 50 small oil fields and 1 medium-sized oil field have been discovered.

3. Samples and Experimental Method
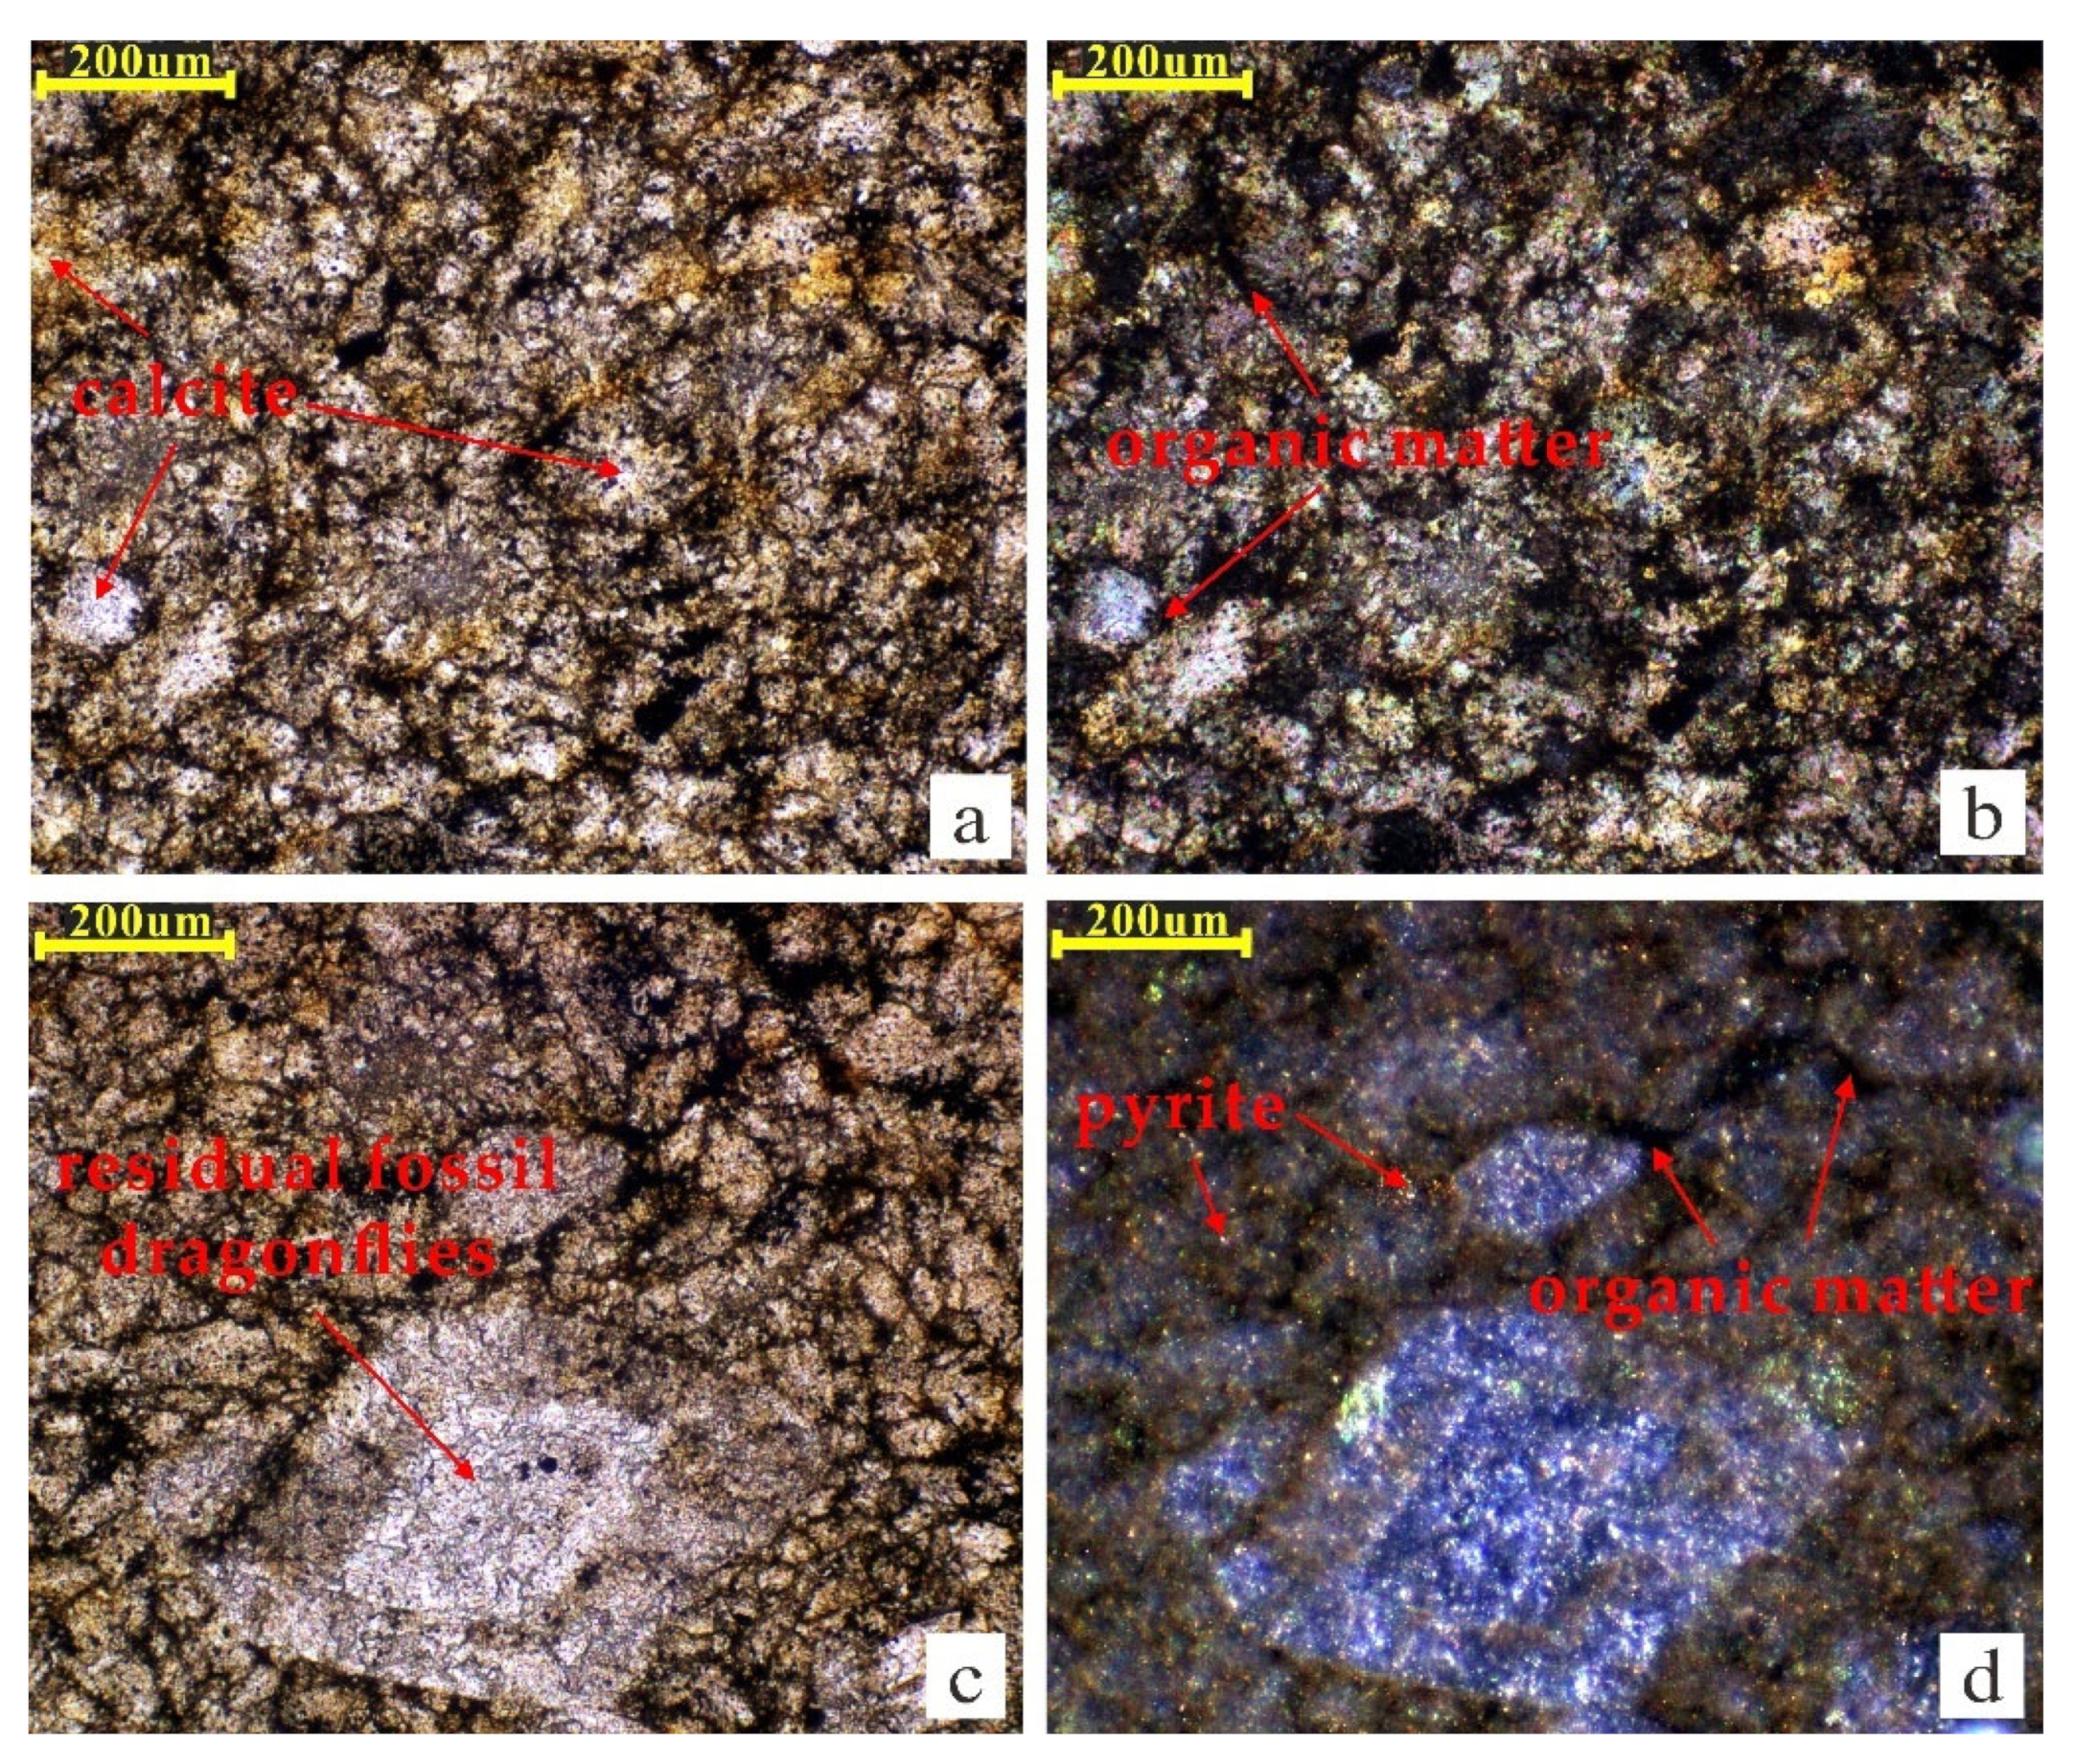
3.1. Samples

The experimental sample was taken from carbonate nodules in the Scandinavian Middle Cambrian–Lower Ordovician Alum Shale in the Baltic Sea (Figure 1), which had a TOC content of 1.16 wt.%, with free hydrocarbon (S1) 0.21 mg/g, oil potential (S2) 4.08 mg/g, hydrogen index (HI) 351 mg/g, Tmax 429 °C, equivalent vitrinite reflectance 0.57% and organic matter type IIB (Table 1). The sample has a high organic matter content and low thermal maturity, making it suitable for hydrocarbon generation thermal simulation experiments. Whole rock mineral composition analysis showed that the mineral composition of this sample was predominantly calcite at 94.40%, with small amounts of quartz and pyrite and no clay minerals [26], indicating that the sample was a pure carbonate rock with no mud.
The lithology of the Majiagou Formation is carbonate rock–paste salt rock alternately developed, of which the Maj 1 section, Maj 3 section, and Maj 5 section develop the sea recession cyclic table within the evaporite limitation of terrace phase deposition; its lithology is mainly for the salt rock, hard gypsum, sandwiched between thin layers of paste-bearing dolomite, muddy dolomite, and limestone. The Maj 2 section, the Maj 4 section, and the Maj 6 section belong to the sea recession cyclic carbonate terrace phase deposition, and its lithology is mainly for the limestone and dolomite. The commonly called “salt up” and “salt down” are generally distinguished by the boundary of the huge thick saline rocks in the sixth sub-section of the fifth section of the Majiagou Formation (O1m56). The hydrocarbon parent material of the Well Mitan-1 is dominated by sapropel-type kerogen, with an average of 0.4 wt.% total organic carbon, at a high-overmature stage, and the hydrocarbon products are dominated by natural gas [27,28,29,30].
The results of the thin section identification showed that the Nordic carbonate sample had a residual structure, with calcite dominating the rock components and generally recrystallized (Figure 2). This formed semi-automorphic powder-fine crystalline calcite of approximately 0.05–0.15 mm grain size, with a small number of self-shaped rhombohedral de-clouded dolomite pseudocrystals of approximately 0.10–0.20 mm grain size; a small amount of residual fossil dragonflies; and residual algal sand flakes. The residual algal sand fragments were generally 0.10–0.30 mm in size and consisted of mud-crystal calcite and mycorrhizal algae. The more complete individual fragments of fossil dragonflies were approximately 1.30 mm long and 0.30 mm wide, pike-shaped or rhombic in shape, 0.70 mm long and 0.45 mm wide, mostly in fragments, and poorly preserved. These contained a large amount of scattered micronized pyrite and hematite.

3.2. TOC and Rock Pyrolysis Analysis Methods

The rock samples were crushed and passed through an 0.08 mm (200 mesh) sieve, dried at low temperature, weighed 80–120 mg of samples into the crucible, added with dilute hydrochloric acid (volume ratio of concentrated hydrochloric acid and deionized water is 1:7) for inorganic carbon reaction, and then tested for TOC after removing the inorganic carbon, and the TOC was analyzed with a LECO CS230 Carbon and Sulfur Meter according to the standard method of Determination of Organic Carbon in Sedimentary Rocks (GB/T 19145). The pyrolysis analyses were carried out on the OGE-VI instrument produced by China Petroleum Exploration Institute (CPEI). Before analysis, the sample was crushed and passed through an 0.08 mm (200 mesh) sieve, dried at low temperature, weighed at 80–120 mg into the crucible, and then the sample was analyzed by automatic injection on the instrument. The heating procedure for sample analysis was as follows: during the pyrolysis analysis, the instrument was first rapidly heated to 300 °C at a constant temperature for 3 min to measure the free hydrocarbon S1 content; then, the temperature was increased to 600 °C at a heating rate of 50 °C/min, and then at a constant temperature for 1 min to detect the content of pyrolysis hydrocarbon S2; and some of the compounds that can be easily cracked from 300 °C to 392 °C were collected at the same time as the collection of S2; and the collection of the S3 was carried out at the same time.

3.3. Thermal Simulation Experiment Method

Hydrocarbon source rock thermal simulation experiments are an important tool to study the hydrocarbon generation process, product characteristics, and hydrocarbon formation evolution of organic matter [31]. Among many thermal simulation instruments, the gold tube thermal simulation system [32,33] in a closed system can simulate the effect of temperature and pressure on the thermal evolution of organic matter simultaneously. Furthermore, gold is chemically inert, which can prevent the catalytic effect of the reaction device on hydrocarbon formation. Gold also has good ductility at high temperature, so it is considered one of the most suitable systems for simulating the gas generation characteristics of organic matter.
The thermal simulation experiment was carried out at the State Key Laboratory of Organic Geochemistry, Guangzhou Institute of Geochemistry, Chinese Academy of Sciences. We used a gold tube–autoclave closed thermal simulation system, and 200–600 mg whole rock samples was individually welded and sealed inside the gold tubes under argon protection (in this experiment, there was also a process of adding calcium sulfate, where the ratio of rock samples to calcium sulfate was approximately 1:1, and the rock samples weighed 120–300 mg). The gold tubes were placed inside the autoclave, and then a high-pressure pump was used to fill the autoclave with high-pressure water, thus exerting pressure on the outer wall of the gold tube, which in turn exerted a certain pressure on the rock sample and the thermal simulation product, using a pressure sensor to regulate and maintain the pressure in each autoclave at 50 MPa. The two sets of samples were warmed using two heating rate programs, slow (2 °C/h) and fast (20 °C/h). Twelve test temperature points were set for each set of samples (with a total of three temperature points set for the series with calcium sulfate addition, at 504 °C, 552 °C, and 600 °C), with a temperature range of 336–600 °C. After the reaction, the autoclave was removed from the heating oven, and the gold tubes were removed, washed, and placed in a fixed-volume vacuum system that was connected to an Agilent model 6890 N gas chromatograph. The gold tube was punctured with a needle under sealed conditions to release pyrolysis gases for analysis using a chromatograph and mass spectrometer.
The quantitative analysis part was carried out with an Agilent 6890 N gas chromatograph to collect the hydrocarbon products in the thermal simulation experiment, and the hydrocarbon components of C1–C5 were quantified and analyzed online with the external standard method using the FID detector. After the analysis of the gas components was completed, the appropriate amount of gas was extracted with a transfer device, and the carbon isotope analysis of the gas components was carried out with an Isochrom II GC-IRMS isotope mass spectrometer produced by VG Company of the United Kingdom.

4. Results

Thermal Simulation Experiment Results

Thermal simulation experiments provide the complete process of hydrocarbon generation from hydrocarbon source rocks as the temperature changes, and can reproduce the history of continuous maturation of sedimentary organic matter in the subsurface. However, the most intuitive data from simulation experiments are the composition and yield of hydrocarbons at different temperature points, which differ greatly from the relatively mild and long-lasting geological conditions. Thus, the easyRo model [34,35,36], which is commonly used in industry, was used to relate time accumulation at the laboratory scale to maturation under geological conditions (Figure 3).
Hydrocarbon generation thermal simulation experiments were carried out under heating rates of 20 °C/h and 2 °C/h. As shown in Figure 2, the easyRo value continues to increase with increasing pyrolysis temperature. In the experimental temperature range, the corresponding easyRo value was 0.57% (20 °C/h)/0.74% (2 °C/h) at the lowest temperature of 336 °C, and the easyRo value was 3.87% (20 °C/h)/4.45% (2 °C/h) at the highest temperature of 600 °C.
During the thermal simulation experiment, gaseous hydrocarbons (C1–C5), liquid hydrocarbons (C6+), and non-hydrocarbons (H2, CO2, H2S) were generated. The yield of these components and the carbon isotopic composition of the alkanes varied gradually with increasing thermal simulation temperature (Table 2 and Table 3).
In general, the experimental samples produced more methane and nonhydrocarbon gases at 20 °C/h than at 2 °C/h, and produced or cracked heavy hydrocarbon gases (C2+) and liquid hydrocarbons (C6+) at higher temperatures. This suggested that the slow heating rate during thermal simulation continued the reaction adequately, and therefore, the hydrocarbon yields were higher at lower heating rates, a phenomenon consistent with the results of previous studies [37]. During the thermal simulation, the methane yield increased with increasing thermal simulation temperature and showed an increasing trend at 600 °C. The heavy hydrocarbon gas (C2+) yield increased and then decreased, with its yield approaching zero at 550 °C under slow warming conditions. The trend in the yield of liquid hydrocarbons (C6+) was similar to that of the heavy hydrocarbon gases (C2+). The yields of CO2 and H2 of the nonhydrocarbon gases increased with increasing experimental temperature, and the yield of H2S showed an increasing trend before equilibrium (Table 2). The carbon isotopic compositions of methane, ethane, and propane became progressively heavier with increasing temperature during the thermal simulations, following the kinetic isotope effect [38], with positive carbon isotope sequences (δ13C1 < δ13C2 < δ13C3) at all temperature points, and no carbon isotope sequence inversions were observed (Table 3).

5. Comparison of Thermal Simulation Products with Mud Shale of the Pingliang Formation and Coal of the Shanxi Formation

In the thermal simulation experiments, samples from different basins, parent material types, maturities, and other characteristics had different natural gas yields. Considering that natural gas yields are mainly controlled by total organic carbon, we performed TOC normalization for gaseous hydrocarbon yields to facilitate the comparison of natural gas yields of various hydrocarbon source rocks. In this study, we compare the thermal modeling products of the Nordic carbonates with those of the Pingliang Formation mud shale [39] (contemporaneous with the Majiagou Formation samples), which is similar to the Majiagou Formation, and the Shanxi Formation coal [40] (in the upper part of the Majiagou Formation). Among them, the Pingliang Formation in the Ordos Basin is an important set of mud shale of the Ordovician, which was deposited in succession with the underlying Majiagou Formation, but its distribution is relatively limited, only in the southwestern margin of the Ordos Basin; the Shanxi Formation is a coal of the Carboniferous Permian, and it is a very important set of hydrocarbon source rocks of the Upper Paleozoic in the Ordos Basin, and it is also the source of hydrocarbon in many atmospheric fields. Both sample groups and the Nordic carbonates in this study used the closed-system gold tube thermal simulation system, and the experimental conditions were mostly the same.

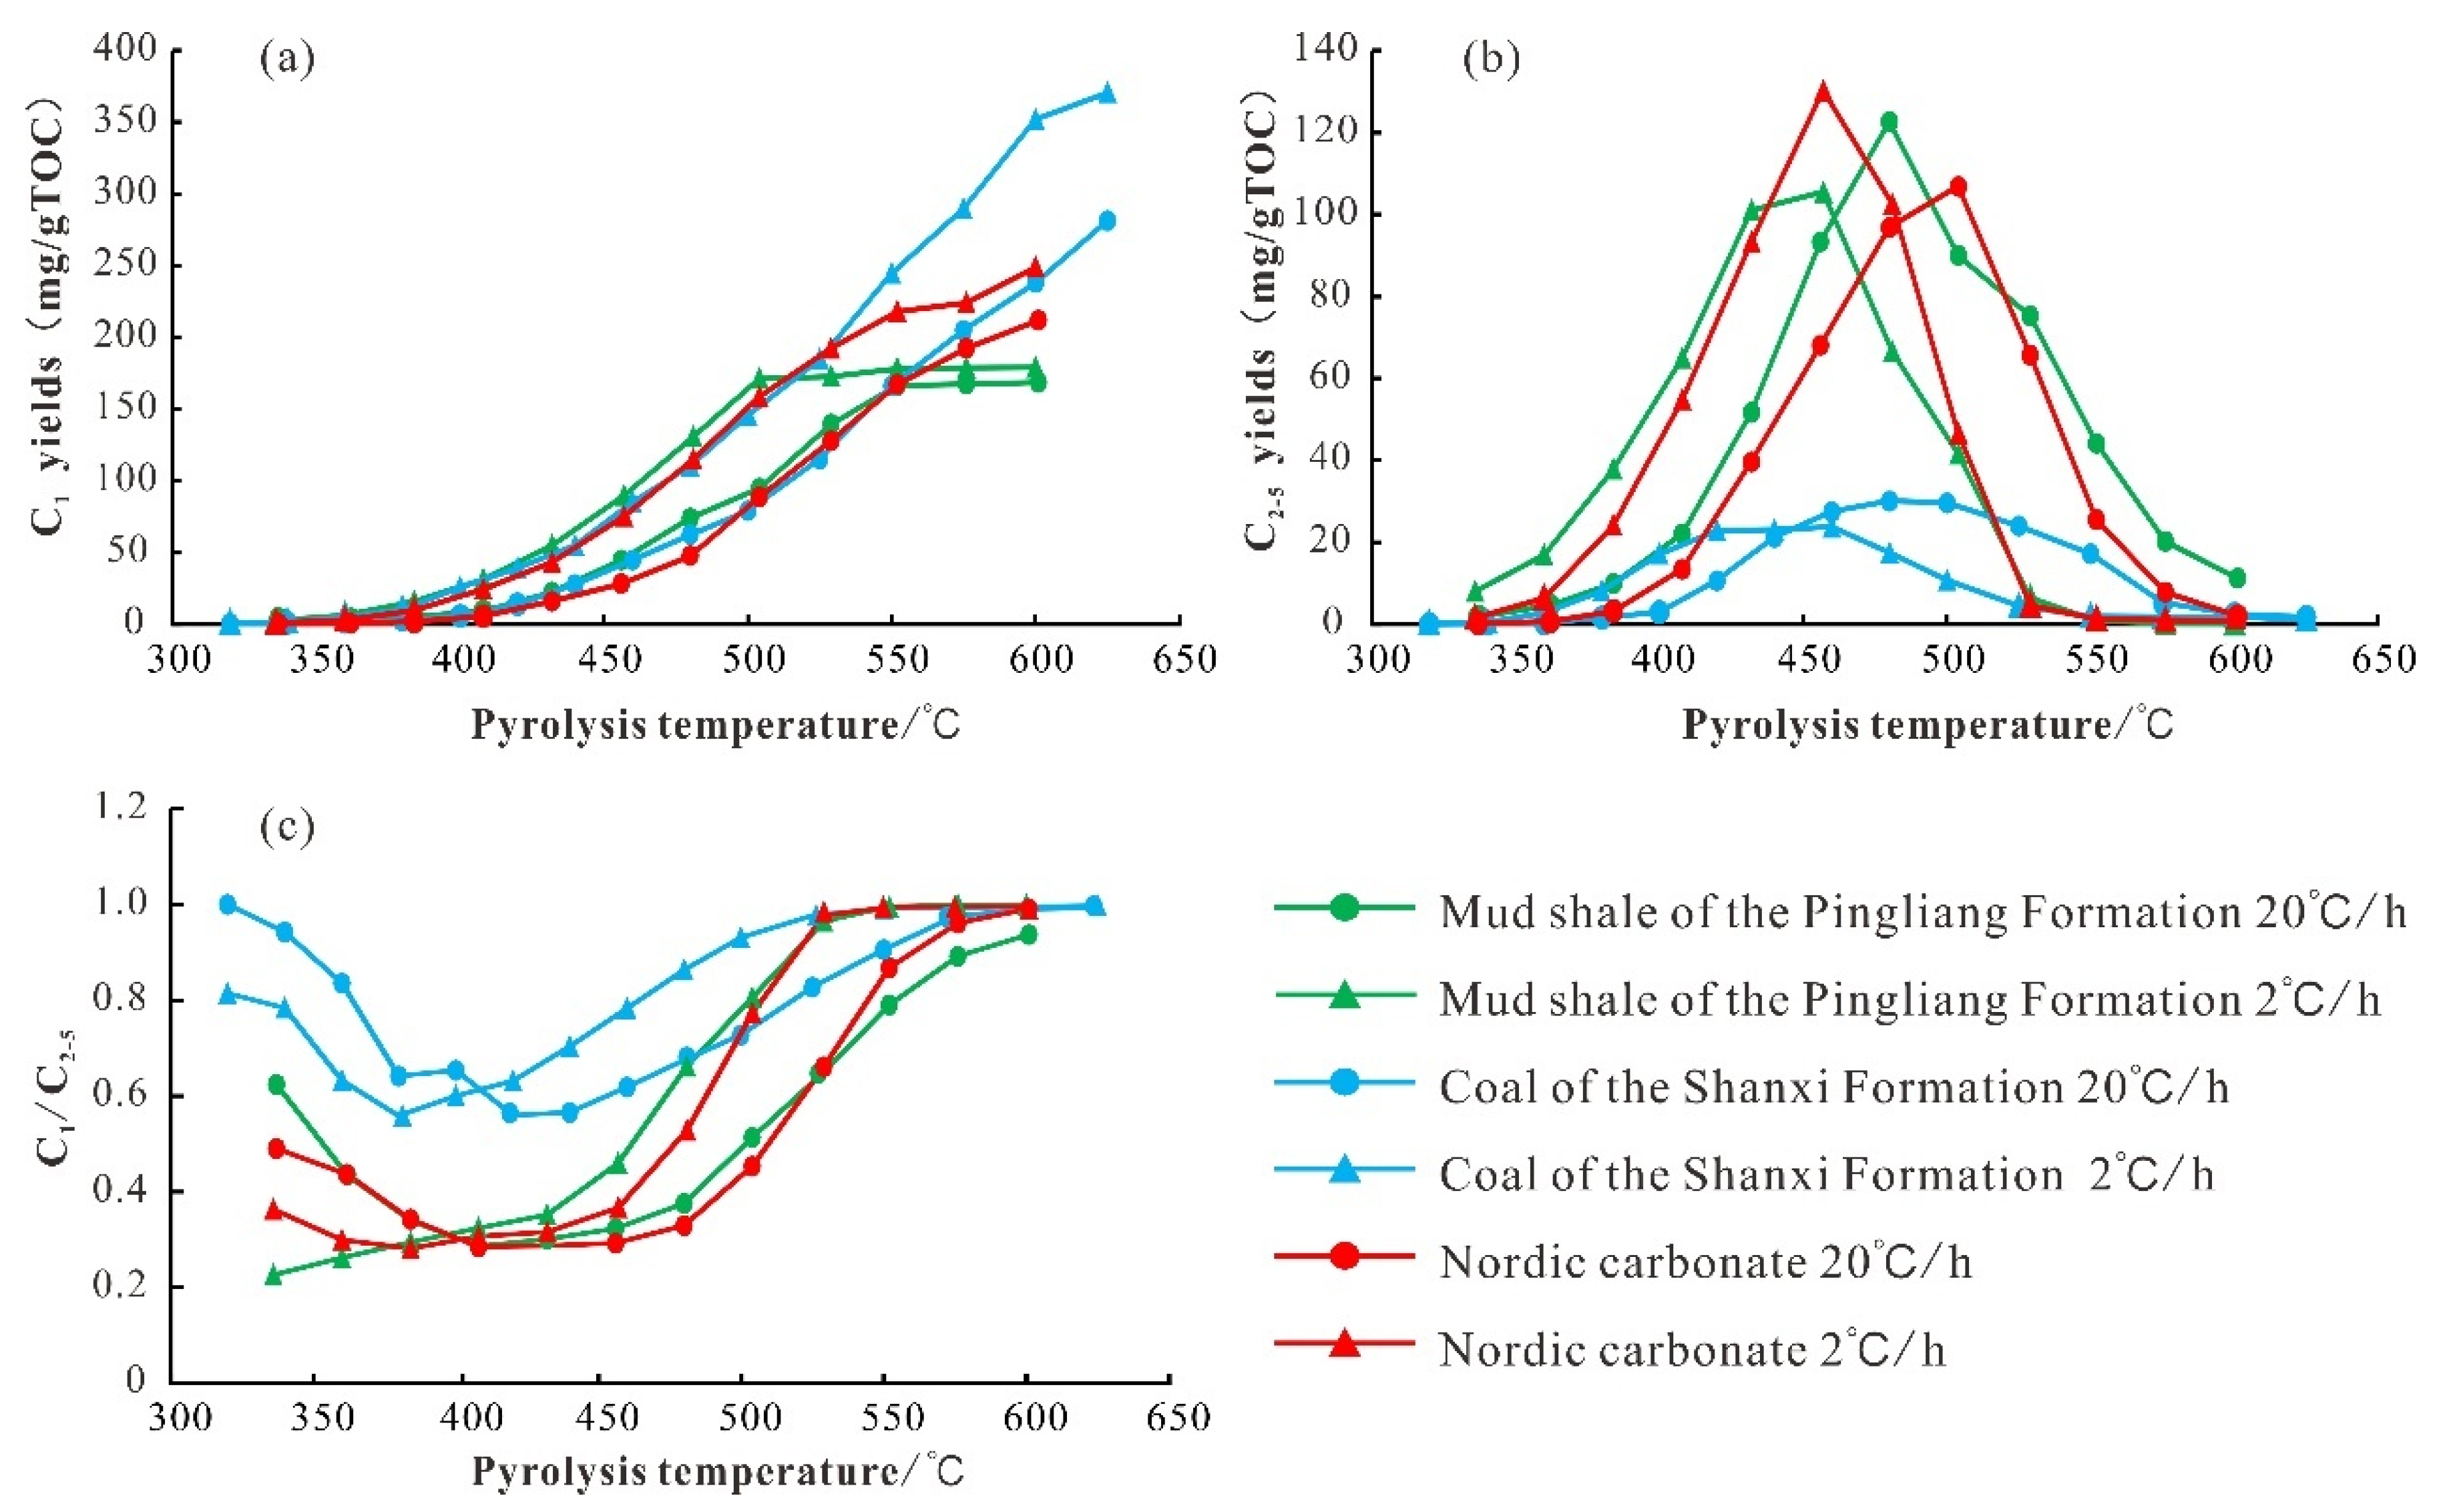
5.1. Gaseous Product Evolutionary Characteristics

5.1.1. Pyrolysis Gaseous Hydrocarbon Characteristics

The experimental results showed that the methane (C1) yield of the Nordic carbonate increased rapidly with increasing temperature during the thermal simulation and maintained a high growth rate at the highest temperature of 600 °C, indicating that there was still a strong potential for methane production at this time. The C1 yield of the mud shale of the Pingliang Formation increased continuously from 336 °C to 504–552 °C during the thermal simulation and decreased significantly to almost zero at higher temperatures (easyRo > 2.99%). The C1 yields of the coal of the Shanxi Formation were close to those of the Nordic carbonate until 530 °C, with higher C1 yields for the coal of the Shanxi Formation at higher temperatures (Figure 4a).
Unlike methane yield, heavy hydrocarbon gases, such as ethane (C2-5), showed a parabolic pattern of increasing and then decreasing with increasing temperature. The C2-5 yields and characteristics of the Nordic carbonate and the mud shale of the Pingliang Formation were relatively similar with a 2 °C/h heating rate, and increased rapidly with increasing pyrolysis temperature from 336 °C, reaching a maximum at 456 °C (easyRo = 2.09%), and then gradually decreasing, eventually approaching 0 at a pyrolysis temperature of 600 °C (Figure 4b). This indicated that the hydrocarbon gases at the end of the experiment were mainly composed of methane, accounting for more than 99% of the hydrocarbon gases. The predominance of methane during thermal evolution naturally carries implications for the type of petroleum systems (including methane hydrate systems [41,42,43]) that might develop as a result. In contrast, the coal of the Shanxi Formation had a lower C2-5 yield, approximately a quarter of the Nordic carbonate, suggesting a significant difference in the gas compositions generated between the two samples.
The gas drying coefficient (C1/C1-5) is an important parameter in natural gas geochemical studies and is of great importance for identifying the natural gas genesis, secondary role, and thermal maturity [44,45,46]. In thermal simulations of Nordic carbonate, C1/C1-5 decreased and then increased with temperature, with a minimum value of 0.5 at 384 °C (easyRo = 1.08%) for a 2 °C/h heating rate, followed by a relative increase in methane content due to the cracking of C2+ hydrocarbons and an increase in the drying coefficient (Figure 4c). Such trends in gas drying coefficients are very common in thermal simulation experiments and are generally thought to be related to the initial cracking of kerogen and the secondary cracking of hydrocarbons [47]. The initial temperature of the thermal simulation experiment was 336 °C, which was difficult to achieve in the geological reality of hydrocarbon formation, and was sufficient to allow rapid hydrocarbon generation from the cracking of kerogen, with short-chain gaseous hydrocarbons and long-chain liquid hydrocarbons forming simultaneously. As the temperature rose, the production of all hydrocarbons increased rapidly, but the rate of increase was relatively higher for the heavy hydrocarbon gases than for methane, causing the proportion of methane in the hydrocarbon gases to gradually decrease. The proportion of methane reached a low point when the secondary cracking threshold was reached. Thereafter, as the temperature increased, the kerogen continued to produce hydrocarbons in addition to C2-5 and liquid hydrocarbons, and a large amount of methane was formed by the secondary cracking of hydrocarbons, causing the proportion of methane to increase rapidly and the drying coefficient to increase (Figure 4c).
During the thermal simulation experiments, the C1/C1-5 values of the 2 °C/h series and the 20 °C/h series did not follow the same pattern, with the C1/C1-5 of the 2 °C/h series continuously increasing with the thermal simulation temperature, without a process of decreasing and then increasing. Moreover, the 20 °C/h series showed a process of decreasing and then increasing, and the difference between the C1/C1-5 of the two experiments at the initial temperature point was considerable. At 400–525 °C, the C1/C1-5 values of the Nordic carbonates were slightly less than those of the mud shale of the Pingliang Formation at the same temperature point, while at temperatures greater than 525 °C, the C1/C1-5 values of the Nordic carbonates were slightly more than those of the mud shale of the Pingliang Formation, and relatively speaking, the C1/C1-5 values of both were less different throughout the experiment. Although the C1/C1-5 value of the coal of the Shanxi Formation also underwent a process of first decreasing and then increasing, it had a higher value than that of Nordic carbonate, that is, the content of C2-5 in hydrocarbon gases was lower.
The drying coefficients of Pingliang Formation mud shale and Nordic carbonate rocks are relatively lower than those of Shanxi Formation coals. The thermal evolution of the Majiagou Formation in the Ordos Basin (Mitan-1 well, Tong-74 well, and Jingtan-1 well, etc.) [48] has already reached the high-overmature stage, but the drying coefficients (0.947, 0.989, and 0.996) tend to be close to 1, indicating that its natural gas still belongs to the wet gas and not to the dry gas. One of the wells, Mitan-1, is a well that has made a major breakthrough at subsalt, and it is also a more typical well. Therefore, the results of thermal simulation experiments are consistent with the characteristics of the dryness coefficient of the Majiagou Formation.

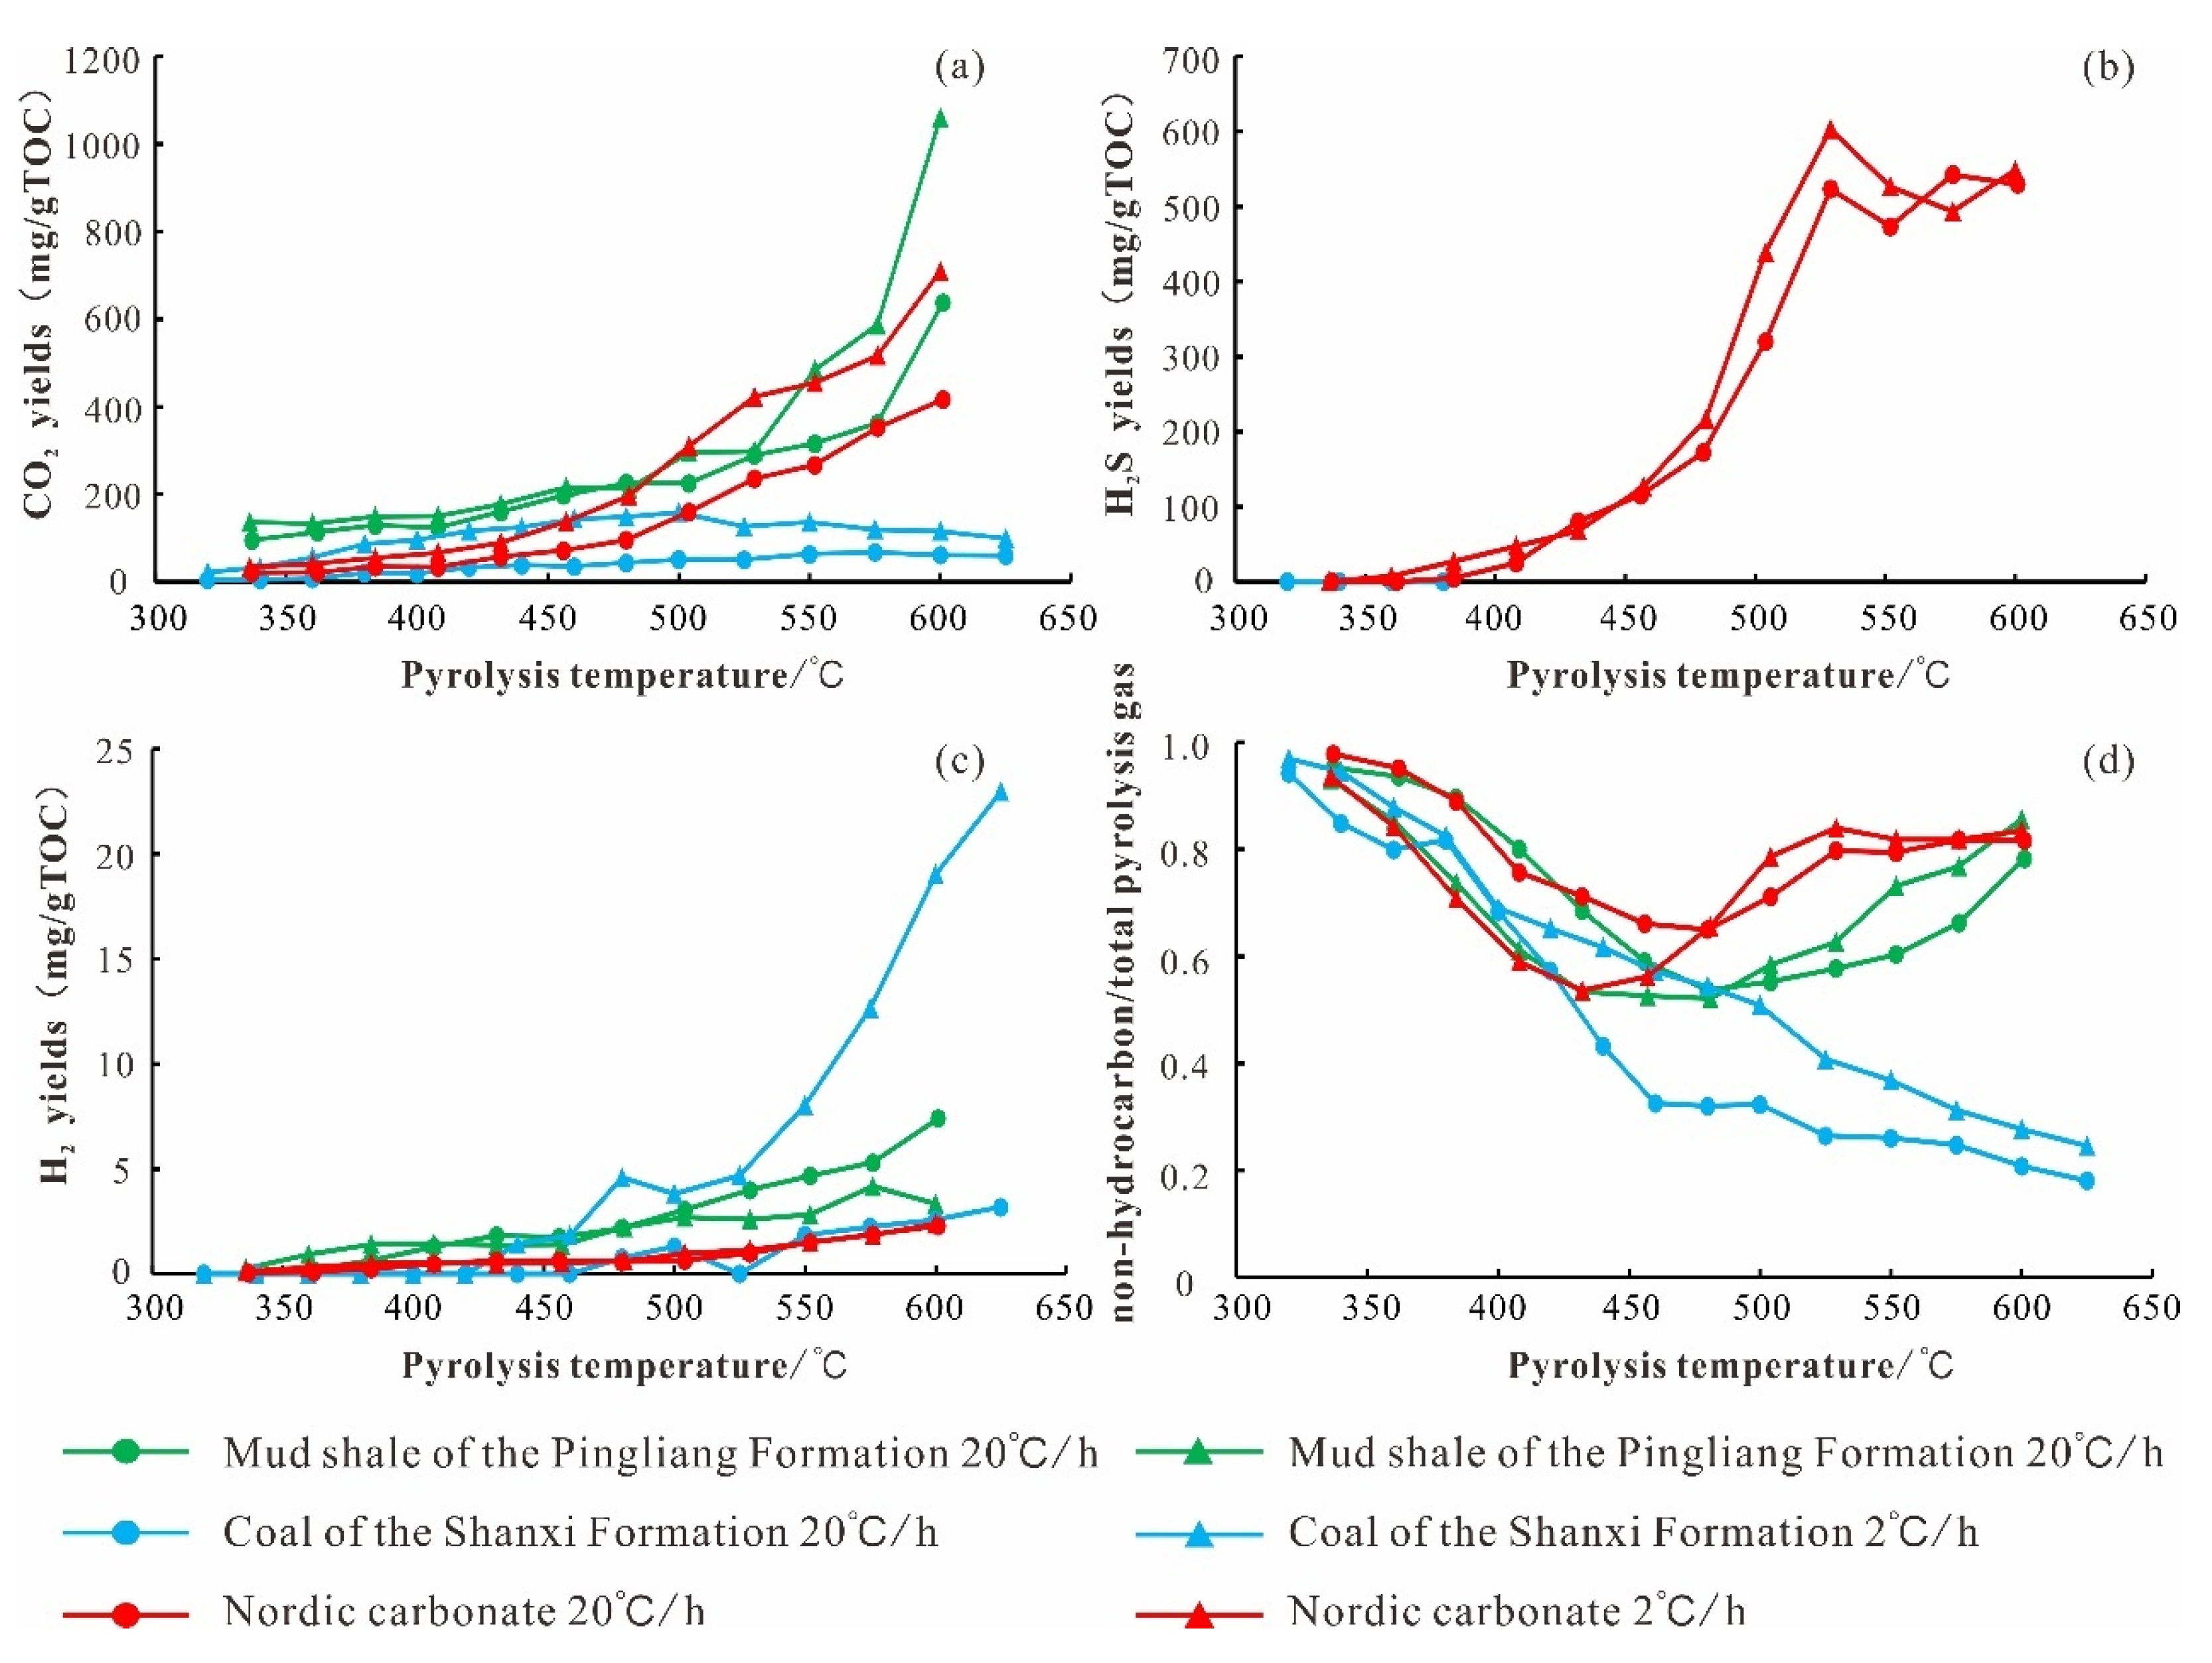
5.1.2. Pyrolysis Nonhydrocarbon Gas Characteristics

The CO2 yield of the Nordic carbonate gradually increased with the temperature during the thermal simulation and continued to increase until 600 °C (Figure 5a). In contrast, the mud shale of the Pingliang Formation had higher CO2 yields at most stages, especially at lower temperatures, and these yields were more than two times higher than those of the Nordic carbonate. At 600 °C, the CO2 yield of the mud shale of the Pingliang Formation was also more than 30% higher than that of the Nordic carbonate. In contrast, the coal of the Shanxi Formation had a relatively low CO2 yield, and its content essentially did not increase after temperatures exceeded 450 °C. Compared to the Nordic carbonate CO2 yield, the CO2 yield of the coal of the Shanxi Formation was slightly higher in the early part of the thermal simulation, but much lower in the later part. The CO2/C1-5 ratio decreased rapidly with increasing temperature, indicating that the rate of hydrocarbon gas production was significantly higher than that of CO2 with increasing temperature. Thus, we suggest that this phenomenon may be related to the lower activation energy of CO2, which allows for rapid CO2 production in the first stage and less production in the later stage, resulting in a decreasing ratio.
The H2S yield of the Nordic carbonate increased with increasing pyrolysis temperature during the thermal simulation, reaching a maximum at 528 °C (easyRo = 3.49%) and gradually decreasing to zero or even negative at higher temperatures (Figure 5b); the mud shale of the Pingliang Formation and the coal of the Shanxi Formation showed almost no H2S production during the thermal simulation, which may be related to the samples lacking sulfur.
There is no H2S production in Pingliang Formation mud shale and Shanxi Formation coal, while there is a large amount of H2S production in Nordic carbonates, and the natural gas of Majiagou Formation in the Ordos Basin, especially most of the subsalt, has H2S production, for example, the H2S production of Long-L92 well [49] is as high as 23.23%. From the results of thermal simulation experiments, the Nordic carbonates can also produce a large amount of H2S, which confirms that the vast majority of the natural gas in the subsalt of the Majiagou Formation contains a higher content of H2S. Therefore, the H2S in the Ordos Basin comes from the carbonates, which are the set of hydrocarbon source rocks, instead of the Pingliang Formation mud shale and the Shanxi Formation coal.
During the thermal simulation of the Nordic carbonate and the mud shale of the Pingliang Formation, the H2 yield increased continuously with increasing pyrolysis temperature, reaching a maximum at the highest temperature of 600 °C. The coal of the Shanxi Formation produced no H2 gas at the low-temperature stage (T < 440 °C), while at the high-temperature stage (T > 525 °C), the H2 yield increased rapidly, reaching 22.94 mg/gTOC at the highest temperature of 600 °C (Figure 5c).
In the early low-temperature stage, the value of nonhydrocarbon/total pyrolysis gas in the Nordic carbonate and mud shale of the Pingliang Formation was close to 1, that is, nonhydrocarbon gas accounted for the vast majority, and the inflection point appeared in the curve with a further increase in temperature. The non-hydrocarbon/total pyrolysis gas curve showed the characteristics of “first falling and then rising”. Of these, changes in CO2 and H2S yields played a major role in the inflection point. At 432 °C (easyRo = 1.69%), for example, the CO2 and H2S yields increased sharply, and the nonhydrocarbon/total pyrolysis gas curve appeared to inflect at the low heating rate of the Nordic carbonate. In contrast, the nonhydrocarbon yield of the coal of the Shanxi Formation did not change significantly with temperature, resulting in a continuous decrease in the nonhydrocarbon/total pyrolysis gas ratio with increasing temperature (Figure 5d).

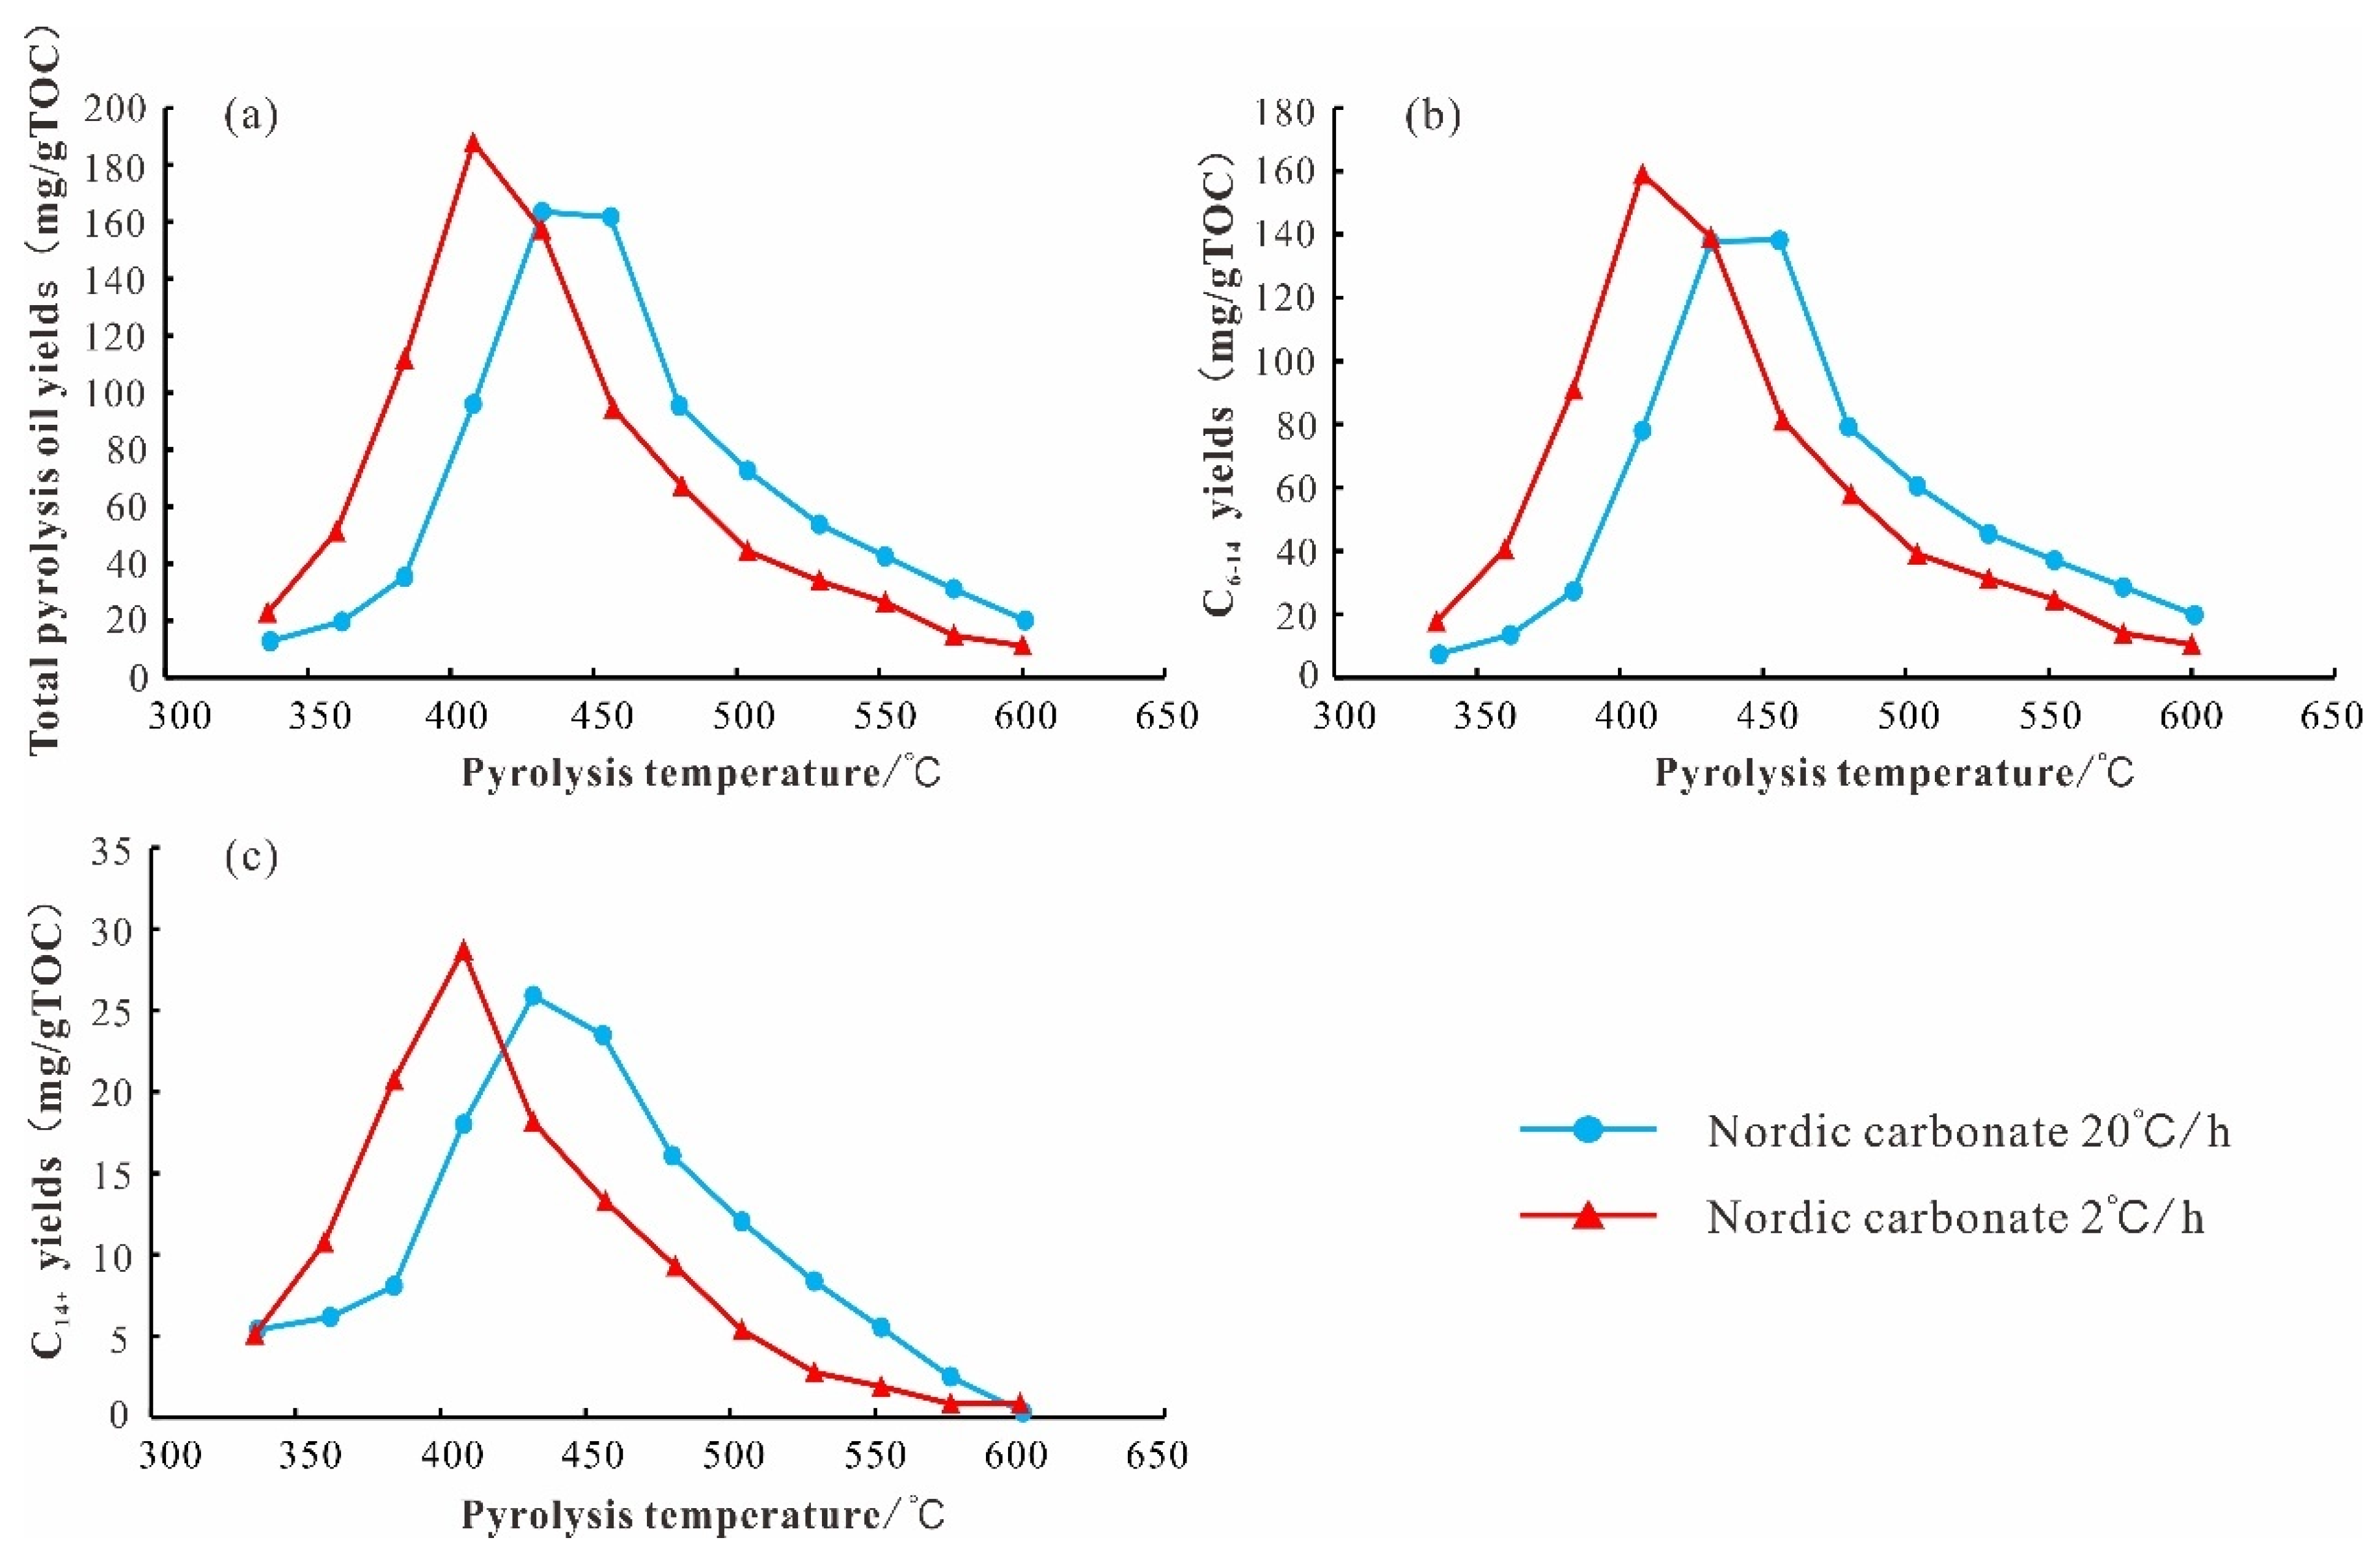
5.2. Liquid Product Evolutionary Characteristics

The characteristics of the liquid hydrocarbon yield with temperature change in the Nordic carbonate during thermal simulation are shown in Figure 6. The oil yield rate showed the parabolic characteristics (first increase and then decrease) under different heating rates, and the oil yield curve change trend of the two heating rates was the same. However, the peak temperature of the oil production rate of the 2 °C/h series was lower than that of the 20 °C/h series, and the difference between the two was approximately 20~50 °C. At 20 °C/h, the oil production rate peaked at 163.40 mg/gTOC at 456 °C. At 2 °C/h, the oil production rate peaked at 187.64 mg/gTOC at 408 °C, that is, the oil production rate was higher at a low heating rate. Compared with the 2 °C/h series, the oil production peak of the 20 °C/h series lagged behind (Figure 6), and the easyRo corresponding to the oil production peak was 1.47% and 1.38%, respectively. This was higher than the actual geological conditions, which was determined by the inherent difference between short-term high temperature and long-term low temperature. The oil production rate was higher at the later high heating rate, which fully reflected the mutual compensation relationship between time and temperature in the hydrocarbon production process. Compared to gaseous hydrocarbon yields, liquid hydrocarbon yields reached a maximum at relatively low temperatures, a result that could be attributed to the closed thermal simulation system. In the closed system, organic matter will preferentially crack to form high-carbon-number hydrocarbons, while as the temperature increases to a certain value, the high carbon number in hydrocarbons will also gradually crack to form a low carbon number in hydrocarbons. The yield of liquid hydrocarbons will gradually decrease after peaking, mainly because the rate of hydrocarbon cleavage is greater than the rate of production. In addition, as thermal evolution proceeds, the high carbon number of hydrocarbons will eventually crack into methane [50,51].
In the carbonate sequence, organic acid salts are also an important class of organic matter, and their contribution to hydrocarbon generation should not be overlooked [52]. Calcium stearate is a type of organic acid salt, and Wang et al. [53] conducted hydrocarbon generation thermal simulation experiments with calcium stearate. This showed that calcium stearate generated fewer hydrocarbons at the low-temperature stage and began to generate many hydrocarbons at the high-temperature stage; therefore, the contribution of organic acid salt to hydrocarbon generation is considered mainly at the high-overmature stage. In contrast, carbonates have a relatively higher yield of C6-14 hydrocarbons and a relatively lower hydrocarbon generation temperature than calcium stearate.

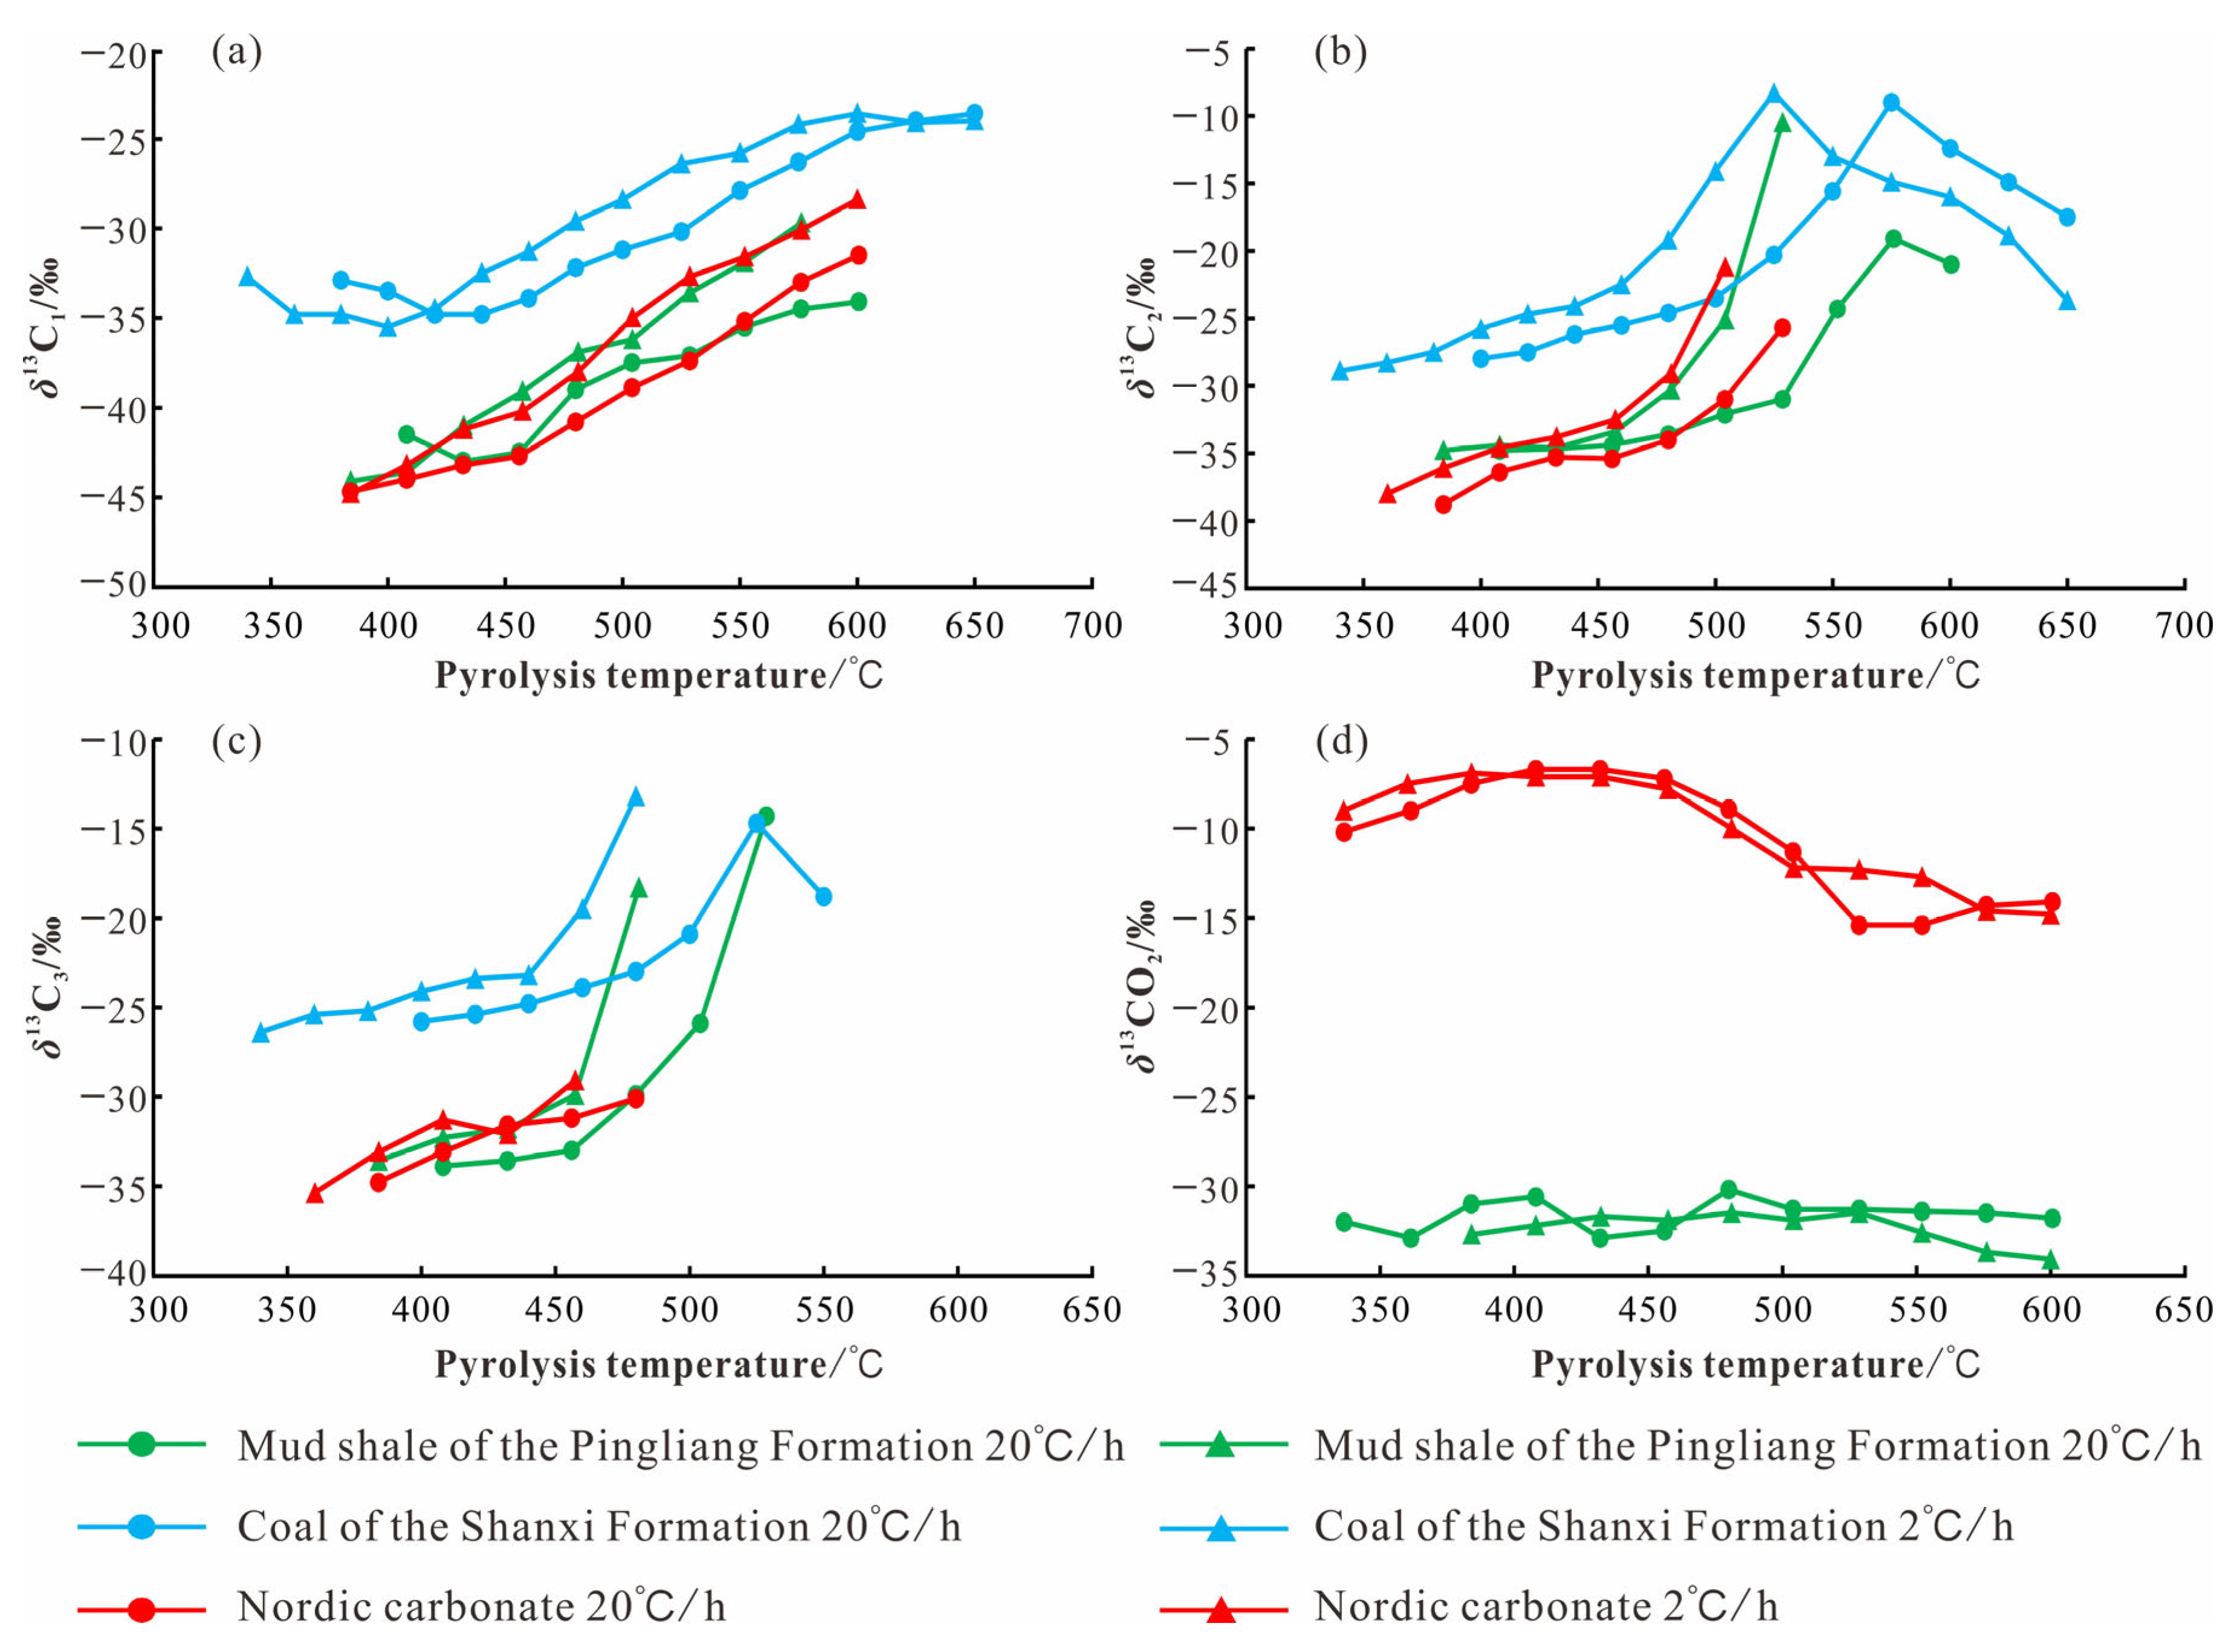
5.3. Carbon Isotope Composition

Carbon isotopic composition is an important parameter for studying the geochemical characteristics of natural gas [54,55,56,57,58]. The experimental results showed that the alkane carbon isotopic compositions of the Nordic carbonate all became progressively heavier with increasing temperature in the thermal simulation experiment, following the kinetic isotope effect. Among them, the methane carbon isotopic composition gradually became heavier from −44.8‰ to −28.4‰, with an overall weight of approximately 16.4‰ (Table 3, Figure 7a). The methane carbon isotope compositions of the Nordic carbonate and the mud shale of the Pingliang Formation had roughly the same distribution range, but differed from the variation pattern in the coal of the Shanxi Formation, which showed an overall lighter and then heavier methane carbon isotope composition. This phenomenon may be due to the nonhomogeneity of the organic matter or the isotopic fractionation effect resulting from changes in the activation energy difference between the early 12C-rich CH4 and 13C-rich CH4 [40] (Figure 7a).
Methane carbon isotopes are mainly affected by the degree of thermal evolution, and the higher the degree of thermal evolution, the heavier the methane carbon isotopes. The lighter methane carbon isotope composition of natural gas in most parts of the subsalt of the Ordos Basin (Shuang-97 well and Mitan-1 well) [39] is consistent with the methane carbon isotope compositions produced by the thermal simulation experiments.
The ethane carbon isotopic composition gradually increased from −38.0‰ to −21.2‰ (2 °C/h series) with increasing temperature (Figure 7b). The ethane carbon isotopic compositions of the mud shale of the Pingliang Formation were distributed over roughly the same range. At high-temperature stages, the ethane carbon isotopes were heavier than −28‰. It is generally accepted that δ13C2 values are strongly inherited from the original parent material, and that humic kerogen is more enriched in 13C than humic mud kerogen, so scholars in China often use δ13C2 values of −28‰ or −29‰ as the boundary between oil- and coal-based gas [54,59], and they play an important role in hydrocarbon genesis discrimination. However, the ethane carbon isotope compositions of the Nordic carbonate and the mud shale of the Pingliang Formation were heavier than −28‰ at high temperatures, and this feature also appears in the thermal simulations of the Luquan marine carbonate source rocks in Yunnan [17], that is, the ethane carbon isotope compositions at high temperatures appeared to be “coal-type gas”. This suggested that the ethane carbon isotope composition of oil-type gas may also be heavier than −28‰ under some special circumstances. The ethane carbon isotope compositions of the coal of the Shanxi Formation were all heavier than −28‰, and the ethane carbon isotope compositions gradually became lighter with increasing temperature in the high-temperature section, resulting in a partial inversion of the carbon isotope sequence.
Ethane carbon isotopes, although also affected by the degree of thermal evolution, are most affected by the type of parent material [45]. Oil-type gas (gas generated by sapropel organic matter) is lighter, generally lighter than −28‰, and coal-type gas (gas generated by humic organic matter) is generally heavier than −28‰. The hydrocarbon source rock of Mitan-1 well [39] belongs to carbonate rock in the marine phase, and the organic matter type is Ⅱ/Ⅱ1, and the natural gas generated should be oil-type gas. It also belongs to the self-generated and self-storage type of gas reservoir, but the generated natural gas surprisingly has the characteristics of coal-type gas. And, this feature also appeared in our thermal simulation experiments, which can respond to its consistency with the ethane carbon isotope composition characteristics of many natural gases under the salt of Majiagou Formation (Tao-38 well, Tong-75 well, etc.) [49].
The Nordic carbonate followed a similar pattern of change in propane carbon isotopes during thermal modeling to that of methane and ethane, becoming heavier with increasing temperature (Figure 7c) and following kinetic isotope effects. The mud shale of the Pingliang Formation produced a much heavier propane carbon isotopic composition compared to the Nordic carbonate. The coal of the Shanxi Formation follows the same pattern of variation as the Nordic carbonate, but the propane carbon isotopic composition of the coal of the Shanxi Formation was approximately 8–10‰ heavier.
Notably, the carbon isotope composition sequences of methane, ethane, and propane were all in positive order (δ13C1 < δ13C2 < δ13C3) throughout the thermal simulation experiment for the Nordic carbonate, and no partial or complete inversion of the carbon isotope sequences occurred. This suggested that the carbonate rock may not experience carbon isotope sequence inversions during normal thermal evolution, unless they undergo mixing [60] or secondary interactions [46]. In contrast, the inversion of heavy hydrocarbon gas δ13C in the coal of the Shanxi Formation at the high premature stage indicated the complexity of the heavy hydrocarbon gas sources at the high premature stage, with sequential δ13C fractionation effects from different sources, which may also be related to the δ13C fractionation effects from aromatic hydrocarbon demethylation and methyl linkage [40].
The pattern of CO2 carbon isotope changes during thermal modeling was completely different from that of alkane gases, with the CO2 carbon isotope compositions generated by thermal modeling of the Nordic carbonate slowly becoming heavier and then gradually lighter. The CO2 carbon isotopic composition of the mud shale of the Pingliang Formation fluctuated within a certain interval and was of organic origin (Figure 7d). The large difference in CO2 carbon isotope composition between the two was because the Nordic carbonate used in the thermal simulations was the protolithic sample, whereas the inorganic carbon was removed from the mud shale of the Pingliang Formation with dilute hydrochloric acid prior to the thermal simulations.

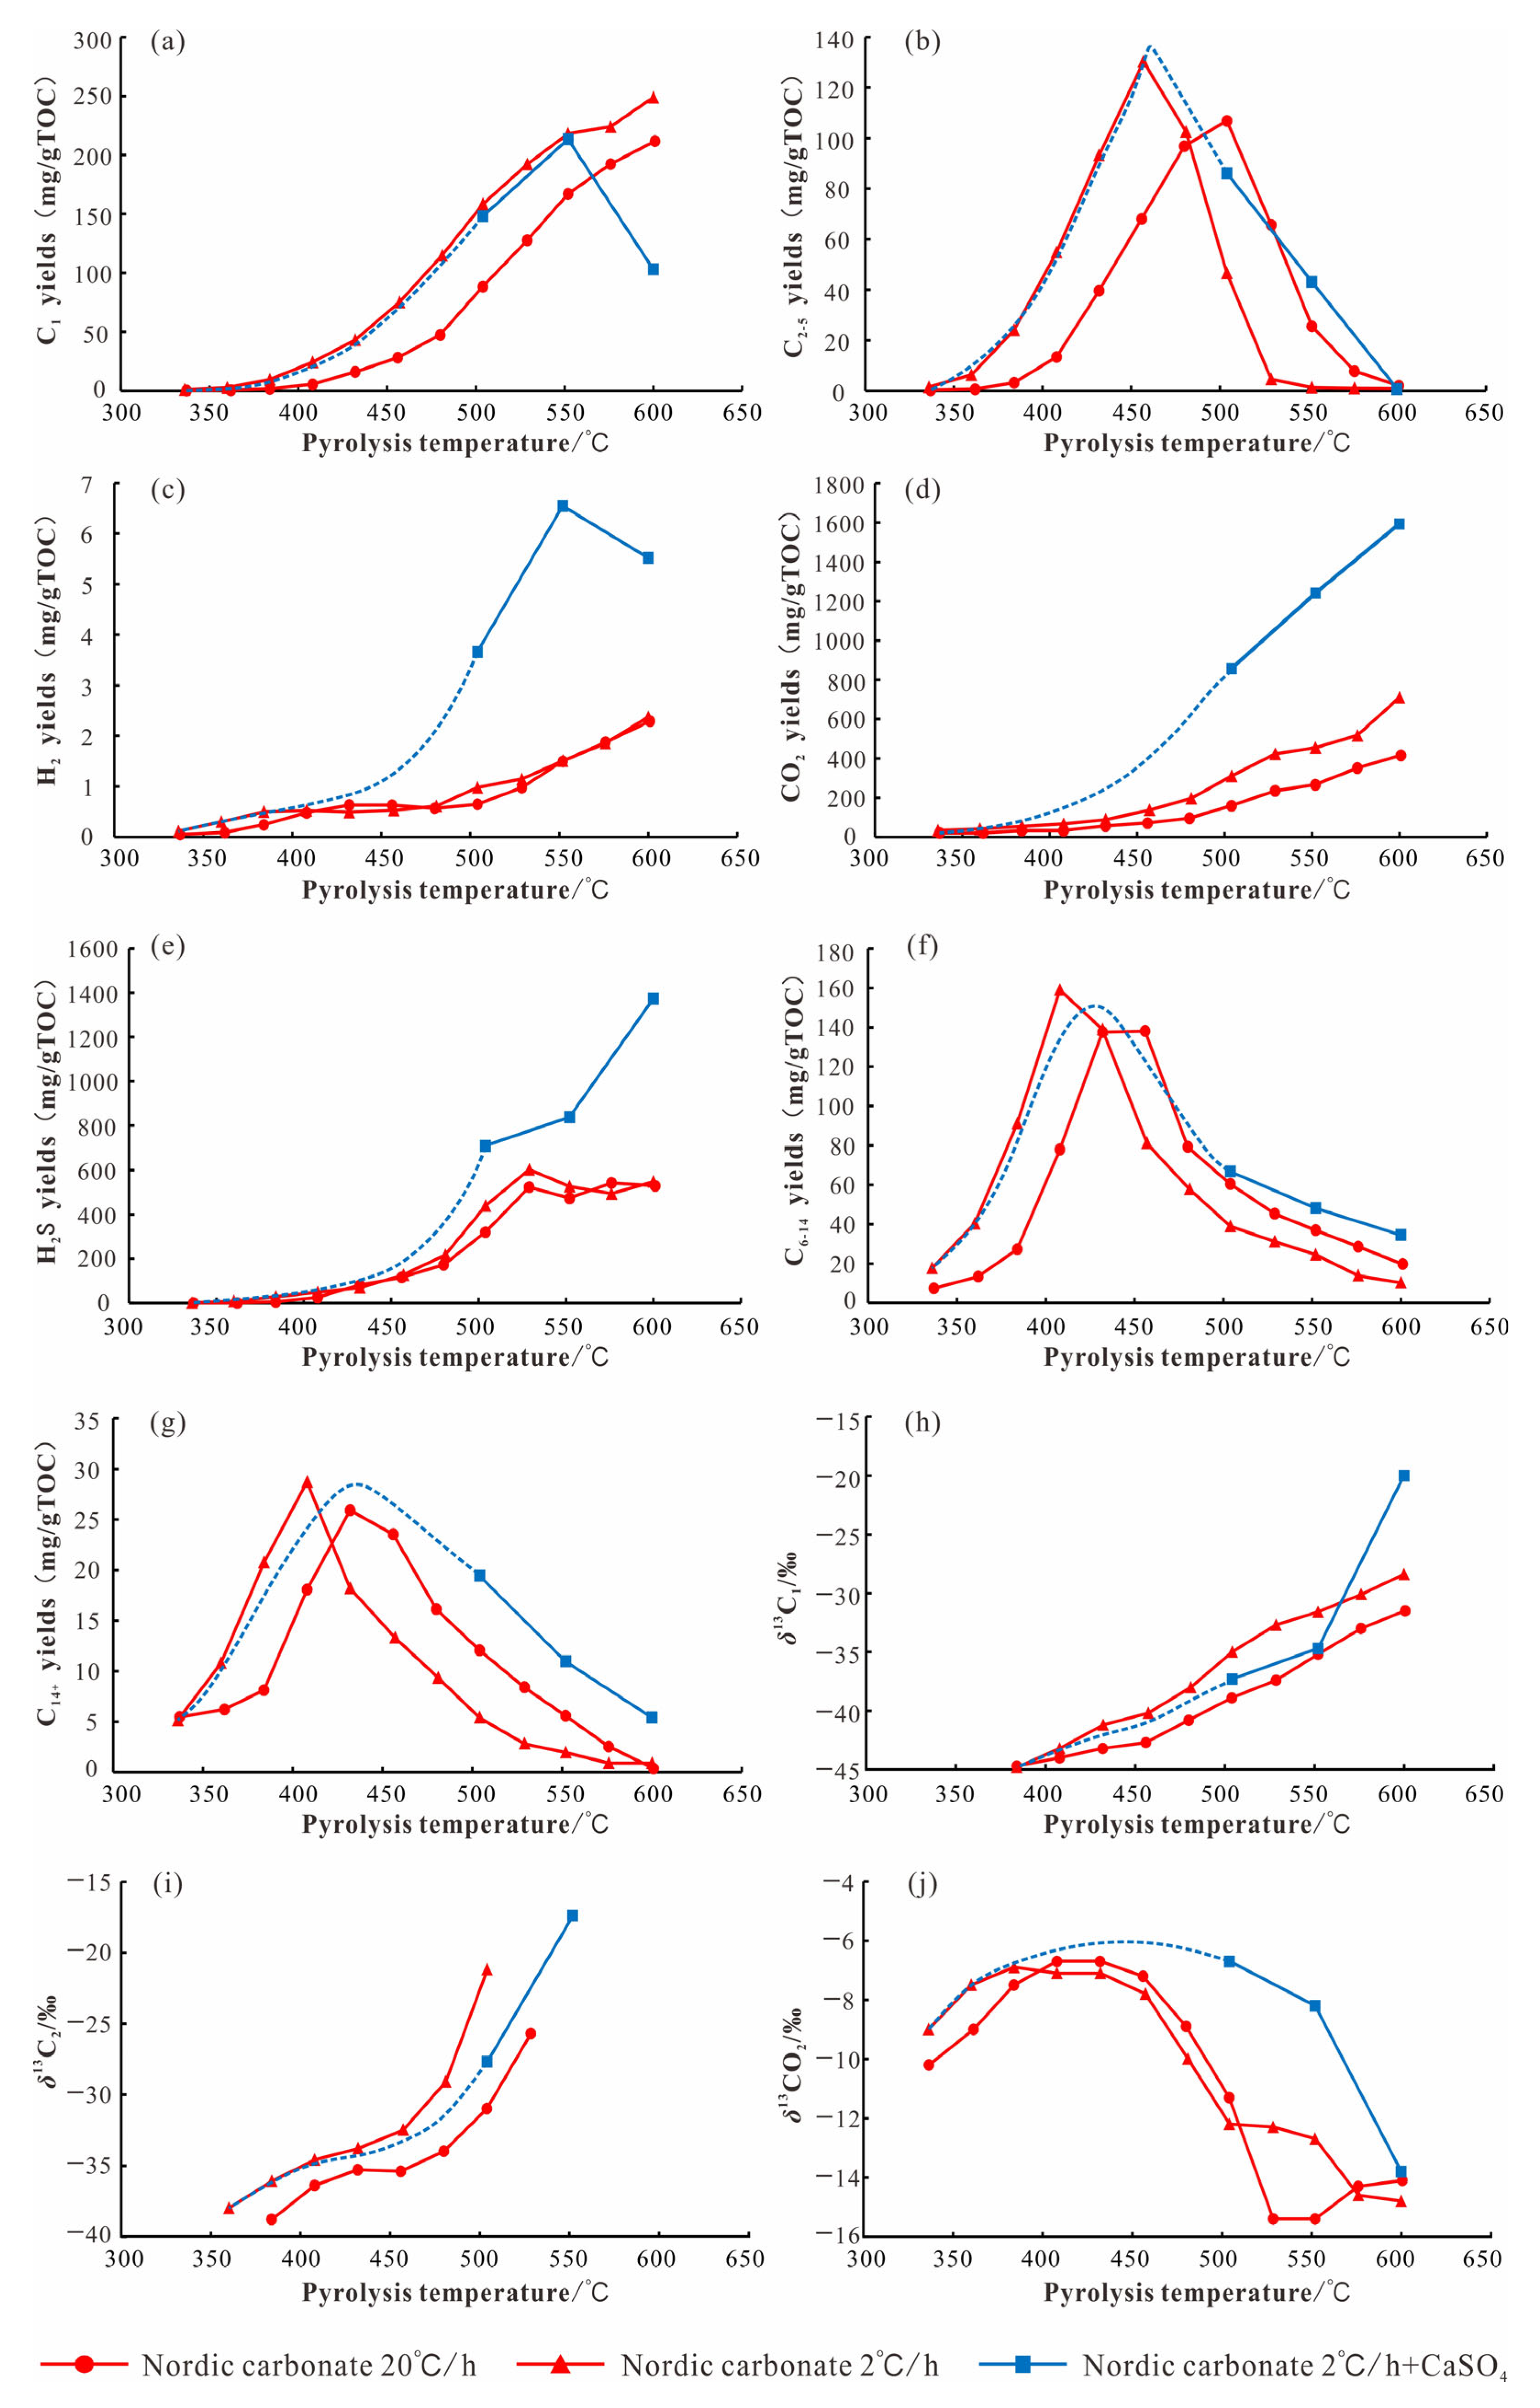
6. Organic–Inorganic Interactions: The Effect of Gypsum Rock Presence on Hydrocarbons

The reaction between sulfate and sedimentary organic matter is a typical type of organic–inorganic interaction within sedimentary basins [61]. In our Ordos Basin study, the gypsum rock sequence in a broad sense refers to a set of sedimentary strata dominated by salt rock and gypsum rock or interlayered with sandstone mudstone. As the main evaporite rock type in our study, gypsum rock is mostly composed of gypsum, anhydrite, and variable water plaster, and contains small amounts of rock salt, salt materials, dolomite, clay organic matter, iron oxides, and other minor components. It has the characteristics of strong plasticity, easy flow, and density [62], and is often symbiotic with carbonate rock sequences in marine basins. The sedimentary environment of marine carbonate rocks is often accompanied by the deposition of gypsum rocks [63], and further studies on the influence of gypsum rocks on organic matter hydrocarbon generation are of positive significance in exploring the hydrocarbon generation mechanism of marine hydrocarbon source rocks. Previous studies have explored whether the salt minerals in gypsum rocks can promote the early hydrocarbon production process of hydrocarbon source rocks. Zhao et al. [64] found that the addition of gypsum (CaSO4) increased hydrocarbon production by 50% from the pyrolysis of kerogen in the marine hydrocarbon source rocks of the Ordovician Pingliang Formation in the Ordos Basin, showing a strong catalytic effect and changing the composition of organic matter pyrolysis hydrocarbons. Numerous studies have demonstrated the catalytic effect of sulfate on the thermal evolution of hydrocarbon source rocks [64,65,66]. To identify the effect of gypsum rock presence on hydrocarbons, CaSO4 was added during the gold tube thermal simulation experiments in this study, and the results are discussed.
The experimental results showed that the Nordic carbonate rock sample with CaSO4 addition had little effect on C1 yield at 500 °C and 550 °C, while at 600 °C, it caused a sharp decrease in C1 yield, indicating that gypsum strongly affects C1 yield at high maturation conditions (Figure 8a). The higher C2-5 yield of the sample with CaSO4 addition at the same temperature suggested that the addition of gypsum may increase the C2-5 content rather than decrease it. However, when the pyrolysis temperature reached 600 °C, the C2-5 yield was almost zero, with or without the addition of CaSO4 (Figure 8b). The addition of CaSO4 significantly increased the yield of H2, CO2, and H2S, and its CO2 yield increased by more than two times at the same temperature. According to the mechanism of the TSR reaction, although the increase in temperature can promote the TSR (refers to the process in which sulphate minerals are reduced by sulphate and hydrocarbons to produce acid gases, such as H2S, which is an important mechanism for the formation of natural gas with high H2S content) reaction when the temperature is too high, it will lead to the decomposition of H2S, and the content of H2S will decrease once the production of the TSR reaction is greater than the decomposition [39]. The TSR reaction increased the hydrogen sulfide yield, as well as the carbon dioxide yield, which confirmed the accuracy of the chemical reaction expression CaSO4 + hydrocarbon → H2S + CaSO3 + hydrocarbon gas + CO2 of TSR (Figure 8c–e). At 504–600 °C, the addition of CaSO4 resulted in higher C6-14 and C14+ hydrocarbon yields, with C6-14 yields increasing by a factor of 1.7–3.4, and C14+ yields increasing by a factor of 3.6–6.0 (Table 3), indicating that the addition of CaSO4 promoted the production of C6-14 and C14+ hydrocarbons at the high-temperature stage, that is, the addition of CaSO4 promoted the high-temperature stage of crude oil production.
Wang et al. [65] conducted experiments using the addition of salts (pure carbonate, sulfate, and chloride salts) to hydrocarbon source rocks. The results showed that carbonate, sulfate, and chloride salts increased the yield of hydrocarbon pyrolysis of gaseous hydrocarbons from hydrocarbon source rocks with increasing temperature, showing a strong catalytic effect. In particular, the higher the experimental temperature is, the stronger the catalytic effect of the three salts. The catalytic effect of the salts not only enables the salt-lake hydrocarbon source rocks to generate natural gas in large quantities under shallow burial conditions, but also changes the composition of gaseous hydrocarbon products and accelerates the thermal evolution of organic matter. This is consistent with our results.
When CaSO4 was added to the Nordic carbonate sample, the methane carbon isotopic composition became approximately 2–3‰ lighter (504–552 °C) or approximately 8‰ heavier (600 °C), suggesting that the methane may have been oxidized by sulfate at this time (Figure 8h); at 504 °C, the ethane carbon isotopic composition became approximately 6.5‰ lighter, suggesting that the addition of CaSO4 may have facilitated ethane production. When introducing the yield of heavy hydrocarbon gases such as ethane, it was also found that the addition of CaSO4 increased the content of heavy hydrocarbon gases such as ethane and reduced the drying coefficient of the gas, and the δ13C1 value was still less than the δ13C2 value after the addition of CaSO4, indicating that it did not lead to carbon isotope inversion (Figure 8i, Table 3). Its propane carbon isotopic composition could not be measured because the amount of propane in the resulting gas was too small; its CO2 carbon isotopic composition was heavier by approximately 5‰ at 504 °C and 552 °C, and by approximately 1‰ at 600 °C (Figure 8j), suggesting that the addition of CaSO4 led to the presence of carbon isotopic fractionation between CO2 of organic origin and carbonate rock of inorganic origin, thus leading to a heavier CO2 carbon isotope or facilitating the decomposition of carbonate minerals. Although the CO2 carbon isotopes in some highly sulfur-containing natural gases were heavy (approximately 0‰), this did not mean that this CO2 was not produced due to TSR, as this was the result of TSR-induced CO2 fractionation with carbon isotopes in reservoir carbonate rocks.

7. Conclusions

The results of the thermal simulation experiments comparing Nordic Cambrian carbonate with mud shale of the Pingliang Formation and coal of the Shanxi Formation showed that the Nordic carbonate and the mud shale of the Pingliang Formation have different hydrocarbon production characteristics, and although the difference in hydrocarbon production rates between the two was not significant, the carbonate continues to produce methane at 600 °C. The difference in hydrocarbon gas production rates between the Nordic carbonate and the coal of the Shanxi Formation was large. The hydrocarbon gas production rate of the Nordic carbonate was approximately equivalent to that of type II2 kerogen, indicating that the hydrocarbon production rate is not related to lithology and only to the type of organic matter, but the Nordic carbonate can produce much H2S.
The alkane carbon isotope changes are mainly controlled by the degree of thermal evolution, showing gradual heaviness with increasing temperature. No carbon isotope sequence reversal occurred during the thermal simulation, indicating that the Nordic carbonate may not experience carbon isotope sequence reversal during normal thermal evolution, unless it undergoes mixing or secondary interactions, and its distribution ranges are roughly the same as those of the alkane carbon isotope compositions of the mud shale of the Pingliang Formation. The ethane carbon isotopic composition was as heavy as −21.2‰ in the high-temperature stage, showing similar characteristics to coal-type gas. The large difference in CO2 isotopic composition between the Nordic Cambrian carbonate and mud shale of the Pingliang Formation was because all CO2 generated from the mud shale of the Pingliang Formation is derived from the decomposition of organic matter, whereas part of the CO2 generated from the Nordic carbonate is derived from the decomposition of inorganic minerals, and the carbon isotopic composition of inorganic minerals differs significantly from that of organic matter.
H2S is also produced from natural gas at the subsalt of the Majiagou Formation in the Ordos Basin. Therefore, we suggest that the H2S in the Ordos Basin is derived from the carbonate rocks, the set of hydrocarbon source rocks, rather than from the Pingliang Formation mud shale and the Shanxi Formation coal. In addition, many natural gas ethane carbon isotopes under the salt of the Majiagou Formation are also characteristic of coal-type gas, which is consistent with the results of our thermal modeling experiments.
The addition of calcium sulfate did not significantly affect the compositional characteristics of the Nordic carbonate pyrolysis products, but caused the TSR reaction to occur, which significantly affects C1 yields at the high-maturation stage, reducing their content by more than 50% at 600 °C. However, the addition of CaSO4 increased C2 yields and promoted the production of C6-14 hydrocarbons and C14+ hydrocarbons at the high-temperature stage and substantially increased H2, CO2, and H2S yields. The addition of CaSO4 also caused δ13C1 values to remain smaller than δ13C2 values, suggesting no carbon isotope inversion, and the heavier CO2 carbon isotopic composition suggested that the addition of CaSO4 causes carbon isotope fractionation between CO2 of organic origin and carbonate rock of inorganic origin, or promotes the decomposition of carbonate minerals.

Author Contributions

Conceptualization, Y.X. and J.H.; methodology, Q.W.; software, Q.M.; validation, J.S., H.Z. and Q.W.; formal analysis, Y.W.; investigation, J.S.; resources, J.H.; data curation, H.Z.; writing—original draft preparation, Y.W.; writing—review and editing, Q.M.; visualization, H.Z.; supervision, Y.X.; project administration, J.S.; funding acquisition, J.H. All authors have read and agreed to the published version of the manuscript.

Funding

This research was funded by [National Natural Science Foundation of China (NSFC)] grant number [41903013], [National Natural Science Foundation of China (NSFC)] grant number [42102180], [Natural Science Foundation of Jiangsu Province] grant number [BK20200171], [PetroChina Exploration and Production Branch Science and Technology Program] grant number [kt2021-04-01], and [PetroChina Exploration and Production Branch Science and Technology Program] grant number [2022KT0103].

Institutional Review Board Statement

Not applicable.

Informed Consent Statement

Informed consent was obtained from all subjects involved in the study.

Data Availability Statement

Data supporting the results can be found in the manuscript text, tables, and figures.

Conflicts of Interest

The authors declare no conflict of interest.

References

  1. Liu, H.; Tan, X.; Li, Y.; Cao, J.; Luo, B. Occurrence and conceptual sedimentary model of Cambrian gypsum-bearing evaporites in the Sichuan Basin, SW China. Geosci. Front. 2018, 9, 1179–1191. [Google Scholar] [CrossRef]
  2. Radwan, A.E.; Husinec, A.; Benjumea, B.; Kassem, A.A.; Aal, A.A.; Hakimi, M.H.; Thanh, H.V.; Abdel-Fattah, M.I.; Shehata, A.A. Diagenetic overprint on porosity and permeability of a combined conventional-unconventional reservoir: Insights from the Eocene pelagic limestones, Gulf of Suez, Egypt. Mar. Pet. Geol. 2022, 146, 105967. [Google Scholar] [CrossRef]
  3. Jones, R.W. Comparison of carbonate and shale source rocks. In Petroleum Geochemistry and Source Rock Potential of Carbonate Rocks; Palacas, J.G., Ed.; American Association of Petroleum Geologists: Tulsa, OK, USA, 1984; Volume 18, pp. 163–180. [Google Scholar]
  4. Palacas, J.G.; Anders, D.E.; King, J.D. South Florida Basin—A prime example of carbonate source rocks of petroleum. In Petroleum Geochemistry and Source Rock Potential of Carbonate Rocks; Palacas, J.G., Ed.; American Association of Petroleum Geologists: Tulsa, OK, USA, 1984; Volume 18, pp. 71–96. [Google Scholar]
  5. Katz, B.J.; Dittmar, E.I.; Ehret, G.E. A geochemical review of carbonate source rocks in Italy. J. Pet. Geol. 2000, 23, 399–424. [Google Scholar] [CrossRef]
  6. Guo, Y.; Fu, J.; Wei, X.; Xu, W.; Sun, L.; Liu, J.; Zhao, Y.; Gao, J.; Zhang, Y. Natural gas accumulation and models in Ordovician carbonates, Ordos Basin, China. Pet. Explor. Dev. 2014, 41, 393–403. [Google Scholar] [CrossRef]
  7. Meng, M.; Ge, H.; Shen, Y.; Ji, W.; Wang, Q. Rock fabric of tight sandstone and its influence on irreducible water saturation in Eastern Ordos Basin. Energy Fuels 2023, 37, 3685–3696. [Google Scholar] [CrossRef]
  8. Huang, D.; Xiong, C.; Yang, J.; Xu, Z.; Wang, K. Gas source discrimination and natural gas genetic types of central gas field in Ordos Basin. Nat. Gas Ind. 1996, 16, 95. [Google Scholar]
  9. Yang, H.; Liu, X.; Zhang, D. Main controlling factors of gas pooling in Ordovician marine carbonate reservoirs in the Ordos Basin and advances in gas exploration. Nat. Gas Ind. 2013, 33, 1–12. [Google Scholar]
  10. Wang, J.; Jia, H.; Sun, X.; Tao, C.; Zhang, Y.; Ma, L.; Wang, F.; Jiang, H. Comprehensive evaluation on origin and source of natural gas in the Paleozoic in Fuxian Area, Ordos Basin. Nat. Gas Geosci. 2022, 33, 1476–1484. [Google Scholar]
  11. Dai, J.; Li, J.; Luo, X.; Zhang, W.; Hu, G.; Ma, C.; Guo, J.; Ge, S. Stable carbon isotope compositions and source rock geochemistry of the giant gas accumulations in the Ordos Basin, China. Org. Geochem. 2005, 36, 1617–1635. [Google Scholar] [CrossRef]
  12. Liang, D.; Guo, T.; Chen, J.; Bian, L.; Zhao, J. Some progresses on studies of hydrocarbon generation and accumulation in marine sedimentary regions, Southern China (Part 1): Distribution of four suits of regional marine source rocks. Mar. Orig. Pet. Geol. 2008, 13, 1–16. [Google Scholar] [CrossRef]
  13. Li, J.; Li, J.; Li, Z.; Zhang, C.; Cui, H.; Zhu, Z. Characteristics and genetic types of the Lower Paleozoic natural gas, Ordos Basin. Mar. Pet. Geol. 2018, 89, 106–119. [Google Scholar] [CrossRef]
  14. Meng, M.; Ge, H.; Shen, Y.; Ji, W.; Li, Z. Insight into water occurrence and pore size distribution by nuclear magnetic resonance in marine shale reservoirs, southern China. Energy Fuels 2023, 37, 319–327. [Google Scholar] [CrossRef]
  15. Ding, W.; Li, C.; Su, A.; He, Z. Study on the comprehensive geochemical cross section of Mesozoic marine source rocks and prediction of favorable hydrocarbon generation area in Qiangtan basin, Tibeta. Acta Petrol. Sin. 2011, 27, 878–896. [Google Scholar]
  16. Xie, L.; Sun, Y.; Yang, Z.; Chen, J.; Jang, A.; Zhang, Y.; Deng, C. Evaluation of Hydrocarbon Generation of the Xiamaling Formation Shale in Zhangjiakou and Its Significance to the Petroleum Geology in North China. Sci. China Ser. D Earth Sci. 2013, 43, 1436–1444. [Google Scholar] [CrossRef]
  17. Chen, L.; Zheng, L.; Huang, H.; Ning, C. Carbon isotopic evolution of hydrocarbon gases generated from carbonate source rocks via thermal simulation methods. Pet. Geol. Exp. 2022, 44, 121–128. [Google Scholar] [CrossRef]
  18. Wang, Q. The Ordovician Source Rocks Generate Gaseous Hydrocarbon Thermal Simulation Experiment Research; University of Chinese Academy of Sciences: Beijing, China, 2014. [Google Scholar]
  19. Moldowan, J.M.; Seifert, W.K.; Gallegos, E.J. Relationship between petroleum composition and depositional environment of petroleum source rocks. AAPG Bull. 1985, 69, 1255–1268. [Google Scholar]
  20. Peters, K.E.; Moldowan, J.M.; Schoell, M.; Hempkins, W.B. Petroleum isotopic and biomarker composition related to source rock organic matter and depositional environment. Org. Geochem. 1986, 10, 17–27. [Google Scholar] [CrossRef]
  21. Peters, K.E.; Walters, C.C.; Moldowan, J.M. The Biomarker Guide; Cambridge University Press: Cambridge, UK, 2005. [Google Scholar]
  22. Burton, Z.F.M.; Moldowan, J.M.; Sykes, R.; Graham, S.A. Unraveling petroleum degradation, maturity, and mixing and addressing impact on petroleum prospectivity: Insights from frontier exploration regions in New Zealand. Energy Fuels 2018, 32, 1287–1296. [Google Scholar] [CrossRef]
  23. Burton, Z.F.M.; Moldowan, J.M.; Magoon, L.B.; Sykes, R.; Graham, S.A. Interpretation of source rock depositional environment and age from seep oil, east coast of New Zealand. Int. J. Earth Sci. 2019, 108, 1093. [Google Scholar] [CrossRef]
  24. Schulz, H.M.; Yang, S.; Schovsbo, N.H.; Rybacki, E.; Ghanizadeh, A.; Bernard, S.; Mahlstedt, N.; Krüger, M.; Amann-Hildebrandt, A.; Krooss, B.M.; et al. The Furongian to Lower Ordovician Alum Shale Formation in conventional and unconventional petroleum systems in the Baltic Basin–A review. Earth-Sci. Rev. 2021, 218, 103674. [Google Scholar] [CrossRef]
  25. Sanei, H.; Petersen, H.; Schovsbo, N.; Jiang, C.; Goodsite, M. Petrographic and geochemical composition of kerogen in the Furongian (U. Cambrian) Alum Shale, central Sweden: Reflections on the petroleum generation potential. Int. J. Coal Geol. 2014, 132, 158–169. [Google Scholar] [CrossRef]
  26. Meng, M.; Peng, J.; Ge, H.; Ji, W.; Li, X.; Wang, Q. Rock fabric of lacustrine shale and its influence on residual oil distribution in the Upper Cretaceous Qingshankou Formation, Songliao Basin. Energy Fuels 2023, 37, 7151–7160. [Google Scholar] [CrossRef]
  27. Liu, W.; Wang, X.; Zhang, D.; Cai, Z.; Luo, H.; Chen, X.; Wang, T.; Li, F.; Zhang, W.; Li, F. Restudy on geochemical characteristics and genesis of Jingbian Gas Field in Ordos Basin. J. Northwest Univ. Nat. Sci. Ed. 2002, 52, 943–956. [Google Scholar] [CrossRef]
  28. Yang, H.; Zhang, W.; Zan, C.; Ma, J. Geochemical characteristics of Ordovician subsalt gas reservoir and their significance for reunderstanding the gas source of Jingbian Gasfield, East Ordos Basin. Nat. Gas Geosci. 2009, 20, 8–14. [Google Scholar]
  29. Liu, D.; Zhang, W.; Kong, Q.; Feng, Z.; Fang, S.; Peng, W. Lower Paleozoic source rocks and natural gas origins in Ordos Basin, NW China. Pet. Explor. Dev. 2016, 43, 540–549. [Google Scholar] [CrossRef]
  30. Fu, J.; Yu, Z.; Li, C.; Wang, W.; Huang, Z.; Wu, X.; Wang, S. New discovery and favorable areas of natural gas exploration in the 4th Member of Ordovician Majiagou Formation by Well Mitan 1 in the eastern Ordos Basin. Nat. Gas Ind. 2021, 41, 17–27. [Google Scholar] [CrossRef]
  31. Schenk, H.; Dieckmann, V. Prediction of petroleum formation: The influence of laboratory heating rates on kinetic parameters and geological extrapolations. Mar. Pet. Geol. 2004, 21, 79–95. [Google Scholar] [CrossRef]
  32. Zhang, S.; Mi, J.; He, K. Synthesis of hydrocarbon gases from four different carbon sources and hydrogen gas using a gold-tube system by Fischer-Tropsch method. Chem. Geol. 2013, 349–350, 27–35. [Google Scholar] [CrossRef]
  33. He, K.; Zhang, S.; Mi, J.; Zhang, W. Pyrolysis involving n-hexadecane, water and minerals: Insight into the mechanisms and isotope fractionation for water-hydrocarbon reaction. J. Anal. Appl. Pyrolysis 2018, 130, 198–208. [Google Scholar] [CrossRef]
  34. Sweeney, J.; Burnham, A. Evaluation of a Simple Model of Vitrinite Reflectance Based on Chemical Kinetics. AAPG Bull. 1990, 74, 1559–1570. [Google Scholar]
  35. Li, E.; Pan, C.; Yu, S.; Jin, X.; Liu, J. Hydrocarbon generation from coal, extracted coal and bitumen rich coal in confined pyrolysis experiments. Org. Geochem. 2013, 64, 58–75. [Google Scholar] [CrossRef]
  36. Burnham, A.K. Kinetic models of vitrinite, kerogen, and bitumen reflectance. Org. Geochem. 2019, 131, 50–59. [Google Scholar] [CrossRef]
  37. Gao, D.; Guo, C.; Jiang, C.; Zhang, L.; Wang, H.; Shi, P.; Chen, Y. Hydrocarbon generation simulation of low-maturity shale in Shanxi Formation, Ordos Basin. Pet. Geol. Exp. 2018, 40, 454–460. [Google Scholar] [CrossRef]
  38. Xu, Y. Genetic Theory of Natural Gases and Its Application; Science Press: Beijing, China, 1994. [Google Scholar]
  39. Wang, Q.; Lu, H.; Greenwood, P.; Shen, C.; Liu, J.; Peng, P. Gas evolution during kerogen pyrolysis of Estonian Kukersite shale in confined gold tube system. Org. Geochem. 2013, 65, 74–82. [Google Scholar] [CrossRef]
  40. Peng, W.; Liu, Q.; Hu, G.; Lv, Y.; Zhu, D.; Meng, Q.; Guo, F.; Wang, R. Mechanisms of carbon isotope fractionation in the process of natural gas generation: Geochemical evidence from thermal simulation experiment. Pet. Explor. Dev. 2020, 47, 972–983. [Google Scholar] [CrossRef]
  41. You, K.; Flemings, P.B.; Malinverno, A.; Collett, T.S.; Darnell, K. Mechanisms of methane hydrate formation in geological systems. Rev. Geophys. 2019, 57, 1146–1196. [Google Scholar] [CrossRef]
  42. Burton, Z.F.M.; Dafov, L.N. Testing the sediment organic contents required for biogenic gas hydrate formation: Insights from synthetic 3-D basin and hydrocarbon system modelling. Fuels 2022, 3, 555–562. [Google Scholar] [CrossRef]
  43. Burton, Z.F.M.; Dafov, L.N. Salt Diapir-Driven Recycling of Gas Hydrate. Geochem. Geophys. Geosystems 2023, 24, e2022GC010704. [Google Scholar] [CrossRef]
  44. Wang, X.; Li, X.; Wang, X.; Shi, B.; Luo, X.; Zhang, L.; Lei, Y.; Jiang, C.; Meng, Q. Carbon isotopic fractionation by desorption of shale gases. Mar. Pet. Geol. 2015, 60, 79–86. [Google Scholar] [CrossRef]
  45. Meng, Q.; Wang, X.; Shi, B.; Lei, Y.; Zhao, H.; Zhao, Q.; Yin, J.; Gao, C. The 13C-depleted methane in terrigenous shale gas: A case study in the Triassic Yanchang Formation, Ordos Basin. Mar. Pet. Geol. 2022, 141, 105688. [Google Scholar] [CrossRef]
  46. Meng, Q.; Wang, X.; Wang, X.; Shi, B.; Luo, X.; Zhang, L.; Lei, Y.; Jiang, C.; Liu, P. Gas geochemical evidences for biodegradation of shale gases in the Upper Triassic Yanchang Formation, Ordos Basin, China. Int. J. Coal Geol. 2017, 179, 139–152. [Google Scholar] [CrossRef]
  47. Tian, H.; Xiao, X.; Yang, L.; Xiao, Z.; Guo, L.; Shen, J.; Lu, Y. Pyrolysis of oil at high temperatures: Gas potentials, chemical and carbon isotopic signatures. Chin. Sci. Bull. 2009, 54, 1217–1224. [Google Scholar] [CrossRef]
  48. Meng, Q.; Shi, J.; Zhao, H.; Huang, J.; Liu, Y.; Wang, Y.; Xie, X.; Xu, Y. Genesis and source of natural gas in Well Mitan-1 of Ordovician Majiagou Formation, mid-eastern Ordos Basin, China. Nat. Gas Geosci. 2023, 1–26. [Google Scholar]
  49. Kong, Q.; Zhang, W.; Li, J.; Zan, C.L. Geochemical characteristics and genesis of Ordovician natural gas under gypsolyte in Ordos Basin. Nat. Gas Geosci. 2019, 30, 423–432. [Google Scholar] [CrossRef]
  50. Xia, X.; Geoffrey, S.; Ma, Q.; Tang, Y. Compositional and stable carbon isotopic fractionation during non-autocatalytic thermochemical sulfate reduction by gaseous hydrocarbons. Geochim. Cosmochim. Acta 2014, 139, 472–486. [Google Scholar] [CrossRef]
  51. Wei, Z.; Zou, Y.; Cai, Y.; Wang, L.; Luo, X.; Peng, P. Kinetics of oil group-type generation and expulsion: An integrated application to Dongying Depression. Bohai Bay Basin. China Org. Geochem. 2012, 52, 1–12. [Google Scholar] [CrossRef]
  52. Liu, W.; Teng, G.; Wang, X.; Li, M.; Hu, G.; Wang, J.; Lu, L.; Zhao, H.; Chen, Q.; Luo, H. New knowledge of hydrocarbon generating theory of organic matter in Chinese marine carbonates. Pet. Explor. Dev. 2017, 44, 155–164. [Google Scholar] [CrossRef]
  53. Wang, Q.; Liu, W.; Pei, L.; Cai, Z.; Luo, H.; Wang, X.; Zhang, D.; Liu, J. Hydrocarbon generation from calcium stearate: Insights from closed-system pyrolysis. Mar. Pet. Geol. 2021, 126, 104923. [Google Scholar] [CrossRef]
  54. Liu, Q.; Wu, X.; Wang, X.; Jin, Z.; Zhu, D.; Meng, Q.; Huang, S.; Liu, J.; Fu, Q. Carbon and hydrogen isotopes of methane, ethane, and propane: A review of genetic identification of natural gas. Earth-Sci. Rev. 2019, 190, 247–272. [Google Scholar] [CrossRef]
  55. Schoell, M. The hydrogen and carbon isotopic composition of methane from natural gases of various origins. Geochim. Cosmochim. Acta 1980, 44, 649–661. [Google Scholar] [CrossRef]
  56. Schoell, M. Genetic characterization of natural gases. AAPG Bull. 1983, 67, 2225–2238. [Google Scholar]
  57. James, A.T. Correlation of natural gas by use of carbon isotopic distribution between hydrocarbon components. AAPG Bull. 1983, 67, 1176–1191. [Google Scholar]
  58. Clayton, C. Carbon isotope fractionation during natural gas generation from kerogen. Mar. Pet. Geol. 1991, 8, 232–240. [Google Scholar] [CrossRef]
  59. Dai, J. Hydrocarbon isotopic characteristics of natural gas and identification of various natural gases. Nat. Gas Geosci. 1993, 4, 1–40. [Google Scholar]
  60. Guo, H.; Liu, M.; Wang, Y.; Wang, Q.; Liu, J.; Peng, P. The effect of thermochemical sulfate reduction of n-pentane and condensate on the chemical and isotopic compositions of gases: Implications for the organic reactant and reaction extent. Mar. Pet. Geol. 2022, 145, 105916. [Google Scholar] [CrossRef]
  61. Wu, J.; Wang, Y.; Qi, W.; Shi, S.; Jiang, F.; Zhang, C. Influence of Gypsum on the Distribution of Aromatic Molecules During Catagenesis and Its Geochemical Significance. J. Sediment. 2023, 1–13. [Google Scholar] [CrossRef]
  62. Zhu, X. Sedimentary Petrography; Petroleum Industry Press: Beijing, China, 2008; pp. 214–217. [Google Scholar]
  63. Prothero, D.R.; Schwab, F. Sedimentary Geology; Freeman: New York, NY, USA, 2004; p. 557. [Google Scholar]
  64. Zhao, G.; Li, S.; Liu, L. A study on characteristics and kinetics of catalytic degradation from kerogen in carbonate rocks. Chin. J. Geol. 2005, 40, 47–54. [Google Scholar] [CrossRef]
  65. Wang, J.; Jin, Q.; Ma, G.; Wang, L.; Wang, X. Catalytic action of sulphate evaporates in pyrolytic gas generation of source rocks. Nat. Gas Geosci. 2009, 20, 26–31. [Google Scholar]
  66. Hu, M.; Cheng, Z.; Zhang, M.; Liu, M.; Song, L.; Zhang, Y.; Li, J. Effect of Calcite, Kaolinite, Gypsum, and Montmorillonite on Huadian Oil Shale Kerogen Pyrolysis. Energy Fuels 2014, 28, 1860–1867. [Google Scholar] [CrossRef]
Figure 1. Thickness and thermal maturity of the Alum Shale Formation and stratigraphic column (modified from the reference [23]).
Jmse 11 01616 g001
Figure 2. The Nordic carbonate microscopic characteristics. (a) Residual structure containing a small amount of residual bacteria algal spherulite, many scattered-shaped or grainy pyrite aggregate-shape distribution, intergranular filling organic matter calcite and pyrite and single polarization; (b) a photo with horizon orthogonal polarization, residual structure, calcite recrystallization, generally containing a small amount of residual algal spherulite, containing much grainy pyrite; (c) residual fossil dragonflies, including individual and slightly better calcite intergranular residual much of iron and organic matter and single polarization; (d) enhancement of (c) with sight reflected light photos, where the opaque component is composed of micro granular pyrite and organic matter, and the organic matter is not reflective.
Jmse 11 01616 g002
Figure 3. Gold tube thermal simulation experiment of easyRo values corresponding to different temperature points.
Jmse 11 01616 g003
Figure 4. Carbonate thermal simulation of gaseous hydrocarbon production rate with temperature variation characteristics, and out of shale gas state hydrocarbon yield comparison and Shanxi group. (a) Carbonate thermal simulation of C1 yields with temperature variation characteristics, and out of shale gas state hydrocarbon yield comparison and Shanxi group; (b) Carbonate thermal simulation of C2-5 yields with temperature variation characteristics, and out of shale gas state hydrocarbon yield comparison and Shanxi group; (c) Carbonate thermal simulation of C1/C2-5 with temperature variation characteristics, and out of shale gas state hydrocarbon yield comparison and Shanxi group.
Jmse 11 01616 g004
Figure 5. Carbonate thermal simulation of hydrocarbon production rate with temperature variation characteristics, and out of shale and Shanxi coal group of hydrocarbon production rate. (a) Carbonate thermal simulation of CO2 yields with temperature variation characteristics, and out of shale and Shanxi coal group of hydrocarbon production rate; (b) Carbonate thermal simulation of H2S yields with temperature variation characteristics, and out of shale and Shanxi coal group of hydrocarbon production rate; (c) Carbonate thermal simulation of H2 with temperature variation characteristics, and out of shale and Shanxi coal group of hydrocarbon production rate; (d) Carbonate thermal simulation of non-hydrocarbon/total pyrolysis gas with temperature variation characteristics, and out of shale and Shanxi coal group of hydrocarbon production rate.
Jmse 11 01616 g005
Figure 6. Carbonate thermal simulation in the process of liquid hydrocarbon yield characteristics with the temperature change. (a) Carbonate thermal simulation in the process of total pyrolysis oil yields characteristics with the temperature change; (b) Carbonate thermal simulation in the process of C6-14 yields characteristics with the temperature change; (c) Carbonate thermal simulation in the process of C14+ yields characteristics with the temperature change.
Jmse 11 01616 g006
Figure 7. Carbonate rock pyrolysis gas product deltaδ13C characteristics with the temperature and the delta of out shale pyrolysis gas and Shanxi coal products δ13C. (a) Carbonate rock pyrolysis gas product deltaδ13C1 characteristics with the temperature and the delta of out shale pyrolysis gas and Shanxi coal products δ13C1; (b) Carbonate rock pyrolysis gas product deltaδ13C2 characteristics with the temperature and the delta of out shale pyrolysis gas and Shanxi coal products δ13C2; (c) Carbonate rock pyrolysis gas product deltaδ13C3 characteristics with the temperature and the delta of out shale pyrolysis gas and Shanxi coal products δ13C3; (d) Carbonate rock pyrolysis gas product deltaδ13CO2 characteristics with the temperature and the delta of out shale pyrolysis gas and Shanxi coal products δ13CO2.
Jmse 11 01616 g007
Figure 8. Carbonate thermal simulation results with the temperature change characteristics and product after joining CaSO4 contrast. (a) Characterization of the carbonate C1 yields as a function of temperature versus the temperature change with the addition of CaSO4 and a comparison of the products; (b) Characterization of the carbonate C2-5 yields as a function of temperature versus the temperature change with the addition of CaSO4 and a comparison of the products; (c) Characterization of the carbonate H2 yields as a function of temperature versus the temperature change with the addition of CaSO4 and a comparison of the products; (d) Characterization of the carbonate CO2 yields as a function of temperature versus the temperature change with the addition of CaSO4 and a comparison of the products; (e) Characterization of the carbonate H2S yields as a function of temperature versus the temperature change with the addition of CaSO4 and a comparison of the products; (f) Characterization of the carbonate C6-14 yields as a function of temperature versus the temperature change with the addition of CaSO4 and a comparison of the products; (g) Characterization of the carbonate C14+ yields as a function of temperature versus the temperature change with the addition of CaSO4 and a comparison of the products; (h) Characterization of the carbonate δ13C1 as a function of temperature versus the temperature change with the addition of CaSO4 and a comparison of the products; (i) Characterization of the carbonate δ13C2 as a function of temperature versus the temperature change with the addition of CaSO4 and a comparison of the products; (j) Characterization of the carbonate δ13CO2 as a function of temperature versus the temperature change with the addition of CaSO4 and a comparison of the products.
Jmse 11 01616 g008
Table 1. Thermal simulation of the geochemical basic parameters of the sample.
LithologyTOC
(wt.%)
Tmax
(°C)
S1
(mg/g)
S2
(mg/g)
S3
(mg/g)
HI
(mg/g)
vRo
(%)
Parent Material TypesSource
Nordic carbonate1.164290.214.080.683510.57IIBthis study
mud shale of Pingliang Formation0.864430.051.340.771470.80IIWang et al., 2014
coal of Shanxi Formation58.304240.6697.18/1670.55IIIPeng et al., 2020
Table 2. Thermal simulation experiment of carbonate hydrocarbon production rate under different heating rates with temperature variation characteristics.
Heating RateT/
°C
easyro/%Total Amount of G asCH4C2H6C3H8iC4H10nC4H10iC5H12nC5H12H2CO2H2SC1-5C6-14C14+
mg/gTOC
20 °C/h3370.5720.730.230.120.080.010.020.000.000.0520.220.000.467.285.44
3620.6821.790.470.300.210.040.050.010.010.0820.630.001.0813.386.19
3840.8043.121.631.291.070.220.380.080.100.2433.364.754.7727.228.10
4080.9677.085.344.884.290.921.920.590.820.4832.7325.1218.7577.8818.05
4321.19193.0015.8914.1412.892.535.881.842.380.6356.4080.4155.56137.4925.91
4561.47283.1728.0323.2421.944.3310.553.474.530.6370.87115.6096.08138.0023.51
4801.81411.4447.3635.1033.036.7014.123.604.240.5794.86171.87144.1479.2016.11
5042.19675.0488.3551.7940.666.447.290.370.310.64159.02320.16195.2160.4112.06
5292.54952.04127.6445.9518.201.210.260.010.010.98234.81522.98193.2845.348.39
5522.99933.33167.0022.872.570.050.020.000.001.50266.33472.99192.5136.945.57
5763.321095.36192.337.540.240.010.010.000.001.87351.25542.11200.1228.542.53
6013.871161.28211.681.920.070.000.000.000.002.29415.78529.53213.6819.710.36
2 °C/h3360.7434.870.820.580.490.140.150.030.040.1132.510.002.2517.555.13
3600.8856.972.682.302.100.520.850.250.280.3040.407.298.9840.3210.78
3841.08114.419.408.637.871.653.491.081.310.4953.4727.0233.4390.9220.73
4081.38192.5024.1719.5818.153.478.152.452.990.5265.6347.3978.95158.9228.71
4321.69293.1942.9531.5730.636.3414.434.585.680.4988.4168.12136.17138.8418.18
4572.09468.4675.0749.6846.619.6217.423.293.600.53136.36126.28205.2981.0813.29
4812.52630.11114.6256.0937.175.373.660.130.100.61196.07216.30217.1457.799.32
5042.99953.60158.2139.146.990.320.100.010.010.97309.25438.61204.7738.885.39
5293.491222.12192.054.210.310.020.010.000.001.14421.81602.57196.6031.082.81
5523.891201.07217.921.210.080.000.000.000.001.50454.06526.31219.2024.471.94
5764.191236.05223.840.930.030.000.000.000.001.85516.13493.26224.8013.840.88
6004.451508.19248.710.830.010.000.000.000.002.37708.38547.90249.5510.250.89
2 °C/h adding calcium sulfate5042.991802.59148.0165.9219.620.510.050.010.013.66856.36708.46234.1266.8119.43
5523.892341.24213.3442.820.250.010.010.000.006.551240.90837.36256.4348.1210.95
6004.453075.61103.120.750.000.000.000.000.005.521592.901373.33103.8734.505.40
Table 3. The carbon isotope composition of the carbonate thermal simulation experiment with temperature variation characteristics.
Heating RateT/°CeasyRo/%δ13C1/‰δ13CCO2/‰δ13C2/‰δ13C3/‰
20 °C/h3370.570.0−10.20.00.0
3620.680.0−9.00.00.0
3840.80−44.7−7.5−38.8−34.8
4080.96−44.0−6.7−36.4−33.1
4321.19−43.2−6.7−35.3−31.6
4561.47−42.7−7.2−35.4−31.2
4801.81−40.8−8.9−34.0−30.1
5042.19−38.9−11.3−31.00.0
5292.54−37.4−15.4−25.70.0
5522.99−35.2−15.40.00.0
5763.32−33.0−14.30.00.0
6013.87−31.5−14.10.00.0
2 °C/h3360.740.0−9.00.00.0
3600.880.0−7.5−38.0−35.4
3841.08−44.8−6.9−36.1−33.1
4081.38−43.2−7.1−34.6−31.3
4321.69−41.2−7.1−33.8−32.1
4572.09−40.2−7.8−32.5−29.1
4812.52−38.0−10.0−29.10.0
5042.99−35.0−12.2−21.20.0
5293.49−32.7−12.30.00.0
5523.89−31.6−12.70.00.0
5764.19−30.1−14.60.00.0
6004.45−28.4−14.80.00.0
2 °C/h adding calcium sulfate5042.99−37.3−6.7−27.70.0
5523.89−34.7−8.2−17.40.0
6004.45−20.0−13.80.00.0
Disclaimer/Publisher’s Note: The statements, opinions and data contained in all publications are solely those of the individual author(s) and contributor(s) and not of MDPI and/or the editor(s). MDPI and/or the editor(s) disclaim responsibility for any injury to people or property resulting from any ideas, methods, instructions or products referred to in the content.

