1. Introduction
It is certain that shipping and ports in the future will experience further challenges and disruptions due to external events. We have learned to quantify the impact of part of these events. Often, the performance of actors in the maritime chain depends on how resilient the design of the system is that the event hits. The impacts are often wider than on one ship, port or waterway. When a ship becomes stuck in a waterway, not only the ship and the waterway is impacted, but a wide-ranging global chain reaction occurs, like in the case of Ever Given blocking the Suez Canal, or the case of massive COVID congestion in ports around the world.
Data play an important role when governments and businesses work on strategically aligning themselves for benefiting from challenges and disruptions. Benchmarking tools are required for identifying performance gaps in a non-disrupted environment. Also, benchmarking against peers that could be seen as benefitting from the previous disruption may show which performance areas are important in a specific market that a port or a shipping line is working in.
This research was sparked by the need to collect relevant data on the performance of countries and container ports for answering questions on their performance. Despite the availability of a range of detailed statistics in the area from various open and proprietary sources, we notice that the existing literature has yet to identify what data are relevant and available and address ways to perform country and port benchmarking=.
The developed framework has two levels. At the country level, indicators are identified and assessed for areas of interest at the national level. The framework’s port-level indicators cover the same areas, but in more detail.
The innovative nature of this research lies in the development of a practically applicable data collection framework. The framework is designed by considering the strategic value of the data and is further strengthened by validation at both country and port levels. By employing this approach, the study successfully pinpoints the most suitable data sources for utilisation. In this way, we identify specific data sources that are best used by the researchers to leverage information for benchmarking and supporting the improvement of container port performance.
The main research questions that we aim to answer with the developed framework are the following:
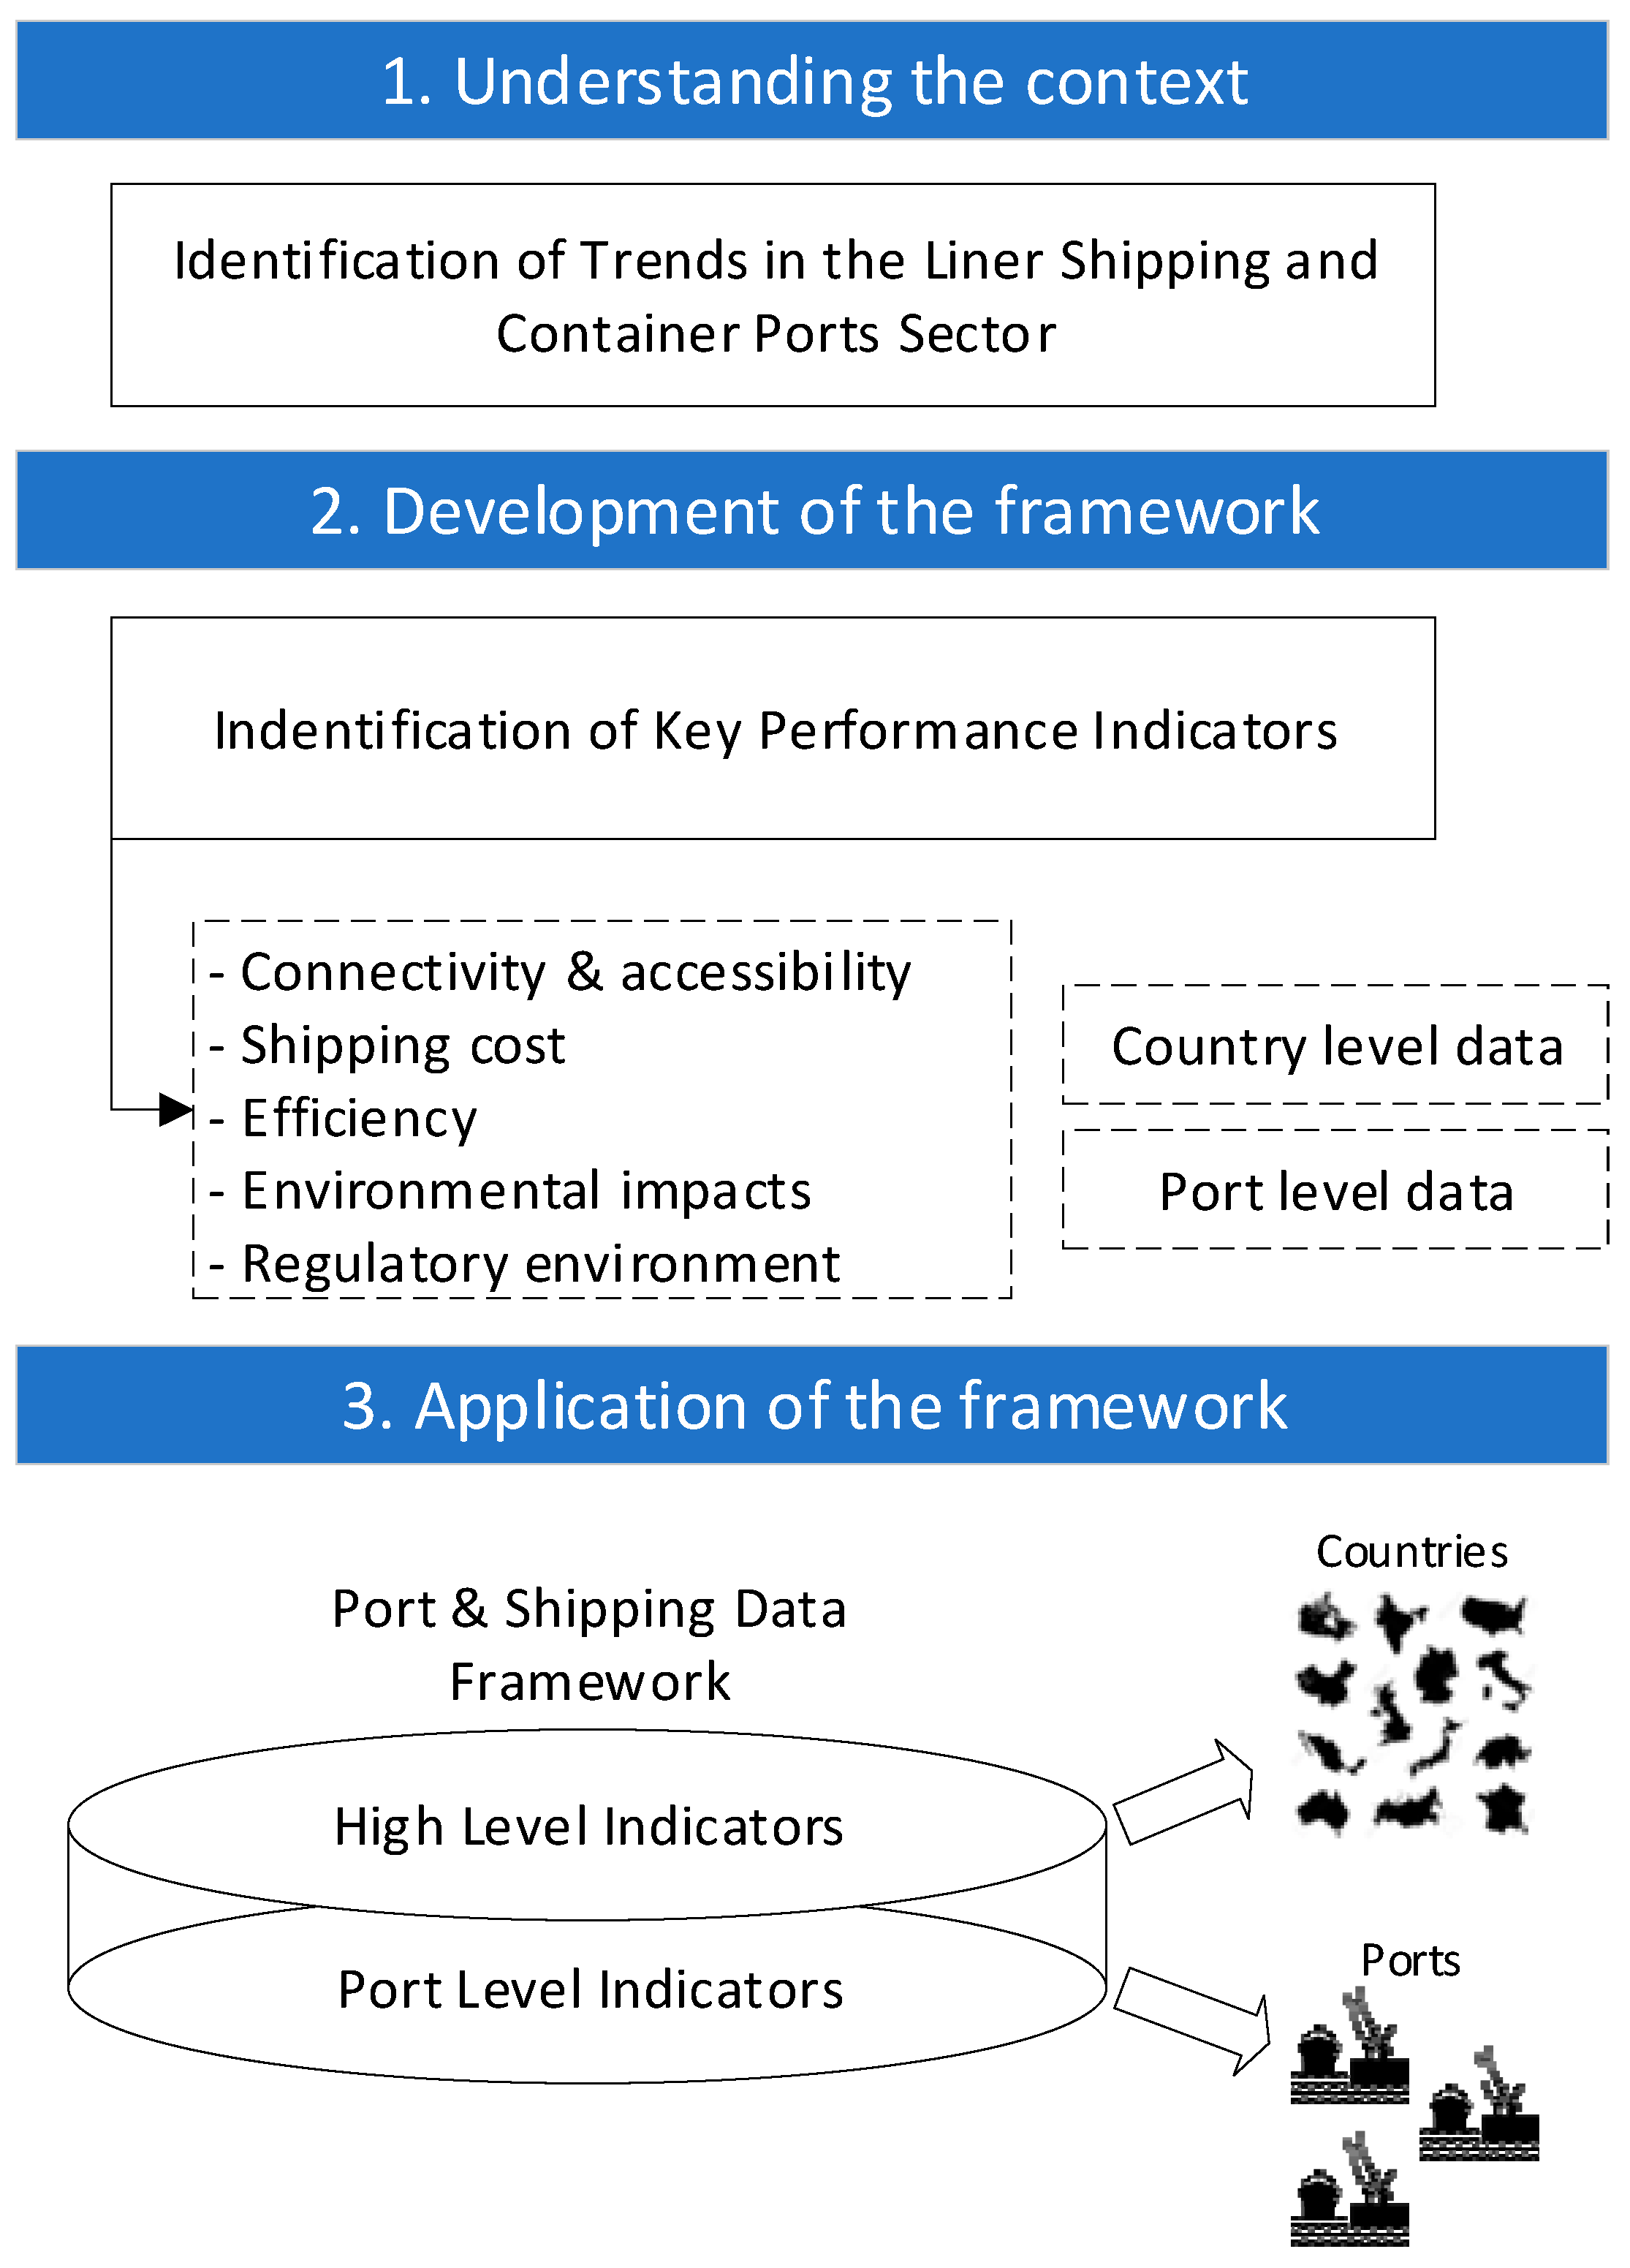
The research approach taken is summarised in
Figure 1 with three consecutive steps. In the first step, understanding of the sector is gained by identifying trends in the liner shipping and container port sector. A literature review is performed with a focus on the relevant trends and developments, and devising areas of interest for which the maritime data framework would have to collect data on. This step allows answering the first research question and is important for the analysis and interpretation of the results in the next steps of the research.
In the second step, the framework is developed by identifying adequate key performance indicators based on their strategic value for collecting country- and port-level data. The aim is to identify what data best describe port performance in each area of interest. And to capture a holistic view, we select indicators that cover both country-level and port-level data.
It is crucial to acknowledge that the data one could envision do not always exist in practice, and even if certain data do exist, they may not always be accessible to researchers due to their proprietary nature or prohibitively high cost. Considering these challenges, we adopt a pragmatic approach in this research to focus on selecting data sources that are available for free or at a moderate cost.
Last, in the third step, the developed framework is applied to validate its performance at the country and port level. This is conducted by collecting data from the identified sources and performing the benchmarking by comparing the performance of selected countries, country groups and ports on identified key performance indicators. Applying the framework allows identifying any data collection, quality and coverage issues that could be encountered.
Section 2 of the article summarises the most important trends in the liner shipping and container port sector. Next,
Section 3 describes the port and shipping data framework development.
Section 4 involves validating the framework by applying it on the country and port level. Then,
Section 5 discusses the relevance of the developed framework. Last,
Section 6 of this article draws conclusions.
2. Global Trends in the Liner Shipping and Container Port Sector
This section summarizes the worldwide port and maritime sector’s current situation and main trends. It focuses especially on maritime ports in the developing world
1, and the trend implications for those countries.
Several trends have shaped the port and maritime sector. Among them are increased globalisation and competition in manufacturing and other economic sectors; increased supply-chain vertical integration; increased consolidation among shipping lines; increases in vessel size; the development of multimodal transport infrastructure; digitization and cybersecurity; climate change; political pressure to decarbonize; and an increased focus on security. Some of these trends have become less pronounced over time, whereas others have gained momentum.
Berns, Dragt and van Bergen [
2] identify the factors driving the major trends in shipping and ports: demographic, societal, technological and economic (which is considered the most significant). This typology has helped identify the following global trends that currently influence shipping and ports and will likely continue to do so in the next 10 years, due to the previously mentioned drivers.
2.1. Economic and International Trade Developments
According to the United Nations Conference on Trade and Development (UNCTAD) [
3], developing countries’ share of seaborne trade tonnage has been growing slowly since 2006, and in 2018, amounted to 62 percent of total maritime trade.
This trend is expected to continue, with the developing world’s economic growth leading to it taking a larger share of increasing maritime trade volumes.
2 The International Transport Forum [
4], drawing on its Global Freight Model, predicted that developing countries’ maritime trade is likely to grow the fastest of all regions until 2050, especially in Indian Ocean and North Pacific trade routes. Reactions to the COVID-19 pandemic—in the form of reshoring, changes to supply chains, greater resilience and other disruptive developments, such as 3D printing—are expected to only slightly moderate this growth.
As countries become more developed, and incur higher manufacturing labour costs, production is sometimes relocated to other countries to reduce costs. In some cases, political developments contribute to production location shifts that were already happening. For example, due to the U.S.–China trade tensions since 2019, the production shift away from China—which was already in process due to rising labour costs—has accelerated. This shift has received added impetus from the COVID-19 pandemic and the need to build resilience in supply chains. One of the main beneficiaries has been Vietnam, reflecting both its lower labour costs and its manufacturing heritage [
5]. But other countries, such as Indonesia, Laos and Cambodia, are experiencing similar benefits.
The evolution in production locations is also presenting opportunities for other countries that are closer to main consumption markets, such as Mexico (for the United States) and Turkey (for Europe). This results in the regionalization of supply chains, whereby production and consumption are within the same world region. This only happens if the producing countries address the longer lead times and inefficiencies in their supply chains, which need to be rectified to press their competitive advantages [
6].
Innovations in production processes (such as the rise of on-demand additive manufacturing in certain sectors
3), increases in factory automation and the inability to build sufficiently resilient supply chains due to high associated costs are contributing to another economic development trend: reshoring. This is the return of the production and manufacturing of goods back to the company’s country of origin because the cost advantages of producing in a developing country do not offset the costs of outsourcing, given the risks and the need to ensure supply chain resilience. In practice, reshoring means that the production of specific goods is relocated to developed countries, or close to them, resulting in a reduction in maritime freight volumes, and a shift to short sea services or other modes of transport more suitable for shorter distances.
2.2. Logistics and Transport Trends—Integration and Resilience
Driven by economic and societal factors, supply chain integration is one of the logistic trends affecting maritime ports. Supply chain integration involves the closer coordination of actors within a supply chain, often using shared management information systems or electronic data interchanges. It also covers strategic decisions and a global vision of the chain, which impact on port choice and port activities. The main elements of supply chain integration, according to Rodrigue [
8], are transport connectivity, commercial, customs and security, regulatory, planning and funding, work practices and information system integration.
As previously unpredicted supply chain risks threaten business operations, logistics increasingly focus on strengthening supply chain resilience. Shocks to maritime supply, such as delays and closures of shipping routes and ports, result in inefficiencies and higher logistic costs. To improve supply chain performance—balancing efficiency with resilience—several approaches to sustainability in supply chain management; innovation and technological development; collaboration and alliances; and risk mitigation are being used [
9].
Because supply chains often stretch across the globe, with at least one end in a developing country, supply chain integration and resilience building are the operational realities for developing countries.
2.3. Trends and Challenges in Maritime Transport Operations
This section gives an overview of trends and challenges that feature in maritime shipping and ports. The overview serves to answer the first research question.
2.3.1. Terminal Operations—Slower Growth and Consolidation
UNCTAD [
10] shows that, as a result of the slowdown of global economic output in 2018 and 2019 and COVID-19 disruption in 2020, growth in global merchandise trade rebounded strongly in 2021 to 9.7% and 3.5% in 2022
4. More than 80% of global merchandise trade, by volume, is carried by sea, and maritime trade volumes increased by 5.8 percent in 2021. To place recent disruptions and rebound into context, the average annual growth in maritime trade from 1970 to 2017 was 3 percent. As a consequence, maritime trade, by volume, reached 10.99 billion tonnes in 2021, almost reaching the all-time high of 11.1 billion tonnes of 2019.
Following the recovery in 2021, the growth rates of the world economy and trade in 2022 were lower because of factors like the China economic slowdown, war in Ukraine, supply chain constraints and inflation-fighting policies of many countries. UNCTAD [
10] estimated maritime trade growth to fall from 3.2 per cent in 2021 to 1.4 per cent in 2022. Over the medium term, 2023–2027, seaborne trade is projected to grow 2.1 per cent per year. Data
5 also show that merchandise trade growth for developing countries tends to stay higher than that of developed countries.
In terminal operations, a weaker growth and rising costs due to increasing vessel sizes and larger shipping alliances are a catalyst for consolidation. Terminal operators have been growing in size, mostly because of mergers and acquisitions, and less so because of greenfield projects. In 2021, the six biggest terminal operators’ throughput, or production rate, had reached 48 percent of global operators’ total volume (ref. [
11], as cited in [
12]).
2.3.2. Vessels—Megaships and Energy Transition
The increase in ship sizes, though not a new trend, remains an important one in some shipping segments, particularly in the container ship segment [
13,
14]. The trend reflects both the ongoing need to reduce costs—in this case, through economies of scale—and the fact that the provided transport service is difficult to differentiate in other ways. Therefore, by increasing ship sizes, shipping companies are gaining a competitive edge in the market. Other market actors must respond to the trend’s effects: shippers receive a reduced frequency on maritime transport links, and terminal operators have to handle ever-bigger vessels, with dramatic impacts on required investments and terminal/port operations.
As megaships—also known as ultra-large container carriers (ULCC)—are deployed on the main trade routes with higher shipping volumes, there is a cascading effect on other trade routes: smaller and older vessels become redeployed there. Increasing vessel sizes, even on the smaller trade routes, requires smaller and feeder ports to also invest in future proofing, by ensuring a sufficient water depth; sufficient length and strength of quay walls; sufficient reach and capacity of cranes; and adequate capacity and terminal capacity. This is the corresponding pressure on the land-side access infrastructure.
Energy transition has established itself as a trend in maritime trade lately, but more as an unavoidable future factor that port operators and vessel owners should bear in mind and react to in the future. Amongst the first few examples of low- and zero-carbon energy use in ships are Ellen, an electric-powered ferry sailing in the West Baltic Sea, and Yara Birkeland, an autonomous electric container vessel operating in the south–east of Norway. There are many more alternative fuel-ready ships that have been built or retrofitted lately, which currently are not operated with low- or zero-carbon fuels. Nevertheless, the ports consider it important to plan and invest in adequate energy supply infrastructure. Timing such investments is difficult because specific energy demands are hard to forecast, and the “winning” energy solution is unclear.
2.3.3. Information Systems—Digitization Path towards Optimisation
Digitization is an established trend in maritime transport, the importance of which is likely to grow, especially in the context of amendments to IMOs Facilitation Convention, which, from 2024, will make the single window for data exchange mandatory in ports around the world. Digitization provides opportunities to optimise existing supply chains, develop new ones operationally and geographically and create new business opportunities. Existing supply chains can also benefit from the optimisation of vessel speeds and routes, which results in the reduction of fuel costs, and potentially of time in a port.
These developments present opportunities for the development of new business models in the maritime supply chains to optimise vessel operation, cargo tracking, capacity management, ship waste management, etc. As a result of lower costs due to better optimisation, the geographical distance will be less relevant, and therefore the competitive advantages of nations will shift, potentially benefitting developing countries [
15]. This trend is highlighted in the port-level data collected as part of this study. In the ports, electronic data exchange is valuable for optimising information flows related to import and export operations. And network effects are present—the more logistics chain stakeholders use electronic data exchange, the greater the benefits for each of them.
But increased digitization increases cybersecurity risks. A February 2020 survey on cybersecurity [
16] found 31 percent of organisations responding had experienced a cyber incident in the 12 months prior, versus 22 percent in the same survey in 2019. But for ports, the risk of delaying the implementation of digitization is likely to be a lower efficiency and higher trade costs.
2.3.4. Ship Routing—New Routes and Improvements to Existing Routes
According to one prediction, within the next few decades, the Arctic Ocean will be ice-free in the summer [
17]. Putting aside the ecological and environmental implications, the possibility presents opportunities for new shipping routes. Using Arctic routes, travel time and cost between Europe and the Far East, and Europe and North America’s West Coast, would be significantly reduced, compared to current routes [
18]. Although there has been a significant increase in vessels using this route, these uses are mainly in connection with oil and gas exploration; commercial lines’ concerns about potential environmental impacts are inhibiting greater utilisation at this time, next to of course the risks related to sailing close to Russia given the war situation since February 2022.
Important shipping routes pass through the Suez and Panama canals but have ship size limitations. Substantial investments in both canals have been and are in progress to increase their capacity and ship size limitations. The Suez Canal, through which 7 to 8 percent of world maritime trade passes, will be upgraded by 2023 to an almost double capacity, from 49 to 97 ships per day. It will also allow the passage of larger vessels [
19]. Similarly, the Panama Canal received a third set of locks in 2016, facilitating the passage of larger ships [
20]. In both cases, this is likely to engender operational changes for the shipping lines; for example, the order in which the ports will be called at. In some cases, this will require additional investments due to changed waterway depth requirements.
2.3.5. Trends in Environmental Policies—Succumbing to Political Pressure
The IMO regulated a global 0.5 percent sulphur cap on fuel content that took effect on 1 January 2020. For shipping companies, compliance with the new regulation requires transition to more expensive low-sulphur-content fuel, investing in equipment such as scrubbers, or the conversion of ships to be powered by liquefied natural gas (LNG). UNCTAD [
21] suggests that the regulation will result in a fuel cost increase of as much as 50 percent—that is, an additional USD 10 billion to USD 15 billion in fuel costs for the container shipping lines in 2020 alone [
22]. This has led to a search for alternative fuel technologies [
23]. The new IMO regulation requires ports that provide bunkering facilities to supply low-sulphur fuels, and it also requires the facilities to handle waste products generated by scrubbers.
Discussions that target carbon emissions continue, with the aim of producing a regulation that balances the interests of shipping companies with the need to remediate the industry’s effect on climate change. The adoption of regulations is crucial for improving shipping’s environmental performance because, as Taudal Poulsen, Ponte and Lister [
24] argue, unless a clear and enforceable regulation is adopted, the environmental upgrading of shipping operations is unlikely.
2.3.6. Port Governance—Creation of Independent Commercial Entities
Ports bring numerous benefits, including tax revenues, to the countries where they are located, and good governance is key to accessing these benefits. Ports are essential to the movement of goods. In developing countries especially, ports fuel economic growth by facilitating international trade, leading to the industrialization of port hinterlands, the development of port cities and increased employment in the ports’ and stakeholders’ communities.
To adapt to globalisation and related trends, since the 1990s, many governments have launched port reforms, changing port governance structures [
25]. This global trend is ongoing. Ports are being restructured as independent commercial entities, using the landlord model, and in most cases, keeping port ownership public [
26]. This includes a widespread adoption of concessions to bring greater private sector management and finance, increased specialization and greater efficiencies to port services. A separation of regulatory oversight from the port authorities is usually conducted through the establishment of a Maritime Administration. This allows for a more efficient oversight and management of port activities.
With the advent of private operators through concessioning, and along with the globalisation featuring many industry sectors, we have also witnessed a globalisation in maritime supply chains, including the port terminal business. Already in 2014, the authors of [
27] witnessed various vertical integration moves initiated by terminal operators, next to of course the high level of horizontal integration that had featured already for more than a decade among terminal operators. The vertical integration involves terminal operators setting up their own or joint venturing in land transport or inland terminal operations. This integration mostly starts from the large, multinational players that have started dominating the global container terminal business.
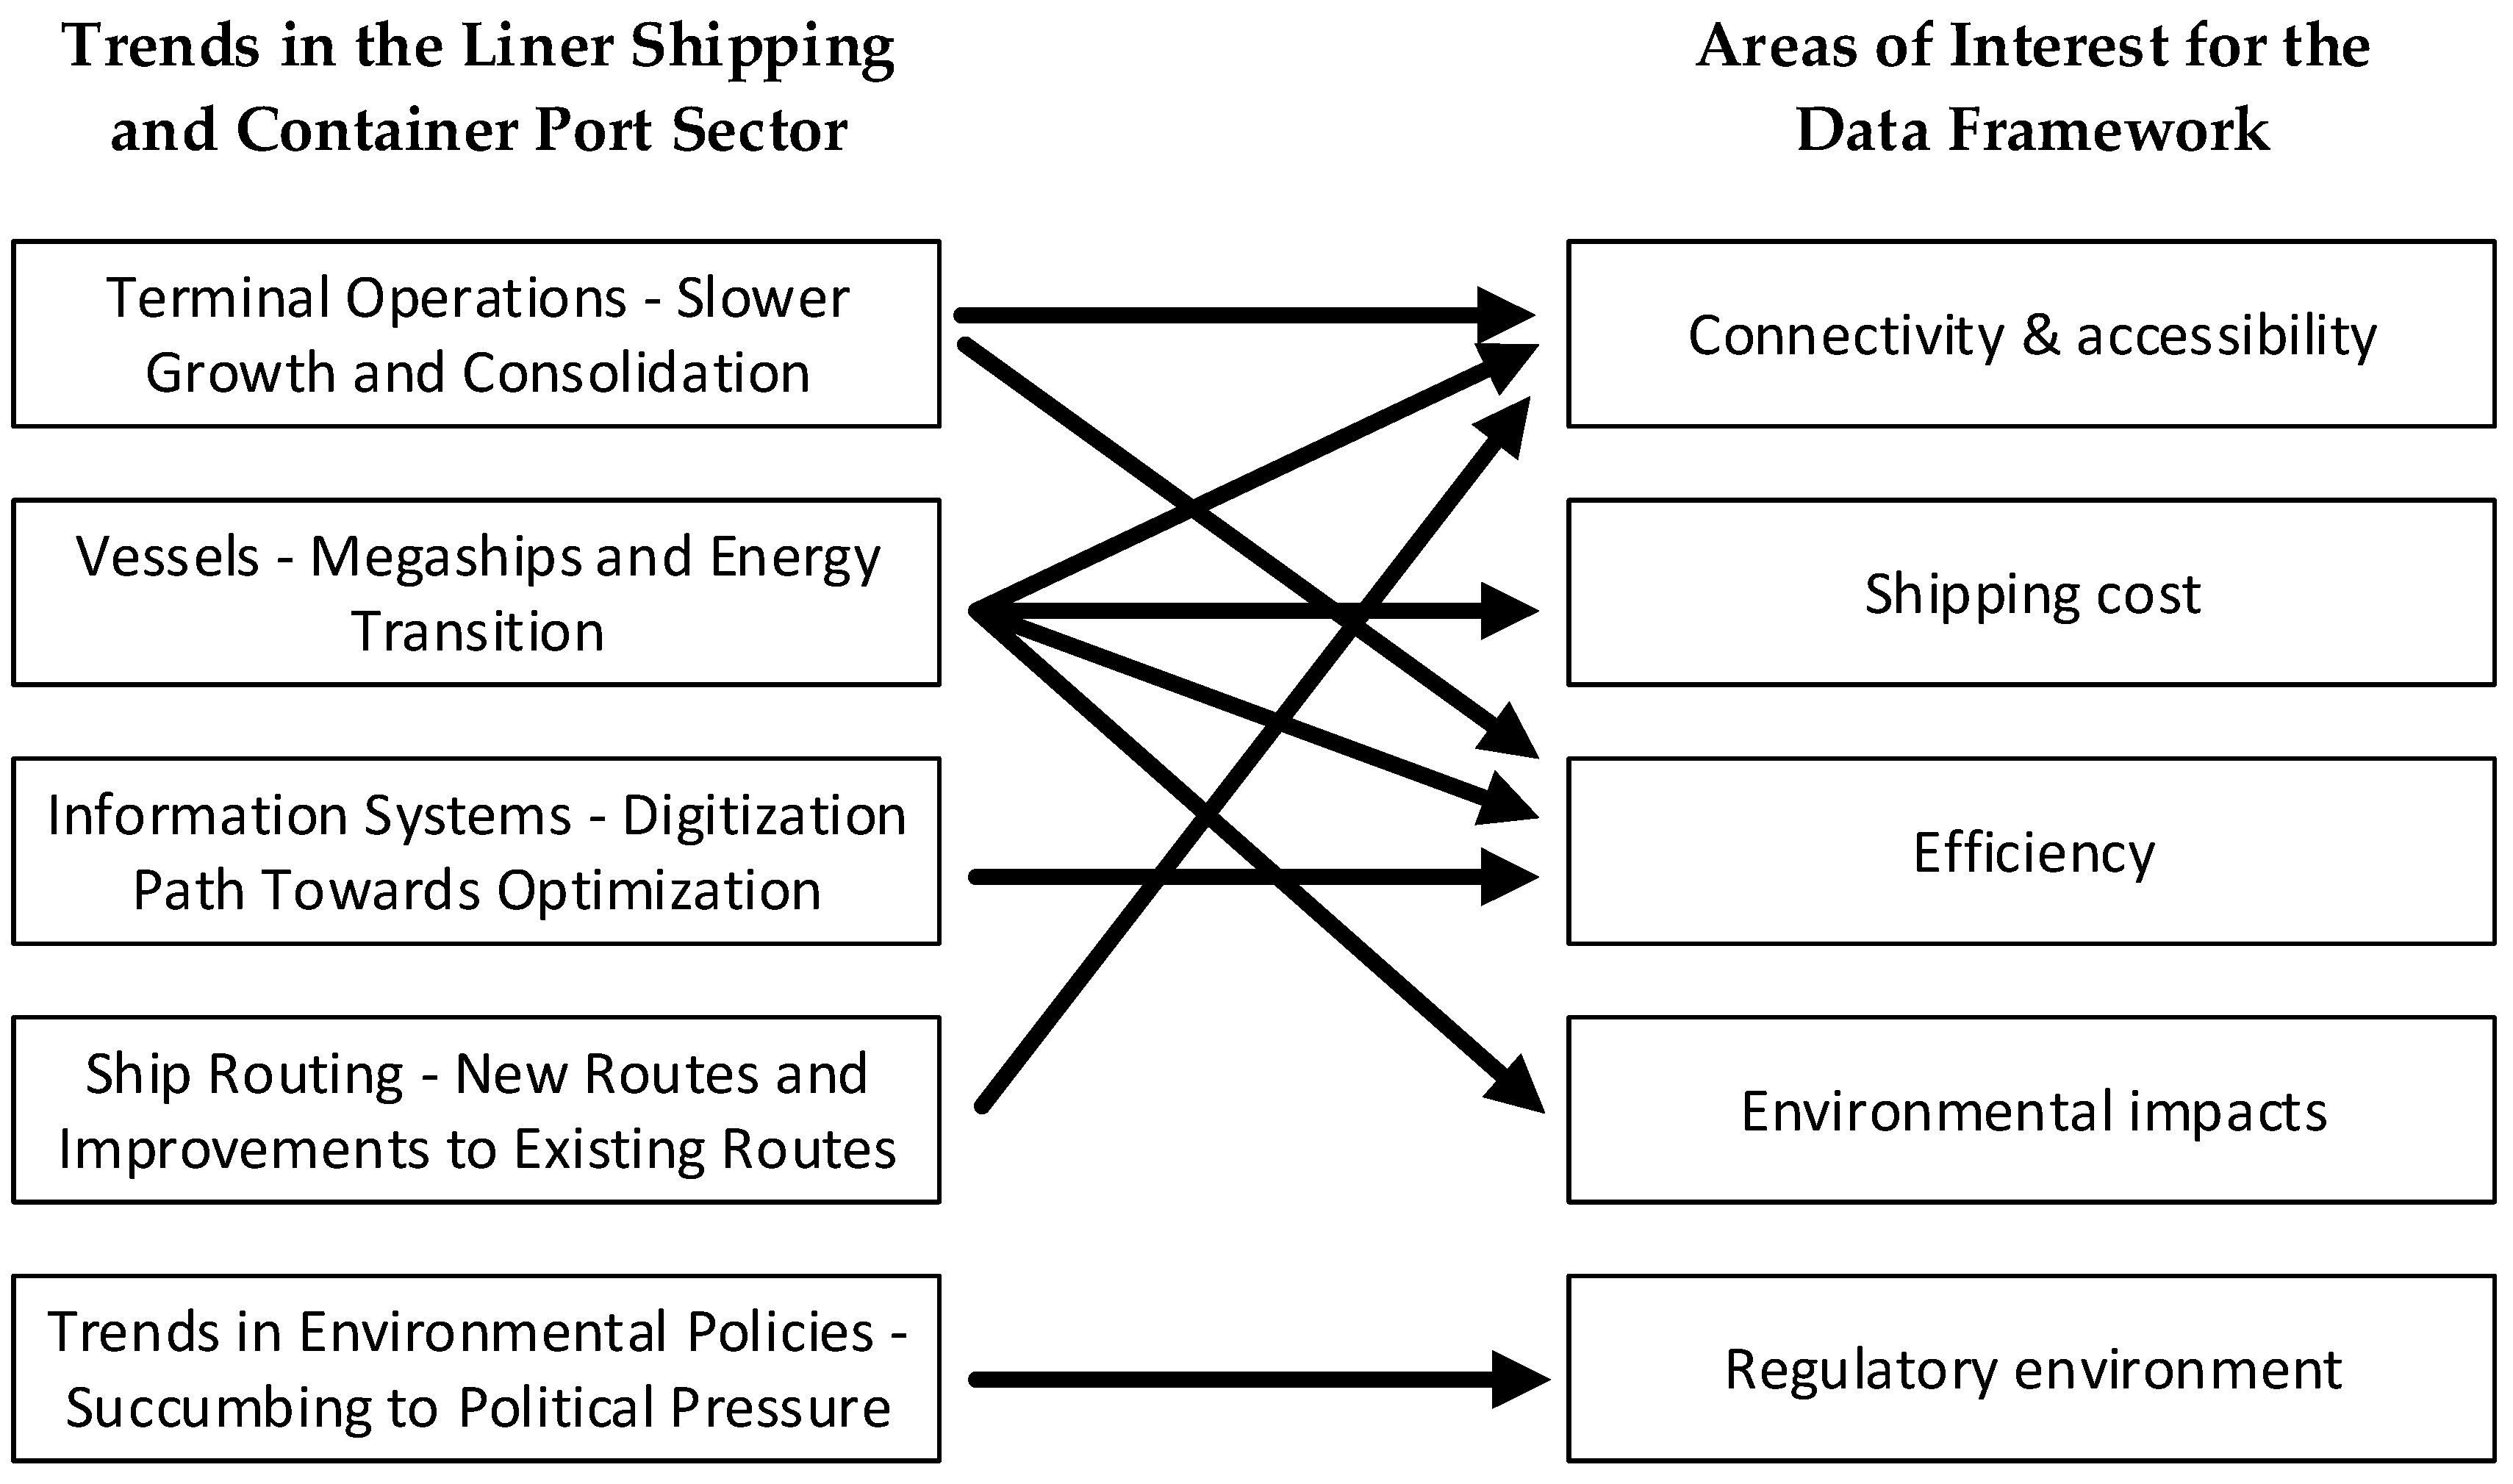
To summarise the section,
Figure 2 illustrates the interconnections between the five identified trends and the areas of interest that the maritime data framework will allow collecting relevant data on. The latter are identified as connectivity and accessibility, shipping cost, port efficiency, environmental impacts and regulatory environment. Understanding the context in which the data are collected is important for analysing them and interpreting the results.
3. Port and Shipping Data Framework: The Concept
In this section, we develop the maritime data framework that is needed to reply to the second research question. We show the criteria that are used for developing the framework and the approach used for identifying key performance indicators, and present the resulting framework.
When developing the framework, we are limiting our investigation to only input criteria that relate to the maritime dimension of maritime transport and directly relevant infrastructure. This means that data that relate to both the maritime connectivity and ports are considered, but data related to the hinterland connectivity of the ports do not fall within the scope of this investigation. Additionally, of particular importance within the scope of this investigation is the regulatory environment that the ports are working in
6.
3.1. Criteria for Developing a Data Framework
In an ideal world, the criteria that serve as input data would be determined by the research questions that should be answered. Then, data collection would follow and no data would be missing. In practice, due to the unavailability of some data, a different approach is used—we construct the data framework and propose KPIs that are based on available rather than desired data. This approach has advantages. It allows answering research questions with an incomplete dataset. Furthermore, it also allows identifying the areas where data are missing, and that could eventually be collected for a specific port or country with extra effort, if required.
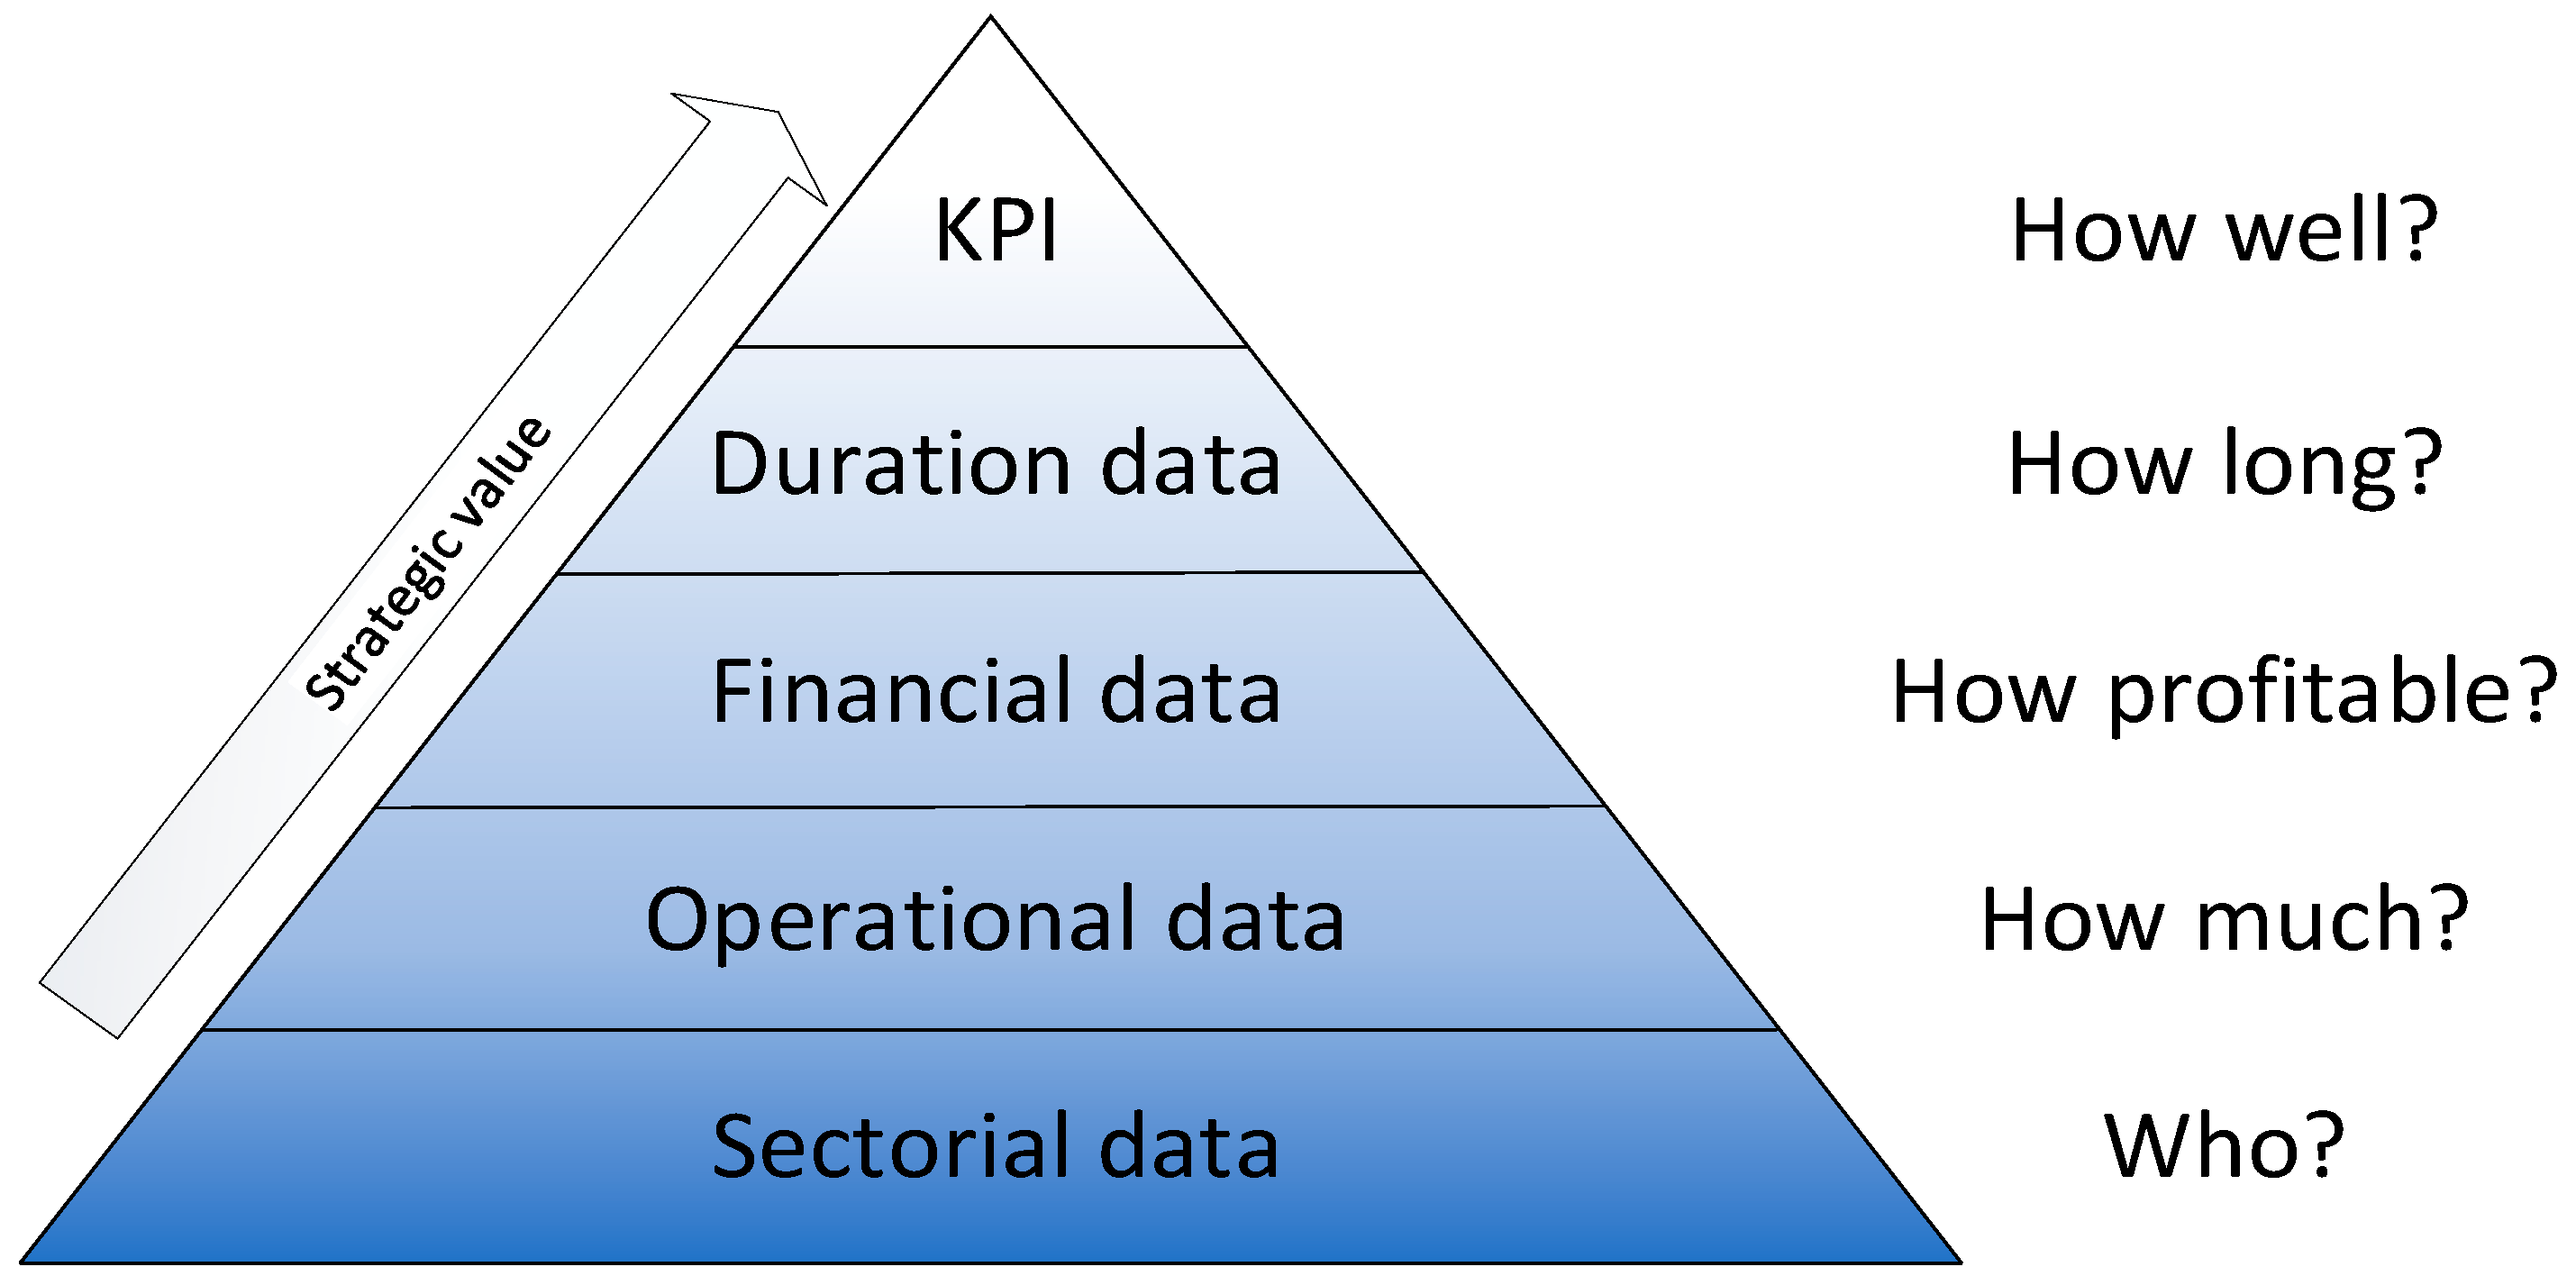
The data framework is constructed as a pyramid (
Figure 3), where data at each level allow answering a specific question about ports and shipping. The higher levels of the pyramid represent a higher strategic value for the decision maker, but also tend to have less usable indicators available. The pyramid serves as an aid for assessing the identified indicators further on in our work and feeds into the developed data framework indirectly.
3.2. Identifying Key Performance Indicators
For identifying what approach should be used for calculating the KPIs, a literature review is performed focussing on connectivity, accessibility, shipping cost (affordability), efficiency (including capacity utilisation), environmental impacts and regulatory environment. The results and the identified KPIs are described below for each of the interest areas.
3.2.1. Connectivity and Accessibility
The distinction between the connectivity of the ports in the maritime network and their accessibility is important to clarify because often these terms are used interchangeably, as indeed their meanings are close. The connectivity of a transport network refers to the density of connections in the path and directness of links [
29]. A well-connected port in a network therefore has many direct connections to the rest of the network. Accessibility refers to the ease with which the goods are able to reach the desired destination, passing through the transport network [
30]. Therefore, the concept of accessibility adds the resistance dimension (cost, distance, technical limitations, etc.) to the connectivity.
The three main approaches for measuring the maritime connectivity and accessibility of the maritime transport network are the following.
The first is the graph-theory-based approach, which measures only connectivity. It describes the shipping network as nodes connected by links, and defines the connectivity of a location as how many connections it has. The connectivity index is constructed by comparing the total number of possible paths to those paths that are available in the shipping network [
31]. Measures for the level of connectivity are the maritime degree and betweenness centrality [
31] and vulnerability [
32]. The disadvantage of the graph-theory-based approaches, according to Frazila and Zukhruf [
33], is that they do not take into consideration distance, cost or other impeding factors.
Second, the gravity-based approach considers potential impedance properties of networks, such as distance, cost and others. It determines the connectivity and accessibility based on the region potential and the measurable cost for interacting between them. The measure of connectivity and accessibility, as proposed in [
34] for air connectivity and also applied for maritime connectivity by Frazila and Zukhruf [
33], is an index based on impedance factors between the nodes.
The third approach, which also measures both connectivity and accessibility, is based on UNCTAD’s Liner Shipping Connectivity Index (LSCI) [
35], which is in its latest version and calculated based on six components: the number of ship calls, deployed capacity, number of regular shipping services, average size of ships using the scheduled service with the largest average vessel size and number of other countries that are connected to the country through direct services. The calculation is straightforward: the values of each component from each country are then divided by the biggest values (i.e., reference values) of each component from all countries and averaged to obtain the connectivity value. The country average is then again divided by the maximum value for the base year and multiplied by 100. This gives an index with a maximum value of 100 in the base year for the country with the best performance, and all other values are in relation to this value.
The Herfindahl–Hirschman index
7 (HHI) is a measure of market concentration, and is calculated based on the market shares of the participants. The index can range from close to zero to 10,000, with lower values pointing to perfect competition in the market, and the highest value of 10,000 showing a monopoly situation.
The index is calculated using the following formula:
where
N is the number of participants in the market, and
si is their market share in a percentage, expressed as a whole number for each of the market participants.
The benefit of using the UNCTAD-LSCI-based approach is that it is simple enough for evaluating the growth of the network and uses a single fixed value of reference, which allows generating internally consistent time series. For the purposes of this research to measure the connectivity and accessibility at the country level, the UNCTAD LSCI index is chosen, while at the port level, the individual components used for the calculation of the index are utilised, as well as the Herfindahl–Hirschman index.
3.2.2. Shipping Cost
Shipping cost, despite its small share in the final cost of the shipped product, is significant, and can pose barriers similar in size to export tariffs [
36]. Costs associated with a poor infrastructure quality (ports and roads), geographical distance to market and oil prices continue to shape global production networks and the integration of countries into global value chains [
37].
In order to assess the international transportation cost levels, OECD created a detailed cross-country sample of official national statistics on explicit CIF-FOB data and used estimates from an econometric gravity model [
37]. Despite not being maritime-shipping-specific, this indicator characterises shipping costs in great detail by trading the partner and commodity category; therefore, it is chosen as a KPI
8.
In order to calculate the generalised shipping cost from any origin to any destination, a model has been developed. The first version of this model was developed by van Hassel et al. [
14]. In this model, the total supply chain, including maritime transport, the port process and hinterland transport, is taken into account. This model considers the entire supply chain, which includes maritime transportation, port operations and inland transportation. The reason for selecting the approach by van Hassel et al. [
14] is that it allows calculating the overall cost for the entire logistics chain, with ports playing a crucial role. This model allows determining the generalised cost of the chain starting from a specific origin point, following a predefined container loop and reaching a destination point.
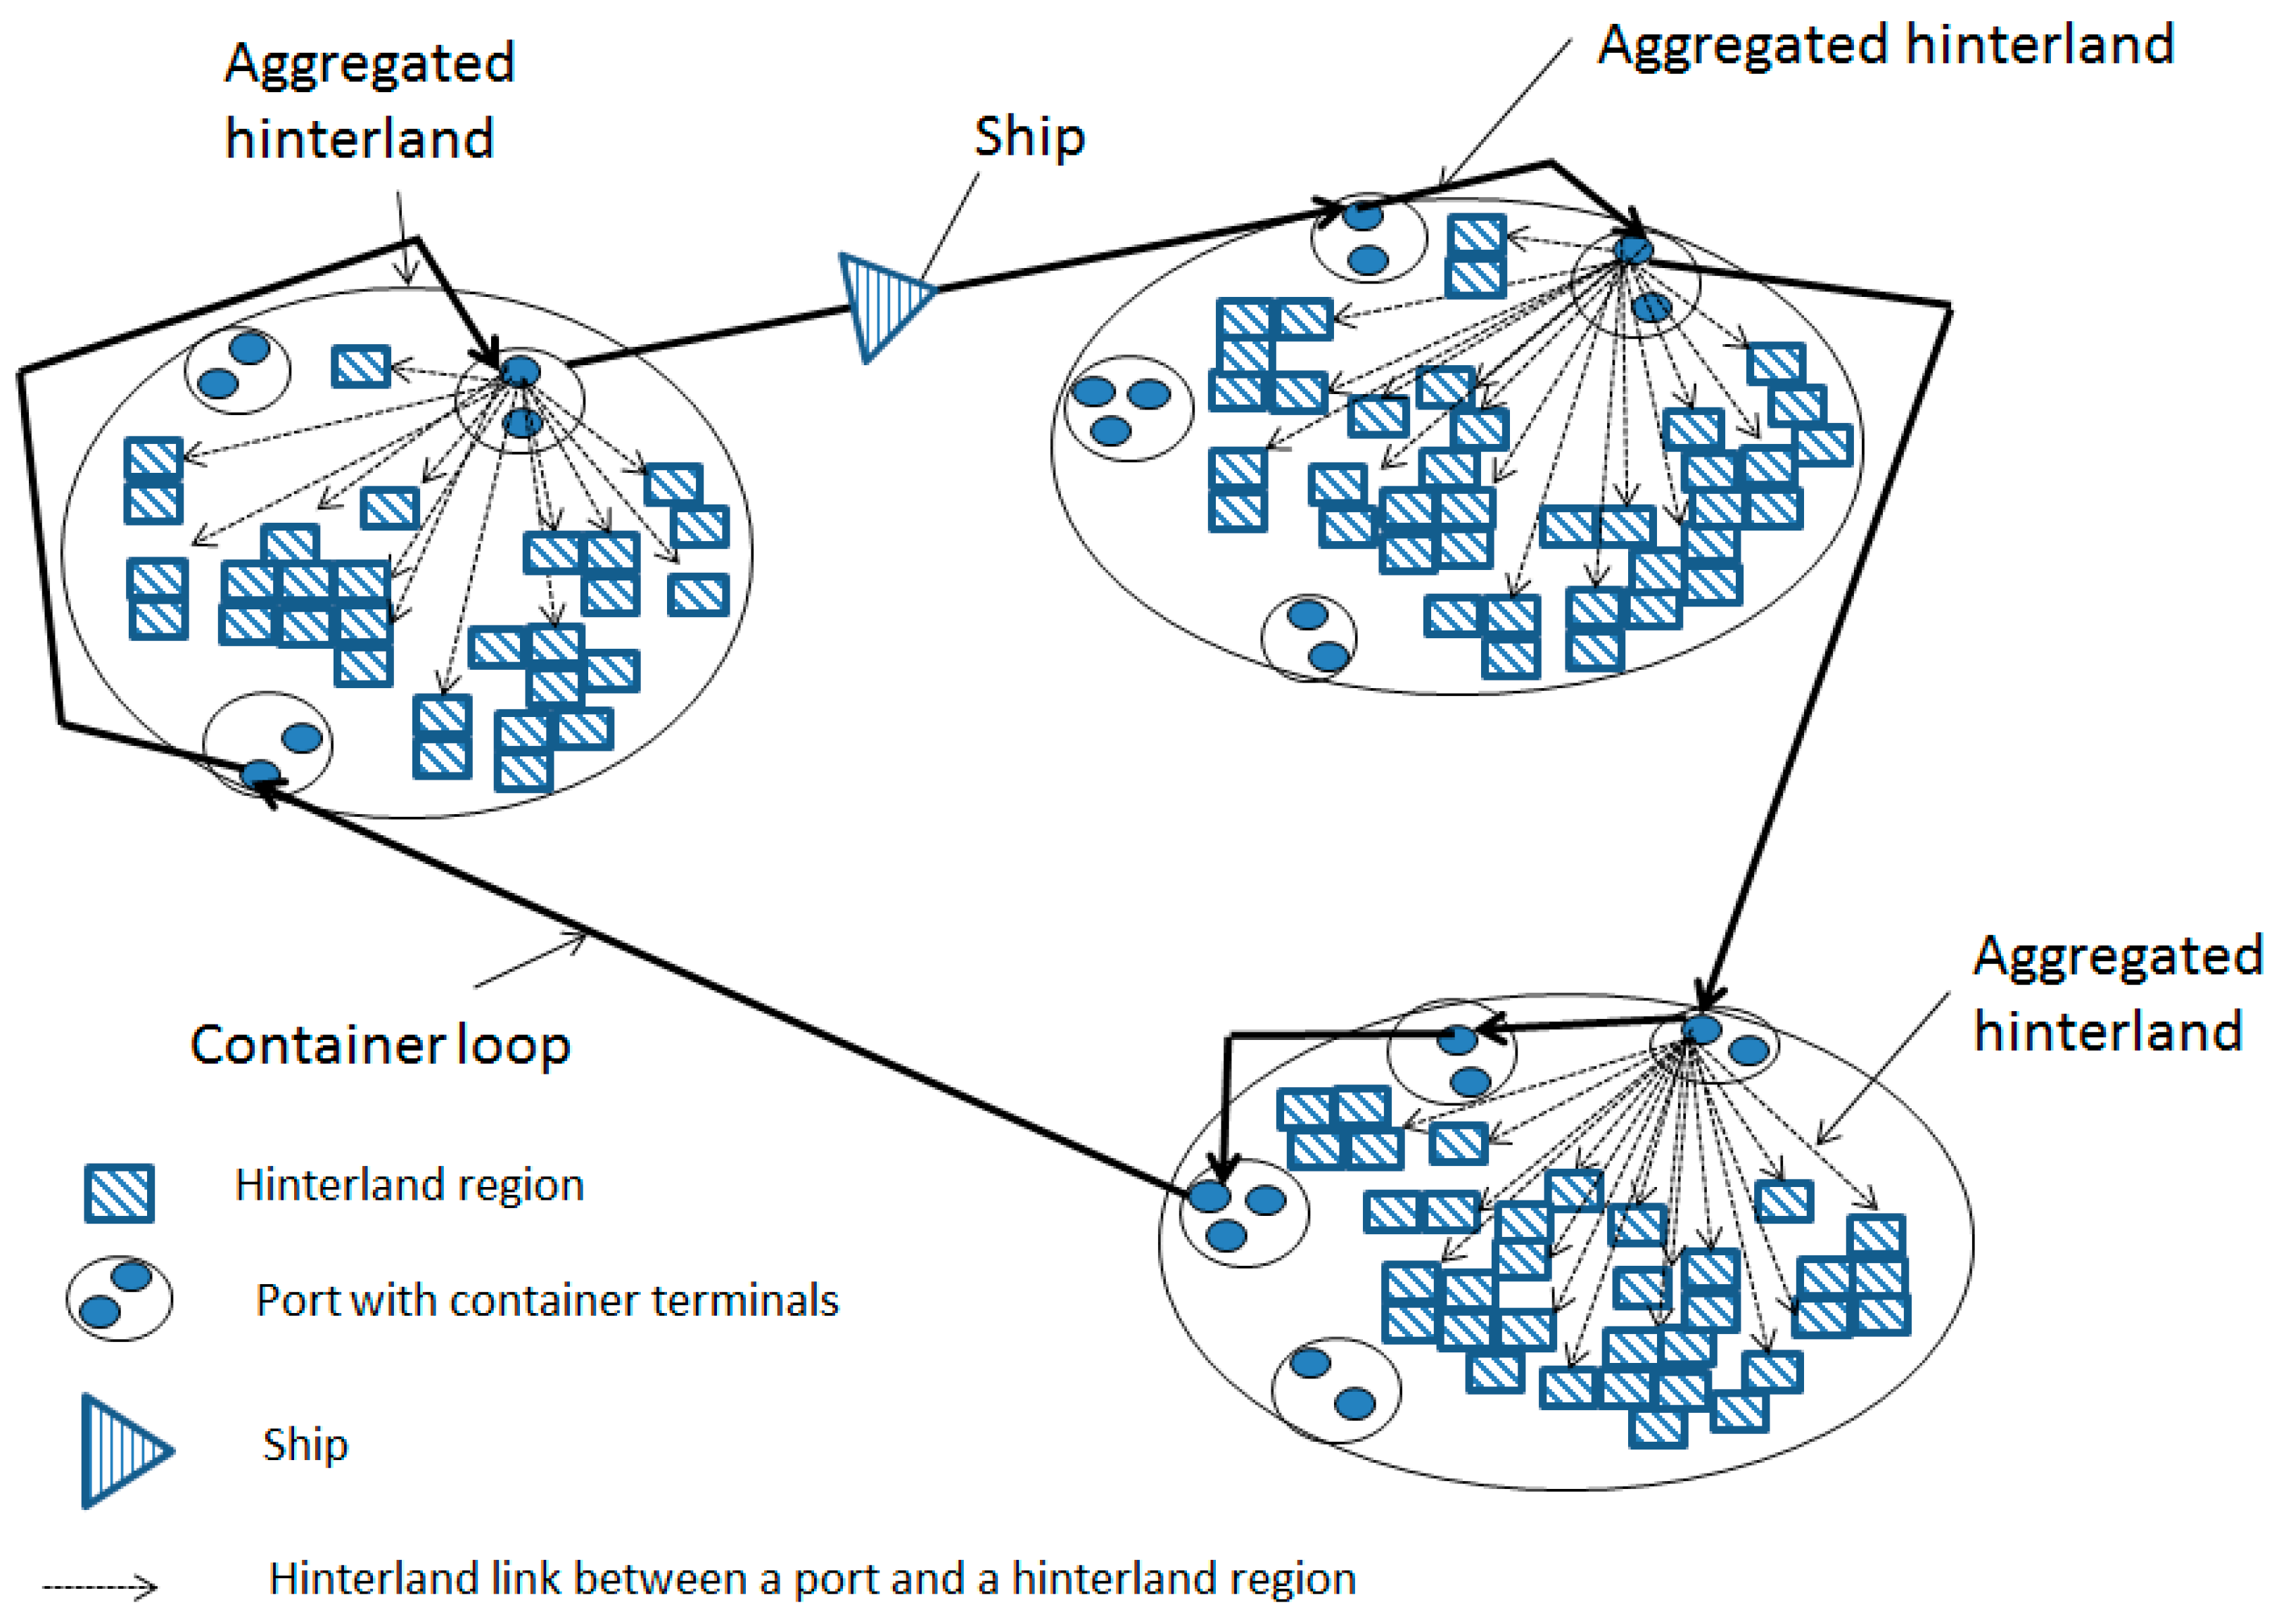
Figure 4 provides an overview of the model that has been developed.
The model incorporates the distances to the hinterland through different transportation modes from each terminal within a port. This allows for calculating mode-specific costs from a terminal to a hinterland destination. A chain refers to a route connecting one aggregated hinterland area to another, with a clear starting and ending point. The model takes into account the costs associated with transporting a container from a hinterland area to a port on both ends of the chain, the expenses during the port phase (e.g., port dues, pilotage and container handling) and the cost of sea transport between the loading and unloading ports. This allows for determining the chain cost from the origin to the destination. The model can be utilised to calculate the cost of transporting goods from specific container terminals in European, American, Chinese and other ports, considering three different transportation modes (road, rail and inland waterway). Consequently, it can also estimate the cost of land-based movements, such as rail transport. The total transit time is a significant factor in the generalised cost, so the model incorporates transport times throughout the entire supply chain. This includes accounting for the transit time from a hinterland region to a port, the container dwell time at a deep-sea port, the maritime transport time and the time required for port and land transport at the destination hinterland. The main explanation of the base model, including the used formulas, can be found in [
14] by van Hassel et al. for the maritime chain cost calculations and in [
38] by Pruyn and van Hassel. All cost data are updated to 2020 cost values
9.
Figure 4.
The structure of the Chain Cost Model. Source: van Hassel et al. [
39].
Figure 4.
The structure of the Chain Cost Model. Source: van Hassel et al. [
39].
3.2.3. Efficiency
The efficiency of port activities is measured using port performance indicators. There are no widely accepted port performance measurements available, although a wide range of measures and indicators exist for tackling data from dissimilar ports [
40]. Originally, port performance indicators were proposed by the United Nations Conference on Trade and Development in 1976 [
41].
The scientific interest in the topic of port efficiency picked up in the mid-1990s, and since then, a range of studies analysing the efficiency and productivity of the port sector have been performed. González and Trujillo [
42] classify these studies in three main groups based on the employed methodologies and indicators used for assessing port efficiency:
Partial productivity indicators of the port system [
43,
44,
45] and total factor productivity (TFP) [
46] were the first application of this methodology to the port area. Later extensions came with the application of the Luenberger indicator [
47], which includes both technical efficiency change (managerial efficacy) and technological change (investment).
Studies with an engineering approach that use the simulation and queueing theory constitute the second group [
48,
49].
The third is more recent and covers technological frontier estimates from which efficiency indexes of port firms are derived [
50]; it can be considered as the starting point in estimating the production functions in the port area [
51,
52,
53].
Fourth and more recently, a port process benchmarking approach was applied by Jeevan et al. [
54], which, in this case, also includes—next to transportation infrastructure and operation facilities—the container planning strategy, competition, location and externalities.
The method of technological frontier estimation, despite not being a methodologically straightforward approach, could be used as a KPI. The input data for the calculation are available on a global scale. The methodology requires building an econometric model to measure the port efficiency using a stochastic production frontier. An application of this approach on a global or large scale has never been conducted (as far as we know), and would be a very interesting study to perform.
Another indicator that is a more general efficiency measure, suggested for inclusion as a KPI, is the Logistics Performance Index (LPI) [
55], which is a more general measure of the efficiency with which the 180 included countries move goods across and within borders. The LPI was created to help identify the challenges and opportunities countries face in their performance, to allow them to improve. It also includes relevant sub-components, which can be investigated separately, like the ability to track and trace, competence, ease of arranging competitively priced international shipments, efficiency of clearance processes, schedule frequencies and quality.
3.2.4. Environmental Impacts
In the context of maritime transport, the emissions are the politically most important externality. They are also the externality that, due to climate change, is the one that is worth following. Unfortunately, ship emissions are reported at the global level due to the difficulty of attributing emissions to countries because maritime emissions are generated elsewhere on the planet. Due to the importance of emission performance, we use a KPI that calculates the shipping CO
2 emission share per country by attributing global emissions based on the volume of trade, despite the methodological shortcomings
10 of the approach. We use two approaches for this: in the first, we assume that the exports and imports both contribute to the maritime emissions of a country, and in the second, we assume that the exporting country bears no responsibility for the emissions because the international trade is demand driven. As there is no single best way for attributing shipping emissions to countries, the use of the two approaches allows contrasting country performance in the two ways.
3.2.5. Regulatory Environment
The regulatory environment includes the laws and regulations that the maritime industry has to comply with. Usually, certain criteria, as required by regulations, must be met to be able to start operations, and the operations themselves must meet the regulatory requirements that are in force. Complying with these requirements can be time consuming and costly. For ports, the regulatory environment can be a differentiating factor and impact on their competitiveness; for example, if two ports are serving the same hinterland. Therefore, we choose to use information that characterises the regulatory environment as a KPI. We follow the OECD Product Market Regulation (PMR) [
56] methodology to ensure the consistency of the approach and allow for direct comparison with existing regulatory environment assessments
11. Also, for terminal concession assessment at the port level, the World Bank Private Participation in Infrastructure database is used.
3.3. Maritime Data Framework
The resulting data framework is developed at two levels. At the top level of the framework, the high-level indicators are included, which describe the country level data in the five areas: connectivity and accessibility, shipping cost, efficiency, environmental impacts and regulatory environment; see
Table 1. The port-level framework contains indicators in the same five areas as the country-level framework, but at a more detailed level; see
Table 2.
4. Application of the Framework
In this section, we demonstrate the application of the framework for the benchmarking of the performance at the country and port level. We choose to only present the most interesting results of the benchmarking
12, intentionally leaving out the results that are obvious or data that bring no added value in the context of this paper. In the first sub-section, we cover the country-level data, and then in the second sub-section, we present the most interesting port-level data.
4.1. Country-Level Data
Benchmarking is a useful approach to assess how countries and ports are performing in comparison with each other. Such comparison on various metrics allows identifying performance gaps and areas that require improvement, based on peer performance in some specific areas. It provides an opportunity to set realistic expectations for port performance improvements, and follow up on performance increases or decreases in the specific identified metrics over time.
In the following sub-sections, we review and compare the performance of countries regarding shipping cost and efficiency.
Shipping Cost
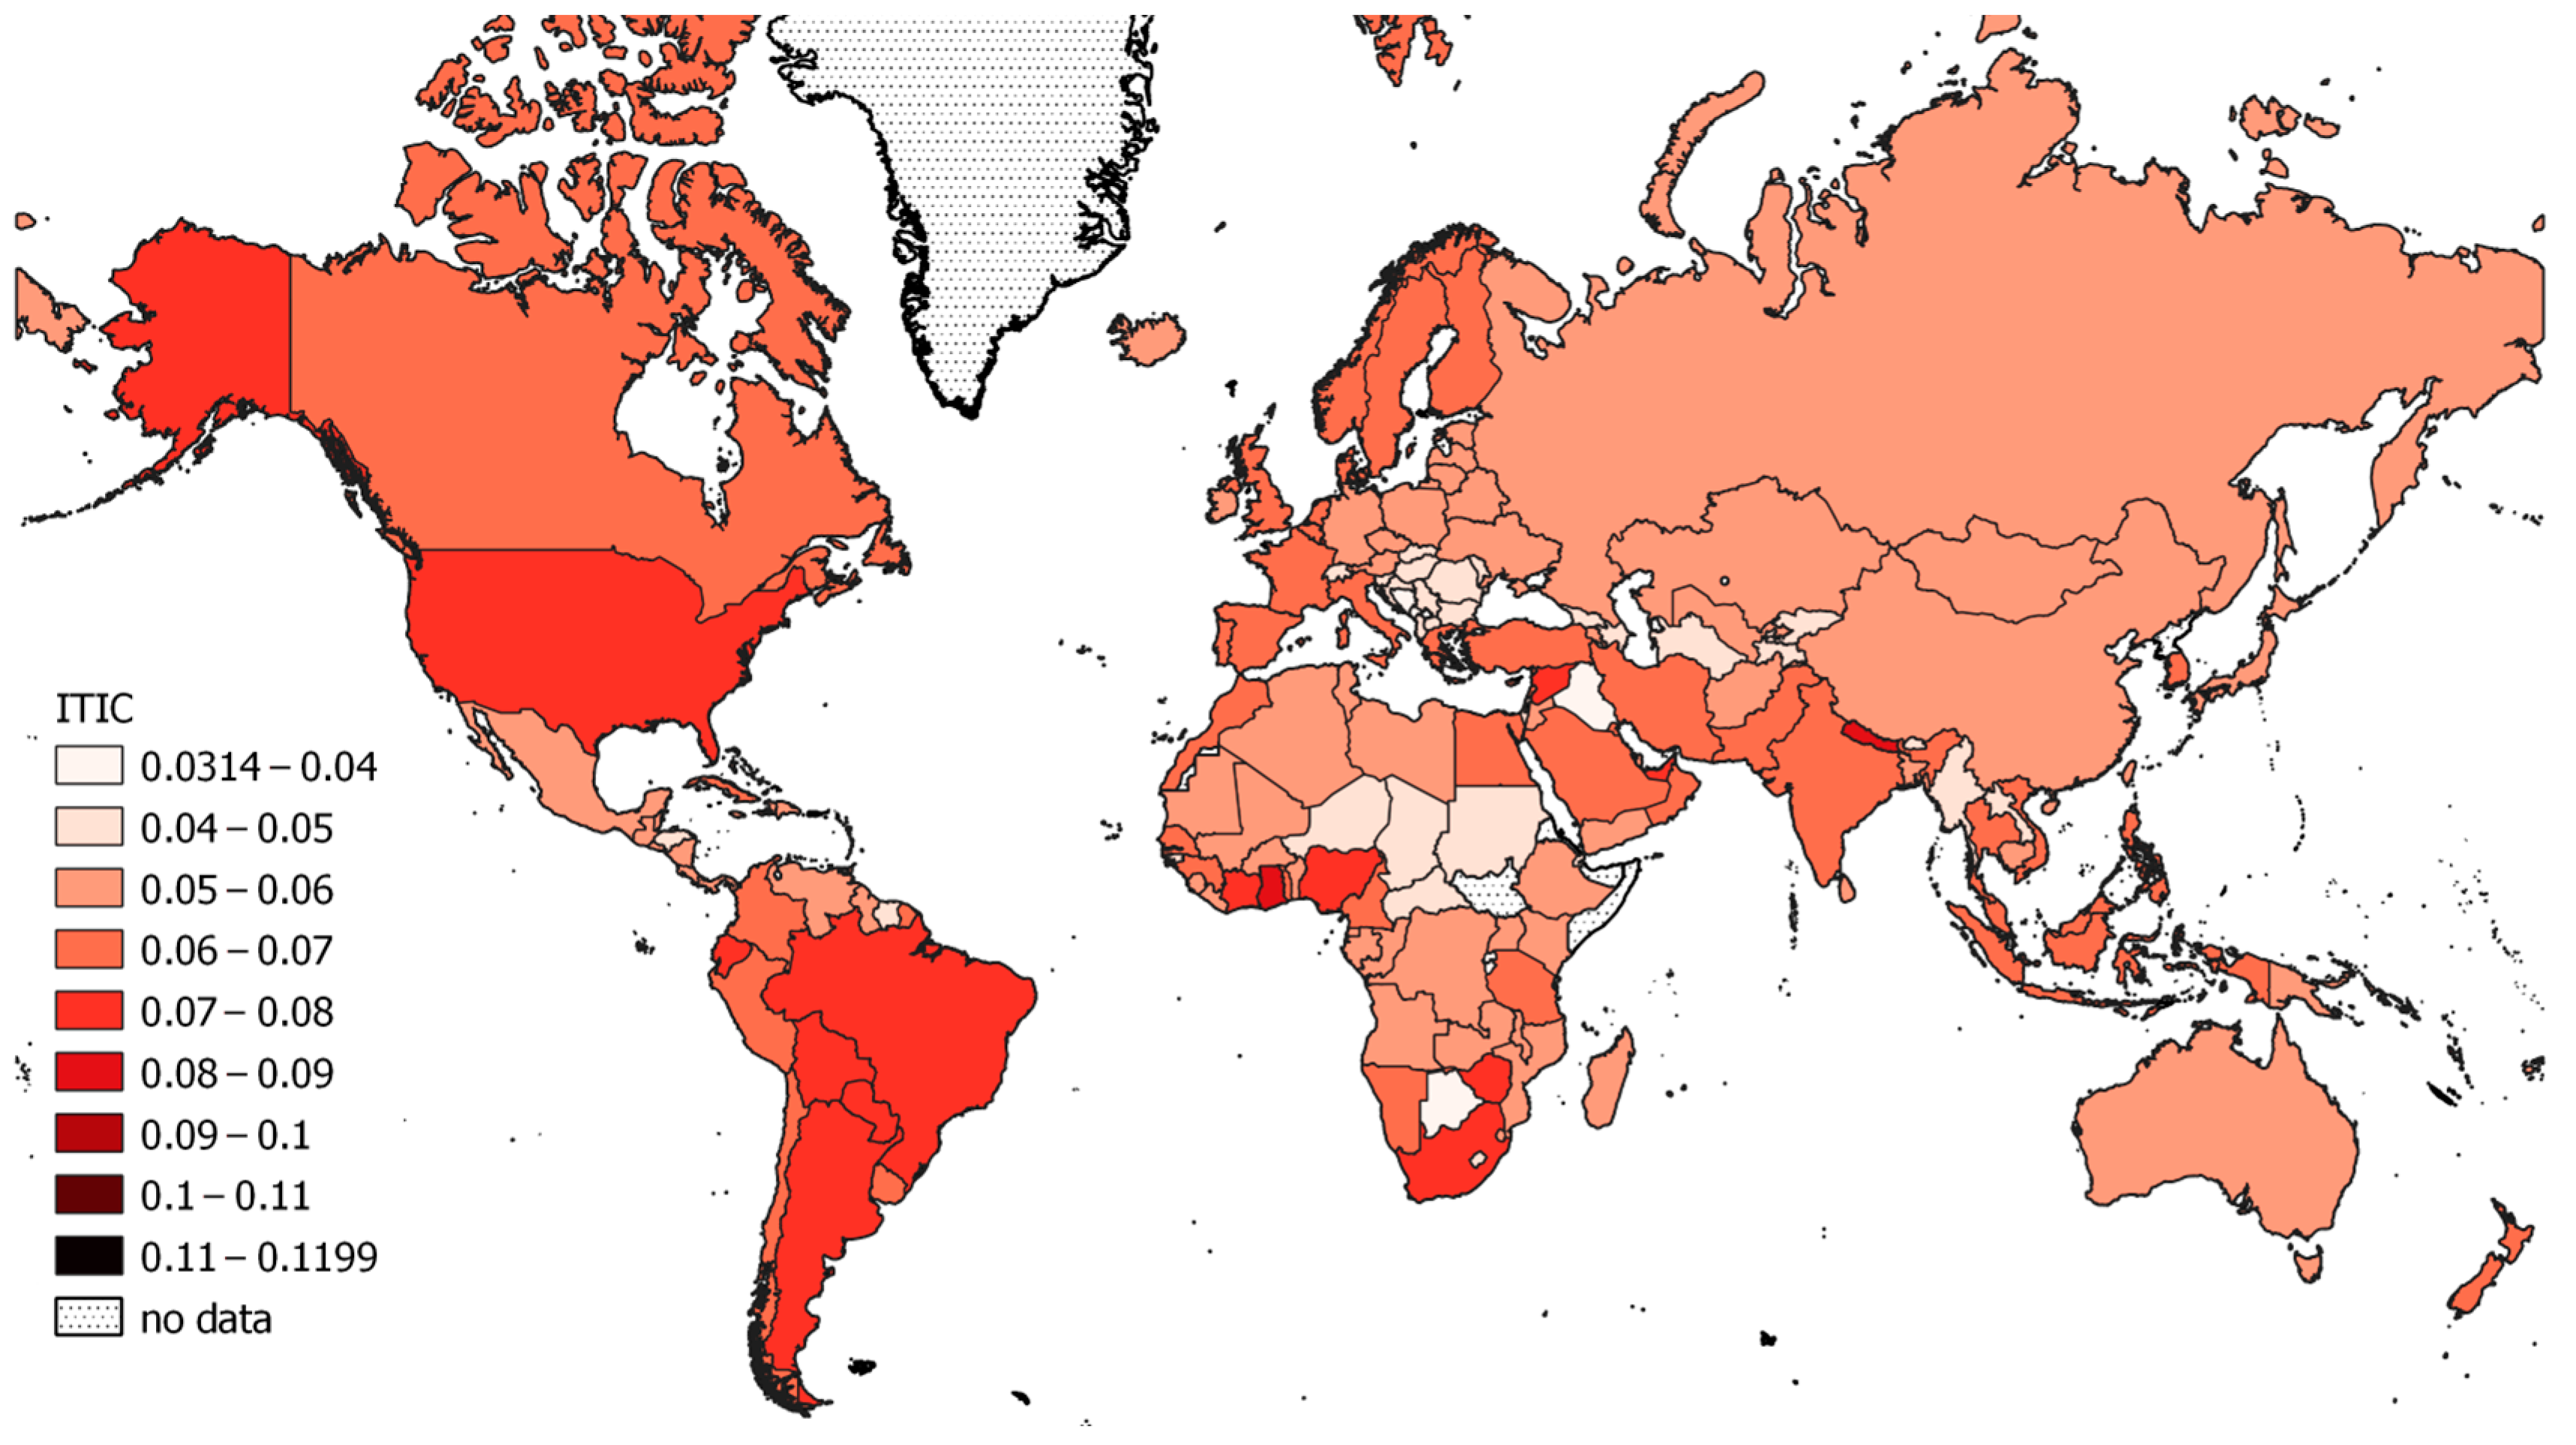
The OECD’s International Transport and Insurance Costs of Merchandise Trade data are used for estimating the average shipping costs of merchandise trade for almost all the countries of the world. The map in
Figure 5 shows the average export shipping cost across all the commodity categories. Countries with a darker colour are experiencing higher costs to export their produce to their customers while for those with lighter colours, the cost to export is lower.
When assessing the country performance regarding this metric, it must be taken into account that it is influenced both by the countries that a particular exporter is actually trading with and by the type of transportation that the exports of that country require.
In
Figure 5, the landlocked countries are excluded from the maps to avoid misinterpretation and because these countries fall out of the scope of this research. The data reveal that the shipping costs are rather uniform with minor regional differences between the countries. The geography and the trade patterns are the main determinants of these costs.
The importance of different maritime trades for countries varies, and some are expected to lose importance, while others will gain importance. To allow presenting data in a more granular way, the OECD International Transport and Insurance Costs of Merchandise Trade data were split into three types of maritime trade.
The split was conducted by determining the major type of trade for each of the 1222 UN Comtrade H3 level 4 commodity classification categories. A commodity would be assigned to a particular trade if more than 50% of it would be transported by that maritime trade. The cost for transportation of that category in the OECD International Transport and Insurance Costs of Merchandise Trade data would then be taken into account for calculating the country averages for each of the three types of trades: (1) container; (2) dry bulk and break bulk; and (3) liquid bulk.
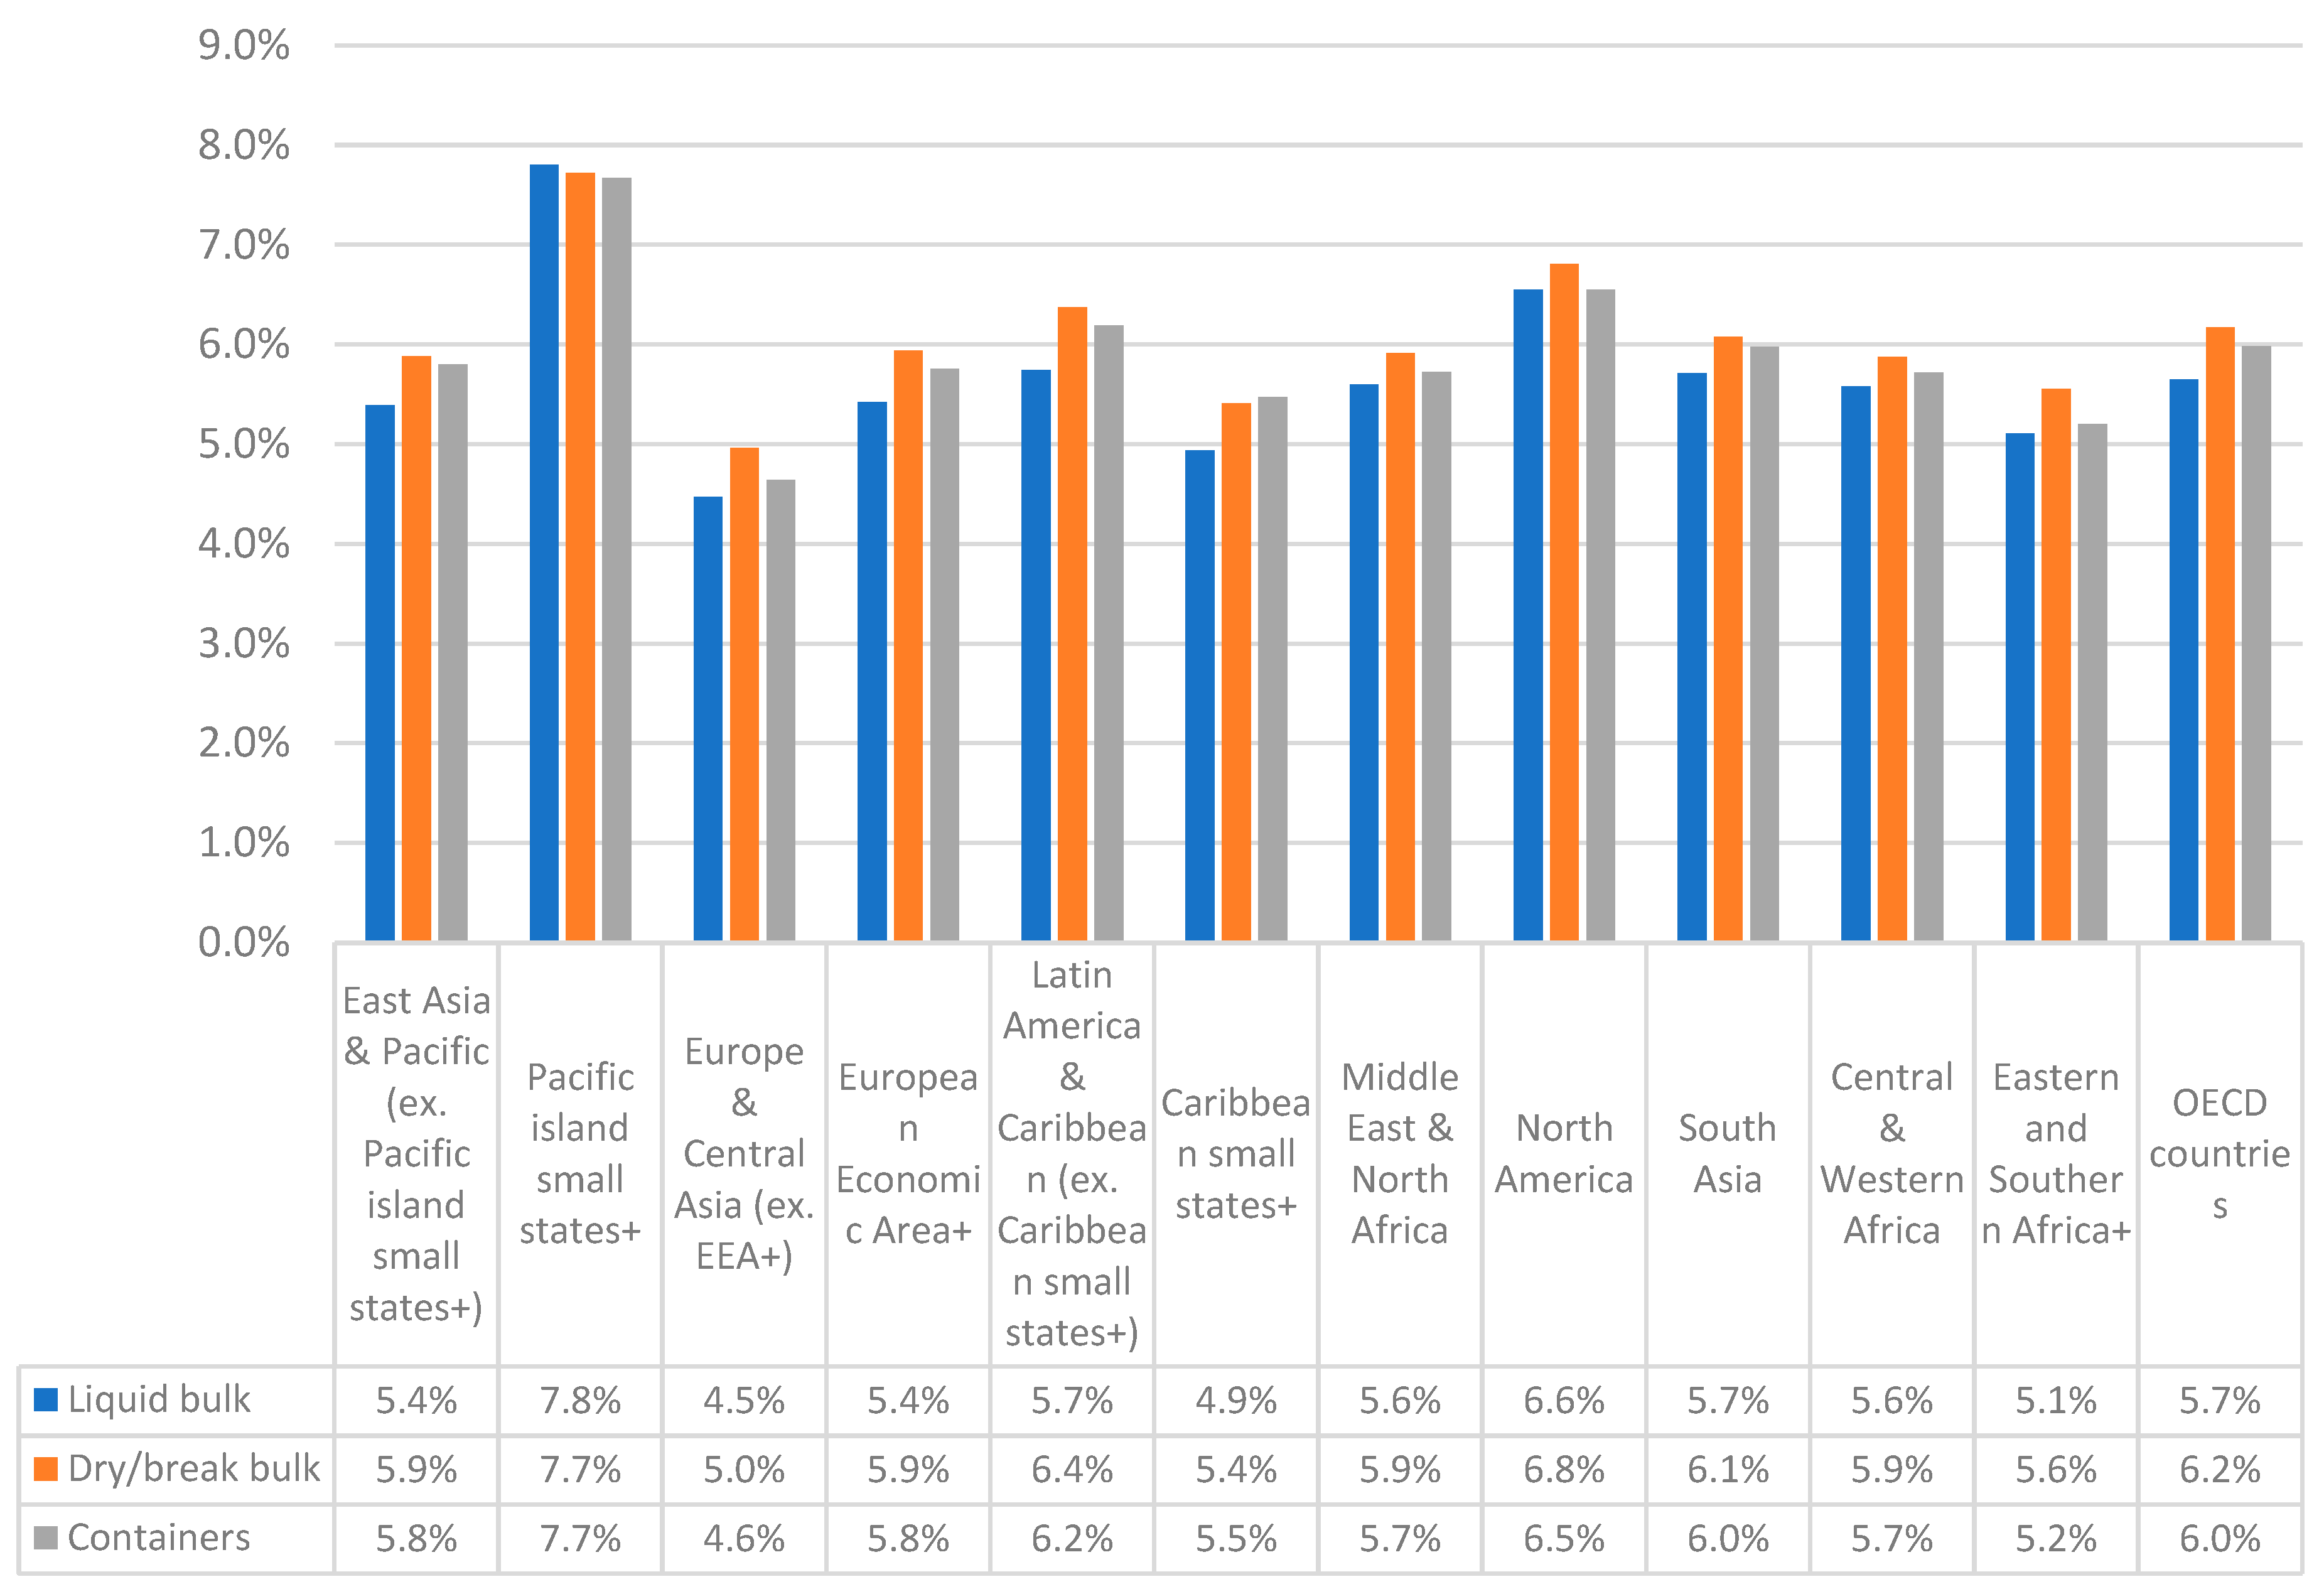
This approach allowed producing a split of International Transport and Insurance Costs of Merchandise Trade. When comparing the results for each of the trades and amongst regions in
Figure 6, we see that the results are rather uniform between regions, but also within each trade. The cost differences between countries can be well explained with the geography and their main trading partners. Liquid bulk trade has the lowest cost with the average of 5.3% from cost, insurance and freight (CIF)—then comes the container trade with the average of 5.6% and then dry bulk trade with the average of 5.8%.
4.2. Port-Level Data
In this section, we apply the framework to assess how the ports are performing with a view on port performance at a global level. For port-level assessment, we base ourselves on the developed port-level indicator framework, shown above in
Table 2, with its five areas of interest.
We review and compare the performance of the ports in the various components of the port-level data framework. We always use a global dataset that includes all available ports.
4.2.1. Connectivity and Accessibility
Liner Shipping Connectivity Index Components
This section of the data framework is based on liner shipping connectivity index (LSCI) components, as developed by UNCTAD. Here, we do not use the same data sources that the UNCTAD calculation does because their sources are not public and available to us, but we do our best to include data that describe the same phenomena in as close of a manner as possible.
The LSCI components that are included in the data framework are the following:
The number of ship calls per week in the port;
The annual deployed capacity in the port in TEU;
The number of liner shipping companies that provide services from and to the port;
The average size in TEU of the ships deployed;
The number of other ports that are connected to the port through direct shipping services.
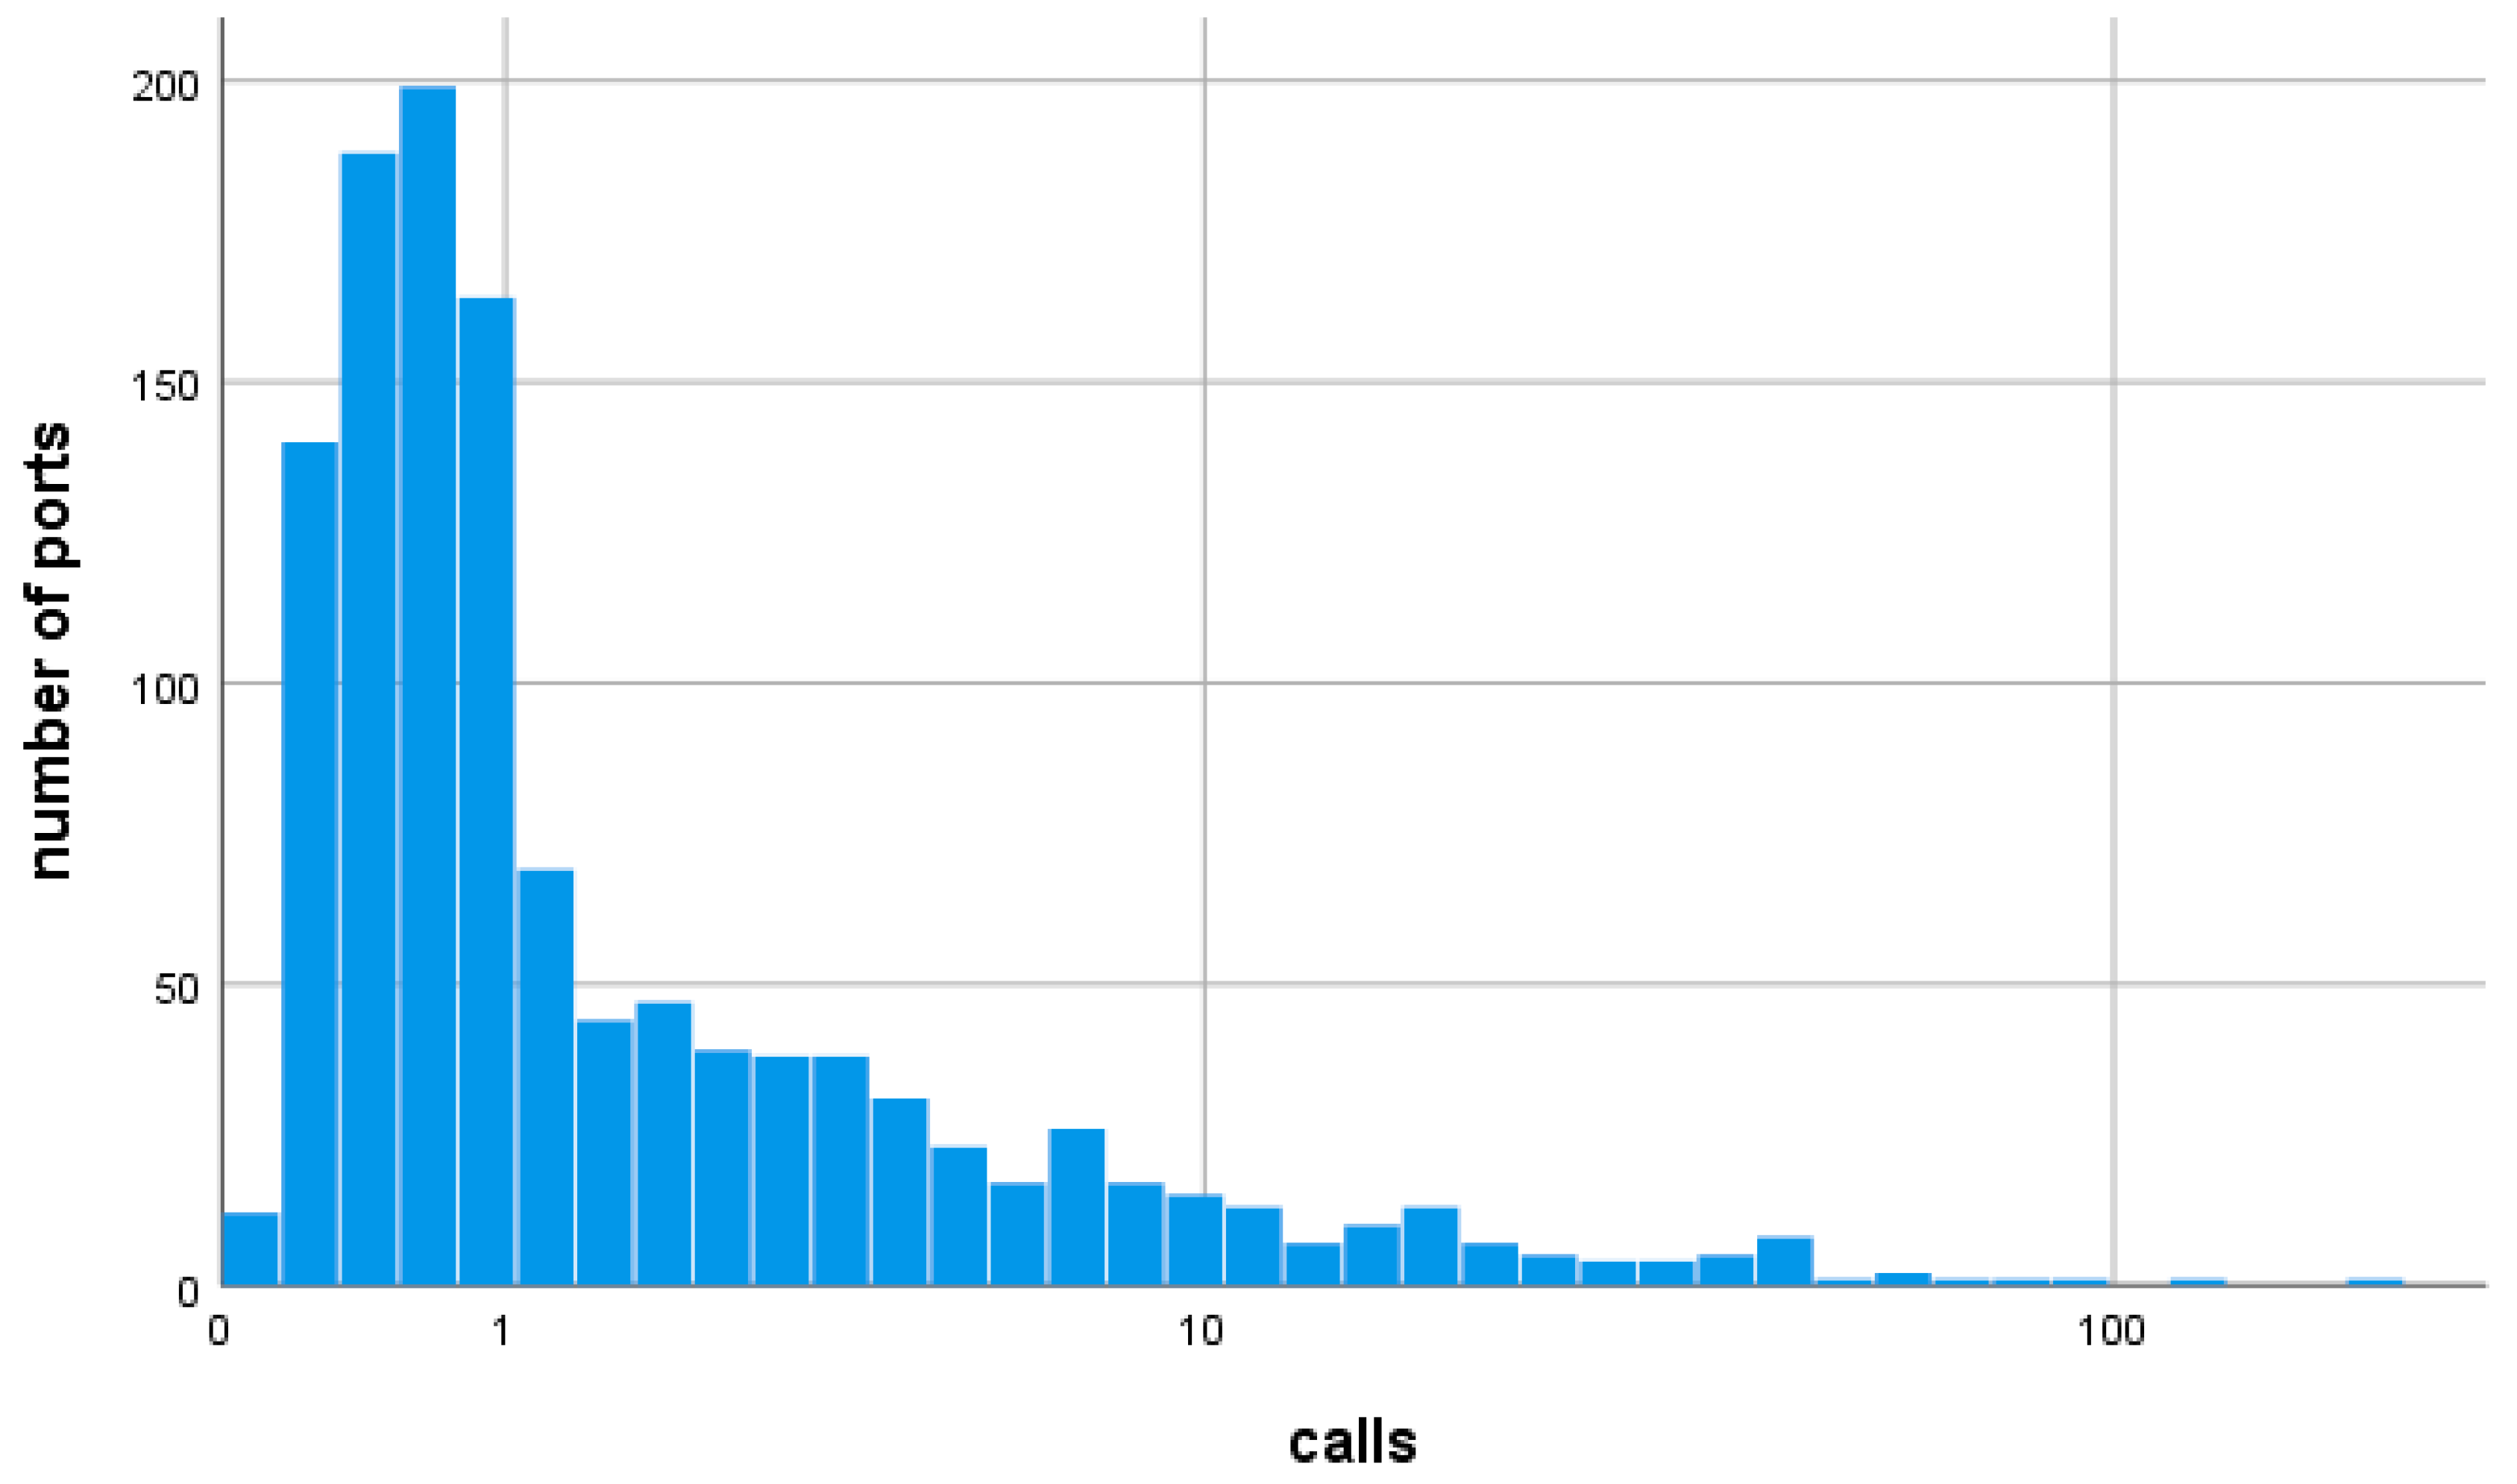
The average number of ship calls per week is a component of the LSCI and included in the maritime data framework. The distribution of the number of ship calls per week in the MarineTraffic data is shown in
Figure 7, where the horizontal axis applies an exponential scale.
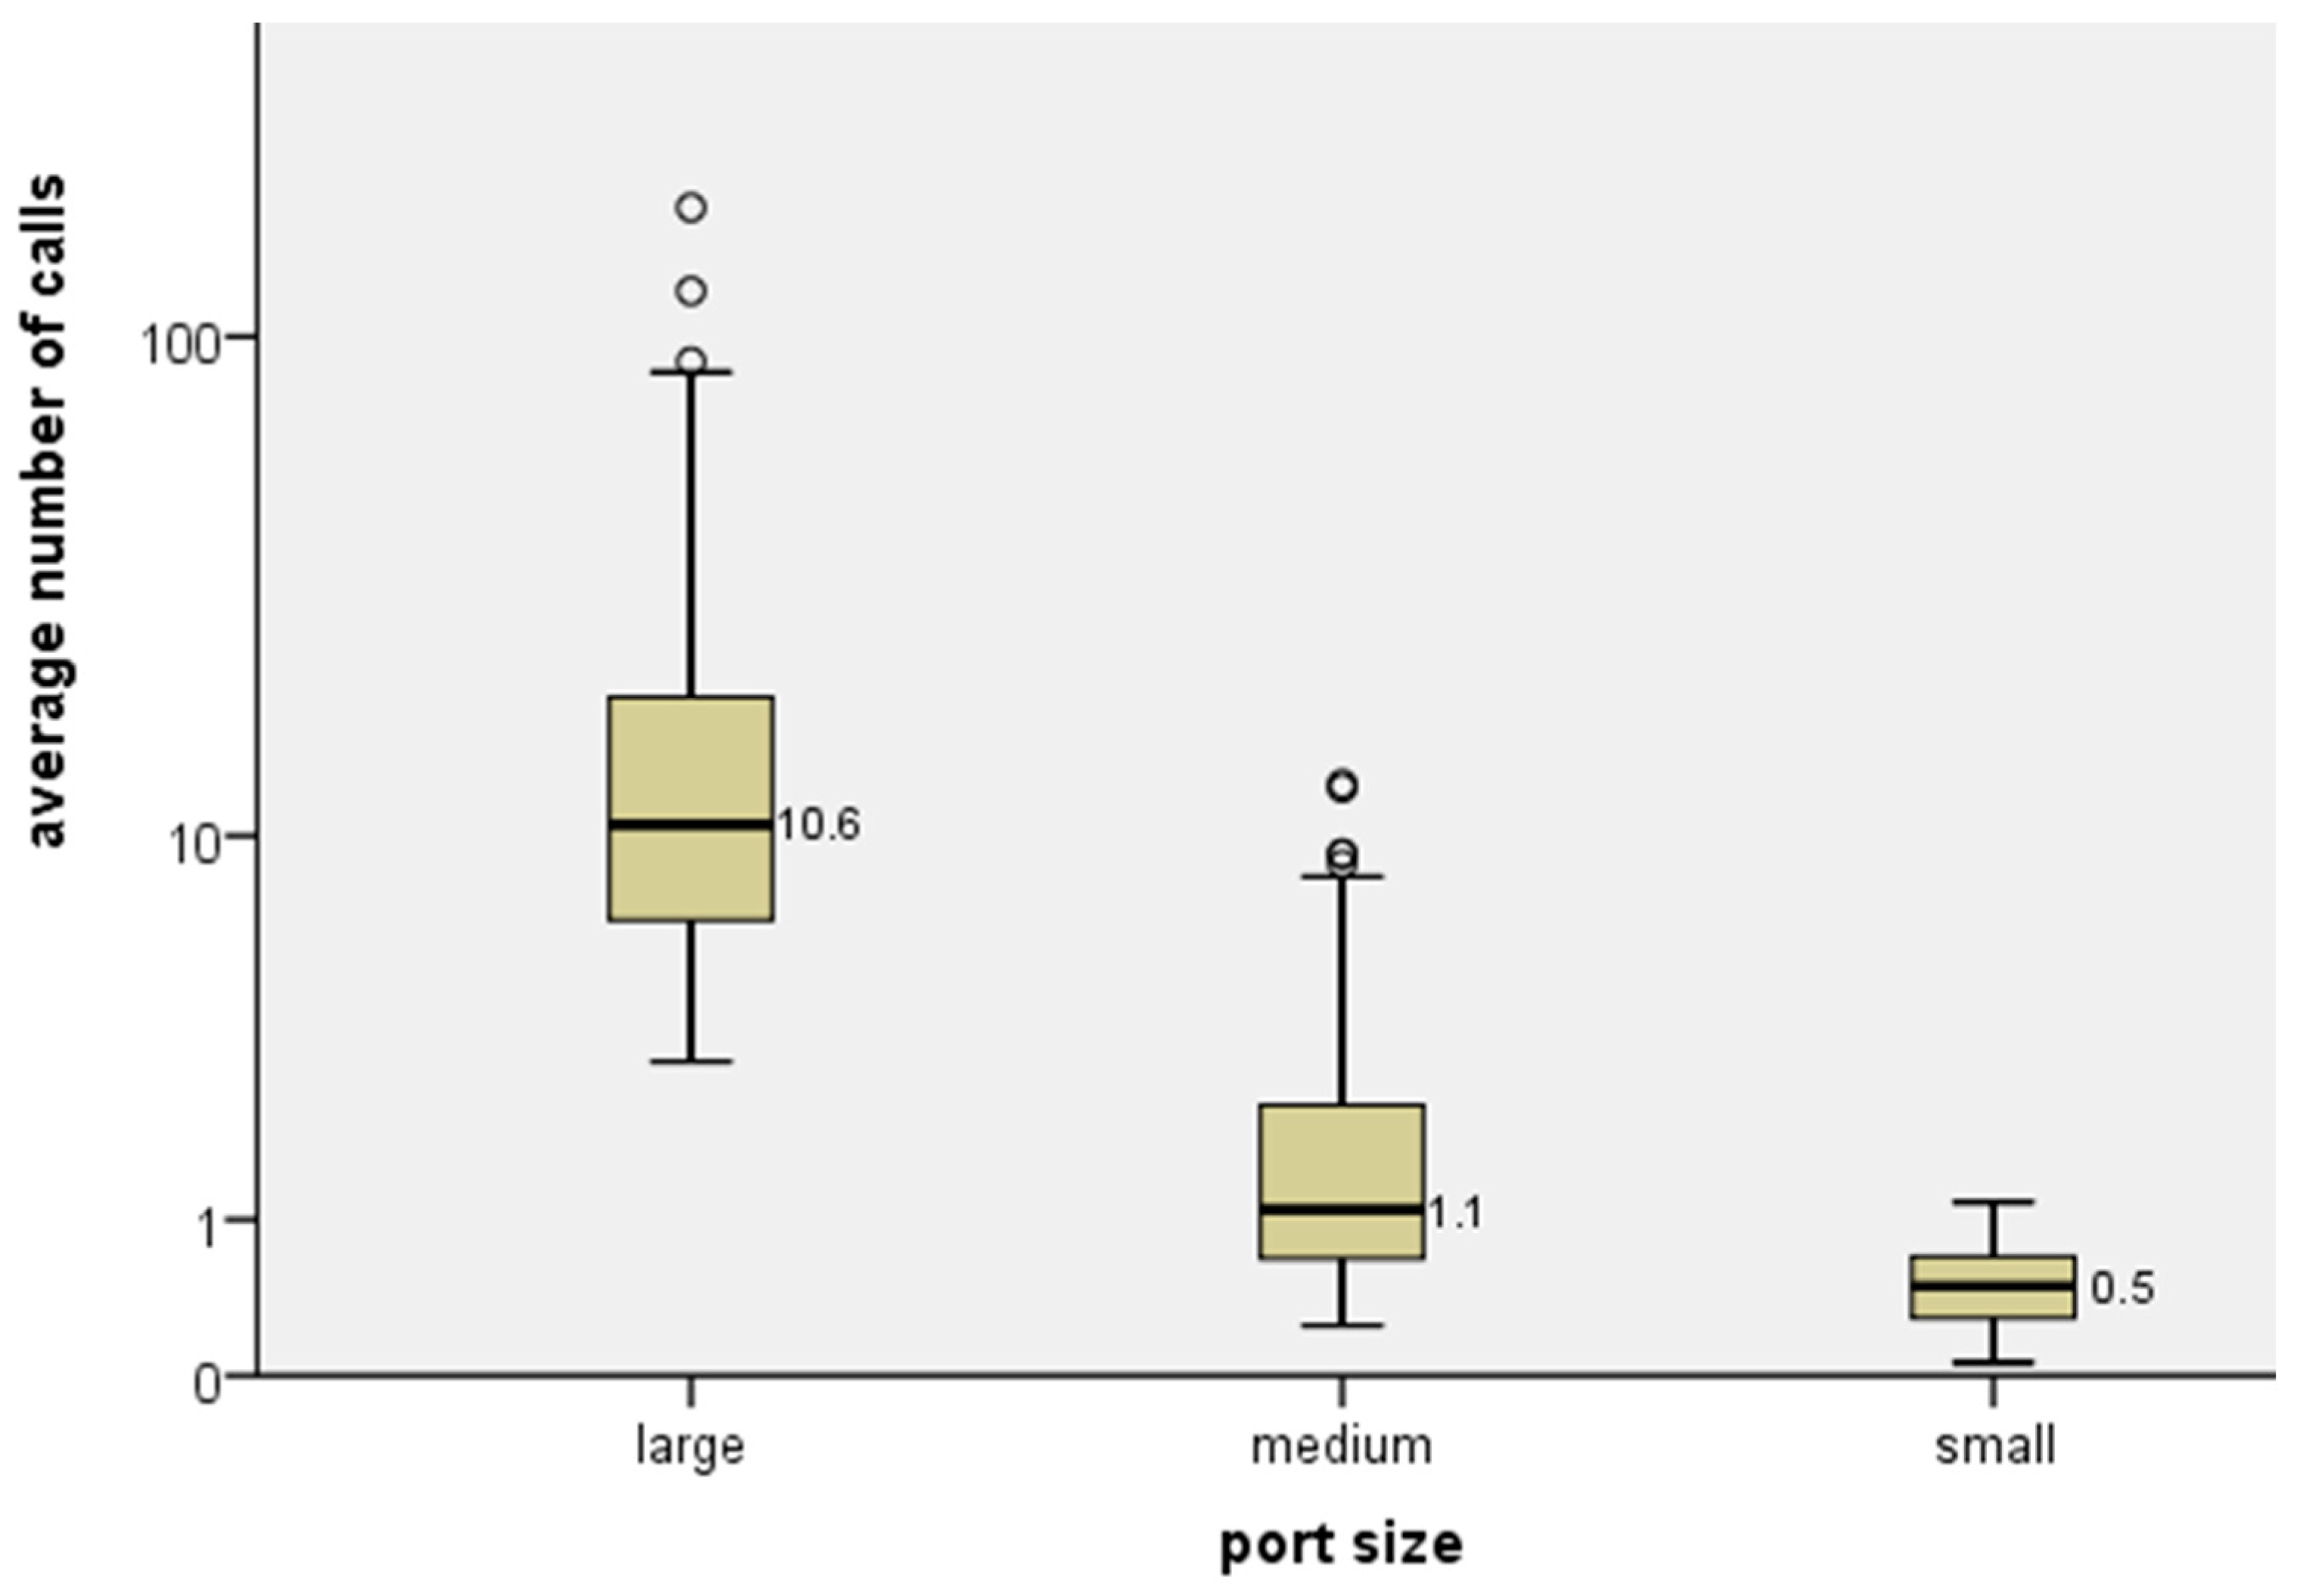
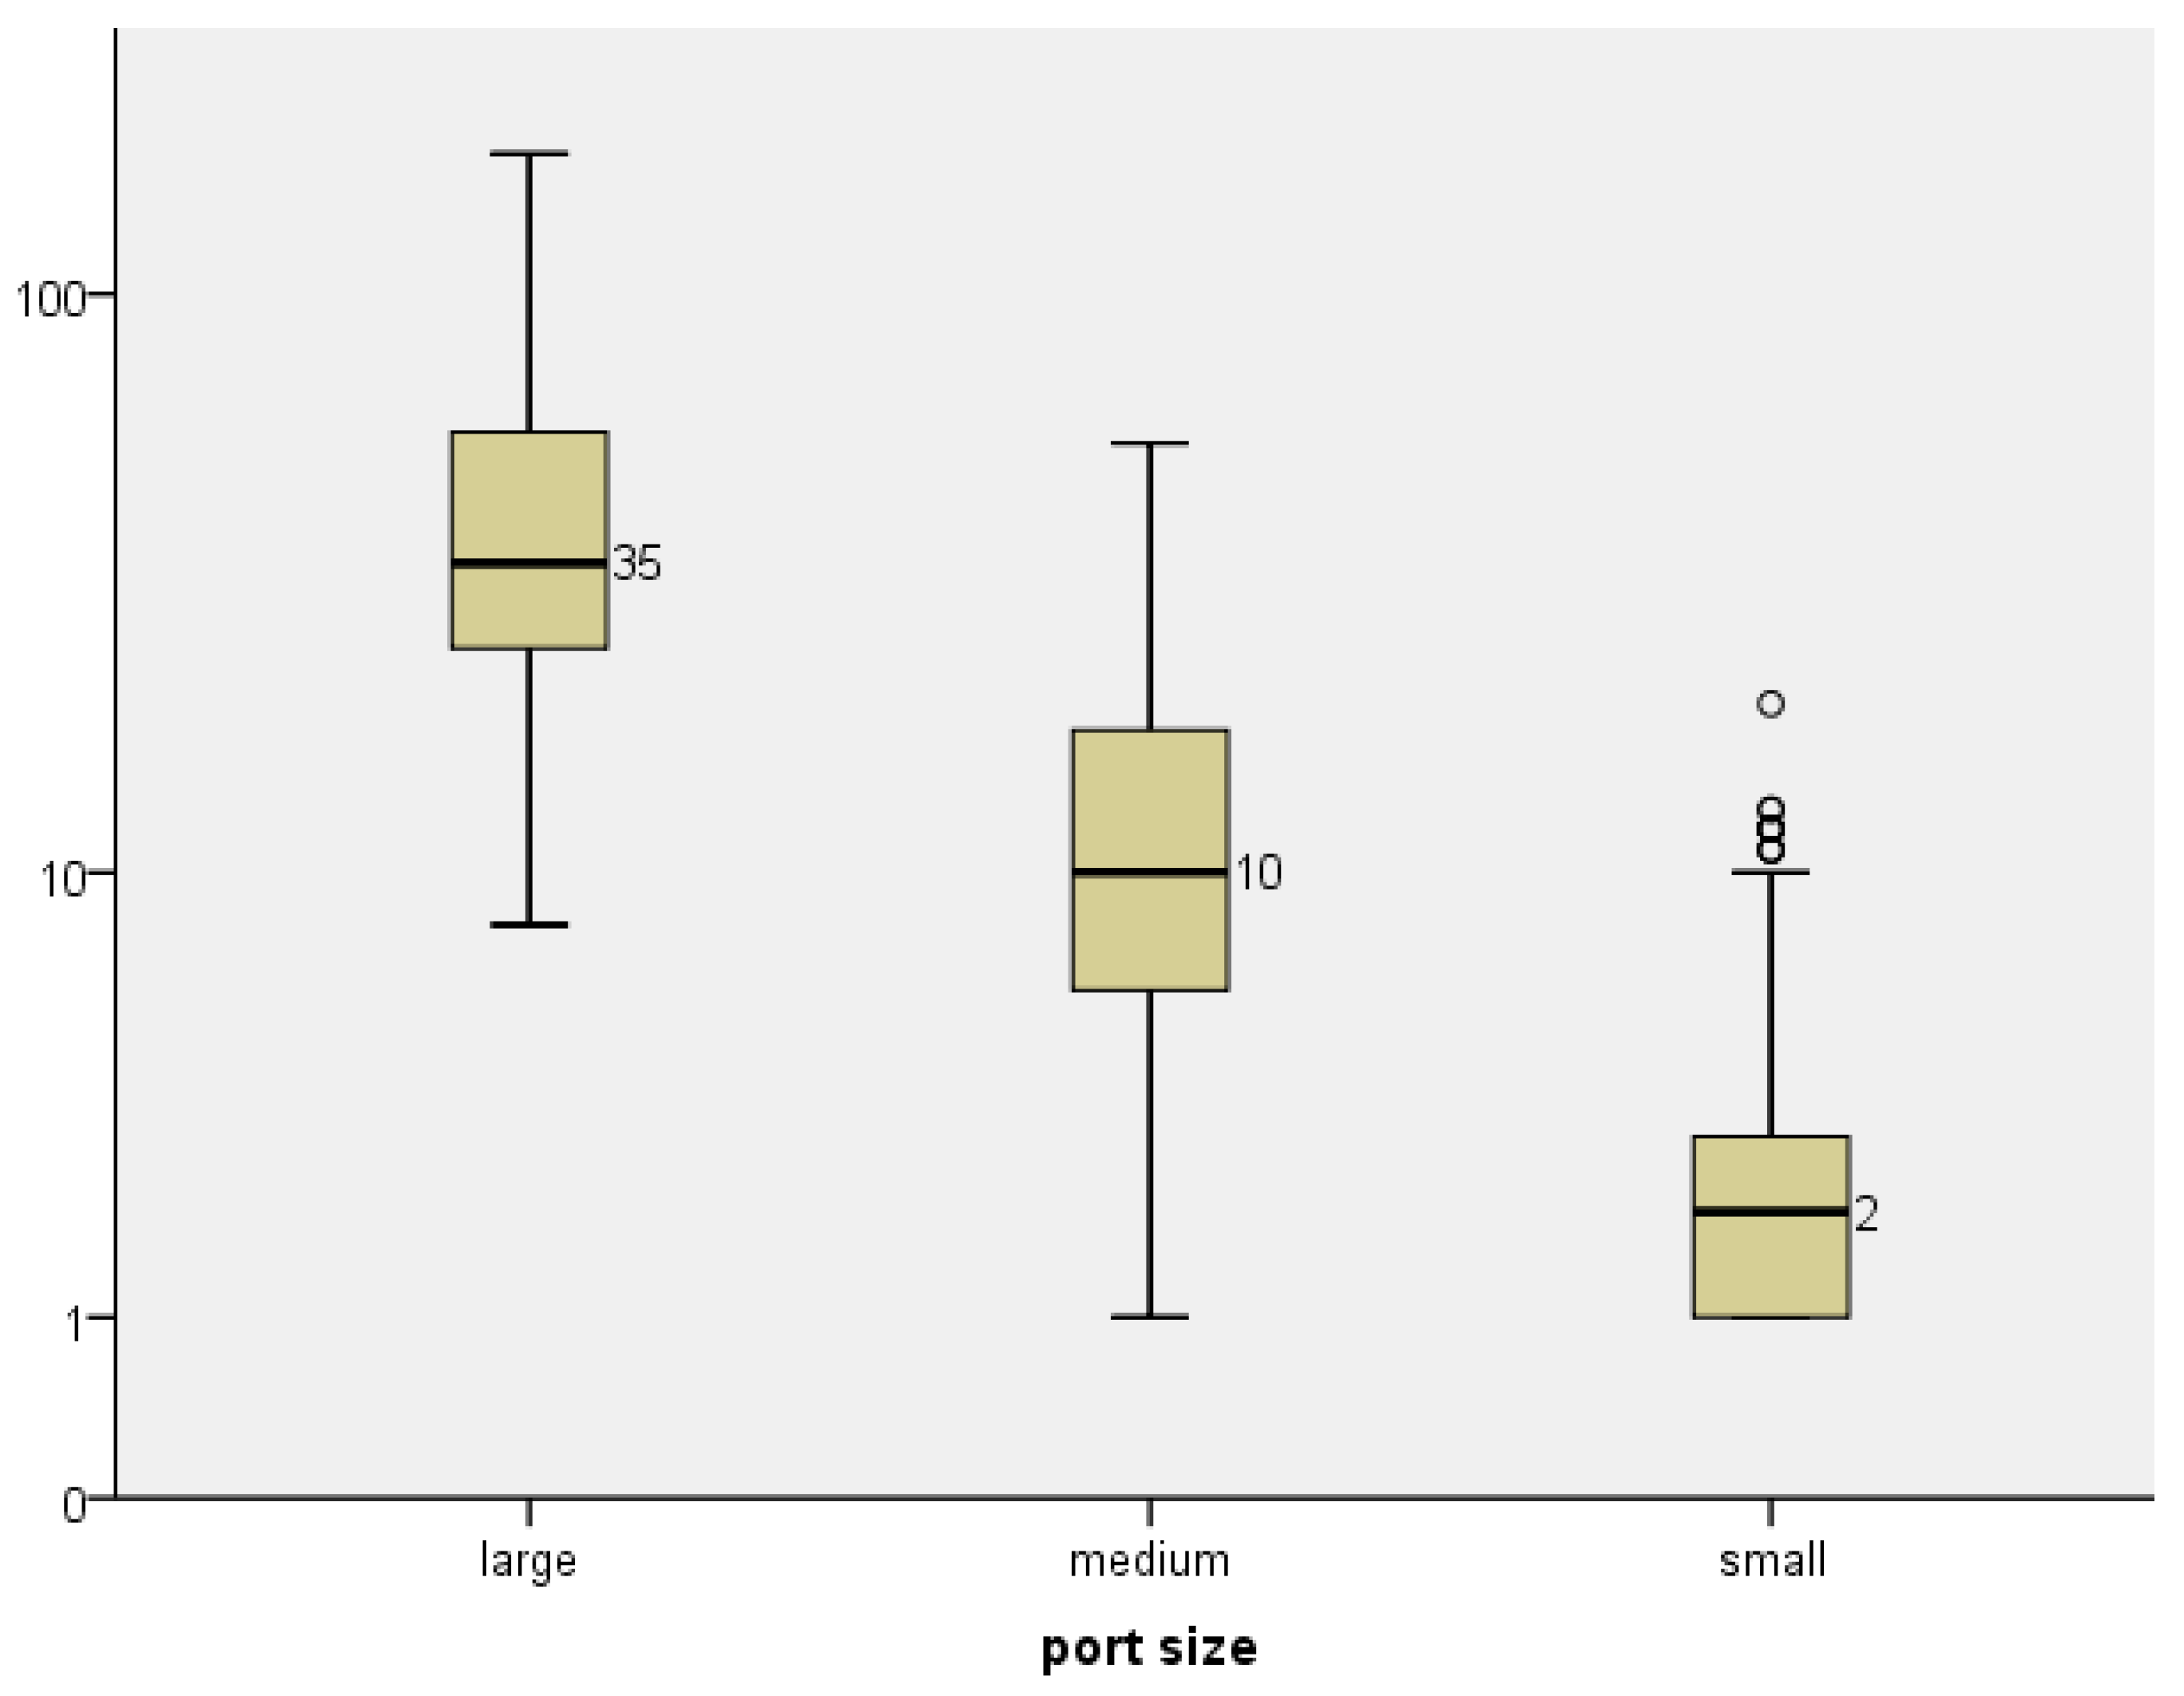
Assigning the port size categories based on the capacity that is offered by shipping lines at the port (for the purpose of this research, we defined that small ports are up to 10 k TEU/year, medium ports are up to 1 million TEU/year and large ports are above that), we see the ship call distribution in
Figure 8. This segmentation of the ports by the volume of offered capacity is also used further on in the paper. For small ports, the median number of calls per week is 0.5, while for medium-sized ports, it is 1.1, and for large ports, it is 10.6. When interpreting the boxplot, it must be noted that the vertical axis is exponential.
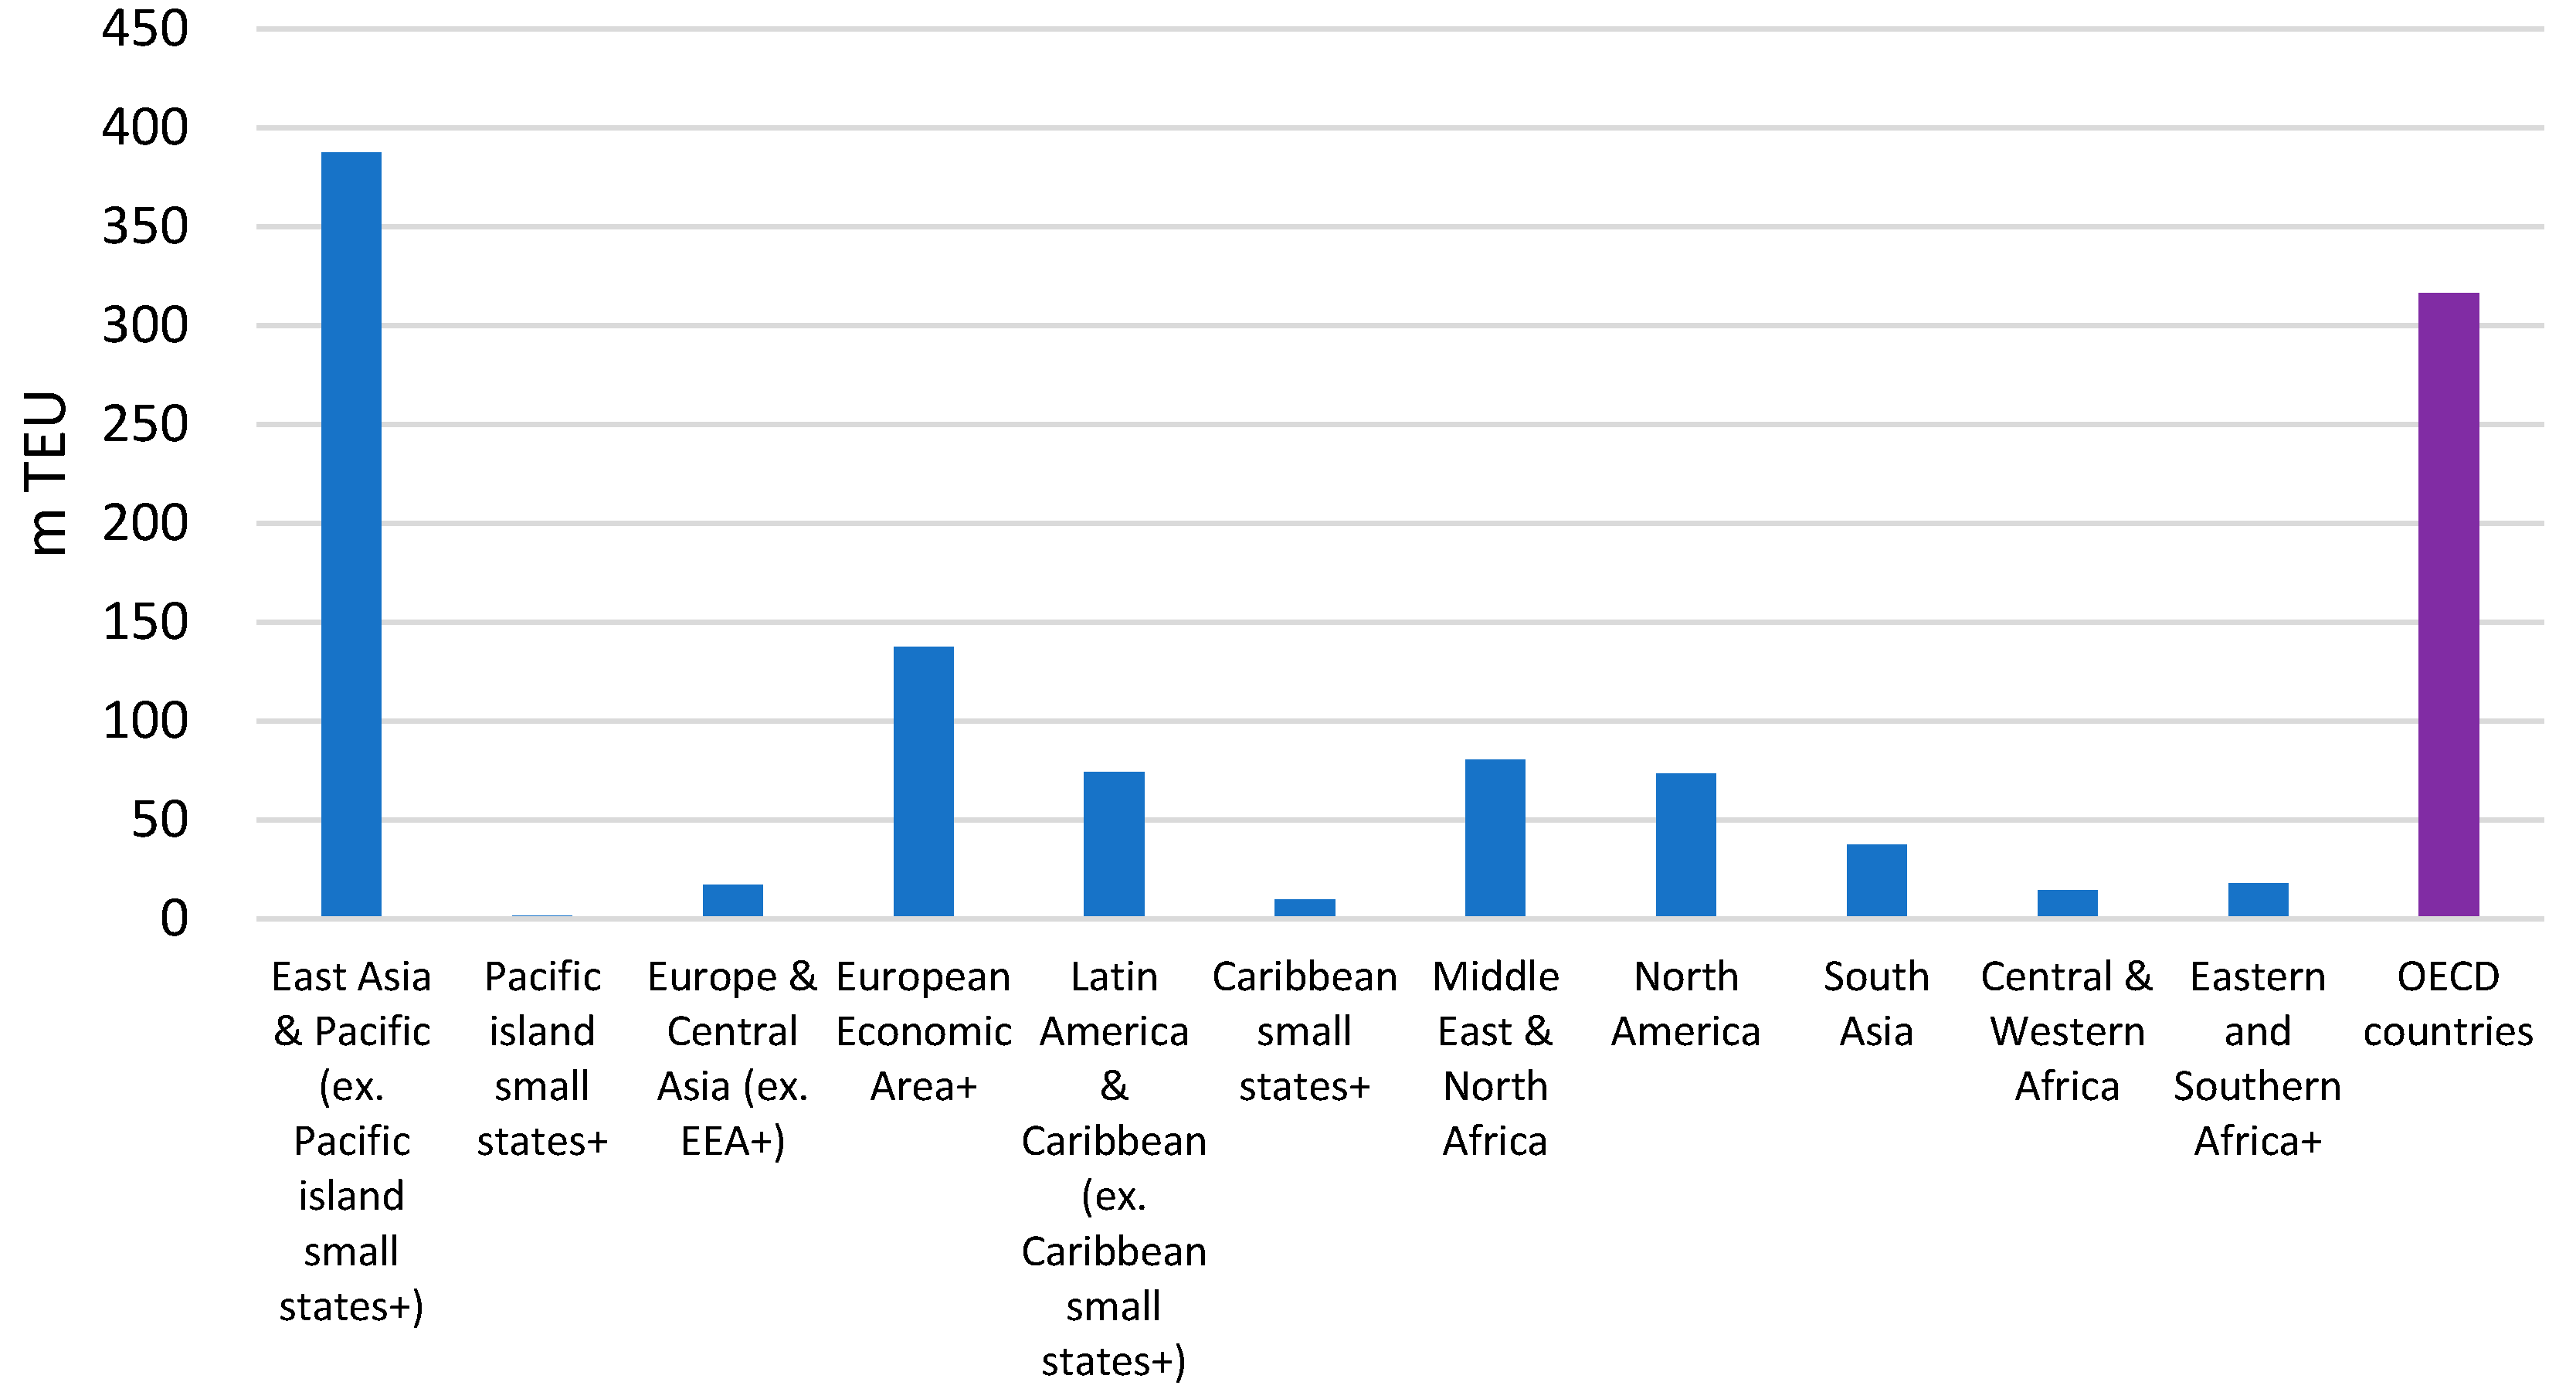
The total TEU carrying capacity of the ships deployed to the ports per region is shown in
Figure 9.
The number of liner shipping companies that provide services from and to the port is shown in
Figure 10. In small ports, it is common that there is only one shipping line calling at that port, while for medium-sized ports, the median number of operators is 12, and for big ports, the median is 70.
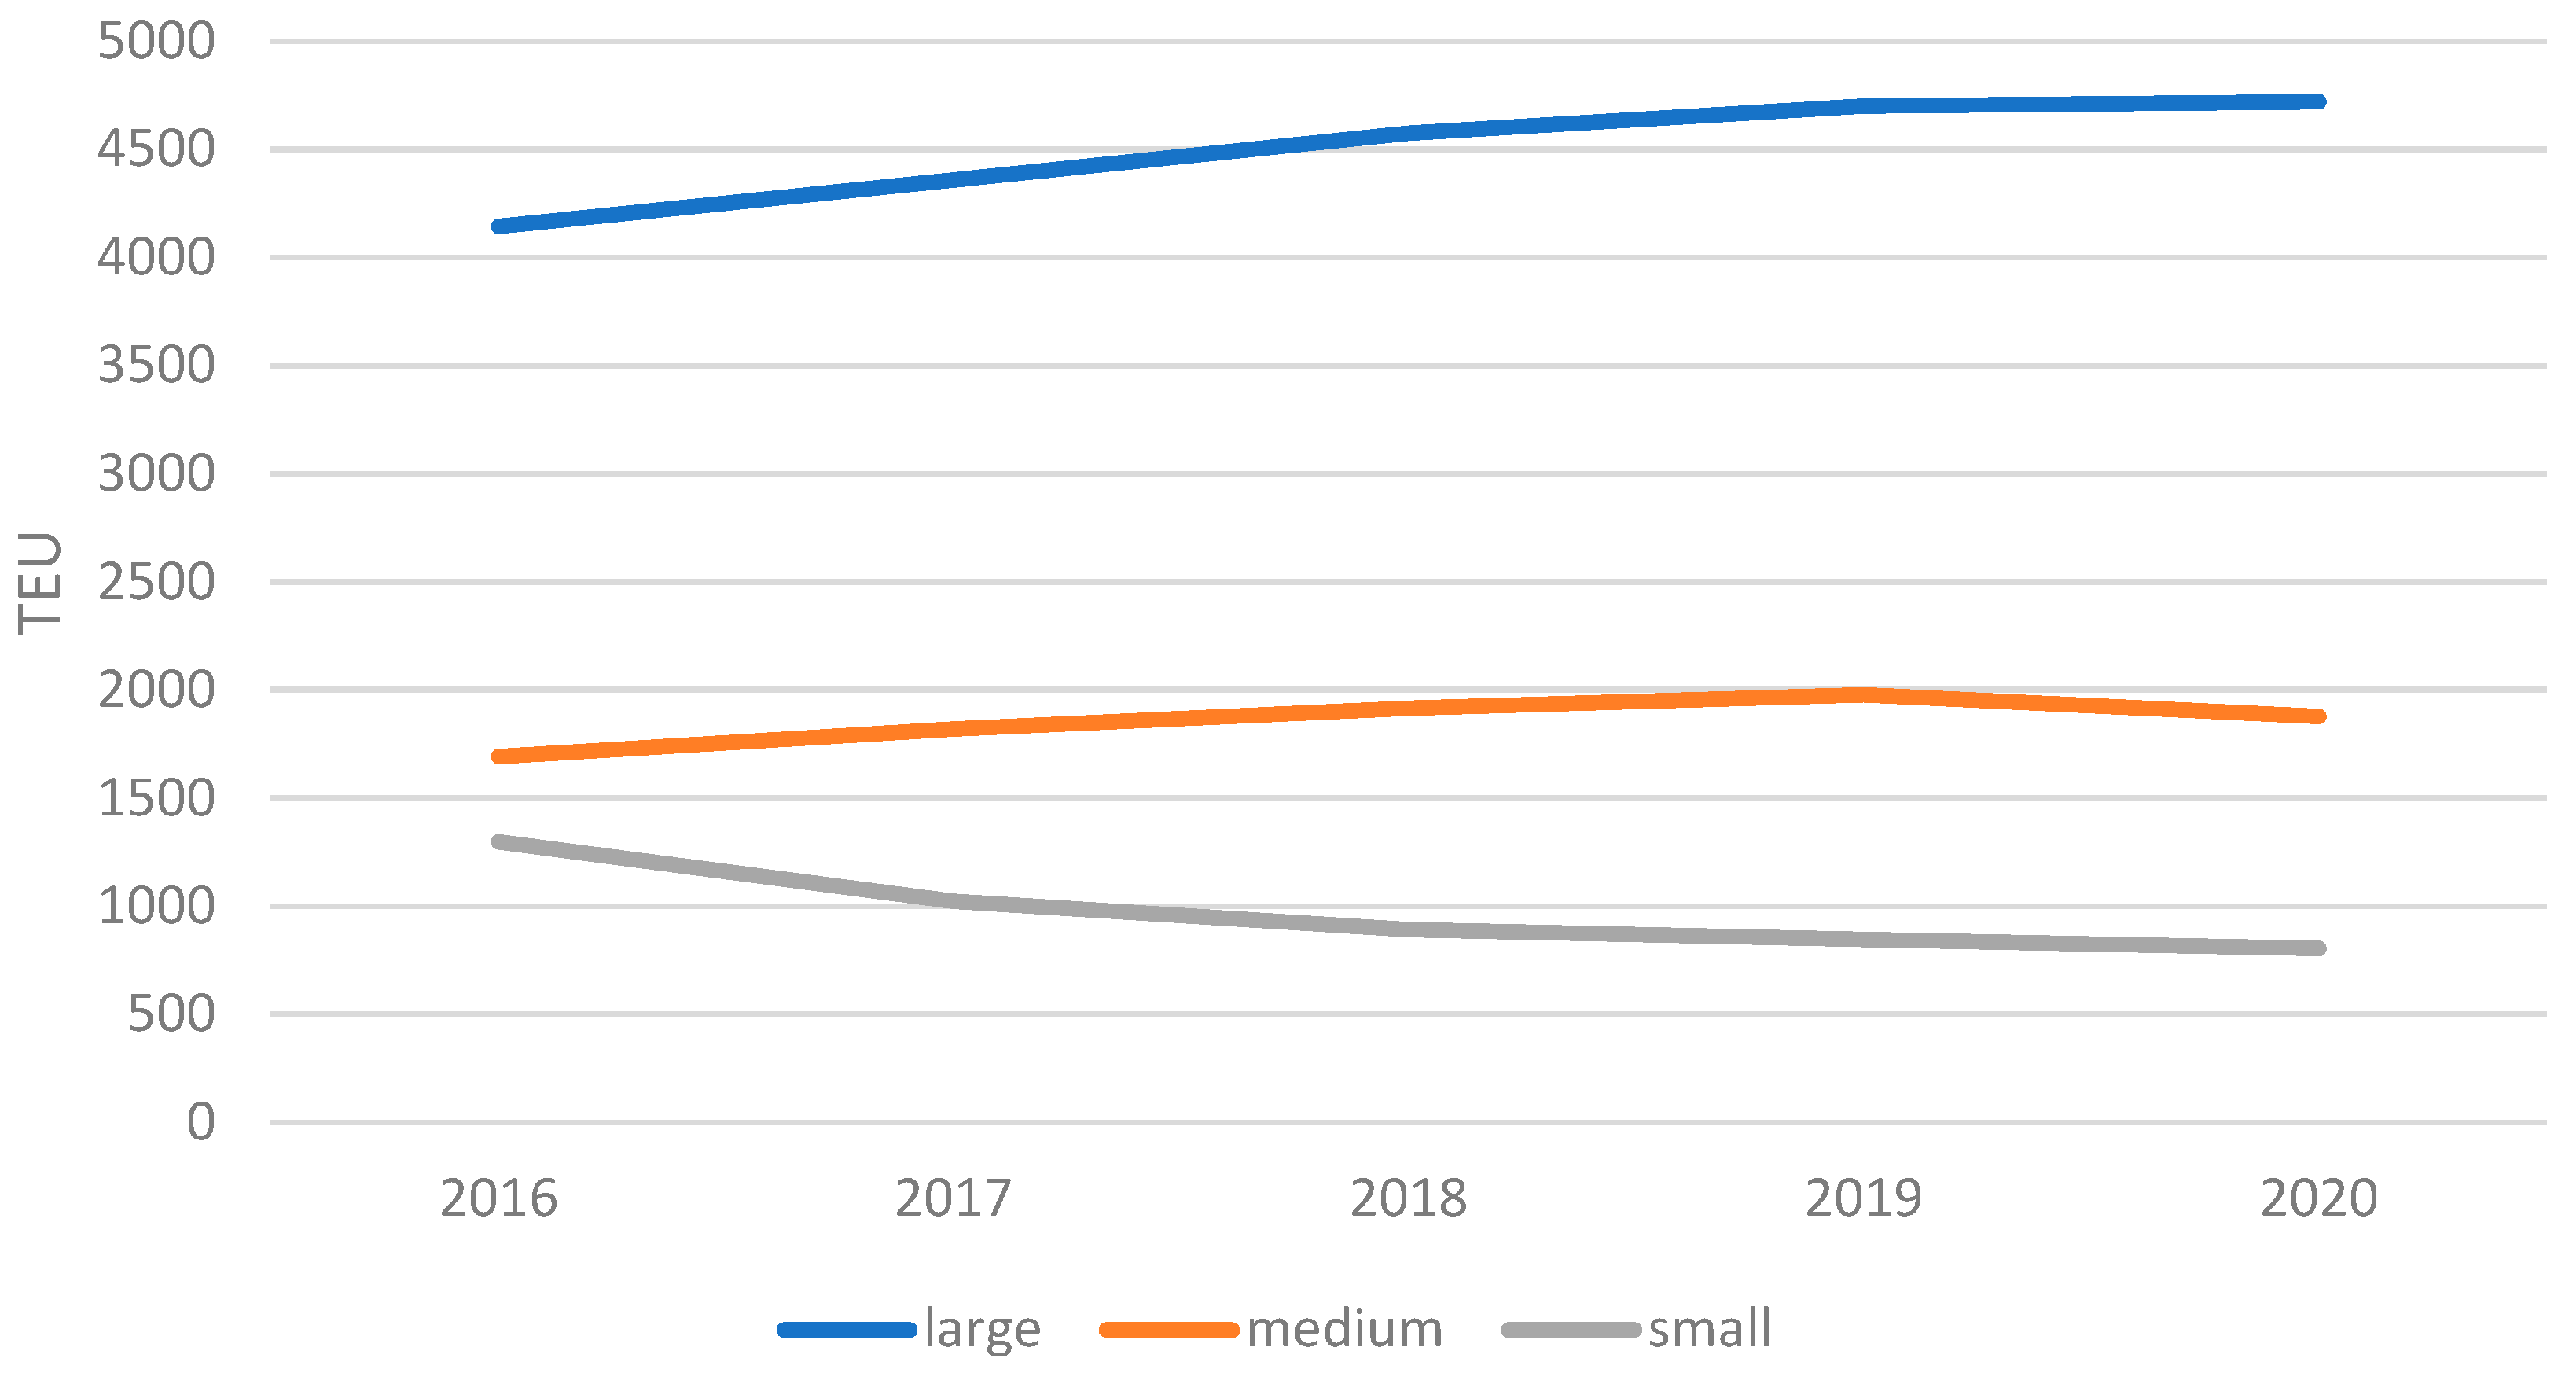
We observe big differences in the average ship size depending on the size of the port with larger container ships calling at larger ports, which is a characteristic of the hub-and-spoke model used in container shipping. The average container ship size has been on the rise since 2016 in large- and medium-sized ports (see
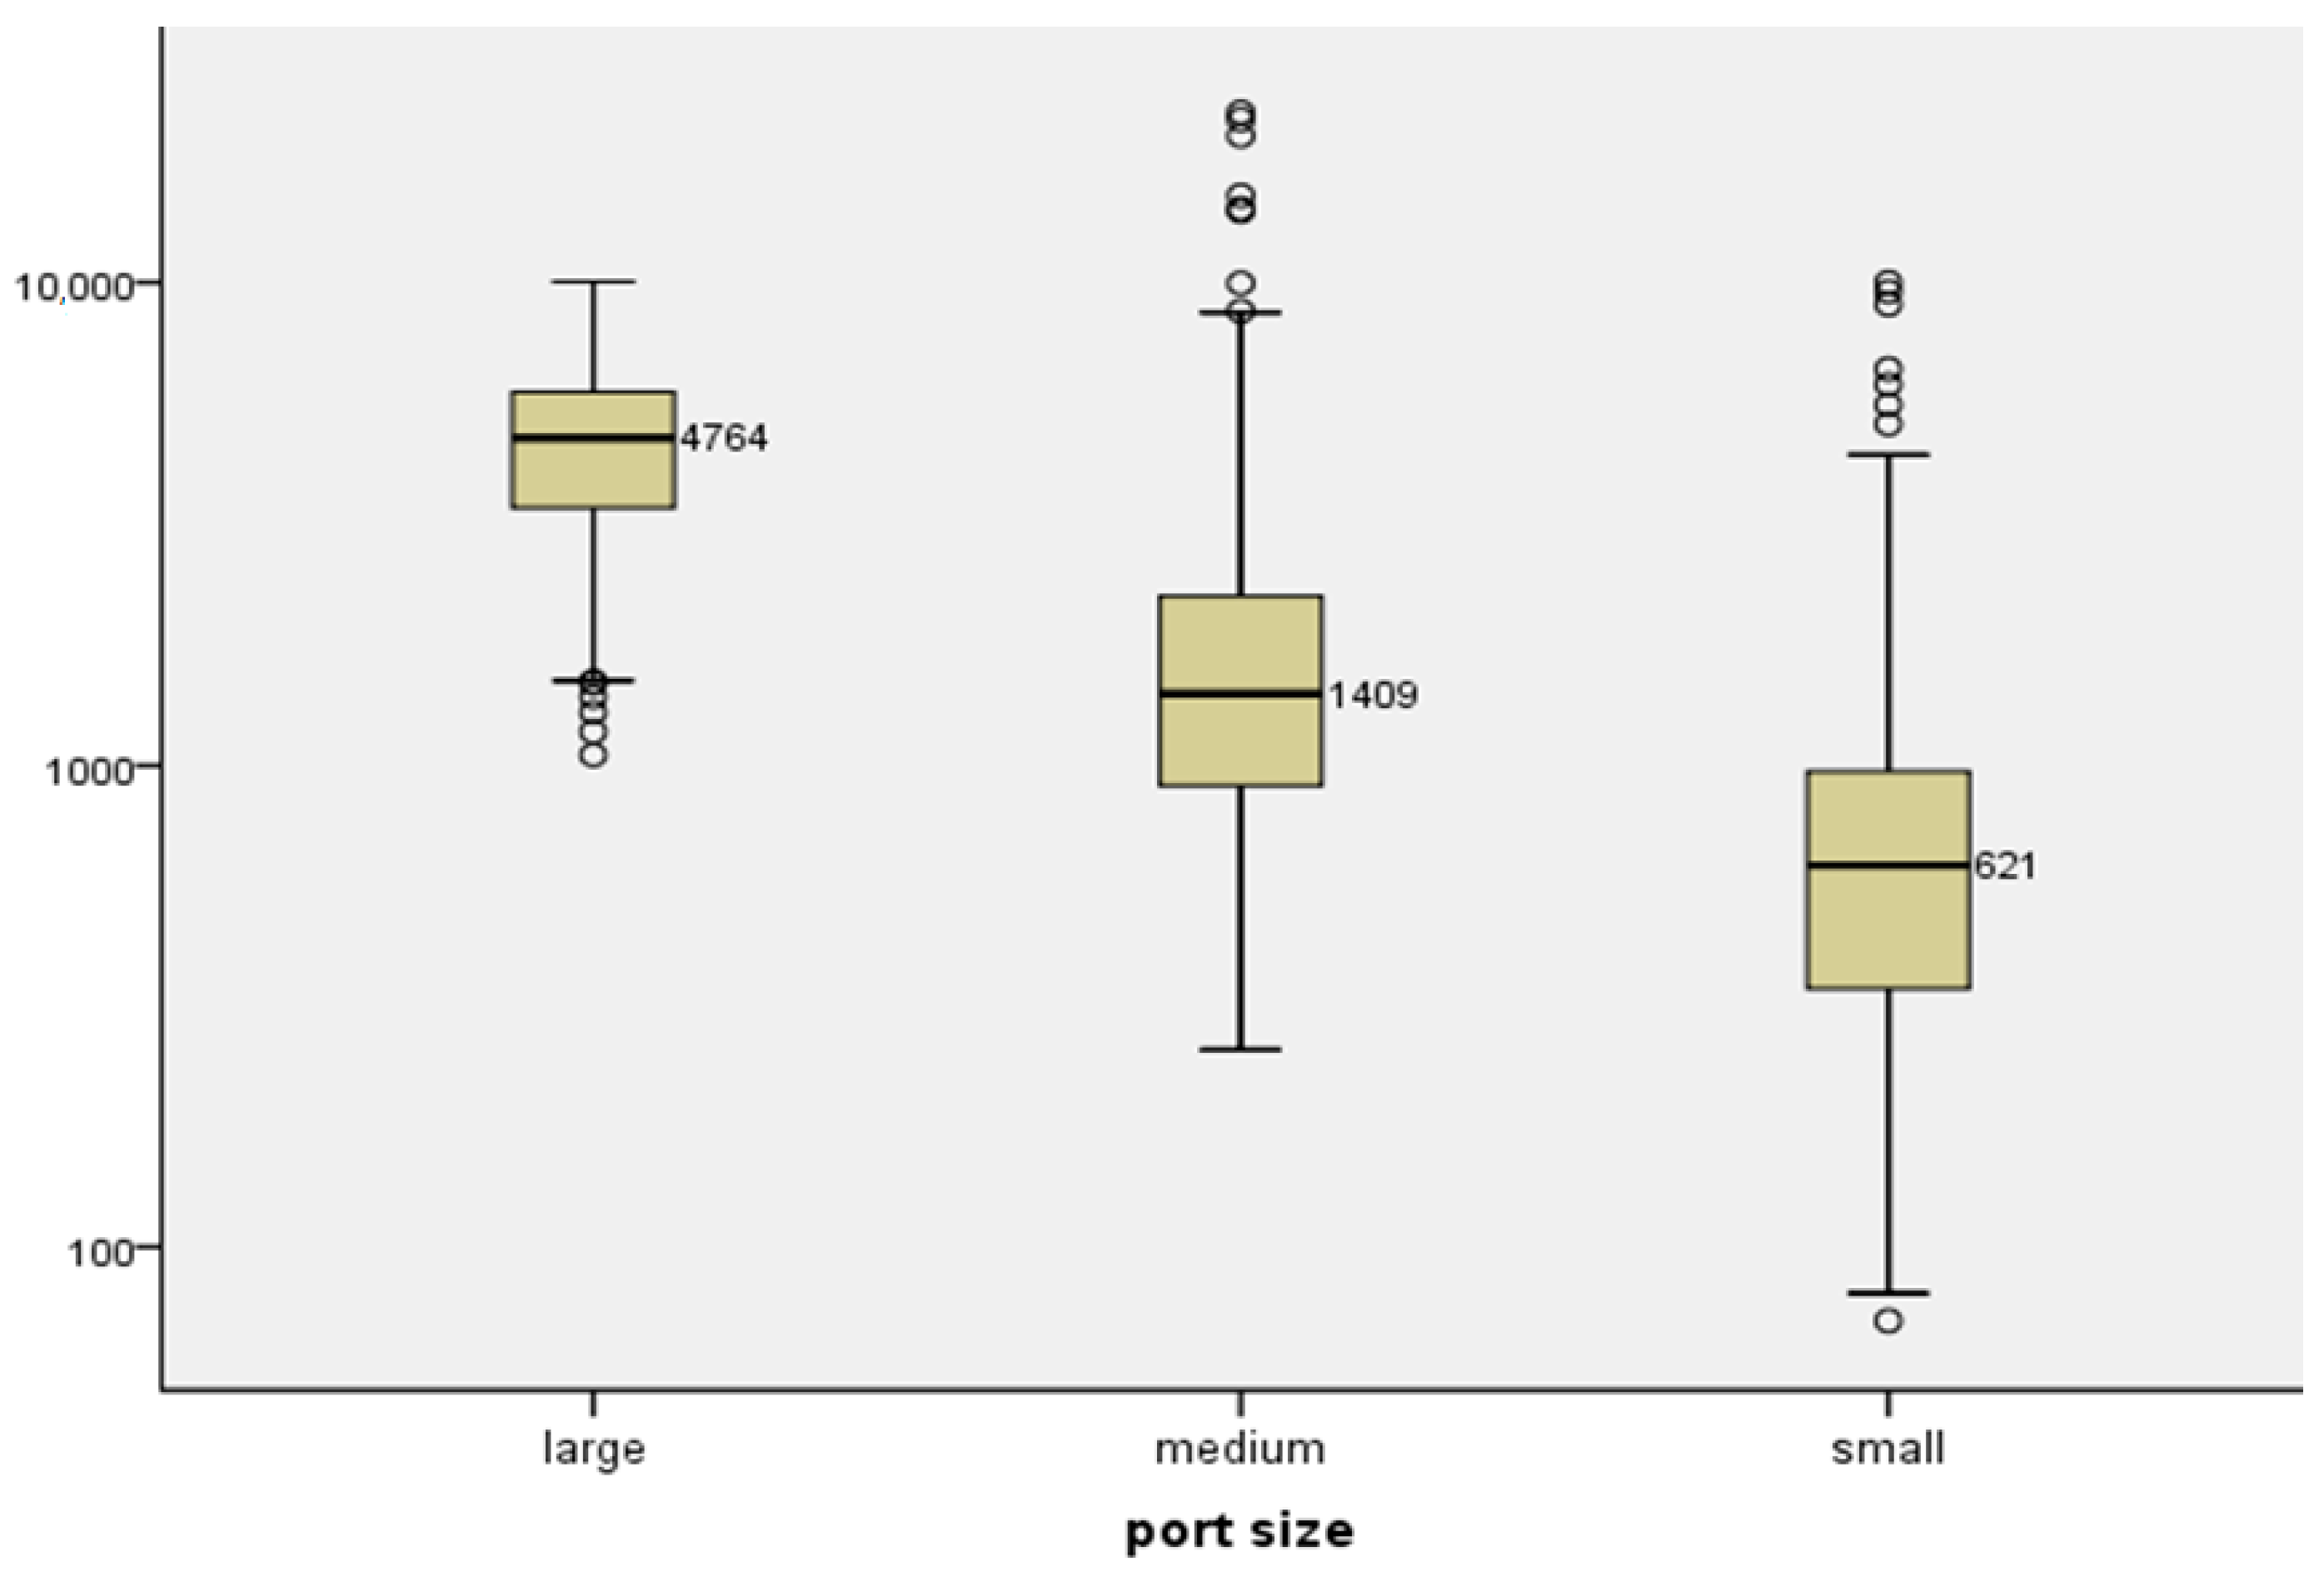
Figure 11), with only a slight decrease in 2020 for the latter. The average ship size in small ports has been decreasing. The distribution of the ship size by the port size for 2019 is shown in the boxplot in
Figure 12.
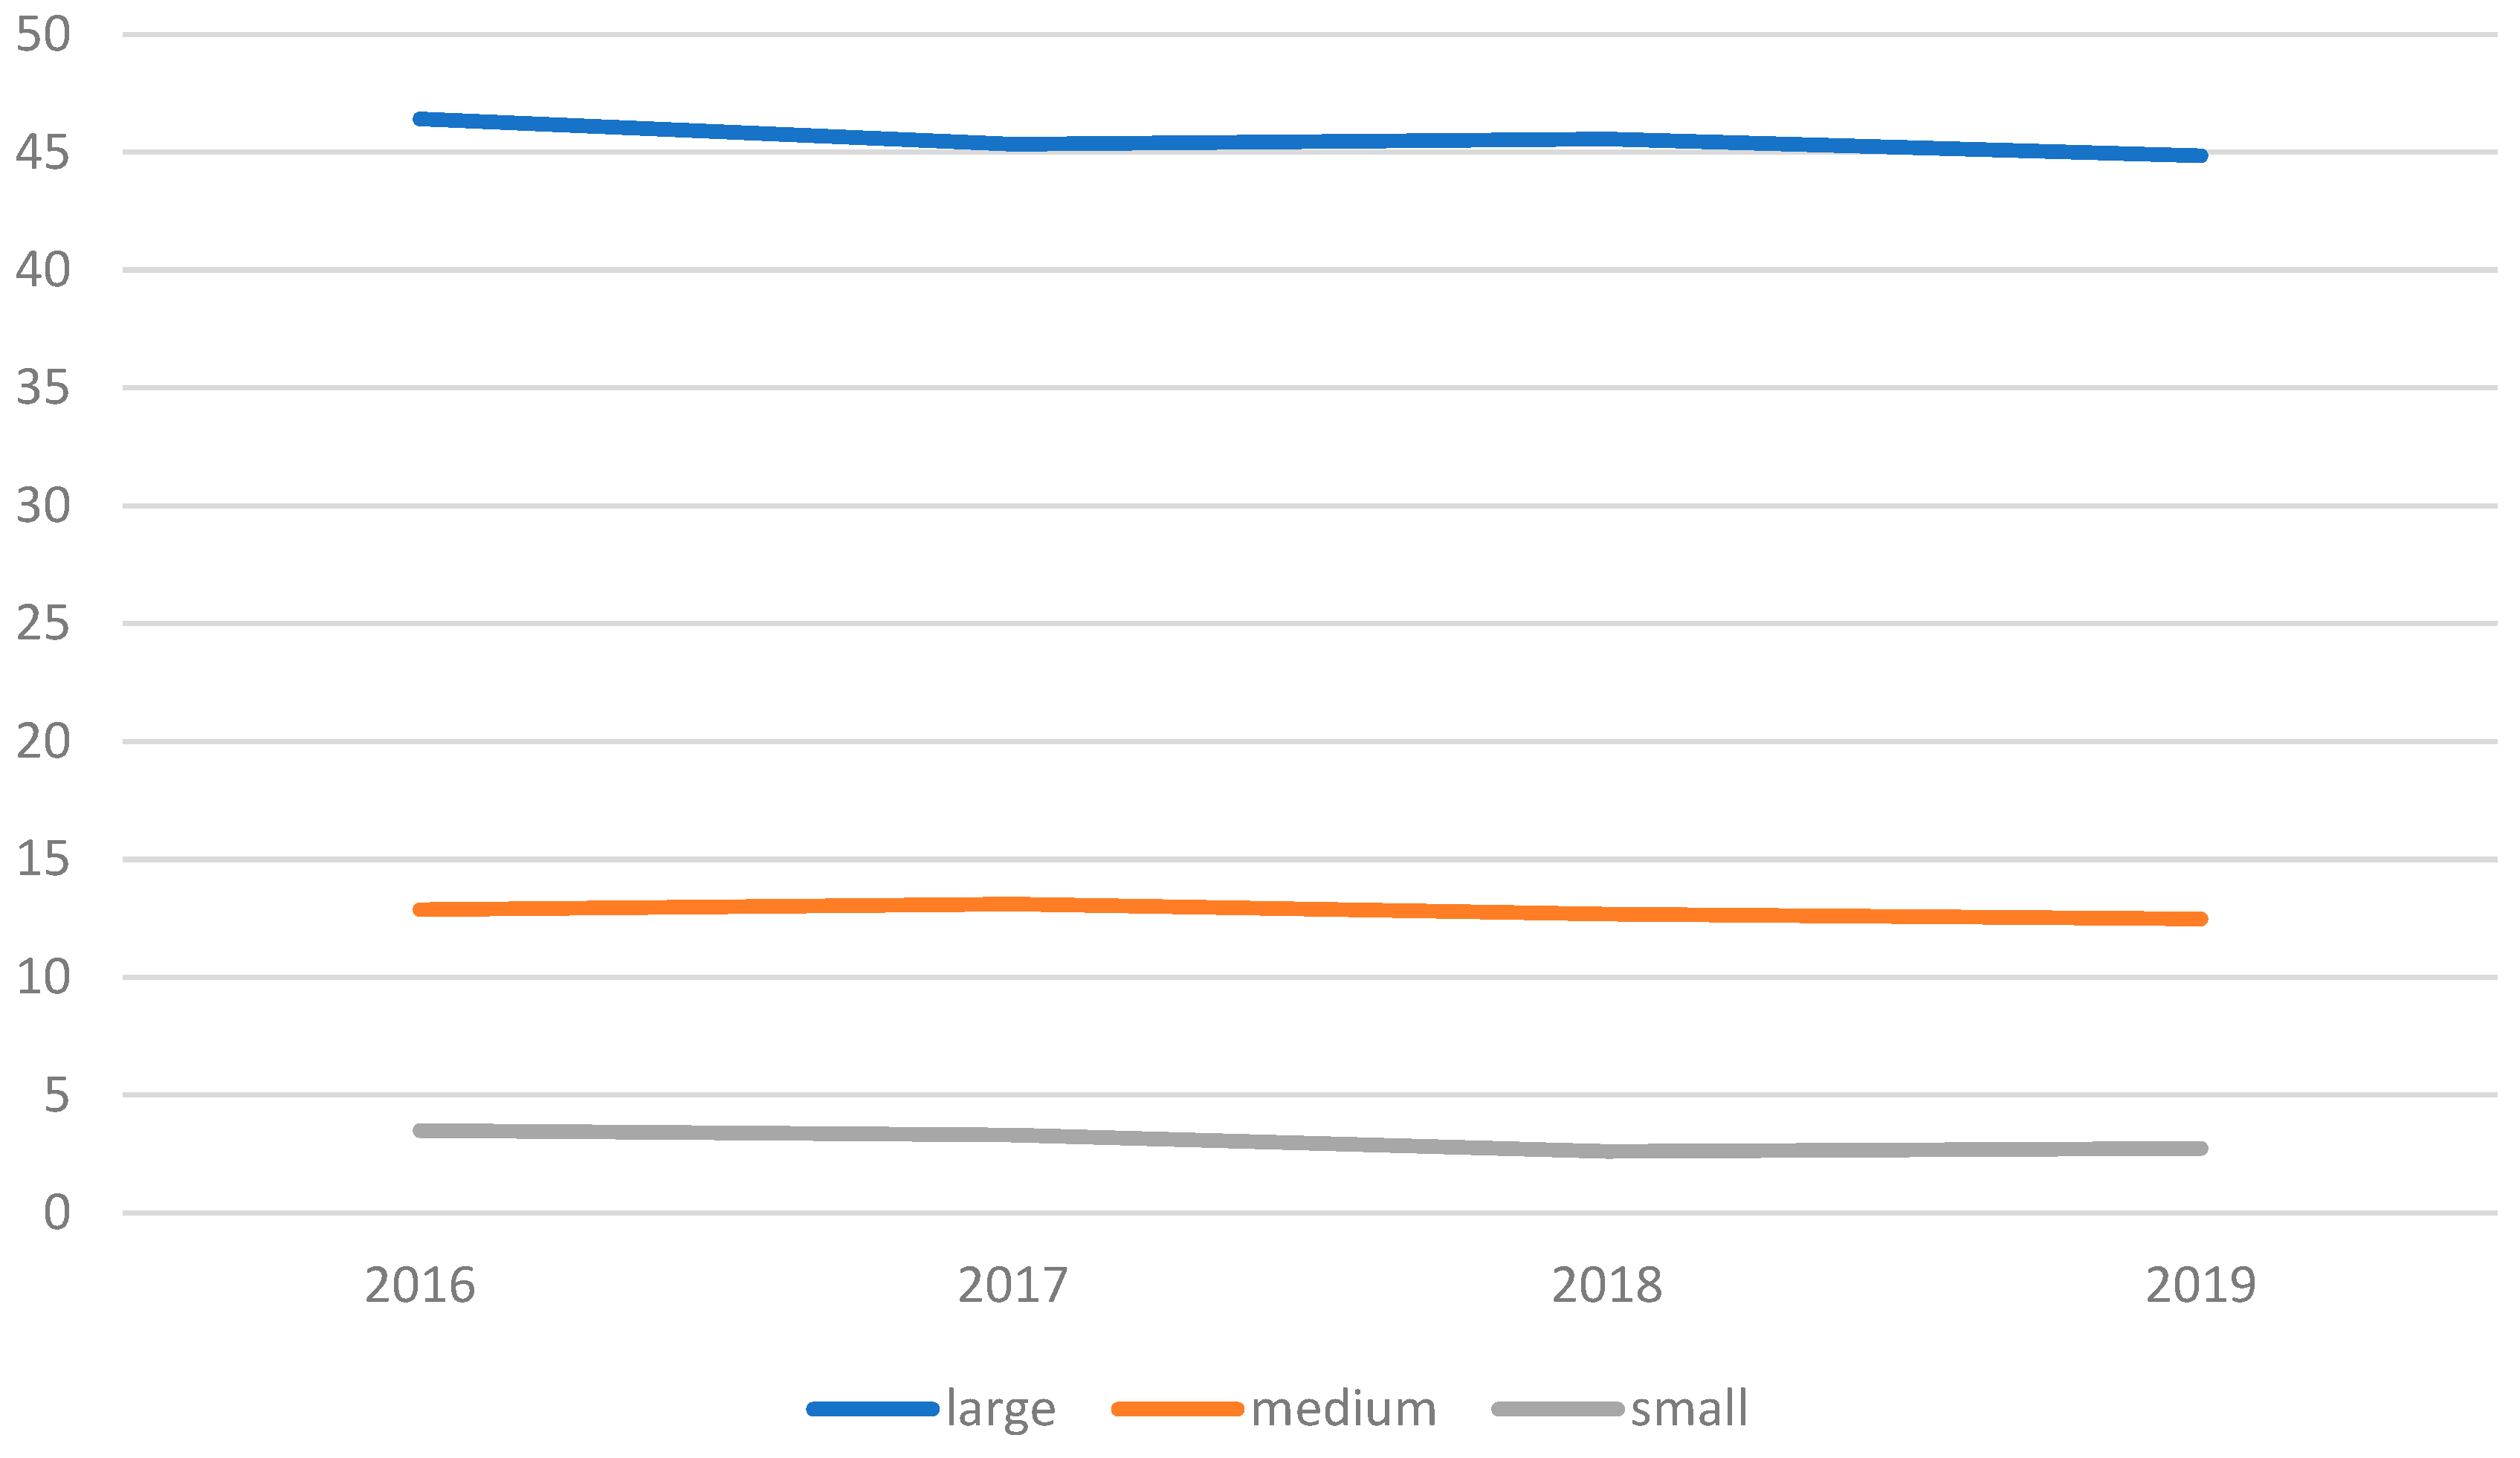
MarineTraffic data show that the number of other ports that are connected to each port through direct shipping services has remained stable for the ports around the world in the years 2016–2019, with an average of 45.5 direct connections for large ports, 12.8 for medium ports and 3.0 for small ports; see
Figure 13 and the boxplot in
Figure 14.
The number of regular liner shipping services that are offered at a port is a component of the LSCI, but this information is not available to us at the time of this investigation. Therefore, as a second-best approach, we use MarineTraffic data. This has its shortcomings, because the data reveal the physical movement of the ships and the ports that they call but do not provide information on whether liner shipping services were actually offered for each individual ship movement
13.
Market Concentration
Sys [
59] was among the first to apply a Herfindahl–Hirschman analysis to shipping at the trade level, with a global scope. Quite a number of other authors have followed with specific applications focusing in detail on specific regions (e.g., [
60] for the Mediterraneau), networks (e.g., [
61] for the Silk Road network) or even countries (e.g., [
62] for China). Le and Ieda [
63] applied a slightly modified form of HHI analysis, including the geographical and economic position of the country where a port is located.
The HHI is calculated separately in this paper for each port using the above formula and a sample of data extracted from MarineTraffic ship movement data. For the calculation of the market share, we use the “offered capacity”—the sum of the capacity of ships in TEU that call at the port—and assign the capacity to shipping companies that operate
14 each ship, not taking into account their participation in alliances. This is performed because we see shipping alliances as institutional structures, where often internal competition is present
15. In this, we follow a pragmatic approach, but acknowledge that it would be best to use “loaded/unloaded quantity” as the best data for this calculation, which unfortunately is not available on such a scale.
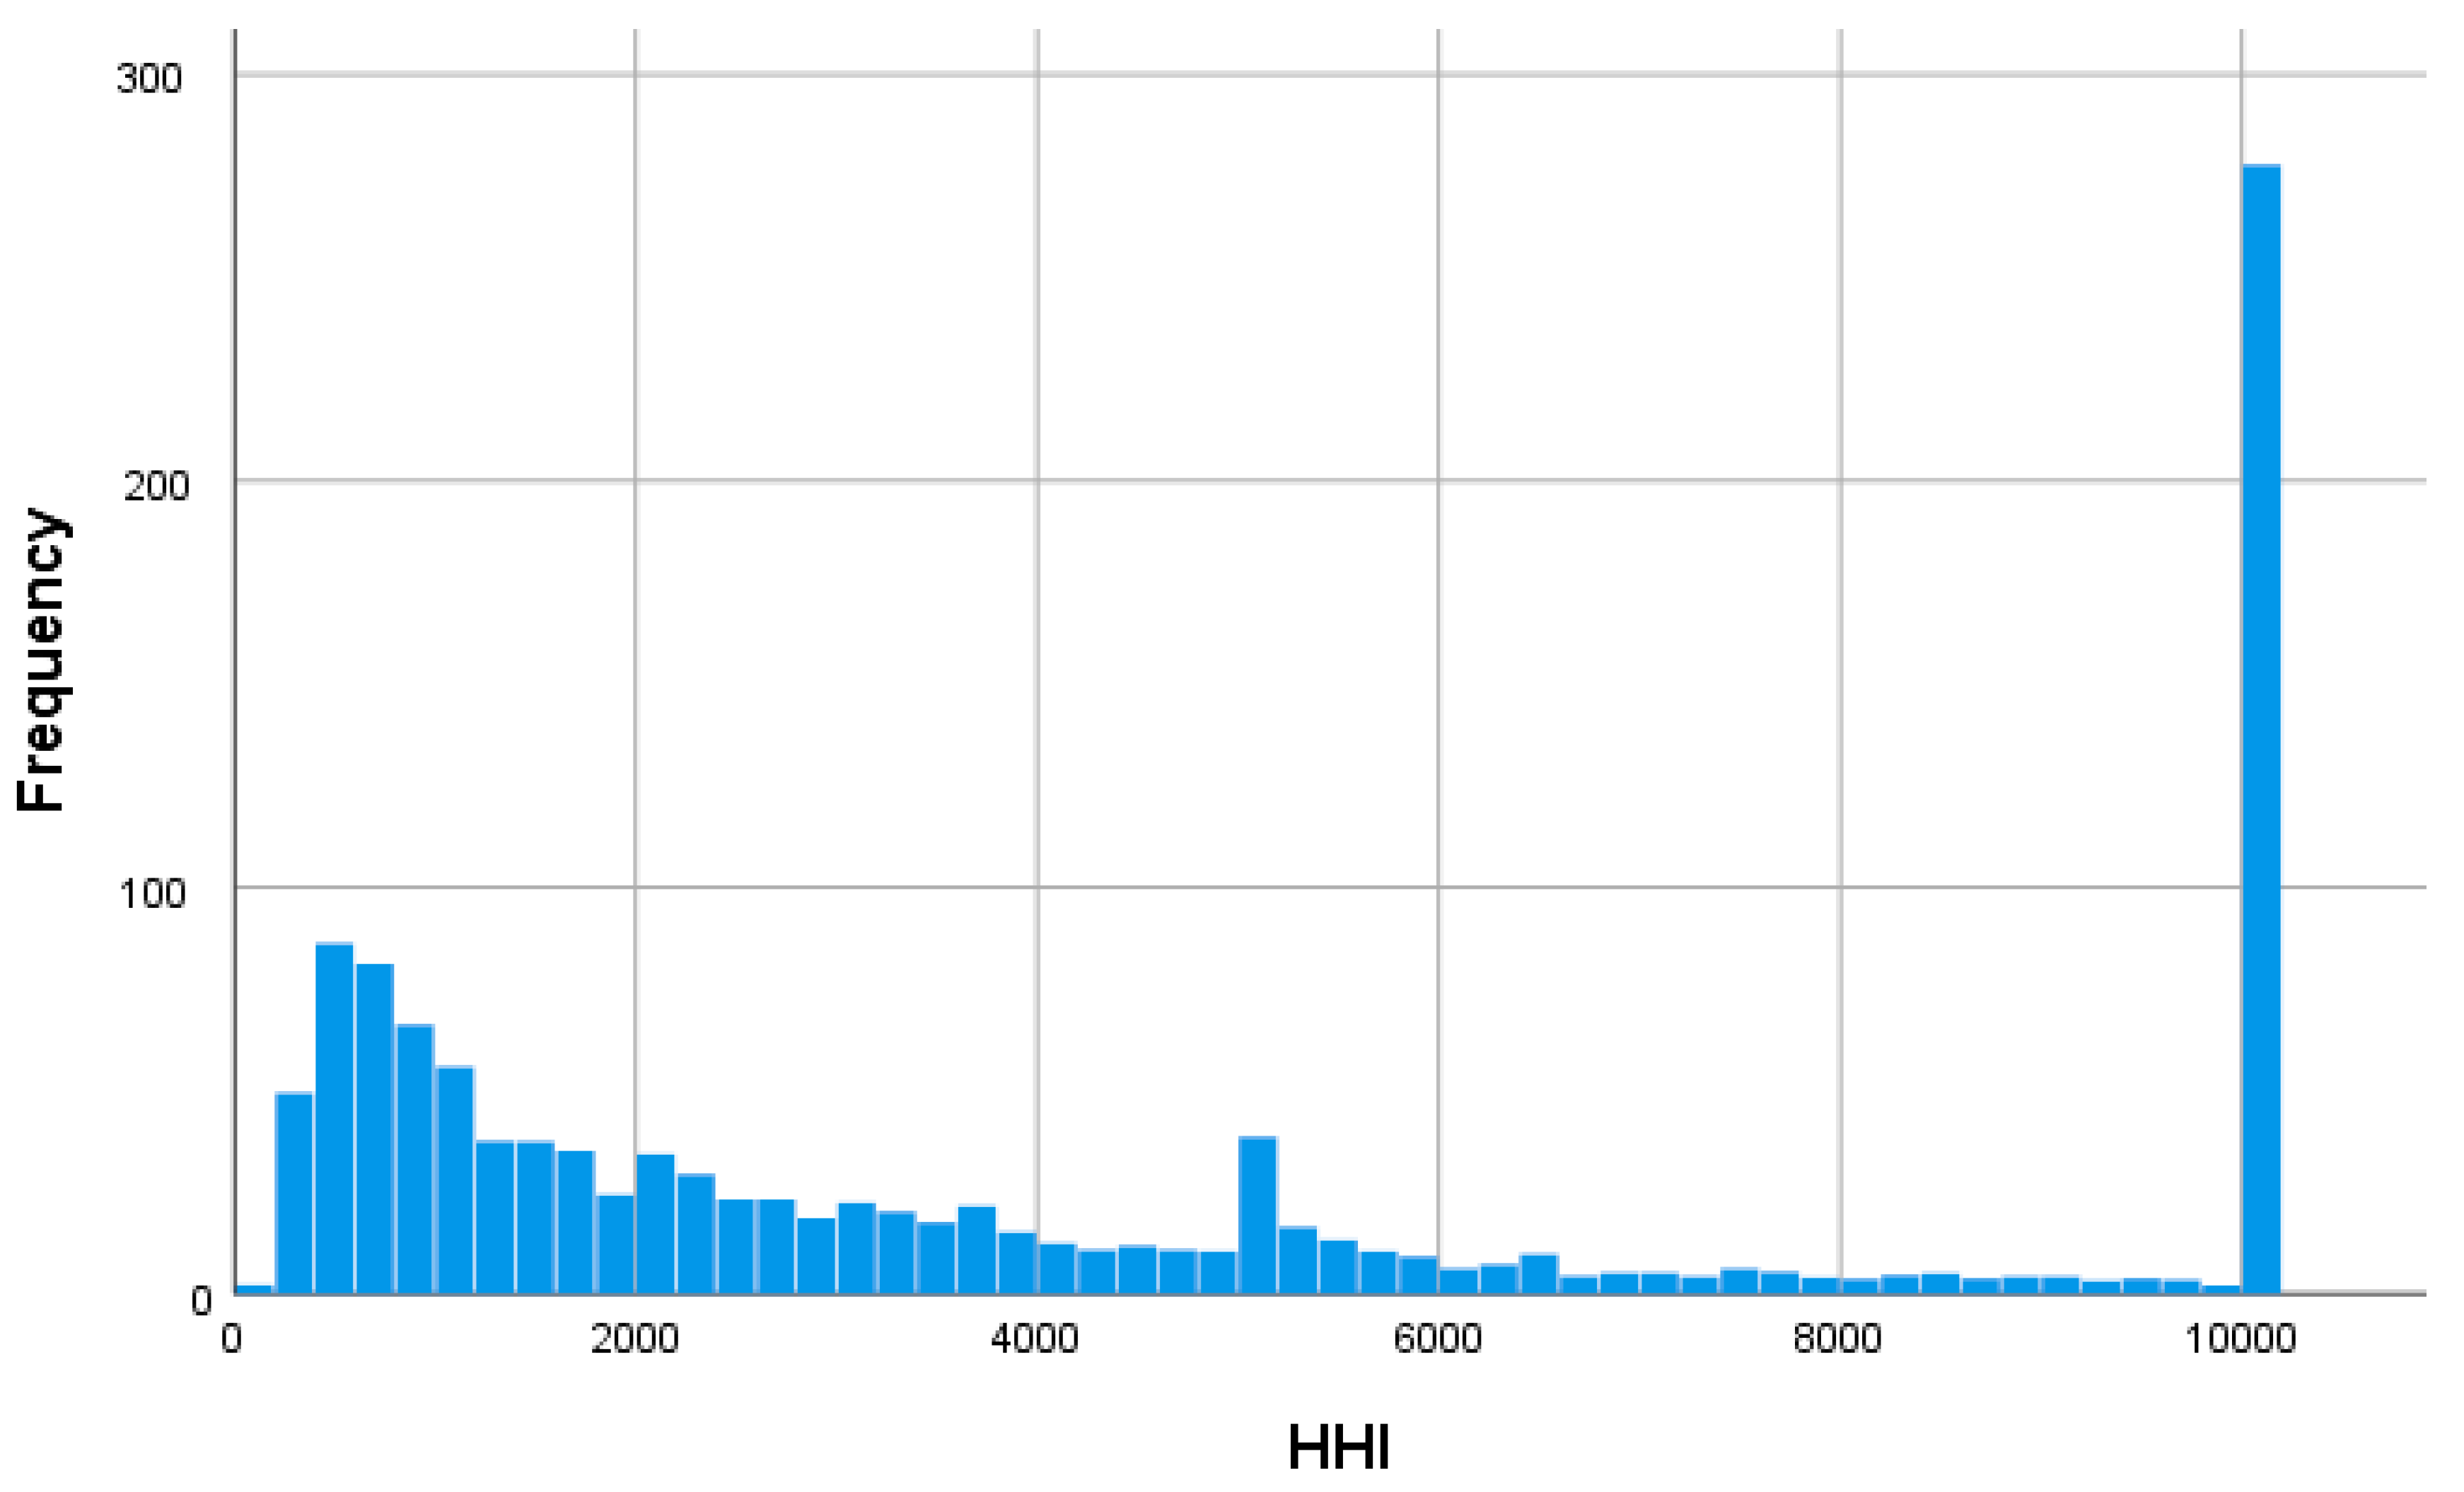
Figure 15 shows a histogram of the HHI calculation results as a histogram for the whole range of ports for the time period from 2016 to 2020. The competition level in the ports of the world differs vastly from almost perfect competition to a complete monopoly, as can be seen for the almost 300 ports on the high side of the scale in
Figure 15.
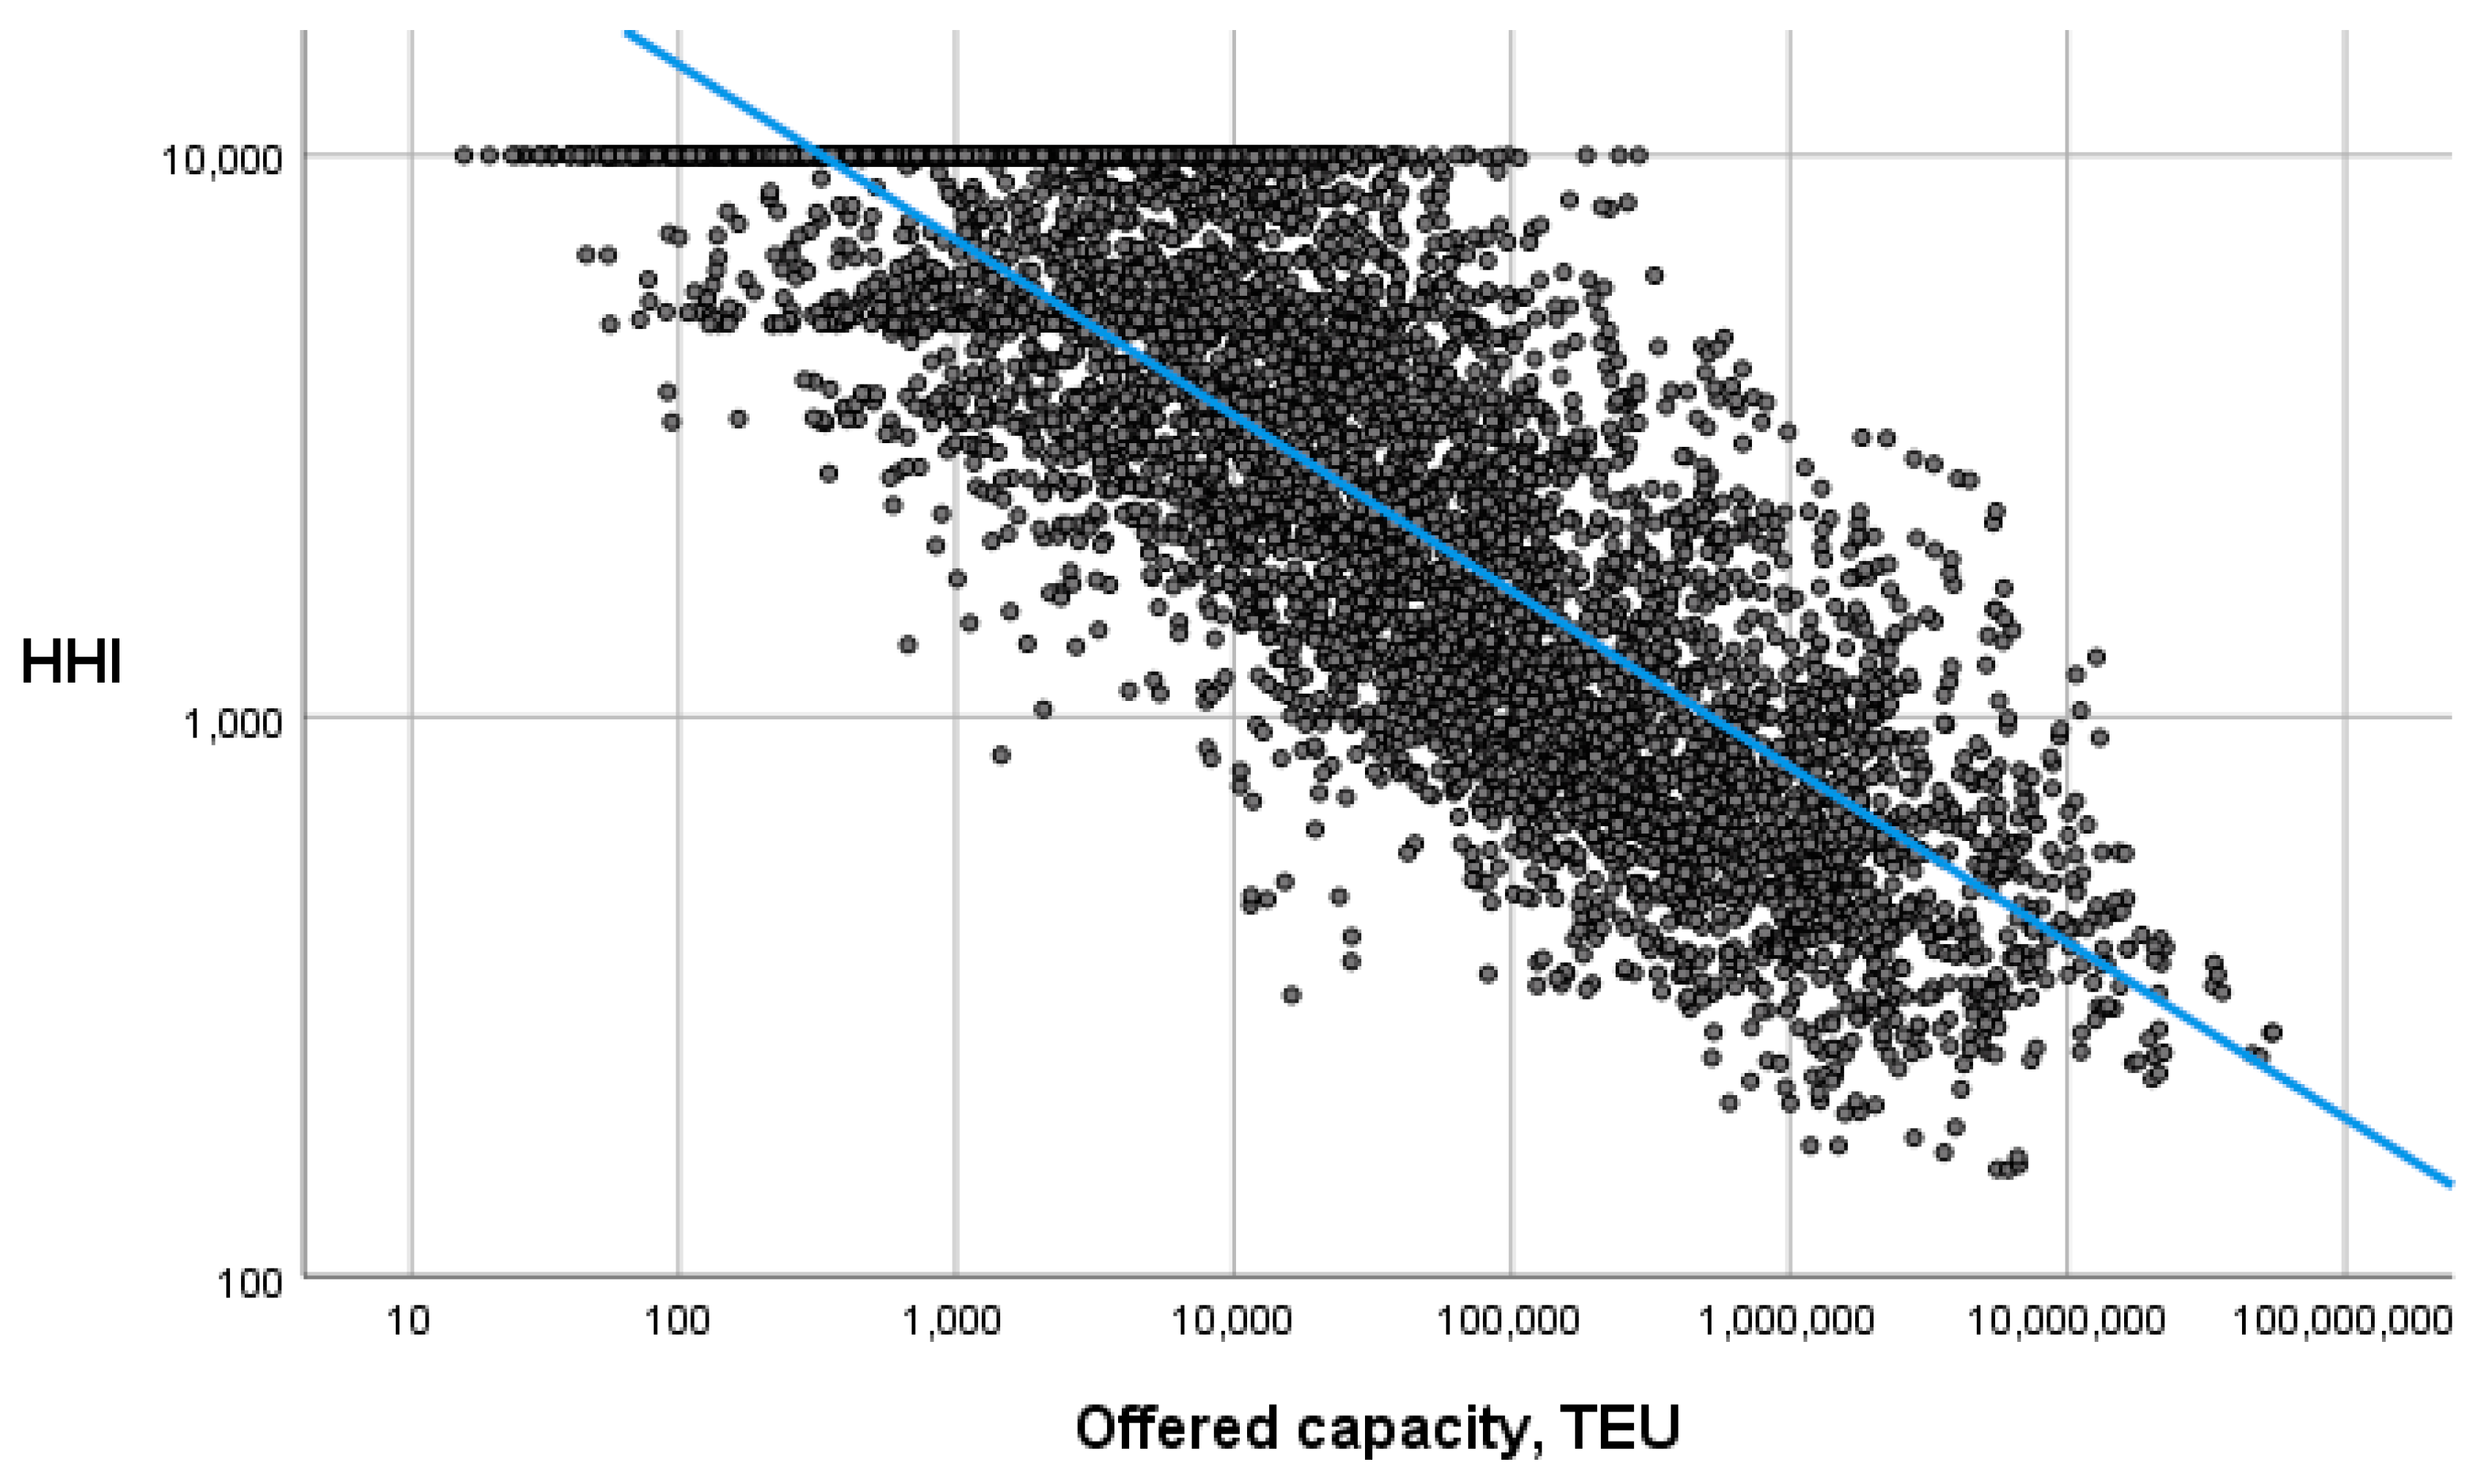
When comparing the capacity that is offered by shipping lines at the port and the Herfindahl–Hirschman index, there is clearly a relationship between the size of the port operations and the level of competitiveness; see the scatterplot in
Figure 1616. It seems that larger ports have the capacity to support higher levels of competition (lower HHI value), as confirmed with the data in
Figure 16.
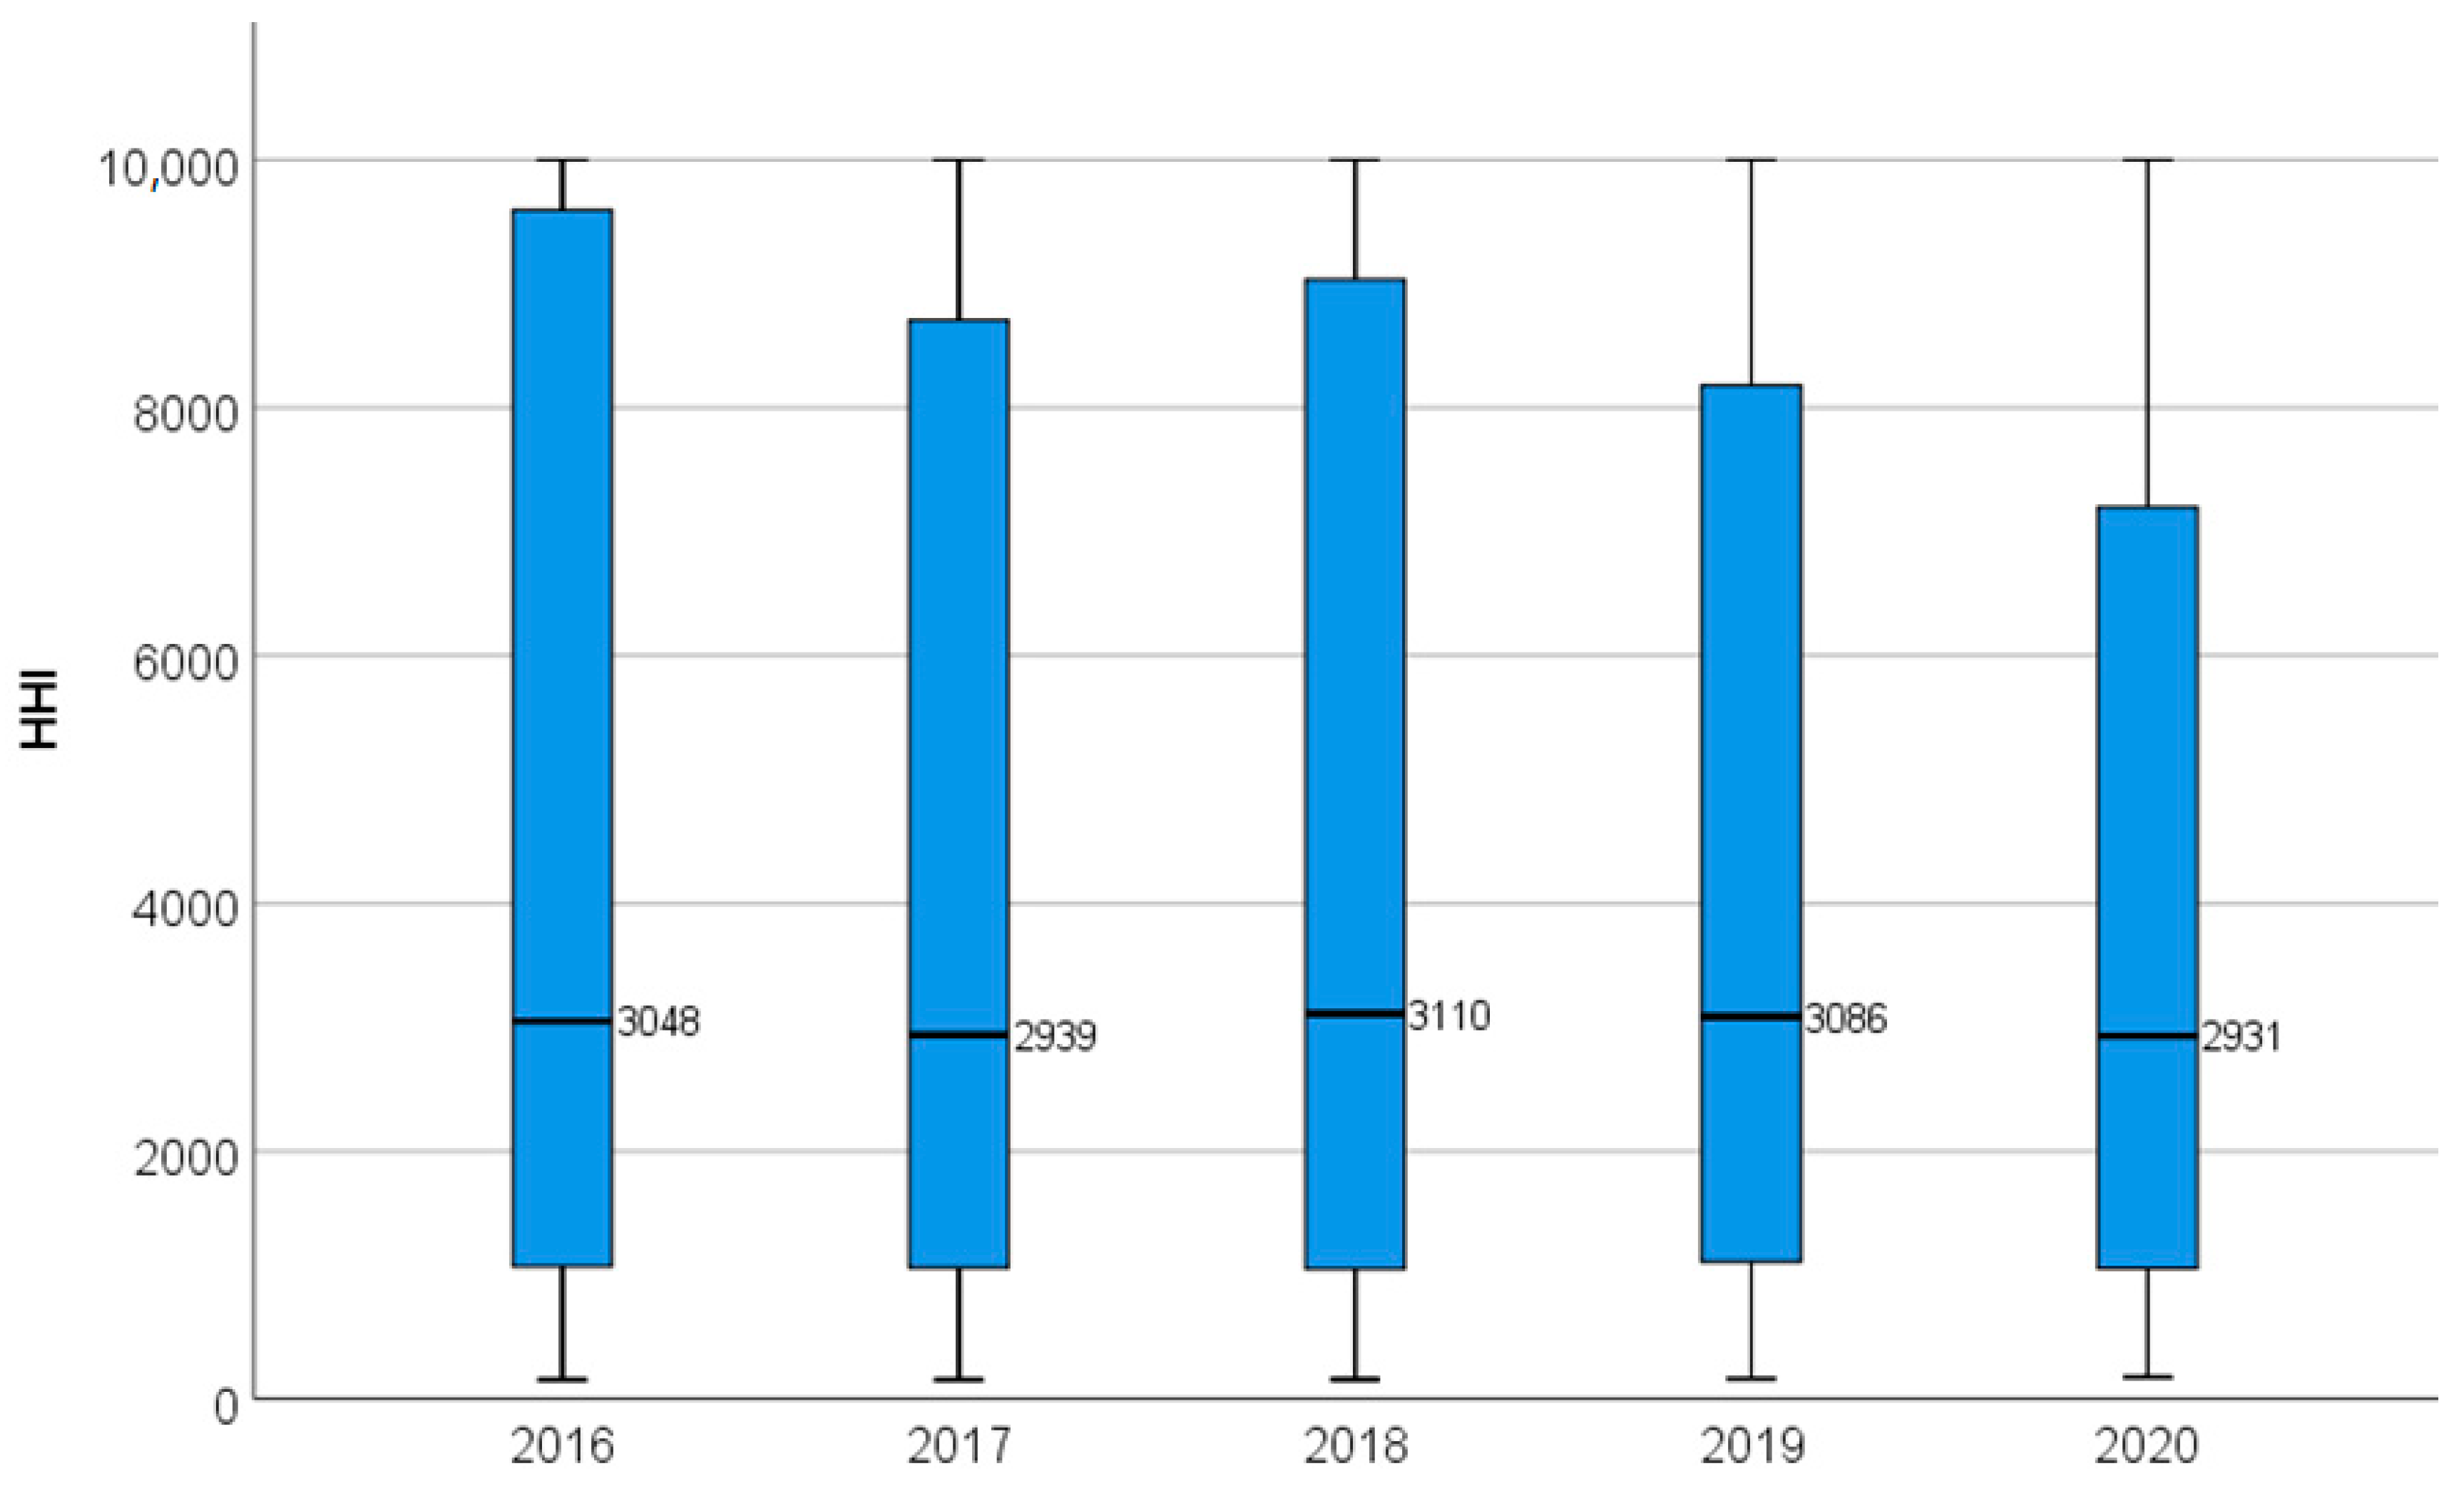
More detail can be observed in the yearly developments of the competition situation in the ports in
Figure 17. It can be seen that the number of ports with a monopoly situation (score of 10,000) is reducing every year, which means that in these ports, additional market participants are joining. On the other end of the spectrum, although less pronounced, are the ports with very high competition levels; the number of competitors is moderating over time, as some of the participants are exiting the market. Both these developments seem natural because in the first case, the high profits from a monopolistic situation are a good incentive for an additional market participant to appear. And for the second development, the low profit levels or even incurred losses from operations are forcing shipping companies to stop offering services in those specific ports.
4.2.2. Shipping Cost
For calculating the shipping cost, which includes the hinterland transport cost, port costs and maritime costs for the whole chain, the UA Chain Cost Model
17 is used [
57]. The model contains data on 100 ports. In order to perform the cost calculations, specific shipping loops based on real liner shipping loops that are currently in service are created in the model to allow for calculations between the ports.
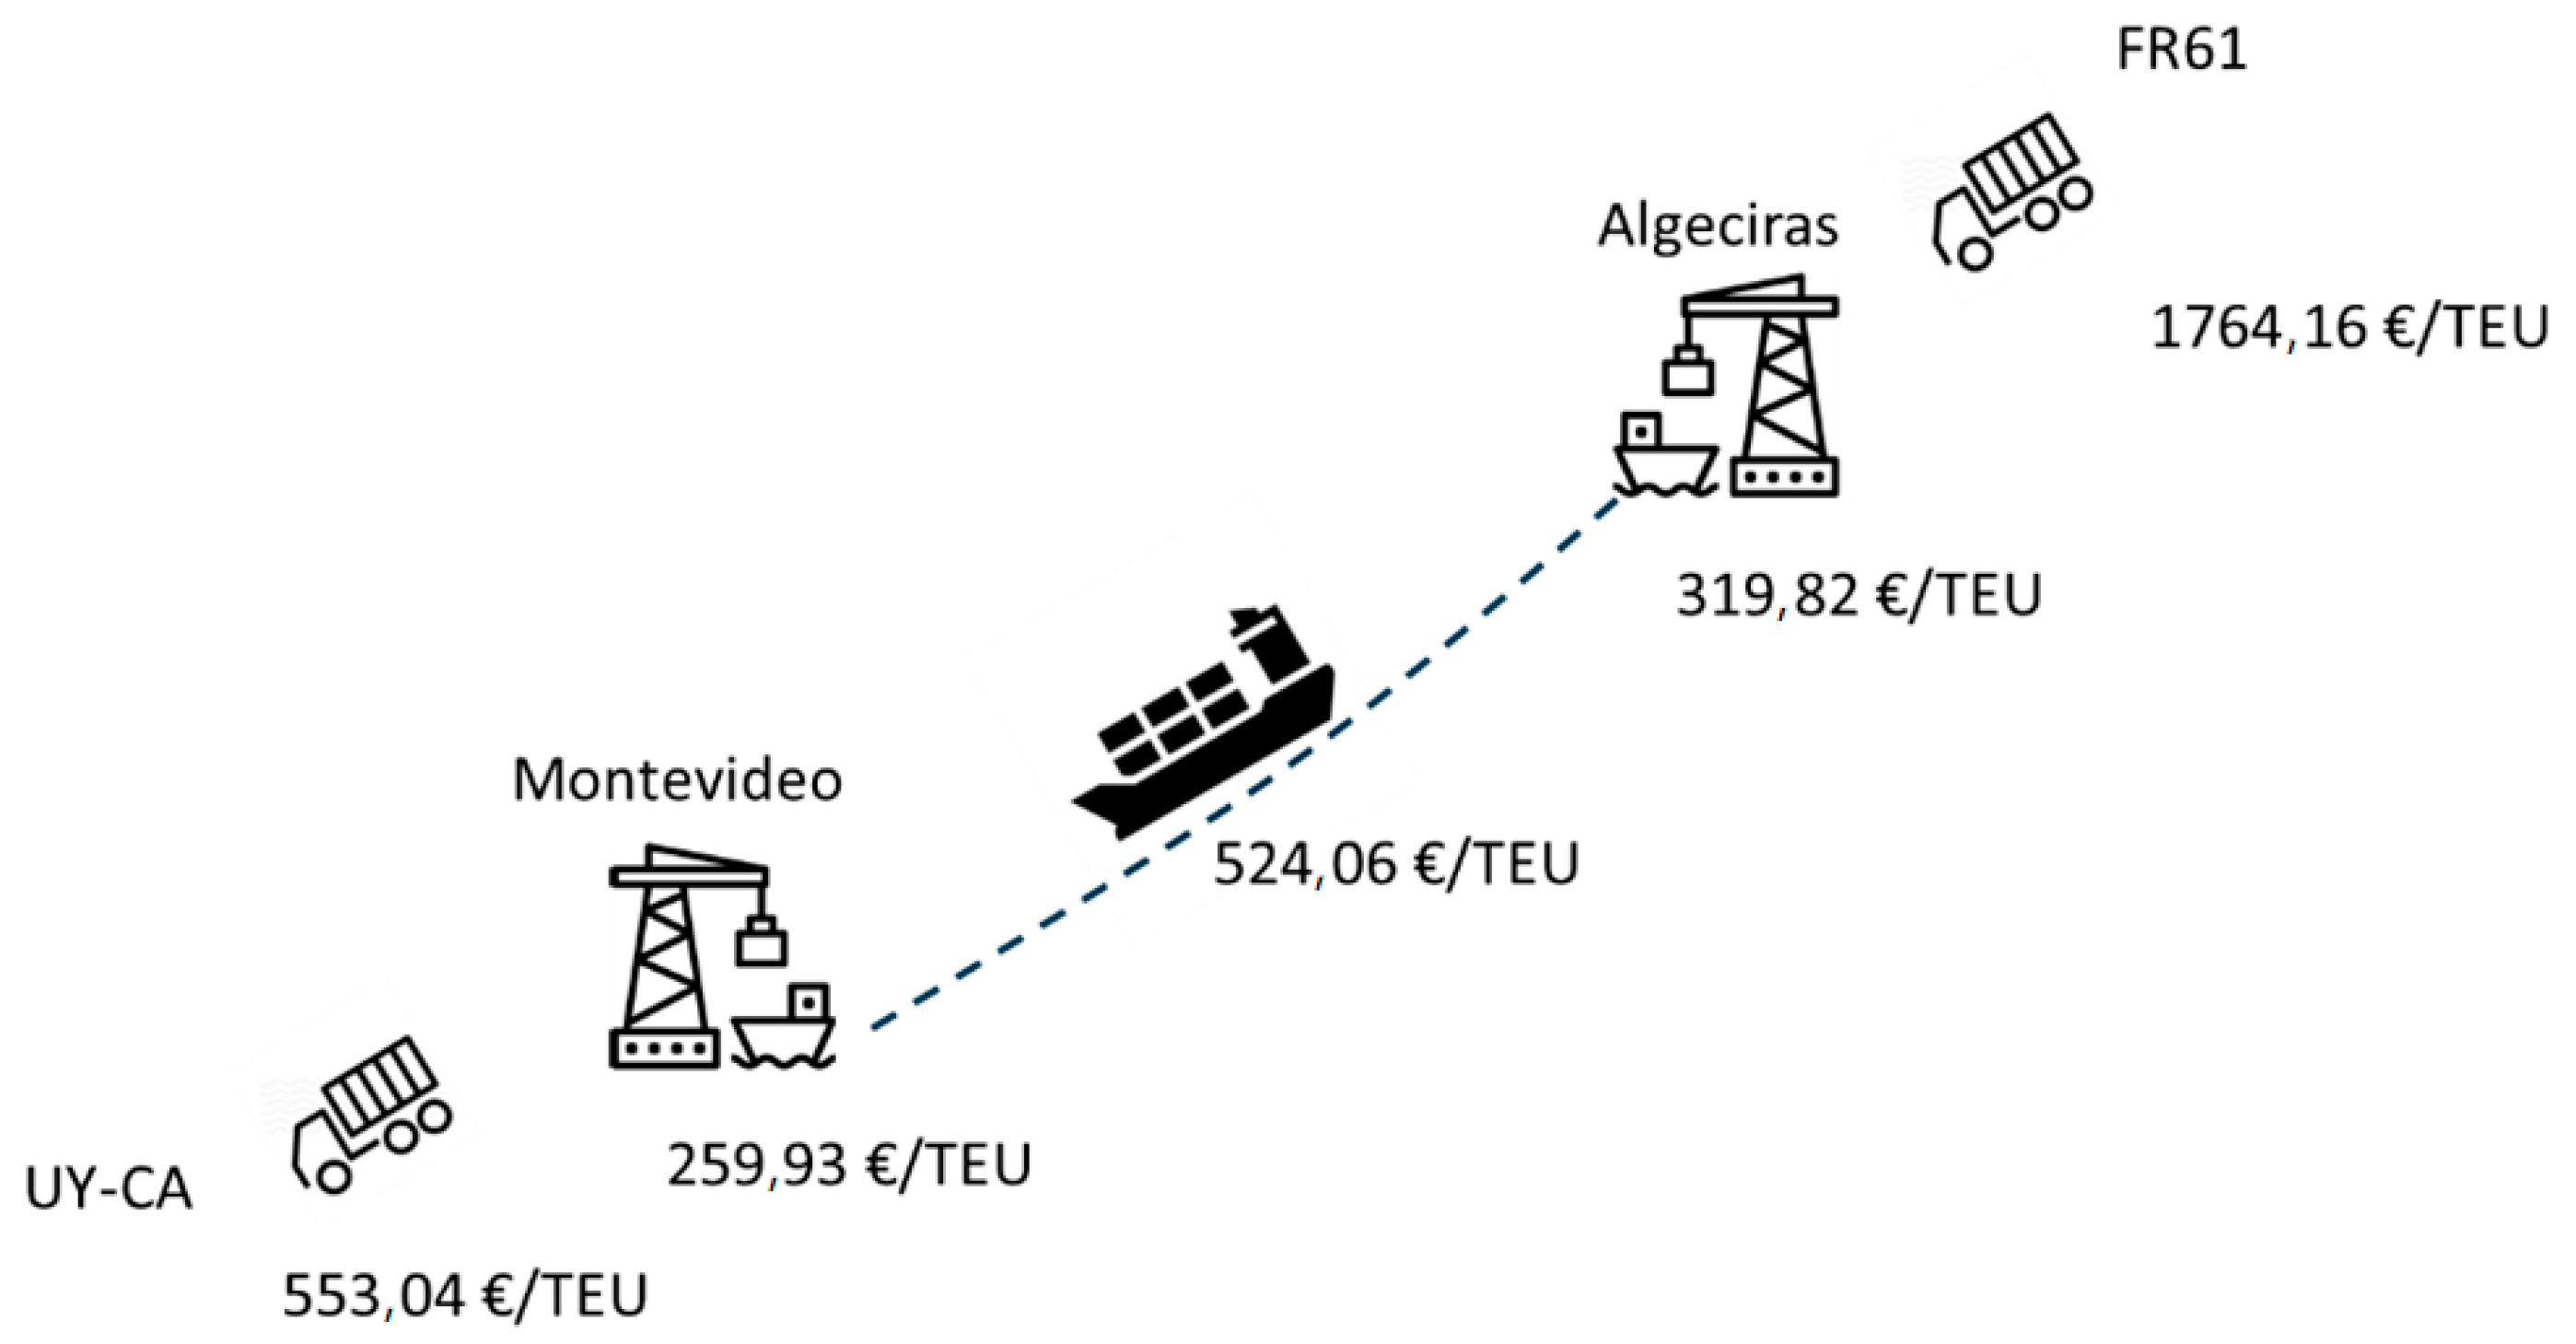
An example of main cost calculation result components is shown in
Figure 18 for the Europe–Uruguay link.
4.2.3. Efficiency
The efficiency section of the port-level data framework includes indicators to show port/berth moves per hour (PMPH and BMPH), steam-in time, average start up/finish up and a port productivity index that is developed jointly by the World Bank and IHS Markit [
55].
The PMPH is calculated by dividing container moves by port hours of a ship and BMPH is calculated in a similar way per berth. This allows for comparing the performance of a port against others.
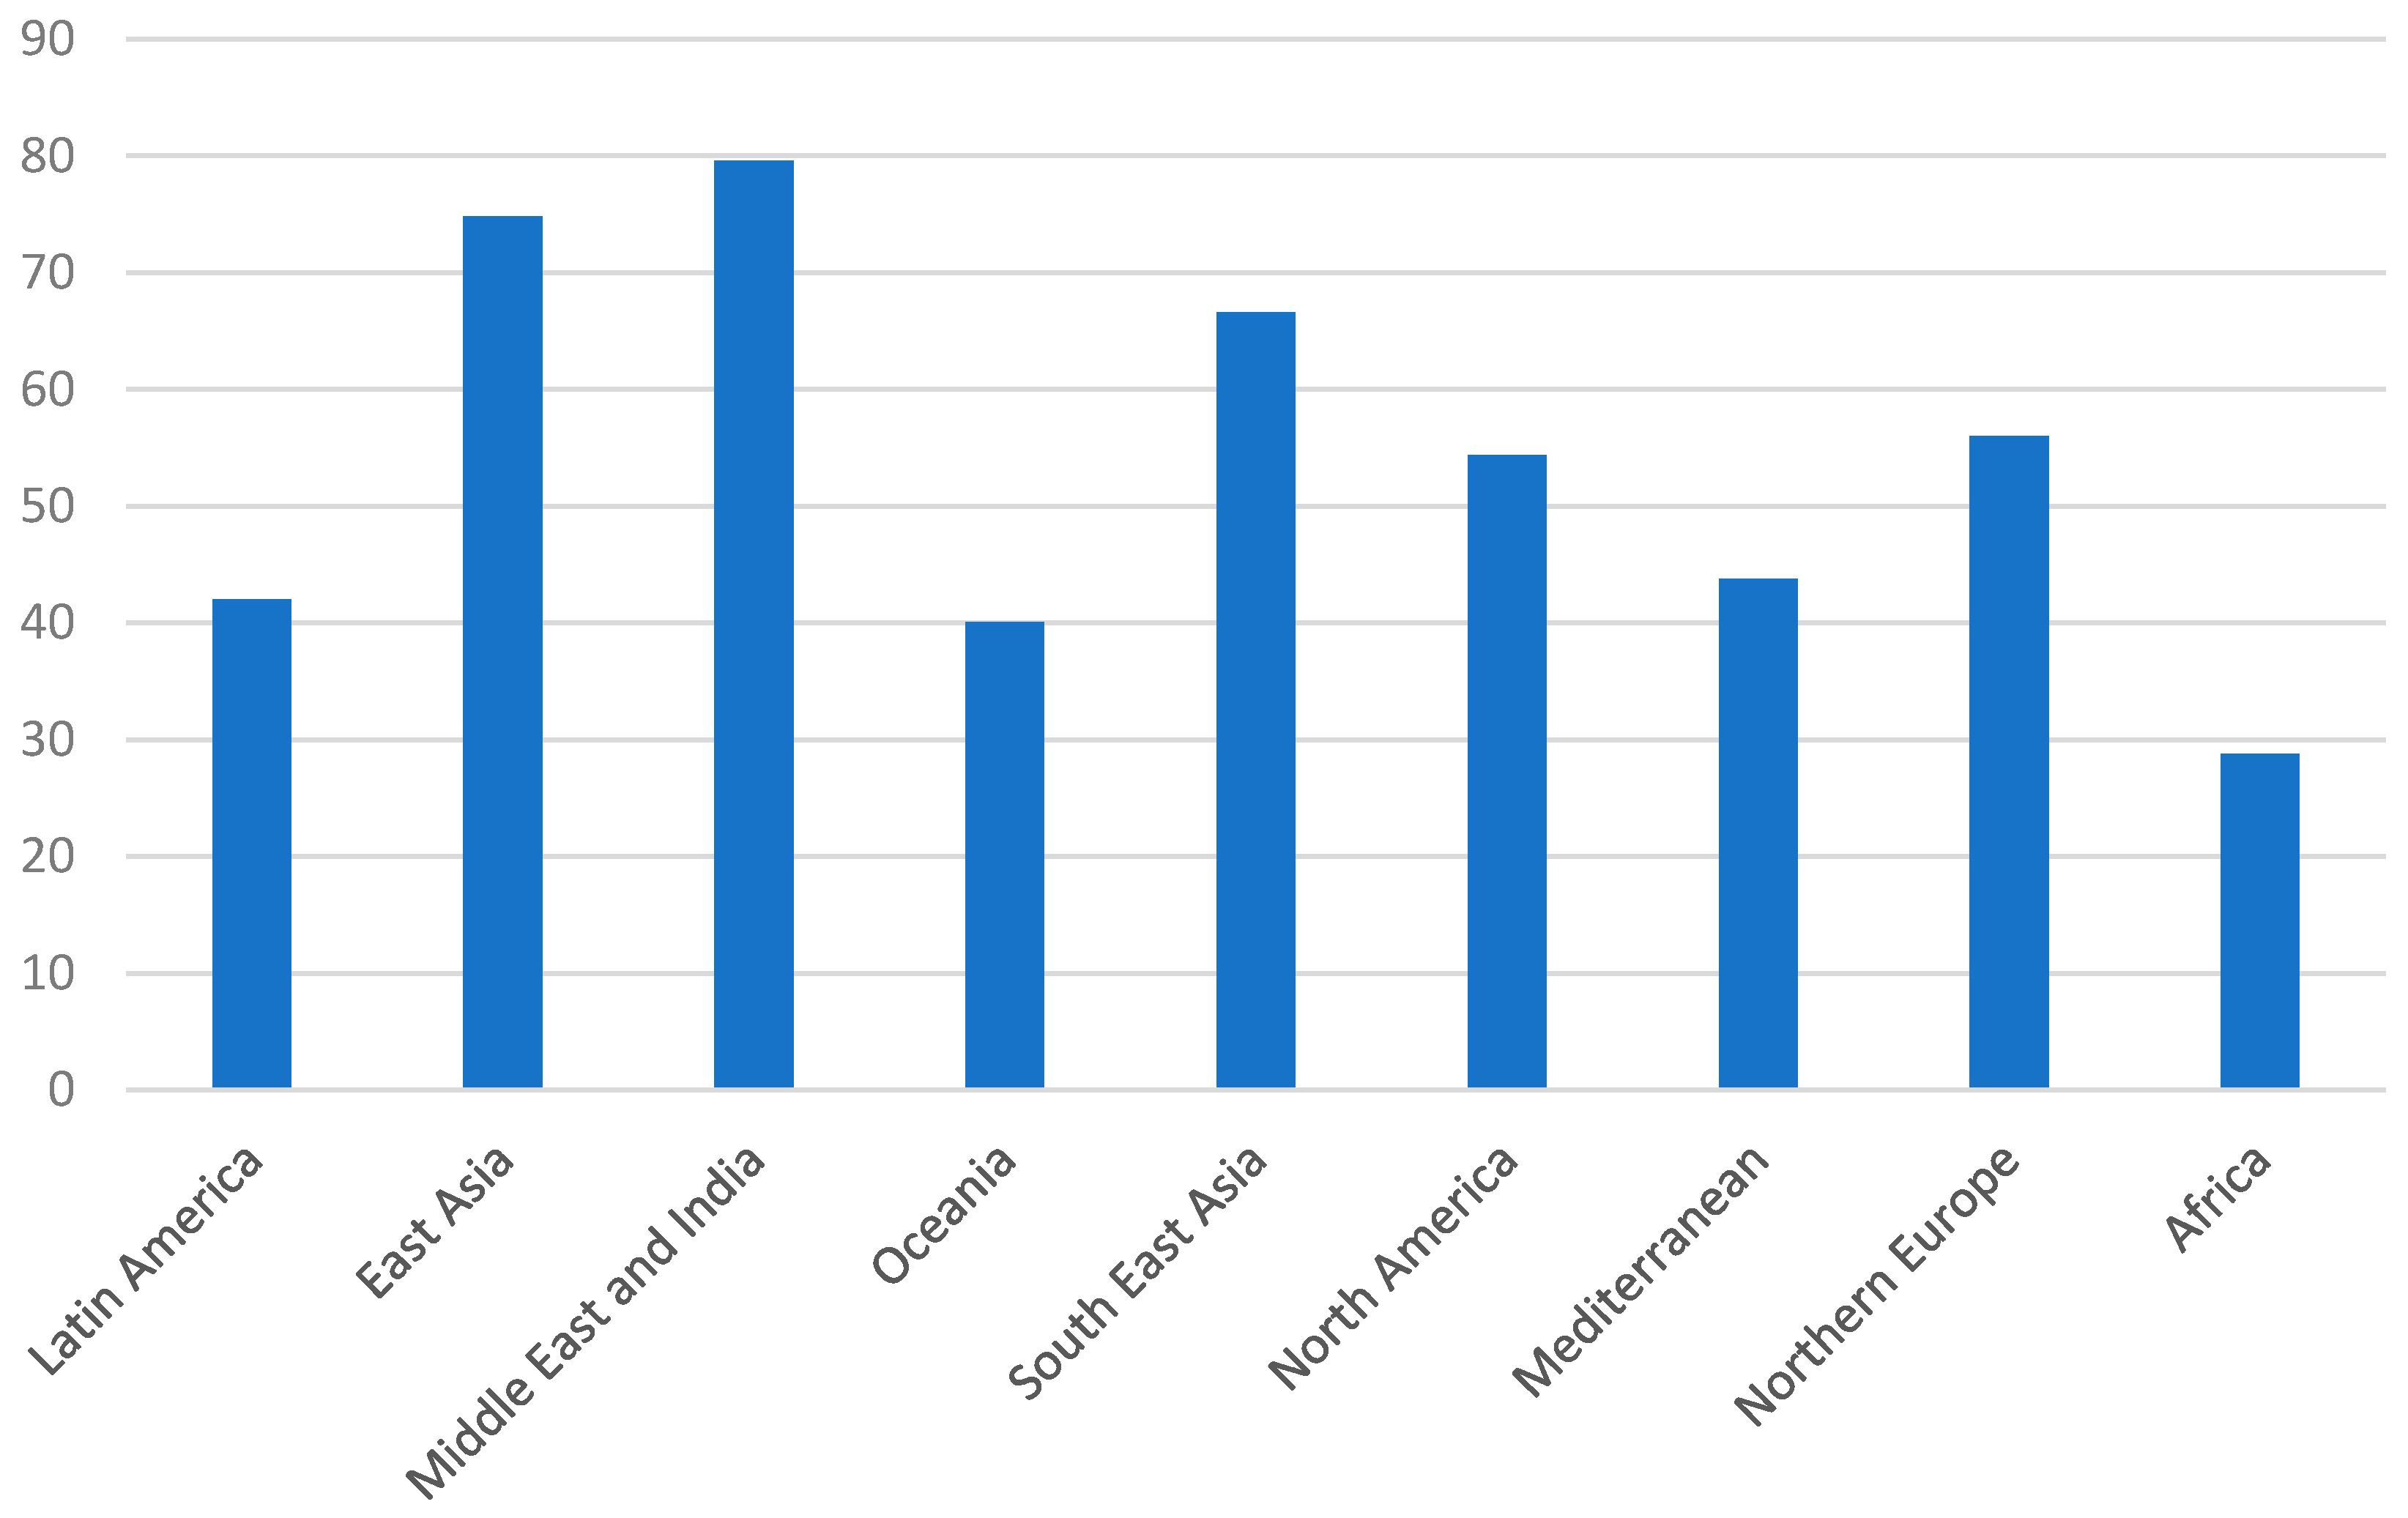
Figure 19 shows the performance of ports in different regions
18 on this metric. The best performing regions are the Middle East and India, as well as East Asia and South East Asia. Berth moves per hour show a very similar picture; therefore, this information is not shown in a separate graph.
The World Bank Container Port Performance Index currently allows an apples-to-apples comparison of port productivity around the globe [
65].
4.2.4. Environmental Impacts
The environmental impacts section of the port-level data framework includes a CO
2 calculation of the ship port phase. The calculation is performed using the UA Chain Cost Model [
20], which takes into account the port geographical configuration and the required approach that the ship has to make to get to the terminal; congestion that might be present; and the time the ship spends at the terminal for port operations.
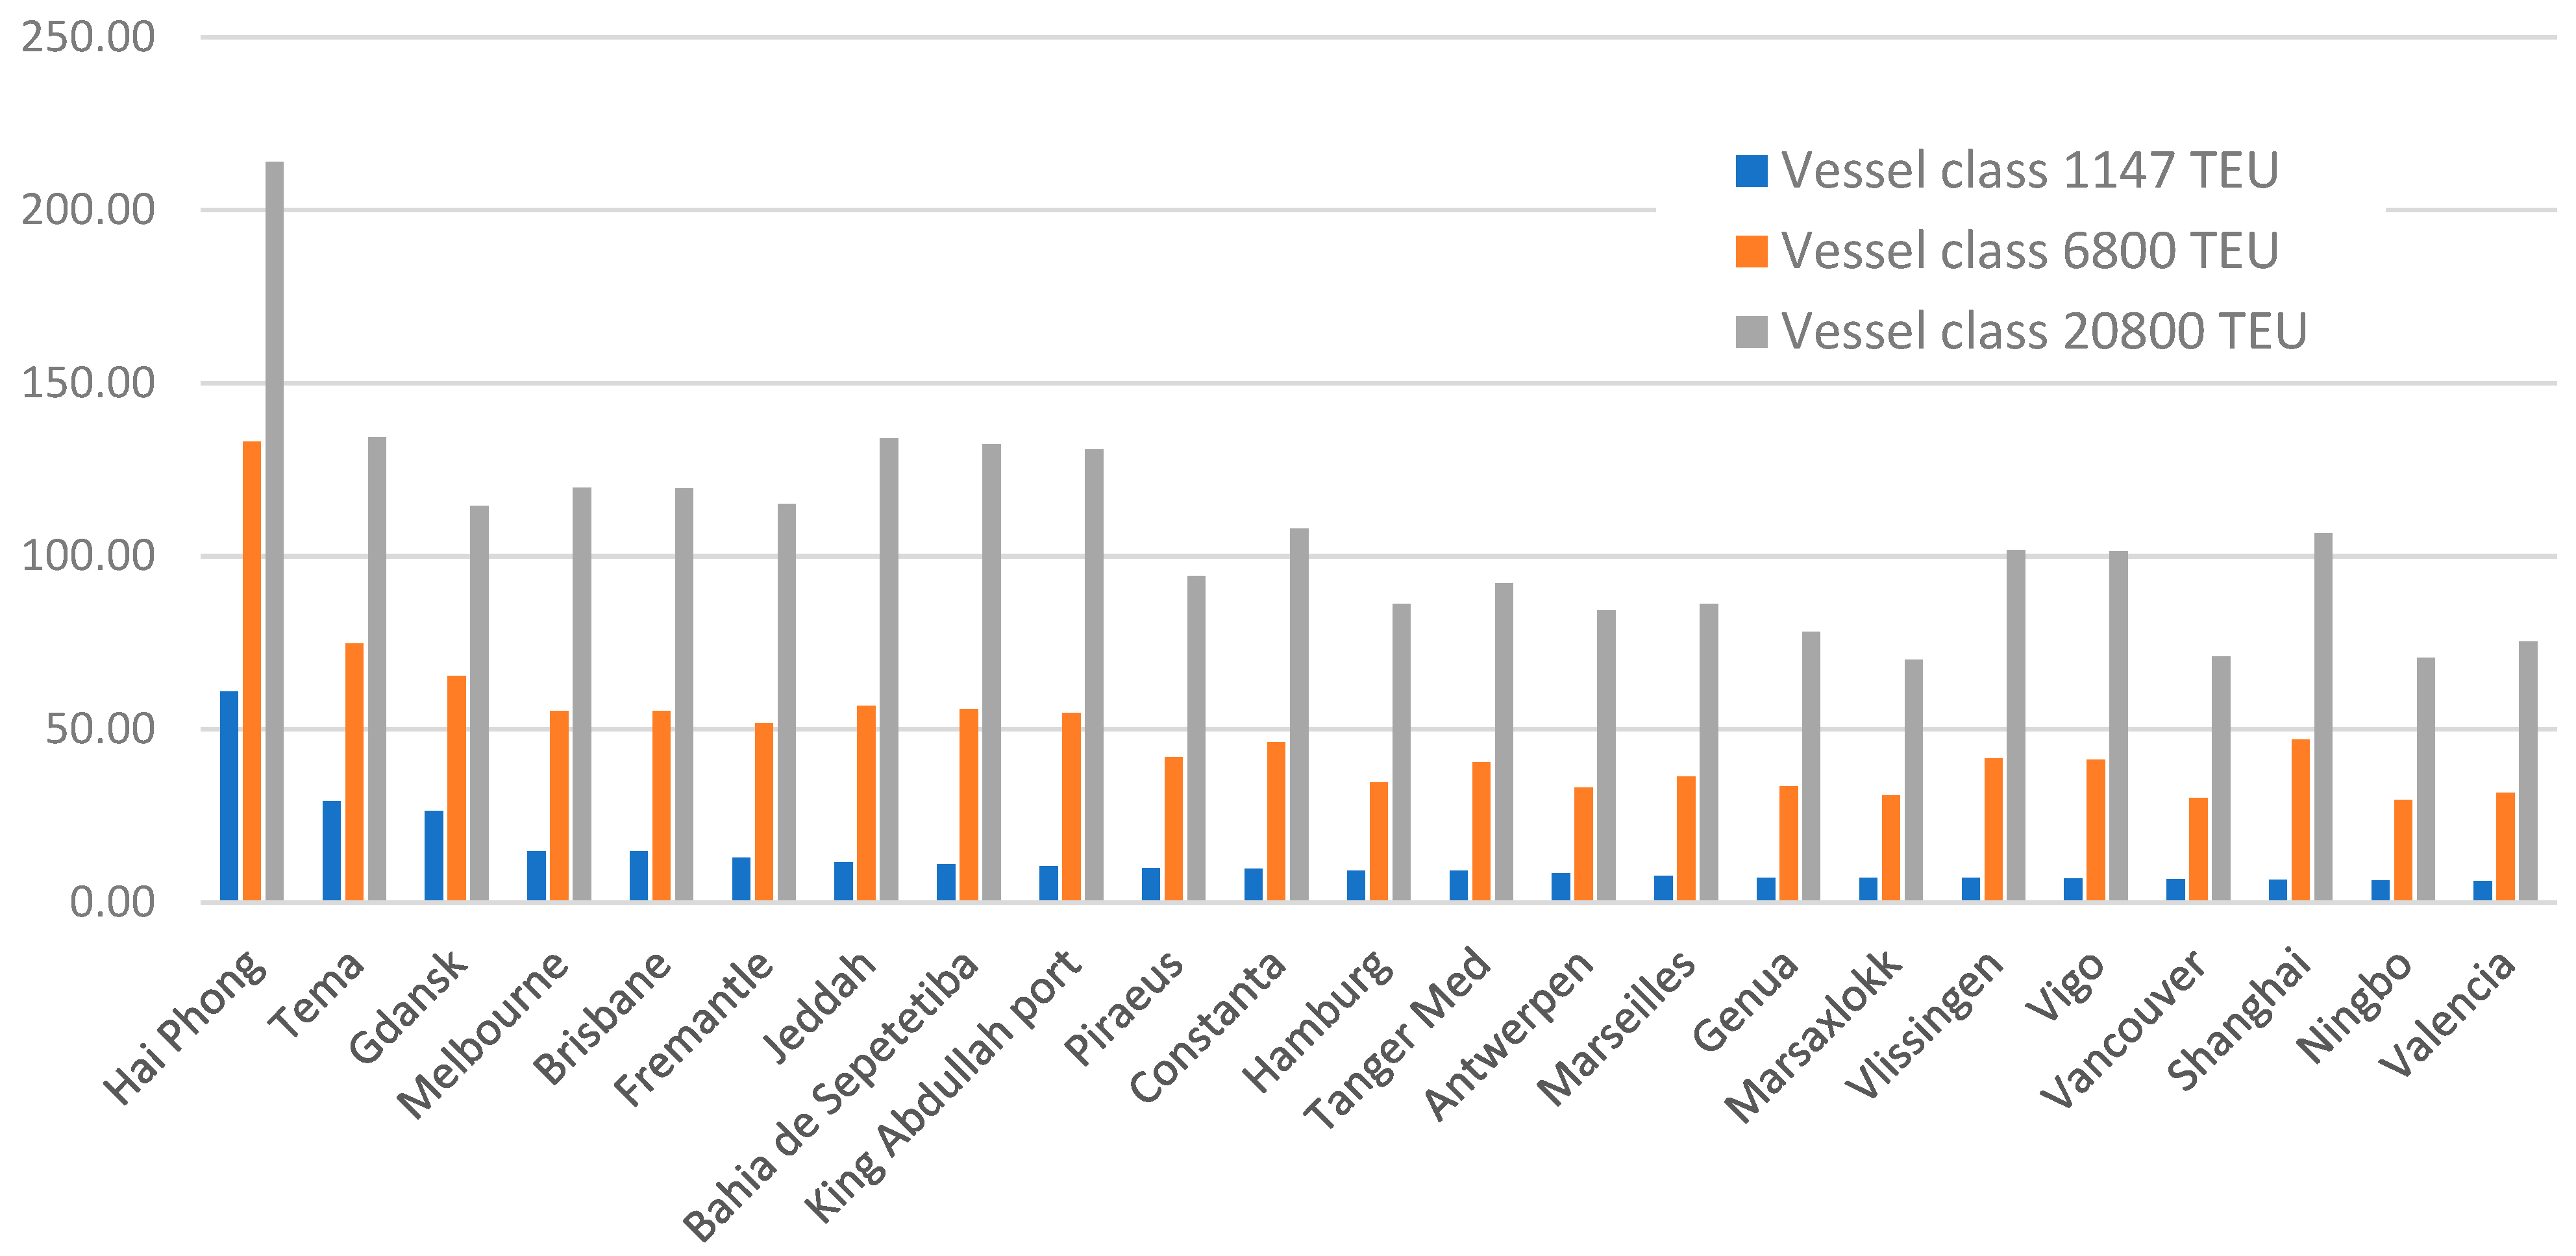
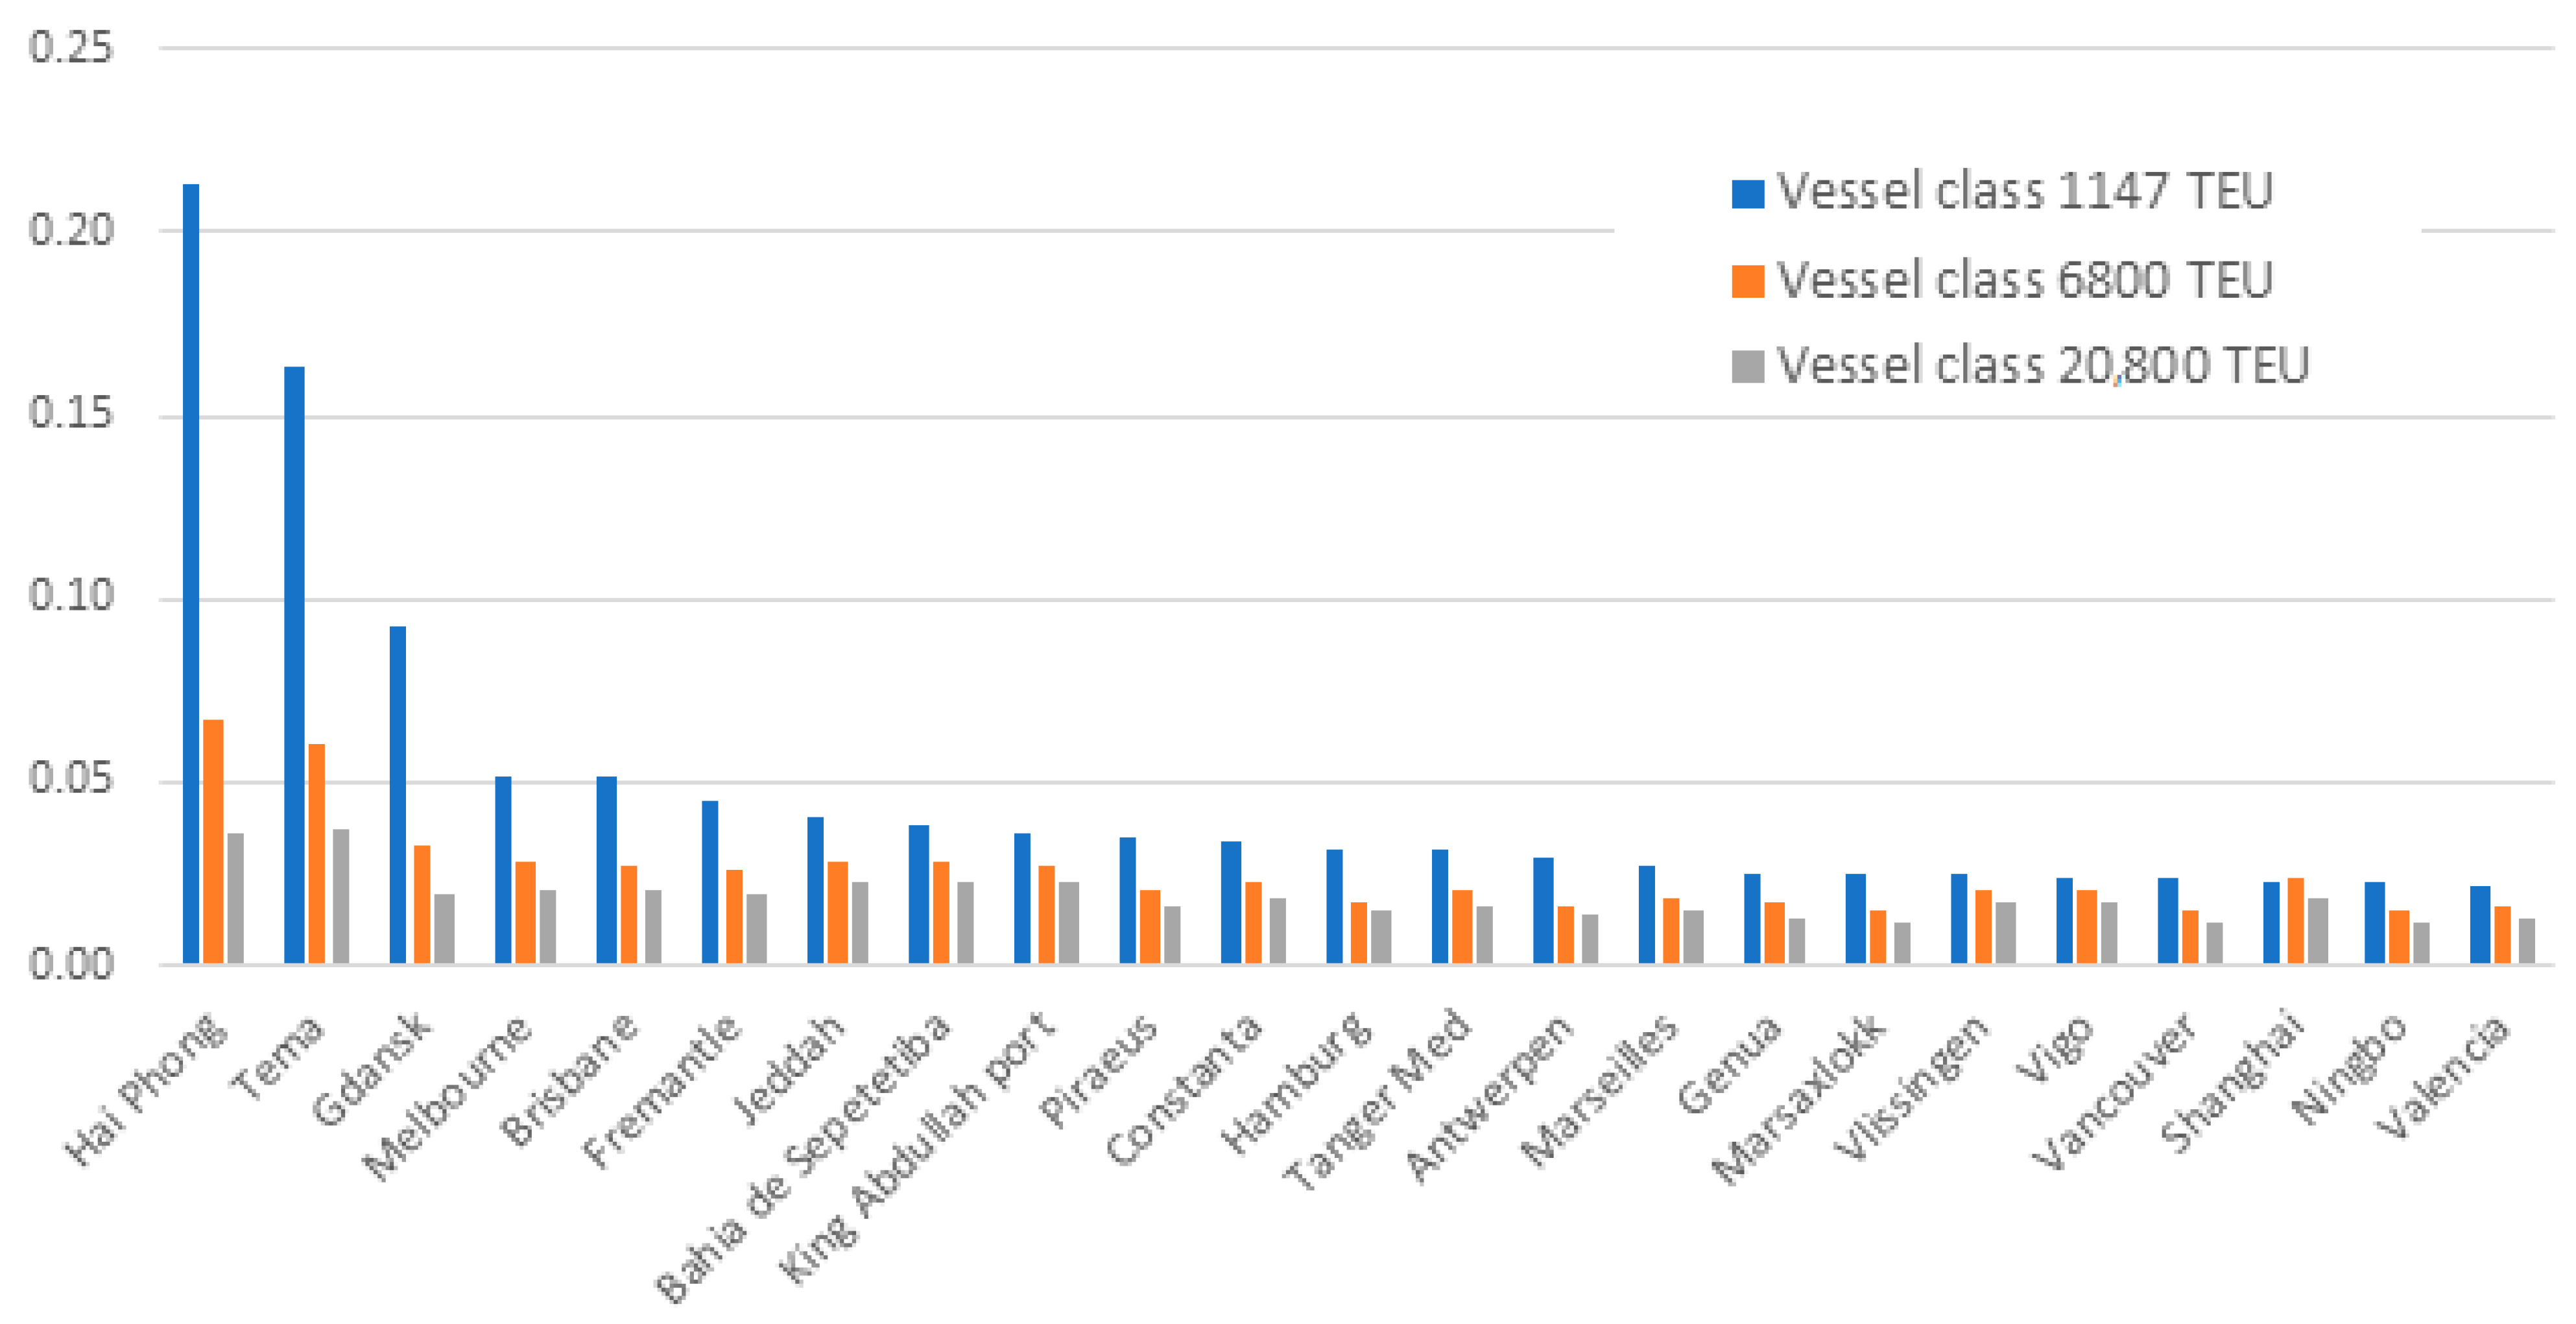
The calculation is performed for three different ship sizes—1147 TEU, 6800 TEU and 20,800 TEU, which each represent a ship technical configuration with specific operational impacts, e.g., MDO consumption during loading and unloading operations (if required in a certain port), required tug services for the approach, distance sailed in the port area by the vessel, etc. In each port, for each of these ship classes, the CO2 calculation outputs are produced at two levels: emissions per ship and emissions per TEU.
Comparisons of vessel emission calculation results are shown for the port phase per ship in
Figure 20 and per TEU in
Figure 21 for a selection of ports.
4.2.5. Regulatory Environment
The OECD has developed Product Market Regulation (PMR) indicators in order to measure regulatory barriers to firm entry and competition in a broad range of key policy areas, ranging from licencing and public procurement to the governance of state-owned enterprises, price control evaluation of new and existing regulations and foreign trade [
56].
The methodology relies on a collection of two sets of indicators. The first set are the economy-wide PMR indicators that measure regulatory barriers to firm entry and competition in the country on a broader range of key policy areas. The second set are the sector PMR indicators, which measure the regulatory barriers to firm entry and competition at the level of specific sectors of the economy. The focus of the second-set evaluation is the network sectors (energy and transport communications), professional activities (involving lawyers, notaries, engineers, etc.) and retail distribution including pharmaceuticals. For water transport, which is the focus of this study, the PMR calculation includes information that describes the market setup and competition limitations set by the laws, barriers to entry, cabotage limitations, involvement of the government in the sector, port operations, ownership and tariff regulation.
In the OECD approach, the sector PMR questionnaire
19 is completed by the member countries. Based on the responses of the countries, the scores on specific indicators are calculated. This allows benchmarking the performance of the countries in the different sectors of the economy.
In this research, in order to produce a PMR water transport evaluation of the countries that can be benchmarked against the OECD countries, the questionnaires are filled in by the World Bank maritime experts for each of the relevant countries. This allows calculating PMR indicator values that are comparable to the OECD results.
Figure 22 shows the calculation of PMR values in this research alongside the OECD calculations of the PMR values. The higher values mean presence of higher regulatory barriers to firm entry and competition. In the calculation results, we see a greater variability of the results for non-OECD countries than in the OECD countries because legislative environments there are much more varied.
5. Discussion
This research was started by investigating the current global trends in the container port and maritime transport sector. Understanding these trends proved to be important for determining which are the key areas that port performance KPIs are supposed to measure, and analysing and interpreting the collected data. The main trends we identified as important are the following:
Growth in megaships—The average ship size is increasing in almost every region. Also, while the annual deployed capacity is increasing globally, since 2018, there has been a lower than average number of ship calls per week.
Increase in consolidation—The number of operational shipping companies in the world has steadily declined since 2016.
Optimisation in shipping routes—There has been a reduction in direct connections for some ports, whereas the number of direct connections has remained at almost the same level (according to data from 2016 to 2019).
Increase in the competitive landscape of ports—This is indicated by a decrease in Herfindahl–Hirschman index values (an indicator of market concentration) globally since 2018. However, although the number of ports with monopolies (an HHI score of 10,000) is declining, there are also signs that market participants are leaving ports with very high competition levels.
These insights helped with the identification of the indicators to include in the maritime data framework. The framework was applied at the country level with no real problems for data collection. At the same time, although an analysis at the country level provides a suitable basis for comparison across countries, in some cases, an additional sub-national analysis would be necessary to obtain a detailed understanding of certain key issues. There were no significant methodological problems when applying the country-level framework for assessing connectivity and accessibility, shipping cost, efficiency and regulatory environment. Also, the application of the OECD PMR methodology due to available documentation was straightforward. The only limitation is in the developing country coverage of the existing database, which necessitates gathering more data in-country to expand the coverage. The assessment of environmental impacts based on the assignment of CO2 emissions has its methodological shortcomings because of a lack of a definition for the fair assignment of “blame” for emissions from maritime freight transport.
Benchmarking based on the developed framework is a valuable tool for evaluating the performance of countries and ports by comparing them with their peers. By analysing various metrics, benchmarking enables the identification of performance gaps and areas in need of improvement. This comparative analysis provides valuable insights into the strengths and weaknesses of different ports, allowing for the establishment of realistic expectations for performance enhancements. Moreover, benchmarking facilitates the tracking of progress over time, enabling stakeholders to monitor performance increases or decreases in specific areas identified for improvement. By leveraging benchmarking, countries and ports can make informed decisions and implement effective strategies to enhance their operational efficiency and competitiveness.
Furthermore, benchmarking can serve as a catalyst for continuous improvement and the improvement of the competitive position of ports. By examining best practices and successful approaches from top-performing ports, countries and individual ports can learn from others and adopt proven strategies. This approach may help drive innovation and encourages the adoption of industry-leading practices. As a result, benchmarking contributes to the overall development and growth of countries and ports by providing a framework for continuous evaluation and improvement in performance.
The time series data in our indicator framework show the types of impacts that unexpected events could have on the cargo flows. They could include general transport demand drops globally or in certain specific regions, blockages of certain parts of the maritime transport network, sudden changes in economics of shipping that impact the supply or demand of maritime transportation and decrease the volumes, etc. These impacts on maritime transport result in a lower overall performance of maritime transportation and changes in connectivity, accessibility, shipping cost, environmental impacts and operational efficiency—parameters that are the first four major sections in the developed framework.
It is impossible to predict what will cause the next disruption in maritime transport, and if it were, most disruptions could be avoided. It is, fortunately, possible to prepare for the impacts of the disruption by aligning one’s infrastructure, operations and policies to be more resilient to disruption. The developed framework should assist in answering such questions.
6. Conclusions
This research developed a framework to perform country and port benchmarking, following main trends in shipping and ports. The framework is based on maritime statistic data that address five areas of interest: connectivity and accessibility, shipping cost, efficiency, environmental impacts and regulatory environment. It was chosen to develop the data framework at two levels. At the country level, data in the five areas were included. The port level of the framework contains indicators in the same five areas as the country level.
In developing and applying the framework at both the country and port level, we conclude that the components selected for the framework are adequate for answering the second research question. The framework proved to be suitable for assessing and comparing port performance, for specific ports or ranges of ports. The data collection, with the design of the framework, is relatively straightforward and requires only simple recalculations.
The application of the developed framework allows structuring the required data collection. The framework development was guided by data availability; therefore, it can easily be re-applied in a different context, which is a strong advantage of the proposed framework.
The indicators that were included in the framework allow effective benchmarking of port and country performance in the five areas of interest. With these indicators, benchmarking becomes a powerful tool for assessing and improving performance, aiding in the identification of areas for enhancement and the implementation of actions for improving performance.
We did find, however, that the assessment of environmental impacts based on the assignment of CO2 emissions has its methodological shortcomings because of a lack of a definition for the fair assignment of responsibility for emissions from maritime transport. Also, cost data cannot be obtained for every port of the world and require manual inputs for each port. The collection of these data is therefore more practical for a specific port or a range of ports that are investigated in detail when the framework is re-applied for port performance assessment.
To further develop the framework, it would be beneficial to add an assessment of port-level technical efficiency using a stochastic frontier analysis. This analysis is not feasible at a global scale due to specific data quality requirements for performing the calculations, but would be possible for ports of interest for which detailed data can be obtained.
