Article

An Integrated Resilient Sediment Transport RIsk Management (IRSTRIM) Approach for Estuaries

1
Department of Civil Engineering, K. N. Toosi University of Technology, Tehran P.O. Box 15875-4416, Iran
2
Belle W. Baruch Institute for Marine and Coastal Sciences, University of South Carolina, 209A Sumwalt Building, Columbia, SC 29208, USA
3
Institute of Geophysics, University of Tehran, Tehran P.O. Box 14155-6466, Iran
*
Author to whom correspondence should be addressed.
J. Mar. Sci. Eng. 2023, 11(7), 1471; https://doi.org/10.3390/jmse11071471
Submission received: 23 May 2023 / Revised: 18 July 2023 / Accepted: 20 July 2023 / Published: 24 July 2023
(This article belongs to the Section Ocean Engineering)

Abstract

:
Estuaries around the world are facing numerous threats, including urbanization, industrialization, resource scarcity, and the impacts of climate change. To increase estuarine resilience, it is crucial to manage these ecosystems to maintain their functionality. Sediment transport resilience is a critical factor that affects the performance objectives of navigation, storm damage reduction, and ecosystem restoration. This paper focuses on an integrated resilient sediment transport risk management (IRSTRIM) approach for estuaries. The framework quantifies resilience indexes such as reaction amplitude, graduality, and recovery rates of “sediment transport” to “river and sea interaction” in the Arvand Estuary, the Persian Gulf. Additionally, three indexes, the tidal asymmetry index (TAI), saltwater intrusion vulnerability index, and infill rate, are developed to aid in resilient sediment management. The quantified indexes successfully incorporated tidal asymmetry, sediment characteristics, bed properties, and flow hydrodynamics. Different resilience and resistance management scenarios are evaluated using a decision support system. Based on the results, tidal barrier application, as a resilience scenario, is the best scenario, and the dredging scenario, as a resistance one, is the worst scenario. The reaction amplitude with a weight of 0.39, and the TAI with a weight of 0.27 are determined as the most effective indexes.

1. Introduction

Estuaries are important environmental and economic regions, providing communities with ecological benefits as well as resources for navigation, tourism, and commercial fisheries [1]. The dynamism of estuaries mainly depends on sediment transport processes [2,3]. Although sediment transport can provide some benefits such as beach formation and the enhancement of the fertility of deltas, namely wetlands and aquatic plants and animals [4,5], they can also cause serious problems in estuaries. For instance, research shows that an increase in tidal range due to estuary mouth erosion contributes to rising sediment imports from the sea toward the estuary [5,6]. This sediment accumulation leads to changes in freshwater quality, soil fertility, and increased tidal asymmetry along the river [7,8], which needs further investigation and coastal management strategies.
Sediment risk management, within the context of sustainable development, aims at the ability to meet current needs without disrupting natural cycles [9,10]. Implementing an effective sediment management approach can help maintain or enhance the ecological functionality of riverine, estuarine, and coastal environments [11], as well as guarantee the long-term sustainability of economic activities (e.g., navigation and renewable energy production) and human/environmental safety (e.g., flood conveyance and slope stability).
Resilient risk management addresses the complexities of large integrated estuarine systems and the uncertainty of future threats [12]. The term “resilience” as a new concept in the literature comes from “resilio” in Latin [13,14], and it was first introduced to ecological systems by Holling in 1973 [15]. Holling defines resilience as the capability of a system to retain its functional performance after a disruption. Resilience is often associated with the recovery or return from a disrupted situation to a functional performance situation and is discussed in various research areas such as ecological, engineering, and community resilience. Ecological resilience describes the ability of a self-organized ecological system to absorb damage and remain functional [15,16,17]. Engineering resilience describes the ability of a system to maintain functional performance in the face of a disturbance and/or return to its pre-disturbance performance level following a disturbance [18,19,20,21]. Finally, community resilience refers to the ability of communities to withstand and recover from external stresses and disturbances by learning and adapting in ways that pre-empt and avoid major changes that would otherwise disrupt their performance [21].
Resilience risk management is mainly employed to keep the performance of interdependent systems of systems’ components under various risk scenarios [22,23]. In the context of estuaries, the components of these systems can be divided into anthropogenic and natural features. The processes in these systems are the set of sustained physical, chemical, and biological phenomena that contribute to their function. These sets of systems can be further divided into three subsystems: navigation, storm damage reduction, and ecosystem restoration [24].
Interdisciplinary models connecting different systems have been widely used in the last decade to inform stakeholders and managers about the resiliency of these systems [25,26,27,28,29,30,31,32,33,34,35,36]. One of the main and critical elements of estuarine systems’ resiliency studies is sediment transport due to its critical role in increasing the resiliency of coastal ecosystems [25,37], as well as the stakeholder demand for sediment management in coastal regions.
To inform management decisions, various quantitative measures for the engineering resilience of systems have been presented in research studies [18,19,20,38,39,40]. Among these, the amplitude or magnitude of the reaction to disturbances, the graduality of reaction(s) under increasing disturbances, and the recovery rate [41,42] are some of the widely used indexes. Measuring the loss of system performance following an impairment of a system is one of the general methods to quantify resilience. This quantified value is known as reaction amplitude which is measured in terms of any useful metric or combination of metrics. The definitions for each of the indicators are different according to the target problem. For instance, some of the indicators that have been chosen based on different management criteria are expected annual damage (EAD) [23], expected average number of casualties per year (EANC) [23] in flood resilience management, and reductions in the required material to keep organisms’ life in the natural environment. Hence, there is a need to reach a scientific consensus on resiliency quantification in the coastal and marine science community and provide a new definition for the above-mentioned indicators in the estuarine environment.
Resilience quantification requires determining the specific response variables such as fluid velocity, tidal range, and bed resistance in estuarine sediment management. To determine these variables, resilience has to be defined by noting the “of what” and “to what” terms in systems, which indicate how a subsystem could reach the status of being resilient to anthropogenic or natural changes [43]. This study aims to clarify a scientific resiliency quantification approach by investigating the resilience of “sediment transport in a fluvial estuary” in the northwestern part of the Persian Gulf to “river and sea interaction”. This research also presents an integrated resilient sediment transport risk management (IRSTIRM) approach for evaluating sediment management in estuaries through modeling and quantifiable metrics of resiliency. In this regard, by focusing on the main evolutionary (internal or external) forces, several indexes are proposed and efficiently applied within the IRSTRIM approach. This approach introduces a hierarchical method that facilitates the investigation of various sediment transport risk management methods and decision-making. This approach can assist coastal managers to appreciate the suggestions and assessments of various risk aspects and quantified resiliency factors of estuarine systems.

2. Materials and Methods

2.1. Study Area

The Arvand Estuary is located in the southwest of Iran. This fluvial estuary receives flow and sediment from the Arvand River. The Arvand River—also known as Shatt-al-Arab—is one of the longest tidal rivers on the border of Iran–Iraq which is formed by the conjunction of the Tigris and Euphrates rivers in Iraq and Karun River in Iran (Figure 1b) [44]. Three major cities, Abadan, Khoramshahr, and Basra, are located around it (Figure 1b), with the river running mainly towards the south to reach the Persian Gulf [45]. Before discharging into the Persian Gulf (Figure 1c), the river varies from 270–2500 m in width and 9–15 m in depth, which implies that it is navigable. It supports marine habitats along the northwest coast of the Persian Gulf and in the Mesopotamian marshes [46]. The hydrodynamics of the estuary are affected by upstream discharge and downstream tides. The tide in the estuary is classified as semi-diurnal, with an average of 2.6 m at the mouth of the river near the Persian Gulf [47]. The tide affects the upstream river by an average of 1.4 m at Abadan city (about 74 km from the river mouth) and continues upstream [48,49].

2.2. Resilient Sediment Transport Risk Management Approach

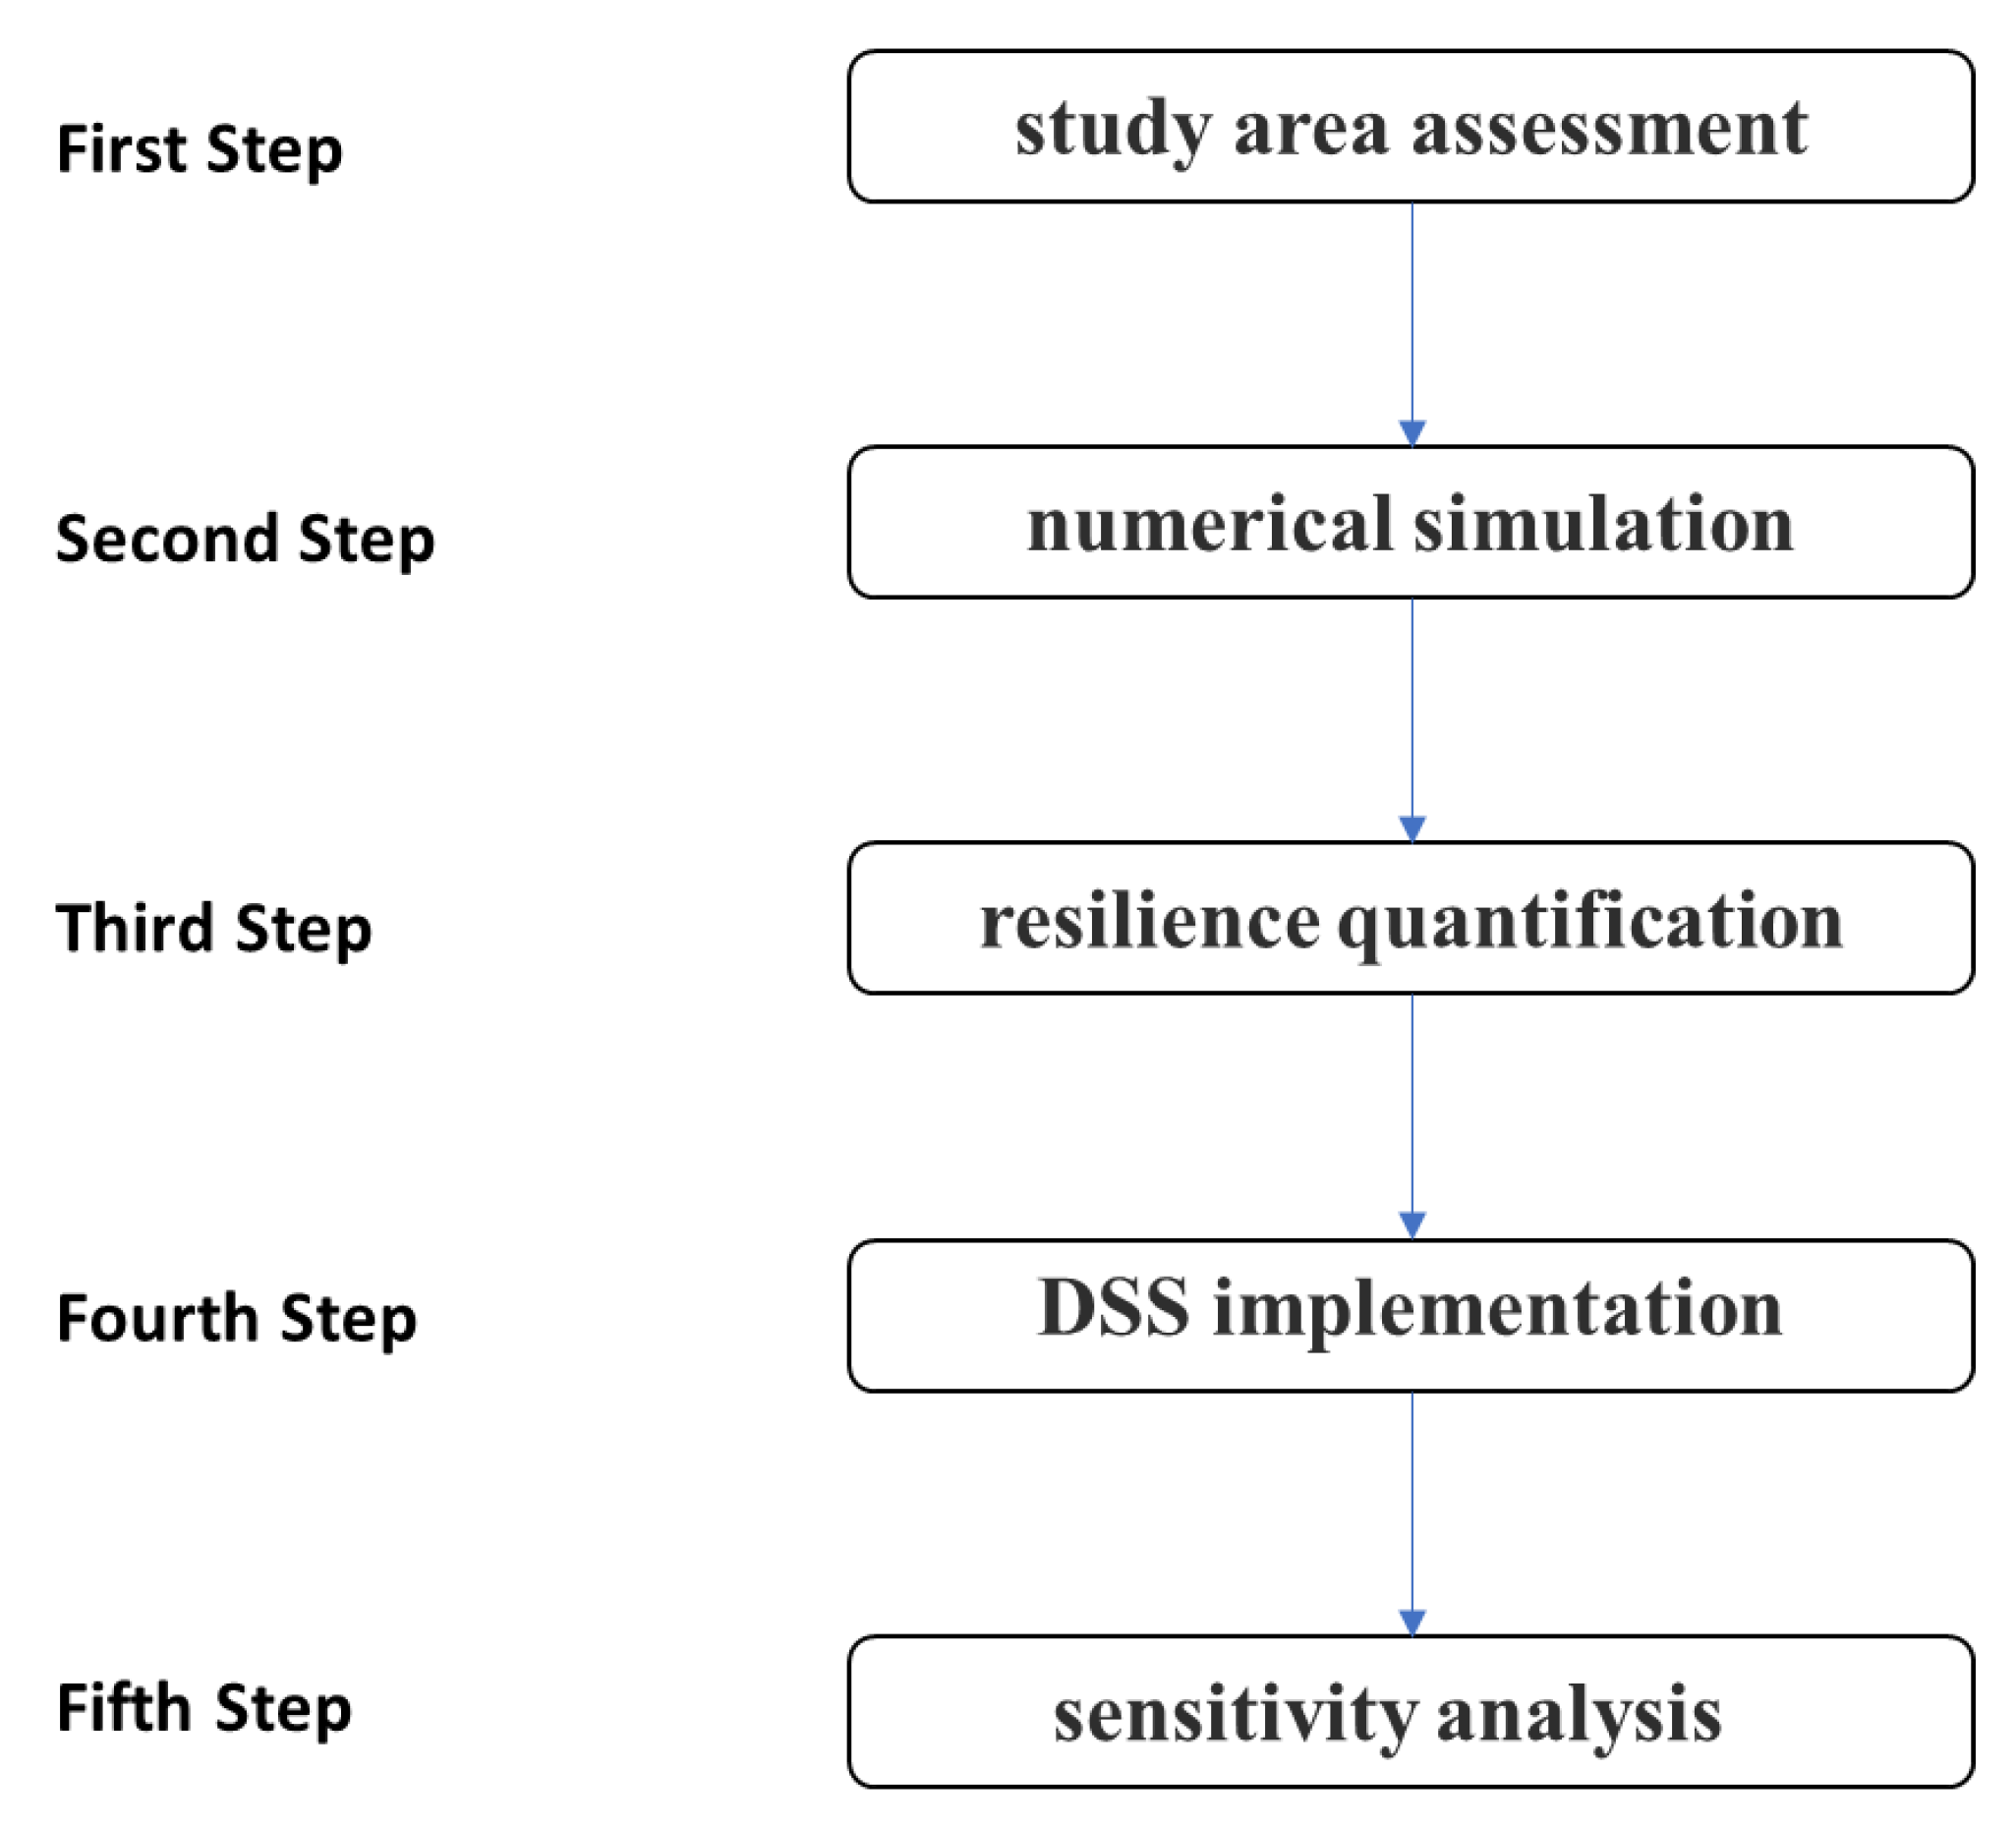
To employ resilient sediment transport risk management in estuarine systems, a resiliency quantification approach has been developed. The proposed approach (Figure 2) presents a process starting with a study area assessment in order to determine whether the area needs sediment management implementation or not. In the areas threatened by sediment transport risk, major factors used in the resiliency quantification module will be determined. Numerical simulations and the modeling of the hydrodynamic conditions considering management scenarios provide inputs for the resiliency quantification part of the proposed approach. The decision support system (DSS) module, in the next step, selects the preferred management scenario using resiliency quantification outputs. To assess the selected scenarios, this approach proposes sensitivity analysis in the final step to confirm the management decision.

2.2.1. Study Area Assessment

Any estuary, its location, the geography of the system, and its hydrodynamics introduce sediment transport potential to the subsystems of the estuarine system. Sediment transport is a natural process and it is not always considered a risk. In some situations, according to human needs and the expected performance of the system, sediment transport is identified as a threat and risk. In this situation, its management is addressed and the concept of IRSTRIM is applicable. Taking into account the important aspects of sediment transport risk leads to the determination of suitable resilience indexes and appropriate management strategies. To assess any study area, it is critical to investigate the archive of satellite images and periodical hydrographs, and evaluate the long-term changes in the study area.

2.2.2. Resilience Quantification

The resilience of a system is determined by calculating its response to forces that affect the functional performance of processes and components. This force could be investigated as a disturbance or evolutionary force. Schultz et al. [24] define disturbance as any sudden change in forces that could affect major processes and damage system function. Evolutionary force is described as a gradual change that significantly influences the function of the elements and processes of a system [24]. The changes due to evolutionary forces are persistent rather than the transient changes resulting from disturbance forces. The gradual erosion of coastal areas is an example of an internal evolutionary force. Sediment import or export is another example of an external evolutionary force that may affect the functional performance of navigation infrastructure. Research shows that major resilience factors that need to be quantified are reaction amplitude, recovery rate, and graduality rate, which are modified and updated for the IRSTRIM approach.
Due to the focus of this study on sediment transport risk management and increasing the resiliency of estuarine systems, the authors introduce additional critical factors that need to be quantified such as the tidal asymmetry index (TAI), saltwater intrusion vulnerability index, and infill rate.
  • Reaction Amplitude
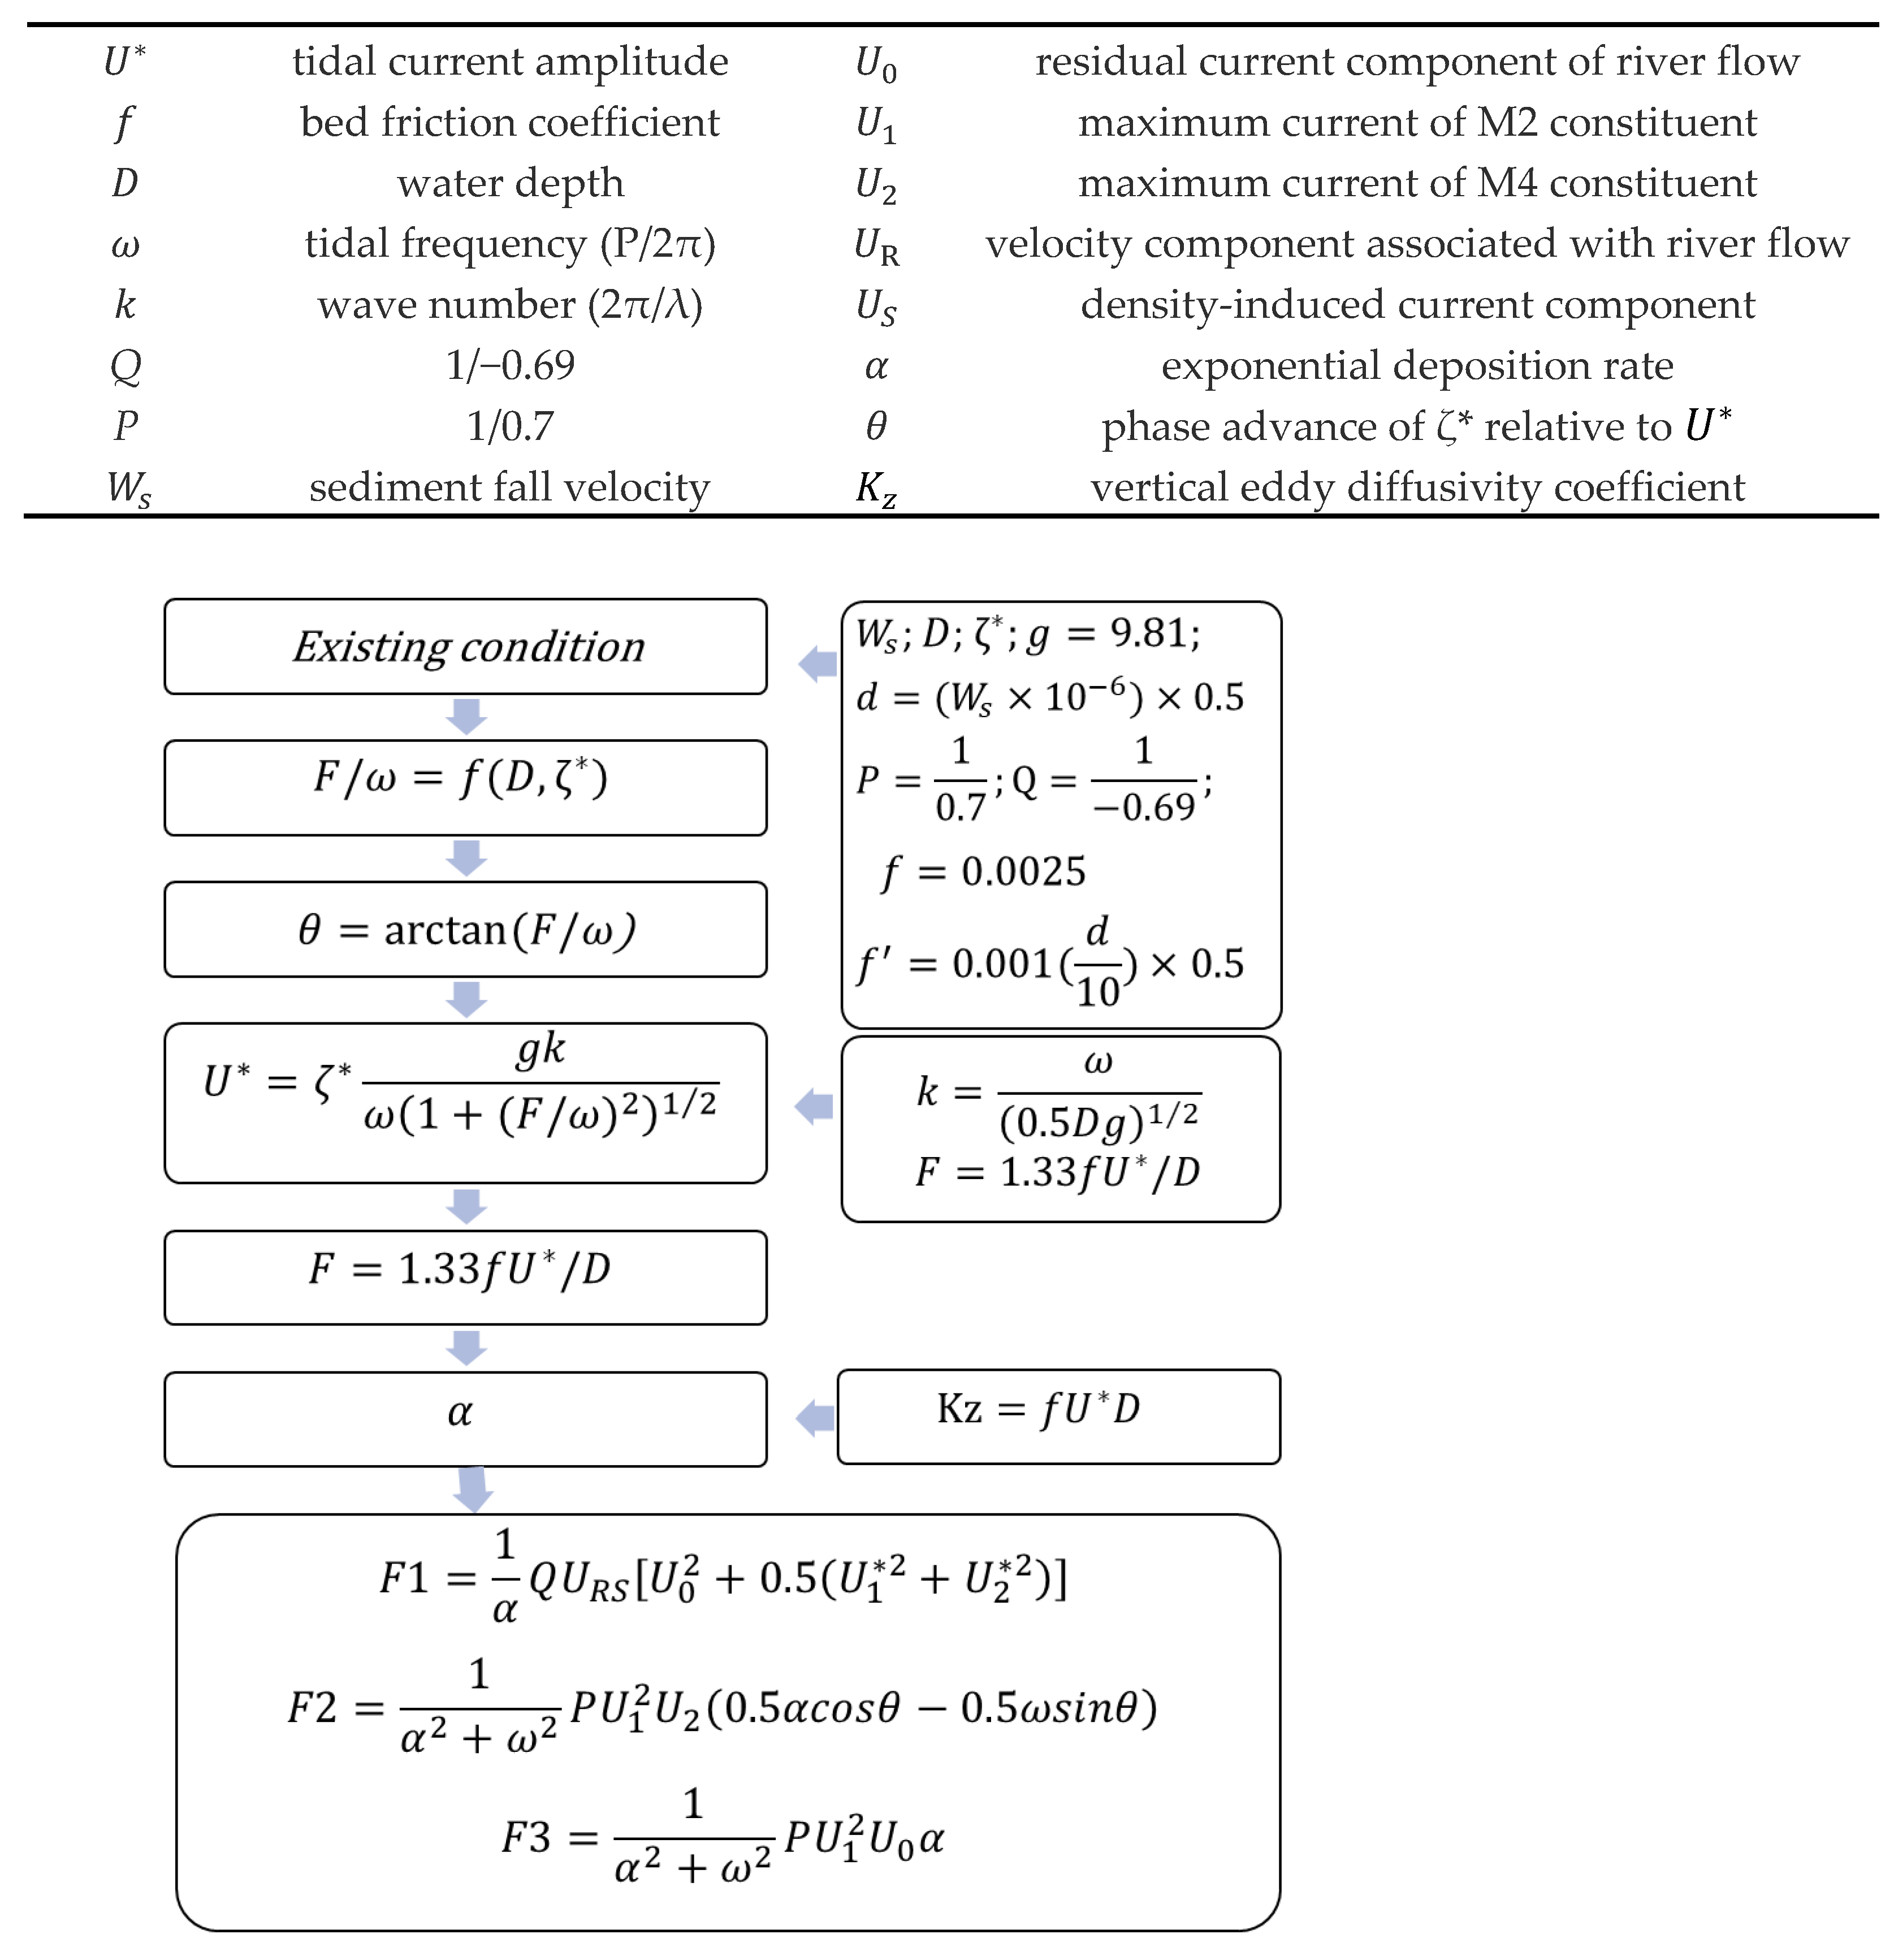
In this research, the reaction of the system to the evolutionary force of sediment transport is described using the expected amount of sediment fluxes in a one-year time period as the reaction amplitude. To quantitatively estimate the index value, the analytical emulator for sediment concentrations and fluxes presented by Prandle is used. In this analytical approach, the flow is assumed to be one-dimensional and sediment advection in the horizontal direction is ignored. Erosion is assumed to be proportional to the current speed squared, modulated by an exponential settling rate (proportional to e α t ) to yield the mean and tidally varying components of sediment concentration. Sediment fluxes involve the products of erosion, modulated by deposition, multiplied by the velocity component of an assumed constant depth. The reaction amplitude consists of three components of Equations (1)–(3). The first component, F 1 , represents the sediment flux associated with the product of the time-averaged suspended particulate matter (SPM) concentration, residual currents of the river flow and saline intrusion. The second component, F 2 , results from the semi-diurnal SPM component generated by the combination of M2 and M4 currents, advected by the semi-diurnal current of M2 constituent. The third component, F 3 , is similar to F 2 , except the semi-diurnal SPM component arises from the combination of U 0 and U 1 c o s ω t .
F 1 = 1 α Q U R S U 0 2 + 0.5 U 1 2 + U 2 2
F 2 = 1 α 2 + ω 2 P U 1 2 U 2 0.5 α c o s θ 0.5 ω s i n θ
F 3 = 1 α 2 + ω 2 P U 1 2 U 0 α
  t a n θ = F ω
F = 1.33 f U D
U = ζ g k ω 2 + F 2 1 / 2
k = ω 0.5 D g 1 / 2
K z = f U D
U R S = U R + U S  
U 0 = U 0 + U R + U S  
U S = 1.55 U R
α = 0.693   W s D 10 X
x 2 0.79 x + j 0.79 j 0.144 = 0                 ,             j = log 10 K z / W s D
Evaluation of these three components of reaction amplitude requires calculating some parameters as follows. U R S is calculated via the summation of the velocity component associated with river flow, U R , and density-induced current component, U S ; see Equation (8). P and Q are two constant values equal to 1/0.7 and 1/−0.69, respectively. The phase advance of ζ* relative to U as θ is a function of ( D , ζ*) and approximately equal to unity for ζ* = D /10. For values of ζ* >> D /10, tidal dynamics become frictionally dominated, whereas for ζ* << D /10 friction, f in Equation (5), becomes insignificant. The F ω ratio (equal to t a n θ as in Equation (4)) is extrapolated from the presented diagram in Prandle [50]. Friedrichs and Aubrey [51] showed the predominance of the friction term in convergent channels, irrespective of depth. To calculate U and ω , Equations (6) and (7) have to be solved simultaneously. As Prandle [52] suggests, the density-induced current component is calculated based on Equation (11). The parameter α is defined as a variable to calculate the half-life in suspension, t 50 = 0.693 α , in Equation (12). K z as the vertical eddy diffusivity coefficient is also calculated in Equation (8). Figure 3 illustrates the trend of reaction amplitude calculations. Other parameters are described as follows.
  • Recovery rate
Generally, the rapidity of recovery is the time between the disturbance event and the time at which a pre-disturbance level of performance is recovered; see Equation (13). In this study, the recovery rate in the sediment transport process is defined based on the concept of dynamic stability, which was first introduced by Gilbert [53]. Dynamic stability in sediment studies is defined as an equilibrium between sediment transport, erosion, and sedimentation, which is a function of physical, chemical, biological, and hydrodynamic parameters [54]. The recovery rate is described as the required time for a system to establish an equilibrium from a disturbance and move from a disturbed stable state to the next stable state [55]. Since the study is focused on sediment transport risk management, the recovery rate is determined as a function of the suspended sediment concentration’s rate of change. Due to the exponential settling rate of the suspended sediment concentration in Equation (14), the recovery time is obtained by employing Equation (15). The recovery rate varies with the suspended sediment concentration, as in Equation (16), which is affected by tidal current, river flow, and sediment type and size; see Equation (17).
R i = d   P e r f o r m a n c e   t d t = C p e r f o r m a n c e C d i s r u p t e d   s t a t e T s t a b i l i z i n g T r e c o v e r i n g
C performance = C disrupted   state × e α T r e c o v e r i n g
T r e c o v e r i n g = 1 α ln C disrupted   state ln C performance
R i = α C performance C disrupted   state ln C disrupted   state ln C performance
C ω = γ f ρ U N ω D ω 2 + a 2 1 2
  • Graduality rate
The gradualness of the disturbances increases the resilience of a system, as slower changes allow for more adaptive responses and reduce the stress on the system [23]. Therefore, the graduality rate index is defined by the relative increase in the speed of occurrence of disturbances or the relative increase in damages or losses [22]. In this research, the rate of gradual and persistent change is illustrated as a function of reaction amplitude changes. According to the presented graduality rate in Equation (18), a sustainable system without any changes will have a value of 0 while a system with sudden changes will be denoted by 1.
G r a d u a l i t y F = 1 0.5 ζ 2 ζ 1 1 F T 2 F T 1 1
F T = F 1 + F 2 + F 3
  • Tidal asymmetry index
Coastal managers need to make informed decisions to increase the resiliency of estuaries against sediment transport risks [56,57,58]. Morphodynamics and sediment transport in estuaries majorly depend on tidal asymmetrical behavior and variability and its consequent effects [59,60,61,62,63,64]. The difference in duration between the rising and falling phases, due to tidal asymmetry, leads to an offset between the velocities of flood and ebb tides. A higher flood velocity transports a larger amount of sediment from the sea to the estuary than that of the sediment exported from the estuary to the sea, while the ebb-dominant condition flushes more sediment out through the estuary [65,66].
To assess tidal asymmetry along the estuary, the tidal asymmetry index ( T A I R i v e r ) is employed based on the relative phase between M4 and M2, as in Equation (20), and is defined as Equation (21) [67]. This index indicates the bias of all sections along the river from the symmetric condition and varies between 0 and 1. The closer T A I R i v e r is to 0, the higher symmetric condition is.
T A = 2 φ M 2 φ M 4
T A I R i v e r = 1 L l : R i v e r   P a t h   T A I 180 180   d l
  • Saltwater intrusion vulnerability index
Various impactful phenomena affect the amount of sediment transported in estuaries including saltwater intrusion and turbidity, which could be related to processes in regions such as the turbidity maximum. The turbidity maximum region influences the upstream (landward) transport of fine suspended sediment and is affected by different hydrodynamic processes such as tidal asymmetry. This asymmetry causes a residual flow pattern, as well as estuarine circulation and stratification resulting from density variations between seawater and river water.
Further upstream in the estuary, residual flow is dominated by river discharge. The convergence region is developed between the river flow’s suspended sediment in the upstream and tidal asymmetry and estuarine circulation’s suspended sediment transport in the downstream. Fine suspended sediment accumulates in the convergence zone upstream and downstream, and forms the turbidity maximum. This zone is generally located around the location of maximum seawater intrusion [68,69,70,71]. When river discharge is high enough, the turbidity maximum can be flushed out from the estuary [72,73].
The turbidity maximum leads to the flocculation of cohesive sediment in the presence of saltwater. Then, the estuary acts as a trap for fine sediments. In this case, a gradual infill of the estuary takes place. Moreover, high turbidity prevents the penetration of sunlight and makes the estuary more vulnerable to environmental stressors [74,75,76].
In this study, the saltwater intrusion length ( L I ) is introduced as the saltwater intrusion vulnerability index (SIVI) to assess the different management strategies, which affect the formation of turbidity maxima or flush it out of the estuary. L I is a function of factors such as tidal range, river flow, and wind speed. Investigating the salinity infiltration process requires recognizing the effects of different physical processes. Here, the following empirical equation [77,78] is used to evaluate the amount of L I . According to Equation (23), L I is directly proportional to the water depth in the mouth of the river. According to the observations of Prandle, the calculated values for the L I are based on tide ranges, the density gradient, bed friction coefficients, river flow, water depth, and flume length.
L I = 0.005 D f U U R = 0.00274 D 3 4 ( f ζ ω ) 1 2 U R
  • Infill rate index
The long-term morphodynamic evolution of estuaries is influenced by both external factors, such as tides, riverine flow, and sediment fluxes, and internal factors (such as the geometry and erodibility of the bed). The multiple interactions and feedback between various physical processes result in highly complex evolutionary trends. In this study, to simplify the evaluation of the morphodynamic evolution of the estuary, the infill rate Equation (25) based on Prandle’s study [50] is applied. An estimate of the minimum in-fill rates (IF) has been obtained based on the assumption of fine marine sediment flow as a continuous suspension (such as salt) in an estuary [50].
T F = 0.5 L I / 2 U 0
I F = ρ s T F 0.69 C

2.2.3. Numerical Simulation

To evaluate the resilience of the Arvand Estuary quantitatively, some data are required as input. The Delft3D model developed by Delft Hydraulics (https://www.deltares.nl/, accessed on 16 June 2023) was operated to simulate the hydrodynamics of the study area. In this regard, a regional model was developed for the Persian Gulf and then a nested local model based on the extracted downstream boundary condition from the Persian Gulf model was simulated. Arvand Estuary simulation and calibration employed in this study were published and explained in detail.
  • Management strategies
Two different types of strategies could be selected for sediment transport risk management: resilience and resistance. These two strategies need to be investigated and compared to better inform coastal managers to reach the most preferred decision. The IRSTRIM approach includes both of these strategies for stakeholders. As an example of a resilient strategy, the construction of tidal barriers, which changes the tidal regime in the river, leads to relatively constant tidal asymmetry along the mouth of the estuary [67]. Furthermore, wetland restoration and development is considered an ecological resilience strategy [79]. It leads to a change in the flow pattern and the propagation process of tidal currents by dissipating wave energy [79,80,81]. These natural-based features could be engineered and created as a resilient strategy [82,83]. This study also investigates the maintenance dredging strategy as a resistance sediment management approach. The primary goal of maintenance dredging is to make the waterway more suitable for human use by adding depth to the navigation channel. This method could lead to ecological damage, changing the tidal flow regime, reducing the flow speed, and increasing the sedimentation rate due to deepening.

2.2.4. DSS Implementation

The IRSTRIM approach bridged the gap between resilience theory and practice with a decision support system to assist decision-makers in the planning and management of resilient systems. Afterward, the resilience indexes were calculated for different management strategies, using multi-criteria decision-making (MCDM) techniques for prioritizing management strategies [84]. The DSS phase of the resilient management approach implements the Entropy method to adjust the final weights of indexes. Finally, the TOPSIS selection method is employed [85].

2.2.5. Sensitivity Analysis

Since the reliability of the output results from the IRSTRIM depended on the input parameter values, it was necessary to perform a sensitivity analysis to evaluate the results against the uncertainties. Therefore, the influence of possible uncertainties governing the effective input parameters on the quantified indicators was analyzed in order to determine the sensitivity of the resulting prioritization and the decision was made.

3. Results and Discussion

In this research, the IRSTRIM approach is applied to the Arvand Estuary to investigate the sediment transport change risk and inform various management decisions in this estuary.

3.1. Arvand Estuary Assessment

In recent decades, considerable dam construction, climate change, and reductions in precipitation have decreased riverine discharge, which has resulted in the domination of tidal currents in the Arvand fluvial estuary. Consequently, this estuary has been affected by the following items:
  • Increased salinity intrusion [86,87];
  • Increased rate of sea sediment intrusion [7];
  • Changes in tidal asymmetry in the river [7,88];
  • Tidally forced river mouth erosion [7], intensified by the above factors.
These changes are confirmed by employing long-term assessments of the Arvand Estuary. The water body boundaries extracted from processed satellite images, namely Global Surface Water Explorer (GSWE) datasets (https://global-surface-water.appspot.com/, accessed on 23 June 2023) [89], were assessed to investigate the shoreline change effects on sediment transport. GSWE employs the entire archive of the Landsat 5 TM (Thematic Mapper), the Landsat 7 ETM+ (Enhanced Thematic Mapper Plus), and the Landsat 8 OLI (Operational Land Imager) orthorectified, TOA (top of atmosphere) reflectance, and brightness temperature images acquired from 1984 to 2019 [90]. In Figure 1d, the green area indicates previously dry land and current tidal zone regions due to increased tidal currents in the estuary. However, the orange area represents a previously intertidal region which has become inundated in recent years. In general, the inundation of the intertidal zone expands gulf boundaries and moves the river mouth northward affecting the tidal regime and asymmetry. Consequently, this area is exposed to a sediment transport hazard, and sediment transport risk management is required.

3.2. Numerical Simulation

Hydrodynamic simulations for the current condition were performed and three proposed management scenarios were established to prepare the required inputs of the IRSTRIM. The Arvand Estuary hydrodynamic model was developed and validated by Zakipour et al. [67] using the Delft3d model. This local model resolved the hydrodynamic processes from the gulf end of the Arvand Estuary up to the Khorramshahr Port at approximately an 80 km distance from the Persian Gulf. It received its boundary conditions from the Persian Gulf’s hydrodynamic model which extended to the Strait of Hormuz in the east. The surface elevation at the open boundary of the Persian Gulf model at the Strait of Hormuz was predicted based on tidal constituents. The curvilinear structured grid approach was employed with finer grids in the local Arvand model (200 m) and around the estuary and mouth of the river, which becomes coarser (1000 m) within the deep gulf regions in the Persian Gulf model.
The downstream boundary condition was extracted from the Persian Gulf model’s water-level oscillations, and the upstream boundary condition was defined as river discharge at the Khorramshahr boundary. The mesh captured the river section by dividing it into 20 segments with a length of about 100 to 150 m (Figure 1d). Bathymetry data resources include the General Bathymetry Chart of the Oceans (GEBCO) on the 15 arc-second interval gridded data [91], Admiralty Chart 2888 of the Strait of Hormuz, and Chart 3842, 3843, 3844, and 1235 for the Arvand River.
The calibration and validation of the hydrodynamic model were performed using data from the Persian Gulf model and two stations along the estuary for the local model (Figure 1c,d). The Persian Gulf model was calibrated by varying bed roughness coefficients in the range of 0.012–0.019 s/m 1/3. For more details, see Zakipour et al. [67].
  • Implementation of Management Strategies
The calibrated hydrodynamic model was employed to investigate the proposed management strategies and assess these strategies’ effects on the current condition to inform managers with the resilience indexes produces with IRSTRIM.
Tidal barrier construction: Different tidal barrier (TB) scenarios were applied using the Arvand hydrodynamic model [67]. The study showed that the ideal case of TB with a closure depth and closure duration of 55% and 180 min can provide a symmetric condition. The results presented by Zakipour et al. [67] are used in this study as inputs for IRSTRIM.
Wetland Effect: To investigate the vegetation effects on the resilience of the sediment transport system, a 50 to 150 m wide band of wetlands in the vicinity of the dry coast was applied in the simulation. Based on Huang [92], wetlands increase bed roughness in their covered areas by 30%, dampen waves and storm surges [93], reduce erosion, and increase the resiliency of the system.
Maintenance dredging: In this study, dredging is proposed as a management resistance strategy, and was applied in simulations to assess the performance of the quantified resiliency indexes. Dredging was performed to keep the required river navigation lane depth maintained. According to the PIANC [94], navigation depth is a function of the draft of ships and processes affecting the vertical motions of the ship such as salinity variation, squat effect, and wave-induced vertical motions. The Abadan berths in the northern part of the river (Figure 1) are equipped to receive ships with a mean draft of 5.5 m loaded with 500 tons and Khorramshahr port (Figure 1) was designed for a maximum draft of 6 m. Considering 0.6 m for net keel clearance, and 1m for the squat effect, the dredging depth was estimated to be 7.5 m, which was applied 150 m away from the thalweg of the river.

3.3. Resilience Quantification

  • Reaction magnitude
The reactions of implemented management scenarios are digitized in Table 1. The higher positive reaction amplitude in the table illustrates a higher-sedimentation process. The best-expected condition is equal to zero for the accumulation of sedimentation and erosion. Under the existing condition, the Arvand Estuary experiences 215 tons of sedimentation per year. The dredging maintenance scenario shows an increase in the magnitude of the response from 215 tons/year to 334 tons/year, which can potentially increase the risk of sedimentation. By applying vegetation effects and adding a wetland system to simulations, the reaction amplitude decreased from 215 tons per year to 168 tons per year. Non-changing and constant tidal fluctuations and the tidal prism resulted in a 22% annual decrease in sediments. Applying TB with a 64% closure depth for a 5 h duration showed a reduction in the reaction amplitude.
  • Recovery rate
In the dredging management scenario, the estimated recovery rate is approximately 0.146 Kg/m3.h. Dredging of the river bed in addition to increased depth can reduce the flow velocity, which potentially introduces more sediments into the water column. Applying the wetland system scenario reduced the estimated recovery rate to 0.12 kg/m3.h. The scenario of TB and tidal range reduction led to a lower recovery rate. This is because the tidal range reduction associated with a tidal flow velocity decrease can cause lower suspended sediment concentrations in the equilibrium rates.
  • Graduality rate
This index shows how gradual changes can impose less stress on the system. Therefore, a closer gradual rate value to one indicates a more gradual and stable trend of changes in the estuary. The gradual rate for dredging was estimated to be 0.706, and including the wetland system scenario demonstrated a gradual rate of 0.89, which was expected due to the nature of an environmentally based scenario. In the TB management scenario, the gradual rate decreased to 0.67 due to a sudden change in the system.
  • Tidal asymmetry index
The tidal asymmetry index is proposed to be calculated along the river. The Arvand Estuary is flood-dominant, ignoring management scenarios, and the tidal asymmetry index is calculated to be 0.34. The dredging scenario decreased the TAI to 0.18 indicating a positive impact on tidal asymmetry conditions along the river. The wetland system scenario has little positive effect on the TAI value, reducing it to 0.31. The most impactful scenario, which shows the minimum TAI, is the TB. According to a related study [67], the implementation of TB can change the flood-dominant state of the estuary to a tidal symmetry state (TAI = 0), and then lead to a transition from that to an ebb-dominant state of the estuary. This could help to reduce the sediment transport risk and increase the resiliency of the system.
  • The salinity intrusion index
The length of salinity intrusion is influenced by factors such as tidal range and river flow. Unlike the scenarios of implementing TB, which resulted in changes in the maximum tidal range and consequently changes in the length of salinity intrusion within the range of 21 to 39 km along the river, the dredging process and the presence of a wetland system were shown to have minimal effects on the salinity intrusion length.
  • Infill rate index
The estimation of the infill rate index is based on the estimation of the filling trend of the estuary. Dredging in the estuary has resulted in an increase in the value of the filling rate index from 0.088 mm/yr to 0.096 mm/yr, which indicates the negative impact of the dredging management scenario on this index. However, the wetland system scenario favored this index and the filling rate value was reduced to 0.065. Implementing the TB scenario decreased the gradual filling rate and the estimated index values due to reduced sediment transport and a decreased amount of suspended sediments in the estuary.

3.4. DSS Implementation

The DSS process including the development of the decision matrix, the indexes’ weight estimation, and non-dimensionalizing was performed and is presented in Table 2 and Table 3. The decision matrix for the Arvand Estuary problem was calculated to employ as input for multi-criteria decision-making methods using information from Table 1. The weights related to the indicators were assigned via the Entropy technique. These weights express the relative importance of each index. The weighting of indicators based on the Entropy method in Table 2 led to the estimation of the impact of each indicator monotonously. Finally, the management scenarios were prioritized according to the weight of the resilience indexes applying the TOPSIS [85] ranking method (Table 3).
The Entropy method demonstrated that the reaction amplitude with a weight of 0.29 and the tidal asymmetry index with a weight of 0.23 are the most effective factors in prioritizing management scenarios. In the present study, graduality, the filling rate, SIVI and recovery rate were weighted 0.13, 0.14, 0.12 and 0.087, respectively.

3.5. Sensitivity Analysis

To evaluate the performance of the IRSTRIM approach, the sensitivity of each index to particle settling velocity (Ws) and bed roughness (f) parameters was assessed. The sensitivity calculations were performed for 0.0005 < Ws < 0.05 m/s and 0.0005 < f < 0.0125.
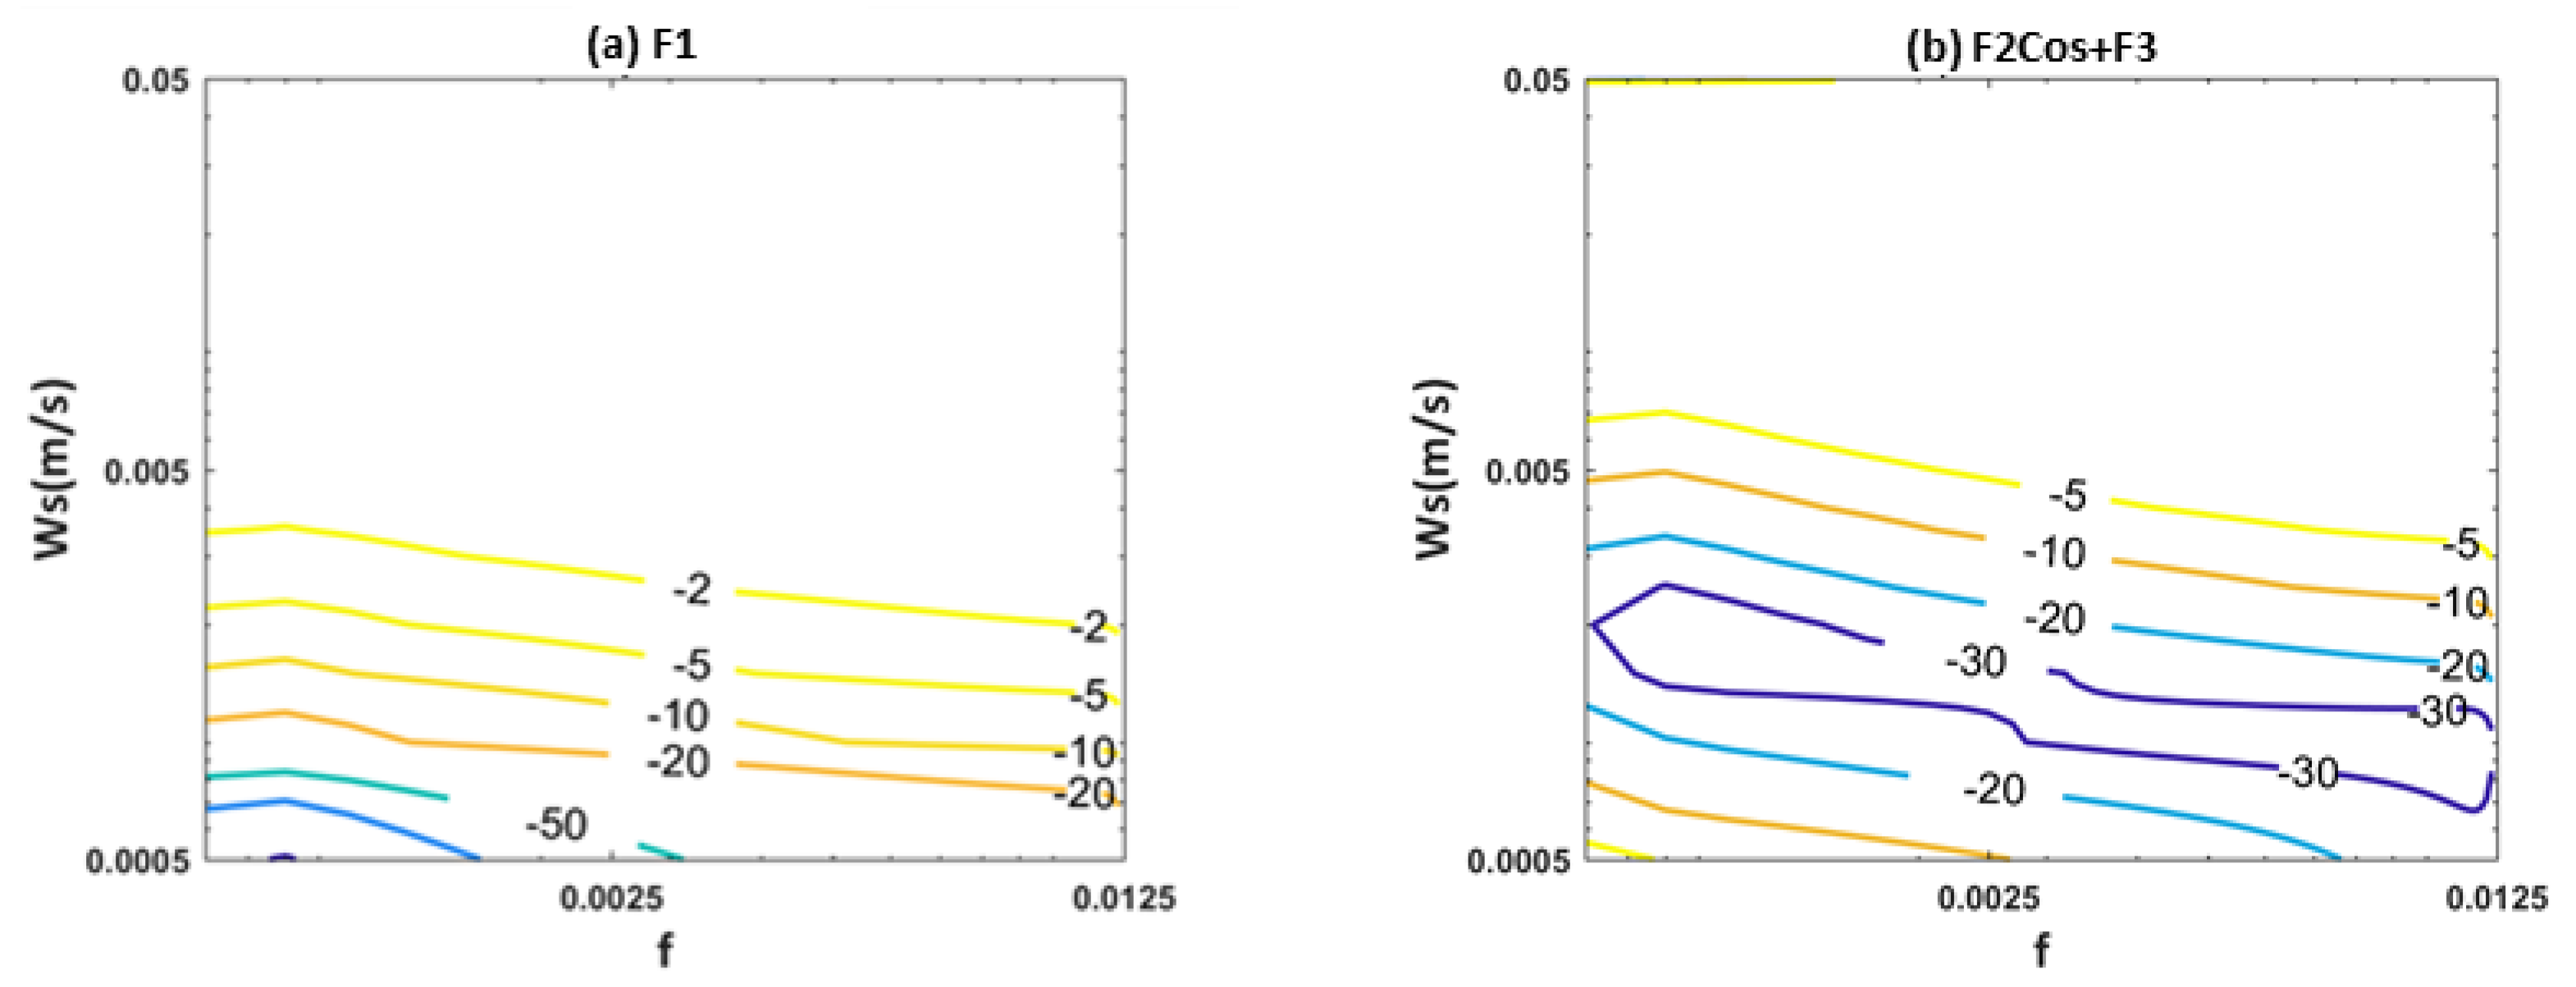
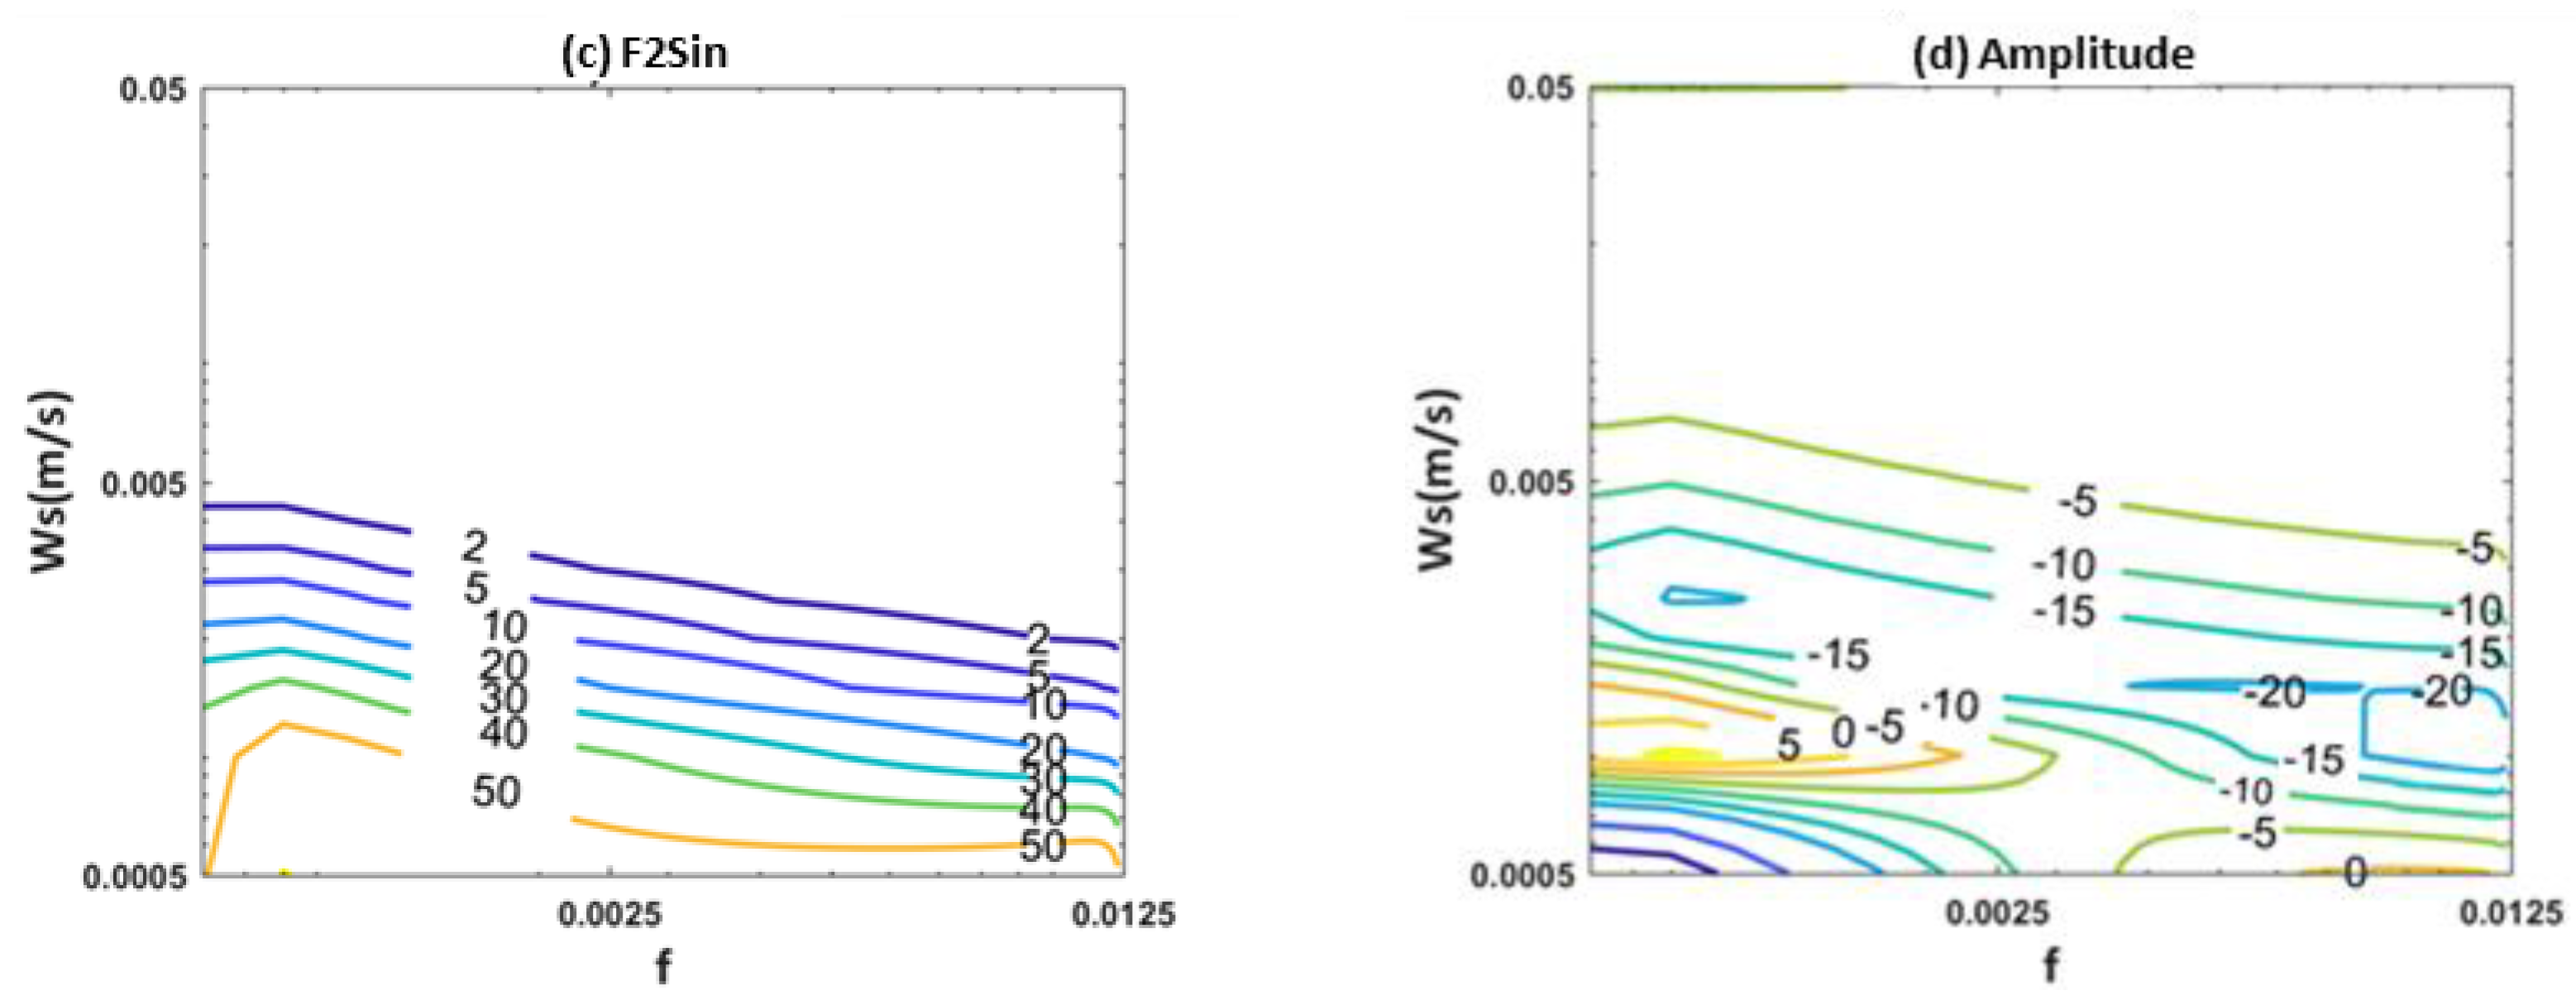
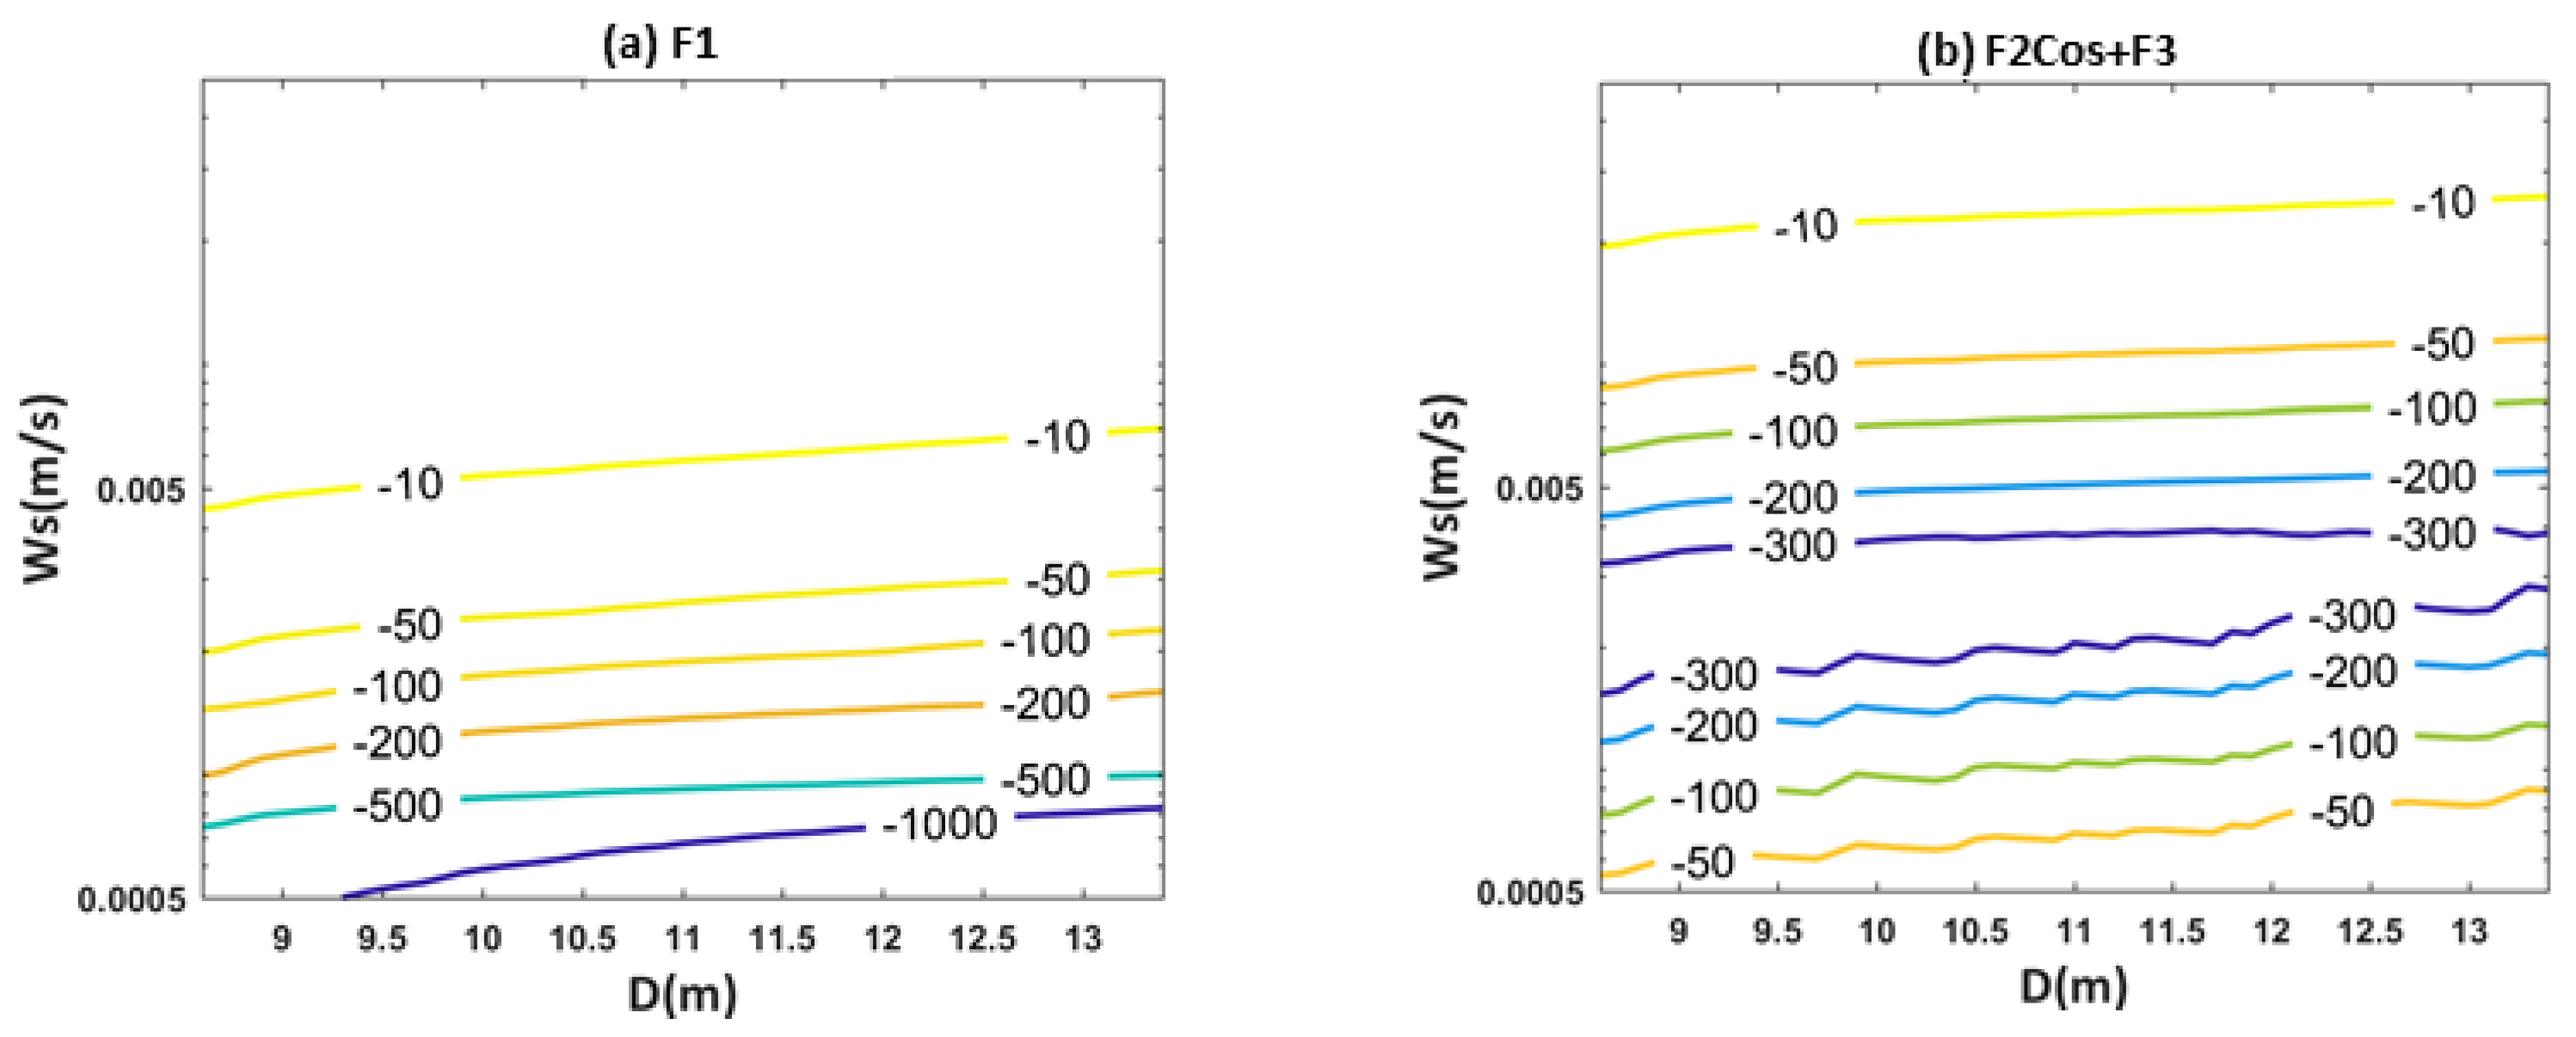
The effect of net sediment transport on the reaction amplitude parameter is demonstrated in Figure 4. The graph shows an increase in the amount of sediment moving out of the river with a decrease in the settling velocity of particles. Meanwhile, the sediment import through the velocity component F2Sin increases. On the other hand, the sedimentation rate associated with the velocity components F2cos + F3 initially increases and then decreases. The graph shows little effect on bed roughness with the settling velocity. Increasing bed roughness leads to a gradual decrease in the values of sedimentation induced by each of the components, F1, F2Sin, and F2Cos + F3.
The sensitivity analysis of the reaction amplitude to variations in particle settling velocity and roughness (f) indicated the critical role of both particle diameter and settling velocity. The results showed that changes in particle diameter and settling velocity (particularly in the range of 0.0005) have a significant impact on the reaction amplitude. For f < 0.0025, decreasing the settling velocity to between 0.005 and 0.0005 is a sign of erosion at a rate of 5 tons per year, and then a reduction in erosion values to 0 tons per year, followed by a conversion of erosion values into deposition values of up to a maximum of 10 tons per year. It should be noted that the magnitudes of the reaction amplitude, in comparison to the initial conditions of the estuary with deposition occurring at approximately 125 tons per year, have significantly decreased. Increasing bed roughness has led to an increase in erosion values of between 0 tons per year to 20 tons per year.
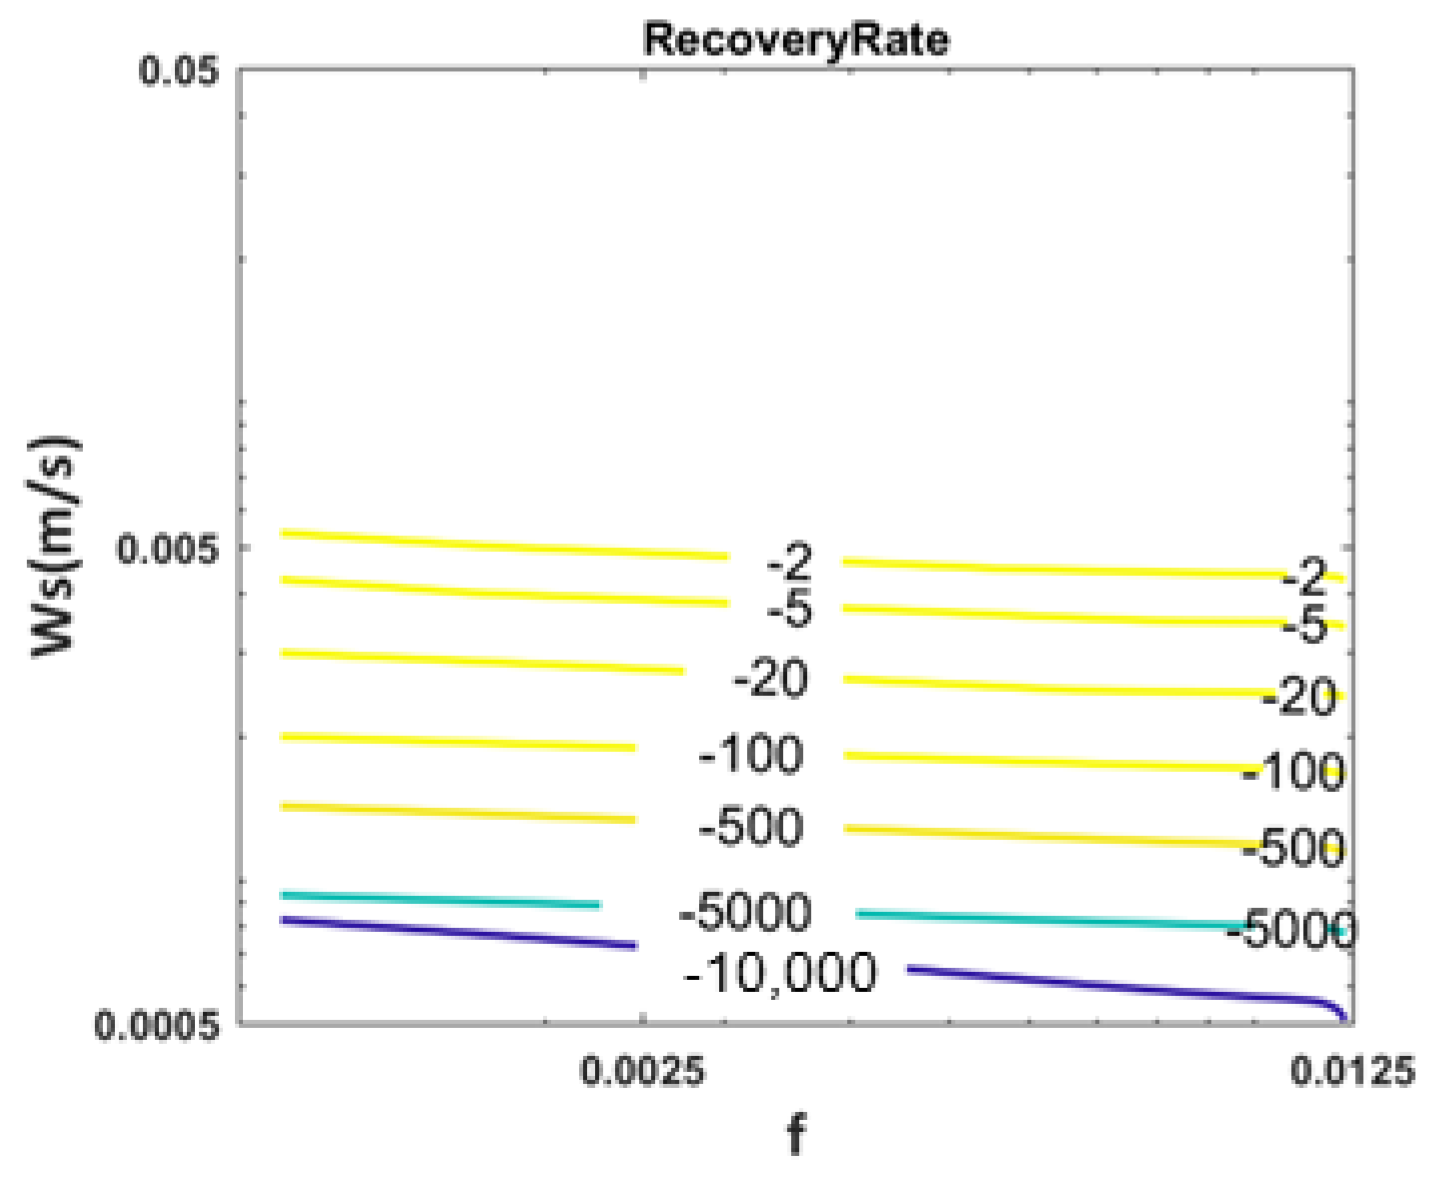
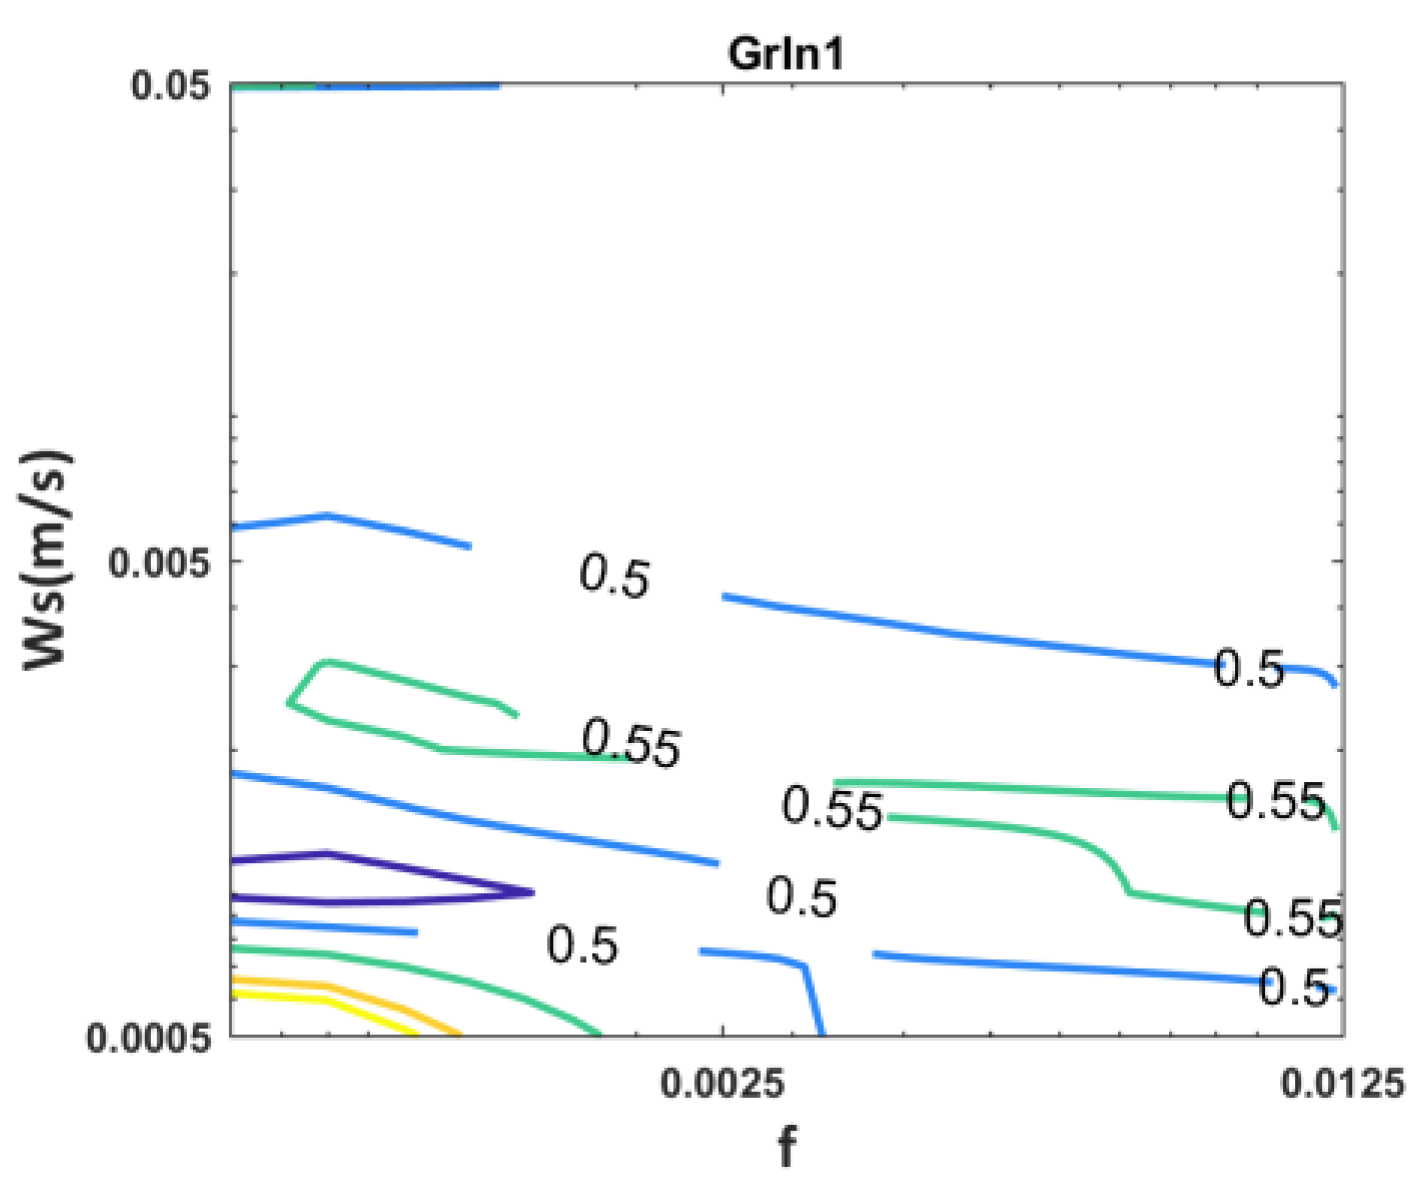
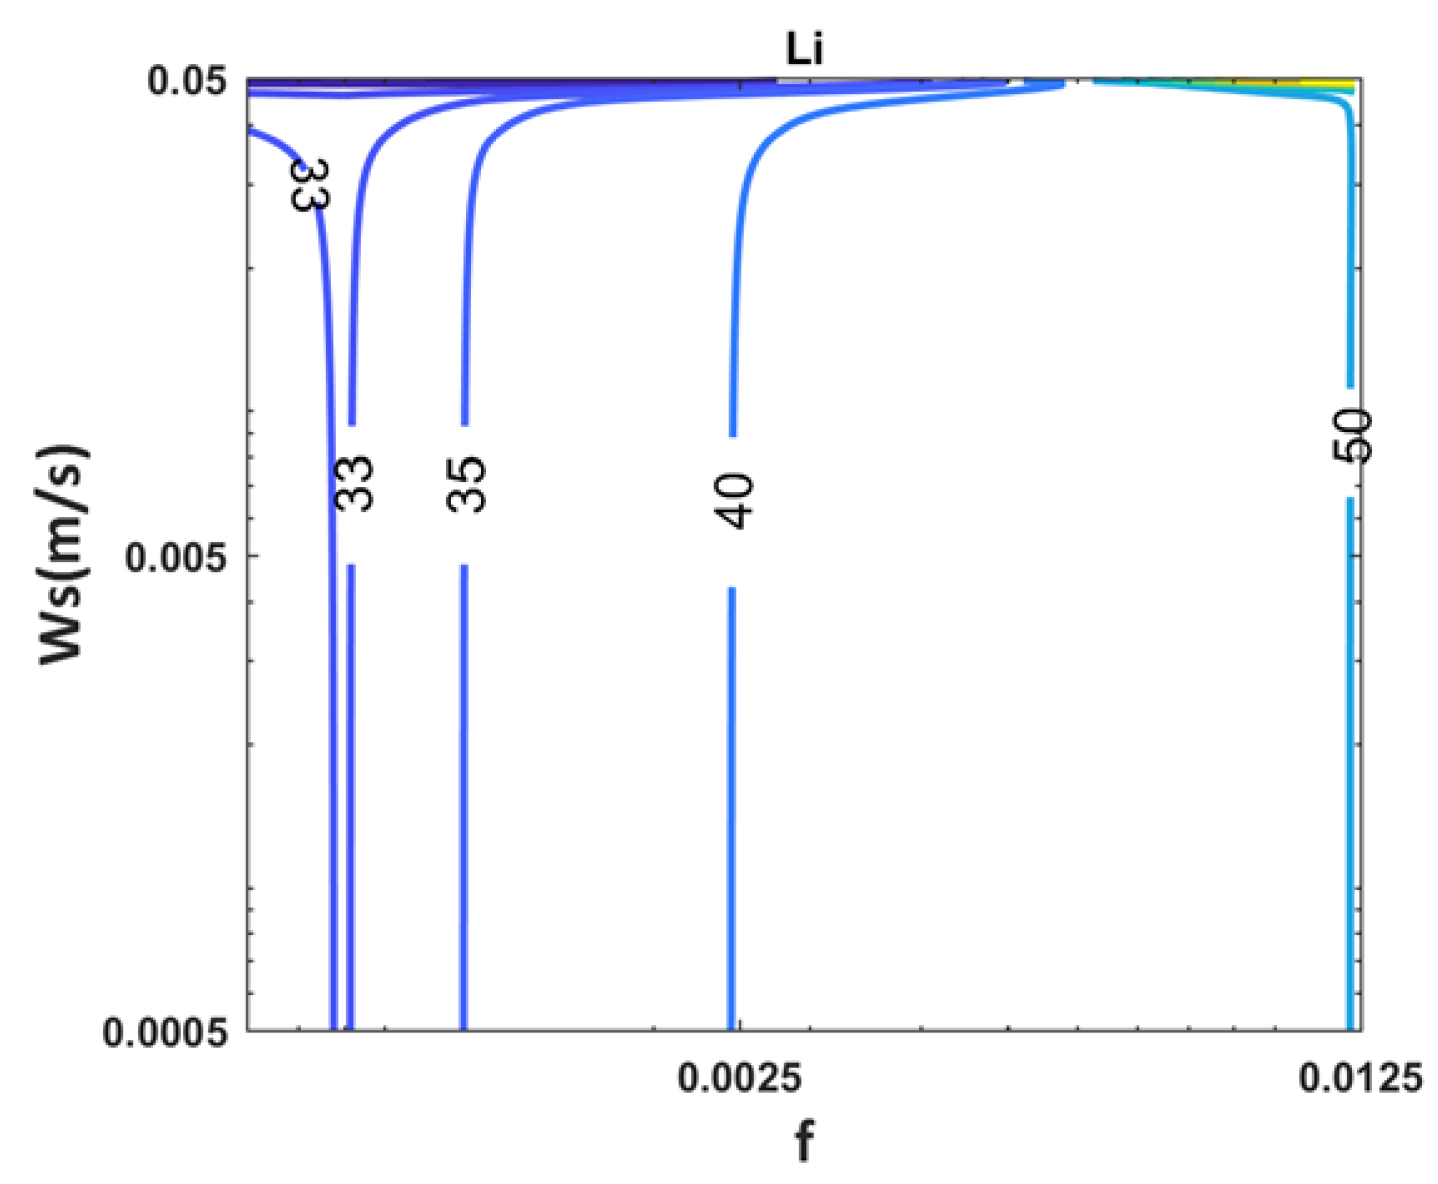
As shown in Figure 5, the recovery rate is highly influenced by the settling velocity values, while variations in bed roughness show little effect on the estimated recovery rate values. Figure 6 illustrates the sensitivity analysis of the graduality index for different ranges of sediment diameter and bed roughness. The graph demonstrates a graduality index in the range of 0.55 to 0.65 and low sensitivity to these two parameters. In addition, Figure 7 indicates a low effect of particle diameter on the SIVI parameter, whereas bed roughness impacts the SIVI values. In the examined roughness range, the effects were variable within the range of 30 to 50 km.
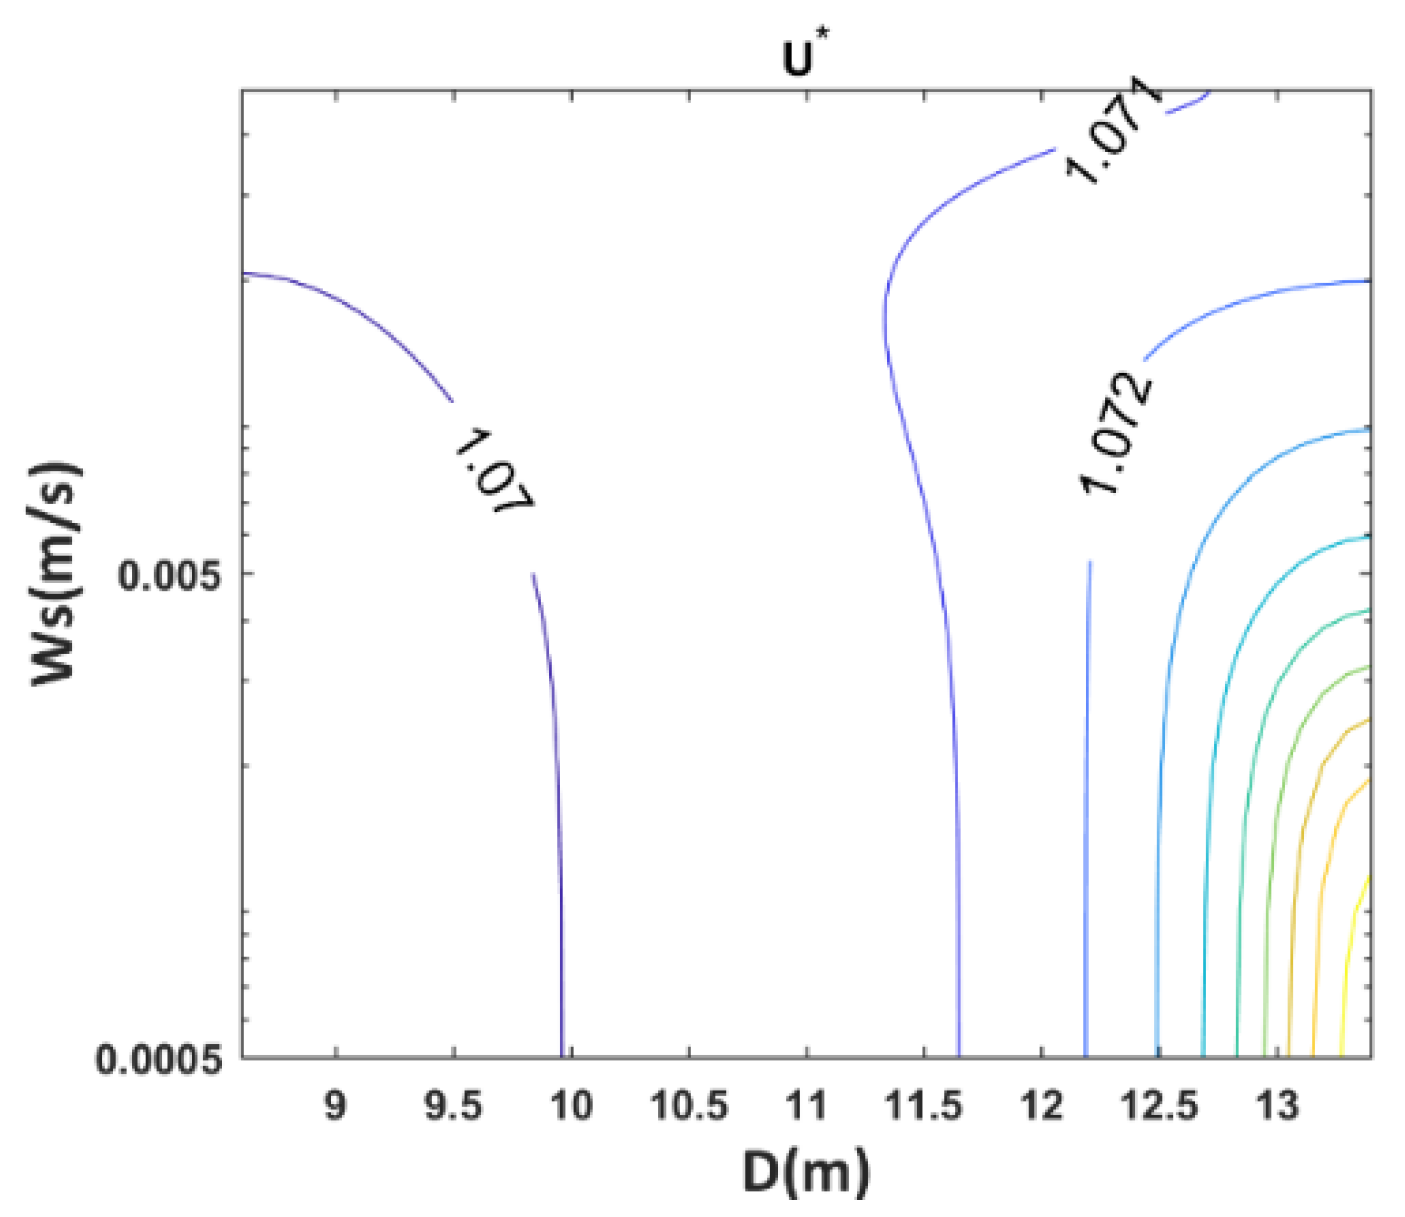
To consider other important factors in the relationships, the sensitivity of U* to the average depth of the estuary mouth (D) and settling velocity was assessed. The graph in Figure 8 shows the calculated values for U* and indicates no sensitivity to changes in water depth and particle diameter. However, an increase in depth led to an increase in sediment transport towards the sea (Figure 9).
This results of this research are in agreement with the findings of Colby et al. for the Murray Estuary [95] showing a reduction in the degree of flood dominance with the dredging strategy due to a reduction in the asymmetry of tidal currents. While bed dredging improved symmetry conditions in the estuary, it caused a 55% increase in the reaction amplitude compared to that of the existing condition. This process could threaten the stability of the estuary system, which is the same as what was observed in the Passer Estuary system in Bangladesh [96]. The Passer Estuary experienced a sedimentation rate of 0.1 to 0.6 m per year after dredging in 2014, which contradicts sustainable system development [96]. The filling rate due to dredging in the Arvand Estuary was estimated at 0.096 m per year. The increase in the reaction amplitude, as well as an increase in bed depth, and a decrease in flow velocity intensified the filling rate and consequently lowered the gradual nature of sedimentation. However, the values of the saline intrusion length decreased by less than 3% compared to that of the existing conditions.
Adding a wetland system scenario led to a decrease in the reaction amplitude compared to that of existing conditions. The tidal asymmetry under applied conditions also underwent minor changes. The application of TB resulted in a decrease in the reaction amplitude. The values of tidal asymmetry along the river also showed a significant decrease.
In general, the provided approach showed that despite the significant impact of tidal asymmetry on the sediment input and transport process in estuaries, this index alone cannot be used to estimate sustainable development goals and establish a resilient system. A consideration of other dimensions and factors affecting sediment transport, such as the characteristics of sediment including settling velocity, flow depth, tidal velocity and amplitude, and upstream discharge, in the IRSTRIM approach can provide the conditions to comprehensively compare various management scenarios.

4. Conclusions

In recent years, various factors such as an increase in salinity intrusion and sedimentation, and the landward progress of the Arvand Estuary have caused disruptions in the performance of this estuary. In this study, the IRSTRIM approach was presented and implemented in the Arvand Estuary located northwest of the Persian Gulf. Various resilient (e.g., tidal barrier implementation and considering wetland) and resistant (e.g., dredging) management scenarios were also proposed and assessed using the IRSTRIM approach.
This approach shows that the dredging scenario is a resistant method, and improves the TAI related to the existing condition (Do Nothing). On the other hand, it causes a 55% increase in the reaction amplitude. The increase in the reaction amplitude, as well as an increase in bed depth, and a decrease in flow velocity resulted in an increase in filling rate (of 10%) and consequently a decrease in the gradual nature of sedimentation. Adding a wetland system as a management scenario also led to a decrease in the reaction amplitude compared to that of existing conditions. The tidal asymmetry under applied management scenarios showed minor changes. The application of TB demonstrated a decrease in the reaction amplitude and tidal asymmetry along the river.
To include management decision processes, the DSS prioritization process was applied and the reaction amplitude and the TAI had the highest weight priority, respectively. In general, the provided approach showed that despite the significant impact of tidal asymmetry on the sediment input and transport process in estuaries, this index alone cannot be used to estimate sustainable development goals and establish a resilient system.
Identifying the processes influencing sediment transport in the Arvand Estuary, determining the effective parameters, and ultimately creating a suitable framework for developing indexes and prioritizing proposed management scenarios are among the most important achievements of the IRSTRIM framework for estuary resilience assessment and sustainable development. The quantified indexes successfully incorporate tidal asymmetry, sediment characteristics, bed properties, and flow hydrodynamics.
Performing sensitivity analysis, considering the possible uncertainties, helps to assess the certainty in the prioritization. Sensitivity analysis was conducted for changes in particle settling velocity, bed roughness, and water depth in the estuary.
The proposed resilience assessment framework could be improved by incorporating the transport of sediments using horizontal advection influenced by factors such as channel geometry, flow turbulence, flow direction changes, and human activity. Due to the various spatial and temporal conditions involved, determining the precise values of these parameters usually involves uncertainties and needs to be investigated. Future research that includes these aspects of sediment transport will help in reaching a more comprehensive understanding of the topic. As the other suggestion for future study, the development of models and strategies that can effectively mitigate the impacts of sediment transport on ecosystems and infrastructure would be a valuable area of research. While it is true that more research is needed to fully understand sediment transport risks, there are several scientifically sound concepts based on a solid foundation of established principles. These impacts can originate from sediment properties, flow characteristics, landscape features, and human impacts, which have all been extensively studied and documented in the literature.

Author Contributions

Conceptualization, M.Z., F.Y. and A.I.; formal analysis, M.Z. and F.Y.; Investigation, M.Z., F.Y. and K.A.; methodology, M.Z., F.Y., K.A., A.I. and A.F.; Software, M.Z. and A.F.; supervision, F.Y.; validation, M.Z. and A.F.; writing—original draft, M.Z., K.A., A.I. and A.F.; writing—review and editing, F.Y., K.A. and A.I. All authors have read and agreed to the published version of the manuscript.

Funding

This research received no external funding.

Institutional Review Board Statement

Not applicable.

Informed Consent Statement

Not applicable.

Data Availability Statement

All using data will be made available by contacting the corresponding author.

Conflicts of Interest

The authors declare no conflict of interest.

Correction Statement

This article has been republished with a minor correction to the existing affiliation information. This change does not affect the scientific content of the article.

References

  1. Speirs, D.C.; Gurney, W.S. Population persistence in rivers and estuaries. Ecology 2001, 82, 1219–1237. [Google Scholar] [CrossRef]
  2. Teng, L.; Cheng, H.; Zhang, E.; Wang, Y. Lateral Variation of Tidal Mixing Asymmetry and Its Impact on the Longitudinal Sediment Transport in Turbidity Maximum Zone of Salt Wedge Estuary. J. Mar. Sci. Eng. 2022, 10, 907. [Google Scholar] [CrossRef]
  3. Zhou, Z.; Zhang, P.; Zhang, G.; Wang, S.; Cai, Y.; Wang, H. Vertical microplastic distribution in sediments of Fuhe River estuary to Baiyangdian Wetland in Northern China. Chemosphere 2021, 280, 130800. [Google Scholar] [CrossRef] [PubMed]
  4. Rudra, K.; Rudra, K. Rivers of the Ganga–Brahmaputra–Meghna Delta: An Overview. In Rivers of the Ganga-Brahmaputra-Meghna Delta: A Fluvial Account of Bengal; Springer International Publishing: Cham, Switzerland, 2018; pp. 1–14. [Google Scholar]
  5. Allison, M.; Kolker, A.; Meselhe, E. Water and sediment dynamics through the wetlands and coastal water bodies of large river deltaic plains. In Biogeochemical Dynamics at Major River-Coastal Interfaces; Cambridge University Press: Cambridge, UK, 2013; pp. 21–54. [Google Scholar]
  6. Liu, Z.C.; de Lange, W.; Bryan, K. Estuary rejuvenation in response to sea level rise: An example from Tairua Estuary, New Zealand. Geo-Mar. Lett. 2020, 40, 269–280. [Google Scholar] [CrossRef]
  7. Passeri, D.L.; Hagen, S.C.; Medeiros, S.C.; Bilskie, M.V.; Alizad, K.; Wang, D. The dynamic effects of sea level rise on low-gradient coastal landscapes: A review. Earth’s Future 2015, 3, 159–181. [Google Scholar] [CrossRef]
  8. Bolle, A.; Wang, Z.B.; Amos, C.; De Ronde, J. The influence of changes in tidal asymmetry on residual sediment transport in the Western Scheldt. Cont. Shelf Res. 2010, 30, 871–882. [Google Scholar] [CrossRef]
  9. Lagutov, V.; Lagutov, V. Through The Preservation Of The Ural River Sturgeon Habitats To Sustainable Watershed Management; Springer International Publishing: Cham, Switzerland, 2008. [Google Scholar]
  10. De Bruijn, K.M. Resilience strategies for flood risk Fmanagement under uncertainties. In Proceedings of the XI World Water Congress of IWRA, Madrid, Spain, 5–9 October 2003. [Google Scholar]
  11. Directive, W.F. Common implementation strategy for the water framework directive (2000/60/EC). In Guidance Document; European Commission: Brussels, Belgium, 2003; p. 7. [Google Scholar]
  12. Butler, D.; Ward, S.; Sweetapple, C.; Astaraie-Imani, M.; Diao, K.; Farmani, R.; Fu, G. Reliable, resilient and sustainable water management: The Safe & SuRe approach. Glob. Chall. 2017, 1, 63–77. [Google Scholar]
  13. Klein, R.J.; Nicholls, R.J.; Thomalla, F. Resilience to natural hazards: How useful is this concept? Glob. Environ. Change Part B Environ. Hazards 2003, 5, 35–45. [Google Scholar] [CrossRef]
  14. Izadi, M.; Hosseinian, S.H.; Dehghan, S.; Fakharian, A.; Amjady, N. A critical review on definitions, indices, and uncertainty characterization in resiliency-oriented operation of power systems. Int. Trans. Electr. Energy Syst. 2021, 31, e12680. [Google Scholar] [CrossRef]
  15. Holling, C.S. Resilience and stability of ecological systems. Annu. Rev. Ecol. Syst. 1973, 4, 1–23. [Google Scholar] [CrossRef]
  16. Walker, B.; Salt, D. Resilience Thinking: Sustaining Ecosystems and People in a Changing World; Island press: Washington, DC, USA, 2012. [Google Scholar]
  17. Brand, F.S.; Jax, K. Focusing the meaning (s) of resilience: Resilience as a descriptive concept and a boundary object. Ecol. Soc. 2007, 12, 16. [Google Scholar] [CrossRef]
  18. Hashimoto, T.; Stedinger, J.R.; Loucks, D.P. Reliability, resiliency, and vulnerability criteria for water resource system performance evaluation. Water Resour. Res. 1982, 18, 14–20. [Google Scholar] [CrossRef]
  19. Moy, W.S.; Cohon, J.L.; ReVelle, C.S. A programming model for analysis of the reliability, resilience, and vulnerability of a water supply reservoir. Water Resour. Res. 1986, 22, 489–498. [Google Scholar] [CrossRef]
  20. Chang, S.E.; Shinozuka, M. Measuring improvements in the disaster resilience of communities. Earthq. Spectra 2004, 20, 739–755. [Google Scholar] [CrossRef]
  21. Wang, C.-h.; Blackmore, J.M. Resilience concepts for water resource systems. J. Water Resour. Plan. Manag. 2009, 135, 528–536. [Google Scholar] [CrossRef]
  22. Izadi, A.; Yazdandoost, F.; Ranjbar, R. Asset-based assessment of resiliency in water distribution networks. Water Resour. Manag. 2020, 34, 1407–1422. [Google Scholar] [CrossRef]
  23. Yazdandoost, F.; Bozorgy, B. Flood risk management strategies using multi-criteria analysis. In Proceedings of the Institution of Civil Engineers-Water Management; Thomas Telford Ltd.: London, UK, 2008; pp. 261–266. [Google Scholar]
  24. Schultz, M.T.; McKay, S.K.; Hales, L.Z. The quantification and evolution of resilience in integrated coastal systems. In Environmental Science, Engineering; Springer: Cham, Switzerland, 2012. [Google Scholar]
  25. Alizad, K.; Morris, J.T.; Bilskie, M.V.; Passeri, D.L.; Hagen, S.C. Integrated Modeling of Dynamic Marsh Feedbacks and Evolution Under Sea-Level Rise in a Mesotidal Estuary (Plum Island, MA, USA). Water Resour. Res. 2022, 58, e2022WR032225. [Google Scholar] [CrossRef]
  26. Chen, J.; Di, Z.; Shi, J.; Shu, Y.; Wan, Z.; Song, L.; Zhang, W. Marine oil spill pollution causes and governance: A case study of Sanchi tanker collision and explosion. J. Clean. Prod. 2020, 273, 122978. [Google Scholar] [CrossRef]
  27. Dawson, R.J.; Hall, J.; Bates, P.; Nicholls, R. Quantified analysis of the probability of flooding in the Thames Estuary under imaginable worst-case sea level rise scenarios. Water Resour. Dev. 2005, 21, 577–591. [Google Scholar] [CrossRef]
  28. French, J. Tidal marsh sedimentation and resilience to environmental change: Exploratory modelling of tidal, sea-level and sediment supply forcing in predominantly allochthonous systems. Mar. Geol. 2006, 235, 119–136. [Google Scholar] [CrossRef]
  29. Goatley, C.H.; Bonaldo, R.M.; Fox, R.J.; Bellwood, D.R. Sediments and herbivory as sensitive indicators of coral reef degradation. Ecol. Soc. 2016, 21, 4628. [Google Scholar] [CrossRef]
  30. González-Riancho, P.; Gerkensmeier, B.; Ratter, B.M.; González, M.; Medina, R. Storm surge risk perception and resilience: A pilot study in the German North Sea coast. Ocean. Coast. Manag. 2015, 112, 44–60. [Google Scholar] [CrossRef]
  31. Lozenguez, G.; Castillo, P.S.; Desquesnes, G.; Doniec, A.; Duviella, É.; Akhi-Elarab, F.N.; Puig, V.; Rajaoarisoa, L. Management tools to study and to deal with effects of climate change on inland waterways. Acad. Open Internet J. 2018, hal-02150379. [Google Scholar]
  32. Pannozzo, N.; Leonardi, N.; Carnacina, I.; Smedley, R. Salt marsh resilience to sea-level rise and increased storm intensity. Geomorphology 2021, 389, 107825. [Google Scholar] [CrossRef]
  33. Rölfer, L.; Celliers, L.; Abson, D. Resilience and coastal governance: Knowledge and navigation between stability and transformation. Ecol. Soc. 2022, 27, 40. [Google Scholar] [CrossRef]
  34. Spiegler, S.; Bandy, R.; Currin, C.; Dorton, J.; Ellin, R.; Farnell, P.; Fear, J.; Gilchrist, E.; Glenn, D.; Hall, N. North Carolina Sentinel Site Cooperative: Report on the 2017 Partners Meeting; National Oceanic and Atmospheric Administration: Washington, DC, USA, 2017. [Google Scholar]
  35. Teng, F.; Shen, Q.; Huang, W.; Ginis, I.; Cai, Y. Characteristics of river flood and storm surge interactions in a tidal river in Rhode Island, USA. Procedia IUTAM 2017, 25, 60–64. [Google Scholar] [CrossRef]
  36. Zeldis, J.R.; Depree, C.; Gongol, C.; South, P.M.; Marriner, A.; Schiel, D.R. Trophic indicators of ecological resilience in a tidal lagoon estuary following wastewater diversion and earthquake disturbance. Estuaries Coasts 2020, 43, 223–239. [Google Scholar] [CrossRef]
  37. Hagen, S.C.; Morris, J.T.; Bacopoulos, P.; Weishampel, J.F. Sea-level rise impact on a salt marsh system of the lower St. Johns River. J. Waterw. Port Coast. Ocean. Eng. 2013, 139, 118–125. [Google Scholar] [CrossRef]
  38. Fiering, M.B. A screening model to quantify resilience. Water Resour. Res. 1982, 18, 27–32. [Google Scholar] [CrossRef]
  39. Maier, H.R.; Lence, B.J.; Tolson, B.A.; Foschi, R.O. First-order reliability method for estimating reliability, vulnerability, and resilience. Water Resour. Res. 2001, 37, 779–790. [Google Scholar] [CrossRef]
  40. Simonovic, S.P.; Li, L. Sensitivity of the Red River Basin flood protection system to climate variability and change. Water Resour. Manag. 2004, 18, 89–110. [Google Scholar] [CrossRef]
  41. Joyce, J.; Chang, N.-B.; Harji, R.; Ruppert, T. Coupling infrastructure resilience and flood risk assessment via copulas analyses for a coastal green-grey-blue drainage system under extreme weather events. Environ. Model. Softw. 2018, 100, 82–103. [Google Scholar] [CrossRef]
  42. De Bruijn, K.M. Resilience and Flood Risk Management: A Systems Approach Applied to Lowland Rivers; IOS Press: Amsterdam, The Netherlands, 2005. [Google Scholar]
  43. Carpenter, S.; Walker, B.; Anderies, J.M.; Abel, N. From metaphor to measurement: Resilience of what to what? Ecosystems 2001, 4, 765–781. [Google Scholar] [CrossRef]
  44. Hajiabadi, A.; Sakhdari, S.; Barati, R. Study of morphologic changes in the past and predicting future changes of border rivers (case study: Arvand River, Iran-Iraq Border Line). In Current Directions in Water Scarcity Research; Elsevier: Amsterdam, The Netherlands, 2022; Volume 7, pp. 153–163. [Google Scholar]
  45. Etemad-Shahidi, A.; Pirnia, M.; Moshfeghi, H.; Lemckert, C. Investigation of hydraulics transport time scales within the Arvand River estuary, Iran. Hydrol. Process. 2014, 28, 6006–6015. [Google Scholar] [CrossRef]
  46. UN-ESCWA; BGR. Inventory of Shared Water Resources in Western Asia; UN-ESCWA, BGR Beirut: Beirut, Lebanon, 2013. [Google Scholar]
  47. Haghighi, A.T.; Sadegh, M.; Bhattacharjee, J.; Sönmez, M.E.; Noury, M.; Yilmaz, N.; Noori, R.; Kløve, B. The impact of river regulation in the Tigris and Euphrates on the Arvandroud Estuary. Prog. Phys. Geogr. Earth Environ. 2020, 44, 948–970. [Google Scholar] [CrossRef]
  48. Etemad Shahidi, A.; Saburi, A.; Parsa, J. Control of salinity intrusion in Arvand estuary under different hydrological conditions. Iran-Water Resour. Res. 2011, 7, 50–60. [Google Scholar]
  49. Zahed, F.; Etemad-Shahidi, A.; Jabbari, E. Modeling of salinity intrusion under different hydrological conditions in the Arvand River Estuary. Can. J. Civ. Eng. 2008, 35, 1476–1480. [Google Scholar] [CrossRef]
  50. Prandle, D. How tides and river flows determine estuarine bathymetries. Prog. Oceanogr. 2004, 61, 1–26. [Google Scholar] [CrossRef]
  51. Friedrichs, C.T.; Aubrey, D.G. Tidal propagation in strongly convergent channels. J. Geophys. Res. Ocean. 1994, 99, 3321–3336. [Google Scholar] [CrossRef]
  52. Prandle, D. Estuaries: Dynamics, Mixing, Sedimentation and Morphology; Cambridge University Press: Cambridge, UK, 2009. [Google Scholar]
  53. Gilbert, G.K. Report on the Geology of the Henry Mountains; US Government Printing Office: Washington, DC, USA, 1880. [Google Scholar]
  54. Perillo, G.M. Geomorphology and sedimentology of estuaries: An introduction. In Developments in Sedimentology; Elsevier: Amsterdam, The Netherlands, 1995; Volume 53, pp. 1–16. [Google Scholar]
  55. Young, O.R. Institutional dynamics: Resilience, vulnerability and adaptation in environmental and resource regimes. Glob. Environ. Chang. 2010, 20, 378–385. [Google Scholar] [CrossRef]
  56. Godin, G. Frictional effects in river tides. Tidal Hydrodyn. 1991, 379, 402. [Google Scholar]
  57. Guo, L.; Van der Wegen, M.; Roelvink, J.; He, Q. The role of river flow and tidal asymmetry on 1-D estuarine morphodynamics. J. Geophys. Res. Earth Surf. 2014, 119, 2315–2334. [Google Scholar] [CrossRef]
  58. Guo, L.; van der Wegen, M.; Jay, D.A.; Matte, P.; Wang, Z.B.; Roelvink, D.; He, Q. River-tide dynamics: Exploration of nonstationary and nonlinear tidal behavior in the Y angtze R iver estuary. J. Geophys. Res. Ocean. 2015, 120, 3499–3521. [Google Scholar] [CrossRef]
  59. Gatto, V.M.; van Prooijen, B.C.; Wang, Z.B. Net sediment transport in tidal basins: Quantifying the tidal barotropic mechanisms in a unified framework. Ocean. Dyn. 2017, 67, 1385–1406. [Google Scholar] [CrossRef]
  60. Guo, L.; van der Wegen, M.; Wang, Z.B.; Roelvink, D.; He, Q. Exploring the impacts of multiple tidal constituents and varying river flow on long-term, large-scale estuarine morphodynamics by means of a 1-D model. J. Geophys. Res. Earth Surf. 2016, 121, 1000–1022. [Google Scholar] [CrossRef]
  61. Postma, H. Tidal flat areas. In Coastal-Offshore Ecosystem Interactions; Springer: Cham, Switzerland, 1988; pp. 102–121. [Google Scholar]
  62. Dronkers, J. Tidal asymmetry and estuarine morphology. Neth. J. Sea Res. 1986, 20, 117–131. [Google Scholar] [CrossRef]
  63. Friedrichs, C.T.; Aubrey, D.G. Non-linear tidal distortion in shallow well-mixed estuaries: A synthesis. Estuar. Coast. Shelf Sci. 1988, 27, 521–545. [Google Scholar] [CrossRef]
  64. Wang, Z.; Jeuken, C.; De Vriend, H.; Stive, M. Tidal Asymmetry and Residual Sediment Transport in Estuaries: A Literature Study and Application to the Western Scheldt; University of California: California, LA, USA, 1999. [Google Scholar]
  65. Winterwerp, J.C. Fine sediment transport by tidal asymmetry in the high-concentrated Ems River: Indications for a regime shift in response to channel deepening. Ocean. Dyn. 2011, 61, 203–215. [Google Scholar] [CrossRef]
  66. Wang, Z.B.; Jeuken, M.; Gerritsen, H.; De Vriend, H.; Kornman, B. Morphology and asymmetry of the vertical tide in the Westerschelde estuary. Cont. Shelf Res. 2002, 22, 2599–2609. [Google Scholar] [CrossRef]
  67. Zakipour, M.; Yazdandoost, F.; Farhangmehr, A.; Alizad, K. An investigation into the effects of tidal barrier operation on the tidal asymmetry in the Arvand Estuary. J. Hydraul. Struct. 2023, 9, 1–17. [Google Scholar]
  68. Brenon, I.; Le Hir, P. Modelling the turbidity maximum in the Seine estuary (France): Identification of formation processes. Estuar. Coast. Shelf Sci. 1999, 49, 525–544. [Google Scholar] [CrossRef]
  69. Scully, M.E.; Friedrichs, C.T. Sediment pumping by tidal asymmetry in a partially mixed estuary. J. Geophys. Res. Ocean. 2007, 112, C07028. [Google Scholar] [CrossRef]
  70. Toublanc, F.; Brenon, I.; Coulombier, T. Formation and structure of the turbidity maximum in the macrotidal Charente estuary (France): Influence of fluvial and tidal forcing. Estuar. Coast. Shelf Sci. 2016, 169, 1–14. [Google Scholar] [CrossRef]
  71. van Maanen, B.; Sottolichio, A. Hydro-and sediment dynamics in the Gironde estuary (France): Sensitivity to seasonal variations in river inflow and sea level rise. Cont. Shelf Res. 2018, 165, 37–50. [Google Scholar] [CrossRef]
  72. Jalón-Rojas, I.; Schmidt, S.; Sottolichio, A.; Bertier, C. Tracking the turbidity maximum zone in the Loire Estuary (France) based on a long-term, high-resolution and high-frequency monitoring network. Cont. Shelf Res. 2016, 117, 1–11. [Google Scholar] [CrossRef]
  73. Pritchard, M.; Green, M. Trapping and episodic flushing of suspended sediment from a tidal river. Cont. Shelf Res. 2017, 143, 286–294. [Google Scholar] [CrossRef]
  74. Morris, A.; Loring, D.; Bale, A.; Howland, R.; Mantoura, R.; Woodward, E. Particle dynamics, particulate carbon and the oxygen minimum in an estuary. Oceanol. Acta 1982, 5, 349–353. [Google Scholar]
  75. Uncles, R.; Joint, I.; Stephens, J. Transport and retention of suspended particulate matter and bacteria in the Humber-Ouse Estuary, United Kingdom, and their relationship to hypoxia and anoxia. Estuaries 1998, 21, 597–612. [Google Scholar] [CrossRef]
  76. Etcheber, H.; Taillez, A.; Abril, G.; Garnier, J.; Servais, P.; Moatar, F.; Commarieu, M.-V. Particulate organic carbon in the estuarine turbidity maxima of the Gironde, Loire and Seine estuaries: Origin and lability. Hydrobiologia 2007, 588, 245–259. [Google Scholar] [CrossRef]
  77. Rigter, B.P. Minimum length of salt intrusion in estuaries. J. Hydraul. Div. 1973, 99, 1475–1496. [Google Scholar] [CrossRef]
  78. Prandle, D. On salinity regimes and the vertical structure of residual flows in narrow tidal estuaries. Estuar. Coast. Shelf Sci. 1985, 20, 615–635. [Google Scholar] [CrossRef]
  79. Neumeier, U.; Ciavola, P. Flow resistance and associated sedimentary processes in a Spartina maritima salt-marsh. J. Coast. Res. 2004, 20, 435–447. [Google Scholar] [CrossRef]
  80. Liu, B.; Chen, Y.; Cai, T.; Li, Y.; Sun, L. Estimating Waves and Currents at the Saltmarsh Edge Using Acoustic Doppler Velocimeter Data. Front. Mar. Sci. 2021, 987, 708116. [Google Scholar] [CrossRef]
  81. Knutson, P.L.; Inskeep, M.R. Shore Erosion Control with Salt Marsh Vegetation; Coastal Engineering Research Center: Fort Belvoir VA, USA, 1982. [Google Scholar]
  82. Adnitt, C. Saltmarsh Management Manual. Joint Defra/Environment Agency Flood and Coastal Erosion Risk Management R&D Programme; Technical Report SC030220, UK. 2007. Available online: http://cdn.environment-agency.gov.uk. (accessed on 13 March 2023).
  83. Jordan, P.; Fröhle, P. Bridging the gap between coastal engineering and nature conservation? A review of coastal ecosystems as nature-based solutions for coastal protection. J. Coast. Conserv. 2022, 26, 4. [Google Scholar] [CrossRef]
  84. Keeney, R.L.; Raiffa, H. Decision Analysis with Multiple Conflicting Objectives; Wiley& Sons: New York, NY, USA, 1976. [Google Scholar]
  85. Yazdandoost, F.; Izadi, A. A decision-making framework for designing water distribution networks based on multi-objective optimisation. Int. J. Multicriteria Decis. Mak. 2016, 6, 269–289. [Google Scholar] [CrossRef]
  86. Etemad-Shahidi, A.; Parsa, J.; Hajiani, M. Salinity intrusion length: Comparison of different approaches. In Proceedings of the Institution of Civil Engineers-Maritime Engineering; Thomas Telford Ltd.: London, UK, 2011; pp. 33–42. [Google Scholar]
  87. Etemad-Shahidi, A.; Rohani, M.; Parsa, J.; Lemckert, C. Effects of sea level rise on the salinity of Bahmanshir estuary. Int. J. Environ. Sci. Technol. 2015, 12, 3329–3340. [Google Scholar] [CrossRef]
  88. Khojasteh, D.; Lewis, M.; Tavakoli, S.; Farzadkhoo, M.; Felder, S.; Iglesias, G.; Glamore, W. Sea level rise will change estuarine tidal energy: A review. Renew. Sustain. Energy Rev. 2022, 156, 111855. [Google Scholar] [CrossRef]
  89. Pekel, J.-F.; Cottam, A.; Gorelick, N.; Belward, A.S. High-resolution mapping of global surface water and its long-term changes. Nature 2016, 540, 418–422. [Google Scholar] [CrossRef]
  90. Hakimdavar, R.; Hubbard, A.; Policelli, F.; Pickens, A.; Hansen, M.; Fatoyinbo, T.; Lagomasino, D.; Pahlevan, N.; Unninayar, S.; Kavvada, A. Monitoring water-related ecosystems with earth observation data in support of Sustainable Development Goal (SDG) 6 reporting. Remote Sens. 2020, 12, 1634. [Google Scholar] [CrossRef]
  91. Weatherall, P.; Marks, K.M.; Jakobsson, M.; Schmitt, T.; Tani, S.; Arndt, J.E.; Rovere, M.; Chayes, D.; Ferrini, V.; Wigley, R. A new digital bathymetric model of the world’s oceans. Earth Space Sci. 2015, 2, 331–345. [Google Scholar] [CrossRef]
  92. Huang, H.; Chen, C.; Blanton, J.O.; Andrade, F.A. A numerical study of tidal asymmetry in Okatee Creek, South Carolina. Estuar. Coast. Shelf Sci. 2008, 78, 190–202. [Google Scholar] [CrossRef]
  93. Alizad, K.; Hagen, S.C.; Medeiros, S.C.; Bilskie, M.V.; Morris, J.T.; Balthis, L.; Buckel, C.A. Dynamic responses and implications to coastal wetlands and the surrounding regions under sea level rise. PLoS ONE 2018, 13, e0205176. [Google Scholar] [CrossRef]
  94. PIANC, P. Approach channels a guide for design. Bulletin 1997, 95, 108. [Google Scholar]
  95. Colby, L.H.; Maycock, S.D.; Nelligan, F.A.; Pocock, H.J.; Walker, D.J. An investigation into the effect of dredging on tidal asymmetry at the river murray mouth. J. Coast. Res. 2010, 26, 843–850. [Google Scholar] [CrossRef]
  96. Rahman, M.; Ali, M.S. Morphological response of the Pussur River, Bangladesh to modern-day dredging: Implications for navigability. J. Asian Earth Sci. X 2022, 7, 100088. [Google Scholar] [CrossRef]
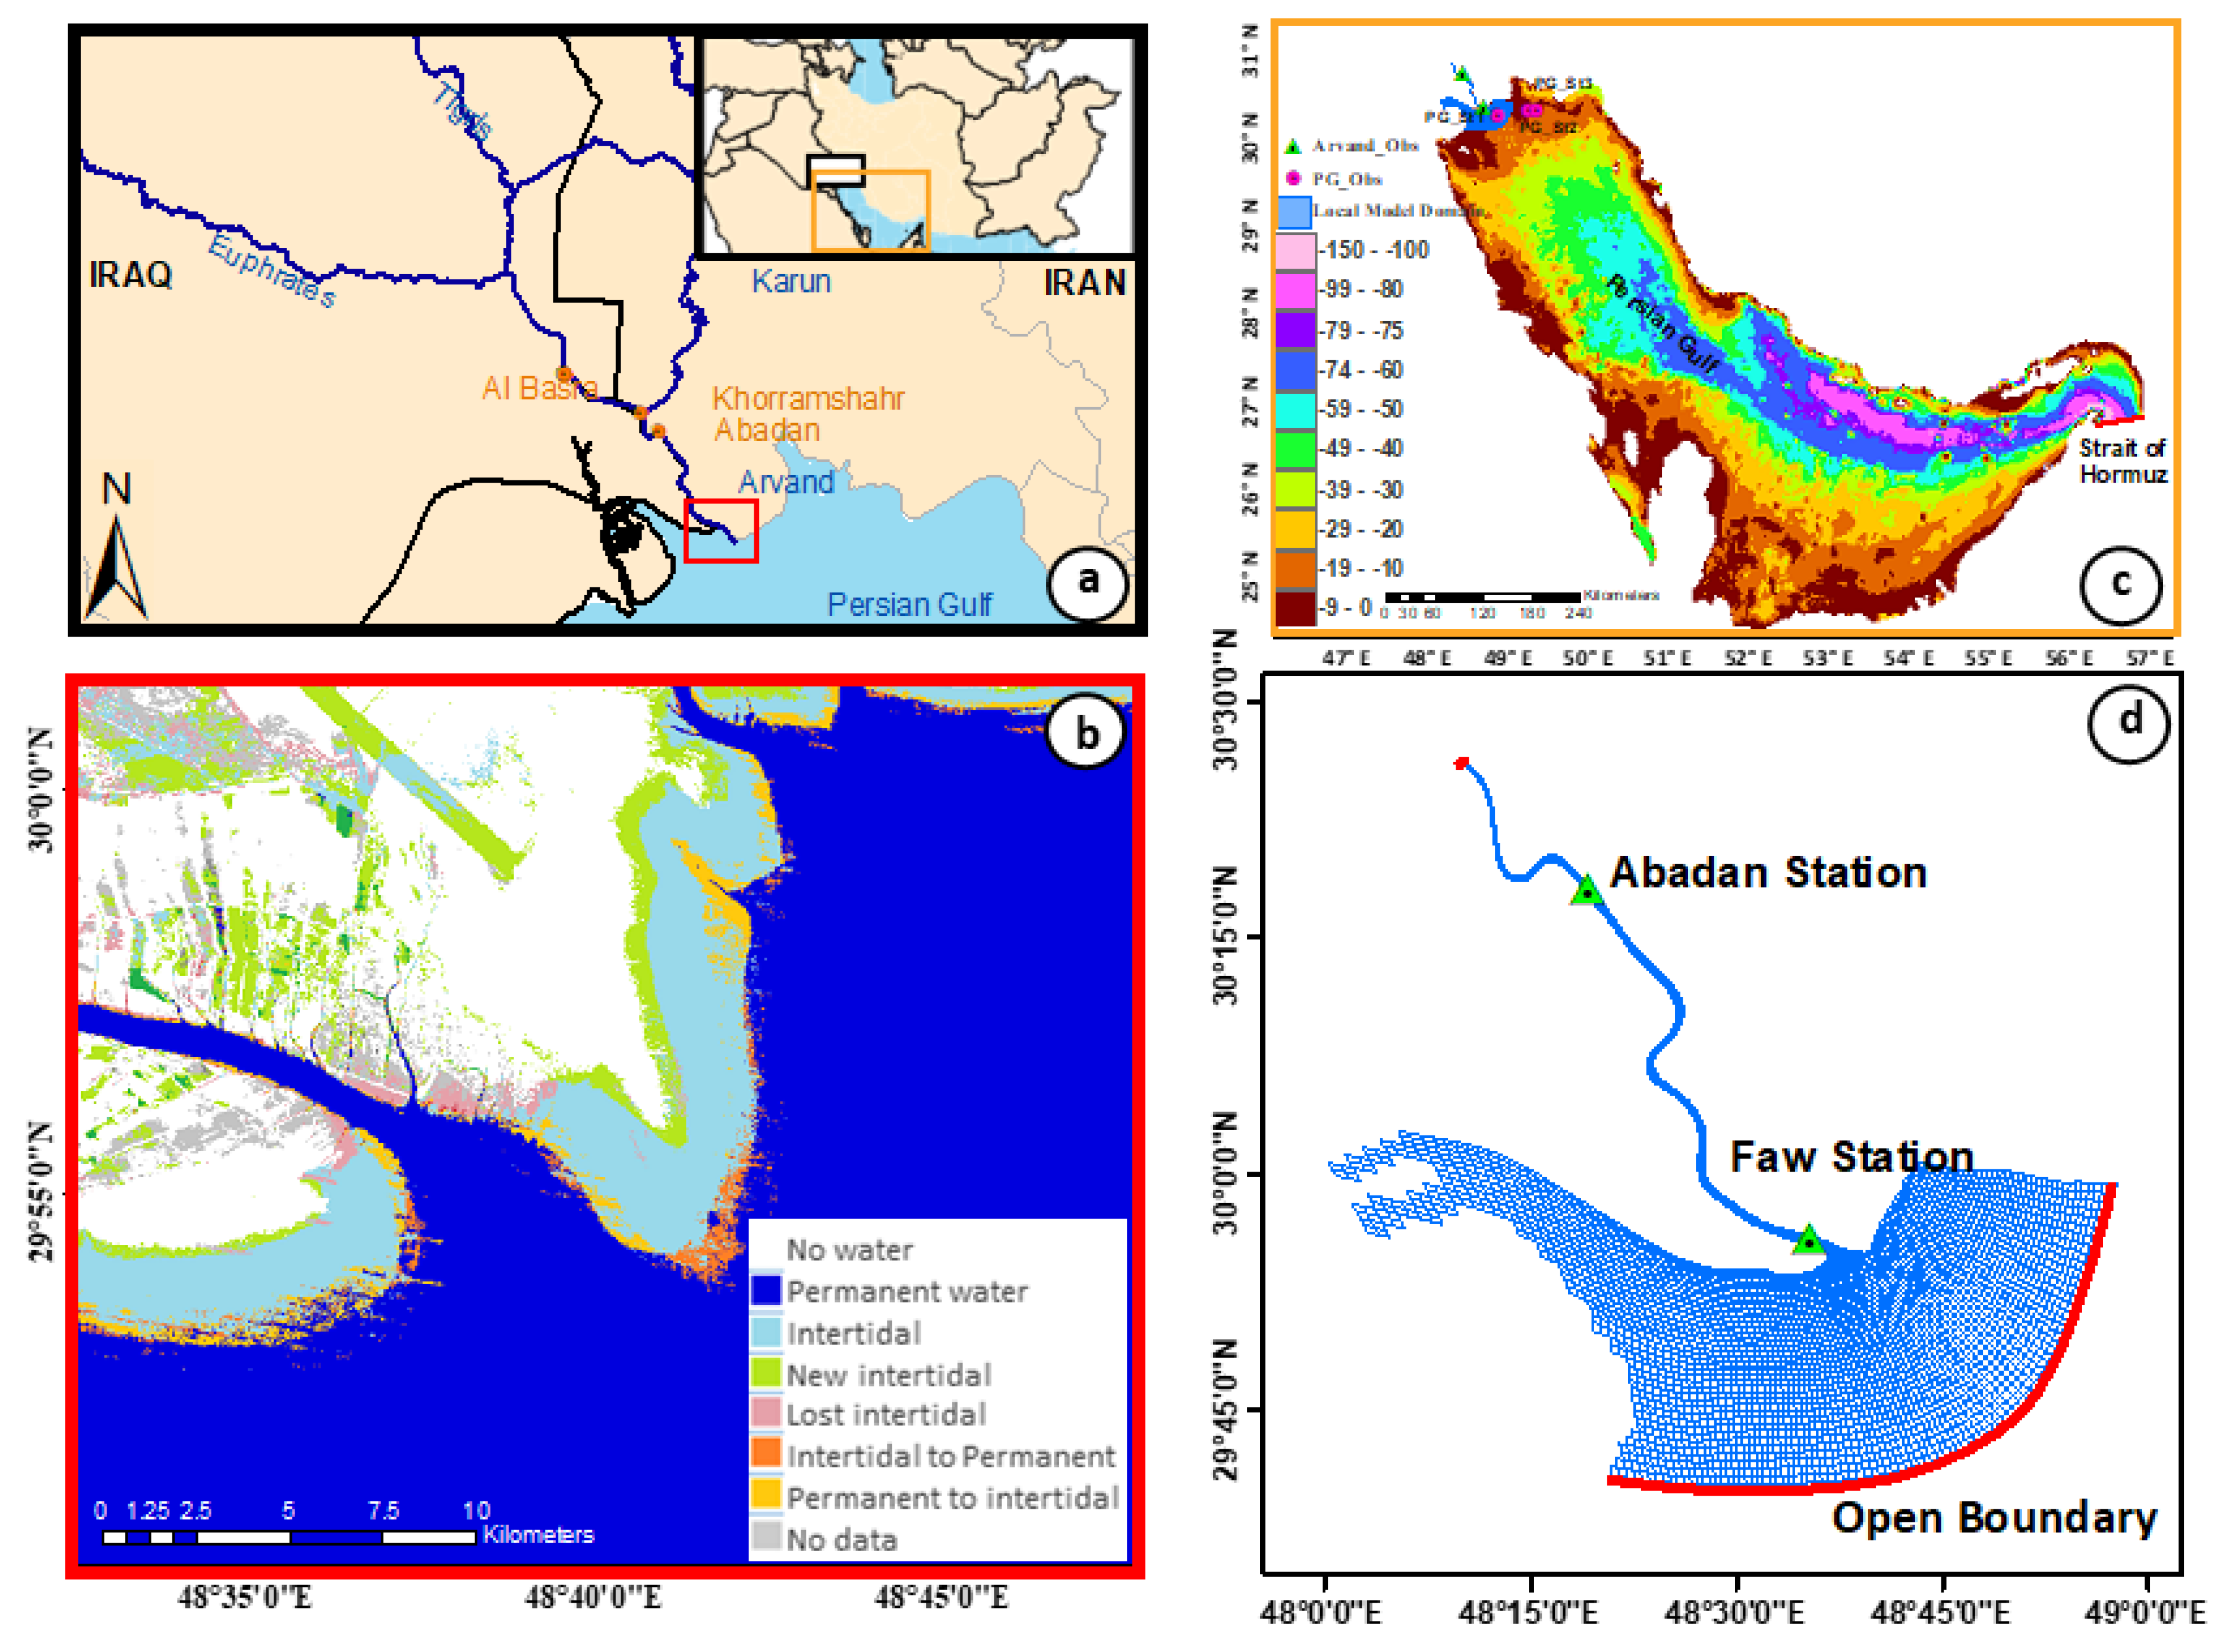
Figure 1. (a) Arvand Estuary location in the southwest of Iran. (b) Long-term changes of Arvand Estuary entrance adopted from Global Surface Water Explorer (GSWE). Blue area: permanent water-covered area; sky-blue area: tidal zone; green area: dry land converted into the intertidal area; pink are: intertidal area converted into dry lands; orange area: intertidal area converted into permanent water-covered area; yellow area: permanent water-covered area converted into the tidal zone; gray: area without data. (c) Persian Gulf bathymetry (GEBCO and Admiralty Charts), observational station, and location of the Persian Gulf model’s open boundary. (d) Delft3D curvilinear mesh of Arvand Estuary model, and observational stations along the estuary.
Jmse 11 01471 g001
Figure 2. Workflow of integrated resilient sediment transport risk management (IRSTRIM) approach.
Jmse 11 01471 g002
Figure 3. Flowchart of reaction amplitude calculation.
Jmse 11 01471 g003
Figure 4. Sensitivity analysis of reaction amplitude. (a) F1. (b) Cosine flux term in F2 and F3. (c) Sine term in F2. (d) Magnitude of reaction amplitude.
Jmse 11 01471 g004aJmse 11 01471 g004b
Figure 5. Sensitivity analysis of recovery rate.
Jmse 11 01471 g005
Figure 6. Sensitivity analysis of graduality rate.
Jmse 11 01471 g006
Figure 7. Sensitivity analysis of saltwater intrusion vulnerability index.
Jmse 11 01471 g007
Figure 8. Sensitivity analysis of U* to changes in particle settling velocity and water depth in the inlet.
Jmse 11 01471 g008
Figure 9. Sensitivity analysis of F1 and F2COS+F3 to changes in particle settling velocity and water depth in the estuary inlet.
Jmse 11 01471 g009
Table 1. Resilience quantification values.
ScenariosAmplitude (ton/year)Recovery Rate (kg/m3.h)GradualityTAISalinity Index (km)Infill Rate (m/year)
Do Nothing215.233NaN1.0000.34121.1540.088
Dredging334.0440.1460.7060.18420.6510.096
Wetland168.3300.1200.8910.31022.3210.065
TB4.5470.0900.6750.16723.2990.045
Table 2. Estimated weight for indicators.
AmplitudeRecovery RateGradualityInfill RateAsymmetrySalinity Index
0.290.0870.130.140.230.12
Table 3. Normalized decision matrix results and application of TOPSIS method considering weight obtained from Entropy method.
RankingConditionsAmplitude (ton/year)Recovery Rate (kg/m3.h)GradualityInfill Rate (m/year)TAISalinity Index (km)TOPSIS Results
1TB0.010.490.560.320.320.600.80
2Wetland0.390.660.740.460.590.570.48
3Do Nothing0.500.000.000.620.650.540.31
4Dredging0.770.800.590.680.350.530.28
Disclaimer/Publisher’s Note: The statements, opinions and data contained in all publications are solely those of the individual author(s) and contributor(s) and not of MDPI and/or the editor(s). MDPI and/or the editor(s) disclaim responsibility for any injury to people or property resulting from any ideas, methods, instructions or products referred to in the content.