Abstract
The discharge of sediment plumes, which occurs mainly in the two depth zones, has a critical impact on assessing the deep-sea environment. Therefore, it is necessary to establish the corresponding physical oceanography for the evolution of these sediment plumes. For a more accurate evolution estimation of the plumes, the model in this research is concerned with the dynamic interaction between the deep-sea mining vehicle (DSMV) and the sediment plumes on small scales (t ≤ 2 s), contributing to a focus on the vital physical mechanics of controlling the extent of these plumes. The sediment concentration and particle trajectories of the plume emissions were determined using the Lagrangian discrete phase model (DPM). The results show that (1) the wake structure of the DSMV wraps the plume vortex discharged from the rear of the vehicle and inhibits the lateral diffusion of the plume, (2) the length of the entire wake (Lw) increases exponentially as the relative discharge velocity of the plume (U*) increases, where U* is defined as the dimensionless difference between the traveling velocity of the DSMV and the discharge velocity of the plume, and (3) at the same traveling speed of the DSMV and U* less than 0.75, the dispersion of the sediment particles in the early discharge stage of the plume does not vary with the plume discharge rate. This will be beneficial for the more accurate monitoring of ecological changes in deep-sea mining activities and provide theoretical guidance for the green design of DSMVs.
1. Introduction
Abundant mineral resources are available on the seafloor. These resources have a wide variety, vast reserves, high grades, and significant development and utilization prospects. Proven deep-sea mineral resources with development prospects have been identified, including polymetallic nodules, cobalt-rich crusts, and polymetallic sulphides, etc., of which the reserves of manganese, nickel, and cobalt are about 10 billion tons, which are much higher than the reserves on land [1]. If commercial exploitation can be carried out safely and efficiently, and the impact on the marine ecological environment during its operation can be well controlled, these abundant marine minerals will become a substitute resource for land-based minerals, meeting the economic development needs of human society for a period in the future [2].
Worldwide, countries are accelerating the development of deep-sea mining equipment. Some organizations have conducted in situ experiments on deep-sea mining activities [3,4,5,6,7]. In these deep-sea mining activities, more than 20 influences have been identified, such as on benthic and planktonic organisms, microtopography, currents, and the material dispersion at mined areas, mainly in two stages [8]. The first stage is the collection phase of deep-sea mining vehicle (DSMV) driving on the seabed, and the other is the phase where a mixture consisting of water, sediment, and nodule fines is released from a discharge pipe, which forms a so-called collector plume and midwater plume, respectively [9]. Along with deep-sea mining activities, these two types of sediment plumes can spread, driven by ocean currents, affecting benthic communities and causing wide-range, long-cycle environmental impacts on the marine environment. The collector plume, known as a sediment plume, is generated by resuspended sediments discharging around a collector vehicle during deep-sea mining activities, generally in its wake zone [10], which is also the primary concern in this study.
Gillard et al. studied the physical and hydrodynamic characteristics of deep-sea sediment plumes in the polymetallic nodule mining areas in the Clarion Clipperton Fracture Zone (CCFZ) of the East-Central Pacific [11]. The spatial dispersion of the plume in the water column was not investigated in the study, but it was revealed that, under an increased shear rate, an increasing concentration of plumes could improve the effect of flocculation. Spearman et al. presented the results of in situ tests at cobalt-rich crust sites in the tropical seamount southwest of the Canary Islands and roughly predicted the spatial distribution of the sediment plumes generated by the artificial disturbance of the seabed sediment, in combination with in situ turbidity data [12]. However, these experiments are pilot scale for deep-sea mining, which is fundamentally smaller than commercial mining. In commercial mining, vehicles suck up most of the nodules, but also draw a large amount of surface sediment into the collectors, and then discharge it to form the bottom sediment plumes [13]. Consequently, it can be predicted that the bottom environment will take a long time to recover after commercial mining [14]. Therefore, it is critical to explore the evolution of bottom sediment plumes and how large the affected area is around the mined area.
Any errors in model assumptions about the initial conditions of plume discharge can have profound implications for the predictions of plumes in the passive-transport phase. Thus, a thorough understanding of the initial form of collector plumes is also the foundation for designing approaches to polymetallic nodule mining. Jankowski et al. developed a numerical model containing plume sources to simulate the convective and diffusion processes of sediments [15]. The results showed that the velocity distribution, stratification, and induced mixing effects of the deep-sea bottom boundary layer (BBL) led to a substantial reduction in the sediment residence time. Furthermore, sensitivity analyses of the interrelationships between sediment plumes and species disturbances have been performed based on this model [16]. In the CCFZ in situ experiments, the numerical model was applied to estimate the scalar sediment concentration and plume dilution factor over long periods and large horizontal distances [12]. However, a key consideration that is specific to deep-sea mining is that the source of the turbidity current is moving. To gain insight into this, Ouillon et al. conducted the first investigation of a gravity current continuously released from a moving source using direct numerical simulation (DNS) [17]. The related numerical predictions were consistent with the field experiment results, which were conducted at a depth of 4500 m in the CCFZ region of the Pacific Ocean [18]. Nevertheless, the idealized numerical model [17] did not resolve individual particles and their interactions, settling, or propensity to flocculate, but instead used an equilibrium-Eulerian description of a buoyancy scalar to represent the sediment mass concentration. To address this point, Lin et al. simulated and experimentally validated plume diffusion on small scales using the smoothed particle hydrodynamics (SPH) method, considering the physical properties of the particles [19]. However, these considerations are not very well thought out either.
In general, the most recent studies mentioned above for modelling such plumes have forced large-scale evolution simulations of sediment plume concentrations over time scales that are still much lighter than the disturbance to the seabed during actual mining [6,12,20]. The discharge of the plumes in these studies have been treated as a source point producing sediments at a certain releasing rate, and the advection–diffusion equation has been solved to describe the dispersion of these plumes. As a result, a normal distribution in the horizontal direction is assumed as the initial condition of the plumes [15,18], and the coupling between the DSMV and the plume is neglected. However, the accuracy of the plume evolution estimation is determined by the effect of the wake of the deep-sea mining vehicle on the initial distribution of the plume during the plume discharge phase [16]. Therefore, new ideas and directions are necessary to model and analyze this effect, add the changes of the plume distribution due to this effect, obtain more accurate initial plume values, and finally complete the large-scale plume evolution estimation.
This study adopted a regular cube structure with a tail jet as the DSMV model to quantify the dynamic interactions between deep-sea mining vehicles and sediment plumes. The main concern was the increased flow field, namely, the wake region, on the influence of the sediment plume distribution in the near field. In Section 2, based on the physical and mechanical properties of sediments and the discrete phase model (DPM) numerical method, the numerical model was established. Subsequently, the grid independence of the discharge plume model was verified. Owing to the variety of pressure gradients during plume discharge, the initial development of plumes is often accompanied by a rapid turbulent entrainment phenomenon [20]. Thus, in Section 3, first, a hydrodynamic analysis within the computational domain was performed, followed by tracing the diffusion of the plume and the spatial distribution of the particles based on the Lagrangian discrete phase model (DPM) numerical method. Finally, the dynamic interaction reflected in the vorticity field, wake length downstream of the DSMV, sediment concentration, and spatial particle distribution were obtained in Section 4, and the discussion was also discussed.
2. Methods
2.1. Equations of Flow Field
In this model, the discrete phase is the particle, and the continuous phase is the fluid moving in the flow field. The particles are treated as discrete particles existing in the continuous phase, following the continuous phase flow field. With a finite control volume integral, the control equation for the continuous phase can be written as:
where Sm is the mass added to the continuous phase from the dispersed phase [kg/m3], which can, of course, be performed as any custom source phase. T represents the viscous stress tensor [N/m2] and fb is the combined force of the various volume forces acting per unit volume of the continuum [N/m3], such as gravity and centrifugal force.
A finite volume discretization is used for Equations (1) and (2), where the second-order midpoint rule and second-order approximate integral are used for the surface and volume integrals, respectively, as shown in the following equation:
in which Jϕ is the convective or diffusive fluxes of fluid property ϕ, sf is the surface area vector of face f of mesh [m2], Sϕ is the mean value of the source terms at the center of the mesh, and V0 is the volume of the mesh [m3]. When ϕ = u, v, w, the momentum equation can be discretized as:
For the transient term, the backward differentiation formula in the basic second-order time discretization solution (BDF2) is used, where the current time step is n + 1.
Then, the pressure–velocity coupling equation is solved by the SIMPLE algorithm to update the density with various pressures and release the temporary storage.
For the incompressible flow, if there is less heat exchange, the conservation of the energy equation can be disregarded. In this simulation, since no heat exchange is involved, the effect of the law of conservation of energy is not considered. Additionally, the turbulence model RKE 2L is applied for the continuous phase, which combines the Realizable K-Epsilon model with the Two-Layer approach [21]. The transport equations for the kinetic energy k and the turbulent dissipation rate ε are:
Mixing the turbulent viscosity in the K-Epsilon model with the Two-layer values, the following equation can be calculated:
in which is the mean fluid velocity [m/s], μ is the dynamic viscosity [Pa·s], k is the turbulent kinetic energy [J/kg], Cε1 = max (0.43, η/(5 + η)), η = Sk/ε, , , Te = k/ε, , σε = 1.2, σk = 1, Cε2 = 1.9, Sk and Sε are user-specified source items, Pk and Pε are the production terms, which depend on the K-Epsilon model variant, and λe is related to the Reynolds number [22].
2.2. The Lagrangian Discrete Phase Model (DPM)
In this study, the Lagrangian DPM numerical method is applied with Euler numerical methods to describe the case in which the individual particle dynamics affect the scaling solution solved in the Euler field. With the DPM method, the trajectory of the particles in the plume can be reflected more realistically. Furthermore, it can reflect the entrainment effect of the plume on the water column. This is not available with the equilibrium-Eulerian description that uses buoyancy scalars to represent the sediment mass concentration. The framework is based on the Lagrangian–Euler method [23], in which the mass, momentum, and energy conservation equations for the discrete phases are written in Lagrangian form for each particle. This method can be used to calculate the trajectory for each particle. The governing equations for the continuous phase are expressed in the Euler form and modified to account for the existence of discrete phases.
The momentum conservation equations for the particles are written in a Lagrangian architecture. The change in momentum is balanced by the surface and bulk forces acting on the particles. The following formula provides the linear momentum conservation equation for a material particle of mass mp:
where vp is the instantaneous particle velocity, Fs is the total force acting on the particle surface, and Fb is the total body force. These forces will then break down into:
where Fd is the drag force, Fp is the pressure gradient force, FL is the lift force acting on the surface of the particles, Fbg is the bottom gravity force, Fc is the contact force based on Hertz Mindlin’s contact theory, and Fvm is the virtual mass force.
2.3. The Numerical Model Setup
As shown in Figure 1, the movement of the DSV produces a disturbance in the surrounding local flow field. Because the model adopts a cube configuration, with increasing movement speed, an expanding vortex at the corner of the front and trailing edge of the structure occurs, and the upstream vortex slowly extends downstream. One of the primary sources of suspended sediment is discharged in the tail of the DSMV after initial screening [17]. On this basis, the mixture of sediment and water is discharged from the DSMV vehicle at a specific injection velocity perpendicular to the jet hole, as shown in red in Figure 1. The proportion of plume velocity as the independent variable describes the velocity disturbance in the downstream flow field.
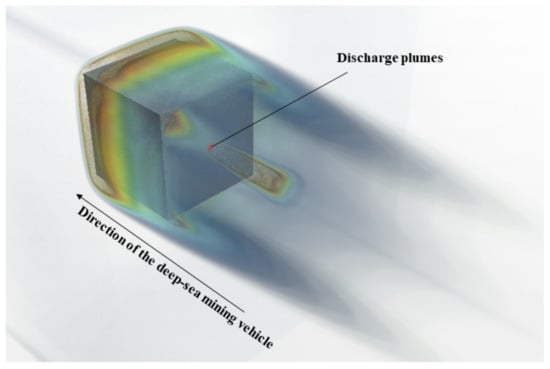
Figure 1.
Volumetric rendering of the vorticity magnitude for the wake region.
Based on the physical motion mechanism described above, a regular cubic structure with a tail jet was used as the numerical model. The model involved two main variables: (1) the speed of the DSMV, and (2) the discharge plume speed. A series of experiments and numerical studies were designed to be carried out based on the structure. Therefore, for subsequent comparisons with experimental data, a mining vehicle model was established under flow similarity, although the scale reduction with the similarity rule is usually used for laboratory experiments.
In this study, we utilized established, reasonable parameters based on nodule mining activities. The main parameters in the model were the plume discharge rate and sediment content. The plume discharge rate can be calculated using the pipe flow formula with a plume discharge velocity, which is O (10−3) m/s. The sediment content was based on the sample experiments, with water depths of 1000 m in the South China Sea in July 2021. The nodules were embedded in the surface layer of the seafloor. Therefore, the physical and mechanical properties of the sediment layer from 0 to 15 cm were obtained, which are shown in Table 1.

Table 1.
Physical properties of deep-sea sediments [24,25].
The current velocity was set to 0.01 m/s to ensure a faster convergence [14]. More detailed parameters are listed in Table 2.

Table 2.
Parameters used in the model and typical values [26,27].
2.3.1. Computational Domain Setting
A dynamic interaction model between the DSMV and sediment plumes was established in Star-CCM+, with hexahedral meshing and surface reconfiguration, as shown in Figure 2, including the plume discharge and movement of the vehicle. First, as shown in Figure 2a, a background region was added for the basic settings of the Eulerian phase, including the physical properties of the continuous medium (water), the inlet, and the outlet. In addition, as shown in Figure 2b, an overlapping grid region was nested within the computational domain to implement the iterative computation for the movement mesh. The plume discharge domain was placed downstream of the DSMV, as shown in Figure 2c,d, and was set as the input injector of the Lagrangian discrete phase. The scale of the background area and the overlapping grid area were set to length × width × height = 2.5 m × 0.5 m × 0.5 m and 0.5 m × 0.25 m × 0.25 m, with a grid size of 0.01 m and 0.002 m, respectively. The simulation time in this model was 2 s.
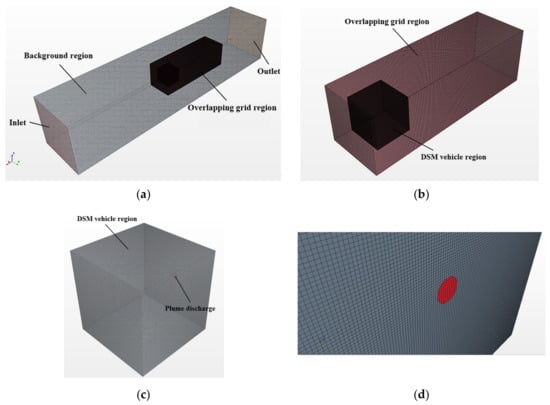
Figure 2.
The computational domain of the dynamic interaction model, which are listed as: (a) Background domain; (b) Overlapping grid domain; (c) Deep-sea mining vehicle domain; and (d) Plume discharge domain.
The particles entered the computational domain at this discrete position. The particle size and velocity vector distribution of the injector were strictly controlled during the numerical calculation process, and the cumulative distribution function (CDF), F(D), was used to quantify the particle size distribution. This definition provides three fundamental properties of the cumulative distribution function.
The Rosin-Rammler cumulative distribution function, defined as follows, was tabulated as the (D, F(D)) value to ensure that these values conformed to the properties in Equation (13) [28]:
where the exponential q and reference dimension Dref are the typical parameters.
The mass flow rate and number of parcels in the injector are given. The distribution of the particles was assigned according to the diameter. The mass of the jet at each time step was divided by the number of parcels to ensure that the mass of each parcel was the same. The particle diameter of each parcel was then randomly sampled from the distribution, and the particle count was adjusted to ensure that the mass of each parcel was the same.
The DSMV model was simplified to a cube with an edge length of 0.15 m and the diameter of the nodule discharge pipe in the model was set to 3 cm, which limited the feather discharge rate in the numerical model. The DSMV moved forward at a fixed speed, whereas the plume was released in the opposite direction. The position of the plume source changed over time, but the discharge rate remained constant.
2.3.2. Sensitivity Analyses of Mesh Parameters
In this numerical model, owing to the high mesh sensitivity of the Eulerian method, it was necessary to calculate the convergence of the numerical calculation results under different mesh numbers.
Four groups of meshes were established and divided using the cutting body mesh method. Because the overlapping grid mesh was sensitive to the grid accuracy, all the meshes of the background region during the overlapping grid mesh movement in the simulation time were densified. During the simulation process, parameters such as the traveling speed of the DSMV and the plume discharge speed were kept constant. The number of meshes was adjusted to the background and the overlapping grid region through a particular proportion, which was taken as the square root of two here. The grid was gradually refined and the model was then calculated.
This numerical simulation mesh sensitivity analysis took 227 W, 360 W, 470 W, and 700 W grids, which meant that the background grid size was reduced from 0.015 m to 0.01 m and the overlapping grid size was reduced from 0.0018 m to 0.001 m, as is shown in Table 3. To show that relatively accurate results could be obtained at the current grid size, the velocity curve on the central axis (y = 0, z = 0) along the movement direction of the vehicle was extracted to compare the calculation results under different numbers of meshes and to judge the correlation between the results and the mesh.

Table 3.
Mesh sensitivity parameter setting.
As shown in Figure 3 and Table 4, it can be observed that the different mesh sizes had significant differences in the numerical calculation results. Both adjacent solutions were between 5% and 10%, and the downstream velocity maximum and extension distance from the 360 W to 470 W grids were approximately 3.2% and 0.65%, respectively. From the 470 W to 700 W grids, these were approximately 2.96% and 0%, respectively. According to the numerical calculation results of the velocity curve and the analysis of the variation of the maximum velocity position, the final mesh sizes were obtained, as indicated in Table 4.
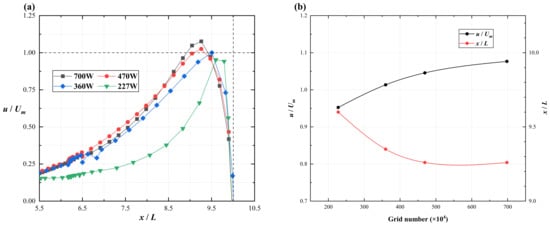
Figure 3.
Sensitivity analysis results of each mesh size. (a) the downstream maximum velocity; (b) extension distance.

Table 4.
Grid independence verification on numerical modeling.
2.3.3. Research Condition Settings
After determining the sensitivity analyses of the mesh parameters, the typical values of variables um and up were obtained. The boundary conditions of the integral numerical model were set as follows:
- The current boundary condition of the inlet was 0.01 m/s. The travel of the DSMV started at the same time as the discharge of the plume. The simulation time was 2 s.
- The percentage of sediment in the plume: the initial setting of the sediment percentage was operated at 20%. Then, the parameter estimate for the resulting sediment discharge rate was 0.29 kg/s with up = 2.0 m/s in Table 3.
The parameters were set, as presented in Table 5.

Table 5.
The typical parameters used in the model to qualify the dynamic interaction.
3. Results and Discussion
3.1. Hydrodynamic Analysis
Based on the established numerical model, a numerical simulation was conducted on the dynamic interaction between the DSMV and sediment plumes with different relative velocities. It should be mentioned that the viscosity and diffusivity of the water were used in the discharge plume, which did not accurately reflect the spreading of the plume and wake fields. Thus, only a qualitative hydrodynamic analysis was carried out, by taking the horizontal section (z = 0) and observing the vorticity and velocity fields at different plume discharge velocities.
3.1.1. Dynamic Interaction Analysis Based on the DSMV and the Plume Vortex Structure
Figure 4 illustrates the variable vortex field in the simulation time, where the vortices were generated first at the upstream and downstream edges of the DSMV during movement. As the vehicle traveled, the downstream vortex shed backward, and the upstream vortex extended downstream to form the integral wake vortex structure of the DSMV. Around the plume discharge location, a vortex structure would also be produced, which would interact with the wake vortex structure of the vehicle and thus affect the plume diffusion distribution and internal particle trajectory.
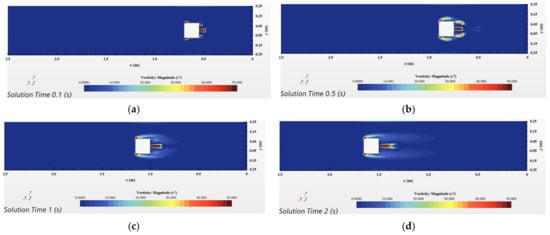
Figure 4.
Vorticity fields at variable moments (z = 0, um = 0.5 m/s, up = 1.0 m/s). (a) t = 0.1 s, (b) t = 0.5 s, (c) t = 1.0 s, and (d) t = 2.0 s. The white square of each figure is the simplified model of a DSMV.
It can be found that, under the influence of the interaction between the DSMV and sediment plume, the vortex caused by the discharge plume would show two stages. At the beginning of the motion, the downstream wake vortex did not fall off from the DSMV when the inertial force dominated, and the plume carried out the spiral diffusion of particles according to its original trajectory. Furthermore, as the downstream wake vortex shed, while the upstream wake vortex developed downstream, an integral wake vortex structure of the vehicle was formed. Owing to the entrainment of the wake region, the wake vortex of the plume was restricted from shedding from the plume release position, and its lateral expansion was prevented.
Based on this influence, vortex volume fields with different discharge plume velocities are shown in Figure 5. The pulsation caused by the discharge of the plume increased with an increase in up, which weakened the influence of the wake vortex structure of the vehicle on the plume diffusion trajectory. Therefore, a larger plume vortex structure was generated under the effect of the relative pressure gradient, which drove the sediment particles in the plume to move along the vortex direction and diffuse the plume on a larger scale. In addition, from Figure 5d, it can be inferred that the vortex shedding from the plume discharge in the first stage was more pronounced, which means that the impact of the DSMV on the plume was reduced.
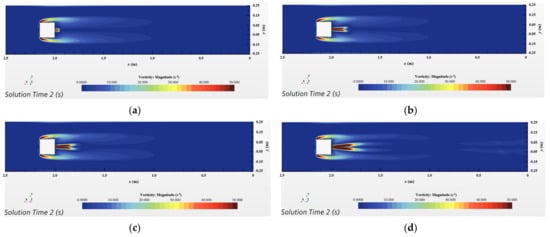
Figure 5.
Vorticity fields with variable plume discharge velocities (z = 0, t = 2 s, um = 0.75 m/s). (a) up = 0 m/s, (b) up = 1.0 m/s, (c) up = 2.0 m/s, and (d) up = 5.0 m/s.
3.1.2. Dynamic Interaction Analysis Based on Turbulent Velocity Profiles
As shown in Figure 6, like the vorticity field, the velocity at the upstream and downstream edges of the DSMV structure was at its maximum in the early stage of travel, at which time the system only produced local velocity changes. Subsequently, there was no noticeable change in the upstream flow field because it was only related to the traveling speed [17]. However, with the formation of the integral wake vortex structure of the vehicle, a tail cone-shaped flow field with plume influence was formed downstream.
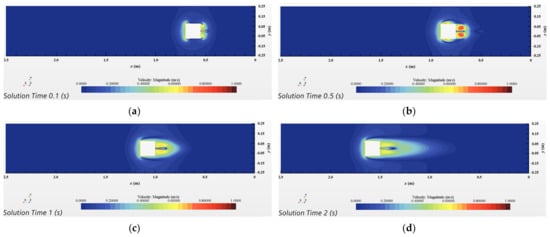
Figure 6.
Velocity fields at variable moments (z = 0, up = 1.0 m/s, um = 0.5 m/s). (a) t = 0.1 s, (b) t = 0.5 s, (c) t = 1.0 s, and (d) t = 2.0 s.
As is shown in Figure 6, the plume discharge improved the structure of the surrounding flow field. The instantaneous velocities along the central axis at different plume discharge velocities were extracted. In the presence of the plume, the wake downstream of the vehicle contained a recirculation zone directly in the integral wake vortex structure, shown as a reverse flow (u < 0) in Figure 7. After the recirculation zone, the velocity would increase back to U∞, rapidly. In principle, the wake could not fully recover to the original velocity field, because the momentum caused by the lift had to remain unchanged downstream of the structure [29]. However, an overall wake length Lw could be defined, meaning that the velocity change rate decreased from the downstream of the structure to the velocity peak, , in which Um represents the maximum velocity value in this profile. In Figure 7a, for the relative velocities U* = 0 and 0.5, Lw/L = 1.13 ± 0.03 and 1.67 ± 0.07, respectively.
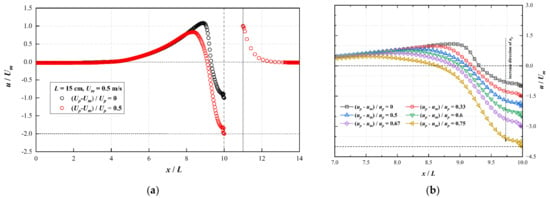
Figure 7.
Longitudinal profile of velocities at variable plume discharge velocities (y = 0). (a) Global velocity profile (up = 0.5, 1 m/s), (b) Local velocity profile.
In addition, Figure 7 shows that increasing the relative velocity increased the length of the downstream velocity recovery zone, while decreasing the peak value of the speed. This was because, as the size of the recovery zone approached the length of the wake vortex zone of the vehicle, the influence of the wake gradually weakened, and the peak value of the velocity also decreased. From this phenomenon, it can be inferred that an increase in the plume discharge velocity delayed the velocity recovery in the downstream flow field, and the peak velocity also decreased.
Figure 8 shows the relationship between Lw/L and U*. According to the analysis of the physical law, under the influence of the vehicle wake flow, when the relative velocity was small, the plume velocity had no apparent impact on the flow field. With a further increase in the relative velocity, the overall wake length increased significantly.
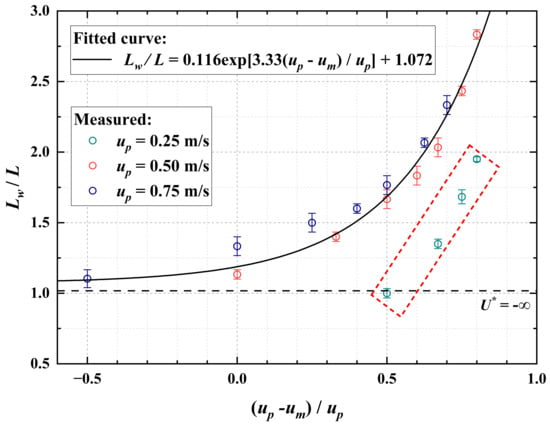
Figure 8.
The relationship between the overall wake length Lw/L and the relative velocity U*, and the black dotted line represents the limit of up = 0, in which U* = −∞, the red dotted area is the data for the case of up = 0.25 m/s.
This law was in accordance with the exponential distribution. Therefore, in the normal range of plume discharge (U* ≤ 0.8), the empirical formula for the wake length and relative velocity of the plume release can be obtained as follows:
where A and β are empirical coefficients, A = 3.33 and β = 0.116. L0 is the limit of up = 0, the numerical simulation result, L0 = 1.072, and the correlation coefficient R2 = 0.973. This formula explains the situation where U* < 0. In addition, as shown in the red dotted area of Figure 8, the fitted curve had a significant deviation for up = 0.25 m/s. The incomplete development of the wake structure of the vehicle at the end of the simulation can explain this.
3.2. Analysis of Sediment Particles
Muñoz-Royo et al. affirmed the role of particles in in situ tests of measuring plume diffusion range and considered that an excessive particle content in the plume affects the plume diffusion [17]. In this study, the volume fraction of the particles in the discharge plume was fixed at 20%, and different volume fluxes of the plume discharge caused variable sediment particle mass fluxes, which was defined as .
In this study, the Lagrangian DPM was used to analyze the characteristic scales of the sediment particle diffusion range. Three cross-sections (normal to the positive x-axis) with different distances from the downstream of the vehicle at t = 2 s, defined as xdown, and a flat cross-section (normal to the positive z-axis) were taken to observe the sediment concentration distributions, as shown in Figure 9.
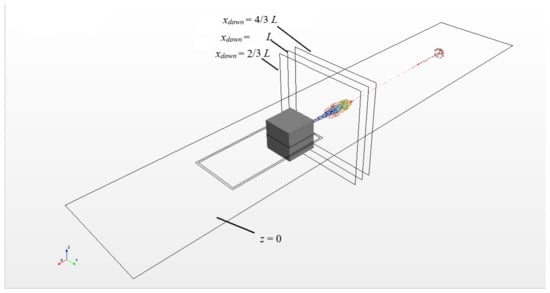
Figure 9.
Schematic diagram of characteristic position for particle concentration analysis.
3.2.1. Flat Cross-Section Distribution of Particle Concentration
As shown in Figure 10, the particles propagated in the clustered parcel bundles along the x-axis. Then, in the presence of the plume vortex (Figure 4 and Figure 5), the particles spread around in the direction of the vortex, which was mainly manifested by the particle concentration increasing significantly at xdown ≈ 6.2 L in the flat cross-section (Figure 10a,b).
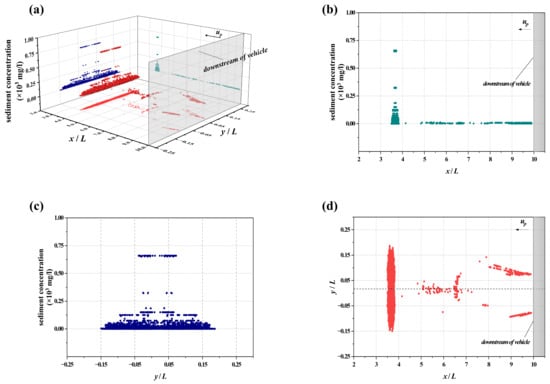
Figure 10.
Flat cross-section distribution of particle concentration (y = 0, t = 2 s, um = 0.5 m/s, and up = 0.5 m/s), (a) The dark red dots are the spatial distribution of particle concentration, (b) The green dots show the variation of particle concentration along the x-axis, (c) The blue dots show the variation of particle concentration along the y-axis, and (d) The light red dots are the distribution of particles on the flat cross-section.
Regarding the spatial scale of the particle distribution, it was found that the particle concentration presented a symmetrical distribution along both sides of the y-axis at this local scale, as shown in Figure 10c,d, with the maximum concentration of particles at the center and a minor concentration further away from the center. This phenomenon is consistent with the initial distribution assumptions of Jankowski et al. and Wenbin et al. for plume sources, namely the Gaussian distribution [14,15]. However, along the direction of the plume discharge, the particles showed an apparent single-peak skewed distribution, as shown in Figure 10b, because the plume Froude number, defined as Frp , decreased with particle movement. This phenomenon means that the inertial force of the plume weakened, and the plume began to swirl and spread under the action of the current, forming vortices (Figure 4), thus resulting in a skewed distribution of the particles.
In this study, owing to the DSMV wake vortex structure, the value of the relative velocity determined the influence of the wake turbulence structure on the plume inertia force. Figure 11 shows the spatial distribution of the flat cross-section of the particles at different relative velocities. It can be seen from Figure 11 that an increase in the relative velocity caused the particles to spread over a broader range. Although there was a close relationship between them, the location where the particles initially diffused did not change. Muñoz-Royo et al. proposed that the wake turbulence effect of the DSMV on the plume discharge should be characterized by the wake Froude number Frw, defined as Frw = um/, where the floating heaviness g′ = g (ρs − ρ0)/ρs. It can be inferred from the formula that the speed of the DSMV, the sediment content of the plume, and the submerged location of the vehicle determine the influence of the wake turbulence on the plume discharge. Therefore, as shown in Figure 4, the wake vortex structure extended downstream, wrapping the plume vortex and inhibiting its diffusion. When the travel speed of the vehicle was constant, the wake vortex turbulence had the same suppression effect on the plume, and the location of the plume vortex center did not change; therefore, the particles at different relative speeds still diffused at the same position.
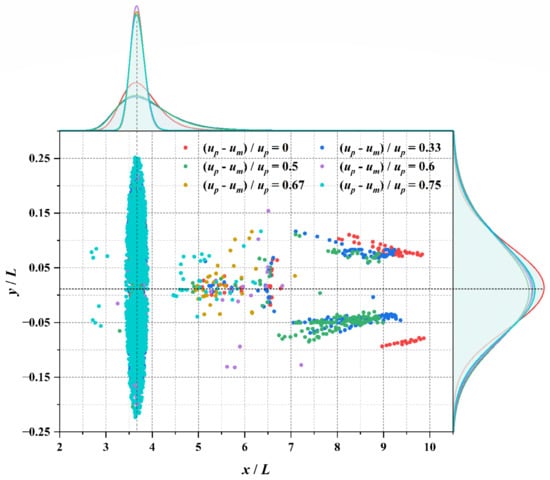
Figure 11.
Spatial distribution of particle flat cross-section (y = 0, t = 2 s, um = 0.5 m/s). The points in the figure are the spatial distribution of particle positions corresponding to different relative velocities, the upper part of the figure is the probability distribution curve of particle positions along the x-axis, and the right part of the figure is the probability distribution curve of particle positions along the y-axis.
3.2.2. Cross-Sections Distribution of Particle Concentration
In this study, axisymmetric or uniform settings were used for the initial conditions, including the DSMV structure, plume discharge location, reference pressure, and particle size. Therefore, it was expected that the particle concentration would also have a highly symmetrical distribution on the lateral scale, as shown in Figure 12. Under up = 0.5 m/s, the spatial distribution of the particles on the cross-section did not change significantly with an increase in the distance from the downstream of the DSMV structure. However, the spatial distribution of the sediment concentration first increased and then decreased with xdown. This trend suggests that the plume discharge period consisted of two phases. The first phase of the plume discharge, shown in Figure 7, exhibited a significant eddy field in the plume itself, with the plume itself dominating and the DSMV wake being less influential, which resulted in the maximum concentration of sediment following the plume outward (Figure 12a,c).
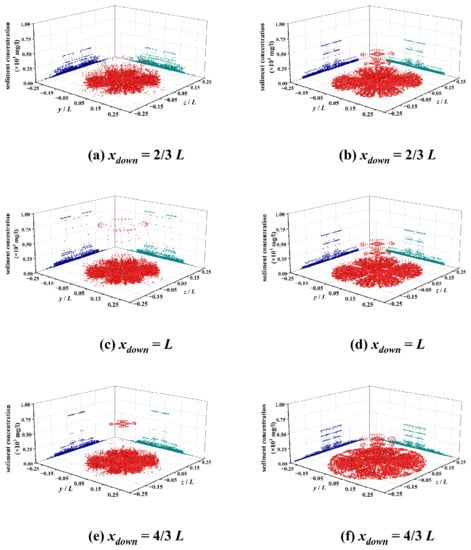
Figure 12.
Cross-sections distribution of particle concentration (um = 0.5 m/s, left: up = 0.5 m/s, right: up = 1.0 m/s).
However, considering the dynamic interaction between the DSMV and the sediment plume, as the plume progressed into the second phase, the wake turbulence of the vehicle inhibited the further spread of the plume, thus leading to the compression of the sediment maximum concentration position toward the center, as shown in Figure 12c,e. Furthermore, an increase in the relative velocity weakened the influence of the DSMV wake flow. Therefore, for up = 1.0 m/s, as shown in Figure 10b,d,f, the maximum sediment concentration was not significantly influenced by xdown, due to a larger plume-dominated region. In contrast, the spatial distribution of the internal particles spread adequately with the discharge of the plume and tended to be more uniform and complete, like a circular distribution.
4. Conclusions
In this study, the initial discharge form of sediment plumes was studied based on the dynamic interaction between the DSMV and these sediment plumes. The initial plume parameters included the sediment content and particle diameter, which were obtained via an appropriate plume estimation based on in situ experiments from a sea area in the South China Sea. Based on the small-scale analysis, the Lagrange (DPM) numerical method was used to analyze the hydrodynamic force, particle trajectory, and plume diffusion range according to the change in the relative velocity, composed of the plume release velocity and traveling speed of the DSMV. The main conclusions are as follows.
- (1)
- The wake vortex structure of a vehicle has an important influence on the plume discharged in its wake region. When the relative velocity was satisfied as U* ≤ 0.8, the wake vortex structure of the vehicle entrapped the plume vortex released from the tail and inhibited the lateral spread of the plume.
- (2)
- In this study, an empirical formula (Equation (15)) was used to estimate the wake length of the downstream flow field. Compared with the plume discharge speed, the relative speed also included the independent variable of the traveling speed of the DSMV; therefore, it had a higher universality.
- (3)
- The strength of this inhibition was related to the traveling speed of the mining vehicle. Therefore, at the same traveling rate, this inhibition caused the dispersion of the sediment particles in the plume release direction to be similar. However, the discharge of the plume conversely affected the wake flow field of the DSMV and delayed the recovery of the downstream flow field.
It is worth mentioning that the structure of the DSMV in this model was simplified, whereas the flow structure around the DSMV in a real situation is much more complex. Thus, the current model just suggests a new way of thinking about studying sediment plumes, which is more idealized. Meanwhile, it can be determined that the parameters of the present study were appropriately chosen and could monitor a more accurate estimation of sediment plumes and provide theoretical guidance for the green design of DSMVs in real DSM activities. In addition, since the DPM method tracks for particles, it consumes a lot of computational resources and is not suitable for long-term and large-scale applications. Therefore, the authors believe that combining near-field (DPM) with far-field (Eulerian scalar) for combined simulations would be a new, appropriate approach.
This research did not consider the interaction among the particles in the sediment plume, including collision, breakup, and flocculation. It further simulated the suspension and settlement caused by the variation in the particle size distribution after the plume was discharged. This study focused on the sediment plume released from the wake region of a vehicle. Therefore, shorter time and space scales were adopted. At this scale, the discharge velocity of the plume (O (m/s)) was far greater than the settling velocity of the sediment particles (O (mm/s)), and the inertial force of the plume was the main force that weakened the influence of the particle interaction on the sediment diffusion.
However, this does not imply that the interaction is negligible. In subsequent studies, these effects should be combined to evaluate the total length and diffusion of the plume in a large-scale analysis.
Author Contributions
Conceptualization, S.L.; methodology, S.L. and P.S.; software, S.L., J.Y., H.L. and B.Z.; validation, S.L., J.Y., P.S., H.L. and B.Z.; formal analysis, S.L.; investigation, P.S.; resources, S.L.; data curation, S.L.; writing—original draft preparation, S.L.; writing—review and editing, S.L., P.S., H.L. and B.Z.; visualization, J.Y. and P.S.; supervision, S.L.; project administration, S.L.; funding acquisition, S.L. All authors have read and agreed to the published version of the manuscript.
Funding
This research was funded by the Hainan Special Ph.D. Scientific Research Foundation of Sanya Yazhou Bay Science and Technology City (HSPHDSRF-2022-01-003), Major Projects of Strategic Emerging Industries in Shanghai.
Institutional Review Board Statement
Not applicable.
Informed Consent Statement
Not applicable.
Data Availability Statement
The data presented in this study are available on request from the corresponding author.
Conflicts of Interest
The authors declare no conflict of interest.
Abbreviations
The main symbols used in the article are listed below, containing all the parameters and their units.
| Variable | Parameter | Unit |
| Cε1 | coefficient I in the Realizable K-Epsilon model | None |
| Cε2 | coefficient II in the Realizable K-Epsilon model | None |
| D | discharge hole diameter | m |
| ds | mean diameter of sediment | m |
| Dref | reference dimension | m |
| Fs | total force acting on the particle surface | N |
| Fb | total body force | N |
| Fd | drag force | N |
| Fp | pressure gradient force | N |
| FL | lift force acting on the surface of the particles | N |
| Fbg | bottom gravity force | N |
| Fc | contact force based on Hertz Mindlin’s contact theory | N |
| Fvm | virtual mass force | N |
| Frp | initial plume Froude number | None |
| Frw | wake Froude number | None |
| fb | combined force of the various volume forces | N/m3 |
| f2 | the damping function | None |
| k | turbulent kinetic energy | J/kg |
| Lw | overall wake length | m |
| L | side lengths of the cube model | m |
| L0 | non-dimensional distance at the limit of up = 0 | None |
| sediment discharge rate | kg/s | |
| Pk | the production term I | J/kg·s |
| Pε | the production term II | J/kg·s |
| Qp | plume discharge rate | m3/s |
| q | exponential | None |
| Sm | mass added to the continuous phase from the dispersed phase | kg/m3 |
| Sk | user-specified source item I | J/kg·s |
| Sε | user-specified source item II | J/kg·s |
| sf | surface area vector of face f of mesh | m |
| T | viscous stress tensor | N/m2 |
| Te | large-eddy time scale | None |
| T0 | time scale per unit | None |
| t | Simulation time | s |
| U* | relative discharge velocity of the plume | None |
| Um | the maximum velocity value in the profile | m/s |
| u | instantaneous velocity at a specific location | m/s |
| um | traveling speed of DSMV vehicle | m/s |
| up | Mean discharge velocity | m/s |
| mean fluid velocity | m/s | |
| vp | instantaneous particle velocity | m/s |
| V0 | volume of the mesh | m3 |
| xdown | distance from the downstream of the DSMV | m |
| x | longitudinal coordinates of the model | m |
| y | horizontal coordinates of the model | m |
| z | vertical coordinates of the model | m |
| ρ0 | fluid density | kg/m3 |
| μ | dynamic viscosity | Pa·s |
| μt | turbulent viscosity | Pa·s |
| σε | coefficient III in the Realizable K-Epsilon model | None |
| σk | coefficient IV in the Realizable K-Epsilon model | None |
| λe | coefficient in the viscosity model | None |
| α | percentage of sediment in the plume | None |
| ρs | sediment solid density | kg/m3 |
References
- Yang, J.; Liu, L.; Lyu, H.; Lin, Z. Deep-Sea Mining Equipment in China: Current Status and Prospect. Chin. J. Eng. Sci. 2020, 22, 1–9. [Google Scholar] [CrossRef]
- Yang, N.; Chen, G. Status quo and development trendency of deep sea minerals mining technology. Min. Process. Equip. 2010, 38, 4–9. [Google Scholar]
- Klein, H. Near-bottom currents in the deep Peru Basin, DISCOL experimental area. Dtsch. Hydrogr. Z. 1993, 45, 31–42. [Google Scholar] [CrossRef]
- Koschinsky, A.; Heinrich, L.; Boehnke, K.; Cohrs, J.C.; Markus, T.; Shani, M.; Singh, P.; Smith Stegen, K.; Werner, W. Deep-sea mining: Interdisciplinary research on potential environmental, legal, economic, and societal implications. Integr. Env. Ment. Assess. Manag. 2018, 14, 672–691. [Google Scholar] [CrossRef] [PubMed]
- Kulkarni, C.S.; Haley, P.J.; Lermusiaux, P.F.; Dutt, A.; Gupta, A.; Mirabito, C.; Subramani, D.N.; Jana, S.; Ali, W.H.; Peacock, T.; et al. Real-time sediment plume modeling in the Southern California bight. In Proceedings of the OCEANS 2018 MTS/IEEE Charleston, Charleston, SC, USA, 22–25 October 2018; pp. 1–10. [Google Scholar] [CrossRef]
- Muñoz-Royo, C.; Peacock, T.; Alford, M.H.; Smith, J.A.; Le Boyer, A.; Kulkarni, C.S.; Lermusiaux, P.F.J.; Haley, P.J.; Mirabito, C.; Wang, D.; et al. Extent of impact of deep-sea nodule mining midwater plumes is influenced by sediment loading, turbulence and thresholds. Commun. Earth Environ. 2021, 2, 148. [Google Scholar] [CrossRef]
- Spearman, J.J.M.P.B. A review of the physical impacts of sediment dispersion from aggregate dredging—ScienceDirect. Mar. Pollut. Bull. 2015, 94, 260–277. [Google Scholar] [CrossRef]
- Sharma, R. Deep-Sea Mining: Resource Potential, Technical and Environmental Considerations; Springer: Berlin/Heidelberg, Germany, 2017. [Google Scholar]
- Zongyu, H. Environmental impacts of deep sea mining. Ocean. Dev. Manag. 2003, 20, 61–65. [Google Scholar]
- Ouillon, R.; Muñoz-Royo, C.; Alford, M.H.; Peacock, T. Advection-diffusion-settling of deep-sea mining sediment plumes. Part 1: Midwater plumes. Flow 2022, 2, E22. [Google Scholar] [CrossRef]
- Gillard, B.; Purkiani, K.; Chatzievangelou, D.; Vink, A.; Iversen, M.H.; Thomsen, L. Physical and hydrodynamic properties of deep sea mining-generated, abyssal sediment plumes in the Clarion Clipperton Fracture Zone (eastern-central Pacific). Elem. Sci. Anthr. 2019, 7, 5. [Google Scholar] [CrossRef]
- Spearman, J.; Taylor, J.; Crossouard, N.; Cooper, A.; Turnbull, M.; Manning, A.; Lee, M.; Murton, B. Measurement and modelling of deep sea sediment plumes and implications for deep sea mining. Sci. Rep. 2020, 10, 5075. [Google Scholar] [CrossRef]
- Ouillon, R.; Muñoz-Royo, C.; Alford, M.H.; Peacock, T. Advection–diffusion settling of deep-sea mining sediment plumes. Part 2. Collector plumes. Flow 2022, 2, E23. [Google Scholar] [CrossRef]
- Jankowski, J.A.; Malcherek, A.; Zielke, W. Numerical modeling of suspended sediment due to deep-sea mining. J. Geophys. Res. Oceans 1996, 101, 3545–3560. [Google Scholar] [CrossRef]
- Ma, W.; Schott, D.; van Rhee, C. Numerical calculations of environmental impacts for deep sea mining activities. Sci. Total Environ. 2019, 652, 996–1012. [Google Scholar] [CrossRef]
- Ouillon, R.; Kakoutas, C.; Meiburg, E.; Peacock, T. Gravity currents from moving sources. J. Fluid Mech. 2021, 924, A43. [Google Scholar] [CrossRef]
- Muñoz-Royo, C.; Ouillon, R.; El Mousadik, S.; Alford, M.H.; Peacock, T. An in situ study of abyssal turbidity-current sediment plumes generated by a deep seabed polymetallic nodule mining preprototype collector vehicle. Sci. Adv. 2022, 8, eabn1219. [Google Scholar] [CrossRef]
- Lin, Y.; Weng, Z.; Guo, J.; Lin, X.; Phan-Thien, N.; Zhang, J. Simulation Study on the Sediment Dispersion during Deep-Sea Nodule Harvesting. J. Mar. Sci. Eng. 2022, 11, 10. [Google Scholar] [CrossRef]
- Purkiani, K.; Gillard, B.; Paul, A.; Haeckel, M.; Haalboom, S.; Greinert, J.; de Stigter, H.; Hollstein, M.; Baeye, M.; Vink, A.; et al. Numerical Simulation of Deep-Sea Sediment Transport Induced by a Dredge Experiment in the Northeastern Pacific Ocean. Front. Mar. Sci. 2021, 8, 719463. [Google Scholar] [CrossRef]
- Morton, B.R.; Taylor, G.I.; Turner, J.S. Turbulent gravitational convection from maintained and instantaneous sources. Proc. R. Soc. London. Ser. A Math. Phys. Sci. 1956, 234, 125–128. [Google Scholar] [CrossRef]
- Shih, T.H.; Liou, W.W.; Shabbir, A.; Yang, Z.; Zhu, J. A New K-epsilon Eddy Viscosity Model for High Reynolds Number Turbulent Flows: Model Development and Validation. Comput. Fluids 1994, 24, 227–238. [Google Scholar] [CrossRef]
- Jongen, T. Simulation and Modeling of Turbulent Incompressible Fluid Flows. Ph.D. Thesis, EPF Lausanne, Lausanne, Switzerland, 1992. [Google Scholar] [CrossRef]
- Crowe, C.T.; Schwarzkopf, J.D.; Sommerfeld, M.; Tsuji, Y. Multiphase Flows with Droplets and Particles; CRC Press: Boca Raton, FL, USA, 2011. [Google Scholar]
- Liu, S.; Liu, C.; Dai, Y. Status and progress on researches and developments of deep ocean mining equipments. J. Mech. Eng. 2014, 50, 8–18. [Google Scholar] [CrossRef]
- Sun, P.; Lu, H.; Yang, J.; Liu, M.; Li, S.; Zhang, B. Numerical study on shear interaction between the track plate of deep-sea mining vehicle and the seafloor sediment based on CEL method. Ocean Eng. 2022, 266, 112785. [Google Scholar] [CrossRef]
- Oebius, H.U.; Becker, H.J.; Rolinski, S.; Jankowski, J.A. Parametrization and evaluation of marine environmental impacts produced by deep-sea manganese nodule mining. Deep. Sea Res. Part II Top. Stud. Oceanogr. 2001, 48, 3453–3467. [Google Scholar] [CrossRef]
- Rzeznik, A.J.; Flierl, G.R.; Peacock, T. Model investigations of discharge plumes generated by deep-sea nodule mining opera-tions. Ocean. Eng. 2019, 172, 684–696. [Google Scholar] [CrossRef]
- Lefebvre, A.H.; McDonell, V.G. Atomization and Sprays; CRC Press: Boca Raton, FL, USA, 2017. [Google Scholar]
- Zong, L.; Nepf, H. Vortex development behind a finite porous obstruction in a channel. J. Fluid Mech. 2011, 691, 368–391. [Google Scholar] [CrossRef]
Disclaimer/Publisher’s Note: The statements, opinions and data contained in all publications are solely those of the individual author(s) and contributor(s) and not of MDPI and/or the editor(s). MDPI and/or the editor(s) disclaim responsibility for any injury to people or property resulting from any ideas, methods, instructions or products referred to in the content. |
© 2023 by the authors. Licensee MDPI, Basel, Switzerland. This article is an open access article distributed under the terms and conditions of the Creative Commons Attribution (CC BY) license (https://creativecommons.org/licenses/by/4.0/).