Abstract
This work describes the characteristics of a device capable of detecting the magnetic field generated by a submerged electrical conductor. This low-cost apparatus is based on the open-source Arduino platform and offers the possibility of monitoring magnetic fields generated by undersea cables. Measuring magnetic fields generated by undersea cables facilitates the development of technologies that will harness marine energy potential. The research is based on published parameters of magnetic field values generated by existing submarine cables. A coil was built to simulate an approximate magnetic field at 10 mT. The magnetic field generated by the coil was used as a reference standard. The device developed has a measurement probe built with an array of SS49E Hall effect sensors placed in a straight line and separated 5 cm from each other. A DS18B20 temperature sensor was added to make the necessary corrections and cancel the influence of temperature during the measurements. A microSD card module was attached to store continuous magnetic field measurements. The device was adjusted under strict laboratory conditions. The functionality of the device developed was confirmed by two samplings in the sea. In these samples, the magnetic field generated by the coil was measured in the entire water column from a depth of 3 m to 150 m. Results indicate that the prototype can successfully perform the necessary functions to quantify the underwater magnetic field accurately with about 10 µT accuracy.
1. Introduction
A wide range of marine energy devices capture and convert the power available in the ocean, using various operational principles. Generally speaking, electricity can be harvested from the movement of water through waves, currents, and tides, as well as from differences in temperature and salinity [1,2,3,4,5,6,7]. All marine energy conversion technologies need to transmit the electricity they produce to the shore via undersea power cables either as alternating current (AC) or direct current (DC) [8].
Submarine power cables (SPCs), as with any other anthropic installation in the ocean, can affect marine life temporarily or permanently [8]. Although SPCs were used for more than a century, concerns related to their environmental impacts are more recent, and their impacts are still relatively unknown in many cases [8]. One of these concerns relates to the changes in the behaviour of marine species when they are exposed to the magnetic fields produced by the electric current flowing through the cable [9]. Research in this field often faces the difficulties of working in very harsh oceanic environmental conditions [8]. Consequently, these investigations are usually carried out in laboratories, where the operation of an SPC is simulated through coil systems. For example, Refs. [10,11,12] used a Helmholtz coil system, while [13] used a square coil.
The first high voltage direct current (HVDC) submarine cable for electricity transmission was commissioned in 1954, connecting the electric grid of Gotland Island to Sweden’s mainland grid. The cable was rated at 200 A (20 MW, 100 kV), and had a length of 98 km [14]. Nowadays, the longest power transmission HVDC submarine cable is the NorNed Link, between Norway and the Netherlands at 580 km, with a total transfer capacity of 1555 A (700 MW, ±450 kV) [15]. Among many SPC projects being planned worldwide, submarine cables of over 1000 km are soon to be installed. The Icelink project includes a planned 1200 km SPC, connecting the UK with Norway, Germany, and the Netherlands. This SPC will carry ~2200 A (1000 MW, average 440 kV) and is due to be operational in 2025 [16]. The EuroAsia Interconnector will connect the Israeli electricity grid to Greece, via Cyprus, with a total rated transmission capacity of 5000 A (2000 MW, 400 kV), and a length of over 1500 km [17].
An electrical conductor can carry electrical energy via AC or DC. In both cases, electromagnetic fields are generated, being composed of an electric field (measured in volts per metre, V/m) and a magnetic field (measured in tesla, T). Scientific interest in understanding the interactions between ocean life and undersea cables began with records of whale entanglements [18] and the biting of cables by fish and sharks [19]. Technological advances in the materials sector succeeded in blocking the electric field component generated by SPC using improved coatings, shielding, and protection [20]. Ref. [21] defined the key technical and economic indices of DC submarine cables and strategies for locating and burying submarine cables to reduce their interaction with the environment. Whenever possible, cables are buried under a sediment layer (0.3–2 m); in the case of hard substrata or deep water (>600 m), cables are simply laid on the seabed and covered by rocks, steel plates, concrete slab mattresses, cast-iron shells, or cable anchoring (15–30 cm thick) [18]. The electric fields are confined to the internal part of the cable through the use of highly conductive sheathes and armour, such as steel plates, wire, or tape. Existing insulation technology is only partially effective in shielding magnetic emissions, and is not considered in the design of SPC at present [22].
The Earth´s magnetic field (GMF) is used by numerous marine species for orientation and migration [23,24,25]. Magneto-sensitive species are known to respond to small changes in the intensity and/or direction of a magnetic field [26]. Previous studies showed that fish may respond to changes in field intensity of less than 50 nT [27], suggesting that an artificial magnetic field could affect such species. The ability to sense the GMF was not really considered or investigated in fish before the experimental work of [28,29,30], working on skate (Raja clavata and Trygon pastinaca), which were found to react to magnetic fields between 80 μT and 200 μT in behavioural and electrophysiological experiments. Artificial magnetic fields are as yet poorly understood, although they are potentially important; an increasing emission in the marine environment that may disrupt or mask environmental signals vital to magneto-sensitive fauna [31].
Some authors [32,33] propose that the magnetic fields produced on the surface of submarine cables are very heterogeneous, with intensities ranging from 1 µT for the smallest cables to 3200 µT for the most powerful, high-voltage DC cables. The magnetic field strength (also called magnetic induction) decreases as the distance from the cables increases [22]. Some examples of magnetic fields recorded elsewhere are presented in Appendix A.
Although instruments for measuring underwater magnetic fields are commercially available, they are expensive and sophisticated, and are not very adaptable to specific tasks in various marine conditions, meaning that their use in an ocean energy conversion system would be complicated, or impossible, as they are simply not designed to withstand the pressure of the water column. Small portable instruments are also available, but they cannot take measurements underwater; an instrument capable of measuring the magnetic field values generated by SPC is urgently needed. Such a device should be flexible in its deployment, of a small size, have autonomous memory for storing records, and be low-cost.
Several sensors are currently available for measuring magnetic fields using different operating principles. To provide a few examples, in Faraday induction, when the magnetic flux threading through a conducting circuit varies, a voltage signal is induced in the circuit in accordance with Faraday’s law of electromagnetic induction, the induced voltage is proportional to the rate of change in the magnetic flux [34]. The Larmor precession of neutron spin arises when the beam polarization and magnetic field vectors form a certain angle. Given a uniform magnetic field, the phase of Larmor precession depends on the neutron wavelength and on its path in the magnetic field. Neutron trajectories in space can be discriminated by measuring the Larmor precession phase [35]. For the Josephson junction, when connecting two superconducting materials, separated by a thin insulating layer, an electric current can be observed flowing from one side to the other, this can be measured and is proportional to the external magnetic field [36]. The Hall effect is based on Lorentz forces acting on moving charge carriers while current flows through a material and is exposed to a magnetic field [37].
The choice of sensor depends on the purposes of the research for which the measurements are required. Selection criteria include cost, size, sensitivity, type, and range of supply voltage. The dominating technologies worldwide are systems based on the Hall effect, followed by MR systems [38]. AMR and planar Hall effect were utilized extensively in the past for the construction of low field magnetic sensors [39]. Magnetoresistance and Hall effect-based sensors constitute an active area of development, and their main applicability is in areas that require high sensitivity and small size [39].
In [40] a more detailed comparison of these two sensors is given. Both types of sensors offer non-contact, wear-free operation, and low maintenance costs, but MR sensors have greater sensitivity and their response varies in proportion to the measurement angle, so it is necessary to have an angular compensation stage in the measurement to guarantee the accuracy of the measurements. An MR sensor does not have a linear response and its hysteresis also depends on the measurement angle. The non-linear response implies a considerable increase in the programming cycle, and the greater sensitivity implies an increase in the cost and volume of the device. For this reason, we decided to use a Hall sensor for our research into a low-cost device that does not require exhaustive maintenance or specialized handling; Hall effect sensors have a proven track record in applications requiring more stringent operating characteristics. In this context, and given the rapid development of ocean energy conversion devices, there is clearly a need for innovation in the technology to characterize the interaction of these devices with their marine environment. This work describes the design, construction, and operation of a device that can measure the magnetic field generated by the circulation of an electric current around a conductor. This prototype is based on an Arduino platform, and allows continuous measurements to be taken and stored in a data logger. It successfully measured the magnetic field generated in laboratory experiments.
2. Description of the Proposed System
The intensity of magnetic field from a cable decreases approximately with the inverse square of the distance from the source. In this research we propose a system capable of measuring, with a single sampling, the intensity of the magnetic field at four different points; and with this, to be able to determine experimentally the attenuation of the magnetic field. The system has a probe, capable of measuring four values of the magnetic field around an electrical conductor immersed in water: the first on the “skin” of the cable, and then 5, 10, and 15 cm away from the cable. The system also records the temperature of the water, which is important in compensating for variations in the recorded signals. The recorded data are stored in an SD card. As for the microcontroller options for this research, the physical dimensions of the Arduino Nano board are the smallest, making it a very portable device; a good option for projects that require a minimum of weight and space [41]. A coil was built to simulate the magnetic field generated by an undersea conductor.
2.1. Working Principles
The system developed for magnetic field measurement consists of hardware and software. The hardware system has four magnetic field sensors embedded within a tubular probe, a temperature sensor, an SD card module, and an Arduino microcontroller. The software includes technology for data acquisition, data filtering, and data storage. Hall effect sensors convert the magnetic field into analog voltage signals sent to the microcontroller through its analog pins: A0, A1, A2, and A3. The temperature sensor converts the temperature into a digital signal sent to the microcontroller via digital pin D8. The Arduino microcontroller uploads the data to the SD card module after filtering and analysing the voltage signal from each sensor. Figure 1 shows the configuration of the system. In Figure 2 a flow chart outlines the magnetic field measurement system. Information on the components used is given in Table 1.
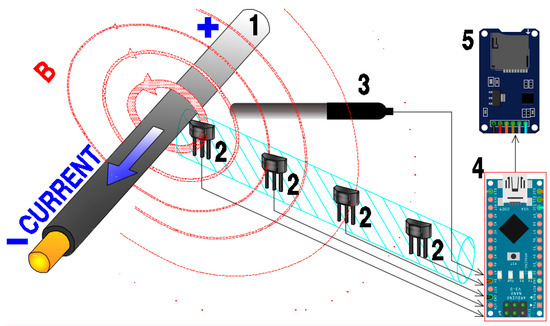
Figure 1.
Schematic of the magnetic field measurement system. 1: Electric cable, 2: magnetic sensor inside the measuring probe. Measuring probe shown in hatched cyan, 3: temperature sensor, 4: Arduino microcontroller, and 5: SD card module.

Figure 2.
Flow chart explaining the structure of the magnetic field measurement system.

Table 1.
Information on the components used.
2.2. Simulated Magnetic Field
There is no suitable device on the market to measure the magnetic field generated around an underwater cable, and to thus assess the electromagnetic effects of marine energy harvesting devices and the power transmission cables carrying the energy from devices to the shore. To emulate the magnetic field generated by an underwater cable, several previous investigations used coil systems: the Helmholtz coil, the ring coil, and the square coil. In this research, we designed a spiral coil [42] to emulate the magnetic field generated by the operation of an HVDC. If the current flowing through the coil is controlled precisely, a very stable magnetic field is produced. To obtain a specific magnetic field, we can (a) vary the induced current while keeping the number of turns of the coil constant, or (b) keep the induced current intensity constant while varying the number of turns in the coil [43]. The latter is more efficient. Each turn carries a current I, all contributing to the total strength of the magnetic field [44]. Figure 3 shows, schematically, the magnetic field generated by the passage of an electric current through a spiral coil.
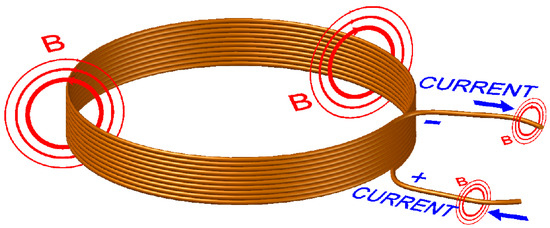
Figure 3.
Magnetic field pattern around the spiral coil.
The total wave power in the world is equivalent to 1 TW [45], while ocean currents could generate approximately 450 GW of electrical energy [46] and marine thermal power of 10 TW without affecting the thermal structure of the ocean [47]. For example, in Mexico, several MW of power could be produced using thermal or salinity gradient technology [48,49]. Considering these values, and considering Table 1, the magnetic field generated by the operation of an energy conversion device is estimated at about 5000 µT. Thus, any device developed should be able to measure this strength of a magnetic field without being damaged. To err on the safe side, we decided to set a maximum value of 10,000 µT.
Using the Biot–Savart law [50] to give a first approximation of the number of turns the coil should have, and in conjunction with the principle of superposition, it is shown in [51] that the magnetic field generated at the centre of a series of aligned turns can be approximated by the following equation:
where
- B: magnetic field (T);
- : constant of vacuum magnetic permeability;
- : number of turns in the coil;
- : electric current (A);
- : coil radius (m).
For this investigation, a Matrix MPS-3003D adjustable DC power supply (0–30 Vdc; 0–3 A) was used, which was adjusted to have a constant current of 2.5 A. An acrylic pipe, of radius 14 cm, was used to wind the magnet wire. Considering the specifications of the magnet wire, 16 AWG wire was chosen for the construction of the coil, since this will withstand the intensity of the electric current used. With this information, the design parameters for the coil were established:
- B = 10,000 µT;
- = ;
- = ?;
- = 2.5 A;
- = 0.14 m.
- Equation (1) yields N ≈ 891 turns.
The dimensions and maximum load of the wire selected, provided by the manufacturer, are shown in Table 2.

Table 2.
Characteristics of the wire used.
Therefore, for a coil of radius 14 cm to generate a magnetic field of 10,000 µT, it must have 891 turns of magnet wire and be energized with a current of 2.5 A. To simplify the calculations, a coil with 1000 turns of 16 AWG magnet wire was made. The magnet wire was thus manually wound around the acrylic tube, turn by turn, leaving no loose spaces between the turns. The coil was marked every 10 turns to avoid confusion in the count. A wooden base was used to support the acrylic pipe, and L-shaped brackets were placed on each of its sides to keep it aligned and guarantee the tension of the wire during each turn. After the final turn, the coil was secured with zip ties and the tube trimmed for easy handling. Figure 4 shows this process.
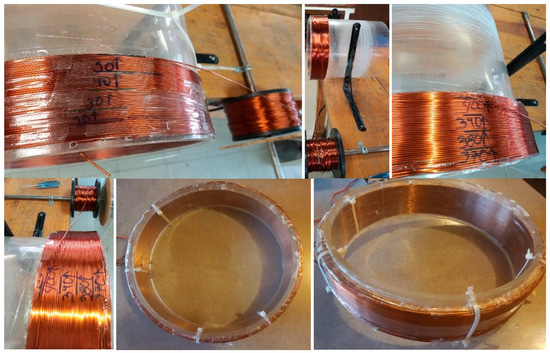
Figure 4.
The winding processes.
In order to characterize the sensor response, the theoretic magnetic field generated by the coil is needed. For this, a variant of the Biot–Savart law was used, which shows that the magnetic field at point P, located at distance x from the centre of the coil, can be expressed by Equation (2).
The magnetic field inside the coil was mapped to have a reference parameter of the magnetic field values. An AlphaLab Incorporate model GM-2 gaussmeter was used. A grid was drawn inside the coil to take measurements every 2.5 cm. The coil was powered to generate a theoretical magnetic field of 11 mT. This procedure was repeated 50 times under different environmental conditions (different time of day, different room temperature, and different relative humidity). Figure 5 shows the average of the measured magnetic field.
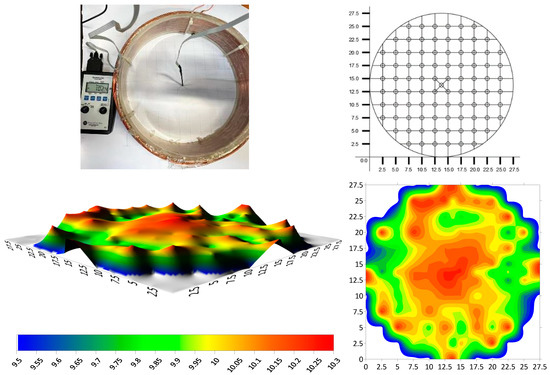
Figure 5.
Mapping of the magnetic field inside the coil.
Figure 6 shows a schematic of the benchmark used. The four sensors were placed on the axial axis of the coil: Sensor 1 on the centre of the coil, Sensor 2 at 5 cm from the centre of the coil, Sensor 3 at 10 cm from the centre of the coil, and Sensor 4 at 15 cm from the centre of the coil.
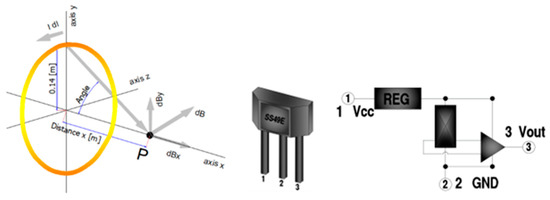
Figure 6.
Magnetic field at point P (left); sensor SS49E (centre); and block diagram of the SS49E sensor (right).
2.3. Linearity of the Selected Sensor
For this study, the Hall effect sensor SS49E was selected, offering analogue output of the signal, correlated directly and linearly to the magnetic field intensity. The specially labelled face must be positioned perpendicular to the direction of the magnetic field to be measured. The voltage ranges from 1 Vdc when the magnetic field reaches −100 mT, and increases linearly to 4 Vdc when the magnetic field reaches 100 mT. Figure 7 shows this relationship graphically. No additional amplification circuit is required.
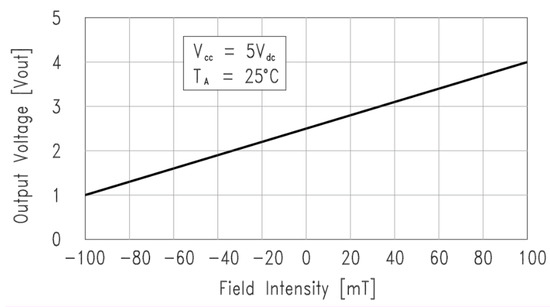
Figure 7.
Response curve of sensor SS49E. Taken from the sheet specifications.
Based on the magnetic field sensor datasheets from the manufacturer, the sensors can be powered by a supply of 3 to 6.5 Vdc. In the quiescent state (that is, with no significant magnetic field: B = 0 T), the output, Vout, equals 2.5 Vdc. The output changes linearly with the intensity and direction of the applied magnetic field from −100 mT to 100 mT [52]. The full electrical characteristics of the sensor are shown in Table 3.

Table 3.
Electrical characteristics of sensor SS49E (TA = 25 °C, Vcc = 5.0 Vdc). Modified from [52].
2.4. Temperature Sensor
The waterproof, pre-wired temperature sensor DS18B20 (Figure 8) was selected. This can measure temperatures between −55 °C and 125 °C, with a ±0.5 °C accuracy range from −10 °C to 85 °C [53].
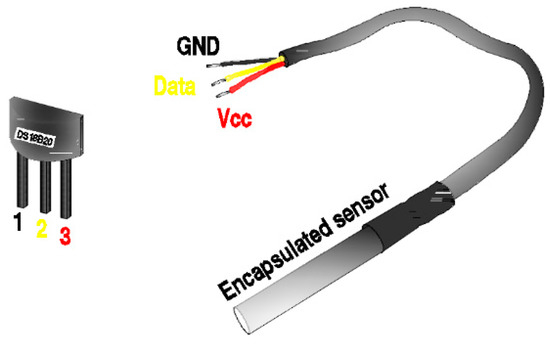
Figure 8.
Sensor DS18B20.
Due to the fact that the 1-Wire communication protocol adopted for the DS18B20 has an excellent CR fault tolerance mechanism, the digital communication has good interference resistance capability and fault data immunity, thus preventing the acquisition system storing faulty temperature values and improving the reliability of the monitoring system [54].
2.5. Micro-SD Card Module
There are several types of basic flash memory cards available, such as the compact flash multimedia card and secure digital card [55]. The micro-SD card module was selected for this study. The advantage of using a micro-SD (Figure 9) is that it automatically enters standby mode, which reduces power consumption [56]. The interface parameters of the micro-SD card are shown in Table 4.
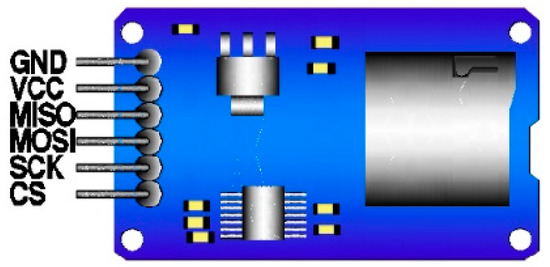
Figure 9.
Micro-SD card module.

Table 4.
Parameters of Micro-SD card module.
3. Materials and Methods
In addition to the elements mentioned in the previous section, the device also had two series-connected 18,650 rechargeable batteries (4.2 V, 9800 mAh) to power the Arduino Nano board through its Vin (+) and GND (−) pins. A further two series-connected 18,650 rechargeable batteries (4.2 V, 9800 mAh) were used to power all the ss49e sensors through their pins 1 (+) and 2 (−). A double pole double throw switch, connected in series to the batteries, was used to control the start and stop times of measurements. A red LED light was used to indicate faults in the system. The electronic components were contained in a waterproof box. Connections with the external sensors (SS49E and DS18B20) were made with 4 pin aviation connectors to facilitate field mounting.
The connections in the device were made with small wires, following the datasheet specifications for each sensor and the Arduino Nano board. All the perforations of the waterproof box were sealed with epoxy resin to prevent water leaking into the device. A measurement probe was constructed from a 50 cm-long plastic hose with a 1 cm radius. Inside this probe, the four SS49E sensors were placed, one after the other, 5 cm apart. The front faces of the four SS49E sensors were aligned within the probe to ensure detection of the magnetic field. The temperature sensor was placed outside the enclosure. Given that this device will operate in extreme pressure situations, the waterproof case and hose were backfilled with silicone dielectric oil after assembly to protect against moisture, oxidation, and pressure. This oil also facilitates re-soldering in the event of maintenance. Figure 10 shows the circuit diagram.
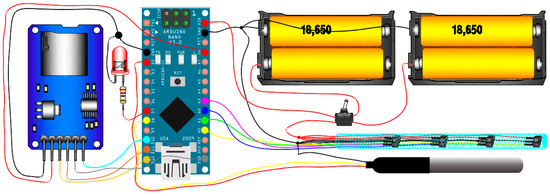
Figure 10.
Circuit diagram and connections. Measuring probe shown in hatched cyan.
3.1. Sensor Validation
The device was validated using accepted conventional methods. Figure 11 shows the arrangement used during the validation phase.
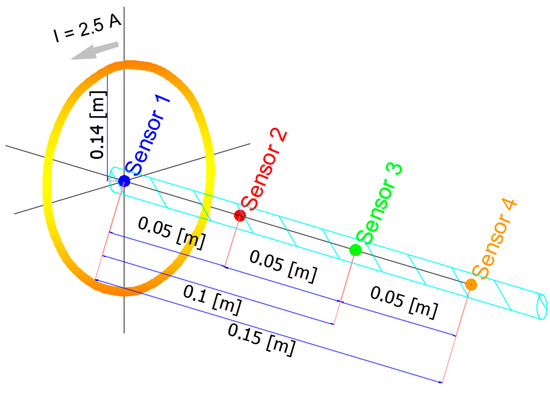
Figure 11.
Validation arrangement. Measuring probe shown in hatched cyan.
Evidence on the linear response of the proposed device and the repeatability of the measurements obtained is presented in Appendix A.
3.1.1. Determination of the Limit of Detection and Quantitation
The limit of detection (LOD) and limit of quantitation (LOQ) are fundamental elements in method validation that define the limitations of an analytical method [57].
The LOD is taken as the lowest concentration in a sample that can be detected, but not necessarily quantified, under the stated conditions of the test. The LOQ is the lowest concentration in a sample that can be determined with acceptable precision and accuracy under the stated conditions of test [58]. A common method to estimate the limit of detection and quantification is from the calibration line. Therefore, the LOD and LOQ can be expressed as
Where σ is the standard deviation of the response and b is the slope of the calibration curve; [59] recommends applying k = 3 and k = 10 for the calculation of LOD and LOQ, respectively.
3.1.2. Determination of Thermal Drift
One means of reducing the error in the temperature drift of the sensors is to optimize the sensor structure [60], although this greatly increases the cost and weight of the device. Another means is to identify the temperature behaviour, which can improve the accuracy of the system by establishing the temperature drift model of the sensor. The low cost and the fact that no additional hardware is needed mean that this method gradually became an area of research [61]. For measurements with a high accuracy of 0.01 mT, it is necessary to compensate the temperature sensitivity of the quiescent voltage output (null magnetic field) [62].
The device works with a 5 V regulated power supply. The temperature sensor and device are put next to each other and put into a temperature chamber set to vary from 4 °C to 35 °C. During this experiment, the coil remained de-energized; therefore, we ignored the magnetic field generated by the coil, and we identified this point as a null field. Consequently, and according to [52], we can establish B = 0 mT when T = 25 °C for this device. The measurement of magnetic field drift intensity is shown in Figure 12.
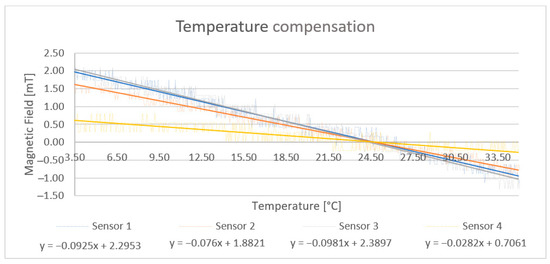
Figure 12.
Temperature compensation curve for each SS49E sensor.
As the temperature increases, the measured value of the magnetic field decreases. The temperature compensation equation is then loaded into the Arduino code for accurate magnetic field measurement.
4. Experiments
For the experimental phase, a different arrangement was used from that of the validating phase. The new arrangement ensures stability and avoids movements of the device being interpreted as variations in the magnetic field. In addition, with this type of coil, a homogeneous magnetic field is produced inside the coil [63,64]. Figure 13 shows the arrangement used for the experimentation phase. The device was attached to the plastic straps of the electrical coil with marine thread to prevent the device moving.
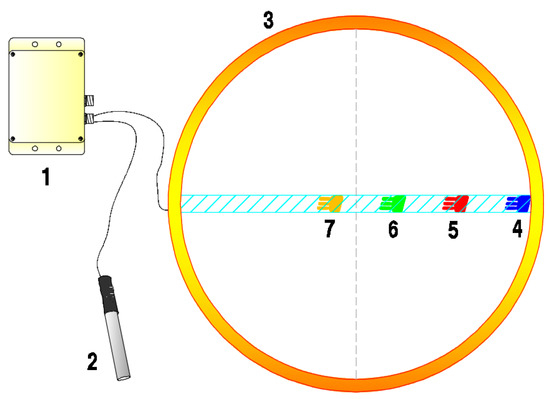
Figure 13.
Experimental arrangement. 1: Waterproof box, 2: temperature sensor, 3: electric coil, 4: sensor 1, 5: sensor 2, 6: sensor 3, and 7: sensor 4. Measuring probe shown in hatched cyan.
4.1. Laboratory Tests
The laboratory tests consisted of detailed measurements of the magnetic field produced by the coil, in salt water. These results were compared with data obtained from measurements made out of the water. In both cases, the temperature was first increased from 25 °C to 35 °C, then decreased from 35 °C to 4 °C, and finally increased from 4 °C to 25 °C. Each test lasted approximately 130 minutes, with a rate of change of approximately 0.2 °C/min. The device was programmed to upload sensor readings every 1000 mS.
4.2. Offshore Field Test
Offshore field tests were carried out at two marine sites (see Figure 14) to determine the behaviour of the magnetic field with respect to depth. At Site_1, the experimental arrangement was horizontal, and for Site_2, vertical, at a depth of 150 m. In order to have records along the vertical profile, nine stops were made during the descent at 3, 25, 50, 75, 100, 125, and 150 m, giving an average descent velocity of 1 m/s. The experimental arrangement remained at each depth for 5 min. The ascent was continuous, without stops. Figure 14 shows the geographic location of each sampling point.
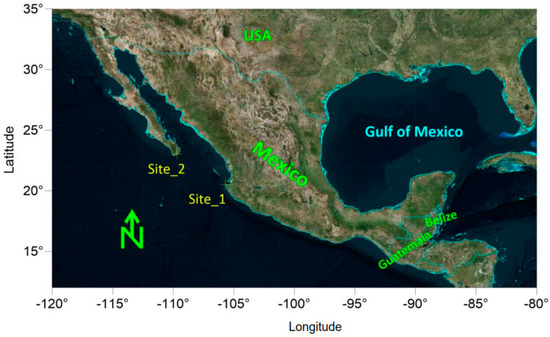
Figure 14.
Location of the offshore field tests.
Site_1 is at 20°30.0881′ N 105°36.3559′ W and the test was carried out during the OTEC-1 research cruise. Site_2 is at 23°02.505′ N 109°38.972′ W and the test was carried out during the BCS-CEMIE research cruise. For Site_1, a hydrographic winch was used on the starboard side of the oceanographic vessel. The coil was secured with plastic strapping and marine thread to a stainless steel frame. A metallic tube was placed at the end of the structure to act as ballast and ensure a safe descent of the assembly. For Site_2, a CTD winch was used on the starboard side of the research vessel. The coil was secured with plastic strapping and marine thread to the rosette frame. Figure 15 shows the set ups.
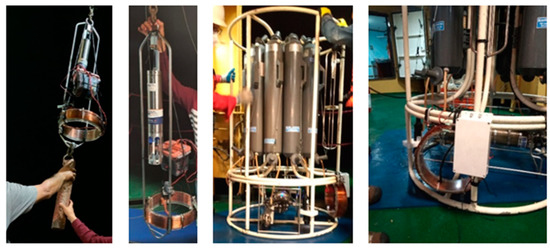
Figure 15.
Coil position in each site: (Left) at Site_1 in a horizontal position; (Right) at Site_2 in a vertical position.
4.3. Device Response
According to [63,64] and Equation (1), the theoretical magnetic field inside an ideal coil should be homogeneous and have an approximate value of 11 mT. However, simple solenoid coils provide a uniform magnetic field over a limited space only within the coil [65]. In fact, the helical shape of a simple solenoid produces an asymmetric field distribution [66]. In addition, the geometry of the coil wires can significantly affect its electromagnetic properties [67].
Some devices use simplifications, such as infinite solenoid models, to estimate the magnetic field [68,69]. In [70] a comparison between the theoretical value, the calculated value and the simulated value of the magnetic field at the centre of a solenoid is shown. Experimental data were superimposed with the theoretical calculation with a low current, and overlapped with simulation results with a high current [70] (see Table 5).

Table 5.
Magnetic field values at the centre of solenoid. Modified from [70].
According to Table 5, the theoretical value of the magnitude of a magnetic field will differ from the value measured experimentally with a probe. Following [71], we can consider that the difference between the theoretical magnetic field and that measured experimentally is admissible, and may be attributed to cumulative misalignment problems between the coil and the sensor. Figure 16 shows the value of the magnetic field measured by each sensor during the laboratory test (not in water).
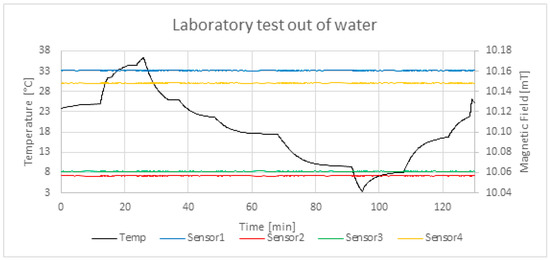
Figure 16.
Response of the device in the laboratory test out of water.
Figure 17 shows the value of the magnetic field measured by each sensor during the laboratory test in salt water.
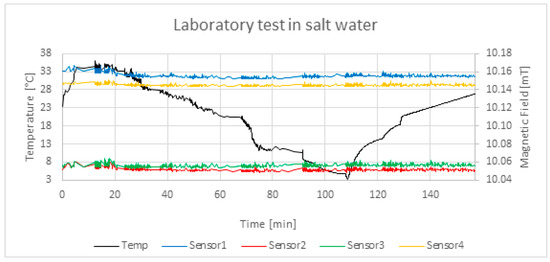
Figure 17.
Response of the device in the laboratory test in salt water.
Especially in shallow water, the electromagnetic signal can be significantly skewed by effects related to the air–water boundary, current-driven water turbulence, and wave motion [72]. Figure 18 and Figure 19 show the device responses at Site_1 and Site_2, respectively.
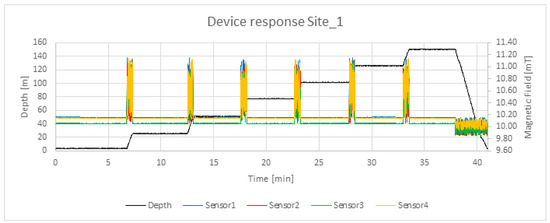
Figure 18.
Response of the device at Site_1.
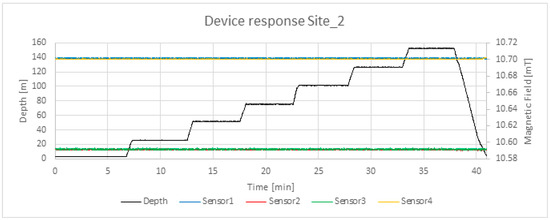
Figure 19.
Response of the device at Site_2.
5. Results and Discussion
This section shows the results obtained in each test. Equation (1) was used to approximate the number of turns the coil should have to simulate a 10 mT magnetic field. For the exact calculation of the generated field, Equation (1) was used considering 1000 turns; that is, 11.22 mT.
5.1. Laboratory Test
Table 6 shows the values measured in the laboratory tests.

Table 6.
Magnetic field measured by each SS49E sensor during laboratory tests.
Figure 16 and Figure 17 show that in both cases, the difference between the theoretical magnetic field and that measured experimentally is within the range considered admissible by [70] for a similar theoretical magnetic field value. In Figure 17 the alteration to the measurements when measuring the magnetic field in salt water, caused by the magnetic diffraction of the air–water interface, is seen. This is in line with the results presented by [72]. The average uncertainty in the measurements made in water is ±1.85 µT. This higher uncertainty could be due to water movement and to magnetic diffraction when the device is submerged. According to [73], the uncertainty can be obtained by calculating the experimental standard deviation.
5.2. Offshore Field Test
Figure 18 shows the response of the device at Site_1. The coil stayed in a horizontal position at Site_1, and it is evident that the precision of the device decreases during descent and ascent, and increases when the depth is constant. In the analysis of these results, only the measurements taken at a constant depth were considered; those made during transition from one depth to another were discarded.
Figure 19 shows the response of the device at Site_2. The coil stayed in a vertical position at Site_2. In this case, the precision of the results does not decrease during the descent or ascent of the device.
Analysis of the results summarized in Table 6 and Table 7 shows that the device is very accurate (±0.30% on average) when performing magnetic field measurements in static conditions both in and out of salt water. This precision is altered when the water surrounding the device is not static. A first hypothesis is that the movement of the water causes the sensors to also move and move inside the coil. As we can see in Figure 5, the magnetic field is not homogeneous inside the coil. The maximum values are in the centre and on the wall of the coil. There are notable differences in the magnetic field that have a value of up to 0.81 mT. A second hypothesis is that in the underwater tests, the water can be considered as behaving as a conductive core for the coil, so the movement of this core could be generating alterations in the magnetic field measured by the device, such as the principle of operation of an inductor. This should be analyzed in future studies; the real origin of the noise displayed in the measurements should be modelled, and be compensated for, in future work.

Table 7.
Magnetic field measured by each SS49E sensor in the offshore field tests.
6. Conclusions
To date, the methods and equipment used to measure the magnetic fields generated by high-voltage cables are often expensive and sophisticated, and they are not very adaptable to specific tasks in various marine conditions; they are simply not designed to withstand the pressure of the water column. Currently, no commercial is designed to work underwater. If we are to develop new techniques to harness the energy of the sea, new devices and means of measuring magnetic fields must also be developed.
This research shows how very simple and cheap devices, such as Arduino boards, can be effectively used in a device for oceanographic research. The low-cost device developed in this work can perform and store magnetic field measurements taken at depths of up to 150 m under the sea. It automatically compensates for temperature variations, and thus provides accurate magnetic field recording.
The prototype described here is based on the open-source Arduino platform. The results show that the underwater measurements provided are very accurate (±0.30% on average) if the theoretical values are taken as a standard of measurement. The prototype also has good stability. The prototype is not costly compared to the gaussmeter GM-2. It is simple in design and does not require any accessories. The low-cost prototype sensors are very adaptable, allowing further customization, and consequently, improvement in the performance of the measurement system. The device can also store continuous measurements and could be used in submarine cable protection systems and in identifying sources of possible failures in power distribution.
A field coil can be used as a substandard for teslameter validation, i.e., with no magnetometer and with only simple instrumentation, such as an Arduino platform. The coil as such can now be used for a secondary magnetic flux density standard measurement, with certain limitations, outside the controlled environment of a magnetic laboratory.
It is hoped that the success of this prototype will stimulate interest in magnetic field research and fill gaps in the knowledge of this important and fast-developing area. It is expected that the prototype will serve as a basis for the future development of systems to detect and monitor magnetic fields, and also serve in the study of their interaction with the marine environment. Considering its cost, the device has very good resolution and accuracy. In the future, specialized housing will be expected to allow the device to be submerged to greater depths at sea. It is also hoped that the limitations identified in our testing will be addressed, and new features incorporated into the design. More records from the sea are needed to see if marine currents affect the distribution of the magnetic field density; and if so, the calculations necessary will be carried out to allow the device to compensate for this.
Author Contributions
Conceptualiztion, writing—preparation of the original draft and writing-revision and editing: V.L., R.S., I.C.-G. and E.M. Process methodology and characterization analysis: V.L. and acquisition of funds: R.S. All authors have read and agreed to the published version of the manuscript.
Funding
The authors are grateful to CONACYT-SENER-Sustentabilidad Energética project: “Centro Mexicano de Innovación on Energía del Océano (CEMIE Océano)”. FSE-2014-06-249795 and Instituto de Ingeniería—UNAM project “GII-Sostenibilidad del Caribe mexicano: Cambiando debilidades en fortalezas” for their financial and technical support.
Institutional Review Board Statement
Not applicable.
Informed Consent Statement
Not applicable.
Data Availability Statement
Not applicable.
Acknowledgments
Víctor Luna thanks CONACYT for the financial support to carry out his doctoral degree.
Conflicts of Interest
The authors declare that they have no conflict of interest.
Nomenclature
| AWG | American wire gauge |
| GMF | Earth´s magnetic field |
| UK | United Kingdom |
| USA | United States of America |
| Vin | Voltage input |
| N | North |
| W | West |
| OTEC-1 | Ocean thermal energy conversion-1 |
| BCS-CEMIE | Baja California Sur-Centro Mexicano de Innovacion en Energia |
| CONACYT | Consejo Nacional de Ciencia y Tecnologia |
| CTD | Conductivity temperature depth |
| Vdc | Voltage in direct current |
| Vcc | Power supply voltage |
| V0 | Quiescent output voltage |
| GND | Ground |
| Vout | Output voltage |
| Icc | Supply current |
| Iout | Output current |
| AC | Alternating current |
| DC | Direct current |
| XLPE | Cross linked polyethylene |
| HVDC | High voltage direct current |
| SPC | Submarine power cable |
| MISO | Master in slave out |
| MOSI | Master out slave in |
| SCK | Serial clock |
| CS | Chip select |
| SD | Secure digital |
| RSD | Relative standard deviation |
| LOD | Limit of detection |
| LOQ | Limit of quantitation |
| r | Radius |
| X | Distance |
| TA | Ambient temperature |
| µ0 | Vacuum magnetic permittivity |
| B | Magnetic field |
| N | Number of turns |
| I | Electric current |
| dBx | Component of the magnetic field on the x-axis |
| dBy | Component of the magnetic field on the y-axis |
| dBz | Component of the magnetic field on the z-axis |
| min | Minutes |
Appendix A
Table A1 shows a synthesis of the magnetic induction generated around SPC. The magnetic field of AC cables varies at low frequencies, while DC cables produce a static magnetic field, and the magnetic induction increases with the current intensity in the cable depending on its power and voltage. This means that an increase in current flow results in an increase in the magnetic fields for both DC and AC transmission [22].

Table A1.
Magnetic induction generated around an underwater cable, obtained by calculation (in bold) and field measurements (based on [22]).
Table A1.
Magnetic induction generated around an underwater cable, obtained by calculation (in bold) and field measurements (based on [22]).
| Power Transmission System | Capacity (A, kV, MW, Hz) | Distance from the Cable Centre (m) | Magnetic Induction (µT) | Reference |
|---|---|---|---|---|
| GMF | 30–70 | [19] | ||
| Monopolar DC | 500 A | Surface (0 m) | 2000 | [20] |
| 5 m above | 20 | |||
| 20 m above | 5 | |||
| 1200 A (312 MW at 260 kV) | Surface (0 m) | 5000 | ||
| 5 m above | 50 | |||
| 1500 A | On the seabed | 300 | [21] | |
| 5 m above the seabed | 50 | |||
| 200 m above the seabed (burial depth not found) | 13 | |||
| DC double-case system (10 m separations) | 1330 A | Surface (0 m) | >500 | [22] |
| 5 m from one cable | <50 | |||
| AC three-phase cables | 350 A, 132 kV, 50 Hz | Surface (0 m) | 1.6 | [23] |
| 60 A, 11 kV, 50 Hz | Surface (0 m) | 0.055 | ||
| 5 m from the cable | 0.046 | |||
| 50 A, 33 kV, 50 Hz | Surface (0 m) | 0.05 | ||
| 5 m from the cable | 0.012 | |||
| 400 m from the cable | 0.00005 | |||
| AC XLEP | 641 A, 33 kV | Surface (0 m) | 1.7 | |
| 2.5 m from the cable | 0.61 | |||
| AC three-core PEX-composite cable | 600 A, 132 kV | 2 m above the cable | 5 | [24] |
| AC three-phase cables (XLPE cable) | 265 A, 33 kV | On the seabed (cable buried at 1.5 m depth) | 1.5 | [25] |
| 132.5 A, 33 kV | On the seabed (cable buried at 1.5 m depth) | 0.9 | ||
| 350 A, 132 kV | Surface (0 m) | 1.6 | [26] |
From Table A1 it is seen that much of the information concerning the strength of magnetic fields generated by underwater cables is theoretical.
To assess the response of the device, a magnetic field was generated by powering the coil. The magnetic field was magnified by increasing the current from 0 A to 2.5 A in increments of 0.25 A. Then, the current was decreased from 2.5 A to 0 A. The theoretical and measured results were compared, as shown in Table 6. This test was repeated 50 times in the controlled laboratory environment at a constant 25 °C temperature.

Table A2.
Theorical magnetic field and measured by each SS49E sensor.
Table A2.
Theorical magnetic field and measured by each SS49E sensor.
| Supply Current I (A) | Magnetic Field Sensor 1 (mT) | Magnetic Field Sensor 2 (mT) | ||||
| Theoretical | Measured Increasing | Measured Decreasing | Theoretical | Measured Increasing | Measured Decreasing | |
| 0.00 | 0.00 | 0.05 | 0.04 | 0.00 | 0.00 | 0.02 |
| 0.25 | 0.79 | 0.71 | 0.58 | 0.66 | 0.64 | 0.52 |
| 0.50 | 1.59 | 1.61 | 1.56 | 1.33 | 1.25 | 1.20 |
| 0.75 | 2.38 | 2.40 | 2.34 | 1.99 | 1.97 | 1.95 |
| 1.00 | 3.17 | 3.20 | 3.15 | 2.65 | 2.64 | 2.62 |
| 1.25 | 3.97 | 4.01 | 3.91 | 3.31 | 3.31 | 3.27 |
| 1.50 | 4.76 | 4.79 | 4.73 | 3.98 | 3.97 | 3.98 |
| 1.75 | 5.55 | 5.57 | 5.53 | 4.64 | 4.65 | 4.66 |
| 2.00 | 6.35 | 6.38 | 6.34 | 5.30 | 5.31 | 5.35 |
| 2.25 | 7.14 | 7.16 | 7.12 | 5.96 | 5.98 | 6.01 |
| 2.50 | 7.93 | 8.01 | 8.01 | 6.63 | 6.65 | 6.65 |
| Supply current I (A) | Magnetic Field Sensor 3 (mT) | Magnetic Field Sensor 4 (mT) | ||||
| Theoretical | Measured Increasing | Measured Decreasing | Theoretical | Measured Increasing | Measured Decreasing | |
| 0.00 | 0.00 | 0.00 | 0.02 | 0.00 | 0.00 | 0.01 |
| 0.25 | 0.43 | 0.45 | 0.41 | 0.25 | 0.24 | 0.22 |
| 0.50 | 0.85 | 0.86 | 0.84 | 0.5 | 0.48 | 0.46 |
| 0.75 | 1.28 | 1.31 | 1.29 | 0.76 | 0.77 | 0.75 |
| 1.00 | 1.71 | 1.72 | 1.69 | 1.01 | 1.00 | 0.98 |
| 1.25 | 2.14 | 2.15 | 2.12 | 1.26 | 1.28 | 1.25 |
| 1.50 | 2.56 | 2.58 | 2.56 | 1.51 | 1.53 | 1.50 |
| 1.75 | 2.99 | 3.01 | 2.98 | 1.76 | 1.78 | 1.75 |
| 2.00 | 3.42 | 3.39 | 3.35 | 2.02 | 2.11 | 2.09 |
| 2.25 | 3.85 | 3.84 | 3.82 | 2.27 | 2.31 | 2.29 |
| 2.50 | 4.27 | 4.25 | 4.25 | 2.52 | 2.55 | 2.55 |
Figure A1 shows the comparisons between the theoretically calculated (Equation (2)) and experimentally measured magnetic fields. The results confirm the direct, linear correlation between the magnetic field and the supply, and that the device is able to measure the expected magnetic field accurately. The linear regression equation was then loaded into the Arduino code to record an accurate measurement of the magnetic field.
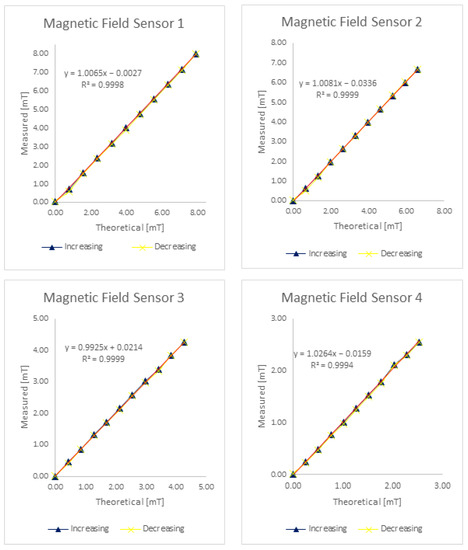
Figure A1.
Linear regression curves obtained for each SS49E sensor.
Repeatability is a significant parameter for a device designed to produce the same output for various applications of the same input under similar conditions [74]. Ten repetitions were performed for the value of each magnetic field generated by the coil and the corresponding outputs were recorded. The results are shown in Figure A2.
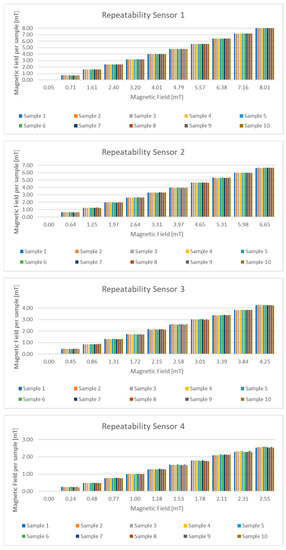
Figure A2.
Repeatability for each SS49E sensor.
Following [74], the repeatability error was calculated in terms of relative standard deviation (RSD).
A lower RSD value means the data is more precise. The RSD of this test is less than 3%, except for measurements with no magnetic field, demonstrating the repeatability of the sensor for all the magnetic fields measured.
The experimental results agree with the LOD and LOQ provided by the manufacturer. The repeatability of the instrument is acceptable, except for values very close to 0 mT.
The %RSD, LOD, and LOQ are shown in Table A3.

Table A3.
Repeatability values, LOQ, and LOD.
Table A3.
Repeatability values, LOQ, and LOD.
| Sensor 1 | Sensor 2 | ||||||||
| Theoretical Magnetic Field (mT) | Measured Average (mT) | Repeatability | LOQ (mT) | LOD (mT) | Theoretical Magnetic Field (mT) | Measured Average (mT) | Repeatability | LOQ (mT) | LOD (mT) |
| 0.79 | 0.71 | 0.95 | 0.07 | 0.02 | 0.66 | 0.64 | 1.65 | 0.10 | 0.03 |
| 1.59 | 1.61 | 0.29 | 0.05 | 0.01 | 1.33 | 1.25 | 1.25 | 0.16 | 0.05 |
| 2.38 | 2.40 | 0.18 | 0.04 | 0.01 | 1.99 | 1.97 | 0.84 | 0.16 | 0.05 |
| 3.17 | 3.20 | 0.15 | 0.05 | 0.01 | 2.65 | 2.64 | 0.84 | 0.22 | 0.07 |
| 3.97 | 4.01 | 0.13 | 0.05 | 0.02 | 3.31 | 3.31 | 0.84 | 0.28 | 0.08 |
| 4.76 | 4.79 | 0.09 | 0.04 | 0.01 | 3.98 | 3.97 | 0.51 | 0.20 | 0.06 |
| 5.55 | 5.57 | 0.08 | 0.04 | 0.01 | 4.64 | 4.65 | 0.35 | 0.16 | 0.05 |
| 6.35 | 6.38 | 0.13 | 0.08 | 0.03 | 5.30 | 5.31 | 0.37 | 0.19 | 0.06 |
| 7.14 | 7.16 | 0.07 | 0.05 | 0.01 | 5.96 | 5.98 | 0.20 | 0.12 | 0.03 |
| 7.93 | 8.01 | 0.04 | 0.03 | 0.01 | 6.63 | 6.65 | 0.18 | 0.12 | 0.04 |
| Sensor 3 | Sensor 4 | ||||||||
| Theoretical Magnetic Field (mT) | Measured Average (mT) | Repeatability | LOQ (mT) | LOD (mT) | Theoretical Magnetic Field (mT) | Measured Average (mT) | Repeatability | LOQ (mT) | LOD (mT) |
| 0.43 | 0.45 | 1.40 | 0.06 | 0.02 | 0.25 | 0.24 | 3.39 | 0.08 | 0.02 |
| 0.85 | 0.86 | 1.28 | 0.11 | 0.03 | 0.50 | 0.48 | 1.39 | 0.06 | 0.02 |
| 1.28 | 1.31 | 1.20 | 0.16 | 0.05 | 0.76 | 0.77 | 1.34 | 0.10 | 0.03 |
| 1.71 | 1.72 | 0.90 | 0.16 | 0.05 | 1.01 | 1.00 | 1.26 | 0.12 | 0.04 |
| 2.14 | 2.15 | 0.86 | 0.19 | 0.05 | 1.26 | 1.28 | 1.04 | 0.13 | 0.04 |
| 2.56 | 2.58 | 0.80 | 0.21 | 0.06 | 1.51 | 1.53 | 0.98 | 0.15 | 0.04 |
| 2.99 | 3.01 | 0.75 | 0.23 | 0.07 | 1.76 | 1.78 | 0.93 | 0.16 | 0.05 |
| 3.42 | 3.39 | 0.42 | 0.14 | 0.04 | 2.02 | 2.11 | 0.89 | 0.18 | 0.06 |
| 3.85 | 3.84 | 0.36 | 0.14 | 0.04 | 2.27 | 2.31 | 0.90 | 0.20 | 0.06 |
| 4.27 | 4.25 | 0.35 | 0.15 | 0.04 | 2.52 | 2.55 | 0.81 | 0.20 | 0.06 |
References
- Andreas, U.; Davide, M. Wave and tidal current energy—A review of the current state of research beyond technology. Renew. Sustain. Energy Rev. 2016, 58, 1070–1081. [Google Scholar]
- Huckerby, J.; Jeffrey, H.; Sedwick, J.; Jay, B.; Finlay, L. An International Vision for Ocean Energy-Version II. Available online: http://www.policyandinnovationedinburgh.org/uploads/3/1/4/1/31417803/oes_booklet_fa_print_08_10_2012.pdf (accessed on 21 April 2022).
- Lewis, A.; Estefen, S.; Huckerby, J.; Musial, W.; Pontes, T.; Torres-Martinez, J. Ocean Energy. In IPCC Special Report on Renewable Energy Sources and Climate Change Mitigation; Edenhofer, O., Pichs-Madruga, R., Sokona, Y., Seyboth, K., Matschoss, P., Kadner, S., Zwickel, T., Eickemeier, P., Hansen, G., Schlömer, S., et al., Eds.; Cambridge University Press: Cambridge, UK; New York, NY, USA, 2011; pp. 497–533. [Google Scholar]
- Brito e Melo, A.; Villate, J.L. Ocean Energy Systems Annual Report. 2014. Available online: https://report2014.ocean-energy-systems.org/ (accessed on 15 April 2022).
- Fontes, J.V.H.; Martínez, M.L.; Wojtarowski, A.; González-Mendoza, J.L.; Landgrave, R.; Silva, R. Is ocean energy an alternative in developing regions? A case study in Michoacan, Mexico. J. Clean. Prod. 2020, 266, 121984. [Google Scholar] [CrossRef]
- Wilberforce, T.; El Hassan, Z.; Durrant, A.; Thompson, J.; Soudan, B.; Olabi, A. Overview of ocean power technology. Energy 2019, 175, 165–181. [Google Scholar] [CrossRef]
- Martínez, M.; Vázquez, G.; Pérez-Maqueo, O.; Silva, R.; Moreno-Casasola, P.; Mendoza-González, G.; López-Portillo, J.; MacGregor-Fors, I.; Heckel, G.; Hernández-Santana, J.; et al. A systemic view of potential environmental impacts of ocean energy production. Renew. Sustain. Energy Rev. 2021, 149, 111332. [Google Scholar] [CrossRef]
- Taormina, B.; Bald, J.; Want, A.; Thouzeau, G.; Lejart, M.; Desroy, N.; Carlier, A. A review of potential impacts of submarine power cables on the marine environment: Knowledge gaps, recommendations and future directions. Renew. Sustain. Energy Rev. 2018, 96, 380–391. [Google Scholar] [CrossRef]
- Petersen, J.K.; Malm, T. Offshore Windmill Farms: Threats to or Possibilities for the Marine Environment. AMBIO A J. Hum. Environ. 2006, 35, 75–80. [Google Scholar] [CrossRef]
- Durif, C.M.F.; Nyqvist, D.; Taormina, B.; Shema, S.D.; Skiftesvik, A.B.; Freytet, F.; Browman, H.I. Magnetic fields generated by submarine power cables have a negligible effect on the swimming behavior of Atlantic lumpfish (Cyclopterus lumpus) juveniles. PeerJ 2023, 11, e14745. [Google Scholar] [CrossRef]
- Fey, D.P.; Jakubowska, M.; Greszkiewicz, M.; Andrulewicz, E.; Otremba, Z.; Urban-Malinga, B. Are magnetic and electromagnetic fields of anthropogenic origin potential threats to early life stages of fish? Aquat. Toxicol. 2019, 209, 150–158. [Google Scholar] [CrossRef]
- Scott, K.; Harsanyi, P.; Easton, B.A.A.; Piper, A.J.R.; Rochas, C.M.V.; Lyndon, A.R. Exposure to Electromagnetic Fields (EMF) from Submarine Power Cables Can Trigger Strength-Dependent Behavioural and Physiological Responses in Edible Crab, Cancer pagurus (L.). J. Mar. Sci. Eng. 2021, 9, 776. [Google Scholar] [CrossRef]
- Cresci, A.; Perrichon, P.; Durif, C.M.; Sørhus, E.; Johnsen, E.; Bjelland, R.; Larsen, T.; Skiftesvik, A.B.; Browman, H.I. Magnetic fields generated by the DC cables of offshore wind farms have no effect on spatial distribution or swimming behavior of lesser sandeel larvae (Ammodytes marinus). Mar. Environ. Res. 2022, 176, 105609. [Google Scholar] [CrossRef]
- Cai, L.; Chen, L.; Devaux, F.; Long, Y. Long-Distance Transport of Green Power via High Voltage Direct Current Submarine Cable. E3S Web Conf. 2022, 350, 02001. [Google Scholar] [CrossRef]
- Stan, A.; Costinaș, S.; Ion, G. Overview and Assessment of HVDC Current Applications and Future Trends. Energies 2022, 15, 1193. [Google Scholar] [CrossRef]
- Halawa, E.; James, G.; Shi, X.; Sari, N.H.; Nepal, R. The Prospect for an Australian–Asian Power Grid: A Critical Appraisal. Energies 2018, 11, 200. [Google Scholar] [CrossRef]
- Schell, K.R.; Claro, J.; Guikema, S.D. Probabilistic cost prediction for submarine power cable projects. Int. J. Electr. Power Energy Syst. 2017, 90, 1–9. [Google Scholar] [CrossRef]
- Wood, M.P.; Carter, L. Whale Entanglements with Submarine Telecommunication Cables. IEEE J. Ocean. Eng. 2008, 33, 445–450. [Google Scholar] [CrossRef]
- International Cable Protection Committee. Submarine Cables and BBNJ. Available online: https://www.un.org/depts/los/biodiversity/prepcom_files/ICC_Submarine_Cables_&_BBNJ_August_2016.pdf (accessed on 20 April 2022).
- Love, M.S.; Nishimoto, M.M.; Clark, S.; McCrea, M.; Bull, A.S. Assessing potential impacts of energized submarine power cables on crab harvests. Cont. Shelf Res. 2017, 151, 23–29. [Google Scholar] [CrossRef]
- Carter, L.; Burnett, D.; Drew, S.; Marle, G.; Hagadorn, L.; Bartlett-McNeil, D.; Irvine, N. Submarine Cables and the Oceans—Connecting the World. Available online: http://www.iscpc.org/publications/icpc-unep_report.pdf (accessed on 21 April 2022).
- Albert, L.; Deschamps, F.; Jolivet, A.; Olivier, F.; Chauvaud, L.; Chauvaud, S. A current synthesis on the effects of electric and magnetic fields emitted by submarine power cables on invertebrates. Mar. Environ. Res. 2020, 159, 104958. [Google Scholar] [CrossRef]
- Cresci, A.; Paris, C.B.; Durif, C.M.F.; Shema, S.; Bjelland, R.M.; Skiftesvik, A.B.; Browman, H.I. Glass eels (Anguilla anguilla) have a magnetic compass linked to the tidal cycle. Sci. Adv. 2017, 3, e1602007. [Google Scholar] [CrossRef]
- Lohmann, K.J.; Ernst, D.A. The Geomagnetic Sense of Crustaceans and Its Use in Orientation and Navigation. Available online: https://www.researchgate.net/profile/Kenneth-Lohmann/publication/280533822_The_geomagnetic_sense_of_crustaceans_and_its_use_in_orientation_and_navigation/links/56f2d7e408ae95e8b6cb454d/The-geomagnetic-sense-of-crustaceans-and-its-use-in-orientation-and-navigation.pdf (accessed on 16 April 2022).
- Durif, C.M.F.; Browman, H.I.; Phillips, J.B.; Skiftesvik, A.B.; Vøllestad, L.A.; Stockhausen, H.H. Magnetic Compass Orientation in the European Eel. PLoS ONE 2013, 8, e59212. [Google Scholar] [CrossRef]
- Nordmann, G.C.; Hochstoeger, T.; Keays, D.A. Magnetoreception—A sense without a receptor. PLoS Biol. 2017, 15, e2003234. [Google Scholar] [CrossRef]
- Schluessel, V. Magnetoreception in Fishes. In The Senses: A Comprehensive Reference, 2nd ed.; Fritzsch, B., Ed.; Elsevier: Bonn, Germany, 2020; pp. 406–420. [Google Scholar]
- Andrianov, G.N.; Brown, H.R.; Ilyinsky, O.B. Responses of central neurons to electrical and magnetic stimuli of the ampullae of lorenzini in the Black Sea skate. J. Comp. Physiol. A 1974, 93, 287–299. [Google Scholar] [CrossRef]
- Akoev, G.N.; Beller, N.N.; Zadan, P.M. Some functional characteristics of the electroreceptors of electric and nonelectric fish. Fiziol. Zhurnal SSSR Im. I.M. Sechenova 1975, 61, 391–399. [Google Scholar]
- Brown, H.R.; Ilyinsky, O.B. The ampullae of Lorenzini in the magnetic field. J. Comp. Physiol. A 1978, 126, 333–341. [Google Scholar] [CrossRef]
- Hutchison, Z.L.; Gill, A.B.; Sigray, P.; He, H.; King, J.W. Anthropogenic electromagnetic fields (EMF) influence the behaviour of bottom-dwelling marine species. Sci. Rep. 2020, 10, 4219. [Google Scholar] [CrossRef]
- Bochert, R.; Zettler, M. Effect of electromagnetic fields on marine organisms. In Offshore Wind Energy Research Environmental Impacts; Köller, J., Köppel, J., Peters, W., Eds.; Springer: Berlin/Heidelberg, Germany, 2006; pp. 223–234. [Google Scholar]
- Tricas, T.; Gill, A. Effects of EMFs from Undersea Power Cables on Elasmobranchs and Other Marine Species Final Report; Normandeau Associates: Bedford, NH, USA, 2011. [Google Scholar]
- Turner, G.M.; Rasson, J.L.; Reeves, C.V. Observation and Measurement Techniques. Treatise Geophys. 2007, 5, 93–146. [Google Scholar] [CrossRef]
- Kozhevnikov, S.V.; Ott, F.; Radu, F. Methods for Probing Magnetic Films with Neutrons. Phys. Part. Nucl. 2018, 49, 308–330. [Google Scholar] [CrossRef]
- Zhang, Y.; Zhou, P.; Tang, J.; Ma, J. Mode selection in a neuron driven by Josephson junction current in presence of magnetic field. Chin. J. Phys. 2020, 71, 72–84. [Google Scholar] [CrossRef]
- Çavdar, Z.B.; Yanık, C.; Yıldırım, E.E.; Trabzon, L.; Karalar, T.C. Separated terminal 2D hall sensors with improved sensitivity. Sens. Actuators A Phys. 2021, 320, 112550. [Google Scholar] [CrossRef]
- Wurz, M.C.; Prediger, M.S. Physical Sensors: Magnetic Sensors. Encycl. Sens. Biosens. 2021, 1, 97–110. [Google Scholar] [CrossRef]
- Roy, A.; Sampathkumar, P.; Kumar, P.A. Development of a very high sensitivity magnetic field sensor based on planar Hall effect. Measurement 2020, 156, 107590. [Google Scholar] [CrossRef]
- Khan, M.A.; Sun, J.; Li, B.; Przybysz, A.; Kosel, J. Magnetic sensors-A review and recent technologies. Eng. Res. Express 2021, 3, 022005. [Google Scholar] [CrossRef]
- Kondaveeti, H.K.; Kumaravelu, N.K.; Vanambathina, S.D.; Mathe, S.E.; Vappangi, S. A systematic literature review on prototyping with Arduino: Applications, challenges, advantages, and limitations. Comput. Sci. Rev. 2021, 40, 100364. [Google Scholar] [CrossRef]
- Khan, N.A.; Matsumoto, H.; Trescases, O. Wireless Electric Vehicle Charger with Electromagnetic Coil-Based Position Correction Using Impedance and Resonant Frequency Detection. IEEE Trans. Power Electron. 2020, 35, 7873–7883. [Google Scholar] [CrossRef]
- Sharma, S.V.; Hemalatha, G.; Ramadevi, K. Analysis of magnetic field-strength of multiple coiled MR-damper using comsol multiphysics. Mater. Today: Proc. 2022, 66, 1789–1795. [Google Scholar] [CrossRef]
- Regtien, P.; Dertien, E. Inductive and magnetic sensors. In Sensors for Mechatronics, 2nd ed.; Elsevier: Enschede, The Netherlands, 2018; pp. 145–182. [Google Scholar] [CrossRef]
- Farrok, O.; Ahmed, K.; Tahlil, A.D.; Farah, M.M.; Kiran, M.R.; Islam, R. Electrical Power Generation from the Oceanic Wave for Sustainable Advancement in Renewable Energy Technologies. Sustainability 2020, 12, 2178. [Google Scholar] [CrossRef]
- Rahman, A.; Farrok, O.; Haque, M. Environmental impact of renewable energy source based electrical power plants: Solar, wind, hydroelectric, biomass, geothermal, tidal, ocean, and osmotic. Renew. Sustain. Energy Rev. 2022, 161, 112279. [Google Scholar] [CrossRef]
- Pelc, R.; Fujita, R.M. Renewable energy from the ocean. Mar. Policy 2002, 26, 471–479. [Google Scholar] [CrossRef]
- Garduño-Ruiz, E.P.; Silva, R.; Rodríguez-Cueto, Y.; García-Huante, A.; Olmedo-González, J.; Martínez, M.L.; Wojtarowski, A.; Martell-Dubois, R.; Cerdeira-Estrada, S. Criteria for Optimal Site Selection for Ocean Thermal Energy Conversion (OTEC) Plants in Mexico. Energies 2021, 14, 2121. [Google Scholar] [CrossRef]
- Hernández-Fontes, J.V.; Felix, A.; Mendoza, E.; Cueto, Y.R.; Silva, R. On the Marine Energy Resources of Mexico. J. Mar. Sci. Eng. 2019, 7, 191. [Google Scholar] [CrossRef]
- Song, X.; Liu, C. Experimental investigation of pressure pulsation induced by the floor-attached vortex in an axial flow pump. Adv. Mech. Eng. 2019, 11, 1687814019838708. [Google Scholar] [CrossRef]
- Kaufman, A.; Itskovich, G. Chapter One—System of Equations of the Stationary Electric and Magnetic Fields. Basic Princ. Induction Logging 2017, 1–37. [Google Scholar] [CrossRef]
- Honeywell. Linear Hall-effect Sensor ICs SS49E Datasheet; Sensing and Control Honeywell: Minneapolis, MN, USA, 2015. [Google Scholar]
- Maxim Integrated. Programmable Resolution 1-Wire Digital Thermometer DS18B20 Datasheet; Maxim Integrated Products, Inc.: San Jose, CA, USA, 2019. [Google Scholar]
- Wang, T.; Xu, J.; Molinos, J.G.; Li, C.; Hu, B.; Pan, M.; Zhang, M. A dynamic temperature difference control recording system in shallow lake mesocosm. Methodsx 2020, 7, 100930. [Google Scholar] [CrossRef]
- Brahmana, K. The Design of Data Collector to Calculate the Efficiency of DC to AC Inverter Based on ATmega328 and Micro SD as Storage Media. J. Technomater. Phys. 2020, 2, 129–138. [Google Scholar] [CrossRef]
- Cameron, N. Arduino Applied; Apress: New York, NY, USA, 2019. [Google Scholar]
- Krupčík, J.; Májek, P.; Gorovenko, R.; Blaško, J.; Kubinec, R.; Sandra, P. Considerations on the determination of the limit of detection and the limit of quantification in one-dimensional and comprehensive two-dimensional gas chromatography. J. Chromatogr. A 2015, 1396, 117–130. [Google Scholar] [CrossRef] [PubMed]
- Shrivastava, A.; Gupta, V.B. Methods for the determination of limit of detection and limit of quantitation of the analytical methods. Chron. Young Sci. 2011, 2, 21–25. [Google Scholar] [CrossRef]
- Currie, L.A. Nomenclature in evaluation of analytical methods including detection and quantification capabilities (IUPAC Recommendations 1995). Anal. Chim. Acta 1999, 391, 105–126. [Google Scholar] [CrossRef]
- Fontanella, R.; Accardo, D.; Moriello, R.S.L.; Angrisani, L.; De Simone, D. An Innovative Strategy for Accurate Thermal Compensation of Gyro Bias in Inertial Units by Exploiting a Novel Augmented Kalman Filter. Sensors 2018, 18, 1457. [Google Scholar] [CrossRef]
- Zhao, S.; Guo, C.; Ke, C.; Zhou, Y.; Shu, X. Temperature drift compensation of fiber strapdown inertial navigation system based on GSA-SVR. Measurement 2022, 195, 111117. [Google Scholar] [CrossRef]
- Liang, C.; Zhou, Y.; Zhang, D.; She, X.; Huang, T.; Shu, X. Research on the temperature characteristic of magnetic sensor in the magnetic drift compensation fiber-optic gyroscope. Optik 2018, 172, 91–96. [Google Scholar] [CrossRef]
- Coillot, C.; Nativel, E.; Zanca, M.; Goze-Bac, C. The magnetic field homogeneity of coils by means of the space harmonics suppression of the current density distribution. J. Sens. Sens. Syst. 2016, 5, 401–408. [Google Scholar] [CrossRef]
- Bolinger, L.; Prammer, M.G.; Leigh, J.S. A multiple-frequency coil with a highly uniform B1 field. J. Magn. Reson. 1989, 81, 162–166. [Google Scholar] [CrossRef]
- Stauffer, P.; Sneed, P.; Hashemi, H.; Phillips, T. Practical induction heating coil designs for clinical hyperthermia with ferromagnetic implants. IEEE Trans. Biomed. Eng. 1994, 41, 17–28. [Google Scholar] [CrossRef] [PubMed]
- Tominaka, T. Magnetic field calculation of an infinitely long solenoid. Eur. J. Phys. 2006, 27, 1399–1408. [Google Scholar] [CrossRef]
- Bordelon, D.E.; Goldstein, R.C.; Nemkov, V.S.; Kumar, A.; Jackowski, J.K.; DeWeese, T.L.; Ivkov, R. Modified Solenoid Coil That Efficiently Produces High Amplitude AC Magnetic Fields with Enhanced Uniformity for Biomedical Applications. IEEE Trans. Magn. 2011, 48, 47–52. [Google Scholar] [CrossRef]
- Skumiel, A.; Leszczyński, B.; Molcan, M.; Timko, M. The comparison of magnetic circuits used in magnetic hyperthermia. J. Magn. Magn. Mater. 2016, 420, 177–184. [Google Scholar] [CrossRef]
- Templin, J.D. Exact solution to the field equations in the case of an ideal, infinite solenoid. Am. J. Phys. 1995, 63, 916–920. [Google Scholar] [CrossRef]
- Sogukpinar, H.; Tali, B.; Algin, E.; Çerçi, S.; Cerci, D.S.; Engin, K.E.; Kaya, A.I. Prototype solenoid electromagnetic design and production for Turkish proton accelerator’s MDIS ion source. Balk. Phys. Lett. 2016, 24, 1–14. [Google Scholar]
- Hurtado-Velasco, R.; Gonzalez-Llorente, J. Simulation of the magnetic field generated by square shape Helmholtz coils. Appl. Math. Model. 2016, 40, 9835–9847. [Google Scholar] [CrossRef]
- Manoj, C.; Kuvshinov, A.; Maus, S.; Lühr, H. Ocean circulation generated magnetic signals. Earth Planets Space 2006, 58, 429–437. [Google Scholar] [CrossRef]
- Schmid, W.A.; Lazos, R.J. Guía para Estimar la Incertidumbre de la Medición; Centro Nacional de Metrología: Queretaro, Mexico, 2000. [Google Scholar]
- Prakash, A.; Sharma, N.; Katiyar, A.K.; Dubey, S.K.; Sharma, S. Magnetic-based detection of muscular contraction for controlling hand prosthesis. Sens. Actuators A Phys. 2022, 344, 113709. [Google Scholar] [CrossRef]
Disclaimer/Publisher’s Note: The statements, opinions and data contained in all publications are solely those of the individual author(s) and contributor(s) and not of MDPI and/or the editor(s). MDPI and/or the editor(s) disclaim responsibility for any injury to people or property resulting from any ideas, methods, instructions or products referred to in the content. |
© 2023 by the authors. Licensee MDPI, Basel, Switzerland. This article is an open access article distributed under the terms and conditions of the Creative Commons Attribution (CC BY) license (https://creativecommons.org/licenses/by/4.0/).