Article

Sequence Stratigraphy and Implications for Shale Gas Exploration in the Southern Sichuan Basin, South China

1
School of Geosciences, Yangtze University, Wuhan 430100, China
2
Key Laboratory of Exploration Technologies for Oil and Gas Resources, Ministry of Education, Yangtze University, Wuhan 430100, China
3
Cooperative Innovation Center of Unconventional Oil and Gas, Yangtze University, Wuhan 430100, China
4
PetroChina Southwest Oil & Gasfield Company, Chengdu 610051, China
*
Author to whom correspondence should be addressed.
J. Mar. Sci. Eng. 2023, 11(7), 1393; https://doi.org/10.3390/jmse11071393
Submission received: 12 June 2023 / Revised: 2 July 2023 / Accepted: 5 July 2023 / Published: 10 July 2023
(This article belongs to the Special Issue High-Efficient Exploration and Development of Oil & Gas from Ocean)

Abstract

:
In contrast to the widely used sequence stratigraphic models for passive continental margins, the stacking patterns of strata within epeiric seas, which are influenced by regional tectonic activity, may display opposing characteristics during the same geological period. These variations serve as a record of basin evolution and also affect the accumulation of hydrocarbons within the strata. Our study investigated the development potential of the deep Longmaxi Shale in the southern Sichuan Basin by examining the sequence stratigraphy and sedimentary fill patterns. Using a combination of core observation, well-logging data analysis, and 3D seismic profile interpretation, we aimed to gain an understanding of the sedimentary fill history of the Longmaxi Shale during the Early Silurian. Our analysis revealed that deglaciation and regional tectonic events affected the sequence stratigraphy, resulting in unconformities that were identifiable using seismic data and wireline logs. Through an analysis of thirty wireline logs and two seismic profiles, we identified two third-order sequences suggested in the Lower Longmaxi Formation. Within the two third-order sequences were five systems tracts, with the first exhibiting a complete cycle of sea-level change and the second cycle being incomplete due to regional tectonic events. The graptolite succession on the upper Yangtze Platform provided a temporal view of the sequence stratigraphy and sedimentation rates of the Longmaxi Shale. The thickness trends of the systems tracts reflected the interplay of short-term eustasy fluctuations, subsidence, and uplift. Our analysis suggests that regional subsidence played a significant role in the deposition of the second transgressive systems tract (TST) in the Weiyuan and Luzhou areas, which represents a promising target for shale gas exploration, in addition to the first TST. However, the Changning area experienced a relative sea-level decrease due to the intense uplift of the Qianzhogn Paleo-uplift and the increased supply of sediment and is interpreted as a highstand systems tract (HST); it is not considered to have shale gas exploration potential.

1. Introduction

The Longmaxi Shale, located in the Upper Yangtze Block of the southern Sichuan Basin, has emerged as the primary target for exploring and developing unconventional shale gas in China [1,2,3]. Although the Changning, Weiyuan, and Zhaotong shale plays have successfully developed shallow (less than 3500 m deep) shale gas [4], the deep shale in the Luzhou area holds even greater potential for development and is expected to be the next target for shale gas exploration [2]. Studying the strata and fluid properties is crucial for understanding the accumulation of hydrocarbons and accurately predicting their development processes [5,6,7]. Additionally, a high-resolution sequence stratigraphic framework not only aids in predicting the oil and gas sweet spots and correlating regions but also provides insights into the evolution of the sedimentary basin [1,8,9,10,11]. Several studies on the sequence stratigraphy of the Longmaxi Formation in southern Sichuan have been conducted to guide the exploration and development of shale gas resources [1,12,13,14,15,16,17]. However, due to variations in available data, research methods, and comprehension of sequence stratigraphy, scholars still hold differing opinions on the sequence division and understanding of the Longmaxi Formation in the southern Sichuan Basin. Most researchers have categorized the Lower Longmaxi Formation as a third-order sequence [1,12], while some have divided it into two or more third-order sequences [13].
Nevertheless, they all acknowledge that the Upper Yangtze Sea exhibits consistent variations in relative sea level [1,12,13,14,15,16,17]. Therefore, the stratigraphic stacking patterns in Weiyuan, Luzhou, and Chongning regions are also consistent. Previous research findings indicated that the transgressive systems tract (TST) represents the most favorable interval for shale gas exploration within a third-order sequence [1]. In other words, based on the correlation between TST and the corresponding strata established through the sequence stratigraphic framework, the shale gas layers with the most potential can be identified. However, recent drilling data demonstrated that the potential distribution of shale gas layers in the Weiyuan, Luzhou, and Chongning regions was inconsistent.
Consequently, the relative sea level changes during the sedimentation of this stratigraphic unit in the Weiyuan, Luzhou, and Changning regions might not be consistent. This could result in a variation of their stratigraphic stacking patterns. Moreover, the migration of the subsidence center, the influence of paleo-uplifts and depressions on the lateral distribution of the sequence stratigraphy, and the evolution of the sequence stratigraphy remain unclear. Identifying the sequence boundary and determining changes in accommodation is critical to establishing the stratigraphic sequence framework of marine shale [18]. Nevertheless, previous studies suggest that the studied strata are controlled not only by eustacy but also by paleogeography and tectonism [19,20,21], thus making it challenging to determine the ideal sequence framework and evolutionary pattern of the studied area, which is complicated by the interplay of eustacy and regional differential subsidence.
Geological records, including seismic data, lithofacies, sedimentary structures, graptolite abundance and extinction, geochemistry, wireline logs, and organic matter abundance (TOC), are important in analyzing the effects of relative sea-level changes [11,22,23,24,25,26,27]. Therefore, it is critical to integrate multiple methods to establish a complete and reasonable high-resolution stratigraphic sequence framework for better predicting the “sweet spot”. As shale gas exploration and development in the Sichuan Basin moves into the deep field, the deep drilling data in the Luzhou area has been augmented. With this understanding and abundance of data, the objectives of this paper are to reconstruct the evolution of the studied strata under the stratigraphic sequence framework and predict the potential layers for shale gas exploration.

2. Geologic Setting

2.1. Tectonic Setting

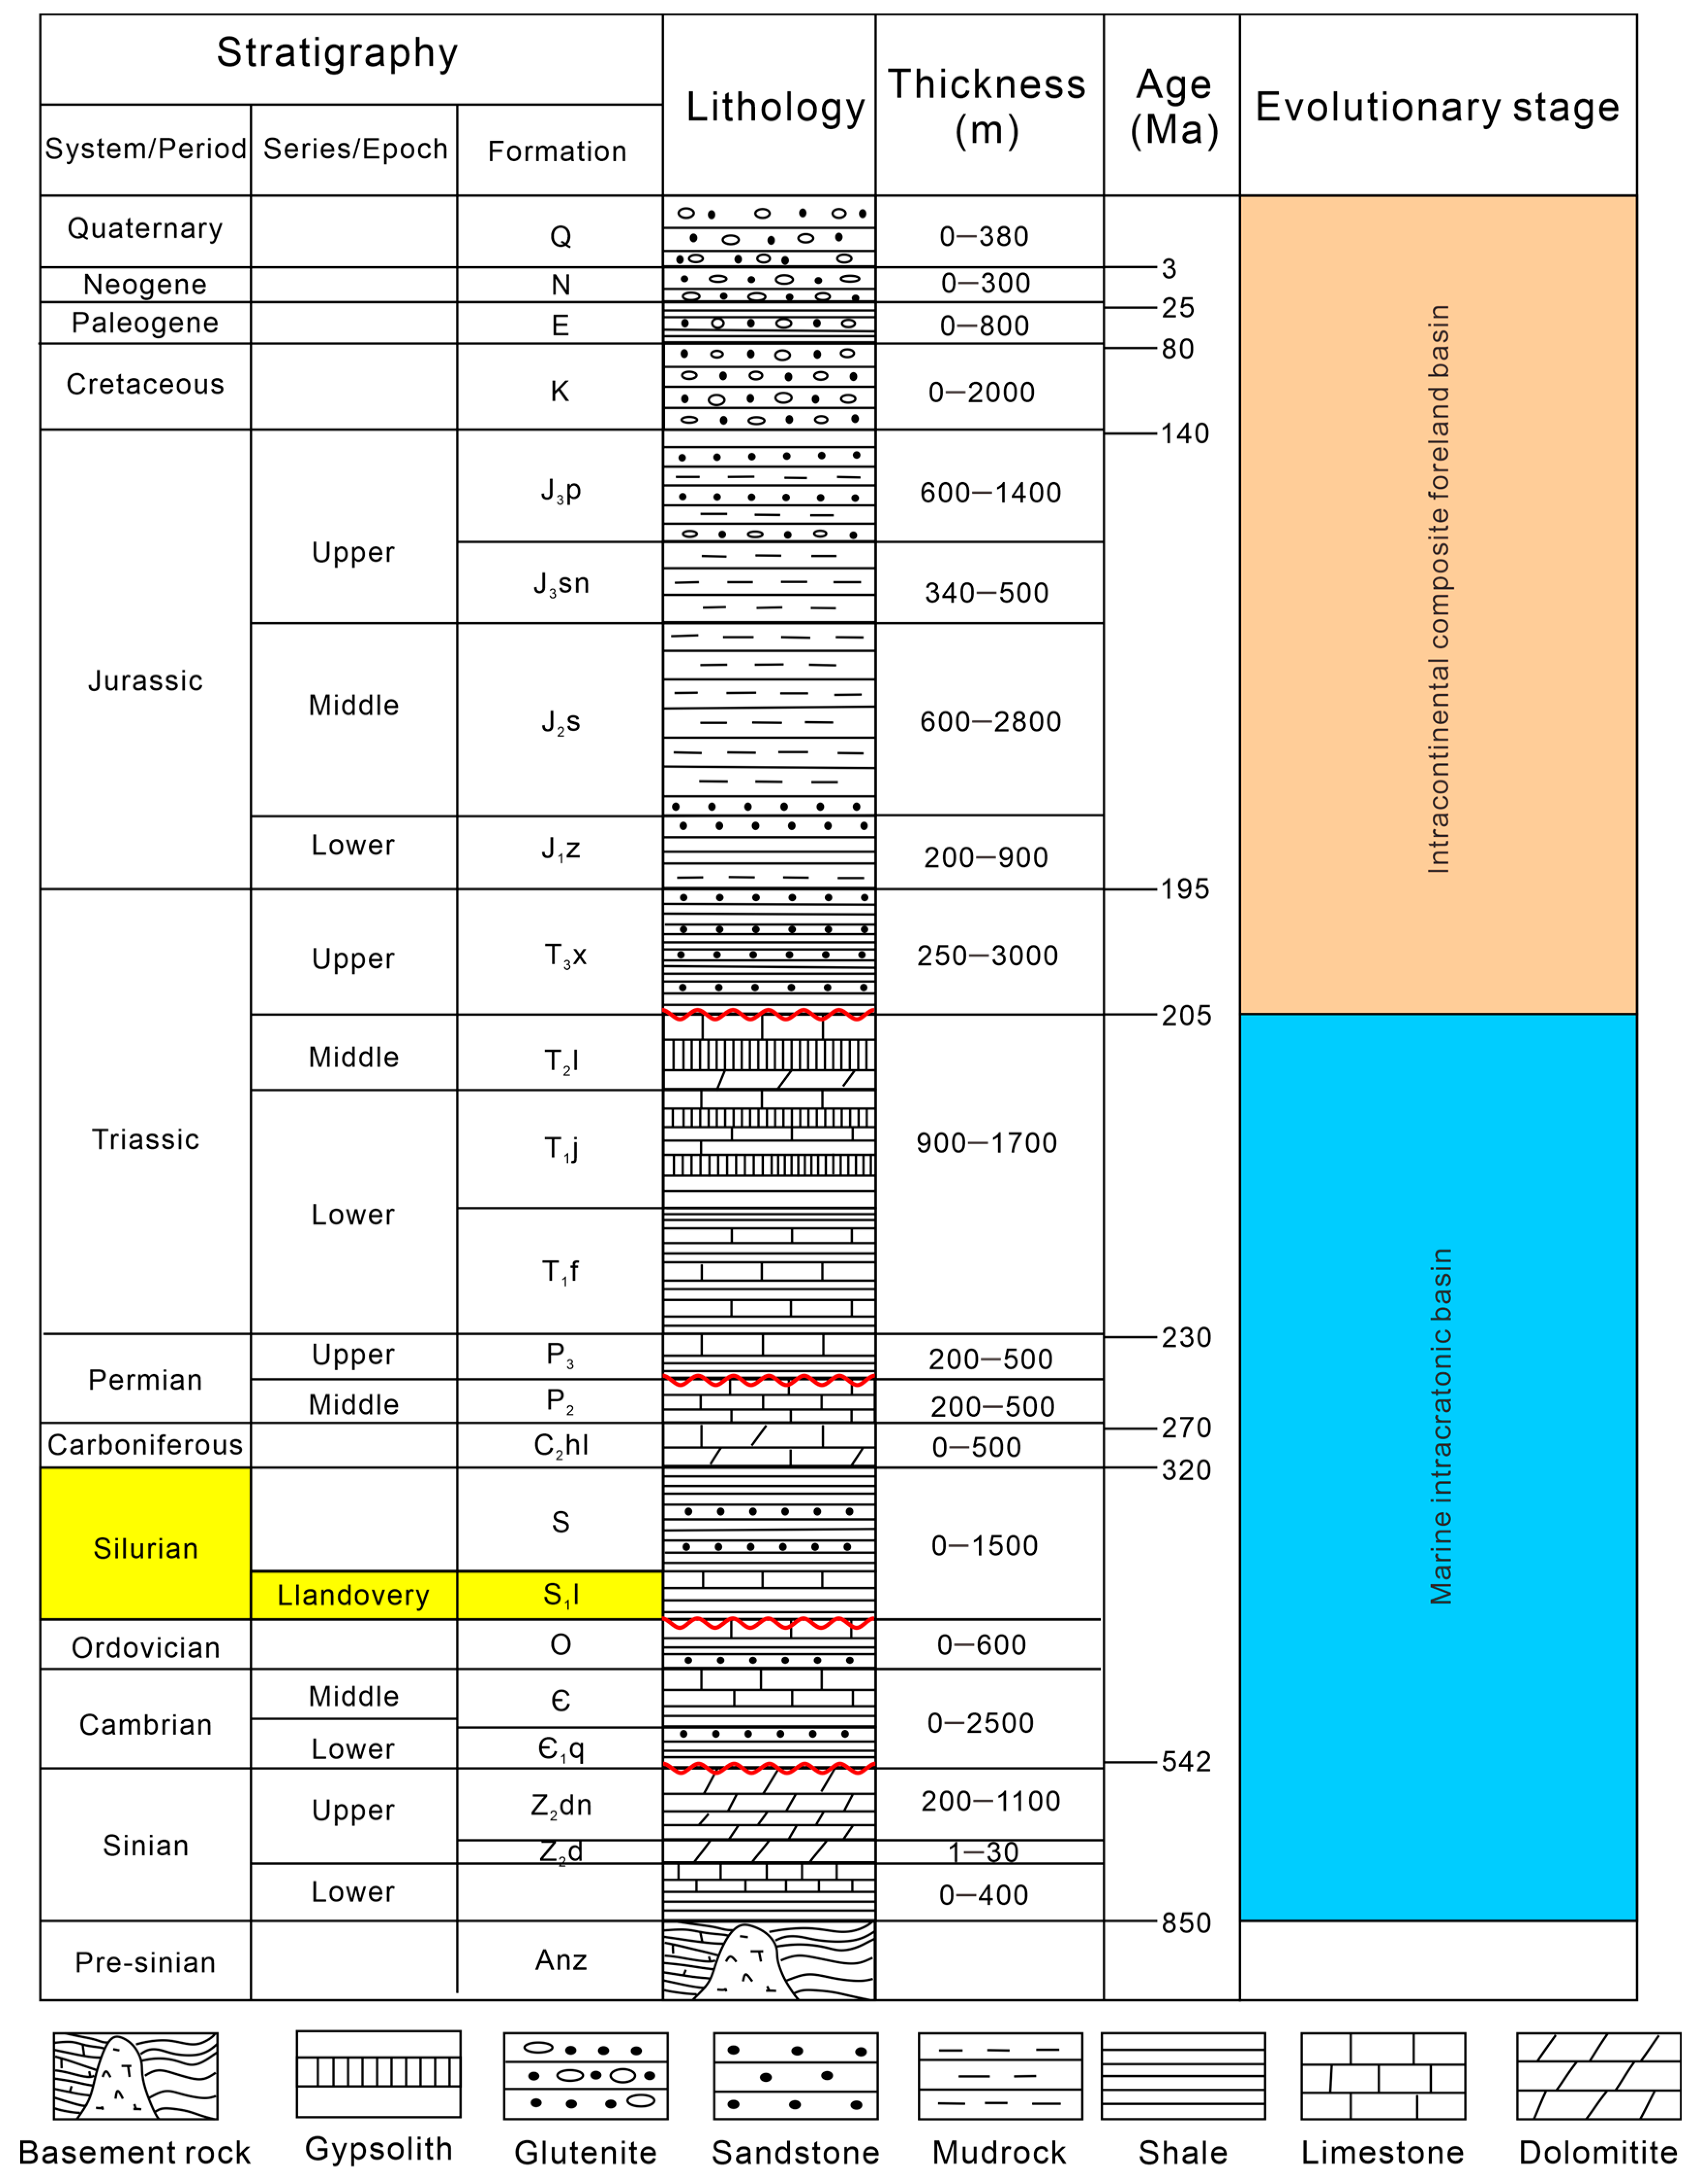
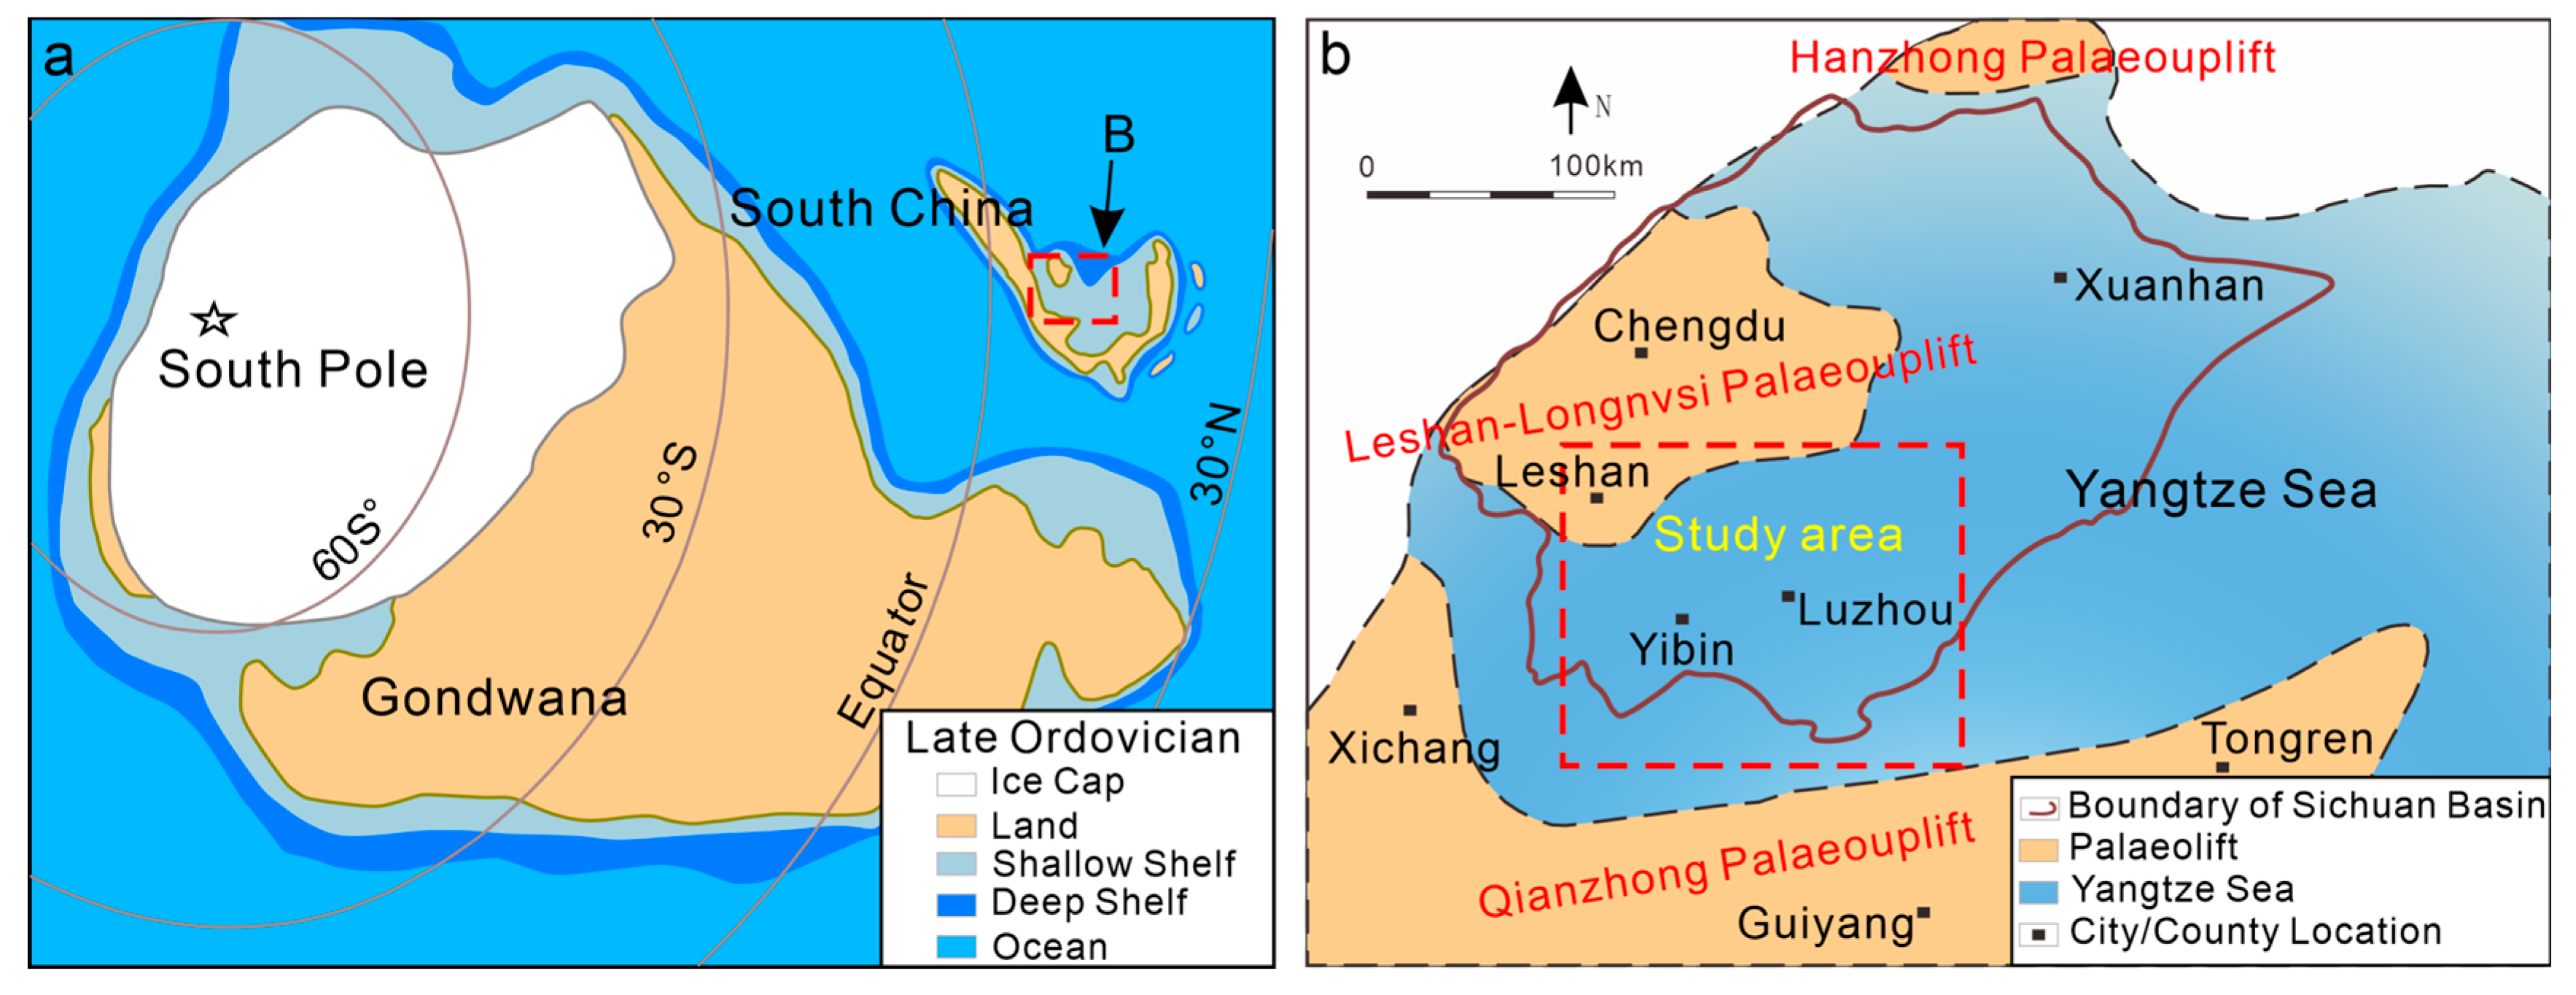
The Sichuan Basin, which is located in southwestern China (Figure 1a), is a superimposed basin spanning a vast area measuring 26 × 104 km2 [28]. The double structures of the basin, consisting of shallow marine deposits and terrestrial strata, were formed during the two evolutionary stages of the basin: (1) the development stage of a marine intracratonic basin and (2) the development phase of an intracontinental composite foreland basin (Figure 2) [22]. South China overlayed the low latitudes of the northern hemisphere in Late Ordovician and Early Silurian times (Figure 3a) and was significantly affected by the global paleoclimate fluctuations and tectonics [29,30,31,32,33,34]. Tectonic highlands and paleo-uplifts were raised along the eastern margin of the Sichuan Basin during the Late Ordovician to the Early Silurian Yangtze-Cathaysia plate collision and amalgamation [29]. Meanwhile, during the Caledonian Era, the Leshan-Longnvsi highland continued to rise, restricting the upper Yangtze Sea in the north by the Leshan-Longnvsi paleo-high and in the south by Qianzhong Paleo-uplift (Figure 3b) [35,36]. With the increasing extrusion of the South China Plate, the peripheral paleo-uplifts surrounding the upper Yangtze Sea continuously elevated and expanded, leading the Kangdian, Dianqiangui, and Cathaysia lands to become one large land area [19,37,38]. In contrast, the upper Yangtze Sea was open towards the northeast, allowing an influx of open marine waters and preventing complete circulation restriction. While the northern margin of the Yangtze Sea still maintained passive edge characteristics, South China exhibited significant compression and shrinkage of structural features [22,39].
The study area is situated within the southern Sichuan Basin low steep dome belt, which was located at the western edge of the Yangtze Plate. Throughout its geological history, this region has undergone multiple phases of complicated tectonic transformations and superimpositions and has been affected by the tectonic movements of several orogens, including the Caledonian, Hercynian, Indosinian, Yanshanian, and Himalayan [1]. Over a relatively long geological timeframe, this region has formed a distinct geometric shape as a result of its unique structural evolution, leading to the formation of a bowl-shaped syncline structure at the boundary of the Longmaxi Formation.

2.2. Regional Stratigraphy

The Longmaxi Formation of the Lower Silurian is divided into two members: The Lower Member and the Upper Member [1]. This article focuses on the Lower Member, which is currently the primary interval for commercial shale gas production. The Longmaxi Formation is widely distributed on the Yangtze Platform [37,42,43,44]. Below the Longmaxi Formation lies the Wufeng Formation, separated from the underlying black shale of the Longmaxi Formation by a thin layer of interbedded shelly limestone [16]. The underlying unit, called “Guanyinqiao”, is known for its thin shelly limestone resulting from Hirnantian glaciation [37,45,46]. The Wufeng Shale and Guanyinqiao together form the Wufeng Formation, consisting of four graptolite zones with a thickness ranging from several meters to thirty meters [47,48]. The Longmaxi Formation comprises the lower organic-rich siliceous shale and the upper silty shale and includes nine graptolite zones with a thickness ranging from several tens of meters to hundreds of meters [49,50].

3. Data and Methods

3.1. Dataset

We used multiple datasets to develop a comprehensive stratigraphic sequence framework for the Lower Longmaxi Formation in the South Sichuan Basin, spanning from the Weiyuan to Changning regions. All data used in this paper were provided by the PetroChina Southwest Oil & Gas Field Company, including a 3D seismic volume with an area of 450 km2, cores with a total length of 667.18 m from 10 wells, and wireline logs from 32 wells. We also examined one outcrop section located in Nanjiang. The seismic data utilized for analyzing the Longmaxi Formation in the Southern Sichuan Basin was collected before 2011 and reprocessed in 2015 using pre-stack time migration. The frequency of the 3D seismic volume data for the study area ranges from 5 Hz to 65 Hz, with a predominant frequency of 30 Hz. Based on calculations, the maximum vertical resolution attainable from this dataset is approximately 25 m. The logging data used in this article include gamma ray (GR) logs, acoustic (AC) logs, and density (DEN) logs. In addition, 340 core samples were collected for geochemical tests, including determinations for TOC, minerals, major elements, and rare earth elements, which can reflect changes in the sedimentary environment. The TOC content was determined using a LECO carbon-sulfur analyzer (CS230). The samples were crushed into a powder with a particle size of less than 100 mesh. Approximately 1 g of the samples were pretreated with acid for approximately 3 h at temperatures ranging from 60 °C to 80 °C in order to remove carbonate minerals. Subsequently, the samples were subjected to pyrolysis at temperatures up to 550 °C. The experimental procedure for determining TOC was carried out in accordance with the standard [51]. The mineral components were measured using K-alpha radiation (XRD) on an X′ Pert3 Powder diffractometer. Data were obtained at room temperature in the 2θ range of 5° to 45°, with a scanning step of 0.02° and a scanning speed of 2°/min. Mineral quantification analysis was calculated using the equation as per the Chinese Oil and Gas Industry Standard (SY/T 5163-2018) [52]. For the determination of major elements and rare earth elements, we suggest readers refer to previous literature for detailed descriptions [53,54,55].

3.2. Methodology

The stratigraphic sequence model was based on traditional stratigraphic sequence principles and terminology [9,18,56], and the approach mainly relied upon Rider (1986) [57] and Van Wagoner et al. (1990) [22]. The isochronous framework of twelve wells was identified to constrain the boundary of the sequence stratigraphy based on the standard graptolite zones established by Chen et al. (2015) [1,42,45]. The location of the first appearance of characteristic graptolites served as a representative indicator of the sedimentary age of the corresponding stratigraphic layer. The third-order sequence boundaries were determined by abrupt changes in the seismic profile, wireline logs, outcrop sections, and cores [58]. Due to the relatively low resolution of the seismic data, the maximum flooding surface (MFS) was recognized by the wireline logs, which were characterized by the highest gamma values [22,26,57]. Systems tracts, a subdivision of a sequence, were defined by the stratal stacking patterns, the local stratigraphic relationships, and types of bounding surfaces [18,59].

4. Results

4.1. Stratigraphic Sequence Surfaces

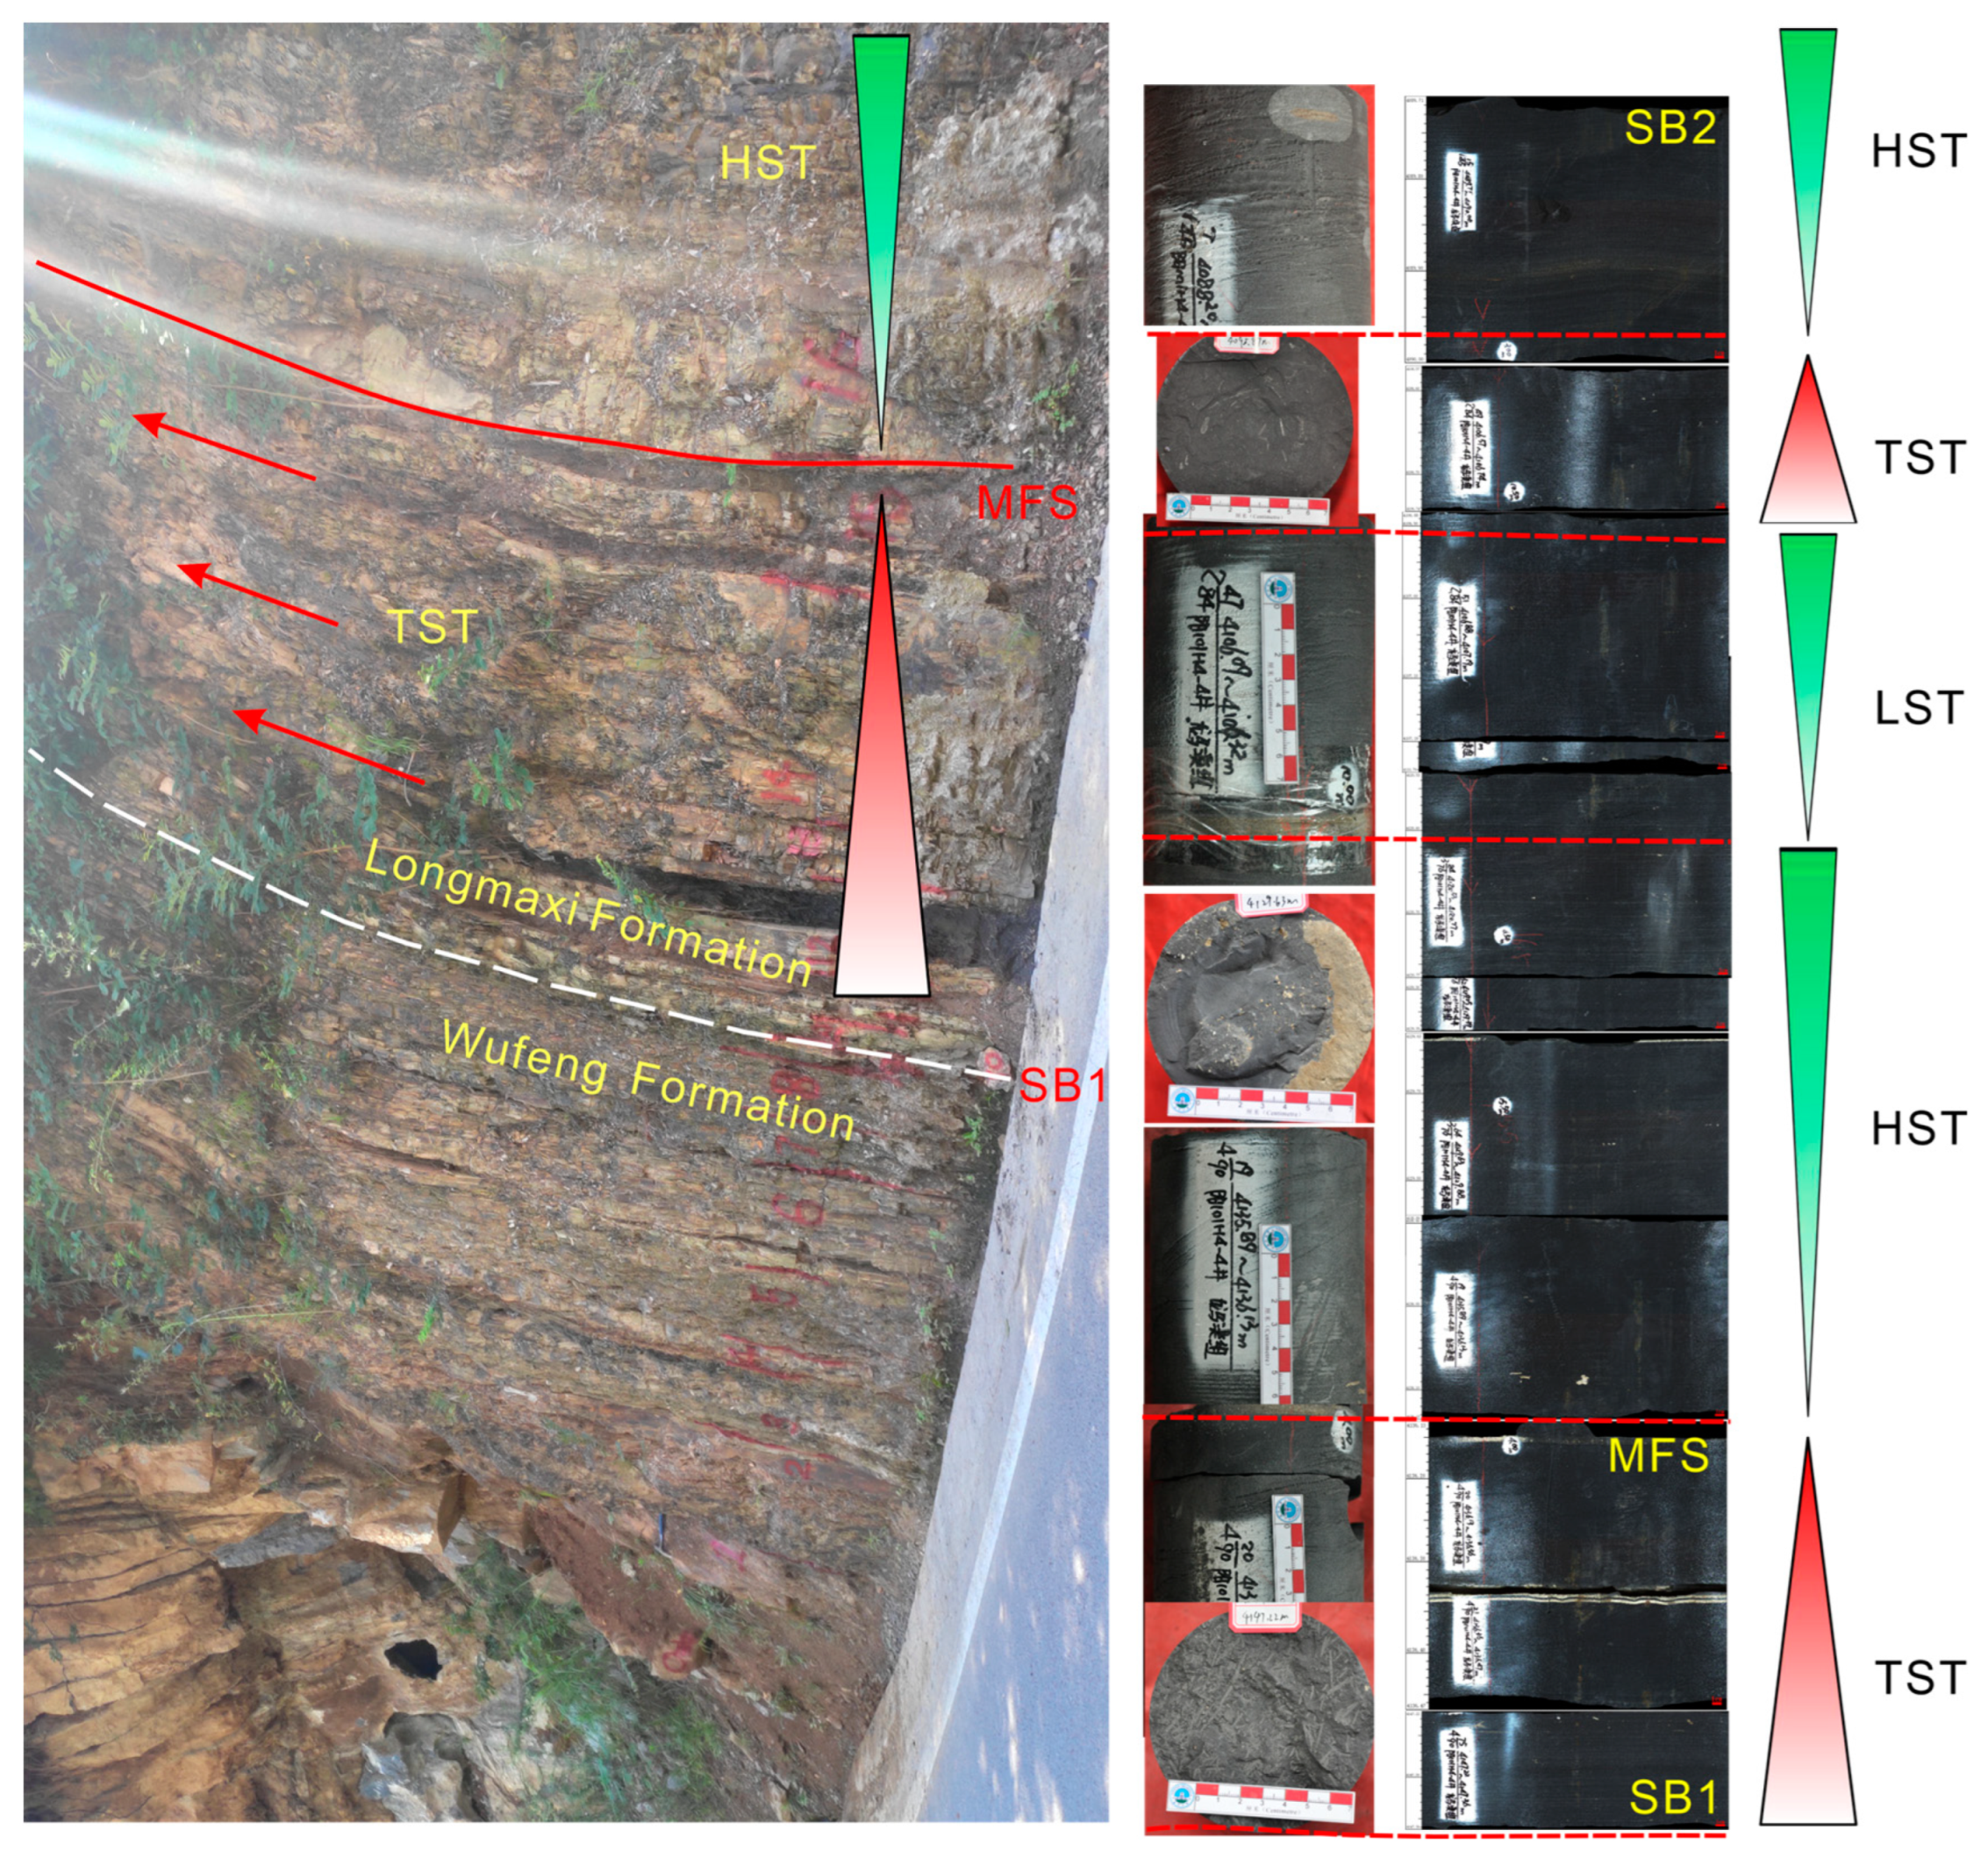
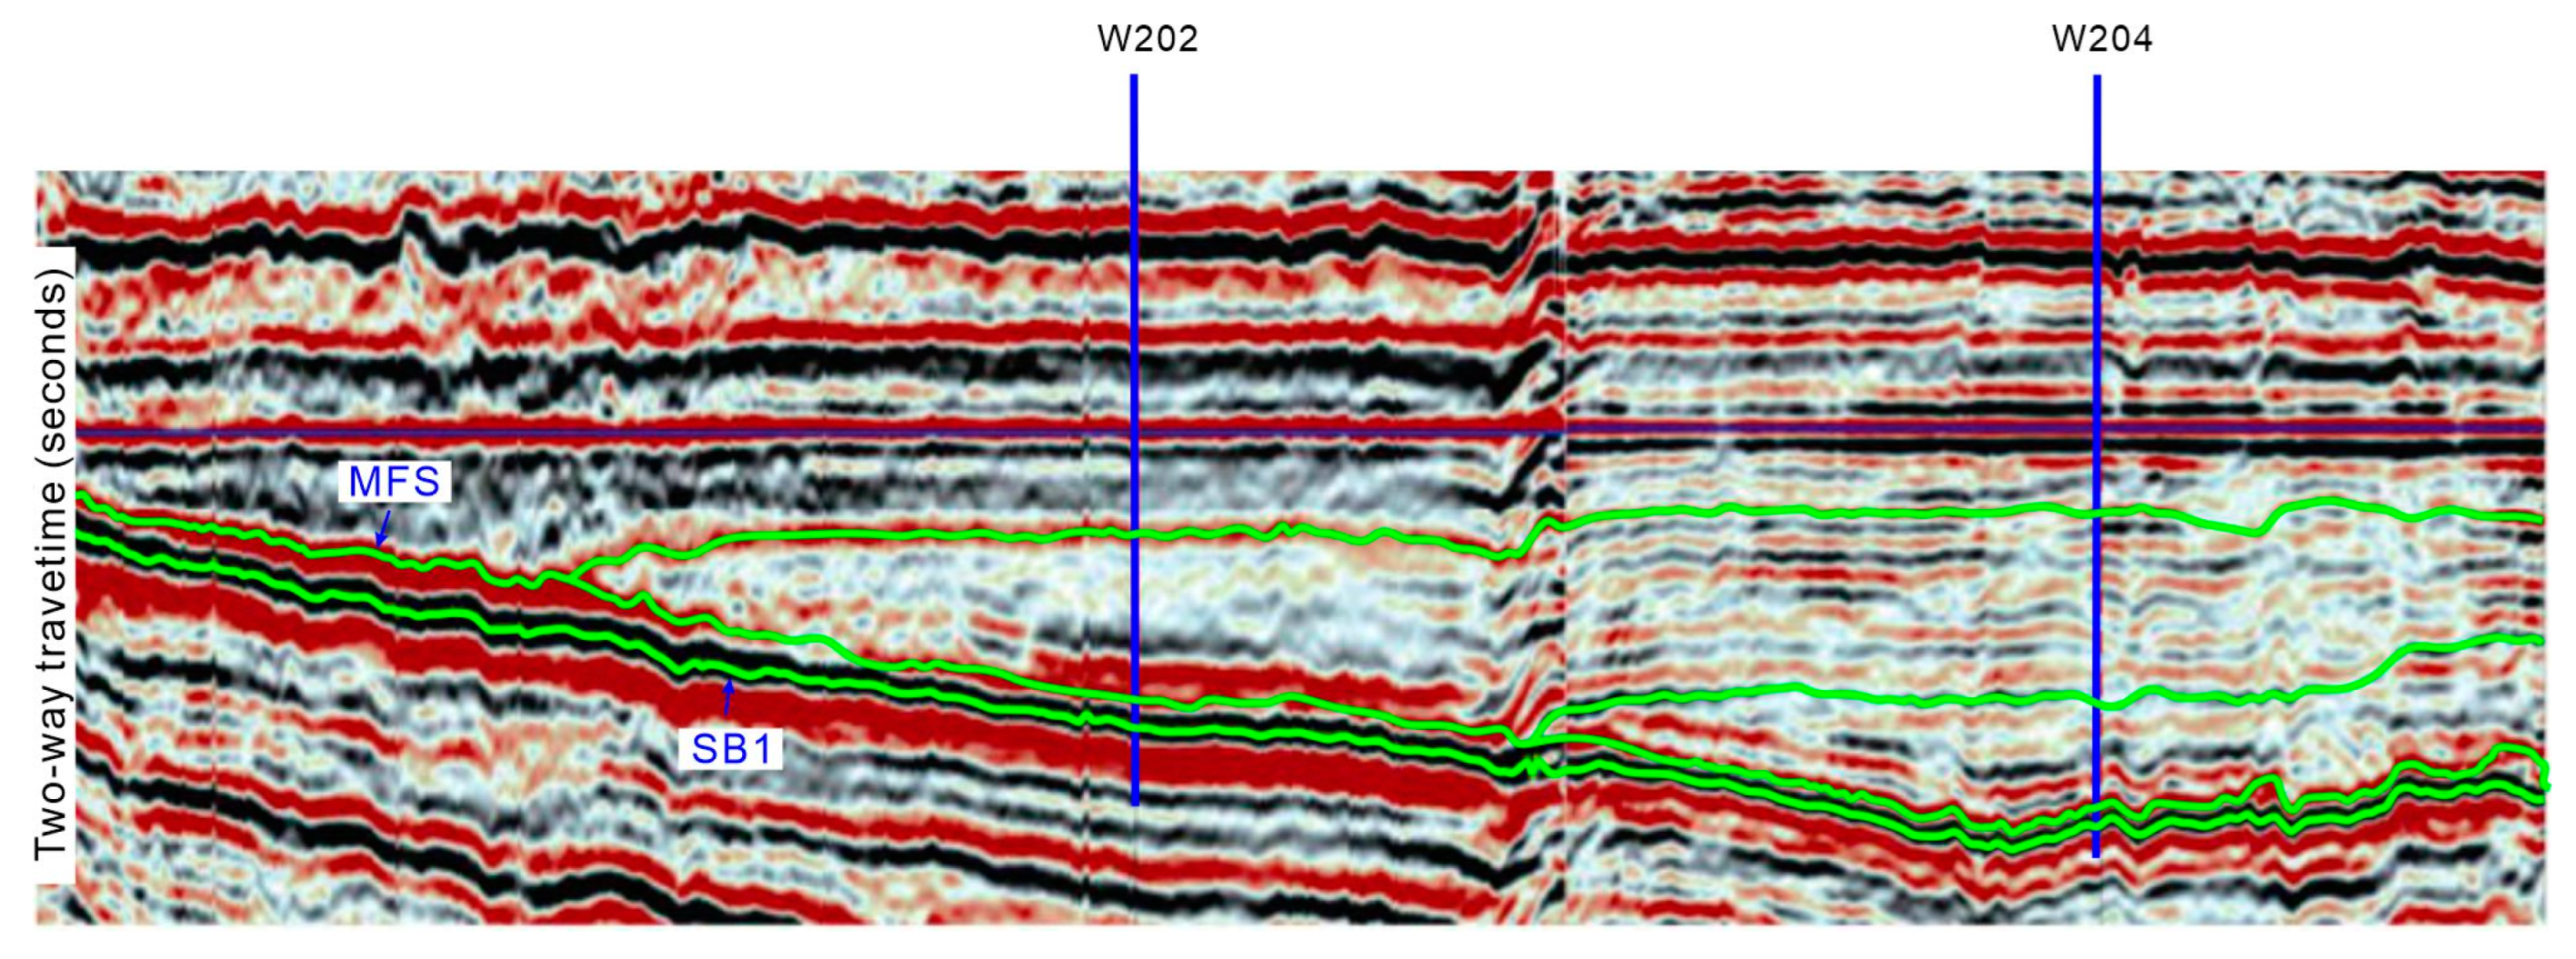
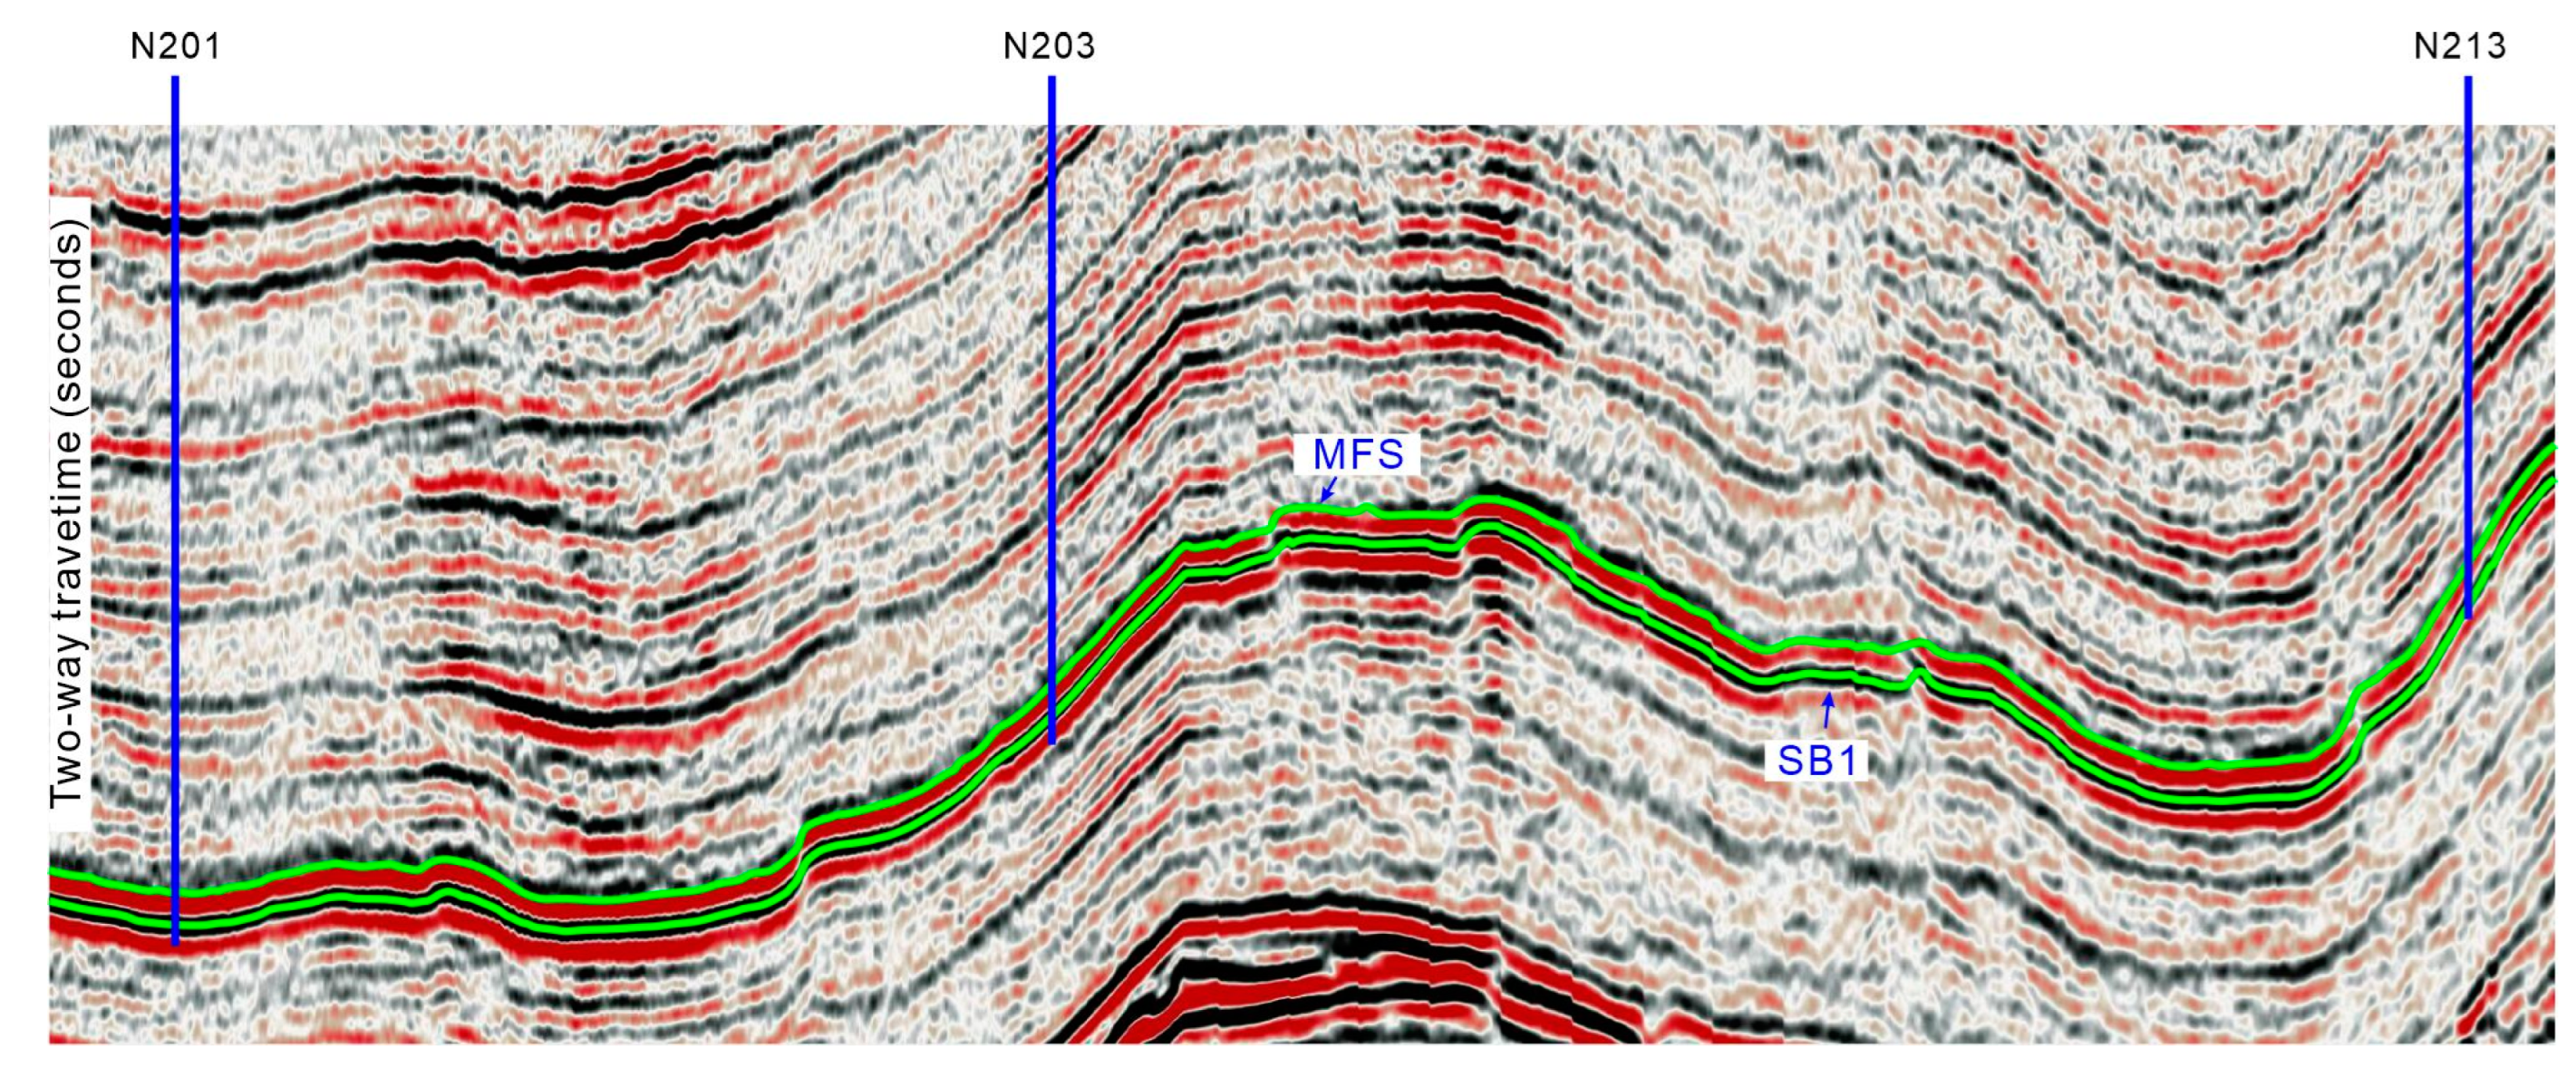
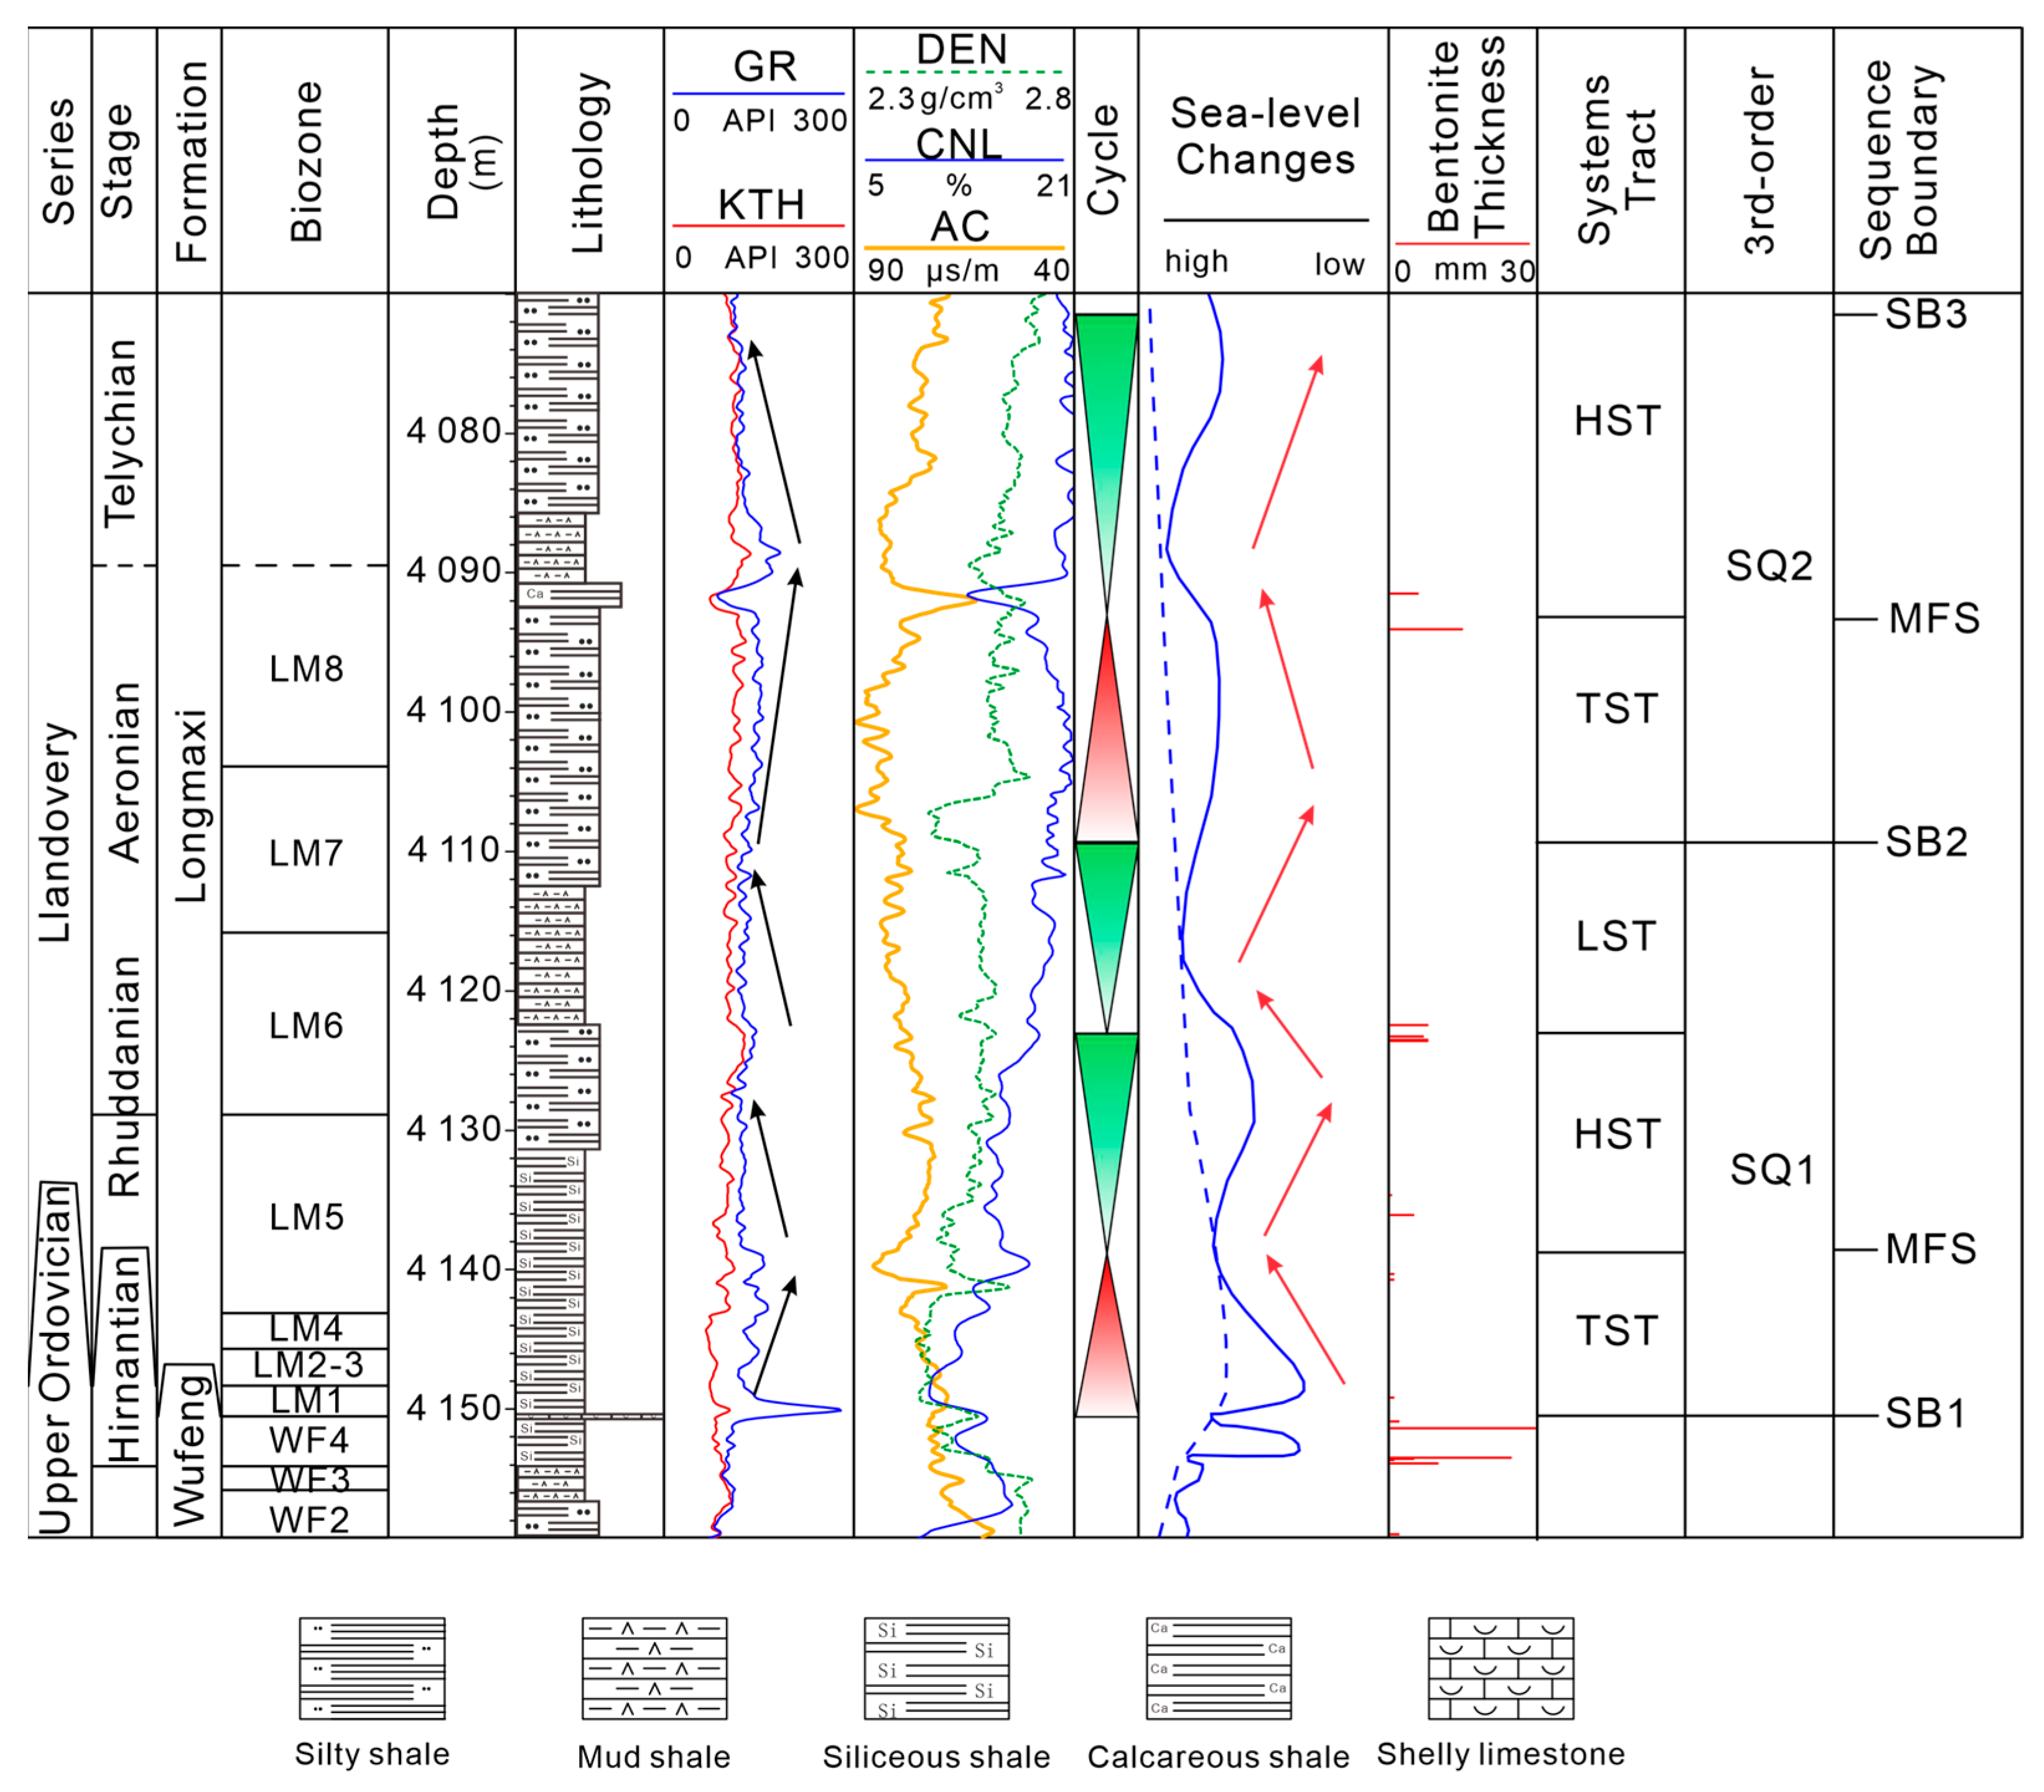
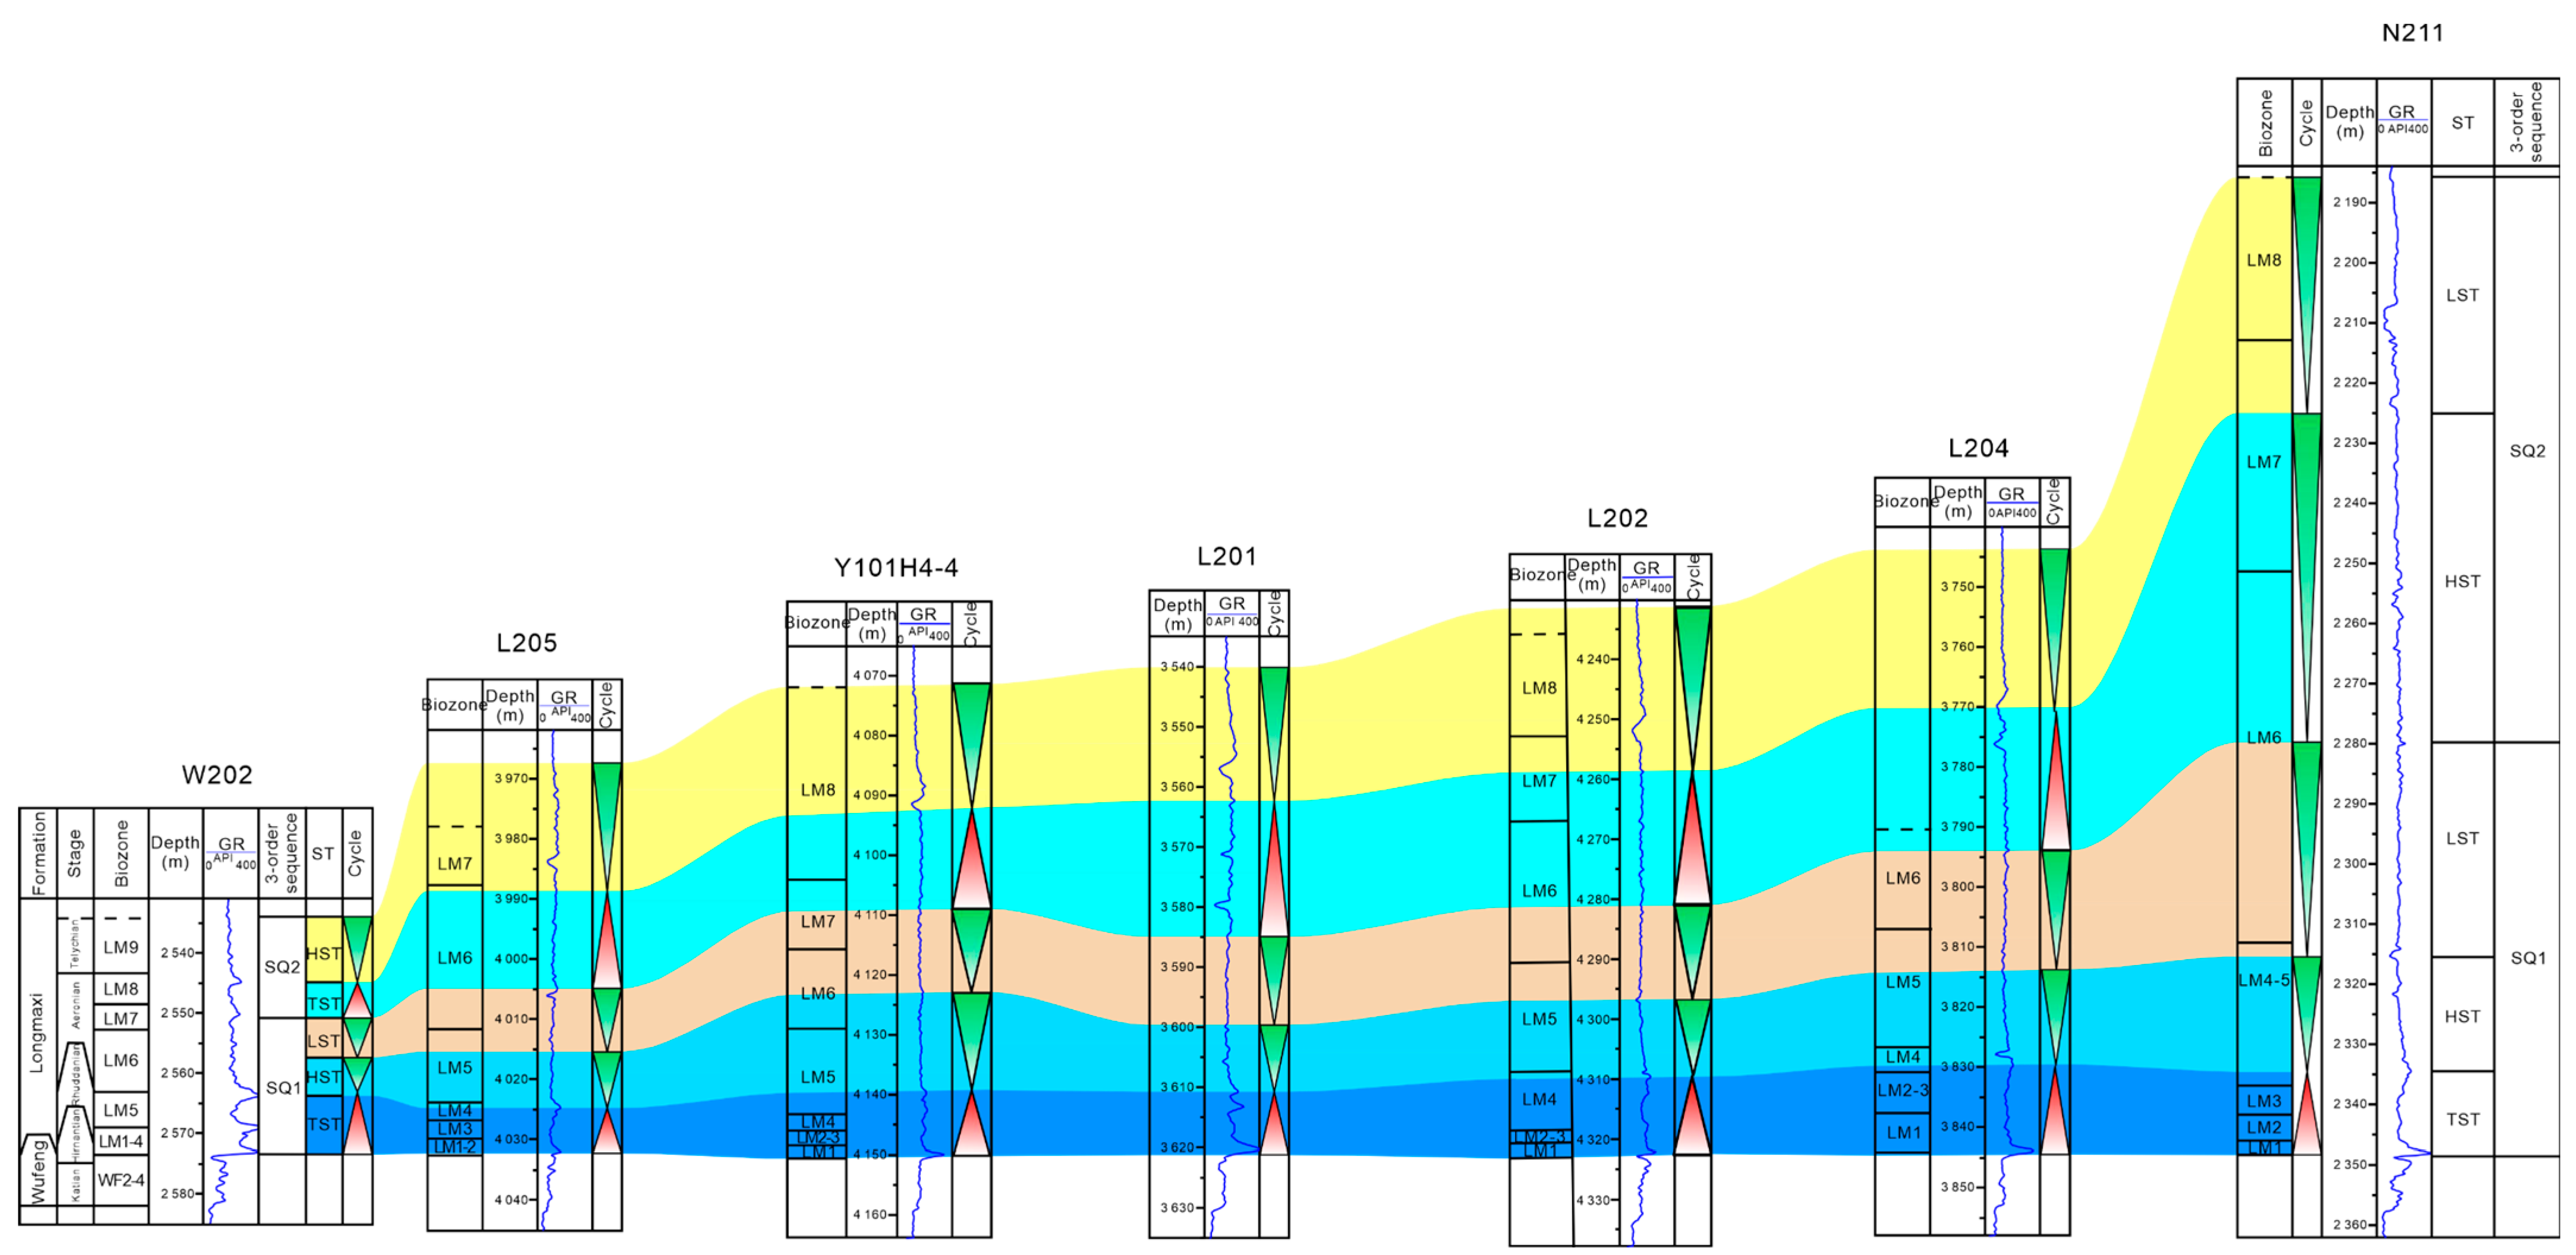
Stratigraphic sequence surfaces mark changes within a lower sequence [18,59]. They are surfaces that appear as unconformities or conformities at the edges and inside of sedimentary basins [1,56]. Based on the available data in this paper, two third-order sequences were defined in the Lower Longmaxi Formation (Figure 4, Figure 5, Figure 6, Figure 7, Figure 8 and Figure 9). Accordingly, five sequence surfaces were identified, including two maximum flooding surfaces (two MFSs in the Weiyuan and Luzhou areas and one in the Changning area) and three third-order sequence boundaries. The first sequence boundary was named SB1. In the field profile, the lower part of the Longmaxi Formation clearly displayed SB1 in the first third-order sequence stratigraphy as it marked a change of lithology (Figure 4). The lithology under SB1 was composed of shelly limestone from the Wufeng Formation, while above this surface, organic-rich black shale comprised the bottom of the Longmaxi Formation. It was also easy to identify SB1 in the core column by recognizing the shelly limestone and the overlying black shale (Figure 4). This surface, SB1, was characterized by an unconformity in some areas of the Yangtze Plate on the seismic profile [60], especially near the edge of the basin (Figure 5). However, conformity could be observed in deep-water settings, such as the Luzhou and Changning areas (Figure 6), making it impossible to determine the type of sequence boundary solely from local seismic profiles. In contrast, the characteristics of this surface, as observed on wire logs, were obvious and consistent. The gamma value suddenly increased rapidly in a short time (Figure 7 and Figure 9). Consequently, SB1 was interpreted as a third-order sequence boundary as well as a transgressive surface, which coincides with previous research [1,16]. The first MFS served as a globally significant surface mainly controlled by the melting of the Gondwana glacier [16]. Specific, recognizable response characteristics were developed in the field profiles, seismic sections, and well log data that could be used to recognize it (Figure 4, Figure 5, Figure 6 and Figure 7). Although SB2, the second MFS, and SB3 have not been directly identified and judged through field and seismic profiles, their response characteristics on logging curves were obvious. Specifically, the gamma values of SB2 and SB3 were local minimum values, while the gamma values of the second MFS were local maximum values (Figure 7). The GR logs in the deep depressions (e.g., W202, W204H10-2, and W204) of the Weiyuan area were rather easy to identify, followed by the Luzhou area, and the variations in the Changning area were relatively subtle (Figure 10 and Figure 11). In this article, we have used the boundary of the system tract of the second third-order sequence as the sequence boundary due to data limitations and research purposes.

4.2. Systems Tracts of the Lower Longmaxi Formation

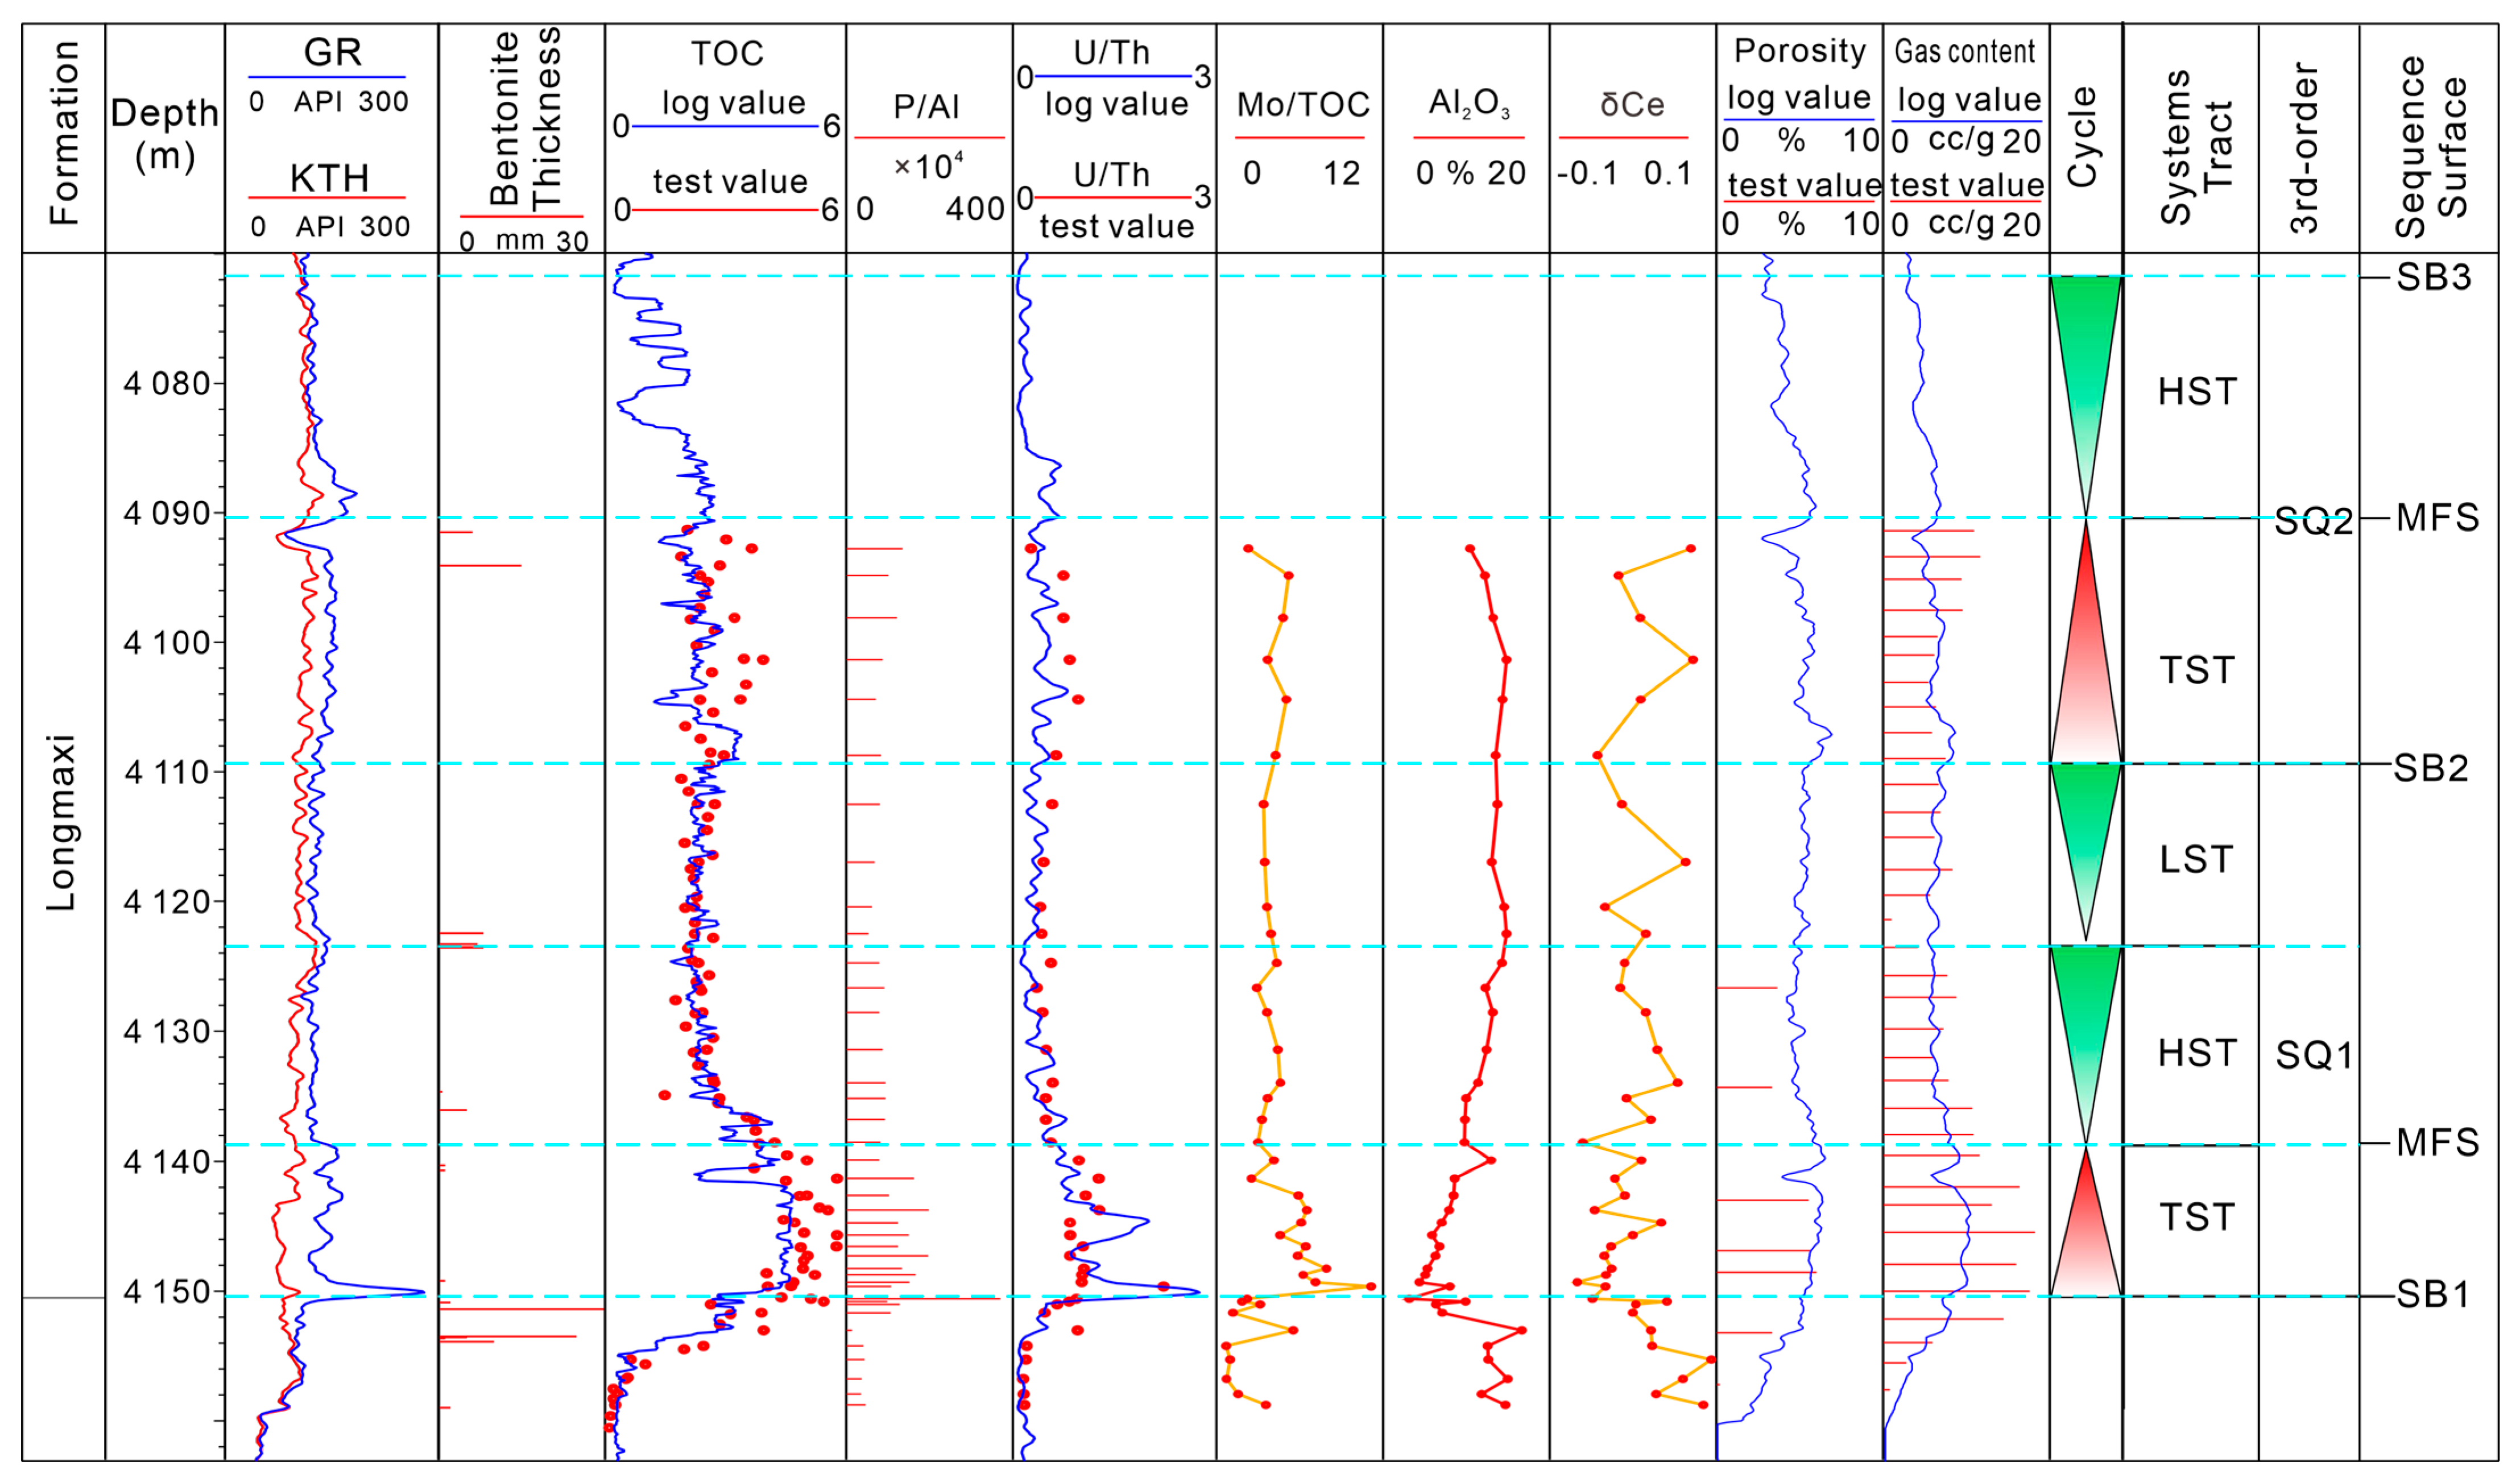
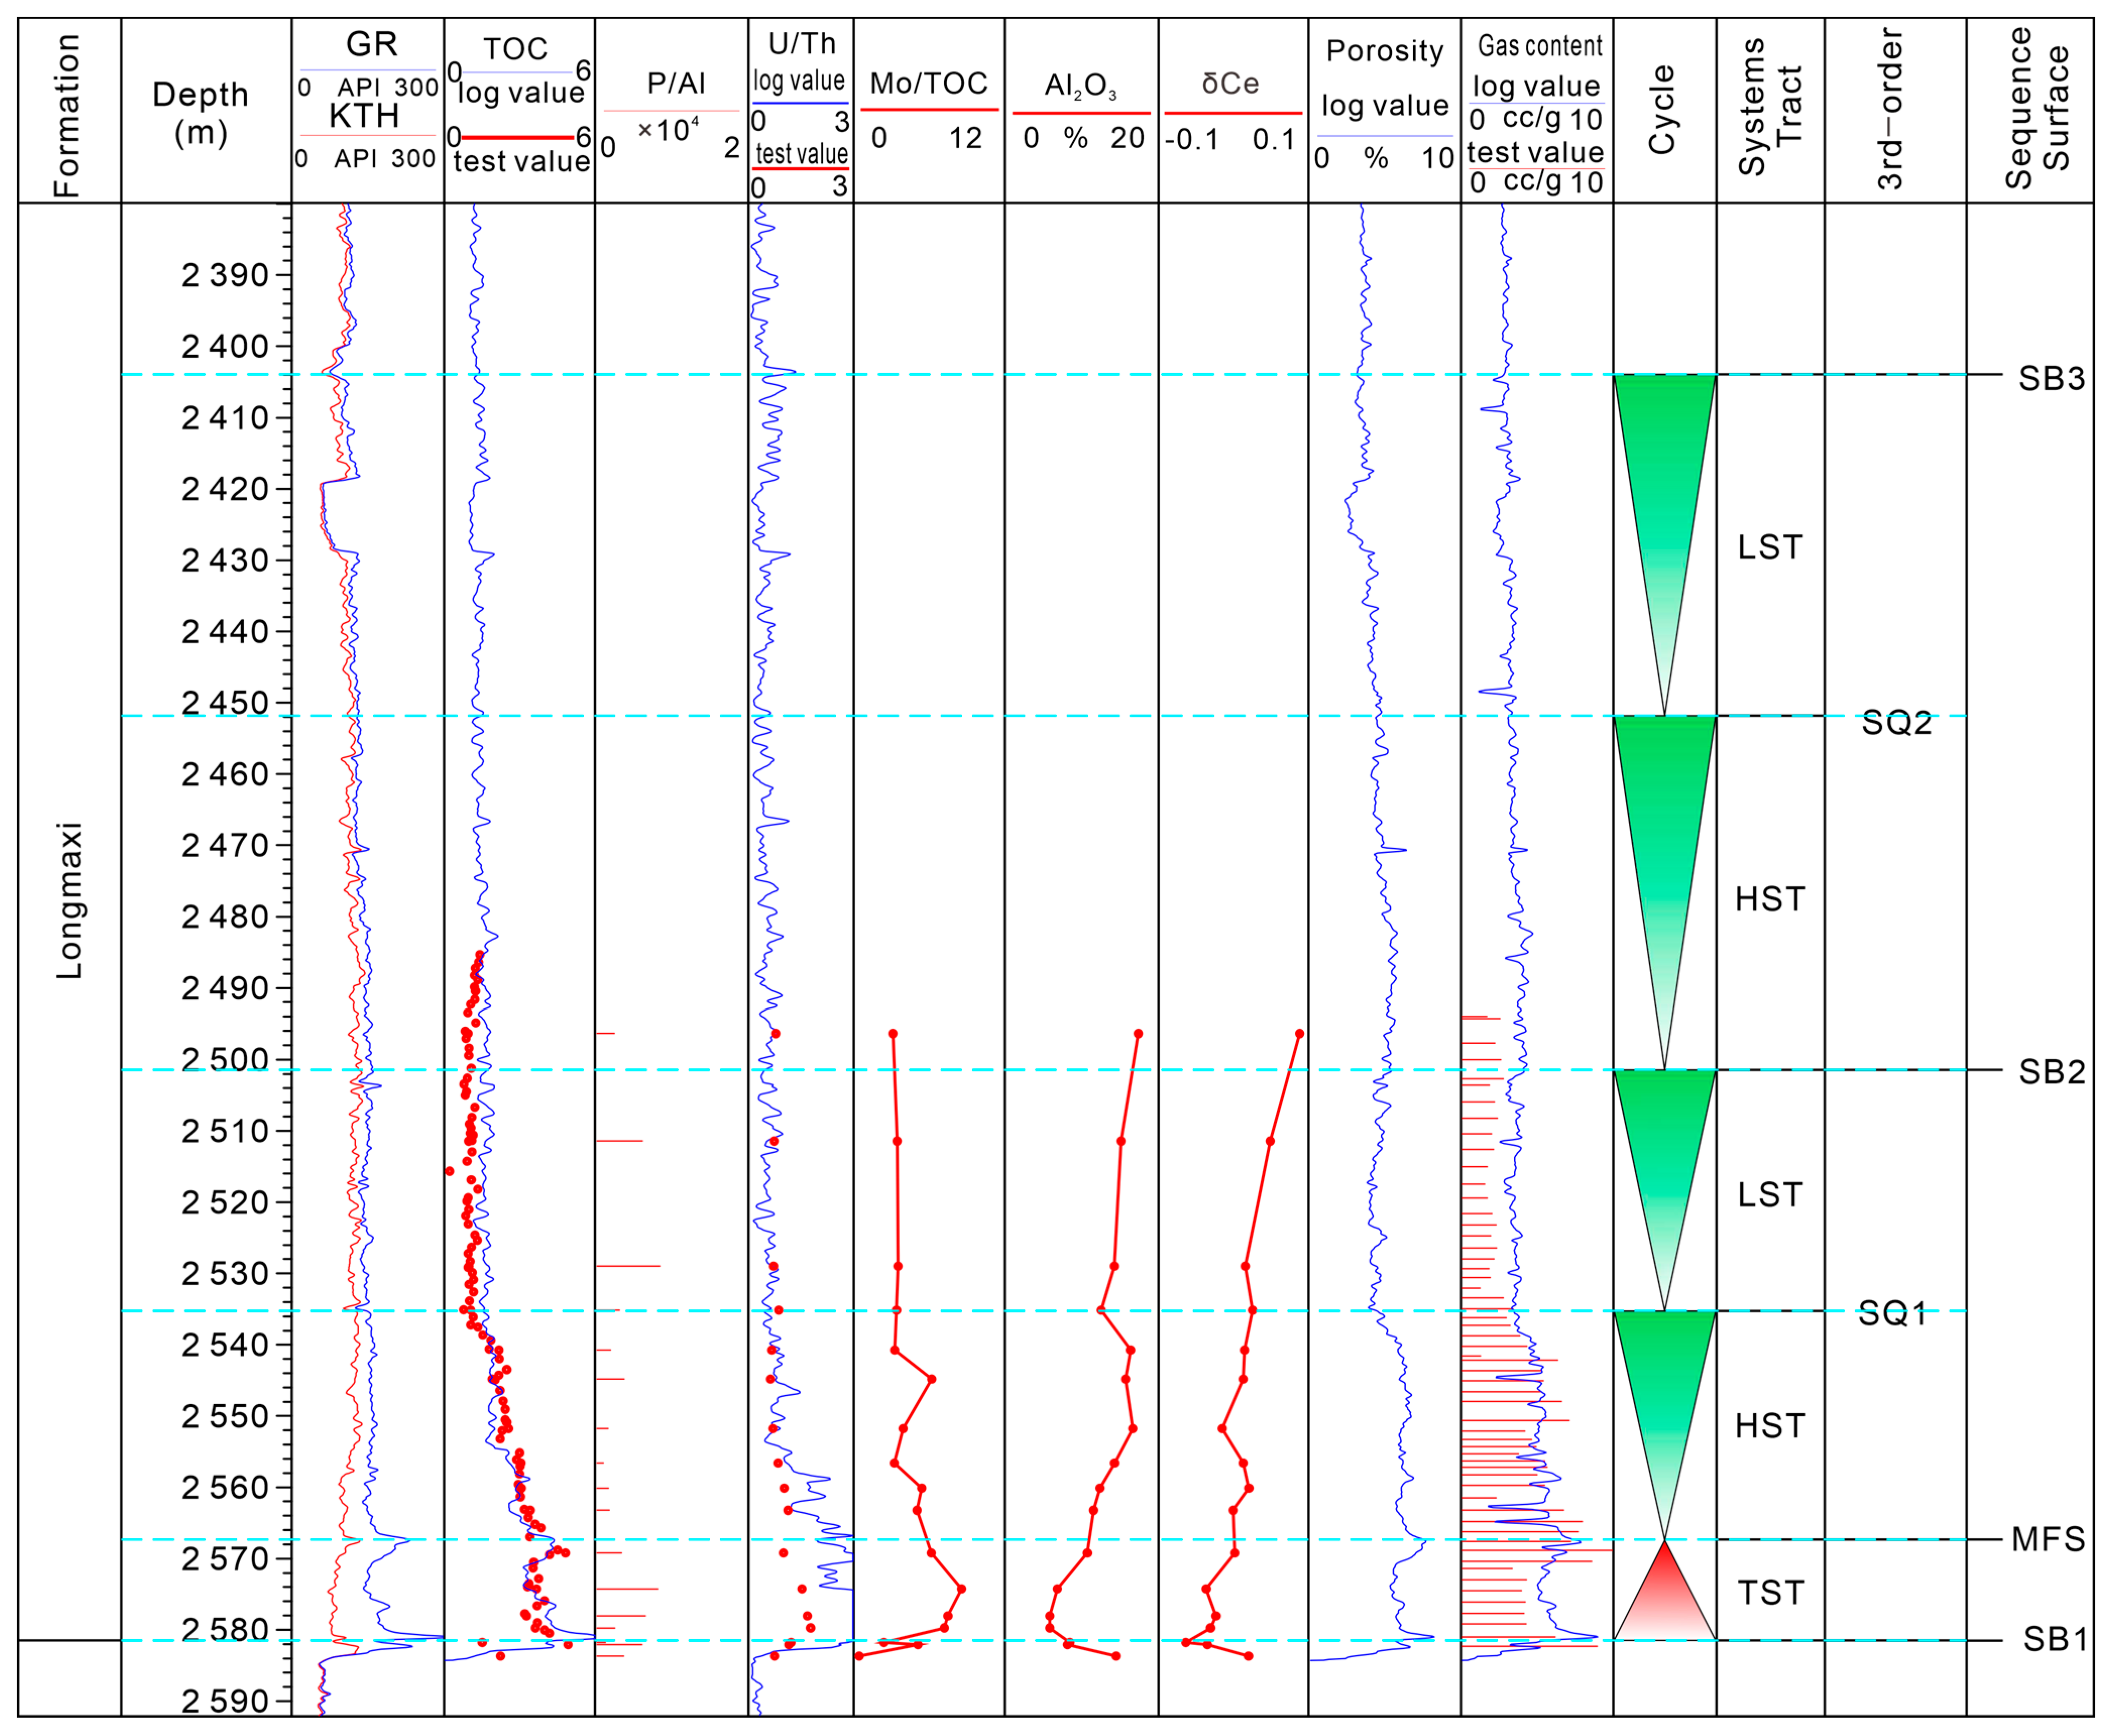
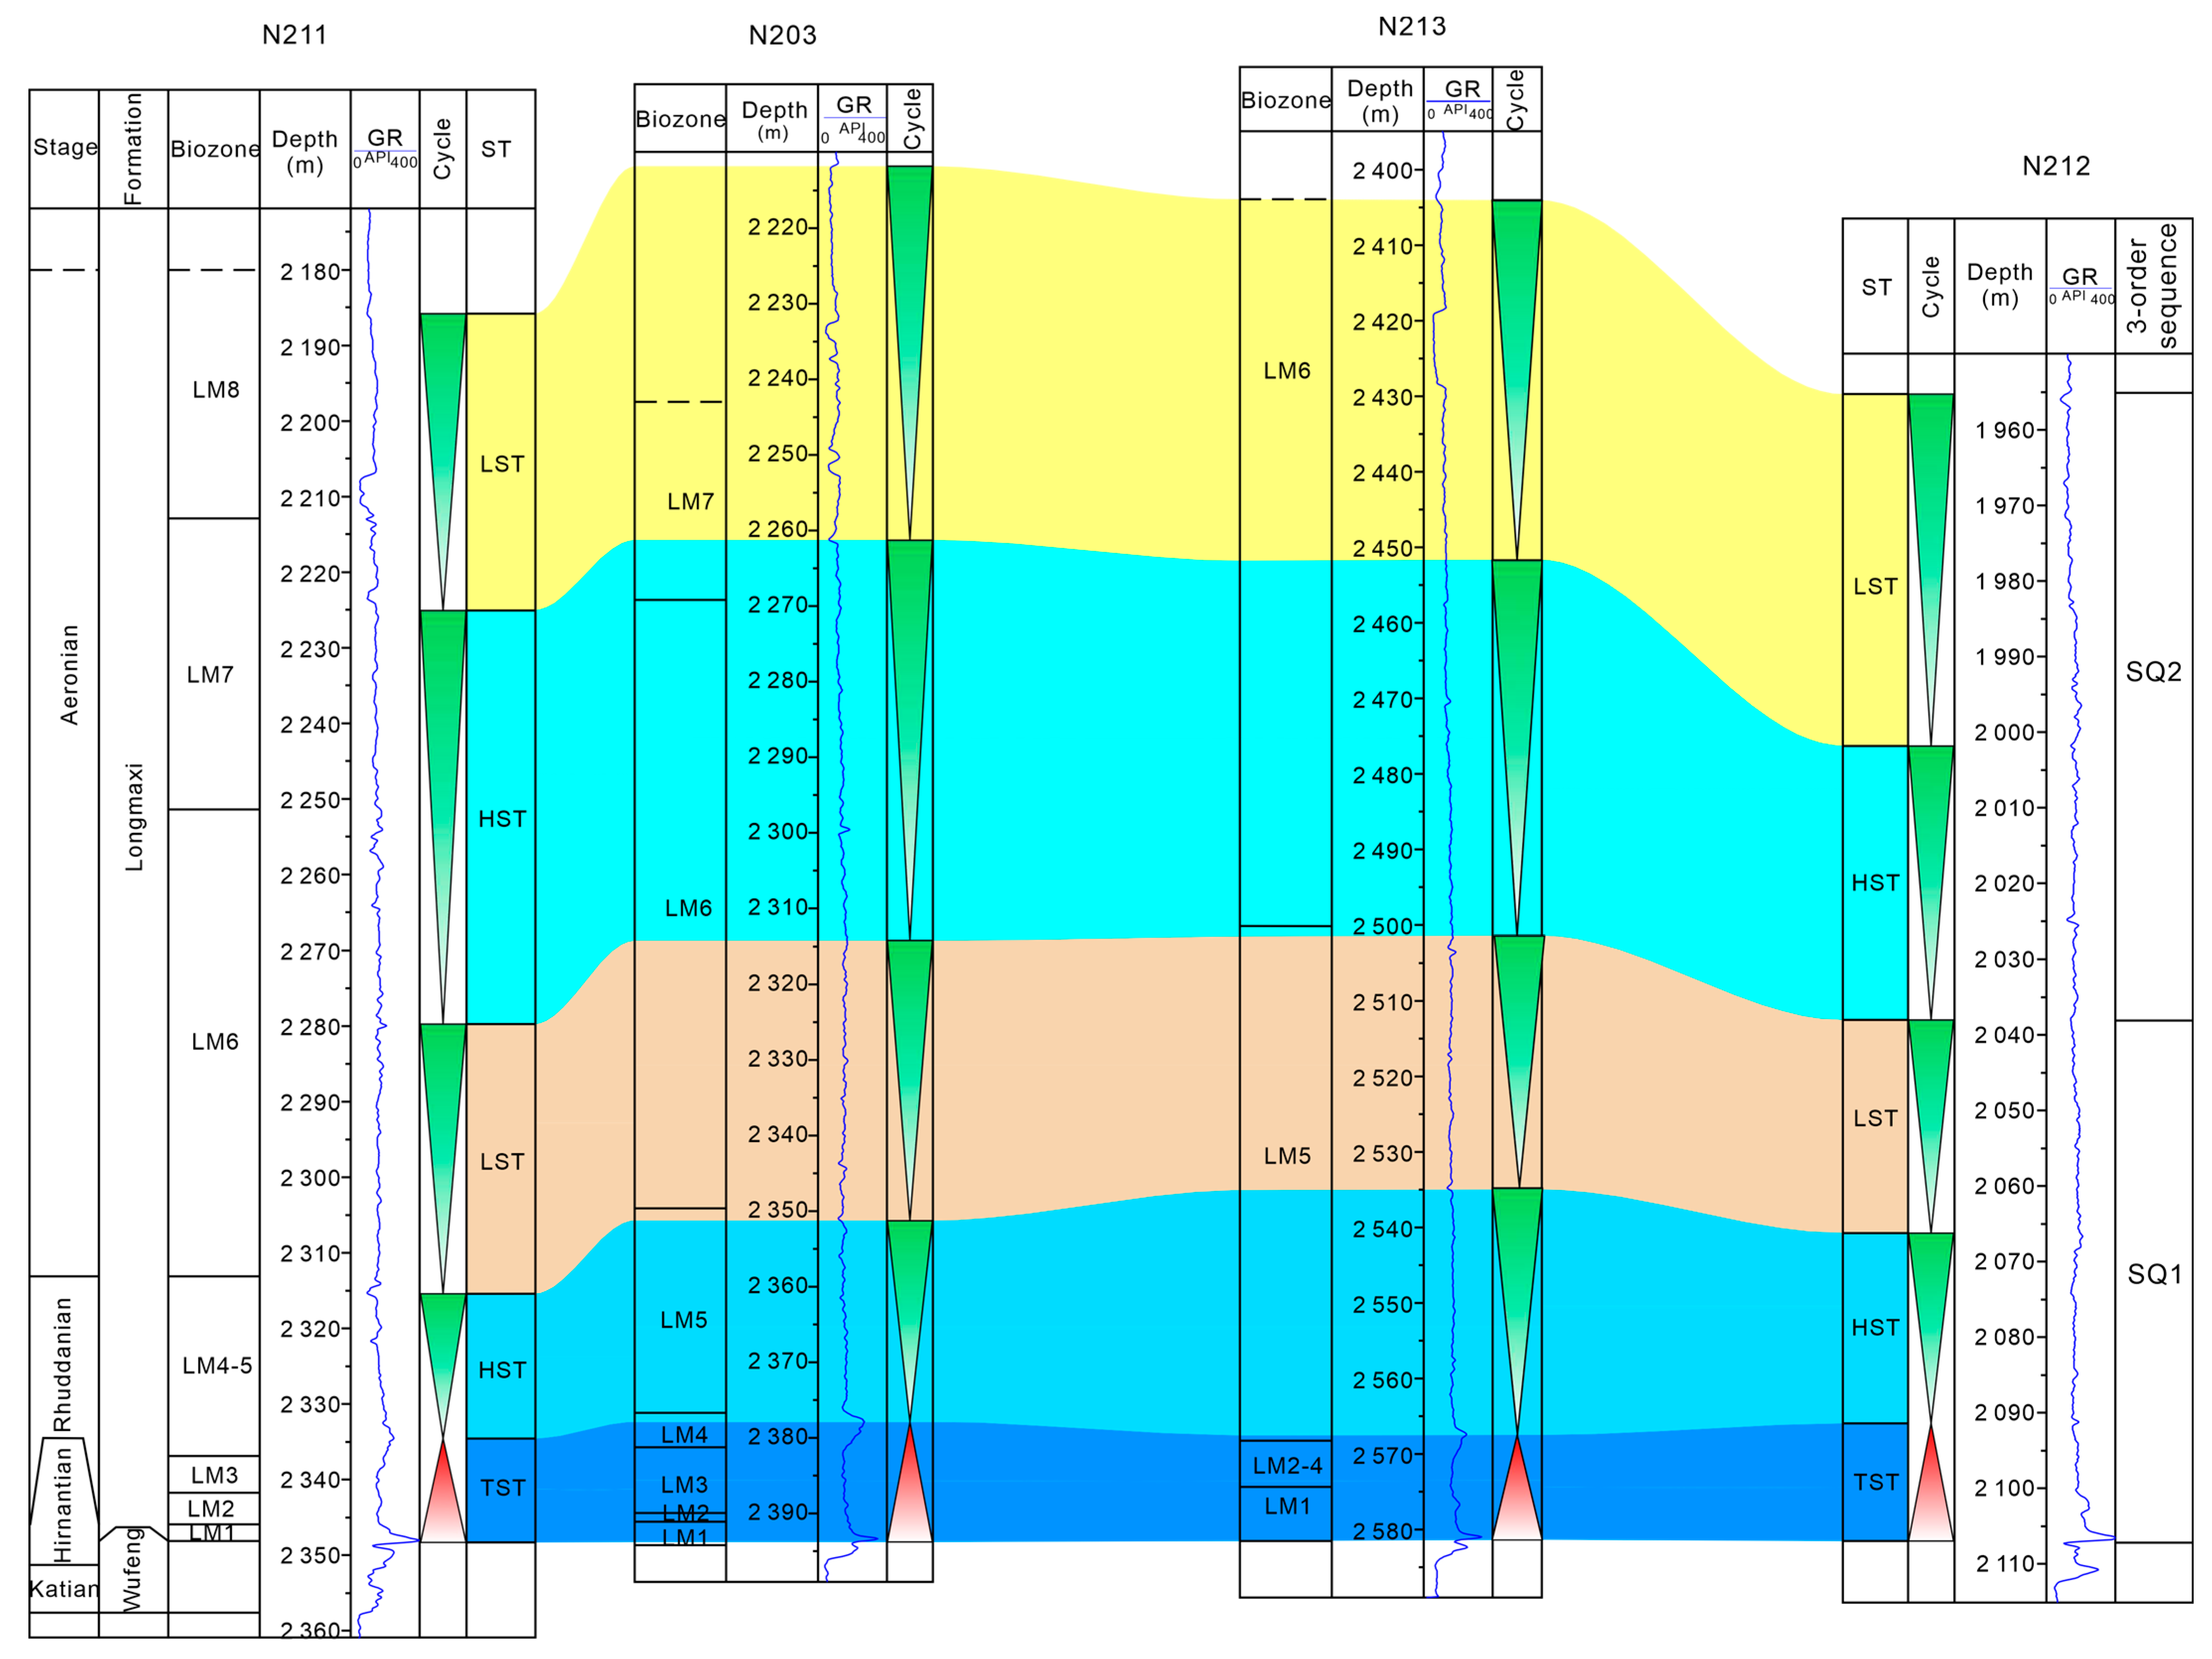
The systems tracts in this study are further subdivisions of third-order sequences, which can be recognized by their shapes based on GR logs and their positions within a eustatic cycle [9,18,22,56,57]. Taking the Y101H4-4 well as an example for the north area and N213 for the south area, the wireline logs and geochemical data within the sequences are illustrated in Figure 8 and Figure 9, respectively.
The TST of SQ1 represents the organic-rich siliceous shale at the bottom of the Longmaxi Formation, which was deposited from LM1 to LM5 (as shown in Figure 10, Figure 11 and Figure 12). This particular shale layer can be correlated with the global “hot shale” [67,68,69,70,71,72] formed during the worldwide transgressive period that resulted from the rapid melting of the Gondwana glacier. The wireline logs of TST in the entire study area exhibited high gamma response characteristics and ended at a maximum flooding surface (MFS), with a local maximum value in GR logs (Figure 8, Figure 9 and Figure 10). The transgression in the Changning area ended slightly earlier due to the uplift of the Qianzhong Paleo-uplift. In contrast, the transgression in the Luzhou and Weiyuan areas lasted until the Coronograptus cyphus (LM5) reached its maximum, submerging the submarine high in the Weiyuan area (Figure 10). However, there was consistency in the geochemical characteristics of the Changning and Luzhou regions (Figure 8 and Figure 9). These include:
  • high organic matter abundance with an average value of 3.78% in well N213 and 4.88% in well Y101H4-4;
  • strong paleo-productivity with a mean of P/Al of 0.51 × 10⁴ in well N213 and 138.47 × 10⁴ in well Y101H4-4;
  • weak oxidizing environment with a mean of U/Th 0.5 in well N213 and 1.12 in well Y101H4-4;
  • strong hydrographic restriction with the mean of Mo/TOC of 7.32 from well N213 and 6.23 from Y101H4-4;
  • low continental input for the Al2O3 content of 7.25% from N213 and 7.21% from Y101H4-4;
  • and high gas content with an average value of 5.65 cc/g from well N213 and 15.5 cc/g from Y101H4-4.
The HST of SQ1 was distinguished by the GR logs decreasing upwards, suggesting a decline in the relative sea level during this period. The HST’s sedimentation rate (corresponding to LM5 in geological time) began to accelerate (Table 1), leading to a significant increase in thickness and relatively low GR values throughout the study area with a clear funnel shape (Figure 8, Figure 9 and Figure 10). Subsequently, the HST was covered by the LST, which was deposited during the relative sea-level decline and comprised progradational sets of parasequences with “funnel” or “cylinder” shapes evident in GR logs. Both the HST and LST of SQ1 suffered from poor paleo-productivity and a worse preservation environment for organic matter than the TST in SQ1. Additionally, an increase in δCe denoted a decrease in relative sea level (Figure 8 and Figure 9).
The first systems tract of SQ2 was interpreted as a TST in the Weiyuan and Luzhou areas, but it was interpreted as an HST in the Changning area (Figure 8, Figure 9, Figure 10 and Figure 11). This systems tract corresponds to the middle part of the Longmaxi Formation. In the study area, the sedimentary thickness was large and decreased laterally towards the north (Figure 8, Figure 9, Figure 10 and Figure 11). However, there were significant differences in the stratigraphic stacking patterns deposited from SQ2 between the north and south of the study area. The GR logs of wells in the Weiyuan and Luzhou areas clearly exhibited bell-shaped or cylinder-shaped characteristics. Therefore, we interpret this rising gamma value segment as a TST (Figure 6, Figure 7 and Figure 8). On the contrary, the GR logs in the Changning region showed a funnel shape. Additionally, the GR logs decreased upwards (Figure 9). Thus, we interpret these strata as an HST. It is believed that the second systems tract of SQ2 in the study area exhibited a progradational pattern formed under the control of the global sea-level decline, as evidenced by the funnel-shaped GR logs. Consequently, we defined the second systems tract of SQ2 as an HST in the Weiyuan and Luzhou areas and a LST in the Changning area.

4.3. Spatial Thickness Distribution of Sequences

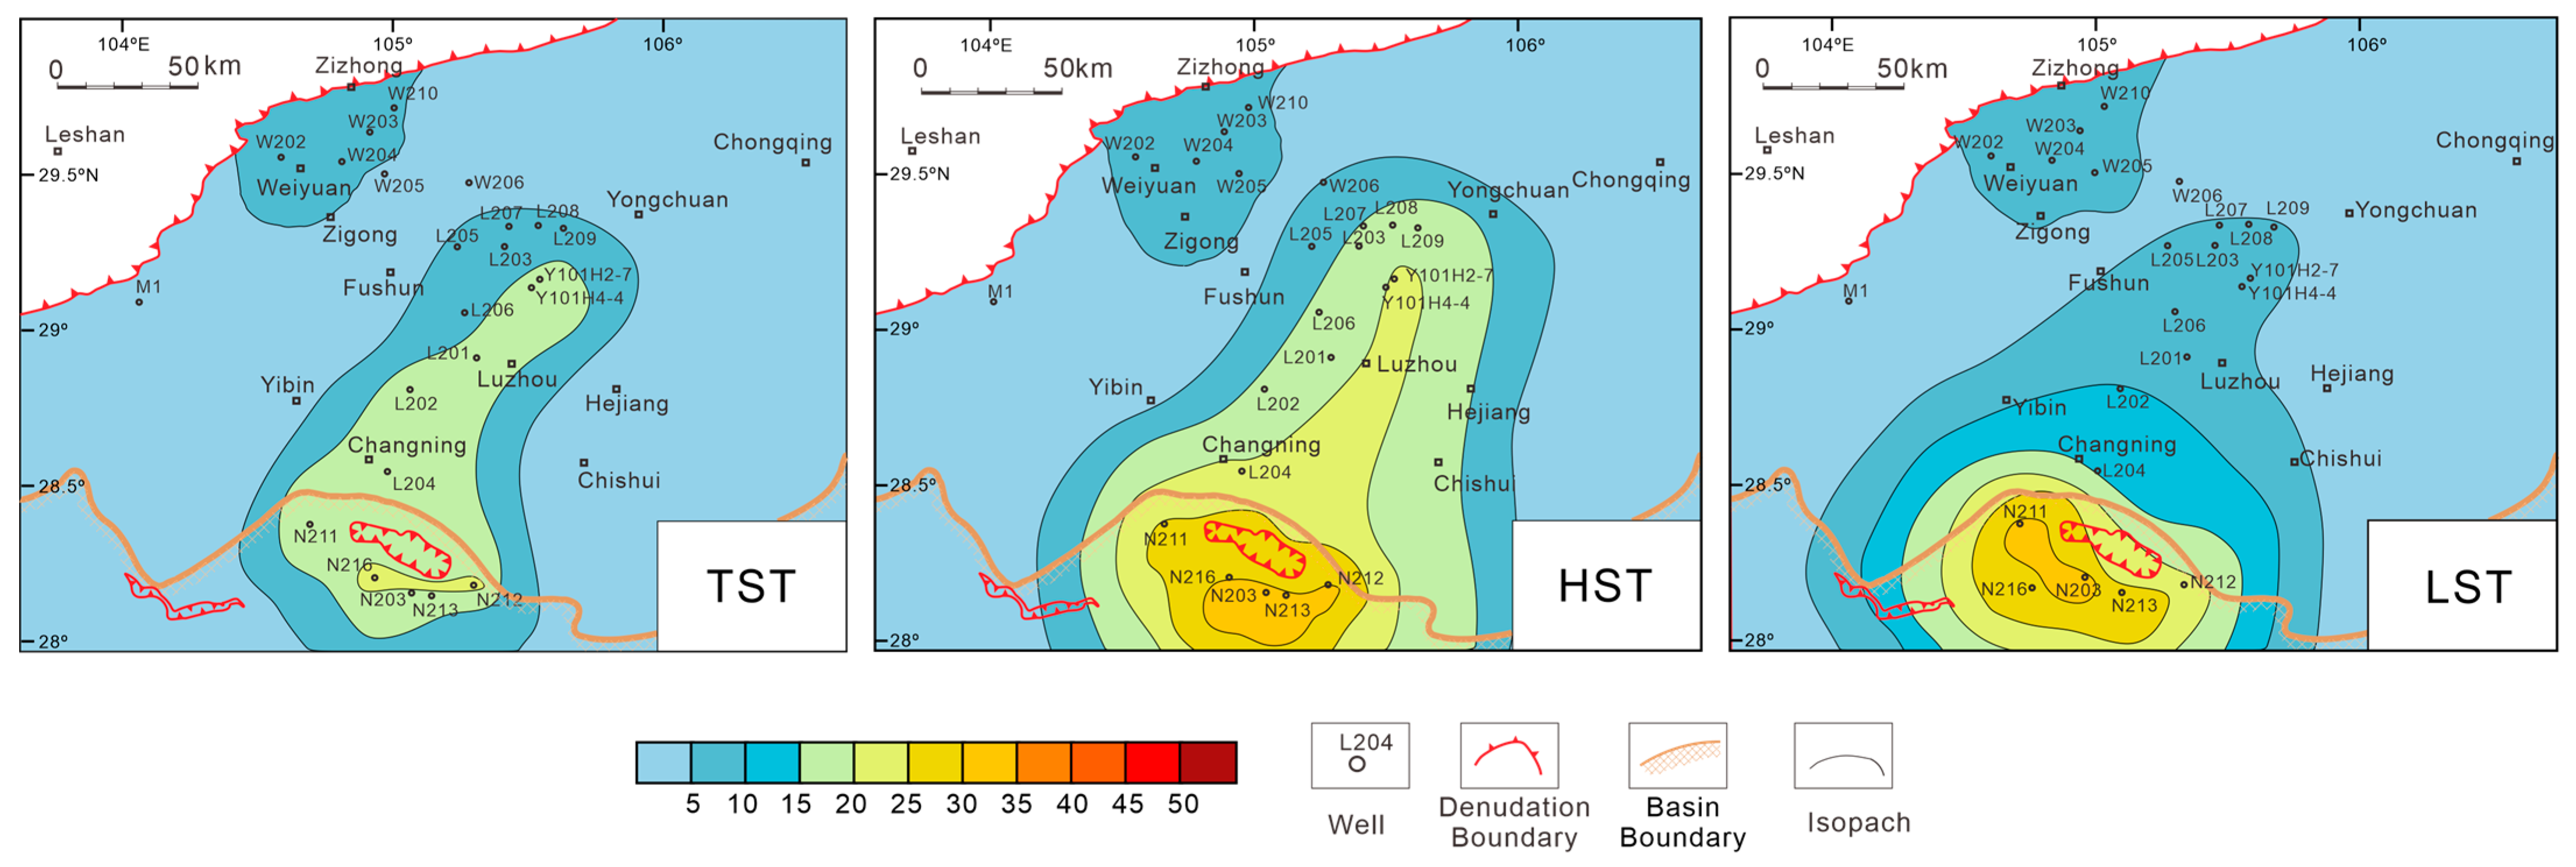
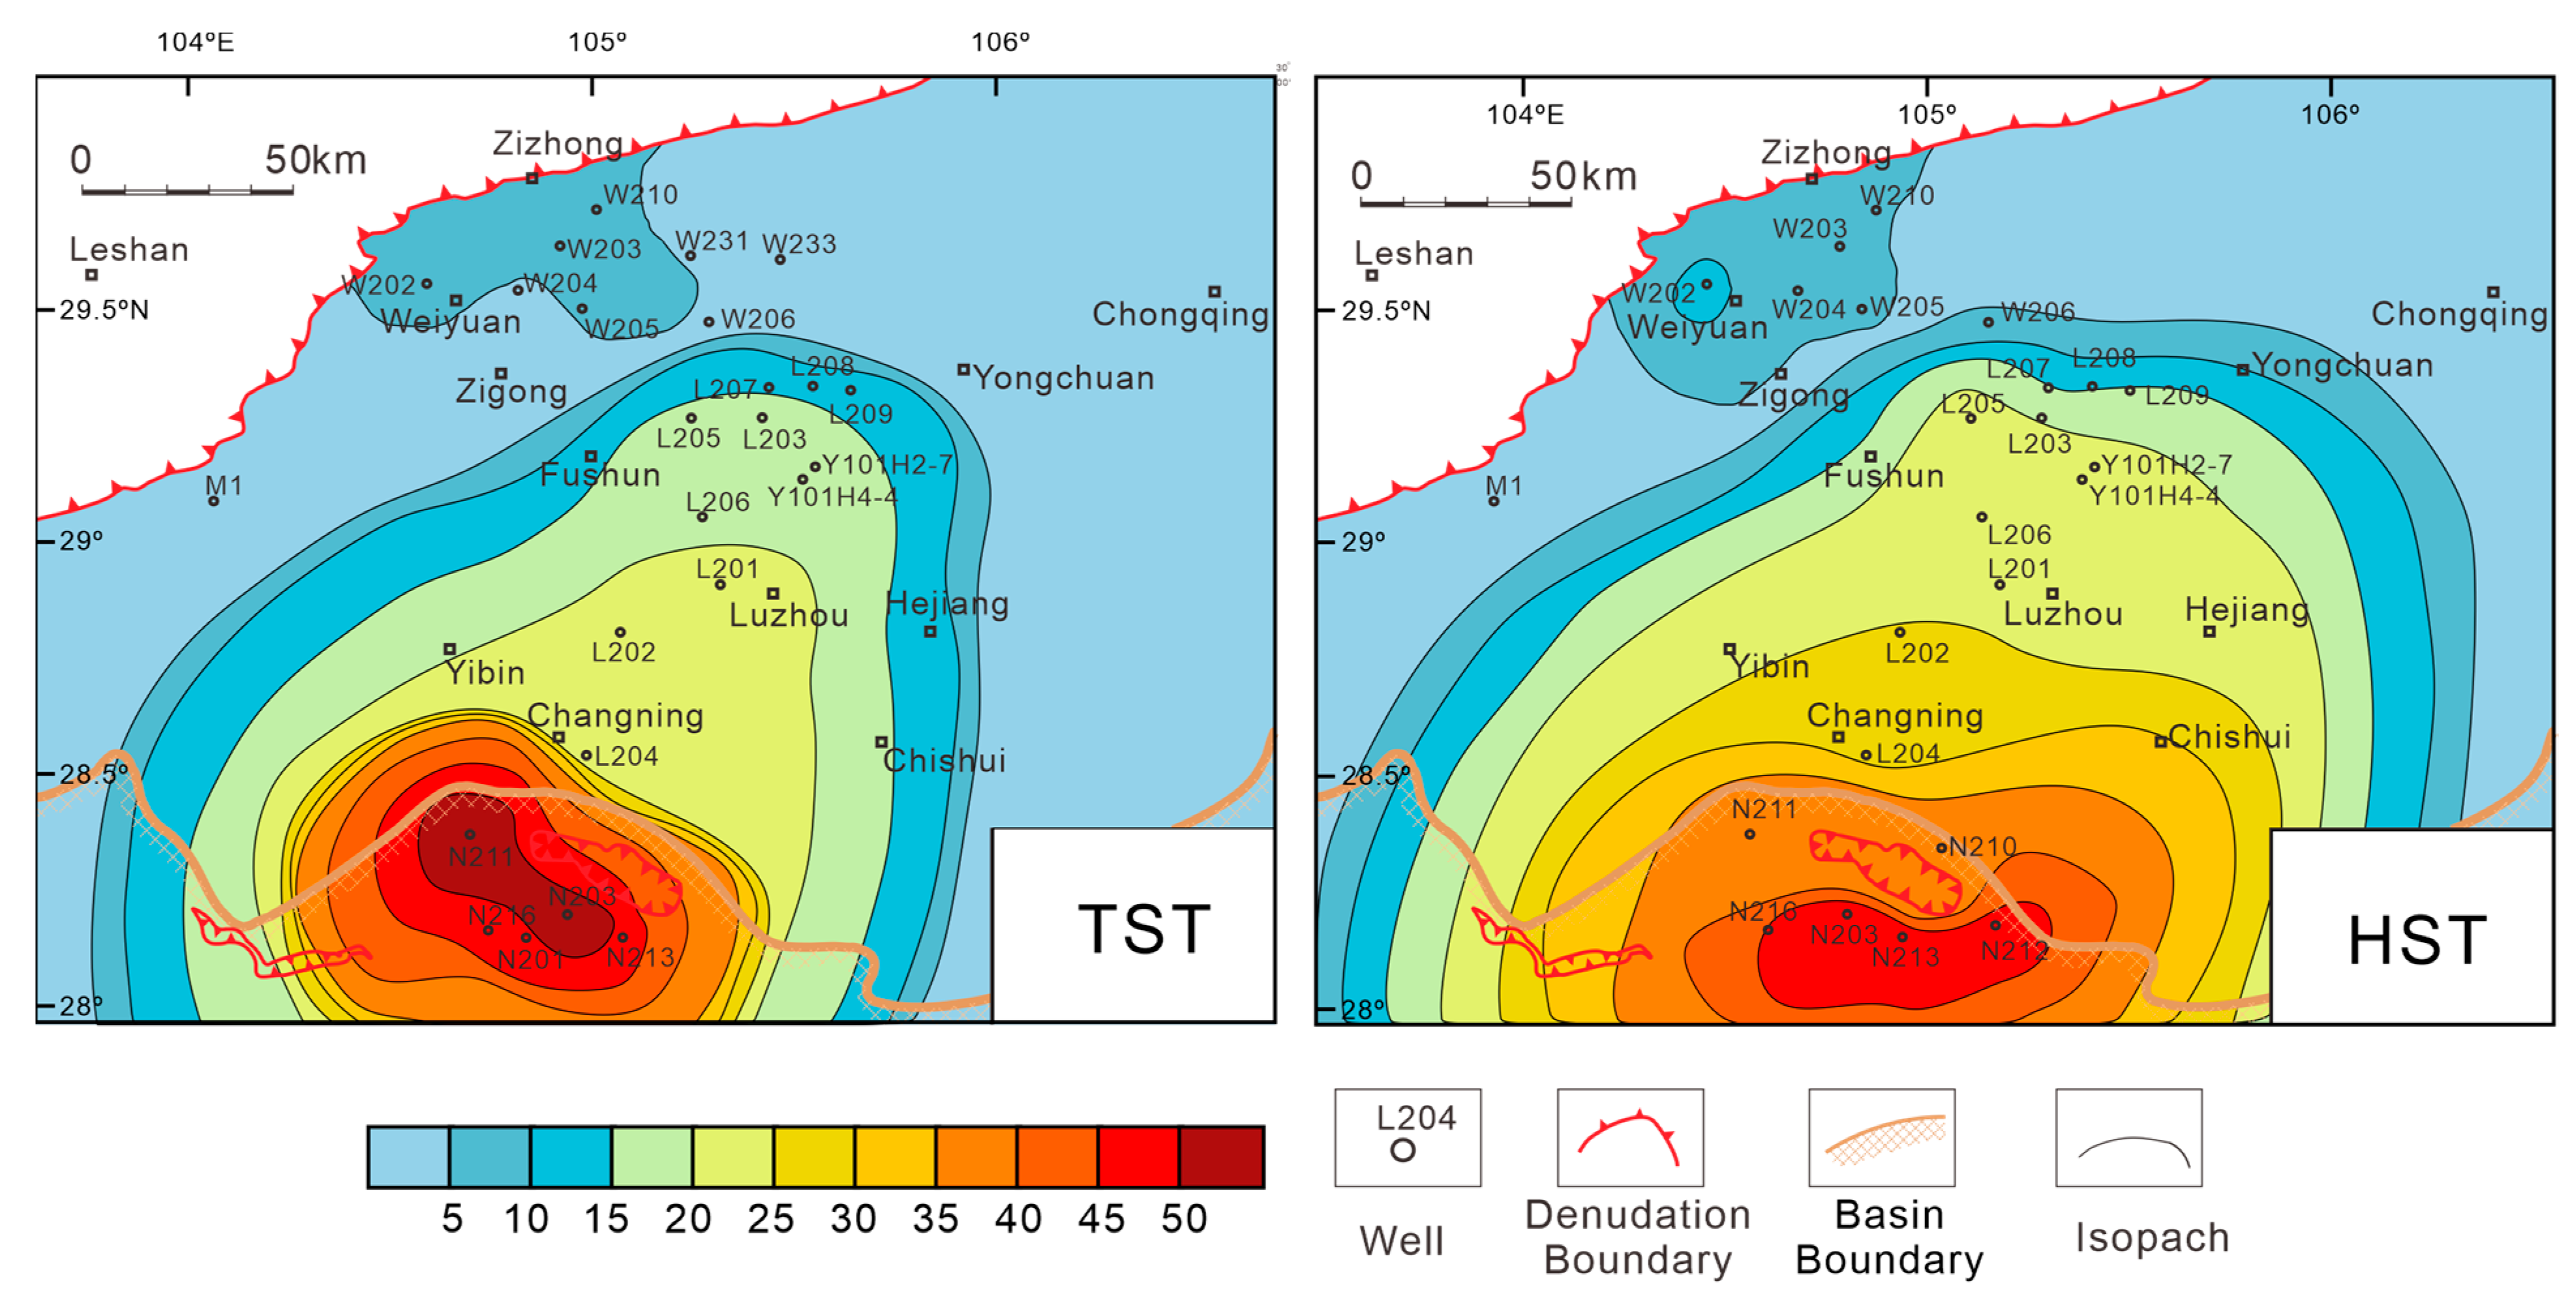
The connected well profiles and isopach maps of the system tracts can explain the spatial changes of the strata in both horizontal and vertical directions, providing a better understanding of how the South Sichuan Basin was filled with sediment and predicting favorable intervals in both directions. The connected well profiles are presented in Figure 8, Figure 9 and Figure 10, while the isopach maps are shown in Figure 11 and Figure 12.
During the deposition of the TST of SQ1, thick strata within the Upper Yangtze Plate formed two depocenters—one located in the Weiyuan area to the north and the other in the Changning area to the south (Figure 13). Research has revealed that the paleo-topography of the Weiyuan area contained a structure of landforms, including a ramp, a nose-shaped bulge, a platform, and a depocenter during the Late Ordovician to Early Silurian [21]. Differences in paleo-topography contributed to variations in the thickness of systems tracts, with thicker deposits found in the depocenter and thinner ones in other areas (see Figure 8 and Figure 11). The thickness of HST increased and expanded northward (Figure 13). While the thick strata of the LST of SQ1 in the Changning area have shrunk, those in the Weiyuan area have remained unchanged and were still controlled by paleo-topography (Figure 13). Additionally, the sedimentation rate accelerated during SQ2 deposition, resulting in a generally increased stratigraphic thickness, particularly in the Changning area (Figure 12). The maximum thickness of the HST of SQ2 is 54.7 m, with an average thickness of 48.3 m. As seawater recedes towards the northeast of the Sichuan Basin, the thick stratigraphic range of the entire southern Sichuan region expands (Figure 14).

5. Discussion

5.1. Sedimentary Evolution

We utilized the obtained results and published research to reconstruct the sedimentary history of the study area. During the Late Ordovician and Early Silurian periods, South China was located in the northern hemisphere at low latitudes [40]. The deposition of the sequence stratigraphy within the basin during this period was significantly affected by global sea-level changes, regional tectonic movements, sediment supply, and paleoclimate [1,29,30,31,32,33,34]. The evolution of the Lower Longmaxi Formation in southern Sichuan was closely related to geological events during this period and consisted of two depositional episodes (Figure 8, Figure 9 and Figure 10). The TST1 of SQ1 was triggered by deglaciation in the late Hirnantian, resulting in a rapid global sea level rise that led to a second mass extinction event [32,73,74]. This transgressive event can also be compared globally [32,75]. Due to the rapid rise in sea level caused by climate warming, a significant number of cold-water animals went extinct [75]. At the same time, TST1 began to form, and the sea level reached its maximum value in late LM4 (Figure 8, Figure 9 and Figure 10). This phase was marked by the development of organic-rich siliceous shale with high gamma values across the study area. As a result, the sea area of the Upper Yangtze expanded, depositing parts of the paleo-uplift in the Weiyuan area during LM4 (see Figure 8).
Since then, the global sea level has been declining. At the same time, the Leshan-Longnvsi Paleo-uplift, the Qianzhong Paleo-uplift, and the Jiangnan-Xuefeng Paleo-uplift have continued to uplift and expand into the basin. As a result of these uplifts, the area of the Upper Yangtze Sea has decreased. The strata of HST1 extended into the sea in a progradation pattern with an upward decreasing GR value. Throughout the LST1 sedimentation period, the gamma value remained consistently low and did not show significant changes. However, the center of subsidence had been moved from north to south, while the depocenter migrated from south to north (Figure 13). The first tectonic system of SQ2 differed between the Weiyuan and Changning areas, which was caused by regional compression in South China [1]. We speculate that there is a subsidence center located between the Weiyuan and Luzhou areas. The continuous subsidence of this center had led to a relative sea level rise in sea level in both areas with a characteristic increasing gamma value (Figure 8 and Figure 10). In the late period of TST2, it was believed that there was relatively strong volcanic activity [62] with thick bentonite deposits (as shown in Figure 7).
In contrast, the Changning region situated near the Qianzhong Paleo-uplift experienced a relative sea level decrease, owing to the continuous uplift of the Qianzhong Paleo-uplift. This process also caused an increase in sedimentary thickness in the Changning area due to increased terrestrial input. As a result, we can observe that the thickness of the first systems tract of SQ2 varies significantly along the north-south direction, increasing from less than 5 m in the northwest (Weiyuan) to more than 30 m thick in the south (Changning) (Figure 12). This change is particularly sharp in the southern well, Y101H4-4, which likely resulted from an increased sediment supply due to the rapid uplift of the Qianzhong Paleo-uplift [1]. Thence, the first systems tract of SQ2 in the Weiyuan and Luzhou areas were interpreted as a TST and as an HST in the Changning area. Note that the sedimentation rate in northwest Weiyuan is far lower than that in south Changning (Table 1), indicating increasing sediment input in Changning. The second systems tract of SQ2 was mainly influenced by the global sea level, and the whole Upper Yangtze area was uplifted. It was interpreted as an HST in the Weiyuan and Luzhou areas, considering the previous systems tract, and as an LST in the Changning area.

5.2. Specificity of Sedimentation in the Study Area

The sedimentary evolution of the study area during the Early Silurian exhibits unique characteristics. The stratigraphic sequence methods published so far have been mostly applied to passive continental margins, with little discussion on the sedimentation of epeiric seas affected by peripheral basin-mountain activities [76]. During the Early Silurian, the sedimentary filling evolution in the study area was not only related to the global sea level rise but also closely linked to regional tectonic activities [1,77]. As the Yangtze Plate experienced compression and internal deformation, the subsidence center continued to shift northward while the surrounding paleo-uplifts kept rising [77]. This resulted in an increase in the elevation of the strata near the Qianzhong Paleo-uplifts and the corresponding enhancement of sediment supply, leading to an increase in sediment thickness (Figure 9, Figure 12 and Figure 13). Some scholars have described this process as the gradual downward curvature of the Yangtze Platform from the southeast margin to the northwest, forming a deep-water foreland basin, and used the development characteristics of bentonite to explain the intensity of collisions and amalgamation between the Yangtze Plate and surrounding blocks [62,77].
The subsidence center and sedimentary center of the sedimentary basin are inconsistent and constantly changing, which is a unique feature of sedimentary evolution in the process of compression deformation within the plate in the study area. During the SQ1 sedimentary period, the sedimentation of the entire Upper Yangtze Sea was controlled by global sea level changes, forming two sedimentary centers near the ancient uplifts in the north and south (Figure 13 and Figure 14). However, during the SQ2 period, due to the compression deformation inside the Upper Yangtze Plate, the continuous uplift of the Central Guizhou ancient uplift moved northward to the subsidence centers of the Central Sichuan ancient uplift and the Central Guizhou ancient uplift, resulting in a relative sea level decrease in the Changning area near the Central Guizhou ancient uplift. However, the relative sea level of the Weiyuan and Luzhou areas in the north was rising, so the strata in the north and south appeared opposite of the superposition pattern (Figure 15), which also indicates that the developing foreland basin was controlled by peripheral orogeny and intraplate compression [77]. The stratigraphic superposition pattern in different areas of the entire sedimentary basin is not necessarily the same at the same time, which also profoundly affects later oil and gas exploration. The inconsistency and continual change between the subsidence center and depocenter in the Sichuan basins is a characteristic feature of sedimentary filling evolution during the intraplate compression and deformation processes within the study area. During the deposition of the SQ1, sequence stratigraphy in the entire Upper Yangtze Sea was controlled by global sea level changes, resulting in the formation of two sedimentation centers located near the paleo-uplifts in the north and south. However, during the deposition of the SQ2, due to intraplate compression and deformation within the Upper Yangtze Plate, the continued uplift of the Qianzhong Paleo-uplift caused the subsidence center between the Leshan-Longnvsi Paleo-uplift and Qianzhong Paleo-uplift to move northward. This led to a relative drop in sea level in the Changning area near the Qianzhong Paleo-uplift, while the Weiyuan and Luzhou areas to the north experienced a relative sea level rise. As a result, the stratigraphic stacking pattern in the northern and southern regions showed the opposite trend. At the same time, the sedimentation rate accelerated in the Changning area (Table 1). This also indicates that for foreland basins developed under the influence of peripheral orogeny and intraplate compression, the stratigraphic stacking pattern in different regions of the sedimentary basin during the same period may not be consistent, which profoundly affects later oil and gas exploration efforts.

5.3. Implications for Shale Gas Exploration

Sequence stratigraphy plays an important role in hydrocarbon evaluation and prediction [1,8,16,58]. Published research has pointed out that the TST is a favorable interval for shale gas [1,30]. This is because TST has a high reducing sedimentary environment, high paleo-productivity, and a sedimentary rate that is favorable for the preservation of organic matter. Therefore, the shale gas exploration potential is also evaluated for TSTs in this paper. The first TST of the Longmaxi Formation has been discussed by numerous publications and proved by the producing wells [16]. The GR values and geochemistry data presented in this paper also support the idea that the first TST of SQ1 is the most promising for shale gas (Figure 7). However, we would like to emphasize the second TST of the Lower Longmaxi Formation, which is referred to as TST2 in the Luzhou and Weiyuan areas for SQ2. Testing data (TOC, P/Al, U/Th, Mo/Toc, porosity, and gas content) from TST2 show that this interval will be the next target for shale gas development in the Luzhou area [2], but there is no shale gas exploration potential in the Changning area (Figure 9). There are also literature explanations for the high paleo-productivity of TST2, stating that the high paleo-productivity of this segment is caused by rising ocean currents [78]. Our research results indicate two favorable intervals for shale gas in the southern Sichuan Basin. The first interval is the black shale deposited throughout the region during the global sea level rise. The second interval is the silty shale deposited in the Weiyuan sag and Luzhou area due to the strong uplift of the Qianzhong Paleo-uplift and compression of the interior of the upper Yangtze Plate, resulting in a subsidence center moving northward.

6. Conclusions

This article presents a series of studies on the sequence stratigraphy, systems tracts, and shale gas exploration potential of the Lower Longmaxi Formation in the southern Sichuan Basin. These studies were conducted through core observation, analysis of wireline logs, description of field sections, as well as interpretation of 3D seismic profiles. The key results that have been identified are as follows.
Based on the sudden logging change, core lithology alteration, and geochemical indicator modification, two third-order sedimentary cycles have been identified. The first cycle showcases a consistent change in the relative sea level of southern Sichuan, while the second cycle differs due to tectonic activity.
The primary cause for the difference in the second sedimentary cycle is the northward displacement of the subsidence center between the ancient lands of central Guizhou and central Sichuan. As the central Guizhou ancient land underwent an uplift, it created an increase in northern accommodation space and a decrease in southern accommodation space. This resulted in a stratigraphic stacking pattern of one advance and one retreat.
By analyzing the sedimentary evolution of the Lower Longmaxi Formation in southern Sichuan, combined with geochemical and logging response characteristics, it can be concluded that the first TST has the best shale gas exploration potential. In addition, for the Weiyuan and Luzhou areas, the second TST also has good shale gas exploration potential.
It should be noted that the data used in this study were primarily obtained from deep water, with limited input from wells in the southern regions of the basin, particularly those located near the basin edge. Therefore, we were unable to observe the presence of onlap in seismic profiles. The stacking patterns of strata were inferred based on the response characteristics of logging curves, which carry a degree of uncertainty. It is necessary to verify the filling model of the basin with wells located closer to the sedimentary basin in the future.

Author Contributions

Conceptualization, L.X. and R.P.; methodology, J.M.; software, B.Z.; validation, Q.S.; investigation, X.Y.; writing—original draft preparation, L.X.; writing—review and editing, J.M. All authors have read and agreed to the published version of the manuscript.

Funding

This research was funded by the National Natural Science Foundation of China (Grant No. 41472123) and the National Natural Science Foundation of China Youth Fund (Gran No. 41402114).

Institutional Review Board Statement

Not applicable.

Informed Consent Statement

Not applicable.

Acknowledgments

The authors would like to thank PetroChina Southwest Oil & Gas field Company for providing core samples and dataset that used in this paper. The authors also want to express gratitude to Zhu (Yiqing Zhu) and Shi (Xuewen Shi) at PetroChina Southwest Oil & Gasfield Company for their provided constructive suggestions to improve this work. In particular, we would like to thank the anonymous reviewers for their patient review and insightful comments. We are also grateful to Academic Editor George Kontakiotis for the valuable comments that greatly improved the original manuscript.

Conflicts of Interest

The authors declare no conflict of interest.

References

  1. Chen, L.; Lu, Y.; Jiang, S.; Li, J.; Guo, T.; Luo, C.; Xing, F. Sequence stratigraphy and its application in marine shale gas exploration: A case study of the Lower Silurian Longmaxi Formation in the Jiaoshiba shale gas field and its adjacent area in southeast Sichuan Basin, SW China. J. Nat. Gas Sci. Eng. 2015, 27, 410–423. [Google Scholar] [CrossRef]
  2. Yang, H.; Zhao, S.; Liu, Y.; Wu, W.; Xia, Z.; Wu, T.; Luo, C.; Fan, T.; Yu, L. Main controlling factors of enrichment and high-yield of deep shale gas in the Luzhou Block, southern Sichuan Basin. Nat. Gas. Ind. 2019, 39, 55–63. [Google Scholar]
  3. Ma, X.; Xie, J.; Yong, R.; Zhu, Y. Geological characteristics and high production control factors of shale gas reservoirs in Silurian Longmaxi Formation, southern Sichuan Basin, SW China. Pet. Explor. Dev. 2020, 47, 901–915. [Google Scholar] [CrossRef]
  4. Ma, X. Enrichment laws and scale effective development of shale gas in the southern Sichuan Basin. Nat. Gas. Ind. B 2019, 6, 240–249. [Google Scholar] [CrossRef]
  5. Mahjour, S.K.; Al-Askari, M.K.G.; Masihi, M. Identification of flow units using methods of Testerman statistical zonation, flow zone index, and cluster analysis in Tabnaak gas field. J. Petrol. Explor. Prod. Technol. 2016, 6, 577–592. [Google Scholar] [CrossRef] [Green Version]
  6. Ahmadi, S.; Motie, M.; Soltanmohammadi, R. Proposing a modified mechanism for determination of hydrocarbons dynamic viscosity, using artificial neural network. Pet. Sci. Technol. 2020, 38, 699–705. [Google Scholar] [CrossRef]
  7. Motie, M.; Bemani, A.; Soltanmohammadi, R. On the estimation of phase behavior of CO2-based binary systems using ANFIS optimized by GA algorithm. In Fifth CO2 Geological Storage Workshop; European Association of Geoscientists & Engineers: Utrecht, The Netherlands, 2018; Volume 1, pp. 1–5. [Google Scholar]
  8. Nadjafi, M.; Mahboubi, A.; Moussavi-Harami, R.; Mirzaee, R. Depositional history and sequence stratigraphy of outcropping Tertiary carbonates in the Jahrum and Asmari formations, Shiraz area (SW Iran). J. Pet. Geol. 2004, 27, 179–190. [Google Scholar] [CrossRef]
  9. Catuneanu, O. Principles of Sequence Stratigraphy; Elsevier: Amsterdam, The Netherlands, 2006; 375p. [Google Scholar]
  10. Lash, G.G.; Engelder, T. Thickness trends and sequence stratigraphy of the Middle Devonian Marcellus Formation, Appalachian Basin: Implications for Acadian foreland basin evolution. AAPG Bull. 2011, 95, 61–103. [Google Scholar] [CrossRef]
  11. Slatt, R.M.; Rodriguez, N.D. Comparative sequence stratigraphy and organic geochemistry of gas shales: Commonality or coincidence? J. Nat. Gas Sci. Eng. 2012, 8, 68–84. [Google Scholar] [CrossRef]
  12. Wang, T.; Yang, K.; Xiong, L.; Shi, H.; Zhang, Q.; Wei, L.; He, X. Shale sequence stratigraphy of Wufeng-Longmaxi Formation in southern Sichuan and their control on reservoirs. Acta Pet. Sin. 2015, 36, 915–925. [Google Scholar]
  13. Wang, Y.; Dong, D.; Li, X.; Huang, J.; Wang, S.; Wu, W. Stratigraphic sequence and sedimentary characteristics of Lower Silurian Longmaxi Formation in Sichuan Basin and its peripheral areas. Nat. Gas. Ind. B 2015, 2, 222–232. [Google Scholar] [CrossRef] [Green Version]
  14. Guo, X. Sequence stratigraphy and evolution model of the Wufeng-Longmaxi shale in the Upper Yangtze area. Earth Sci. 2017, 2, 1069–1082. [Google Scholar]
  15. Wang, G.; Zhu, T.; Wang, H.; Wu, J.; Du, W.; Feng, D.; Wang, R. Integrated sequence stratigraphic division and vertical distribution characteristics of marine shale: A case study of the Wufeng Formation-Longmaxi Formation in southeastern Sichuan Basin. Acta Sedimentol. Sin. 2019, 37, 330–344. [Google Scholar]
  16. Zhu, Y.; Chen, G.; Liu, Y.; Shi, X.; Wu, W.; Luo, C.; Yang, X.; Yang, Y.; Zou, Y. Sequence stratigraphy and lithofacies paleogeographic evolution of Katian Stage—Aeronian Stage in southern Sichuan Basin, SW China. Pet. Explor. Dev. 2021, 48, 1126–1138. [Google Scholar] [CrossRef]
  17. Cai, Q.; Hu, M.; Kane, Q.I.; Li, M.; Zhang, B.; Hu, Z.; Deng, Q.; Xing, N. Cyclic variations in paleoenvironment and organic matter accumulation of the Upper Ordovician-Lower Silurian black shale in the Middle Yangtze Region, South China: Implications for tectonic setting, paleoclimate, and sea-level change. Mar. Pet. Geol. 2022, 136, 105777. [Google Scholar] [CrossRef]
  18. Catuneanu, O.; Kendall, C.; Posamentier, H. Sequence Stratigraphy: Methodology and Nomenclature. Newsl. Stratigr. 2011, 44, 173–245. [Google Scholar] [CrossRef] [Green Version]
  19. Huang, H.; He, D.; Li, Y.; Li, J.; Zhang, L. Silurian tectonic-sedimentary setting and basin evolution in the Sichuan area, southwest China: Implications for palaeogeographic reconstructions. Mar. Pet. Geol. 2018, 92, 403–423. [Google Scholar] [CrossRef]
  20. Yin, F.; Xu, X.; Wan, F.; Chen, M. Characteristic of sequence and stratigraphical division in evolution of Upper Yangtze region during Caledonian. J. Stratigr. 2002, 26, 315–319. [Google Scholar]
  21. Shi, Z.; Wang, H.; Lin, C.; Sun, S.; Jin, H.; Hao, C.; Chen, S.; Zhang, R. Paleotopography of Weiyuan-Zigong area in Wufengian-Lungmachian Stages (Ordovician-Silurian transition) and its effect on the quality of shale gas reservoir. J. Stratigra. 2020, 44, 163–173. [Google Scholar]
  22. Van Wagoner, J.C.; Mitchum, R.M.; Campion, K.M.; Rahmanian, V.D. Siliciclastic Sequence Stratigraphy in Well Logs, Core, and Outcrops: Concepts for High-Resolution Correlation of Time and Facies. In American Association of Petroleum Geologists Methods in Exploration Series; AAPG: Tulsa, OK, USA, 1990; 55p. [Google Scholar]
  23. Carter, R.M.; Fulthorpe, C.S.; Naish, T.R. Sequence concepts at seismic and outcrop scale: The distinction between physical and conceptual stratigraphic surfaces. Sediment. Geol. 1998, 122, 165–179. [Google Scholar] [CrossRef]
  24. Algeo, T.J.; Schwwark, L.; Hoer, J.C. High-resolution geochemistry and sequence stratigraphy of the Hushpuchney Shale (Swope Formation, Eastern Kansas): Implications for climato-environmental dynamics of the Late Pennsylvanian Midcontinent Seaway. Chem. Geol. 2004, 206, 259–288. [Google Scholar] [CrossRef]
  25. Ver Straeten, C.A.; Brett, C.E.; Sageman, B.B. Mudrock sequence stratigraphy: A multi-proxy (sedimentological, paleobiological and geochemical) approach, Devonian Appalachian Basin. Palaeogeogr. Palaeoclimatol. Palaeoecol. 2011, 304, 54–73. [Google Scholar] [CrossRef]
  26. Abouelresh, M.O.; Slatt, R.M. Lithofacies and sequence stratigraphy of the Barnett Shale in east central Fort Worth Basin, Texas. AAPG Bull. 2012, 96, 1–22. [Google Scholar] [CrossRef]
  27. Lagrange, M.T.; Konhauser, K.O.; Catuneanu, O.; Harris, B.S.; Playter, T.L.; Gingras, M.K. Sequence stratigraphy in organic-rich marine mudstone successions using chemostratigraphic datasets. Earth Sci. Rev. 2020, 203, 103137. [Google Scholar] [CrossRef]
  28. Liu, S.; Yang, Y.; Deng, B.; Zhong, Y.; Wen, L.; Sun, W.; Li, Z.; Jansa, L.; Li, J.; Song, J.; et al. Tectonic evolution of the Sichuan basin, southwest China. Earth Sci. Rev. 2021, 213, 103470. [Google Scholar] [CrossRef]
  29. He, D.; Li, D.; Zhang, G.; Zhao, L.; Fan, C.; Lu, R.; Wen, Z. Formation and evolution of multi-cycle superposed Sichuan Basin, China. Sci. Geol. Sin. 2011, 46, 589–606. [Google Scholar]
  30. Lüning, S.; Craig, J.; Loydell, D.K.; Štorch, P.; Fitches, B. Lower Silurian ‘hot shales’ in North Africa and Arabia: Regional distribution and depositional model. Earth Sci. Rev. 2000, 49, 121–200. [Google Scholar] [CrossRef]
  31. Feng, H.; Erdtmann, B.D.; Wang, H. Early Paleozoic whole-rock Ce anomalies and secular eustatic changes in the Upper Yangtze region. China Earth Sci. 2000, 3, 328–336. [Google Scholar] [CrossRef]
  32. Loydell, D.K.; Butcher, A.; Frýda, J. The middle Rhuddanian (lower Silurian) ‘hot’ shale of North Africa and Arabia: An atypical hydrocarbon source rock. Palaeogeogr. Palaeoclimatol. Palaeoecol. 2013, 386, 233–256. [Google Scholar] [CrossRef]
  33. Yan, D.; Chen, D.; Wang, Q.; Wang, J. Large-scale climatic fluctuations in the latest Ordovician on the Yangtze block, south China. Geology 2010, 38, 599–602. [Google Scholar] [CrossRef]
  34. Finnegan, S.; Bergmann, K.; Eiler, J.M.; Jones, D.S.; Fike, D.A.; Eisenman, I.; Hughes, N.C.; Tripati, A.K.; Fischer, W.W. The magnitude and duration of Late Ordovician–Early Silurian glaciation. Science 2011, 331, 903–906. [Google Scholar] [CrossRef] [Green Version]
  35. Liang, D.G.; Guo, T.L.; Bian, L.Z.; Chen, J.P.; Zhao, Z. Some progress on studies of hydrocarbon generation and accumulation in marine sedimentary regions, Southern China (part 3): Controlling factors on the sedimentary facies and development of Palaeozoic marine source rocks. Mar. Orig. Pet. Geol. 2009, 14, 1–19. [Google Scholar]
  36. Zeng, X.L.; Liu, S.G.; Huang, W.M.; Zhang, C.J. Comparison of Silurian Longmaxi Formation shale of Sichuan Basin in China and Carboniferous Barnett Formation shale of Fort Worth Basin in United States. Geol. Bull. China 2011, 30, 372–384. [Google Scholar]
  37. Chen, X.; Rong, J.; Li, Y.; Boucot, A.J. Facies patterns and geography of the Yangtze region, South China, through the Ordovician and Silurian transition. Palaeogeogr. Palaeoclimatol. Palaeoecol. 2004, 204, 353–372. [Google Scholar]
  38. Mou, C.; Ge, X.; Xu, X.; Zhou, K.; Liang, W.; Wang, X. Lithofacies palaeogeography of the Late Ordovician and its petroleum geological significance in Middle-Upper Yangtze Region. J. Palaeogeogr. 2014, 16, 427–440. [Google Scholar]
  39. Zhou, M.; Wang, R.; Li, Z. Ordovician-Silurian Lithofacies Paleogeography and Mineralization in Southern China; Geological Publishing House: Beijing, China, 1993; 122p. [Google Scholar]
  40. Torsvik, T.H.; Cocks, L.R.M. Gondwana from top to base in space and time. Gondwana Res. 2013, 24, 999–1030. [Google Scholar] [CrossRef]
  41. Sun, S.; Rui, Y.; Dong, D.; Shi, Z.; Bai, W.; Ma, C.; Zhang, L.; Wu, J.; Chang, Y. Paleogeographic evolution of the Late Ordovician-Early Silurian in Upper and Middle Yangtze regions and depositional model of shale. Oil Gas Geol. 2018, 39, 1087–1106. [Google Scholar]
  42. Chen, X.; Rong, J.; Mitchell, C.E.; Harper, D.A.T.; Fan, J.; Zhan, R.; Zhang, Y.; Li, R.; Wang, Y. Late Ordovician to earliest Silurian graptolite and brachiopod biozonation from the Yangtze region, South China, with a global correlation. Geol. Mag. 2000, 173, 623–650. [Google Scholar]
  43. Zhang, K.; Li, Z.; Jiang, S.; Jiang, Z.; Wen, M.; Jia, C.; Song, Y.; Liu, W.; Huang, Y.; Xie, X.; et al. Comparative analysis of the siliceous source and organic matter enrichment mechanism of the Upper Ordovician-Lower Silurian shale in the Upper-Lower Yangtze area. Minerals 2018, 8, 283. [Google Scholar] [CrossRef] [Green Version]
  44. Li, Y.; Zhang, T.; Ellis, G.S.; Shao, D. Depositional environment and organic matter accumulation of Upper Ordovician-Lower Silurian marine shale in the Upper Yangtze Platform, South China. Palaeogeogr. Palaeoclimatol. Palaeoecol. 2017, 466, 252–264. [Google Scholar] [CrossRef]
  45. Chen, X.; Fan, J.; Wang, W.; Wang, H.; Nie, H.; Shi, X.; Wen, Z.; Chen, D.; Li, W. Stage-progressive distribution pattern of the Lungmachi black graptolitic shales from Guizhou to Chongqing, Central China. Sci. China Earth Sci. 2017, 60, 1133–1146. [Google Scholar] [CrossRef]
  46. Fan, J.; Chen, Q.; Melchin, M.J.; David Sheets, H.; Chen, Z.; Zhang, L.; Hou, X. Quantitative stratigraphy of the Wufeng and Lungmachi black shales and graptolite evolution during and after the Late Ordovician mass extinction. Palaeogeogr. Palaeoclimatol. Palaeoecol. 2013, 389, 96–114. [Google Scholar] [CrossRef]
  47. Wang, H.; Shi, Z.; Zhao, Q.; Liu, D.; Sun, S.; Guo, W.; Liang, F.; Lin, C.; Wang, X. Stratigraphic framework of the Wufeng-Longmaxi shale in and around the Sichuan Basin, China: Implications for targeting shale gas. Energy Geosci. 2020, 1, 124–133. [Google Scholar] [CrossRef]
  48. Dong, D.; Shi, Z.; Sun, S.; Guo, C.; Zhang, C.; Guo, W.; Guan, Q.; Zhang, M.; Jiang, S.; Zhang, L.; et al. Factors controlling microfractures in black shale: A case study of Ordovician Wufeng Formation-Silurian Longmaxi Formation in Shuanghe Profile, Changning area, Sichuan Basin, SW China. Pet. Explor. Dev. 2018, 45, 818–829. [Google Scholar] [CrossRef]
  49. Guo, Y.; Li, Z.; Li, D.; Zhang, T.; Wang, Z.; Yu, J.; Xi, Y. Lithofacies palaeogeography of the Early Silurian in Sichuan area. J. Palaeogeogr. 2004, 6, 20–29. [Google Scholar]
  50. Liang, C.; Jiang, Z.; Yang, Y.; Wei, X. Shale lithofacies and reservoir space of the Wufeng-Longmaxi formation, Sichuan Basin, China. Pet. Explor. Dev 2012, 39, 736–743. [Google Scholar] [CrossRef]
  51. GB/T 19145-2022 2022; Determination for Total Organic Carbon in Sedimentary Rock. China Standardization Administration: Beijing, China, 2022.
  52. SY/T 5163-2018, 2018; Analysis Method for Clay Minerals and Ordinary Non-Clay Minerals in Sedimentary Rocks by the X-ray Diffraction. National Energy Administration of China: Beijing, China, 2018.
  53. Harris, N.B.; Mnich, C.A.; Selby, D.; Korn, D. Minor and trace element and Re–Os chemistry of the Upper Devonian Woodford Shale, Permian Basin, west Texas: Insights into metal abundance and basin processes. Chem. Geol. 2013, 356, 76–93. [Google Scholar] [CrossRef] [Green Version]
  54. Wei, C.; Dong, T.; He, Z.; He, S.; He, Q.; Yang, R.; Guo, X.; Hou, Y. Major, trace-elemental and sedimentological characterization of the upper Ordovician Wufeng-lower Silurian Longmaxi formations, Sichuan Basin, south China: Insights into the effect of relative sea-level fluctuations on organic matter accumulation in shales. Mar. Pet. Geol. 2021, 126, 104905. [Google Scholar] [CrossRef]
  55. Deng, Y.; Ren, J.; Guo, Q.; Cao, J.; Wang, H.; Liu, C. Rare earth element geochemistry characteristics of seawater and porewater from deep sea in western Pacific. Sci. Rep. 2017, 7, 16539. [Google Scholar]
  56. Emery, D.; Myers, K. Sequence Stratigraphy; Blackwell: Oxford, UK, 1996; 297p. [Google Scholar]
  57. Rider, M.H. The Geological Interpretation of Well Logs; Blackie and Son Limited: Glasgow, UK, 1986. [Google Scholar]
  58. Cai, Q.; Hu, M.; Ngia, N.R.; Hu, Z. Sequence stratigraphy, sedimentary systems and implications for hydrocarbon exploration in the northern Xujiaweizi Fault Depression, Songliao Basin, NE China. J. Pet. Sci. Eng. 2017, 152, 471–494. [Google Scholar] [CrossRef]
  59. Catuneanu, O. Model-independent sequence stratigraphy. Earth Sci. Rev. 2019, 188, 312–388. [Google Scholar] [CrossRef]
  60. Wang, Y.; Dong, D.; Huang, J.; Li, X.; Wang, S. Guanyinqiao Member lithofacies of the Upper Ordovician Wufeng Formation around the Sichuan Basin and the significance to shale gas plays, SW China. Pet. Explor. Dev. 2016, 43, 45–53. [Google Scholar] [CrossRef]
  61. Haq, B.U.; Schutter, S.R. A chronology of Paleozoic sea-level changes. Science 2008, 322, 64–68. [Google Scholar] [CrossRef]
  62. Wang, Y.; Li, X.; Wang, H.; Jiang, S.; Chen, B.; Ma, J.; Dai, B. Developmental characteristics and geological significance of the bentonite in the Upper Ordovician Wufeng-Lower Silurian Longmaxi Formation in eastern Sichuan Basin, SW China. Pet. Explor. Dev. 2019, 46, 687–700. [Google Scholar] [CrossRef]
  63. Tribovillard, N.; Algeo, T.J.; Lyons, T.; Riboulleau, A. Trace metals as paleoredox and paleoproductivity proxies: An update. Chem. Geol. 2006, 232, 12–32. [Google Scholar] [CrossRef]
  64. Jones, B.; Manning, D.A.C. Comparison of geochemical indices used for the interpretation of palaeoredox conditions in ancient mudstones. Chem. Geol. 1994, 111, 111–129. [Google Scholar] [CrossRef]
  65. Algeo, T.J.; Lyons, T.W. Mo–total organic carbon covariation in modern anoxic marine environments: Implications for analysis of paleoredox and paleohydrographic conditions. Paleoceanography 2006, 21, PA1016. [Google Scholar] [CrossRef]
  66. Chen, H.F.; Yeh, P.Y.; Song, S.R.; Hsu, S.; Yang, T.; Wang, Y.; Chi, Z.; Lee, T.; Chen, M.; Cheng, C.; et al. The Ti/Al molar ratio as a new proxy for tracing sediment transportation processes and its application in aeolian events and sea level change in East Asia. J. Asian Earth Sci. 2013, 73, 31–38. [Google Scholar] [CrossRef] [Green Version]
  67. Armstrong, H.A.; Turner, B.R.; Makhlouf, I.M.; Weedon, G.P.; Willianms, M.; Smadi, A.A.; Salah, A.A. Origin, sequence stratigraphy and depositional environment of an upper Ordovician (Hirnantian) deglacial black shale, Jordan. Palaeogeogr. Palaeoclimatol. Palaeoecol. 2005, 220, 273–289. [Google Scholar] [CrossRef]
  68. Armstrong, H.A.; Abbott, G.D.; Turner, B.R.; Makhlouf, I.M.; Muhammad, A.B.; Pedentchouk, N.; Peters, H. Black shale deposition in an Upper Ordovician-Silurian permanently stratified, peri-glacial basin, southern Jordan. Palaeogeogr. Palaeoclimatol. Palaeoecol. 2009, 273, 368–377. [Google Scholar] [CrossRef]
  69. Loydell, D.K.; Butcher, A.; Frýda, J.; Lüning, S.; Fowler, M. Lower Silurian “Hot Shales” in Jordan: A new depositional model. J. Pet. Geol. 2009, 32, 261–270. [Google Scholar] [CrossRef]
  70. Zou, C.; Qiu, Z.; Poulton, S.W.; Dong, D.; Wang, H.; Chen, D.; Lu, B.; Shi, Z.; Tao, H. Ocean euxinia and climate change “double whammy” drove the Late Ordovician mass extinction. Geology 2018, 46, 535–538. [Google Scholar] [CrossRef]
  71. Yan, D.; Chen, D.; Wang, Z.; Li, J.; Yang, X.; Zhang, B. Climatic and oceanic controlled deposition of Late Ordovician-Early Silurian black shales on the North Yangtze platform, South China. Mar. Pet. Geol. 2019, 110, 112–121. [Google Scholar]
  72. Li, Y.; Zhang, T.; Shen, B.; Li, Z.; Shao, D.; Lash, G.G. Carbon and sulfur isotope variations through the Upper Ordovician and Lower Silurian of South China linked to volcanism. Palaeogeogr. Paleoclimatol. Palaeoecol. 2021, 567, 110285. [Google Scholar] [CrossRef]
  73. Finney, S.C.; Berry, W.B.N.; Cooper, J.D.; Ripperdan, R.L.; Sweet, W.C.; Jacobson, S.R.; Soufiane, A.; Achab, A.; Noble, P.J. Late Ordovician mass extinction: A new perspective from stratigraphic sections in central Nevada. Geology 1999, 27, 215–218. [Google Scholar] [CrossRef]
  74. Trotter, J.A.; Williams, I.; Barnes, C.R.; Lécuyer, C.; Nicoll, R.S. Did cooling oceans trigger Ordovician biodiversification? Evidence from conodont thermometry. Science 2008, 321, 550–554. [Google Scholar] [CrossRef]
  75. Sheehan, P.M. The Late Ordovician Mass Extinction. Ann. Rev. Earth Planet. Sci. 2001, 29, 331–364. [Google Scholar] [CrossRef]
  76. Liu, Z.; Algeo, T.J.; Guo, X.; Fan, J.; Du, X.; Lu, Y. Paleo-environmental cyclicity in the Early Silurian Yangtze Sea (South China): Tectonic or glacio-eustatic control? Palaeogeogr. Palaeoclimatol. Palaeoecol. 2017, 466, 59–76. [Google Scholar] [CrossRef] [Green Version]
  77. Wang, Y.M.; Li, X.; Dong, D.; Zhang, C.; Wang, S. Main factors controlling the sedimentation of high-quality shale in the Wufeng-Longmaxi Fm, Upper Yangtze region. Nat. Gas Ind. B 2017, 4, 327–339. [Google Scholar] [CrossRef]
  78. Wang, Y.; Chen, B.; Li, X.; Wang, H.; Chang, L.; Jiang, S. Sedimentary characteristics of upwelling facies shale in Lower Silurian Longmaxi Formation, northeast Sichuan area. Acta Pet. Sin. 2018, 39, 1092–1102. [Google Scholar]
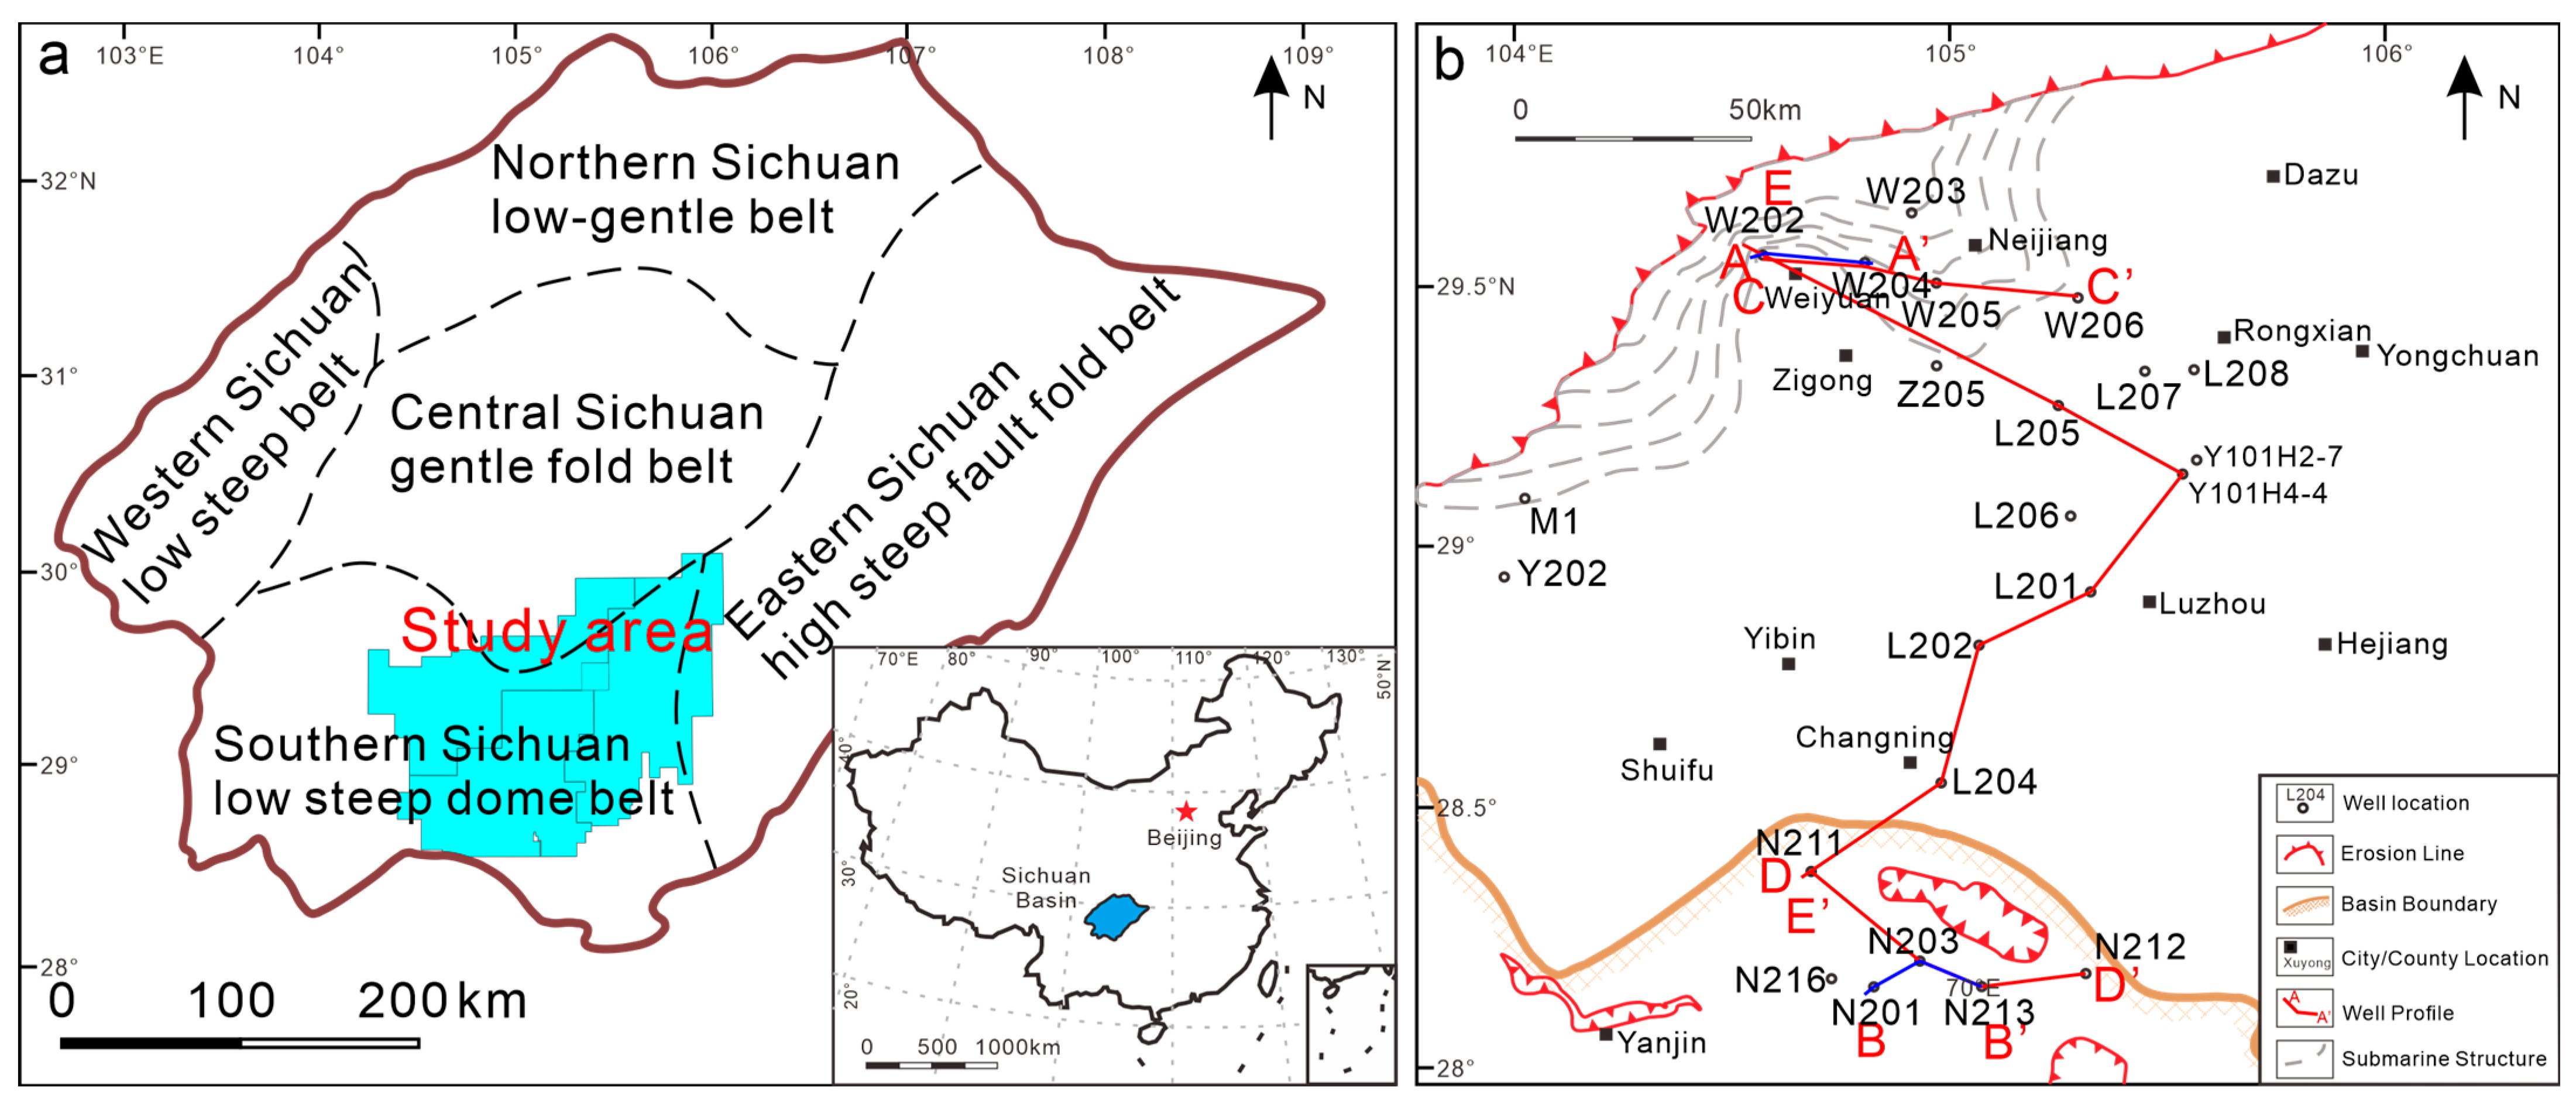
Figure 1. (a)Tectonic location map of the study area in the Sichuan Basin, SW China. (b) Schematic map of the well locations. Dashed lines in the Weiyuan area delineate the paleo-topography during the Early Silurian period (modified after [21]).
Jmse 11 01393 g001
Figure 2. Sedimentary strata and evolutionary stage of the Sichuan Basin (modified from [22]). The highlighted section indicates the location of the research segment. The red wavy lines represent the unconformity surfaces.
Jmse 11 01393 g002
Figure 3. Paleography of the Upper Yangtze Plates. (a) Paleography at 445 Ma, Hirnantian, showing the positions of the glacial ice cap and South China [40]. (b) Paleogeography of the Early Silurian, showing the positions of the Sichuan Basin and the study area (modified from [41]).
Jmse 11 01393 g003
Figure 4. Field section and core photographs of the Longmaxi Formation, located in Nanjing, are shown on the left with field photographs, the middle, with core photographs from well Y101H4-4, and the right, with digital core photographs from well Y101H4-4. SB1 represents a third-order sequence boundary, while MFS denotes the shift from transgression to highstand regression within the first third-order sequence. Abbreviations: TST-transgressive systems tract; HST-highstand systems tracts.
Jmse 11 01393 g004
Figure 5. Regional seismic profile from the Weiyuan area (modified from [21]), with SB1 (third-order sequence boundary) and MFS (maximum flooding surface of sequence 1). The location of the seismic profile is shown in Figure 1b. SB = sequence boundary. MFS = maximum flooding surface.
Jmse 11 01393 g005
Figure 6. Regional seismic profile from the Changning area, showing the third-order stratigraphic framework. The location of the seismic profile is shown in Figure 1b. SB1 is a third-order sequence boundary. SB = sequence boundary. MFS = maximum flooding surface.
Jmse 11 01393 g006
Figure 7. Summary of the stratigraphic sequence column from well Y101H4-4, showcasing the graptolite zone, wireline logs, the bentonite thickness observed from cores, sea-level changes [61], and the interpretation of sequence stratigraphy. Note the biozone abbreviations are adapted from [45], WF2 = Dicellograptus complexus, WF3 = Paraorthogr. pacificus, WF4 = Metabologr. extraordinarius, LM1 = Persculptogr. persculptus, LM2-3 = Akidograptus ascensus-Parakidogr. Acuminatus, LM4 = Cystograptus vesiculosus, LM5 = Coronograptus cyphus, LM6 = Demirastrites triangulates, LM7 = Lituigraptus convolutes, LM8 = Stimulograptus sedgwickii. GR = gamma ray, KTH = gamma ray without uranium, DEN = density, CNL = compensated neutron logging, AC = acoustic, TST = transgressive systems tract, HST = highstand systems tract, SQ = sequence, SB = sequence boundary. A dashed line at biozone boundaries means uncertainty in placement.
Jmse 11 01393 g007
Figure 8. Geological section of the Longmaxi Shale from well Y101H4−4, where the thickness of bentonite was used to indicate the strength of volcanic activity [62]. Paleo-productivity was expressed by the value of P/Al [63], where the paleo-redox state of the depositional environment was expressed by U/Th [16,64]. The degree of water restriction was represented by Mo/TOC [65], and the content of Al2O3 served as a proxy for the extent of continental input [66]. Additionally, δCe was used to indicate the trend of relative sea-level changes [66]: δCe = log [3 × Cen/(2 × Lan + Ndn)]. Finally, the gas content was calculated using polynomial regression based on the field test value.
Jmse 11 01393 g008
Figure 9. Geological section of the Longmaxi Shale from well N213. Paleo-productivity was expressed by the value of P/Al [63], where the paleo-redox state of the depositional environment was expressed by U/Th [16,64]. The degree of hydrographic restriction was represented by Mo/TOC [65], and the content of Al2O3 served as a proxy for the extent of continental input [66]. Additionally, δCe was used to indicate the trend of sea-level changes [66]: δCe = log [3 × Cen/(2 × Lan + Ndn)]. Finally, the gas content was calculated using polynomial regression based on the field test value.
Jmse 11 01393 g009
Figure 10. Stratigraphic sequence cross-section of the Wufeng-Longmaxi Formation (A-A’, see Figure 1), showing the stratigraphic sequence correlation in the Weiyuan area. The fourth-order sequences were recognized based on GR under the constraint of biozone. The abbreviations of the biozone were adapted from [45], WF2 = Dicellograptus complexus, WF3 = Paraorthogr. pacificus, WF4 = Metabologr. extraordinarius, LM1 = Persculptogr. persculptus, LM2 = Akidograptus ascensus, LM3 = Parakidogr. Acuminatus, LM4 = Cystograptus vesiculosus, LM5 = Coronograptus cyphus, LM6 = Demirastrites triangulates, LM7 = Lituigraptus convolutes, LM8 = Stimulograptus sedgwickii, LM9 = Spirograptus guerichi. GR = gamma ray, SQ = sequence, PSS = parasequence sets. A dashed line at biozone boundaries means uncertainty in placement.
Jmse 11 01393 g010
Figure 11. Stratigraphic sequence cross-section of the Wufeng-Longmaxi Formation (C-C’, see Figure 1), showing the sequence stratigraphic correlation in the Changning area. The fourth-order sequences were recognized based on GR under the constraint of biozone. The abbreviations of the biozone were adapted from [45], WF2 = Dicellograptus complexus, WF3 = Paraorthogr. pacificus, WF4 = Metabologr. extraordinarius, LM1 = Persculptogr. persculptus, LM2 = Akidograptus ascensus, LM3 = Parakidogr. Acuminatus, LM4 = Cystograptus vesiculosus, LM5 = Coronograptus cyphus, LM6 = Demirastrites triangulates, LM7 = Lituigraptus convolutes, LM8 = Stimulograptus sedgwickii, LM9 = Spirograptus guerichi. GR = gamma ray, SQ = sequence, PSS = parasequence sets. A dashed line at biozone boundaries means uncertainty in placement.
Jmse 11 01393 g011
Figure 12. Stratigraphic sequence cross-section of the Wufeng-Longmaxi Formation (B-B’, see Figure 1), showing the stratigraphic sequence correlation in the southern Sichuan Basin. The fourth-order sequences were recognized based on GR under the constraint of biozone. The abbreviations of the biozone are adapted from [45], WF2 = Dicellograptus complexus, WF3 = Paraorthogr. pacificus, WF4 = Metabologr. extraordinarius, LM1 = Persculptogr. persculptus, LM2 = Akidograptus ascensus, LM3 = Parakidogr. Acuminatus, LM4 = Cystograptus vesiculosus, LM5 = Coronograptus cyphus, LM6 = Demirastrites triangulates, LM7 = Lituigraptus convolutes, LM8 = Stimulograptus sedgwickii, LM9 = Spirograptus guerichi. GR = gamma ray, SQ = sequence, PSS = parasequence sets. A dashed line at biozone boundaries means uncertainty in placement.
Jmse 11 01393 g012
Figure 13. Isopach maps of systems tracts for SQ1.
Jmse 11 01393 g013
Figure 14. Isopach maps of systems tracts for SQ2.
Jmse 11 01393 g014
Figure 15. Sedimentary pattern for the first systems tract of SQ2.
Jmse 11 01393 g015
Table 1. Thickness and sedimentation rates of the stratigraphy from the Dicellograptus complexus zone to the Spirograptus guerichi zone observed by cores in the southern Sichuan Basin. The ages of the biozone bases are after [45]. “/” means no available data.
BiozoneAge (Ma)N213L204Y101H4-4L205W204H10-2
Thickness (m)Rate (m/Ma)Thickness (m)Rate (m/Ma)Thickness (m)Rate (m/Ma)Thickness (m)Rate (m/Ma)Thickness (m)Rate (m/Ma)
Spirograptus guerichi (LM9)438.49////////>29>80.42
Stimulograptus sedgwickii (LM8)438.76////>14>51.85//17.6524.51
Lituigraptus convolutes (LM7)439.21////11.9326.51>27>61.02
Demirastrites triangulates (LM6)440.77>23.99>15.38>35>22.4413.048.3623.9315.3414.038.99
Coronograptus cyphus (LM5)441.5768.0485.0521.6927.1114.2417.812.1915.243.244.05
Cystograptus vesiculosus (LM4)442.475.892.616.777.522.582.872.983.311.822.02
Parakidogr. Acuminatus (LM3)443.403.852.832.651.953.073.301.952.1
Akidograptus ascensus (LM2)443.832.72.621.563.63
Persculptogr. Persculptus (LM1)444.437.2126.6112.183.630.61
Disclaimer/Publisher’s Note: The statements, opinions and data contained in all publications are solely those of the individual author(s) and contributor(s) and not of MDPI and/or the editor(s). MDPI and/or the editor(s) disclaim responsibility for any injury to people or property resulting from any ideas, methods, instructions or products referred to in the content.