Abstract
A novel structural design of a wave energy converter (WEC) is proposed, utilizing a gyroscope as the main component for energy absorption. A vacuum-sealed, high-speed flywheel is implemented within the gyroscope to convert energy and reduce energy loss from air resistance. A dynamic model that considers the response of the floater, gyroscope, and power take-off (PTO) system with multi-degree-of-freedom (DoF) wave excitations is created. The primary parameters such as flywheel speed, damping, and stiffness of the WEC system that affect the gyroscope and PTO on energy absorption are analyzed through numerical simulations. The simulation results demonstrate that changes to these parameters can significantly impact the energy-absorption peak value. Furthermore, an improved multi-objective evolutionary algorithm based on the decomposition (MOEA/D) algorithm is applied to optimize key parameters, such as the power conversion and gyro precession of the WEC system, using a hybrid constraint handling strategy for enhanced diversity and the HV value as the evaluation criterion. The optimal design solution is selected from the Pareto solution set using a technique for order preference by similarity to the ideal solution (TOPSIS) method based on entropy weighting so that technical guidance can be provided for the design and control of the WEC system.
1. Introduction
Ocean wave energy is a kind of green energy that is widely dispersed over the sea area, with an estimated 2.11 TW available globally [1]. In spite of this abundantly available wave energy source, there is currently no commercial wave power development or implementation that exists today. A wave energy converter (WEC) that can supply power to vessels, buoys, beacons, and some other offshore units from wave energy would have various applications in ocean exploration and development. Up until now, various types of WECs have been investigated and developed in laboratory experiments and prototype tests [2,3,4].
A point absorber (PA) is a typical WEC device that achieves wave energy through an oscillating body with a dimension smaller than the prevailing wavelength. These structures and units, without a specific installation environment, either floating, submerged, or even moving with a hull, belong to the category of generalized PAs.
Early designs of the oscillating body of PAs, such as the well-known Nodding Duck device presented by Stephen Salter [5,6], captured the wave energy by oscillating the duck’s beak in the pitch degree of freedom (DoF). A similar idea was also applied in the development of PELAMIS by Ocean Power Delivery Ltd., which increased the stability of the WEC against the harsh sea state with a raft-type connection [7]. In recent years, some examples of PA-type WECs have been investigated and implemented. The Inertial Sea Wave Energy Converter (ISWEC) is an innovative PA design presented by the Polytechnic University of Turin [8,9,10,11]. This device consists of a floating, boat-shaped hull that is slack-moored to the seabed, which internally houses a gyroscopic power take-off (PTO) unit. The device utilizes precession effects produced by the spinning gyroscope and pitching hull to drive an electric generator/PTO. Due to the sensitivity of the gyroscope to less obvious disturbances, the WEC could significantly amplify the oscillation caused by the wave excitation without energy loss [12].
The focus of wave energy research is to improve conversion efficiency and lower economic costs. The challenges of WEC design and development are twofold. The first is the improvement and quantification of the conversion capabilities of the WEC for wave energy. Some methods and strategies that rely on the motion of the floater in waves for evaluating the wave power extraction are important aspects of theory and prototype investigations. The boundary element method (BEM), which is based on linear potential flow equations, is a prevalent method for simulating wave excitation. In view of the nonlinear phenomena for solving the radiation force convolution integral, calibrated BEM models and compressible Navier–Stokes (NS) equations are applied to optimize and refine the accuracy of the hydro-dynamical model. The study of these nonlinear effects is important, especially when considering the gyroscope operating in a nonlinear state, which will provide some guidelines for further improving the design of the WEC system [13]. Another research focus of WEC design and development is to ensure the resonance between the WEC and the sea wave. Theoretically, the optimal efficiency of wave energy absorption is achieved when the predominant frequency of an incident wave matches that of the WEC, which is considered resonance. Thus, to maximize the power output, an adaptive controller method was used to tune the dynamics of the WEC such that its inherent frequency approximated the wave frequency to a suitable extent [14,15]. This method can be easily implemented in linear systems; however, in cases where there are prominent nonlinear factors in the system, such as the inertial WEC studied in this paper, it becomes challenging to derive an analytical expression for the inherent frequency of the system [16,17]. Thus, by optimizing the design of the passive load, we enabled the device to operate optimally under specific sea conditions. This approach can serve as a reference for achieving the optimal design and can provide valuable insights for control strategies.
This paper presents the establishment of a novel wave energy converter that uses an inertial gyroscope system. By conducting mathematical modeling and numerical simulations, this study examines the impact of the gyroscope and PTO parameters on the WEC device under various operating conditions and formulates an optimization design based on the findings. In Section 2, the structure of the inertial WEC device is developed. What sets this apart is that the mechanical components of the gyroscope, such as the flywheel and motor elements, are sealed in a vacuum chamber to minimize air drag during high-speed rotation and prevent corrosion from seawater. Then, a dynamic model of the entire device is developed that accounts for multiple DoFs. Section 3 describes numerical simulations that examine how the main parameters of the gyroscopic and load systems affect device performance, as well as the distinctions between models that feature multi-DoF wave excitation and those with single-pitch DoF. In Section 4, the main device parameters are optimized using an enhanced MOEA/D optimization algorithm, ultimately resulting in an outstanding design.
2. Inertial WEC System Description and Model Establishment
2.1. Description of Inertial WEC Structure
Figure 1 displays the internal structure of the inertial WEC device, which includes a PTO unit and gyroscope unit to convert wave energy into useful power. The relative torsional displacement between the internal gyroscope shell and external floater support is the key mechanism for this energy conversion process. The floater was constructed with a semi-circular bottom surface with a radius R and dimensions L and W for the length and width, respectively. The device also had separate adjustable compartments on each side used for ballasting, which determined the draught D of the floater.
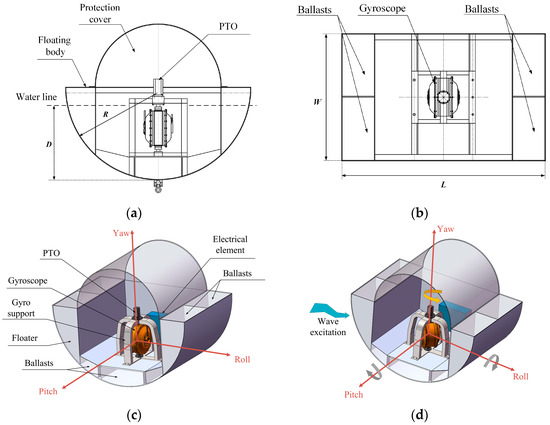
Figure 1.
(a) Main view; (b) top view; (c) 3D structure; and (d) working principle diagram of inertial WEC device.
In Figure 1d, it can be seen that when wave excitation occurs, due to the precession effect of the spinning gyro flywheel, the gyroscope induces torque in the orthogonal direction, which activates the rotational motion of the PTO shaft and directly outputs power. This process is regarded as the absorption and conversion of energy from waves.
The gyroscopic unit is composed of various mechanical and electrical components, including a cylindrical gyro shell, and interior elements such as the gyro flywheel, flywheel motor, support axle, bearings, and stator support, as shown in Figure 2.
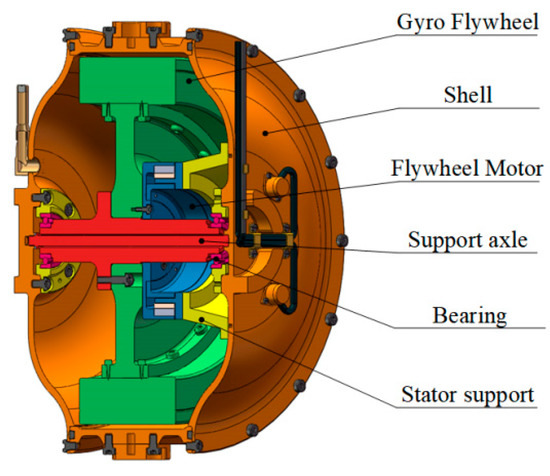
Figure 2.
Cut-away view of the gyroscopic structure.
The flywheel is powered by a disk-type high speed motor, which is sealed inside a vacuum chamber to decrease energy losses due to air friction. The motor pre-accelerates the flywheel to the desired speed to provide enough angular momentum for the gyroscope. Once started, the motor rotor becomes a part of the rotating mass of the flywheel. When wave excitation is present, the floater absorbs the energy and causes relative rotation between the shell and the float, ultimately converting wave energy into the expected power output.
Several factors contribute to the proposal for an inertial WEC. Firstly, the sensitive nature of the inertial gyroscope component enables it to detect even minor changes in position and angle caused by wave excitation, which is effective even in low latitude areas with barely noticeable wave activity [8]. The device has been shown to amplify the excitation angle by up to five- to tenfold depending on gyro characteristic, and to allow sensors for more accurate measurement. Another significant factor of using a gyroscope as the main component of WEC is that, by modifying the angular momentum of the gyro flywheel, it is possible to adjust the inherent frequency of the gyroscope system, then achieving active control of the inertial elements. When combined with passive control of the load (PTO), this technology can effectively adapt to deal with more complex and varied ocean conditions.
Compared to conventional PA systems, inertial WEC involves a highly intricate nonlinear coupling between the gyroscope, load, and float. Therefore, realizing precise control over the motion of gyroscope is challenging work. It is essential to study and analyze the primary parameters that influence the movement state of the gyroscope and, ultimately, improve the wave energy absorption ability of the device.
2.2. Hydrodynamic Equation of Floater with Wave Excitation
Wave energy varies greatly and is difficult to predict on an instantaneous basis, and also lacks a precise mathematical expression for its evaluation. However, when examined on a macro scale, sea wave energy is considered over a longer period of time—hours, days or even weeks—and the distribution of wave energy can be modeled using specific characteristic parameters, which remain relatively stable. In this paper, we assume that the fluid is both incompressible and inviscid, and that fluid motion is characterized as irrotational with a small amplitude. As such, the linear wave theory can be employed to describe irregular wave surfaces through the superposition of numerous harmonic waves. These waves possess a specific distribution of energy across varying frequencies. In modeling monochrome waves, the collective motion of a water particle on the wave surface can be represented as:
in which an, ωn, and ψn are the amplitude, angular frequency, and phase of the n-th harmonic wave, respectively, and N is the number of these waves. For the irregular waves, the energy of the harmonic waves within a frequency range is discretized with an interval Δω, as given by:
In Equation (2), the spectral function S(ω) is given by the double-parameters spectrum with the significant height ζs and the spectral peak period Tp of the sea wave, developed by the Joint North Sea Wave Project (JONSWAP) [18]. It can be used to simulate the realistic sea wave state in a steady wind field, which is expressed as:
where σ is the form factor of the wave as given by:
in which ω is the combined angular frequency of waves, and ωp is the spectral peak angular frequency. Through generating a sequence of irregular waves, we can simulate the real-world state of sea waves, which allows us to use these theoretical models to analyze the effect of wave excitation on floating structures. The wave energy follows a certain predictable distribution. The characteristic parameters of the frequency spectrum represent wave properties, and can be used to serve as the primary parameters in numerical simulations. This section presents a simplified dynamic model of a floater subjected to wave excitation using Cummins’ function, which is utilized to describe the motion of the floater in a wave field [19], and is expressed in the time domain, as follows:
where If and ΔI refer to the inherent and added inertia matrices of the floater, respectively. The second term with a convolution function Kf is the radiation force caused by the body oscillation. And the third term represents the hydrostatic restoring force with the stiffness coefficient Cf. Te and Tr represent the torque caused by wave excitation and the reaction torque from the gyroscopic effect on the floating structure, respectively. Z represents the angular displacement of the floater in three rotational DoFs, which is defined as:
in which α, β, and γ are the angle displacements of the floater on pitch, roll and yaw, respectively. The stiffness coefficient Cf in Equation (5) could be calculated using classical naval architecture theory. And the wave excitation torque Te is a function of the wave energy spectra, as expressed by:
where μe is the impulse response function of the wave excitation torque.
The convolution function in the formula cannot be directly described as a linear function. To address this issue, there are several approaches available: Ref [19] utilized the frequency domain regression method that approximated the convolution function to a linear state-space expression, and this solution effectively addressed the issue with real-time performance. Alternatively, in situations where calculation accuracy is of greater importance than real-time performance, specialized software such as ANSYS AQWA could be used for aided calculation.
The last term Tr in Equation (5) is the gyroscopic reaction torque, which will be derived in Section 2.3.
2.3. Gyroscopic System Dynamic Model
Actually, the gyroscope creates no additional energy consumption; it simply alters the wave energy pattern. The precession effect of gyroscope housing with the wave excitation being accurately modeled and solved is a significant area of research. This section presents the structure and principle of the WEC and defines the reference frames of the components that comprise the gyroscope, which determines the kinematic equation based on the transformation of each frame. An ideal dynamic model of the gyroscope is then established using the Newton–Euler method based on the stress state. To examine the motion of the gyro flywheel WEC device in sea waves, we applied four reference frames with a common origin, as shown in Figure 3, which were defined as the inertial reference frame (F0: O-XYZ); the floater reference frame (F1: O-xfyfzf); the shell reference frame (F2: O-xsyszs), as the red arrows in Figure 3; and the gyro flywheel reference frame (F3: O-xgygzg) as the blue arrows in Figure 3. The reference frames coincided at the initial position in the absence of external forces. The flywheel spun around the rotation axis Ozg at a constant speed υ. When subjected to wave excitation, the floater oscillated in three DoFs with the angular displacement Z. Then the angular corresponding velocity of the floater is as defined in Equation (8), and the definition of angular acceleration follows the same law:
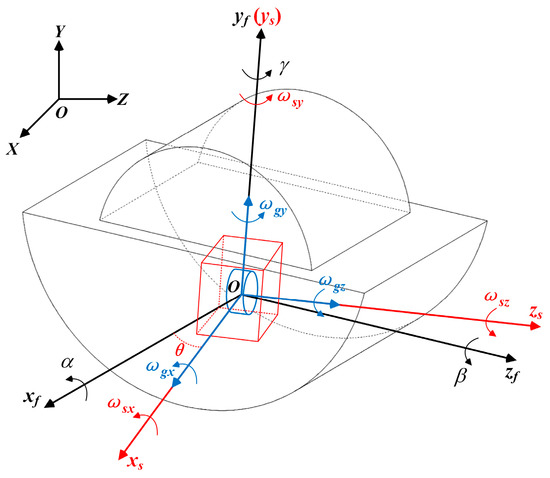
Figure 3.
Gyroscopic system reference frame definition.
The gyroscope experiences oscillations similar to the floater due to the gyroscopic precession effect. The gyroscope motion is restricted to a single DoF with the angle θ with respect to the floater frame, under the constraints of the shell support, as illustrated in Figure 3. These principles can be explained through gyroscopic dynamics.
To develop dynamic models for various components of WEC, it is necessary to transform these kinematic vectors into a common coordinate system for expression. The combination of two angular velocity vectors, the relative angular velocity of the gyro shell with respect to the reference frame F1 and the transformation angular velocity of the floater with respect to the frame F0, define the angular velocity of the gyro shell in the inertial coordinate reference frame F0. This angular velocity ωs is denoted as:
in which projection matrix sCg is given by:
To further compute the absolute angular velocity of the gyro flywheel, similarly, consider it as the vector sum of the rotational speed of gyro flywheel and the angular velocity of shell, which can be expressed by:
The Newton–Euler method is utilized to develop a dynamic model for WEC and, subsequently, to perform force analyses on each major component, as depicted in Figure 4. The floater experiences wave excitation torque Te (red arrows in Figure 4a) and reaction force torque Tr (blue arrows in Figure 4a) from the gyro shell. Similarly, the shell receives torque Tf (blue arrows in Figure 4b) from the floater, torque Tg (red arrows in Figure 4b) from the gyroscope flywheel, and torque TPTO from the reaction of the load (PTO). The resultant torque experienced by the gyro flywheel is denoted as Tm (red arrows in Figure 4c). This torque dictates the variation in angular momentum of the flywheel in accordance with the principle of angular momentum, and serves as the fundamental cause for the occurrence of the gyro flywheel precession effect.
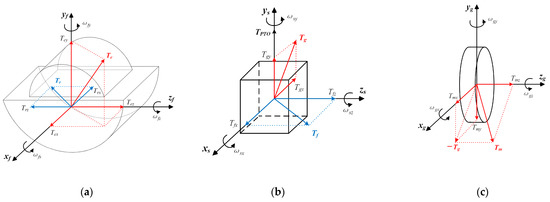
Figure 4.
Forces analysis of gyro components: (a) floater; (b) shell; and (c) gyro flywheel.
Assuming that the principal axes of inertia of all the main components in an ideal WEC structure are aligned with the axes of the defined spatial coordinate system, the moment of inertia matrices for the floater, gyro shell, and flywheel can be expressed by the following equations:
where the moment of inertia components for the flywheel are given by Igs and Igt in the axial and radial directions, respectively, with Iss and Ist denoting the axial and radial moments of inertia components for the shell. Additionally, Ix, Iy, and Iz represent the respective moments of inertia for the floater in three DoFs.
The Coriolis theorem states that when considering a vector in a rotating coordinate system, its absolute variation rate is equal to the sum of the relative change rate of the vector in a moving coordinate and the cross product of the angular velocity of the coordinate system and the vector itself. Hence, while utilizing the equation of angular momentum, the dynamic equation can be derived for an individual gyros flywheel as:
The components of the vector in Equation (13) along the principle axes of frame F2 can be expressed as follows:
where Tmx, Tmy, and Tmz are the components of Tm acting directly upon the gyro flywheel along the Oxs, Oys, and Ozs axes, respectively. Tmx acts perpendicularly to the direction of gyroscopic rotation and indirectly affects the floater through the shell, providing the fundamental reaction force to restrain the motion of the floater. Tmy is directed along the rotation axis of the shell and is balanced by the load (PTO). The interaction between this force and PTO results in the export of power from the gyroscopic system to the external device. Tmz refers to the axial component of the rotation of flywheel that does not typically interact with external parts, which is balanced by the resistance and friction of the medium when the flywheel rotates at a constant speed.
Next, the dynamic equation of the individual gyro shell can be derived using a similar approach, as:
where Ts is the resultant torque experienced by the gyro shell. Here, Tm and Tg represent a pair of interacting torques, as do Tf and Tr. From Equation (15), the components of Ts on the coordinate axis of frame F2 are expressed by:
where Tsx, Tsy, Tsz are the components of Ts acting directly upon the gyro flywheel along the Oxs, Oys, and Ozs axes, respectively. According to the structure depicted in Figure 4, the gyroscope and load interact on the Oys axis are evident. Assume that the load is a linear damping spring system around Oys, as given in frame F2 by:
where c and k correspond to the damping and stiffness, respectively, of the load system. Then, we can reformulate the torque balance equation in Equation (16b) by:
where It = Igt + Ist represents the combined moment of inertia on the output shaft. It is worth mentioning that in Equations (16a)–(16c), θ is actually equivalent to (θ + β), and the simulation indicates that β is a negligibly small quantity compared to θ; this substitution was introduced to simplify subsequent calculations and facilitate notation.
Figure 4 indicates that the coordinate components of Tf and Tr are presented in a distinct reference frame, and then their transformation can be expressed by following
Substituting Equations (16a) and (16b) into Equation (19) yields the reaction torque produced by the gyroscope on the floater in both pitch and roll DoFs, as represented by:
Thus, a dynamic model linking waves to the gyroscope and, further, to PTO was established by Equations (5), (18), (20a) and (20b). It is apparent that the equations involved are characterized by complex nonlinearity, which increases the difficulty in calculating and analyzing the device performance. Consequently, in the following section, a numerical simulation method will be employed to study the absorption capacity of the WEC device for wave energy, with special emphasis given to primary parameters of the gyroscope and PTO system. The energy extracted by the PTO from the gyroscope can be expressed as the kinetic energy equation along the shaft, as:
Taking the time average of Equation (21) over the one wave peak period, we can obtain the power absorbed by the PTO. Equations (16b) and (17) yield two alternative expressions for TPTO, and therefore two equations for conversion power can be derived as:
The integral of terms in Equation (22) includes odd-order powers, and the twice frequency over one wave period equals zero, so that Equation (22) can be rewritten as two expressions:
Equations (23) and (24) provide clear demonstrations of the absorbed power in different forms. Equation (23) shows the influence of PTO parameters on the absorption, while Equation (24) describes the relationship between the gyro dynamics and the absorbed power. These equations also prove that the gyroscope does not produce extra power loss in the process of energy transfer. The PTO absorption power can be calculated, if either the PTO parameters or the motion state of the gyroscope are known.
3. Numerical Simulation and Analysis
According to the dynamic model presented in Section 2, a simulation model was established for the WEC to assess its behavior under wave excitation. The structural parameters of the system were taken from Table 1, and ANSYS AQWA software was used to analyze the hydrodynamic characteristics of the floater. The hydrodynamic parameters of the floater were obtained by the simulations, including the wave excitation and the response motions of the floater in three DoFs, respectively. Then, the additional masses were calculated as well. These parameters will be applied to the future numerical simulation as known conditions. A dynamic model was then developed using MATLAB/Simulink software, which provided an integrated environment for modeling, simulating, and analyzing the dynamic system.

Table 1.
Inertial WEC main dimensions.
As shown in Figure 5, the model was designed to observe and discuss the effects of varying system parameters on the corresponding response. The physical quantities in Figure 5 are derived from the dynamic model introduced in Section 2.3, where Tex, Tey, and Tez are the wave excitation torques causing the motion α, β, and γ of the floater in three DoFs, respectively. Tfx and Tfz are torques forcing the gyroscope on pitch DoF and roll DoF, and Trx and Trz are the reaction torques to balance against them, respectively. Since the gyroscope and floater are not fixed at yaw DoF, there is no interaction. Finally, the absorbed power is calculated by the torque TPTO of the load on PTO and the precession angle θ of the gyroscope.

Figure 5.
Simulation construction of inertial WEC model.
In this study, the primary focus is the analysis of how the active parameter of the gyroscope (flywheel speed) and the passive parameters of the PTO (damping and stiffness) affect the motion status and power absorption of the WEC device, to offer guidance for future optimization designs.
3.1. Hydrodynamic Simulation of the Floater
A geometric model of the floating body was established using the Design Modeler module in the ANSYS Workbench, with point mass parameters as shown in Table 1. In order to balance the computational efficiency and accuracy, a geometric model was created with 814 meshes. The simulated conditions of pressure and motion are illustrated in Figure 6, with a wave amplitude of 0.5 m (ζs = 1 m).
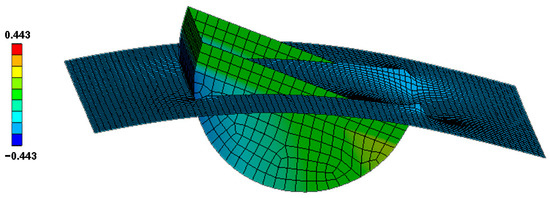
Figure 6.
Simulation case of floating body.
In this section, the AQWA software was used to calculate the wave-induced forces and Response Amplitude Operators (RAOs) of the floater in three DoFs. The wave period range was set at 1 to 10 s. The simulation results are shown in Figure 7.
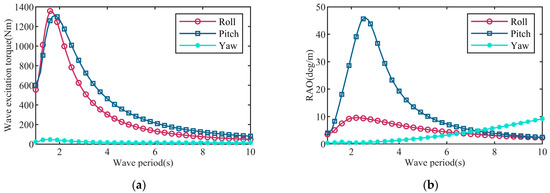
Figure 7.
AQWA simulation results of (a) wave excitations and (b) RAOs changing with wave period.
Figure 7a shows that there was little difference between the wave-induced moments on the roll and pitch DoF, and these were much higher than those observed on the yaw. The maximum torque amplitude appeared at the wave period range of 1.5–2 s, which suggested that rotating the floater about the pitch DoF was likely to yield higher power, in line with the initial design of the structure. In Figure 7b, the peak RAO values for pitch DoF were observed at a wave period of 2.6 s (45.96°/m), while for roll DoF they occured at a wave period of 2.2 s (9.57°/m). The above calculations revealed that the motion state of the WEC was more pronounced on the pitch DoF, aligning with design expectations. Additionally, the added mass ΔI of the floating structure was calculated using AQWA software, as an artificially added weight used to better replicate the motion of the floater and improve the simulation of the sea wave conditions, to bring it closer to the actual conditions. The results of the added masses are presented in Figure 8, from which it can be seen that the pitch motion of the floating body had less added mass than the roll motion and yaw motion. The results are benefit to design and control the gyro flywheel WEC system for power absorbing.
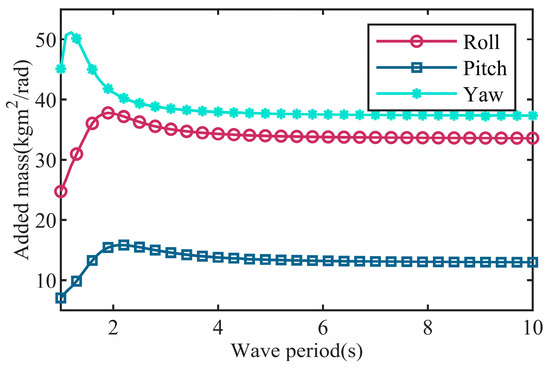
Figure 8.
Added mass changing with wave period.
3.2. The Effect of Gyro Angular Momentum
The wave energy absorption capability of the WEC is largely dependent on the angular momentum of the gyro flywheel in practical applications. In this simulation, the physical parameters of the gyroscope are shown in Table 2. The spinning speed of the gyro flywheel was the main source of angular momentum and the key adjustable variable.

Table 2.
Physical parameters of the gyroscope.
Set the flywheel speed to be sampled at intervals of 2000 r/min from 2000 to 10,000 r/min, with the provided PTO system (c = 80 N·m·s/rad, k = 60 N·m/rad). The gyroscope precession response, angular displacement, and angular velocity on the pitch DoF, with multiply flywheel speeds under monochromatic wave excitation (ζ = 1 m, T = 2.5 s) and irregular wave excitation (ζs = 1 m, Tp = 2.5 s), are presented in Figure 9.
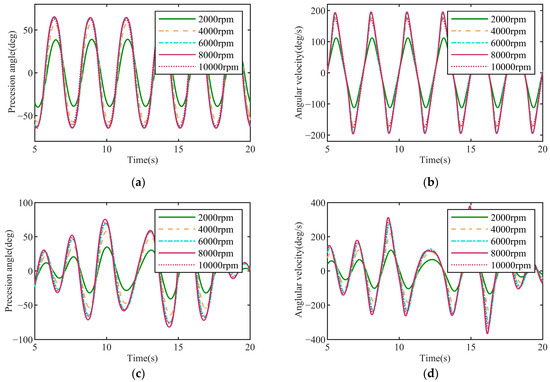
Figure 9.
Precession (a) angle displacement and (b) angular velocity under monochromatic wave excitation; precession (c) angle displacement and (d) angular velocity under irregular wave excitation.
In Figure 9, the amplitude of the precession angle and velocity was not consistently affected by changes in flywheel speed, and the peak value appeared near υ = 8000 r/min. This result was consistent in the simulation of monochromatic and irregular waves. Table 3 contains multiple sets of parameter cases, which will be used for numerical simulation in Section 3.2, Section 3.3 and Section 3.4. The premise of all these simulations was set as the ocean waves with ζs = 1 m, Tp = 2.5 s. In order to comprehensively study the influence of the flywheel speed on system performance, a specific combination of parameters, presented in cases 1–3 from Table 3, were selected for the simulation. Then, simulations were conducted, respectively, for the average power of PTO, the precession angle of the gyroscope, and the pitch angle of the floater. The simulation results are depicted in Figure 10.

Table 3.
Model parameters for simulation.
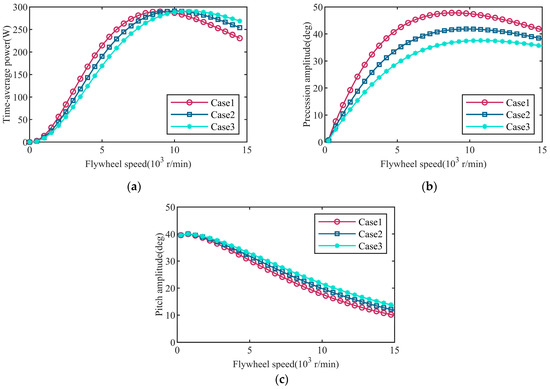
Figure 10.
Variation of (a) time-average power, (b) precession angle, and (c) pitch angle with flywheel speed.
The simulation results depicted in Figure 10a,b revealed that the time-average power absorption of the PTO and the amplitude of the precession angle with respect to the flywheel speed was non-monotonic. This phenomenon can be explained by Equations (18), (20a) and (20b). As shown in Figure 10c, the angular momentum of the flywheel was positively correlated with the precession motion and also increased the resistance to the pitch motion of the floater. An increase in flywheel speed led to a decrease in the amplitude of the float pitch angle and a monotonically increasing amplitude of the reaction torque of the gyroscope. Therefore, these competitive factors could aid in determining the most effective flywheel speed to attain the highest wave energy absorption peak value. In Figure 10a, the flywheel speeds at which the maximum power absorption was achieved for the cases were found within the range of 9000 to 11,000 r/min. Once these thresholds were surpassed, the anti-pitch effect of the gyroscope on the floater became more prominent. Additionally, while the gyro parameters impacted the absorption capability for the wave energy, their influence was not the sole determining factor. Due to variations in the load, we must conduct further research on changes to the load parameters to better understand their influence.
3.3. The Effect of Load (PTO) Parameters
In this paper, the load system was designed as a standard damping-spring system, serving as the PTO to absorb the energy from the gyroscope. Equation (23) reveal that parameters such as damping coefficient c play a direct role in determining the wave energy absorption capacity of WEC. Adopting the same wave parameter presented in Section 3.2 (ζs = 1 m, Tp = 2.5 s), we employed parameters in cases 4–6 from Table 3 to conduct simulations. Initially, the impact of various damping coefficients on the state of WEC was studied, which included average power absorption, gyroscope precession, and floater pitch motion, as shown in Figure 11.
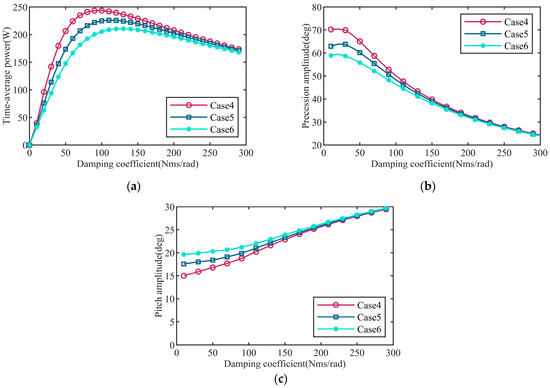
Figure 11.
Variation in (a) time-average power, (b) precession angle, and (c) pitch angle with damping c of PTO.
Figure 11a reveals that the average power of the PTO wave energy absorption system changed, first up and then down, with the damping coefficient increasing, and an average power peak value existed at approximately 80~100 N·m·s/rad damping condition. Meanwhile, the average power near the peak value decreased with the stiffness coefficient increasing. Figure 11b shows that the gyroscope precession amplitude decreased with the damping coefficient increasing, and the rate of decreasing would be affected by the value of stiffness; this was more prominent when the damping was small (10~100 N·m·s/rad). Figure 11c shows that the floater pitch amplitude value increased with the damping coefficient increasing, and the increasing rate was controlled by stiffness, as well, especially damping in the range of 10~100 N·m·s/rad. Therefore, the generation of an optimal absorption power is needed to balance between these competitive factors.
The stiffness k of PTO indicated its capacity to recover to the initial position after original location deviation. A higher stiffness might impede the motion of PTO, which is demonstrated in the simulation results depicted in Figure 12.
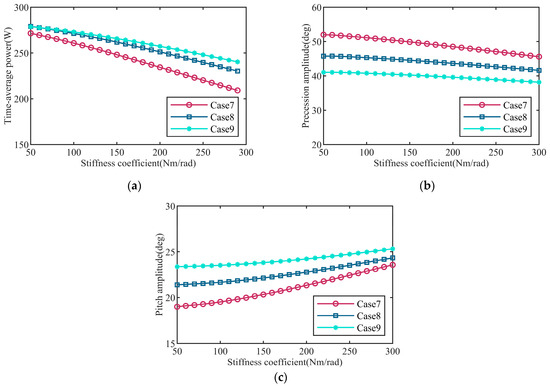
Figure 12.
Variation in (a) time-average power, (b) precession angle, and (c) pitch angle with stiffness k of PTO.
Figure 12a shows that the average power decreased monotonously with the stiffness coefficient increasing, and the average power change had a positive correlation with the damping coefficient. Figure 12b shows that the gyroscope precession amplitude decreased monotonously with the stiffness coefficient increasing, and its rate remained similar if the damping was changed. However, the variation trend of the pitch amplitude in Figure 12c was the opposite. These observations suggest a monotonic decrease in the ability for the wave energy absorption of WEC as the stiffness increased. However, it is worth mentioning that, as the stiffness k is small, the recovering ability of PTO from the wave excitation may be inadequate, causing a progressive accumulation of the precession deviation until it reaches a position perpendicular to the initial orientation (β = 90°), as illustrated in the Figure 13. The rate at which this deviation accumulates is directly influenced by the PTO damping coefficient c. As the damping decreases, the energy storage capacity of PTO reduces, which accelerates the accumulation of precession displacement errors, as evidenced by the results shown in Figure 14.
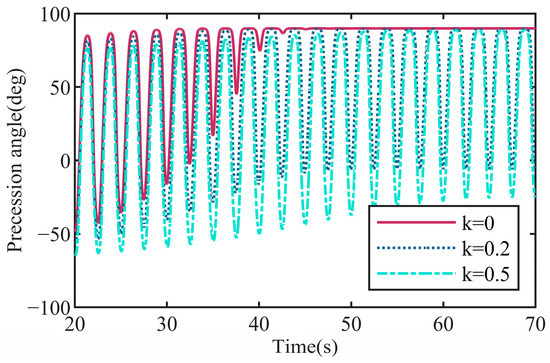
Figure 13.
Accumulated deviation in precession with a small stiffness k.
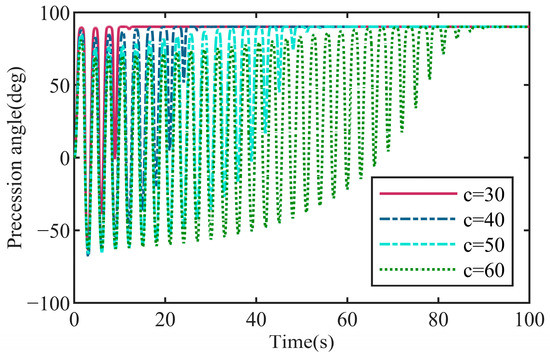
Figure 14.
Deviations (k = 0) in precession with various PTO damping c values.
3.4. The Effect of Coupling Wave Excitation of Multi-DoFs
In accordance with the design of the gyroscope, the direction that was orthogonal to both the precession of the gyroscope and the flywheel spin was specified as the sensitive axis, which in Figure 3 was represented by the Oxf axis and corresponded to the pitch DoF of the floater. Theoretically, when wave excitation is applied separately to the three DoFs of the floater, the gyroscope only responds to the excitation along the sensitive axis. However, when excitations of the three DoFs interact, a coupling effect is produced which alters the floater response on pitch DoF. In Figure 15, we compared the motion curves of gyro precession with the wave excitation on pitch DoF only to those with the coupling excitation of three DoFs, with parameters set as in case 10 in Table 3.
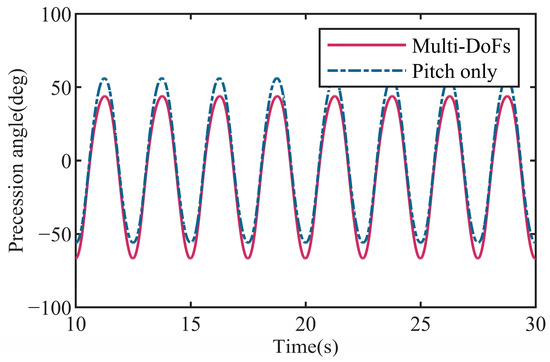
Figure 15.
Gyro precession with wave excitation on pitch only and multi-DoFs.
The simulation results in Figure 15 show that with wave excitations involving multiple degrees of freedom, the zero position of the gyro precession significantly shifts away from its original point, causing errors in the calculation results of PTO absorption power with two different models. To explore this issue further, we employed a sampling approach and fitted the deviation experienced across different PTO damping and stiffness conditions, as illustrated in Figure 16, into the simulation; the flywheel speed was set as υ = 10,000 r/min.
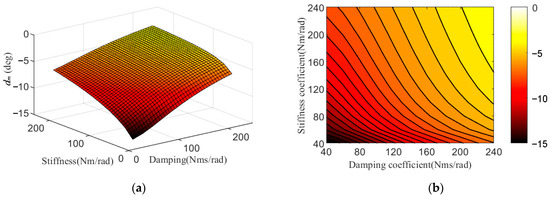
Figure 16.
(a) Gyro precession deviation dm with c and k; (b) contour plot of dm.
Figure 16 shows that the deviation dm increased with the damping and stiffness decreasing, and the damping and stiffness played similar dominant roles in the contour plot. Moreover, the deviations in Figure 16 might cause difficulties in the structural design of the WEC device, and might disrupt the movement of gyroscope. As such, we aimed to minimize the deviations while achieving maximum PTO absorption power, which will be discussed as one of our optimization objectives in Section 4.
We further investigated the error in the time-average power calculated with two different models, then depicted the relationship between the errors em of average power and PTO parameters. Figure 17 reveals that while the multi-DoFs excitation model displayed calculation errors, as compared to the model with pitch DoF only, the error em correlated closely with the PTO parameters. As the damping and stiffness increased, the error em became larger, and the damping played a dominant part in the contour plot.
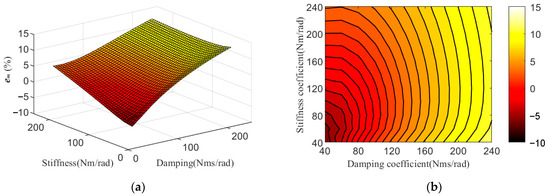
Figure 17.
(a) Errors of average power em with c and k; (b) contour plot of em.
To sum up, the simulations conducted above demonstrate that the flywheel speed, damping, and stiffness coefficient of the PTO system were the crucial factors that impacted the wave energy absorption capability when using the designed WEC device. The proper flywheel speed υ and damping c that maximize the absorbed power exist. Studies also indicated that stiffness k had a monotonic effect, while in the extreme scenario of k being nearly zero, the gyroscope tended to vertically deviate from the initial position, thereby eliminating the precession effect. The subsequent investigation delved into the contrast between the simulation outcomes of the multi-DoFs excitation model and the model on pitch DoF only, then ascertaining the association between these deviations and PTO parameters to provide a reference for further optimization design.
4. Optimal Design Method Based on the Multi-Objective of WEC System
In actual energy conversion, the power absorption of PTO is a critical link in appraising system performance. Furthermore, some other parameters such as energy consumption and safety, which affect the reliability and stability of equipment operation, also need to be taken into account.
An optimal design method developed from the multi-objective evolutionary algorithm based on decomposition (MOEA/D) was used to update and filter the optimal design of WEC system. The main idea of the MOEA/D algorithm was first proposed in Ref. [20], which was to employ a decomposition strategy to solve multi-objective problems. The MOEA/D algorithm uses Pareto decomposition to balance the objective functions, transforming the multi-objective problem into multiple single-objective sub-problems, which are solved by using evolutionary algorithms. Then, the solutions to these sub-problems are integrated to obtain the Pareto frontier of the original problem. The MOEA/D algorithm has excellent performance and robustness, demonstrated in many multi-objective optimization problems which can be effectively applied in the optimization design of our WEC system.
4.1. Design Variate and Objective Function
According to the results from the numerical simulation and analysis in Section 3, a vector that consists of the flywheel speed υ, damping c, and stiffness k, as the key design variables which determine the absorption capacity of WEC, was selected as:
In order to delimit the feasible solution space during the optimization process, the following constraints were defined as follows.
- 1.
- Based on the designed gyroscope, the rotation speed constraint of the gyro flywheel was defined as:
- 2.
- The constraint on the precession angle of the gyroscope was defined as:
- 3.
- Considering the safety of the equipment operation, the constraints on the pitch and roll directions of the floater were defined as:
- 4.
- To prevent the failure of precession caused by a small stiffness k value, the constraint on the adjacent wave peaks is as follows:
The optimization objective selected is as follows.
- The overall power output of the gyroscope system during energy conversion, as expressed by:
In our work, with the flywheel rotation in a vacuum, the contribution of velocity-square-dependent air resistance to energy loss can be ignored, with a1 ≈ 0. Instead, energy loss is primarily caused by mechanical friction, where a2 = 0.13 is the coefficient defined in Equation (28) [17].
- 2.
- The second objective to optimize is minimizing the precession deviation dm of the gyroscope, which is essential for maintaining system stability:
Taking all definitions into account, we can express the optimization objective vector J for the multi-objective of variate design as follows, in which gi (i = 1,2,...,6) are specified as the constraints.
4.2. Improved MOEA/D Method with Constraint Handling Strategy
In this section, we hope to employ conventional replication and enhancement methods of MOEAs [21]. However, conventional methods prioritize feasible solutions over unfeasible ones, which disregards the information present in the latter. In cases where feasible problem domains are limited, this approach may not work. To address this issue, we need to improve the MOEA, so a penalty function is utilized to penalize individuals that violate the constraints, reducing the fitness of unfeasible solutions instead of discarding them outright. The improved MOEA/D algorithm flow is shown in the Figure 18.
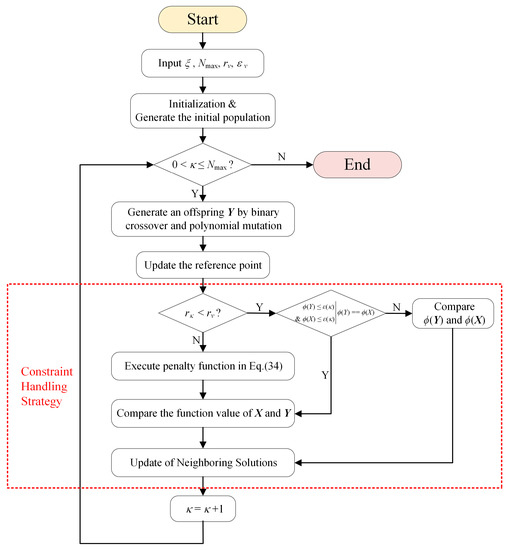
Figure 18.
Flow chart of the improved MOEA/D method.
To maximize information utilization within feasible ranges, the corresponding constraints are relaxed, with the degree of relaxation measured by the constraint coefficient ε [22]. Additionally, an adaptable penalty function is employed to preserve diversity within the population. In order to standardize the magnitude of constraints [23], they can be normalized by:
where gjmax represents the upper limit of each constraint range. The variable ϕ is then introduced to quantify the degree of violation of the constraint range for each individual, denoted by:
To compare two solutions, X1 and X2, their constraint violation degrees ϕ(X1) and ϕ(X2) must either be within the constraint range ε or be equal. Otherwise, the solution with a higher degree of constraint violation is discarded. To guide the optimization process, the value of ε can be adjusted dynamically with each iteration of evolution, particularly in the early stages to help prepare the randomly generated individuals for quicker convergence towards the feasible region. To handle constraints, we introduced κ as the current generation of evolution and denoted rκ as the ratio of feasible individuals in that generation. Then, a threshold rv ∊ [0, 1] was set to determine whether to enable punishment. The processing could be depicted as follows:
in which Pinf denotes the penalty coefficient of infeasible solutions, and Nmax is the maximum generation. F(Xi) represents the initial value of objective vectors, and Fmax is the maximum objective vector.
Rule 1.
At the beginning, ε(κ = 0) = ϕ(Xξ), where Xξ is the ξ-th individual in the initial population sorted in descending order according to ϕ(Xi);
Rule 2.
When rκ < rv, ε (κ) = (1 − εv)ε (κ − 1), where εv is the rate coefficient of the decline of rv;
Rule 3.
When rκ > rv or both are equal, the penalty function is used to screen the feasible solutions and the available non-feasible ones, which is expressed by:
4.3. Multi-Objective Optimization Results and Optimal Solution Selection
Applying the improved MOEA/D method mentioned above, the simulation case was set as ζs = 1 m, Tp = 2.5 s; the resulting Pareto optimal frontier is depicted in Figure 19. Furthermore, to assess the efficacy of our algorithm, a comparison can be made between our approach, the NSGA-III [24] method, and the typical MOEA/D [25] method without ε-constraint law, with their respective Pareto optimal frontiers also illustrated in Figure 19.
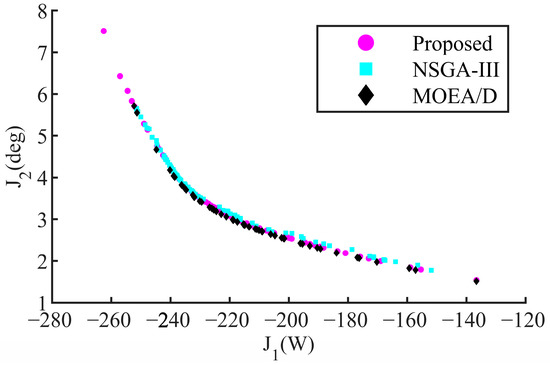
Figure 19.
Pareto optimal frontiers of various algorithms.
From Figure 19, it is revealed that the proposed method generated a more evenly distributed Pareto solution set for the problems of structural optimization design. This is due to the hybrid constraint strategy, which optimizes the diversity–convergence trade-off by leveraging unfeasible information in the evolutionary process. As a result, the obtained solutions have higher domination ranks and a more uniform distribution. To evaluate the quality of Pareto solutions obtained by various algorithms, this study employed the hyper volume (HV) indicator as a quantitative assessment tool [26]. By normalizing all solutions and combining them into an optimal Pareto front with a reference point of [1, 1], we used the normalized HV indicator to compare the performance of different multi-objective algorithms. In essence, the higher the HV value, the better the performance of the algorithm. To ensure the robustness of the results, the algorithm was run 20 times with a population of 200 individuals and 200 iterations each, and the HV values obtained for each run were averaged across the runs. The resulting summary statistics are presented in Table 4 for comparison. Moreover, in order to evaluate the real-time performance of the algorithm, the average time was calculated based on 20 runs above, as is given in Table 4. All simulation results were obtained using MATLAB 2020a on a Windows 10 computer with Intel® CoreTM i7-10700 CPU and 16 GB of memory.

Table 4.
HV values of various algorithms.
From Table 4, it can be observed that the algorithm proposed in this study achieved the highest HV value, implying superior performance in optimizing PTO parameters. The average calculation time of the proposed algorithm was 112.17 s, which can satisfy the real-time requirements, although it is not the fastest algorithm. The reason is that the measurement and estimation of irregular waves are slow and take several minutes, providing running time for the algorithm. In addition, the optimized parameters can also be formed into a database, which can be invoked in the reality work.
To select an ideal solution from the Pareto frontier, a Technique for Order Preference by Similarity to Ideal Solution (TOPSIS) based on entropy weighting was employed [27,28]. The impact of each objective on the overall solution was gauged based on the level of discretization. It was reflected by its entropy value, then assigned an appropriate weight. As a non-subjective weighting method, this approach is solely dependent on the intrinsic discretization of the objectives, and the implementation process is realized as follows.
Construct a matrix with the objective values corresponding to a group of optimal solution [X1, X2,..., Xm]T evolved, where m is the number of solutions.
Considering that the size of different objectives may vary significantly, the objectives are normalized by:
Then, the proportion of objective Ji(Xi) among j-th objective is given by:
Thus, the entropy of the j-th objective could be calculated by:
The weight of the j-th objective could be assigned by:
The comprehensive evaluation of each solution can be given by:
By using the evaluation function contained in Equation (44), a sorting process was performed on all solutions to identify the ideal one. The ideal solution for the given case is shown in Table 5. This method remains effective even when dealing with a greater number of objectives.

Table 5.
Optimal design parameters.
As the ocean environment changes, the components of WEC devices follow suit. We have illustrated the adaptability of the system to diverse sea wave conditions by constructing an optimal parameter variation trajectory through the linking of discrete ideal solutions. In Figure 20a, the trajectory of optimal results was obtained by sampling every 0.25 s within the 1–3 s wave period range. The variations in objective function values for each optimal point are given in Figure 20b.
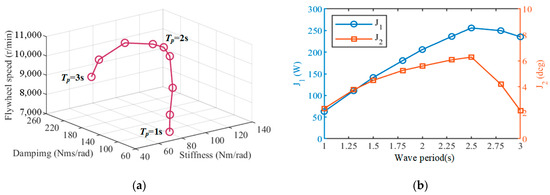
Figure 20.
(a) Optimal results with various wave period and (b) their objective function values.
Figure 20 illustrates that the main parameters of the WEC vary according to changes in the wave period. The theoretical maximum power capture occurred in the region where the pitch RAO peaked, which corresponded to a wave period of about 2.6 s. The flywheel angular momentum was critical for capturing energy; thus, it must be kept at a high speed with a limited range of adjustment available. As the system approached its resonant peak, the PTO damping c increased and the value of stiffness k needed to be allocated appropriately to ensure system stability. Because of its large range of adjustable parameters, PTO could serve as the primary control objective. Together, these results offer an illustration of the system performance over this wave period range, and the optimal ideal solution for the various cases by means of the improved MOEA/D algorithm and entropy weighting TOPSIS method. These optimal parameters might contribute clear guidance to the design and control of the WEC system.
5. Conclusions
- A novel wave energy converter was presented, comprising a floater, gyroscope, and PTO system. ANSYS/AQWA software was utilized to solve the hydrodynamic response of the device, revealing that the device primarily exhibits notable motion in the pitch DoF, in line with our design expectations.
- The dynamic model linking waves to the gyroscope and PTO was developed, allowing for numerical simulations in MATLAB/Simulink to demonstrate the impact of major variables on system performance. The simulation results reveal that there existed a peak value of absorbed power with variations of flywheel speed and PTO damping. It is necessary to find a balance between these competing factors to achieve the optimal absorption of WEC. Moreover, PTO stiffness is crucial to ensuring the sustained precession effect of the gyroscope; without sufficient stiffness, the gyro precession will cease.
- This study compared the response of models under two scenarios: wave excitation with multi-DoFs, and wave excitation with only pitch motion. The findings revealed that the precession of the gyroscope experienced some deviations, and an error also existed in the absorbed power of the PTO system between the two cases. The magnitude of these discrepancies was influenced by the variables of the gyroscope and PTO system.
- In order to optimize the wave energy absorption of WEC and minimize the deviation of the gyroscope precession caused by multi-DoF wave excitation, an improved MOEA/D algorithm was employed to optimize the major variables of the WEC system. Optimized variables such as flywheel speed, PTO damping, and stiffness were selected. The improved MOEA/D algorithm employed an adaptive constraint handling strategy with a penalty function to enhance the diversification of the population, and could lever useful information from the Pareto optimal frontiers and outside the feasible domain. The optimized results exhibited that the proposed method conducted well in terms of overall system performance through comparatives. Finally, the ideal solution was acquired using the entropy weight TOPSIS method. These optimal parameters might contribute clear guidance to the design and control of the WEC system.
Author Contributions
Conceptualization, Z.P., Z.T. and J.Y.; methodology, H.J. and Z.T.; software, H.J.; validation, H.J.; resources, Z.P.; writing—original draft preparation, H.J.; writing—review and editing, H.J.; funding acquisition, Z.P., Z.T. and J.Y. All authors have read and agreed to the published version of the manuscript.
Funding
This research received no external funding.
Institutional Review Board Statement
Not applicable.
Informed Consent Statement
Not applicable.
Data Availability Statement
Data sharing not applicable.
Conflicts of Interest
The authors declare no conflict of interest.
References
- Gunn, K.; Stock-Williams, C. Quantifying the global wave power resource. Renew. Energy 2012, 44, 296–304. [Google Scholar] [CrossRef]
- Penalba, M.; Ringwood, J. A review of Wave-to-Wire Models for Wave Energy Converters. Energies 2016, 9, 506. [Google Scholar] [CrossRef]
- Falcao, A. Wave energy utilization: A review of the technologies. Renew. Sustain. Energy Rev. 2010, 14, 899–918. [Google Scholar] [CrossRef]
- Falcao, A. Ocean wave energy conversion: A brief review. In Proceedings of the Workshop on Ocean Energy, Lisbon, Portugal, 6–8 October 2010. [Google Scholar]
- Salter, S.H. Wave power. Nature 1974, 249, 720–724. [Google Scholar] [CrossRef]
- Salter, S.H. Power conversion systems for ducks. In Proceedings of the International Conference on Future Energy Concepts, London, UK, 30 January–1 February 1979. [Google Scholar]
- Henderson, R. Design, simulation, and testing of a novel hydraulic power take-off system for the Pelamis wave energy converter. Renew. Energy 2006, 31, 271–283. [Google Scholar] [CrossRef]
- Bracco, G.; Giorcelli, E.; Mattiazzo, G. ISWEC: A gyroscopic mechanism for wave power exploitation. Mech. Mach. Theory 2011, 46, 1411–1424. [Google Scholar] [CrossRef]
- Bracco, G.; Cagninei, A.; Giorcelli, E.; Mattiazzo, G.; Poggi, D.; Raffero, M. Experimental validation of the ISWEC wave to PTO model. Ocean Eng. 2016, 120, 40–51. [Google Scholar] [CrossRef]
- Kanki, H.; Arii, S.; Hata, T. Gyro dynamics for New Wave Power Generation System. In Proceedings of the 7th IFToMM-Conference on Rotor Dynamics, Vienna, Austria, 25–28 September 2006. [Google Scholar]
- Fontana, M.; Casalone, P.; Sirigu, S.A.; Giorgi, G.; Bracco, G.; Mattiazzo, G. Viscous Damping Identification for a Wave Energy Converter Using CFD-URANS Simulations. J. Mar. Sci. Eng. 2020, 8, 355. [Google Scholar] [CrossRef]
- Khedkar, K.; Nangia, N.; Thirumalaisamy, R.; Bhalla, A.P.S. The inertial sea wave energy converter (ISWEC) technology: Device-physics, multiphase modeling and simulations. Ocean Eng. 2021, 229, 108879. [Google Scholar] [CrossRef]
- Medeiros, J.; Brizzolara, S. Mathematical Framework for Hydromechanical Time-Domain Simulation of Wave Energy Converters. Math. Probl. Eng. 2018, 10, 1155. [Google Scholar] [CrossRef]
- Hals, J.; Falnes, J.; Moan, T. Constrained optimal control of a heaving buoy wave-energy converter. J. Offshore Mech. Arct. Eng. 2010, 113, 011401. [Google Scholar] [CrossRef]
- Bacelli, G.; Ringwood, J. Numerical optimal control of wave energy converters. IEEE Trans. Sustain. Energy 2015, 6, 294–302. [Google Scholar] [CrossRef]
- Zhan, S.; Na, J.; Wang, B. Adaptive Model Predictive Control of Wave Energy Converters. IEEE Trans. Sustain. Energy 2020, 11, 229–238. [Google Scholar] [CrossRef]
- Vissio, G.; Valério, D.; Bracco, G.; Beirão, P.; Pozzi, N.; Mattiazzo, G. ISWEC linear quadratic regulator oscillating control. Renew. Energy 2017, 103, 372–382. [Google Scholar] [CrossRef]
- Hasselmann, K. Measurements of wind-wave growth and swell decay during the joint north sea wave project (JONSWAP). Deutches Hydrogr. Inst. 1973, A8, 1–95. [Google Scholar]
- Taghipoura, R.; Pereza, T.; Moan, T. Hybrid frequency-time domain models for dynamic response analysis of marine structures. Ocean Eng. 2008, 35, 685–705. [Google Scholar] [CrossRef]
- Zhang, Q.; Li, H. MOEA/D: A Multi-objective Evolutionary Algorithm Based on Decomposition. IEEE Trans. Evol. Comput. 2007, 11, 712–731. [Google Scholar] [CrossRef]
- Deb, K.; Beyer, H. Self-Adaptive Genetic Algorithms with Simulated Binary Crossover. Evol. Comput. 2001, 9, 197–221. [Google Scholar] [CrossRef] [PubMed]
- Fan, Z.; Li, W.; Cai, X.; Huang, H.; Fang, Y.; You, Y.; Mo, J.; Wei, C.; Goodman, E. An Improved Epsilon Constraint-Handling Method in MOEA/D for CMOPs With Large Infeasible Regions. Soft Comput. 2019, 23, 12491–12510. [Google Scholar] [CrossRef]
- Jan, M.; Zhang, Q. MOEA/D for Constrained Multi-Objective Optimization: Some Preliminary Experimental Results. In Proceedings of the 2010 UK Workshop on Computational Intelligence (UKCI), Colchester, UK, 8–10 September 2010; IEEE: Colchester, UK, 2010; pp. 1–6. [Google Scholar]
- Chai, R.; Savvaris, A.; Tsourdos, A.; Xia, Y.; Chai, S. Solving Multi-Objective Constrained Trajectory Optimization Problem by an Extended Evolutionary Algorithm. IEEE Trans. Cybern. 2020, 50, 1630–1643. [Google Scholar] [CrossRef] [PubMed]
- Jan, M.; Khanum, R. A Study of Two Penalty-Parameterless Constraint Handling Techniques in The Framework of MOEA/D. Appl. Soft Comput. J. 2013, 13, 128–148. [Google Scholar] [CrossRef]
- While, L.; Hingston, P.; Barone, L.; Huband, S. A faster algorithm for calculating hypervolume. IEEE Trans. Evol. Comput. 2006, 10, 29–38. [Google Scholar] [CrossRef]
- Zhu, S.; Zhang, H.; Jiang, Z.; Hon, B. A Carbon Efficiency Upgrading Method for Mechanical Machining Based on Scheduling Optimization Strategy. Front. Mech. Eng. 2020, 15, 338–350. [Google Scholar] [CrossRef]
- Zhang, P.; Li, H.; Ni, Y.; Gong, F.; Li, M.; Wang, F. Security Aware Virtual Network Embedding Algorithm Using Information Entropy TOPSIS. J. Netw. Syst. Manag. 2020, 28, 35–57. [Google Scholar] [CrossRef]
Disclaimer/Publisher’s Note: The statements, opinions and data contained in all publications are solely those of the individual author(s) and contributor(s) and not of MDPI and/or the editor(s). MDPI and/or the editor(s) disclaim responsibility for any injury to people or property resulting from any ideas, methods, instructions or products referred to in the content. |
© 2023 by the authors. Licensee MDPI, Basel, Switzerland. This article is an open access article distributed under the terms and conditions of the Creative Commons Attribution (CC BY) license (https://creativecommons.org/licenses/by/4.0/).