Review

Micro/Bubble Drag Reduction Focused on New Applications

by
Adelaida García-Magariño
*,
Pablo Lopez-Gavilan
,
Suthyvann Sor
and
Félix Terroba
Instituto Nacional de Tecnología Aeroespacial “Esteban Terradas” (INTA), 28048 Madrid, Spain
*
Author to whom correspondence should be addressed.
J. Mar. Sci. Eng. 2023, 11(7), 1315; https://doi.org/10.3390/jmse11071315
Submission received: 10 May 2023 / Revised: 22 June 2023 / Accepted: 26 June 2023 / Published: 28 June 2023
(This article belongs to the Section Ocean Engineering)

Abstract

:
Bubble drag reduction has been shown to be a promising technique for reducing the drag in ships, thus reducing the emission of pollutants and allowing the compliance with the new requirements imposed recently in this respect. Different searches have been conducted in the publications related to this technique, and an increase in interest has been shown, especially in the last decade. In this context, a review of the experimental work related to bubble drag reduction published in the last decade is presented in the present article. The works were classified according to the facility used (towing tank, cavitation tunnel, water channel, Taylor–Couette…), and the main finding are presented. It was found that two new trends in research have arisen, while there are still contradictions in the fundamental basis, which needs further study.

1. Introduction

Bubble drag reduction (BDR) is applied in a wide variety of applications such as the transportation of water or oil by pipelines, or reducing the hull resistance in ships. Among them, reducing maritime vehicle resistance leads to a reduction in energy consumption and the improvement in energy efficiency, which has constituted an active field of study and interest for the industry since the adoption by the International Maritime Organization (IMO) in 2013 of the Energy Efficiency Design Index (EEDI). Specifically, the EEDI establishes that newly built ships must comply with a level of energy efficiency linked to the type of ship. In addition, a gradual increase in restrictions is established every 5 years. A 30% reduction in fuel consumption is set as an objective for the period of 2025. The organization does not establish any technological restrictions, allowing the adoption of innovative technologies such as BDR to achieve the objectives. This reduction in consumption in maritime traffic is also included in the package of measures “Objective 55” of the European Union.
One of the sources of energy consumption and therefore the emission of pollutants is friction resistance, which, depending on the naval platform, can account for up to 80% of the total resistance to advance [1]. In order to reduce the friction forces, there exist methods related to the boundary layer such as polymer additives, superhydrophobic surfaces or air lubrication drag reduction methods [2]. Among them, this article is dedicated to air lubrication and, in particular, to microbubble/bubble drag reduction methods (see Figure 1). In 2010, Ceccio [3] reviewed the frictional drag reduction of external flows with bubbles. Later, in 2014, Murai [4] extensively reviewed the frictional drag reduction by bubble injection focusing on the understanding of the phenomena, thus reviewing also fundamental studies. One of the main problems regarding the impact of microbubbles on the reduction of hydrodynamic resistance, is that, according to experimental results, this depends on the local void fraction (Legner [5], Kim and Cleaver [6]) and the modification of the momentum transfer by turbulent structures as a consequence of bubbles (Murai et al. [7], Hassan and Gutiérrez-Torres [8], Paik et al. [9], Park et al. [10], Feng et al. [11]), its size being a very relevant parameter compared to the turbulent scale. From the comprehensive review of Murai [4], new experimental research has been conducted. For example, new experimental observations seem to indicate that the resistance reduction would be benefited by an intermittent injection linked to a frequency related to the length of turbulent recovery (Park et al. [12], Tanaka et al. [13]). In this context, the aim of the present article is to review the experimental studies related to BDR during the last decade. Although there are some recent reviews on bubble drag reduction, they are either more focused on the numerical nature, such as Sindagi et al. [1] or An et al. [14], or they are very specific, such as the one by Zhang et al. [15], which studied the recovery region of the separated turbulent boundary layer. In the review of An et al. [14], which reviewed the progress on air lubrication drag reduction technology for ships, only six publications related to experimental bubble drag reduction research since 2014 were mentioned in the article, while in Sindagi et al. [1], which reviewed the microbubble drag reduction (MBDR) and BDR techniques in reducing a ship’s drag, none of them were mentioned.
Additionally, Wang et al. [16] also gave a succinct account on gas lubrication, but they focused on the bubble mattress and bubble injection. The global benefit of the gas lubrication technique will depend on the ability to reduce the drag by injecting the gas with the smallest amount of energy, and therefore the bubble injection method is important. Broadly speaking, there are two main methods of inserting gas into the carrier phase: on the one hand, forced ventilation and, on the other hand, electrolysis. Regarding the first, we can find recent publications such as Zhao et al. [17], where the dynamics of bubbles inside a venturi-type generator are studied, or Zhang et al. [18] and Murai et al. [19], who study the generation of bubbles on naval platforms using hydroprofiling. A relevant review article on the mechanisms of microbubble generation can be found in Rodríguez-Rodríguez et al. [20]. According to Rodriguez-Rodriguez [20], the bubble size depends both on the pore/hole size and the gas flow rate in relation to the liquid flow rate. At the naval industry level, there are commercial solutions such as the “MHI Air Lubrication Systems” system or the “Silverstream” system. In the first, the holes made in flat plates are what determine the size of the bubbles, while the second uses the rupture of larger bubbles into smaller ones through Kelvin–Helmholtz instabilities. In total, more than 26 vessels of different types have implemented these commercial solutions, which demonstrates the interest in this type of technology. On the other hand, the reduction in hydrodynamic resistance through bubbles generated by electrolysis has been widely studied since its initial application by McCormick and Bhattacharyya [21] on the hull of a submersible model. This microbubble generation method is widely used in experimental facilities, as in Dominguez-Ontiveros et al. [22], Hassan and Gutierrez-Torres [8], and Murai et al. [7], among others. A novel article on its use in special groups of electrodes in a micrometric matrix can be found in Zhu et al. [23] as an interesting solution to increase its ability to reside in a region in a stable manner. Nevertheless, Wang et al. [16] concluded that although considerable progress has been made in understanding bubble injection, a solid knowledge of the physical basis occurring in bubbly flow is still missing.
In this context, where there is still no firm theoretical framework that explains the complexity of the observed mechanisms [23], this article presents a review of the microbubble drag reduction experimental publications during the last decade. First, the methodology used to select the publication data base for this review is shown in Section 2. Then, the results of the review are classified into different kind of experiments: Towing Tank, Taylor–Couette, Water Tunnel Channels, and others. Additionally, the relation between surface wettability and BDR is discussed. Finally, the main conclusions are drawn.

2. Methodology

The publication data base for this review has been constructed with the help of the Web of Science data base. The searches conducted have been summarized in Table 1, whereas the definitions of the search parameters can be found in Table 2. Table 3 shows the number of publications found and the percentage that were published in the last 10 years.
First of all, the words “Microbubble Drag Reduction” or “Bubble Drag Reduction” or “Bubbly Drag” (hereafter BDR) were looked for either in the title, the abstract or the topic (including keywords). In order to avoid articles related to recirculation bubbles, which are out of the scope of this review, the words related to them (see Table 2 for details) were excluded from all the searches. A total of 459 publications were found, with 271 published in the last decade, which means that almost 60% of the publications related were published in the last ten years. Then, more restricted searches were conducted. In the case of experimental research in BDR, 67% were published in the last ten years. The same happened with ship research in BDR. In order to study which articles were of a fundamental nature, the words “Boundary layer” were searched. In the case of the boundary layer of BDR, only 48% were conducted in the last ten years, which is fewer than in previous cases. However, 58% of the experimental research on the boundary layer of BDR were conducted in the last ten years. Finally, it has to be noted that 90% of experimental ship research on BDR was published during the last ten years. The data base used for the present review corresponds to the experimental research in BDR (search BDR & EXP).
Table 4 shows the number of publications per each year per each search, while Figure 2 shows the number of publications versus the year for three searches. It can be observed that BDR publications and ship BDR publications have clearly grown over the last 10 years while experimental BDR remains almost constant.
The publications found on experimental research on BDR (search BDR&EXP) were reviewed and classified according to the experimental facility used. First, a group of works conducted on towing tank facilities applied to ships were found (see Section 3). Then, other research studies of a more fundamental nature conducted in the Taylor–Couette setups, cavitation tunnel and water channel, among others, were found (see Section 4). Finally, publications were found on the use of superhydrophobic/hydrophilic surfaces in combination with BDR in order to control the bubble size (see Section 5).
Apart from previous publications, other less-related publications were also found. In particular, numerical works that used experimental data to validate the results were found [24,25,26,27,28,29,30]. Additionally, works related to partial ventilation cavitation [31,32,33,34,35,36,37,38,39] and supercavitation [40,41,42,43,44,45,46,47] appeared. Finally, there were some other non-related works [48,49,50,51,52,53,54,55,56]. As an example, Chanson et al. [48] study aerated flows. All these less-related and non-related works will not be discussed in the following sections.

3. Towing Tank Experiments Applied to Ships

A typical towing tank facility consists of a water channel and a moving platform outside the water that is able to tow a model through the channel (see Figure 3). From the search of publications conducted, only seven of them referred to microbubble drag reduction experiments conducted in towing tank facilities. In most of them, ship models were tested, with the most common type of ships tested being the barge [57,58] and the bulk carrier [59,60]. The length of the models ranged from 0.2 m in Ref. [58] to 6 m in Ref. [59] and the Froude number of the experiments varied between 0.08 in Ref. [61] and 1.34 in Ref. [62]. Regarding the bubble generation, in all cases a porous medium plate with holes connected to a compressed air system was used. The diameter of the holes/pores was different for each experiment, ranging from 50 μm in Ref. [61] to 10 mm in Ref. [59]. The injection location also varied. The size of the bubbles generated is not usually provided, but instead either the flow rate or the injection flow coefficient is usually used. The flow rate is generally measured by means of flowmeters [60,61]. In this way, the injection coefficient is defined as [57,58,62]:
α Q = Q a Q w
where Q a is the air injection flow rate and Q w is the water flow rate within the boundary layer. Based on the turbulent boundary layer theory [63], assuming a seventh power velocity distribution across the boundary layer, estimating the boundary thickness by the Schlichting formula [63] and simplifying by assuming an equivalent zero pressure gradient at the trailing edge of the hull, the water flow within the boundary layer can be calculated by the following expression:
Q w = 0.292 × L 0.8 × ν 0.2 × V 0.8 × W
where L is the length of the ship, W is its width, ν is the kinematic viscosity of the fluid and V its velocity. In the cases where there is an air layer, the parameter used to quantify the air injected is the ideal air layer thickness, defined as follows [59]:
t A L = Q a V i n B
where V i n is the inflow velocity and B is the transverse width of air injection entrance. The drag reduction due to the presence of the microbubbles or the air layer is usually defined as [57,58]:
D R % = C T C T 0 C T 0 · 100 %
where C T is the coefficient resistance with air injection and C T 0 is the coefficient resistance without air injection.
Table 5 shows the main setup characteristic of each of the air lubrication experiments conducted in the towing tank found in the search. First, in 2013, Sayyaadi et al. [62] studied the optimum injection flow rate for achieving maximum microbubble drag reduction by performing towing tank experiments in a catamaran model at four model speed velocities (Fr = [0.36–1.34]). Air was injected at three position along the overall length of the model, increasing the injection flow coefficient by steps of 0.1 up to 1. The results of the experiments showed that a maximum rate of drag reduction (around 8%) was obtained for an injection coefficient of between 0.4 and 0.6 and lower speeds. It was established that the maximum drag reduction effect decreases as the speed increases, and at higher velocities the injection rate should increase, since bubbles are pushed out of the boundary layer. Finally, it was also observed that with an excessive supply of the quantity of microbubbles, the drag reduction decreases, and they explained this by a decay in the turbulent boundary layer and a piling up effect, where small bubbles coalesce to form larger bubbles.
Later, in 2017, Mäkiharju [64] conducted an experimental and numerical study on two barge models, which had different boundary-layer thicknesses at the location of the gas injection, in a towing tank facility with a Froude number between 1.3 and 7.2. Instead of a porous medium with an array of holes, in this case the air was injected through one hole at an inclination angle. At this location, a plume was formed and, as the gas pocket convected downstream, a bifurcation into two different branches appeared, and under some circumstances there appeared a bubbly flow between them. The boundary layer profiles were measured at the air injection location by a traversing pitot tube from 0 mm to 250 mm beneath the surface, for each flow speed and barge model. Although the authors did not conclude anything regarding the drag reduction, interesting finding were obtained regarding the boundary layer. The authors found large flow structures formed in front of the gas injection location that persisted downstream, thus modifying the boundary layer similarity law of the parallel velocity profile as u / U = y / δ 1 / n , where U is the free stream velocity and y / δ the similarity variable. The authors found for the turbulent case a value of n between 5 and 8.
In 2018, Yanuar et al. [57] performed towing tank experiments on a self-propelled barge ship type at different speeds (Fr = [0.10–0.31]) with either microbubble injection (with different injection coefficient) or air layer injection (with different flow rates) to compare these two techniques and their drag reduction effects. It was found that drag reduction of Microbubble Drag Reduction (MBDR) was higher than that of Air Layer Drag Reduction (ALDR) under high Froude numbers (Fr > 0.28), which was apparently due to the propagation movement over the entire hull. On the other hand, for a low Froude number, the air layer configuration had greater advantages over the microbubbles, obtaining a maximum drag reduction of around 90% (at a flow rate of 85 standard liters per minute and Fr = 0.15) as compared to 50% for MBDR (at an injection coefficient of 0.2 and Fr = 0.11).
In Gunawan et al. [58] in 2019, an experimental study in a towing tank facility was carried out on a 1:45 scale flat-hull barge ship model made of fiberglass. The model was instrumented with a load cell that measured the resistance to the advancement anchored at 0.35 L (L = length of the ship). The model was dragged at a different constant speed for 0.1 < Fr < 0.35 and had an air injector installed through a porous medium at 0.1 m from the bow and another system at 0.05 m from the midpoint. The system consisted of a mechanical injector with tank, flow meter and flow regulation valve, which generated bubbles through a porous medium. It was found that for Fr > 0.23, the difference between the resistance with and without microbubble injection, for the configuration close to the bow, was greater. The author based this event on the generation of a sheet of air for high values of α Q and low speed, which can break into large bubbles (all of which significantly affects the structure of the boundary layer). This increased the size of the wake and could lead to lower drag reduction values or even increase the drag. On the other hand, high velocities and high injection coefficient values kept the microbubbles in the boundary layer and were linked to higher drag reduction values. The additional conclusion was that for flat and slender hulls, the forward location of the injector gave better results, affecting larger sections of the wetted surface without leaving the boundary layer.
Another publication that appeared in the search was the one by Hao et al. [59] in 2019, where, although bubbles appeared in the transition to create an air layer, the article was mainly focused on ALDR. The authors initially carried out an experimental study in a towing tank facility of eight different types of cavity design on a rigid flat plate, whose leading and trailing edge consisted of a symmetrical NACA 0015 profile. In the front part of the lower surface an injection system with a matrix of holes was installed. Three floating-type local shear sensors were installed on the bottom surface. The shape of the air layer was measured with a camera located at the bottom of the channel and the continuity of the air layer was analyzed for the different designs and different values of ideal air layer thickness. In addition, the reduction in hydrodynamic resistance was studied, reaching a value of up to 38.7% for Fr = 0.272 for one of the cavity designs. They also studied the stability of the air cavity by analyzing the persistence of the reduction in resistance over time from the moment the air injection was interrupted. As a result of the conclusions of these tests, another experimental study of resistance and self-propulsion was carried out in the same facilities on a 1:38 scale bulk carrier ship model with a flat hull (95K DWT). The physical model consisted of an air injection system by compressor through a matrix of holes located at the bow. In addition, a cavity of 4.32 m × 0.82 m and 25 mm deep was designed on the bottom, so that it was estimated that 40% of the wetted surface would be affected by the reduction in resistance due to the viscous friction in the design conditions.
In 2021, Sindagi et al. [60] performed an experimental study on a scale model of a bulk carrier in a towing tank facility at different speeds (6–10 knots), with two series of different sizes of injection holes (2 mm and 1 mm) at different air injection rates. Acrylic sheets were used to replace the bottom to visualize the flow and the migration of the bubbles. At the lowest velocity (6 knots), a continuous air layer was formed, while as the velocity increased, bubbles were formed separately. The size of the bubbles depended on the speed of operation and the air injection rate. The smallest bubbles were generated for a speed of 8 knots (average size: 10 mm) while larger bubbles were generated for 10 knots (average size: 40 mm). It was observed that at 8 knots, where the droplet size was smaller, the drag reduction was found to be minimum, and the authors concluded that larger holes (2 mm) resulted in higher reduction.
In 2022, Zhao et al. [61] carried out a numerical and experimental study on a flat hull model with paneling on the sides to prevent bubbles from leaving the measurement regions and a central keel whose function was to prevent the drift and the generation of asymmetries. The model was dragged at constant speed for 0.08 < Fr < 0.20 and had an air injector installed at 0.75 m from the bow. The system consists of a mechanical compressed air injector that introduces air through 102 filters with 50 μm holes, at flow rates of 0.25 m3/h up to 10 m3/h. As a result, the authors found three areas of resistance reduction, depending on the volumetric flow and speed. Thus, for low flows and low speeds (0–2 m3/h and Fr < 0.1), the resistance reduction (DR) was practically null or even negative. There was a second region with reductions with rapid growth for 2 m3/h < Q a < 6 m3/h and intermediate Fr and later a region of horizontal asymptote where the incorporation of more air did not contribute to reducing the hydrodynamic resistance. In addition, the morphology of the air for the three zones was studied. In the first zone, the MBDR was encountered, in the intermediate region a transition to ALDR combined with intermediate bubbles was found, and in the last region ALDR covered completely. On the other hand, according to the authors, the size of the bubble was a dominant parameter for the MBDR region, with the finding that the smaller the size, the better the DR. However, this is in contrast to the previous results of Sindagi et al. [60]. On the other hand, speed was also found to be relevant, as it affected the size of the bubbles, with a higher DR for a higher Fr. In the ALDR regime, the dominant parameter is the air layer coverage and the DR follows an increasing trend with Fr. In the case of a two-phase flow with air bubbles, the viscous stress tensor can be modeled as:
τ = μ m U m n = ρ m υ m + υ t m U m n
where the subscripts “m” refers to the values of the mixture, υ m the kinematic viscosity of the mixture, υ t m the turbulent viscosity of the mixture, ρ m the density of the mixture and U m the velocity. Regarding the increase in DR with the size of the bubbles, it was found that an increase in DR implies an increase in υ t m , while the density change is insignificant, leading to an increase in the effective dynamic viscosity.
Finally, during this decade, void waves during microbubble drag reduction have first been studied. In 2016, Park et al. [64] carried out an experimental study in a towing tank facility on a flat hull ship model with paneling of 0.02 m on the sides. The ship model was a flat plate with a bevel at 45° on it to avoid effects related to separation and recirculation. The model was set to maintain a draft of 0.09 m. The model had an air injector installed at 0.7 m from the bow that introduced air through 42 holes of 5 mm in diameter. It was instrumented with shear sensors, ultrasonic bubble measurement systems and optical/image systems. The bubbles were recorded by a high-speed camera on the model that could be moved longitudinally. The model was dragged at constant speed between 2 and 3 m/s, so the experiment was controlled on two parameters: drag speed and air flow rate. The void fraction in the turbulent boundary layer was estimated as:
α δ = Q a Q w + Q a Q a W 0 δ V y δ 1 7 d y b e i n g   δ = 0.37 x 4 5 υ V 1 5
where W is the width of the ship, V the average downward velocity of the liquid phase on the border of the boundary layer, υ the kinematic viscosity of the water, δ the thickness of the boundary layer and x , y the Cartesian coordinates of the model ship. The random addition of bubbles acts as a trigger to the stable transition to the turbulent state. Thus, for the frontal region with α δ > 2 % , the viscous friction near the insertion point intensifies, decreasing in the middle and rear regions of the hull until reaching global DR values of 30% for α δ = 4.2%. The impact was measured through the resistance reduction ratio parameter, defined as:
D R r = ( 1 τ w / τ w 0 ) / α δ
with τ w being the stress with the bubble injection and τ w 0 the stress without the bubble injection. The D R r ranged from 4 to 7, which indicates that the reduction is due to the interaction between phases in the boundary layer rather than to the reduction in the density of the mixture. In addition, the authors found a trend in the DR curves parameterized with α δ . On the other hand, an average advection speed u b was observed in the bubbles, which was measured through particle image velocimetry (PIV). The ratios were 0.45 < u b / V < 0.65 . A reduction in D R r was observed simultaneously with the reduction in u b / V . During the operation, the authors also observed the propagation of local groupings of bubbles that separated from each other, forming vacuum waves with a recognizable spectrum. To estimate this, a normalization of the image with the maximum intensity value and a Fourier intensity spectrum analysis were used. The wavelength was estimated as u b / f b , where f b was the vacuum fluctuation frequency that was in the range of 3 to 8 Hz. The speed affected the intensity of the frequency peak, and, on the other hand, the fraction of vacuum moved the peak at lower frequencies, which may be linked to the coalescence between neighboring waves, according to the authors. On the other hand, the authors found a stochastic behavior, which they explain by the fact that the length of the coherent structures (estimated as 100 times the friction length, which is defined as l τ = υ τ w 0 ρ   w i t h   ρ being the density of water) is several times smaller than the bubbles diameter. The authors relate the DR and the local void fraction to the alteration of the coherent structures. Finally, the authors developed an expression based on the single-phase boundary layer development and Navier–Stokes equations to introduce a relationship between the time variation of the local void fraction linked to the spatial variation of the void fraction and the spatial variation of the stresses on the wall, as:
2 α δ t 2 = U δ 2 α δ x 2 + x τ w ρ δ   b e i n g   U δ = 1 δ 0 δ u d y
where u is the velocity component in the x direction. Then, the authors modeled the viscous stress as the following empirical correlation:
τ w = τ w 0 1 G 1 α δ G 2 α δ x
where G 1 and G 2 are the impact factor of drag reduction to void fraction or the local gradient of the void fraction, respectively, in the boundary layer. Finally, the authors obtained the equations that govern the void fraction fluctuation as:
2 α δ t 2 = C 2 2 α δ x 2 G 1 τ w 0 ρ δ α δ x
C 2 = U δ 2 G 2 τ w 0 ρ δ
with C being the velocity of the wave propagation. In the article, the parameter G 2 was estimated as:
G 2 = 2 δ C f 1 C U δ 2 0.1   m 0.003 1 0.6 2 21   m
which implies that the bubble had a transitory effect up to 21 m ( C f = frictional coefficient). Finally, the authors emphasize that the theoretical attempt to prove the potential occurrence of void waves does not provide a mechanism to generate them or to determine wave length.
Later, in 2018, Park et al. [12] continued their research and performed new experiments in the towing tank, similar to previous experiments except for the air injection system whose hole diameters were 100 µm instead of the previous 5 mm, so injection of the bubbles is smoothed. The shear sensors were located at 1.1 m, 2.3 m and 3.5 m from the bow. Four air flow rates were tested: 1.25·10−3 m3/s, 1.67·10−3 m3/s, 2.08·10−3 m3/s and 2.5·10−3 m3/s. The equivalent diameter of the bubbles was obtained through the area of the binarized image, obtaining a mean value of 3 mm that coincided with that predicted by Sanders et al. [66] for bubbles in shear layers. The bubbles were grouped in a histogram with the population peak next to the critical fragmentation Weber number. The authors found that the bubbles injected by the pores followed the flow without separating from the flat bottom. As they evolved downstream and the effect of the vacuum waves became evident, the bubbles tended to accumulate and coalesce into larger ones that, when reaching a Weber number value above the critical number, broke into smaller ones, which appeared in the dispersion of the diameter histogram. The authors link the vacuum wave to the scale lengths associated with the boundary layer rather than individual bubble interactions. In this case, the injection system allowed the turbulence provided to be less with bubble injection speeds of the order of 2%. On the other hand, they found results similar to those of previous studies, which seemed to indicate that the effect of the injection system disappears downstream. The vacuum wave evolved in both amplitude and length as it proceeded downstream with a wave frequency in the interval 5 Hz < f v o i d < 30 Hz. The authors found that the peak frequency evolved downstream as:
f p e a k f r e f = 0.007 α δ   b e i n g   f r e f = V δ X X 2 2.5
where X is the streamwise coordinate from the bubble injection point, V is the main flow velocity and X 2 is the distance to the mid region from the injector. On the other hand, starting from a limit value of Q a , the intensity of the peak decreases, so it is to be expected that if the air injection flow rate continues to increase, the entire surface will be occupied by bubbles, and therefore the effect of the vacuum waves will disappear. The authors finally identify potential different trigger mechanisms of the vacuum wave: the Tollmien–Schitling wave, the Kelvin–Helmholtz wave, the Richardson wave, and the renewal of the boundary layer scale, as a consequence of the loss of kinetic energy of the flow in the boundary layer.

4. Fundamental Experimental Studies

Different experimental setups are utilized to study the fundamentals of the drag reduction due to the injection of microbubbles in a turbulent boundary layer. Among them, the setups used most are the Taylor-Couette experiments, the water channel experiments and the cavitation tunnels, although some other setups are also employed. In the following section, the publications reviewed are classified depending on the experimental setup used for the investigation.

4.1. Taylor–Couette Experiments

A Taylor–Couette flow consists of the flow between an inner cylinder of radius R i and height H rotating at angular velocity ω i inside another cylinder of radius R 0 (see Figure 4). The Reynolds number, the radius ratio and the Taylor number are usually defined respectively, as follows:
R e = ω i R i d υ
η = R i R 0 ,
T a = R e 2 1 η η
where υ is the kinematic viscosity and all the lengths are defined in Figure 4. The Taylor number takes into account the curvature effect.
According to Fokoua et al. [67], the bubbles induced a modification of the viscous drag in a Taylor–Couette flow that is of interest in the context of naval hydrodynamics, since there are several similarities with the turbulent boundary layer of a flat plate for a moderate-to-high Reynolds number, such as:
  • Inner layer of constant shear stress (linear evolution of the azimuthal velocity):
  • Logarithmic azimuthal velocity law (farther from the wall).
In addition, for the transitional region, the Taylor contra-rotating vortices are similar to the energetic turbulent structures that occur in the very-near wall region of a flat plate.
In order to shed light on the mechanism involved in drag reduction by the introduction of bubbles in the turbulent boundary layer, Fokoua et al. [67] performed experiments using a Taylor–Couette configuration whose main parameters can be seen in Table 6. First, they characterized the single-phase flow and then they introduced bubbles and compared the results. They found two different trends, depending on whether the bubbles were trapped or not by the Taylor vortices. When the bubbles are trapped, an increase in viscous torque is generated by a reduction in the axial wavelength, while a capture of the bubbles in the outflow reduces the viscous torque, increasing the axial wavelength. For small Reynolds numbers, a decrease in the viscous torque was found, while for larger Reynolds numbers an increase was evidenced, with the transition between these two trends depending on the bubble size.
Moreover, Maryami et al. [68] also conducted experiments in a Taylor–Couette setup, but in this case a circulated vertical flow was also added (axial flow) by injecting water at the bottom from a pump (see Table 6 for details of dimensions). The rotating internal cylinder was painted in matt black and the outer concentric hollow cylinder was made of transparent acrylic. The speed of rotation assumed a rotating Reynolds number of 7·103 < Re < 7·104, as defined before. The Reynolds number of the axial flow was 299.15 < R e a x < 396.27, defining the axial Reynolds number as R e a x = 2 δ U m ν w where U m is the speed of the axial flow. The Taylor number will be 8.1 · 10 6 < T a < 7.6 · 10 8 . Therefore, the appearance of Taylor instabilities is foreseeable. The system also consisted of an air compressor injector through a porous medium with a flow regulation valve installed in the lower point of the outer cylinder. The void fraction was calculated as previously, as α δ = Q a Q a + Q w and lay between 0% and 10.33%. The diameter of the bubbles oscillated between 0.8 and 1.7 mm and was processed through the treatment of images taken with a 1920 × 1080 pixels resolution camera in combination with an image tool that combined background subtraction, binarization and edge detection. For the hydrodynamic resistance calculation, two pressure ports located in the lower and upper region ( P 1 and P 2 , respectively), were used, and the pressure drop was calculated as h = λ l U m 2 4 δ g where l is the distance between sensors, g is the gravity and λ the head resistance coefficient. The head resistance coefficient λ is related to the axial Reynold number R e a x and, as a general rule, decreases when the axial Reynolds number is increased. On the other hand λ increases when, for a given number of R e a x , the rotatory Reynolds number R e   i s   p r o g r e s s i v e l y   i n c r e a s e d . Thus, for a Taylor–Couette flow with superimposed axial flow, centrifugal and axial friction forces appear, inducing a normal gradient to the wall that delays the formation of Taylor vortices, which appear at a higher Ta. In the opposite case, for a given axial Reynolds number, if we increase the rotating Reynolds number, we will increase the Taylor number and favor the appearance of Taylor vortices. Since the head loss appears due to the transfer of moments, the damping of the latter reduces the head loss. On the other hand, for the relationship between λ and R e , the effect of bubbles is reduced for the high axial Reynolds. Finally, the authors studied the impact of bubbles on the head loss coefficient using the parameter ξ = 1 λ λ 0 , where λ 0 is the coefficient without bubbles. Thus, for small air flows and a low axial Reynolds number, there is an improvement in terms of head loss. On the other hand, for high ξ numbers, the injection of bubbles contributes significantly negatively in some rotational Reynolds regions between 2·104 and 6·104. The authors speculate on the contribution of bubbles in terms of turbulence, thus indicating that for low rotational Reynolds numbers the bubbles can move in three dimensions. As the rotational speed is increased, the bubbles accumulate, trapped by the centrifugal force, and are trapped in the rings of the vortical structures. The effect is to modify the fluid magnitudes (density, turbulent viscosity…) and the deformability dampens the turbulence. On the other hand, lower rotating speeds decrease the momentum transfer in the vortical structures, elongating them. As the axial Reynolds number is increased, the movement of the bubbles induces fluctuations, increasing the resistance. On the other hand, if the rotating Reynolds number is increased, we will find ourselves navigating between the two previously mentioned effects, so that the reduction in resistance will depend on the survival of the Taylor vortices.
According to the review by Sun et al. [69], the main experimental techniques in this type of systems are: flow visualization, intrusive techniques such as Pitot tubes or thermal anemometry, and non-intrusive techniques such as laser Doppler anemometry or particle image velocimetry. The authors state that special attention must be given to the seeding of apparently non-intrusive techniques, since the particles or small bubbles introduced in the flow could change the topology, thus reducing the drag, as explained before. Therefore, they should be small enough and their influence on the flow should be studied, as discussed in Sun et al. [69]. For the global torque measurements, the power of the driving motors could be monitored or a strain gauge load cell could be used. Finally, the real challenge in a bubbly Taylor–Couette flow is the measurement of the bubbles’ sizes and distribution. In this context, an optical fiber technique is mainly used in bubble detection.
Although numerical studies are outside the scope of this review, it has to be noted that the experimental data provided in the experimental studies are useful for the numerical and theoretical approaches. In the case of Taylor–Couette flows, some specific numerical studies were dedicated to this setup, and the results were compared to experimental data [70,71,72].

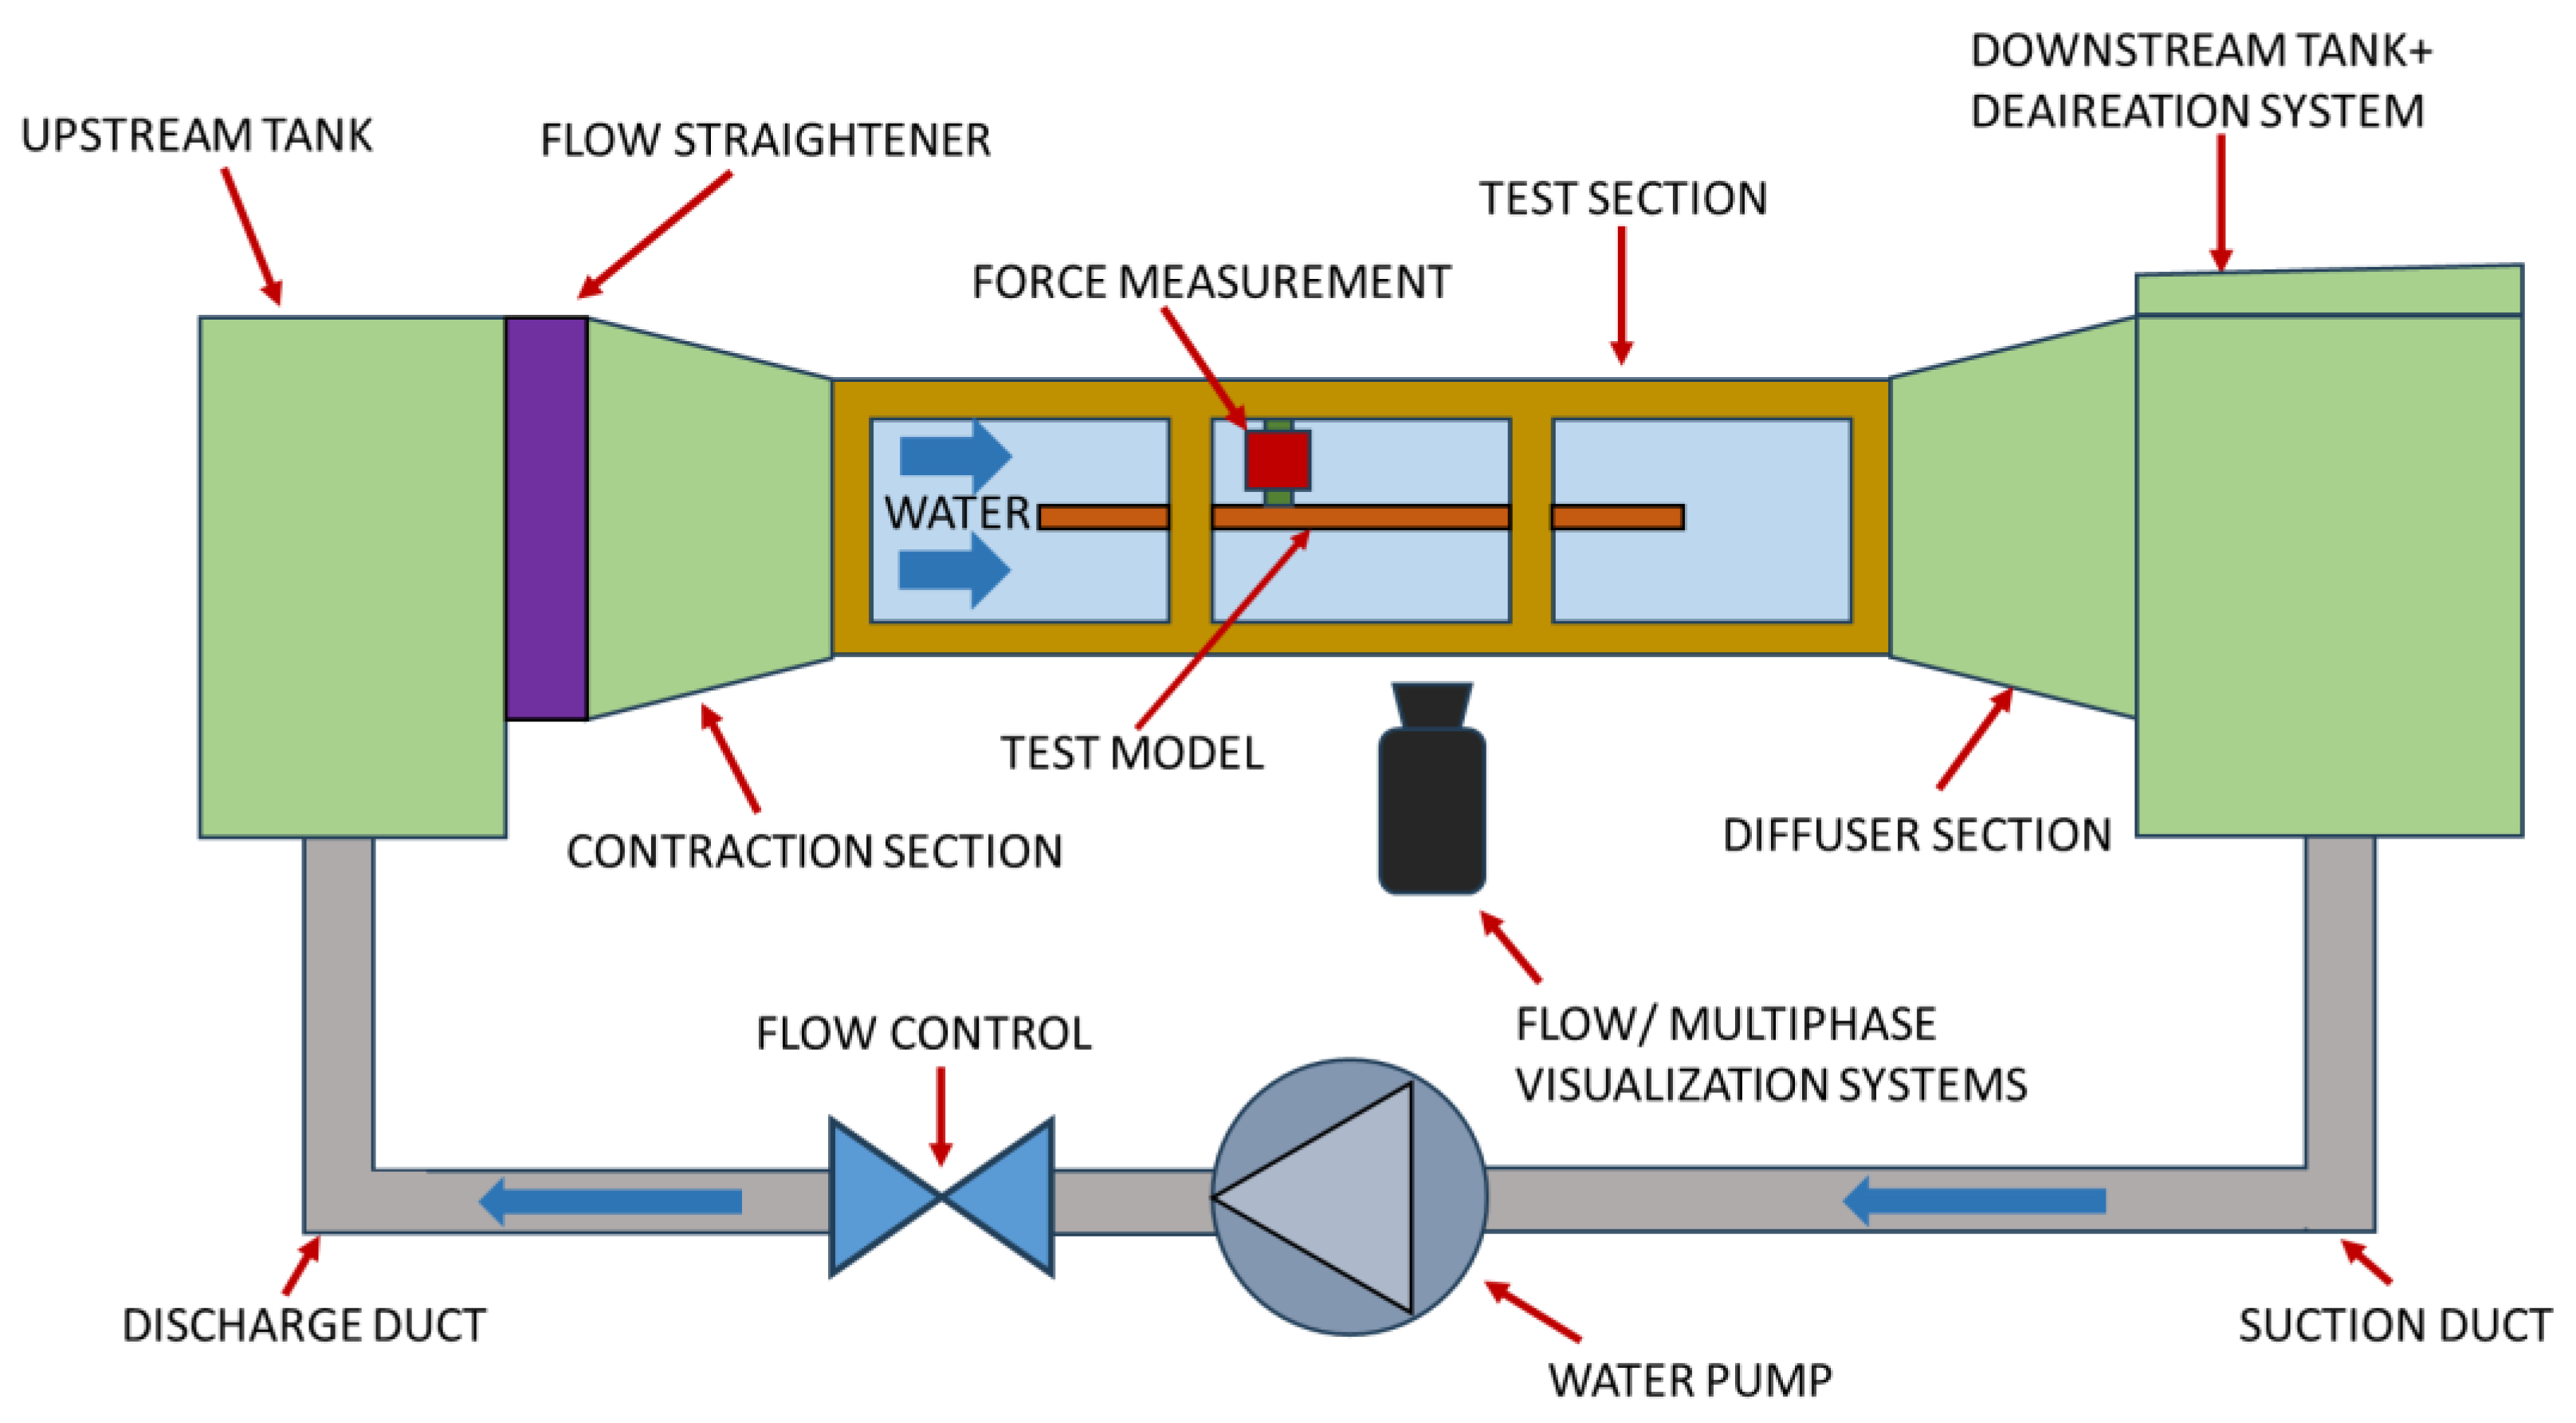
4.2. Cavitation Tunnel/Water Tunnel Channel Experiments

A typical facility for studying the hydrodynamics of ships is the cavitation tunnel, which is a water tunnel in which the pressure can be controlled (see Figure 5). However, testing microbubble drag reduction may be difficult, because the injected air may vary the pressure through time, thus limiting the operational time, and therefore limited studies have been conducted in that type of installation. In order to avoid this problem, in the study by Elbing et al. [73], a stable free surface was generated by means of a triangular wedge attached to the top of the tunnel just before the test section, allowing the air injected beneath the test model to escape, and minimizing the variation in tunnel pressure (see Table 7 for details of the experiments). On the other hand, in other studies such as the one by Qin et al. [74], both the changes in temperature and in pressure were neglected. Instead of cavitation tunnels, simple water tunnel channels have also been employed to study the air lubrication technique, such as the ones used by Wu et al. [75], Zhang et al. [15], Evseev et al. [76] or Hazuku et al. [77]. In any case, in either the cavitation tunnel experiment or the water tunnel channel experiments, the type of studies conducted were of a more fundamental nature, and instead of ship models a flat plate model (or the channel wall) was usually employed, leading to the following interesting findings.
First, in 2013, Elbing et al. [73] studied potential scaling laws for both air layer reduction and microbubble drag reduction, although they explained that multiple mechanisms are involved in MBDR and they are not fully understood, which makes the obtention of the scaling law difficult. In any case, the authors performed experiments at a water speed velocity of 6.3 m/s inside a cavitation tunnel on a flat plate of 12.9 m length, 3.5 m width and 18 cm depth, that had a backward-facing step (BFS) of 13 mm at the air injection location. The cavitation tunnel employed was the US Navy’s Willian B. Morgan Large Cavitation Channel, with a square test section with a side of 3.05 m, which is 13 m long. Additionally, other flow perturbations rather than the BFS were also employed upstream, in order to modify the level of the incoming turbulence. Floating-plate-type drag balances were used to measure local skin friction at four streamwise points. The drag reduction is now defined as:
D R % = 1 τ w τ w 0 · 100 %
Moreover, a three-probe traversing system, which consists of pitot-static, electrical impedance and time of flight, allowed the measurement of the interfacial velocity of the passing bubbles, the void fraction and the local stagnation and static pressure. In the case of BDR, a slip between phases was found from the measurements of the interfacial velocity.
Later, in 2017, in Qin et al. [74], a numerical and experimental study was carried out on a model of a flat aluminum plate with roughness k ≤ 0.5µm, which had an elliptical hydrodynamic leading edge and another elliptical profile on the trailing edge. The model was installed in the cavitation tunnel of the “Shanghai Ship and Shipping Research Institute”, with a test section of 2.6 m × 0.6 × 0.6 m. Tests were conducted at three speeds: 4, 6 and 8 m/s. The model had a line of 25 air injectors installed. The system consisted of a mechanical compressed air injector combined with an accumulator and two solenoid valves of different capacities. Ranges between 23.55 and 117.76 L/min were studied. The system was also instrumented with six force transducers to measure cutting efforts, with a capacity up to 100 N. Images were taken through high-speed cameras of 1280 × 960 pixels at 4000 fps. The area of interest was 70 mm wide and 52 mm high. Images of the biphasic fluid were taken at 130 times the distance between the injectors. The bubbles’ diameter histogram was studied, and it was observed that at higher injection volumes the bubble sizes decreased and greater resistance reductions were achieved. The sizes were studied through the manual selection of 200 bubbles. For moderate injection rates, the bubble sizes decreased with speed and showed distributions mainly dependent on speed without being significantly affected by the volume of air injected:
D m a x σ / 2 ρ 3 / 5 ε 2 / 5
with σ being the surface tension, ρ the density of the carrier phase and ε the rate of dissipation of the turbulent kinetic energy. The study focused on bubbles larger than coherent structures, which led to the fact that most of the DR is a consequence of the development of biphasic flow in the turbulent boundary layer. The evolution of the ratio of the friction coefficient with and without bubbles, C f / C f 0 , was studied along the dimensionless streamline distance to the bubble injection, ( x x i n j ) / δ (where δ is the thickness of the theoretical boundary layer for a single phase). The results were that the downstream trends were very similar, regardless of the volume of air injected, and a region of hydrodynamic resistance reduction appeared near the injector, whose length increased with the volume of air injected. The authors also found fluctuations in the DR, as in the case of other authors who study vacuum waves, and divided the evolution of the ratio of viscous coefficients into four regions: a region I affected by the injector, another region II, where there is a high resistance reduction (up to 100%) in a sustained manner, a transition region III, and a persistent region IV, but with low DR values. The authors also studied the thresholds for transition between regions (named as x i n i , x t r a , and x c r i , respectively). The conclusion was that x c r i and x i n i are not significantly influenced by the overall void fraction, while they are strongly influenced by the free flow velocity. On the other hand, x t r a follows a monotonic relationship with Q a Q a + U b δ 0 δ 0 * where b is the injection region width, U is the velocity, δ 0 is the boundary layer thickness and δ 0 * the displacement thickness. Finally, the authors studied the mechanism of the distribution of the reduction of resistance by bubbles, estimating that the local void fraction in region II close to α δ = 1 is responsible for reaching a DR of between 80% and 100%. Subsequently, the effects of bubble migration with respect to the wall as a consequence of shear thrust lead to regions III and finally IV, with values of around 20%. According to the authors, the presence of bubbles alters the internal physics of the boundary layer, modifying its viscosity, density, turbulent structure, and velocity gradient. The shear stress can be simplified as follows:
τ = ρ ( υ + υ t ) U y
where υ is the viscosity and υ t is the turbulent viscosity. The authors noted that the first three factors have been extensively studied, while U ¯ y is usually considered unchanged. For this reason, they studied the gradient obtained in the simulations as a function of y+. The results were that an increase in the local void fraction seems to cause a reduction U ¯ y , thus modifying the velocity profile in the viscous and buffer region, and consequently causing a reduction in shear stress.
In 2018, Evseev et al. [76] studied the effect of the microbubble drag reduction both at the top and bottom wall of a horizontal hydrodynamic channel of length 2.2 m, height 0.1 m and width 0.3 m at water flow velocities between 2 and 11 m/s. The gas was injected through a porous medium of holes of 20 µm, generating bubbles of an average size of 0.2 mm at an air flow rate in the range of 0 to 7 L/s. Floating-element transducers were used to measure the local drag on the channel at different longitudinal distances from the bubbles generation, while the local void fraction was performed using a fiber-optic sensor. The maximum drag reduction on the wall found was 70–80%. The shapes of the void fraction profiles were different for the top and bottom wall due to the buoyancy effect, and thus a maximum concentration of bubbles in the top remained downstream. They finally concluded that for bubble size in the range 30–50 d+ < 200, the main mechanisms present in the drag reduction were:
  • Decrease in the density in the buffer layer.
  • Increase in the effective viscosity.
  • Turbulence modification in the near-wall zone of the boundary layer (by bubble interaction with the vortex sheet).
  • Coalescence or breakup of bubbles.
Recently, Hazuku et al. [77] performed an experimental investigation in a horizontal rectangular channel of length 3 m, gap 0.05 m and width 0.2 m, by creating a biphasic flow by injecting air through an injection port of 85 holes with a diameter of 1 mm. The following were measured using a double conductivity sensor: the void fraction, the air speed, and the length of the bubble. Three types of flow were observed: bubbly flow, churn-bubbly and plug. They also observed that there was a maximum void fraction along the wall and this maximum decreased as the velocity of the water flow increased. The thickness of the bubbly layer was measured, which increased with the speed of the gas and hardly depended on the speed of the water. On the other hand, the average void fraction and the length of the bubble decreased with increasing velocity of the water, and hardly depended on the velocity of the gas.
For their part, Wu et al. [75] were more focused on the air layer than BDR, although the bubbly flow was generated at the bottom of a flat plate in a water tunnel. Finally, Zhang et al. [15] investigated the transition from bubbly drag increase to bubbly drag reduction. Two regimes were found:
  • Buoyancy Dominant Regime (at 2 m/s): Bubbles are sliding along the wall. At small void fraction, there is an increase in friction, while for higher void fractions there is a friction reduction. Friction reduction in this case is considered to be due to inversion of the wakes of bubbles (from jet-like flow to wake-like flow). The effect of deformation of bubbles is considered to be the cause of wall-normal oscillating motion of the bubbles.
  • Turbulent Dispersion Dominant Regime (at higher velocities): The reduction in the liquid turbulence stress (which reduces the frictional drag) is governed by the correlation between the fluctuations of the gas volume fraction and the wall-normal fluctuating velocity of the liquid. The waves of the void fraction are generated by repetitive bubble accumulation near the wall in liquid sweeping events.
Up until now, all the studies referred to drag reduction, due to the presence of microbubbles or bubbles in the boundary layer of a surface. However, there is another group of studies, focused on drag reduction on pipes, where the bubbles are attached to the surface, and instead of spherical bubbles, convex bubbles are found. This is the case of Kwon et al. [52] in 2014, who studied the use of these convex bubbles to reduce skin frictional drag reduction by means of a microchannel of length 15 mm, height 50 μm and width 0.5 mm, with a cavity array. Micro-PIV (particle image velocimetry) was used to measure the flow field around the convex bubble, and they found that the convex air bubble could increase the momentum flux, which could reduce the skin frictional drag. Other studies related to pipes are those by Ushida et al. [78,79] where the pressure drop of nanobubble mixtures passing through micro-orifices were studied, or Saffari et al. [80], who investigated the effect of bubbles on the pressure drop reduction in helical coils.

4.3. Other Experimental Setups

Another fundamental study was the one by Dismore et al. [81], which studied the dissipative effects of bubbles in shear flows from an analytical perspective, and whose findings were corroborated by experimental tests. The tests conducted consisted of release by a plastic pipe, in such a way that a rotational motion was induced, both water and carbonated water, into a small lower reservoir of 0.5 m in diameter. The authors concluded that large kinetic energy dissipation is caused by the presence of bubbles in a bulk shear flow.
Gvozdic et al. [82] investigated the heat transport in a bubbly flow. They performed experiments in a water column with a hot side and a cold side, where bubbles were injected from below so that a flow of homogeneous bubbles of 2.5 mm diameter was obtained. They found that the global bubble injection enhanced heat transfer up to 20 times. They concluded that in the two-phase flow, the heat transfer was not only due to natural convention (due to the temperature difference) but also to the diffusivity of the bubbles, and that this last mechanism was much more important in their experiments, since heat transfer (represented by the Nusselt number) did not depend on the temperature difference (represented by the Rayleigh number), but only on the void fraction (which was 5%).
Other fundamental studies were conducted in a water tank, such as the ones by Gan et al. [83] or Yun et al. [84]. Gan et al. [83] studied the drag reduction in a cylindrical model that moved up in a water tank while air was injected next to the head though holes of 0.052 times the diameter of the cylindrical model. For the head profile, a smooth transition curve was adopted to avoid cavitation. The velocity of the model was between 2 and 7 m/s. The authors found three dynamic behaviors: discontinuous bubbly flow, smooth interface and disturbed interface. Yun et al. [84] studied the vertical water entry of two consecutive spheres. The second sphere encountered a bubbly wake of the first sphere that reduced the drag, which allowed a larger sphere velocity for the second sphere.

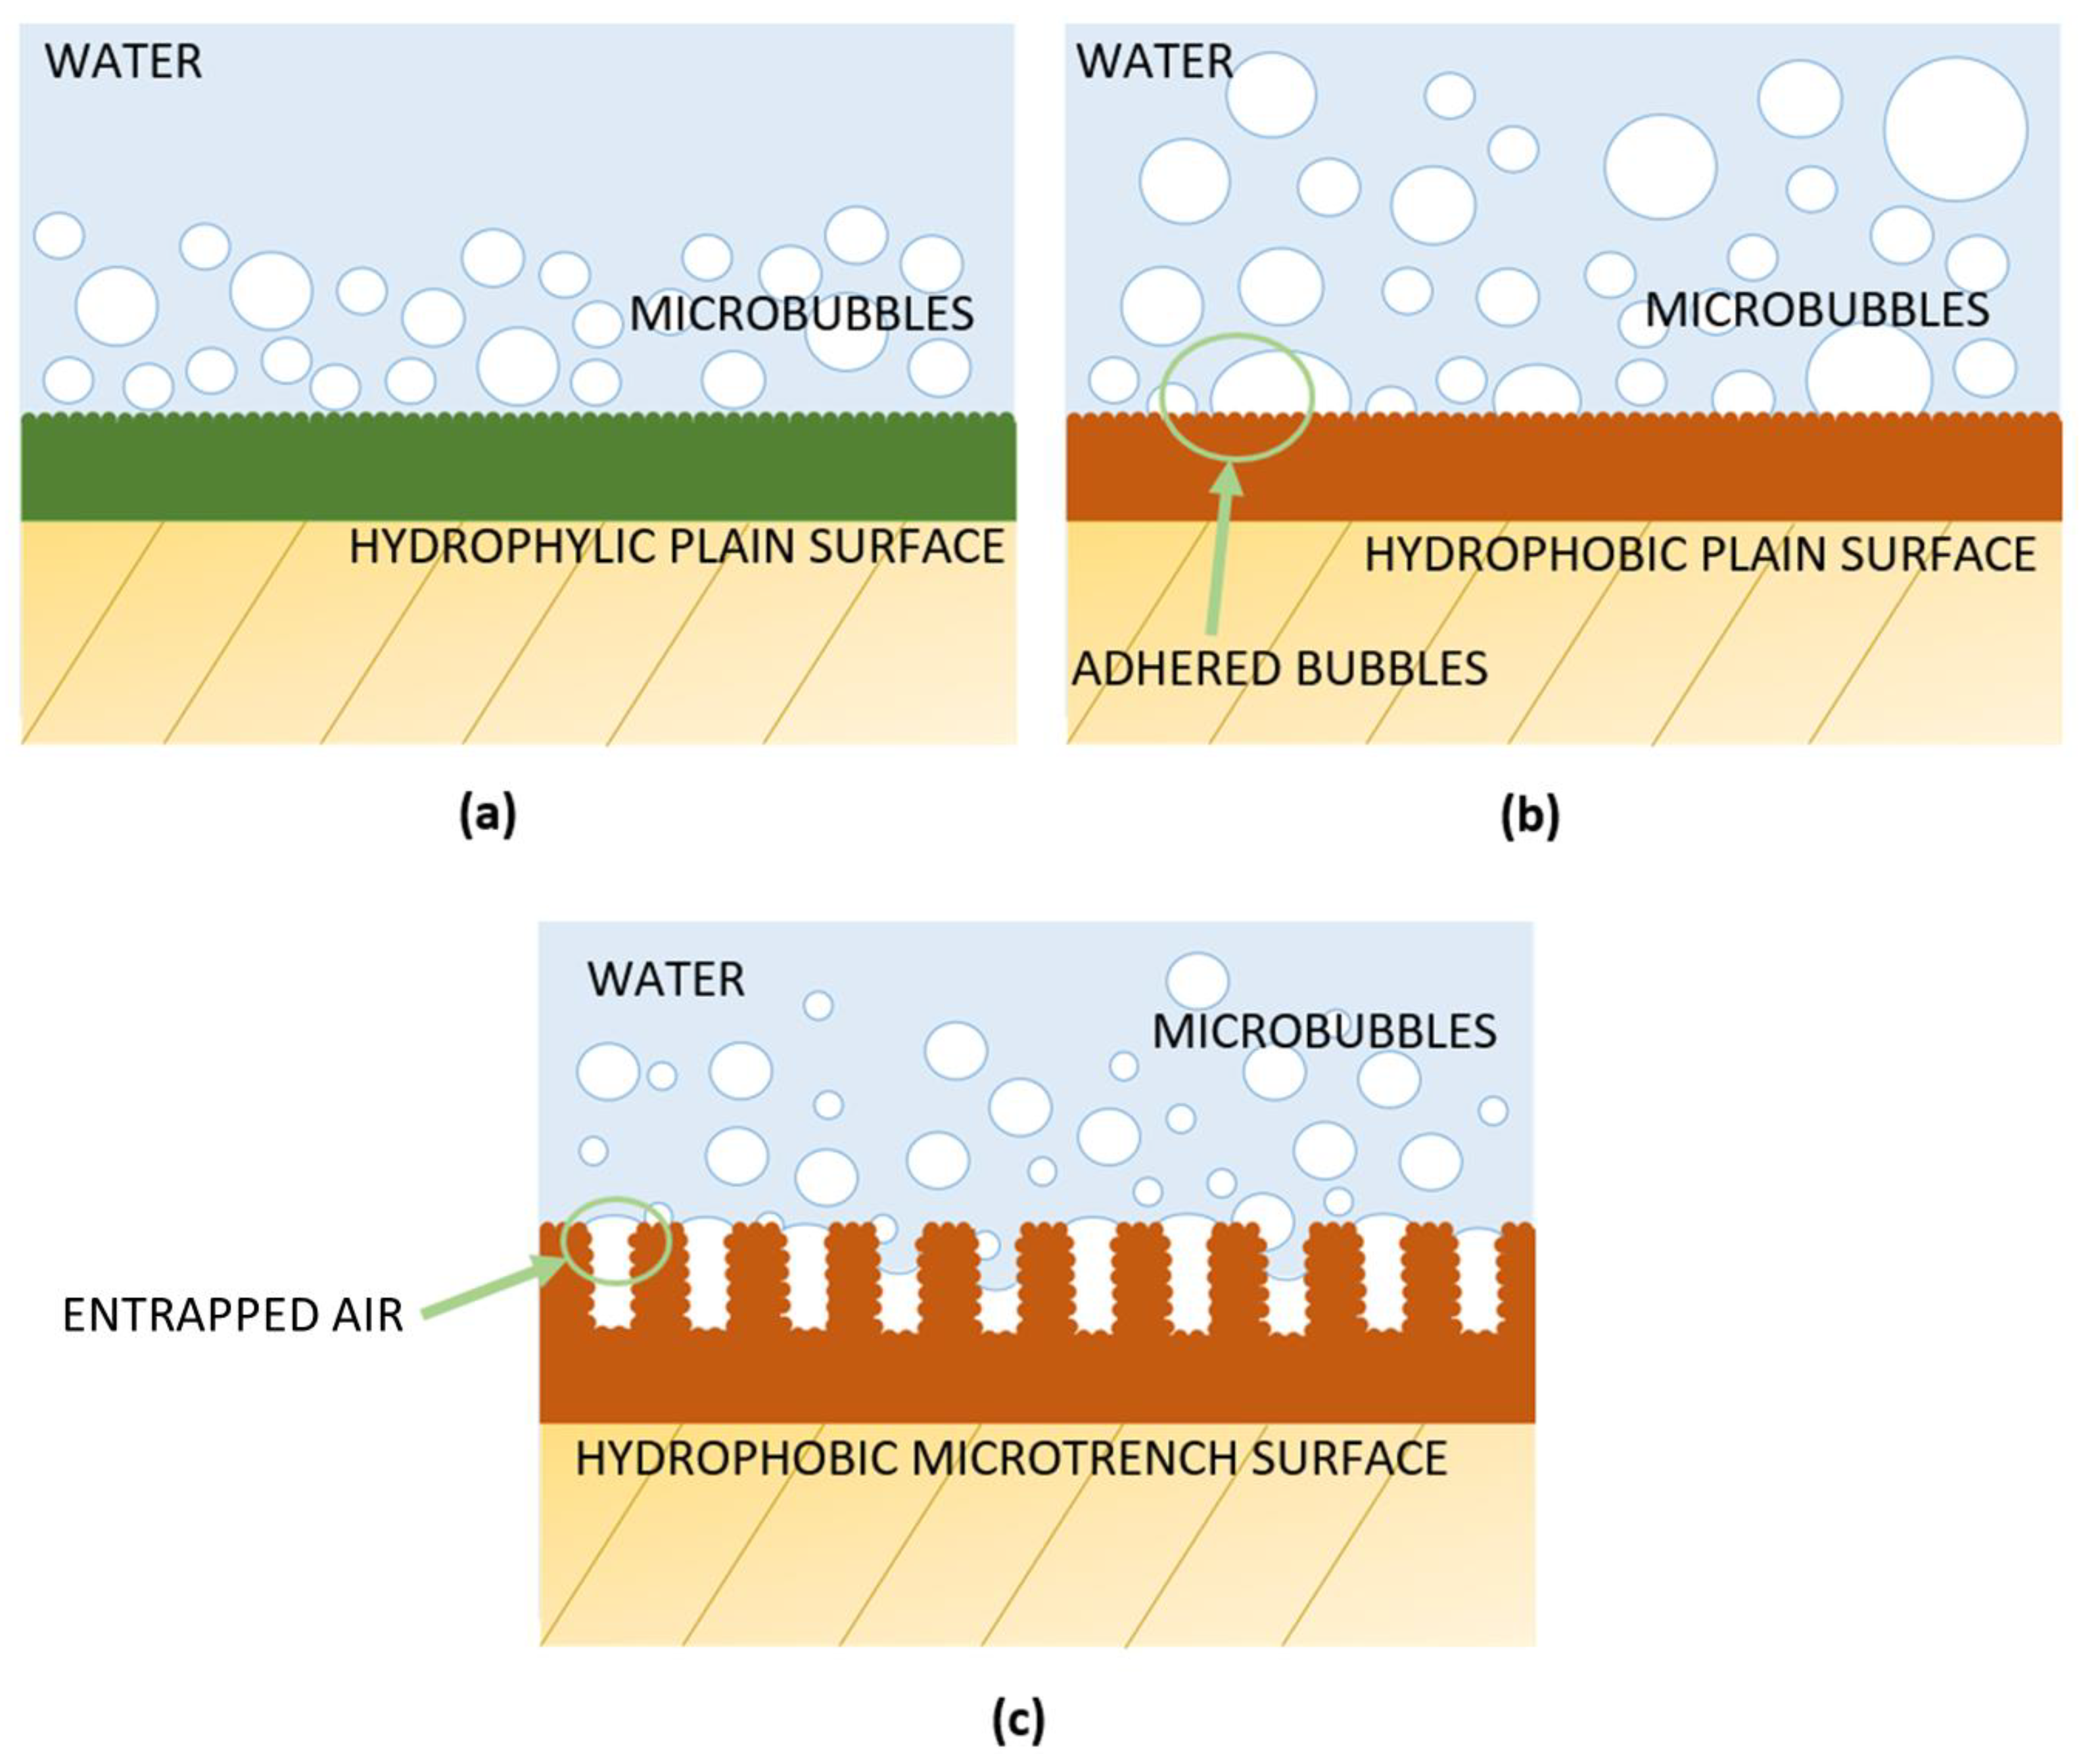
5. Surface Wettability and Microbubble Drag Reduction

The influence of the wall surface wettability when combined with bubble injection techniques is becoming an area of interest for researchers interested in BDR/MBDR techniques. From the beginning, the main efforts have been directed at understanding the interaction between the bubbles and the flow close to the walls, but not such attention has been paid to the impact of wettability on these interactions.
Related to this matter, an interesting study is the one developed by Kitagawa et al. [85], where the author focused on the effect of wettability on the movement and behavior of swarms of hydrogen bubbles that rise close to plates placed vertically inside a water tank made of acrylic. The bubbles are generated by electrolysis, and move through two different vertical areas of a test plate made of acrylic, one inclined at 3°, so bubbles rise close to the wall, where a metal plate is placed, and the other is vertical and fully transparent, so the size of bubbles is measured once they exit the inclined area. In total, three different metal plates were tested, each one with different wettability. The authors found that the bubble attachment and growth strongly depend on the surface wettability, so the more hydrophilic the material is, the fewer the coalescence and lower the maximum size reached. in addition, for hydrophobic materials, bubbles tend to attach to the surface and coalesce until detachment happens due to buoyancy. The authors found that in the case of hydrophobic materials there coexist a wide range of different bubble sizes (see Figure 6b), while in the hydrophilic case (see Figure 6a), the range narrows significantly, so coalescence and size limit can be controlled by the application of hydrophilic materials. In addition, the swarm movement is analyzed by means of particle tracking velocimetry, considering the average distance of the bubbles from the wall. For hydrophobic materials there is a bigger distance, due to the bubble diffusion induced by the bigger bubbles’ wake (see Figure 6b). In addition, the bubbles exhibit a bouncing behavior, due to successive attachment to and detachment from the wall. For most of the hydrophilic material, a suppression of the transverse diffusion close to the wall is reached, so it exhibits a stable and narrow bubble layer (see Figure 6a). As bubble diffusion can be affected by surface wettability, it is expected that this also affects void fraction and turbulence suppression in the application of BDR/MBDR.
In this way, a later work by the same authors (Kitagawa et al. [86]) performs a study based on the position, velocity and size of bubbles moving in the upper plate of a horizontal hydrodynamic channel, in order to characterize how wettability affects its behavior. The channel test section is 200 mm in length, 100 mm in width and 10 mm in height. Two sample plates with different wettability are fixed in the upper part of the test section, both made of aluminum, one coated with a thin hydrophobic material and the other thermally treated so the aluminum becomes sensitively hydrophilic. Bubbles are injected by means of five injectors in a flow with Re numbers in the range of 1000 and 5000, a Webber number between 1 and 10, and air flow controlled so the void fraction is about 0.4% for all Reynolds numbers. From the experiments, the authors found that for the hydrophilic plate, there is no adhesion even at a low Reynolds number while the hydrophobic surfaces can coalesce. Finally, for Re = 1000, the bubbles coalesce, resulting in the formation of a thin air layer. Considering bubble size, in the case of the hydrophobic material, the histogram of the bubble diameter reveals a strong correlation with the Reynolds number, which is not the case of the hydrophilic material’s histogram, which reveals a peak at 3.5 mm, becoming totally independent of the Reynolds number. In addition, as the bubbles coalesce they form bigger bubbles that will tend to break, due to shear stretching, into smaller ones, a cycle that will be repeated as they move downward. This results in a diameter histogram with a higher standard deviation. As in (Kitagawa et al. [85]), bubbles moving under the hydrophilic surface tend to group together, forming an almost constant thick bubble layer (see Figure 6a), while for the hydrophobic surface, bubbles tend to flow at slower velocities with chaotic attachments and detachments from the wall (see Figure 6b). The authors conclude that a probable increase in drag can be expected when using hydrophobic coatings in marine applications. On the other hand, the use of coatings with high wettability seems a promising technique that, used in combination with BDR/MBDR, can lead to better control of bubble size and an increase in the void fraction inside the boundary layer.
Based on these promising results, Bullee et al. [87] performed experiments for a Taylor–Couette setup where a rotating inner cylinder coated with hydrophobic material was compared with a hydrophilic one. Bubbles were generated by means of agitation, due to the partial filling of the volume, so varying the water height void fraction was partially controlled. The rotating speed was varied, so the Reynolds number was between 5 × 10 5 and 1.8 × 10 6 , so the flow was highly turbulent. The torque was measured with a reaction torque sensor. The results were that there was a 14% almost constant higher drag when no air was injected for the smooth hydrophilic wall when compared to the hydrophobic one, which is consistent with the fact that the hydrophilic surface is hydrodynamically smooth and hydrophobic is considered rough; however, the authors found that as they increased the void fraction the increase in drag reduction was higher for the rough hydrophobic one, showing that for void fractions higher than 4% drag behavior for both materials is almost the same. The conclusion is that the effect of void fraction on drag reduction is stronger for hydrophobic materials, which seems to be contrary to what was expected according to Kitagawa et al. [85]. Care should be taken when comparing both results, as the flow topology was very different.
Drag reduction can also be enhanced by the use of air entrapped in textures manufactured for that purpose (see Figure 6c). The main problem for the application of these devices in marine environments is maintaining the surface covered by air. It has been found that the use of materials of different wettability can increase the stability of these air structures. Related to this, but not directly related to bubble injection, in Hu et al. [88] the authors study the combined use of materials of different wettability (hydrophobic–hydrophilic) as a way to ensure the stability of air rings distributed over the surface of the inner cylinder of a Taylor–Couette setup. The authors conclude that the use of designs that combine super-hydrophobic and hydrophilic materials seems to be a potential solution for increasing both the stability and the performance of this drag reduction method. A study of the stability of this kind of air retaining system is also carried out by Mail et al. [89] for larger grid structures, exploring different materials and geometries in stagnant water. The conclusion is that communication between grid compartments and the use of hydrophobic surfaces in combination with rectangular-type grids are better in order to increase the stability and survivability of the air retained. About 60% of the initial air grid surface is retained when pressure cycles from up to 700 mbar are applied. An interesting point of this work is that the authors discuss the application of air retaining grids on ships and marine structures, which, due to their dynamic nature, will lead to severe losses of the air retained. In order to solve this, they point out that a combination of the system and microbubble injection will help to replenish the air lost and increase the overall efficiency of the system.
The last conclusion was also observed by Xu et al. [90] during what are the first open water tests for superhydrophobic plates with a mattress of microchannels. Small silicon plates, with 500 µm strips on the surface are coated with 1 µm Teflon coating and installed in the hull bottom of a small full-scale ship, 4.06 m long, sailing at constant velocities between 2.57 m/s and 5.14 m/s. Drag reduction is measured by means of a shear stress sensor placed between the plate and the ship’s hull. The gas fraction on the microchannel’s surface is measured by means of a camera. A total of three different plates with pitches of 50 µm, 100 µm, and 200 µm were tested, achieving drag reduction up to 40% for the deepest one at about 4400 Reynolds number. The authors also installed a random roughness plate and found an increase in the drag due to the form drag induced by the bubbles attached to the plastron. An interesting conclusion according to the authors is that the stability of the air trapped inside the trenches is increased, thanks to the re-entrainment of the bubbles. Therefore, as discussed in Mail et al. [89], the injection of microbubbles could not only reduce drag due to its interaction with the turbulent boundary layer, but also combine with the air mattresses devices in order to increase its stability in field applications.
An in-depth study into the form drag of the air entrapped in these manufactured microchannels can be found in Karatay et al. [91]. Here, the authors study experimentally and numerically the impact that the geometry of a mattress of microbubbles protruding from the wall surface has on the wall friction of a rectangular microchannel in low Re steady laminar flow. Previous studies have shown that friction drag can both increase or decrease, depending on how the flow is altered due to the geometry of the bubbles. Gas-filled channels 20 μm wide and made of hydrophilic silicon are distributed over the surface. In order to retain most gas located at the microchannels, they are separated by a hydrophobic surface. The gas pressure is actively controlled so that stability is achieved and the protrusion angle is defined. Symmetry of the microbubbles is achieved thanks to the low value of the capillary (Ca = 5.00·103) and Weber number (We = 6.00·103). Detailed horizontal velocity profiles near the bubble protrusion are measured from micro PIV and used to estimate the effective slip length ( b e f ) , which is calculated with the Navier’s slip boundary condition u x y = 0 = b e f d u x / d y y = 0 . As a result, the authors found that slip length is affected by the protrusion angle and the fraction of the surface covered by bubbles. They also found that, in general, maximum drag reduction value is mostly increased with the surface fraction covered by the bubbles. On the other hand, the critical protrusion angle, defined as the angle when friction is increased from its original value, is slightly decreased with the surface fraction covered by the bubbles. The authors also showed a more complex dependence of the drag reduction on the protrusion angle, which showed a maximum for angles in the range between −2° and 12°. A later numerical and experimental study of the Cassie state is also performed by Yin et al. [92], with similar results.
The use of hydrophobic materials on rough surfaces where air is trapped between the roughness and helps, thanks to the texture and the low surface energy, to achieve the Cassie state that can reduce the friction drag, has also been investigated (see Figure 7a). A comprehensive study of the application of rough hydrophobic textures in turbulent flows can be found in Bidkar et al. [93], where the authors perform water tunnel tests for flat plates with different surfaces. Stainless steel flat plates are compared with six representative textures with two different coatings, each sample characterized by its non-dimensional surface roughness that depends on the friction velocity, the surface roughness and the kinematic viscosity. Maximum drag reductions of 25% are achieve for Teflon coatings at all tested Reynolds numbers. By using a load cell for measuring shear stress, authors concluded that drag reduction can be reached if the hydrophobic textures are orders of magnitude smaller when compared with the viscous sublayer. It is also found that k+ decrease with the distance from the leading edge, so there exist a critical distance where the drag reduction effect will start to arise. Finally, the authors discuss the performance of porous materials in sustaining a Cassie state.
Despite the good results of the Cassie state, the loss of air entrapped by the roughness can lead to the Wenzel state (see Figure 7b), where trapped gas is replaced by water, so reducing the benefits of drag reduction. An interesting study for the rate of air that must be replaced can be found in Ling et al. [94], where the authors studied the effects of variation of pressure combined with the diffusion on the plastron placed on superhydrophobic microchannels manufactured over a surface and perpendicular to the flow direction. The authors found that there is a power law relation between the Sherwood number and the friction Reynolds number, so the wall shear stress is correlated with turbulent diffusion, S h = 0.34 R e τ 0.913 . This expression is suggested as a quantitative estimation of the air needed to replenish the air losses, so maintaining the Cassie state. In addition, it could shed light about how air is diffused to the flow, and answer open questions about how it is affected by the surface roughness and textures and the nature of the interface between phases.
As can be seen in [39] and following the conclusions of Bulle et al. [87], one possible application for BDR/MBDR techniques in combination with different wettability materials is the control of the diffusion and replenishing of air in Cassie-based drag reduction surfaces, so that diffusion can be reduced thanks to the higher concentration of air bubbles close to the wall avoiding the Wenzel state.
Although we have focused on the combination of microbubbles and the advances in applying different surface wettability materials for drag reduction, a deep and full review of the superhydrophobic materials drag reduction topic can be found in Park et al. [95].

6. Summary and Conclusions

Different searches were conducted on publications related to bubble drag reduction (BDR). It was found that 60% of the works were published in the last decade, which shows the great importance nowadays. This percentage is even greater if the search is restricted to experimental research, and even more if it is also restricted to that related to ships. This is mainly due to the new regulation adopted by the IMO in 2013. In this context, the experimental research related to BDR has been reviewed. The main conclusions regarding the way of testing are:
  • The main facilities/setups used for studying BDR are towing tanks, the cavitation tunnel, water channels and Taylor–Couette setups. Among them, special attention has to be paid to testing in a cavitation tunnel where the pressure could be increased due to the bubble injection.
  • The main way used to inject bubbles in the last decade for the experiments in BDR is through a porous plate with an array of holes connected to a reservoir and a pump.
  • There is still much work to be done regarding the way to measure the bubbles inside the boundary layer and their interaction with it.
In addition, the current trends in research related to BDR identified are the following ones:
  • First, it has recently been discovered that introducing intermittent waves of swarms of bubbles could be beneficial, rather than a continuous injection of bubbles. This is now being investigated, and seems to be promising in order to achieve greater drag reduction. However, there is still much work to be done to elucidate all the physics involved.
  • Secondly, there are still contradictions all over the literature regarding the effects of bubble size and air injection flow. Therefore, fundamental studies are still necessary to shed light on the problem, which seems to be due to different complex mechanisms. In any case, bubble size has been shown to be a key parameter.
  • Finally, and regarding the way to control bubble size, a new trend in the research has been identified for studying the relation of the wettability to the bubble size of the air injected. In this context, hydrophobic and hydrophilic surfaces have been investigated in relation to BDR. Further studies in this direction are also necessary.

Author Contributions

Conceptualization, A.G.-M., P.L.-G., S.S. and F.T.; methodology, A.G.-M., P.L.-G., S.S. and F.T.; formal analysis, A.G.-M., P.L.-G., S.S. and F.T.; investigation, A.G.-M., P.L.-G., S.S. and F.T.; resources, A.G.-M., P.L.-G., S.S. and F.T.; writing—original draft preparation, A.G.-M., P.L.-G., S.S. and F.T.; writing—review and editing, A.G.-M., P.L.-G., S.S. and F.T. All authors have read and agreed to the published version of the manuscript.

Funding

This research was funded by the INTA (National Institute of Aerospace Technology, Spain) internal project “BIFLOWPROP” with project number S.IGB22001.

Institutional Review Board Statement

Not applicable.

Informed Consent Statement

Not applicable.

Data Availability Statement

Data sharing is not applicable.

Acknowledgments

The authors want to thank their institution for funding this research.

Conflicts of Interest

The authors declare no conflict of interest.

References

  1. Sindagi, S.; Vijayakumar, R. Succinct review of MBDR/BDR technique in reducing ship’s drag. Ships Off-Shore Struct. 2021, 16, 968–979. [Google Scholar] [CrossRef]
  2. Kumar, S.; Pandey, K.M.; Sharma, K.K. Advances in drag-reduction methods related with boundary layer control—A review. Mater. Today Proc. 2021, 45, 6694–6701. [Google Scholar] [CrossRef]
  3. Ceccio, S.L. Friction drag reduction of external flows with bubble and gas injection. Annu. Rev. Fluid Mech. 2010, 42, 183–203. [Google Scholar] [CrossRef] [Green Version]
  4. Murai, Y. Frictional drag reduction by bubble injection. Exp. Fluids 2014, 55, 1773. [Google Scholar] [CrossRef]
  5. Legner, H.H. A simple model for gas bubble drag reduction. Phys. Fluids 1984, 27, 2788–2790. [Google Scholar] [CrossRef]
  6. Kim, S.Y.; Cleaver, J.W. The persistence of drag reduction following the injection of microbubbles into a turbulent boundary layer. Int. Commun. Heat Mass Transf. 1995, 22, 353–357. [Google Scholar] [CrossRef]
  7. Murai, Y.; Oishi, Y.; Sasaki, T.; Kodama, T.; Yamamoto, F. Turbulent shear stress profile in horizontal bubbly channel flow. In Proceedings of the 6th International Symposium on Smart Control of Turbulence, Tokyo, Japan, 6–9 March 2005; pp. 289–295. [Google Scholar]
  8. Hassan, Y.A.; Gutierrez-Torres, C.C. Investigation of drag reduction mechanism by microbubble injection within a channel boundary layer using particle tracking velocimetry. Nucl. Eng. Technol. 2006, 38, 763–778. [Google Scholar]
  9. Paik, B.G.; Yim, G.T.; Kim, K.Y.; Kim, K.S. The effects of microbubbles on skin friction in a turbulent boundary layer flow. Int. J. Multiph. Flow 2016, 80, 164–175. [Google Scholar] [CrossRef]
  10. Park, H.J.; Saito, D.; Tasaka, Y.; Murai, Y. Color-coded visualization of microbubble clouds interacting with eddies in a spatially developing turbulent boundary layer. Exp. Therm. Fluid Sci. 2019, 109, 109919. [Google Scholar] [CrossRef]
  11. Feng, Y.Y.; Hu, H.; Peng, G.Y.; Zhou, Y. Microbubble effect on friction drag reduction in a turbulent boundary layer. Ocean Eng. 2020, 211, 107583. [Google Scholar] [CrossRef]
  12. Park, H.J.; Tasaka, Y.; Murai, Y. Bubbly drag reduction accompanied by void wave generation inside turbulent boundary layers. Exp. Fluids 2018, 59, 166. [Google Scholar] [CrossRef]
  13. Tanaka, T.; Oishi, Y.; Park, H.J.; Tasaka, Y.; Murai, Y.; Kawakita, C. Repetitive bubble injection promoting frictional drag reduction in high-speed horizontal turbulent channel flows. Ocean Eng. 2021, 239, 109909. [Google Scholar] [CrossRef]
  14. An, H.; Pan, H.; Yang, P. Research Progress of Air Lubrication Drag Reduction Technology for Ships. Fluids 2022, 7, 319. [Google Scholar] [CrossRef]
  15. Zhang, J.; Gabillet, C.; Billard, J.-Y. Experimental study of the bubbly drag reduction in the recovery region of a separated turbulent boundary layer. Int. J. Multiph. Flow 2021, 142, 103697. [Google Scholar] [CrossRef]
  16. Wang, H.; Wang, K.; Liu, G. Drag reduction by gas lubrication with bubbles. Ocean Eng. 2022, 258, 111833. [Google Scholar] [CrossRef]
  17. Zhao, L.; Mo, Z.; Sun, L.; Xie, G.; Liu, H.; Du, M.; Tang, J. A visualized study of the motion of individual bubbles in a venturi-type bubble generator. Prog. Nucl. Energy 2017, 97, 74–89. [Google Scholar] [CrossRef]
  18. Zhang, J.; Yang, S.; Liu, J. Numerical investigation of a novel device for bubble generation to reduce ship drag. Int. J. Nav. Archit. Ocean Eng. 2018, 10, 629–643. [Google Scholar] [CrossRef]
  19. Murai, Y.; Sakamaki, H.; Kumagai, I.; Park, H.J.; Tasaka, Y. Mechanism and performance of a hydrofoil bubble generator utilized for bubbly drag reduction ships. Ocean Eng. 2020, 216, 108085. [Google Scholar] [CrossRef]
  20. Rodríguez-Rodríguez, J.; Sevilla, A.; Martínez-Bazán, C.; Gordillo, J.M. Generation of microbubbles with applications to industry and medicine. Annu. Rev. Fluid Mech. 2015, 47, 405–429. [Google Scholar] [CrossRef]
  21. Mccormick, M.E.; Bhattacharyya, R. Drag reduction of a submersible hull by electrolysis. Nav. Eng. J. 1973, 85, 11–16. [Google Scholar] [CrossRef]
  22. Dominguez-Ontiveros, E.E.; Estrada-Perez, C.E.; Hassan, Y.A. Wall Shear Stress Measurements in Two-phase Flow using PIV, an Optical Sensor and Wall Pressure Transducer. In Proceedings of the 6th International Symposium on Particle Image Velocimetry Pasadena, Pasadena, CA, USA, 21–23 September 2005. [Google Scholar]
  23. Zhu, R.; Zhang, H.; Wen, W.; He, X.; Zhao, C.; Liu, Y.; Zhuang, Q.; Liu, Z. Flow-drag reduction performance of a resident electrolytic microbubble array and its mechanisms. Ocean Eng. 2023, 268, 113496. [Google Scholar] [CrossRef]
  24. Velasco, L.J.; Venturi, D.N.; Fontes, D.H.; de Souza, F.J. Numerical simulation of drag reduction by microbubbles in a vertical channel. Eur. J. Mech.-B/Fluids 2022, 92, 215–225. [Google Scholar] [CrossRef]
  25. Lyu, X.; Tang, H.; Sun, J.; Wu, X.; Chen, X. Simulation of microbubble resistance reduction on a suboff model. Brodogr. Teor. I Praksa Brodogr. I Pomor. Teh. 2014, 65, 23–32. [Google Scholar]
  26. Cihonski, A.J.; Finn, J.R.; Apte, S.V. Volume displacement effects during bubble entrainment in a travelling vortex ring. J. Fluid Mech. 2013, 721, 225–267. [Google Scholar] [CrossRef] [Green Version]
  27. Li, Z.P.; Sun, L.Q.; Xiao, W.; Yao, X.L. Three-dimensional numerical analysis of near-wall single-orifice ventilated bubble dynamics. Ocean Eng. 2019, 186, 106066. [Google Scholar] [CrossRef]
  28. Zhang, G.Q.; Schlüter, J.; Hu, X. Parametric investigation of drag reduction for marine vessels using air-filled dimpled surfaces. Ships Offshore Struct. 2018, 13, 244–255. [Google Scholar] [CrossRef]
  29. Zhao, X.; Zong, Z.; Jiang, Y.; Sun, T. A numerical investigation of the mechanism of air-injection drag reduction. Appl. Ocean Res. 2020, 94, 101978. [Google Scholar] [CrossRef]
  30. Wu, T.; Li, Y.; Jiang, D.; Zhang, Y. Numerical Research of Dynamical Behavior in Engineering Applications by Using E–E Method. Mathematics 2022, 10, 3150. [Google Scholar] [CrossRef]
  31. Liu, T.; Huang, B.; Wang, G.; Zhang, M.; Gao, D. Experimental investigation of the flow pattern for ventilated partial cavitating flows with effect of Froude number and gas entrainment. Ocean Eng. 2017, 129, 343–351. [Google Scholar] [CrossRef]
  32. Liu, T.; Huang, B.; Wang, G.; Zhang, M. Experimental investigation of ventilated partial cavitating flows with special emphasis on flow pattern regime and unsteady shedding behavior around an axisymmetric body at different angles of attack. Ocean Eng. 2018, 147, 289–303. [Google Scholar] [CrossRef]
  33. Maiga, M.A.; Coutier-Delgosha, O. Analysis of the re-entrant jet to twin vortex flow regimes transition in ventilated cavitation. Eur. J. Mech.-B/Fluids 2022, 94, 375–384. [Google Scholar] [CrossRef]
  34. Qin, S.; Sun, S.; Fang, H.; Wang, L.; Chen, Y.; Wu, D. Experimental and numerical investigation on the cavity regime and drag reduction of ventilated partial cavity. Ocean Eng. 2021, 234, 109257. [Google Scholar] [CrossRef]
  35. Yu, D.; Wei, Y.; Wang, C.; Lu, J.; Li, Y.; Zhang, W. Experimental investigation of two ventilated cavities with effect of Froude number and gas entrainment. Ocean Eng. 2022, 261, 112109. [Google Scholar] [CrossRef]
  36. Qin, S.; Sun, S.; Yoon, K.; Fang, H.; Chen, Y.; Wu, D. Investigation on the internal flow of ventilated partial cavity. Phys. Fluids 2021, 33, 083303. [Google Scholar] [CrossRef]
  37. Sun, S.; Qin, S.; Fang, H.; Wu, D.; Huang, B. Effects of lateral space and angle of attack on ventilated partial cavity. Appl. Ocean Res. 2021, 106, 102479. [Google Scholar] [CrossRef]
  38. Wang, L.; Huang, B.; Qin, S.; Cao, L.; Fang, H.; Wu, D.; Li, C. Experimental investigation on ventilated cavity flow of a model ship. Ocean Eng. 2020, 214, 107546. [Google Scholar] [CrossRef]
  39. Xiang, M.; Li, K.; Tu, J.Y.; Zhang, H.W. Numerical investigation on the gas entrainment of ventilated partial cavity based on a multiscale modelling approach. Appl. Ocean Res. 2016, 60, 84–93. [Google Scholar] [CrossRef]
  40. Xu, C.; Huang, J.; Wang, Y.; Wu, X.; Huang, C.; Wu, X. Supercavitating flow around high-speed underwater projectile near free surface induced by air entrainment. AIP Adv. 2018, 8, 035016. [Google Scholar] [CrossRef] [Green Version]
  41. Wang, Y.; Sun, X.J.; Dai, Y.J.; Wu, G.Q.; Cao, Y.; Huang, D.G. Numerical investigation of drag reduction by heat-enhanced cavitation. Appl. Therm. Eng. 2015, 75, 193–202. [Google Scholar] [CrossRef]
  42. Karn, A.; Rosiejka, B. Air entrainment characteristics of artificial supercavities for free and constrained closure models. Exp. Therm. Fluid Sci. 2017, 81, 364–369. [Google Scholar] [CrossRef]
  43. Erfanian, M.-R.; Anbarsooz, M. Numerical investigation of body and hole effects on the cavitating flow behind a disk cavitator at extremely low cavitation numbers. Appl. Math. Model. 2018, 62, 163–180. [Google Scholar] [CrossRef]
  44. Sun, T.; Ding, Y.; Liu, Y.; Zou, L. Numerical modeling and investigation of the effect of internal waves on the dynamic behavior of an asymmetric ventilated supercavity. Ocean Eng. 2021, 233, 109193. [Google Scholar] [CrossRef]
  45. Azad, S.; Lotfi, H.; Riasi, A. The effects of viscoelastic fluid on the cavitation inception and development within a centrifugal pump: An experimental study. Int. Commun. Heat Mass Transf. 2019, 107, 106–113. [Google Scholar] [CrossRef]
  46. Vakarelski, I.U.; Klaseboer, E.; Jetly, A.; Mansoor, M.M.; Aguirre-Pablo, A.A.; Chan, D.Y.; Thoroddsen, S.T. Self-determined shapes and velocities of giant near-zero drag gas cavities. Sci. Adv. 2017, 3, e1701558. [Google Scholar] [CrossRef] [Green Version]
  47. Kadivar, E.; el Moctar, O.; Skoda, R.; Löschner, U. Experimental study of the control of cavitation-induced erosion created by collapse of single bubbles using a micro structured riblet. Wear 2021, 486, 204087. [Google Scholar] [CrossRef]
  48. Chanson, H. Hydraulics of aerated flows: Qui pro quo? J. Hydraul. Res. 2013, 51, 223–243. [Google Scholar] [CrossRef] [Green Version]
  49. Basovich, A. The effect of contaminant drag reduction on the onset and evolution of Langmuir circulations. J. Phys. Oceanogr. 2014, 44, 2739–2752. [Google Scholar] [CrossRef]
  50. Elbing, B.R.; Perlin, M.; Dowling, D.R.; Ceccio, S.L. Modification of the mean near-wall velocity profile of a high-Reynolds number turbulent boundary layer with the injection of drag-reducing polymer solutions. Phys. Fluids 2013, 25, 085103. [Google Scholar] [CrossRef]
  51. Han, X.; Krajnović, S. Very large eddy simulation of passive drag control for a D-shaped cylinder. J. Fluids Eng. 2013, 135, 101102. [Google Scholar] [CrossRef]
  52. Kwon, B.H.; Kim, H.H.; Jeon, H.J.; Kim, M.C.; Lee, I.; Chun, S.; Go, J.S. Experimental study on the reduction of skin frictional drag in pipe flow by using convex air bubbles. Exp. Fluids 2014, 55, 1722. [Google Scholar] [CrossRef]
  53. Lorite-Díez, M.; Jiménez-González, J.I.; Pastur, L.; Martínez-Bazán, C.; Cadot, O. Experimental analysis of the effect of local base blowing on three-dimensional wake modes. J. Fluid Mech. 2020, 883, A53. [Google Scholar] [CrossRef]
  54. Wang, G.-H.; Du, Y.; Xiao, Z.-J.; Huang, J.; Wng, Z.-Y.; Li, H.-C.; Wang, J.-Z.; Wang, Y.-W. Numerical study on formation of a splash sheet induced by an oscillating bubble in extreme vicinity to a water surface. J. Hydrodyn. 2022, 34, 1021–1031. [Google Scholar] [CrossRef]
  55. Yang, H.; Guo, Z.; Li, Y.; Wang, H.; Dou, Y. Experimental study on microbubble drag reduction on soil-steel interface. Appl. Ocean Res. 2021, 116, 102891. [Google Scholar] [CrossRef]
  56. Yang, H.; Guo, Z.; Li, Y.; Wang, H.; Dou, Y. Unsteady dynamic analysis for the cavitating hydrofoils based on OpenFOAM. Exp. Comput. Multiph. Flow 2019, 1, 101–108. [Google Scholar]
  57. Yanuar; Waskito, K.T.; Pratama, S.Y.; Candra, B.D.; Rahmat, B.A. Comparison of microbubble and air layer injection with porous media for drag reduction on a self-propelled barge ship model. J. Mar. Sci. Appl. 2018, 17, 165–172. [Google Scholar] [CrossRef]
  58. Gunawan; Yanuar; Waskito, K.T. Determination the optimum location for microbubble drag reduction method in self propelled barge model; an experimental approach. Energy Rep. 2020, 6, 774–783. [Google Scholar] [CrossRef]
  59. Hao, W.U.; Yongpeng, O.; Qing, Y.E. Experimental study of air layer drag reduction on a flat plate and bottom hull of a ship with cavity. Ocean Eng. 2019, 183, 236–248. [Google Scholar] [CrossRef]
  60. Sindagi, S.; Vijayakumar, R.; Saxena, B.K. Experimental parametric investigation to reduce drag of a scaled model of bulk carrier using BDR/ALS technique. J. Ship Res. 2021, 65, 257–265. [Google Scholar] [CrossRef]
  61. Zhao, X.; Zong, Z. Experimental and numerical studies on the air-injection drag reduction of the ship model. Ocean Eng. 2022, 251, 111032. [Google Scholar] [CrossRef]
  62. Sayyaadi, H.; Nematollahi, M. Determination of optimum injection flow rate to achieve maximum micro bubble drag reduction in ships; an experimental approach. Sci. Iran. 2013, 20, 535–541. [Google Scholar]
  63. Schlichting, H.; Gersten, K. Boundary-Layer Theory; Springer: Berlin/Heidelberg, Germany, 2016. [Google Scholar]
  64. Park, H.J.; Oishi, Y.; Tasaka, Y.; Murai, Y. Void waves propagating in the bubbly two-phase turbulent boundary layer beneath a flat-bottom model ship during drag reduction. Exp. Fluids 2016, 57, 178. [Google Scholar] [CrossRef] [Green Version]
  65. Mäkiharju, S.A.; Lee, I.H.R.; Filip, G.P.; Maki, K.J.; Ceccio, S.L. The topology of gas jets injected beneath a surface and subject to liquid cross-flow. J. Fluid Mech. 2017, 818, 141–183. [Google Scholar] [CrossRef]
  66. Sanders, W.C.; Winkel, E.S.; Dowling, D.R.; Perlin, M.; Ceccio, S.L. Bubble friction drag reduction in a high-Reynolds-number flat-plate turbulent boundary layer. J. Fluid Mech. 2006, 552, 353–380. [Google Scholar] [CrossRef]
  67. Fokoua, G.N.; Gabillet, C.; Aubert, A.; Colin, C. Effect of bubble’s arrangement on the viscous torque in bubbly Taylor-Couette flow. Phys. Fluids 2015, 27, 034105. [Google Scholar] [CrossRef] [Green Version]
  68. Maryami, R.; Javadpoor, M.; Farahat, S. Experimental investigation of head resistance reduction in bubbly Couette–Taylor flow. Heat Mass Transf. 2016, 52, 2593–2608. [Google Scholar] [CrossRef]
  69. Sun, C.; Zhou, Q. Experimental techniques for turbulent Taylor–Couette flow and Rayleigh–Bénard convection. Nonlinearity 2014, 27, R89. [Google Scholar] [CrossRef] [Green Version]
  70. Gao, X.; Kong, B.; Vigil, R. Dennis. CFD simulation of bubbly turbulent Tayor–Couette flow. Chin. J. Chem. Eng. 2016, 24, 719–727. [Google Scholar] [CrossRef]
  71. Lavrenteva, O.; Prakash, J.; Nir, A. Effect of added mass on the interaction of bubbles in a low-Reynolds-number shear flow. Phys. Rev. E 2016, 93, 023105. [Google Scholar] [CrossRef]
  72. Spandan, V.; Ostilla-Mónico, R.; Verzicco, R.; Lohse, D. Drag reduction in numerical two-phase Taylor–Couette turbulence using an Euler–Lagrange approach. J. Fluid Mech. 2016, 798, 411–435. [Google Scholar] [CrossRef] [Green Version]
  73. Elbing, B.R.; Mäkiharju, S.; Wiggins, A.; Perlin, M.; Dowling, D.R.; Ceccio, S.L. On the scaling of air layer drag reduction. J. Fluid Mech. 2013, 717, 484–513. [Google Scholar] [CrossRef]
  74. Qin, S.; Chu, N.; Yao, Y.; Liu, J.; Huang, B.; Wu, D. Stream-wise distribution of skin-friction drag reduction on a flat plate with bubble injection. Phys. Fluids 2017, 29, 037103. [Google Scholar] [CrossRef] [Green Version]
  75. Wu, H.; Ou, Y. Analysis of air layer shape formed by air injection at the bottom of flat plate. Ocean Eng. 2020, 216, 108091. [Google Scholar] [CrossRef]
  76. Evseev, A.R.; Mal’tsev, L.I. Effect of Microbubble Gas Saturation on Near-Wall Turbulence and Drag Reduction. J. Eng. Thermophys. 2018, 27, 155–172. [Google Scholar] [CrossRef]
  77. Hazuku, T.; Ihara, T.; Hibiki, T. Reduction of skin friction and two-phase flow structure beneath wall in horizontal rectangular channel. Ocean Eng. 2022, 248, 110846. [Google Scholar] [CrossRef]
  78. Ushida, A.; Hasegawa, T.; Narumi, T.; Nakajima, T. Flow properties of nanobubble mixtures passing through micro-orifices. Int. J. Heat Fluid Flow 2013, 40, 106–115. [Google Scholar] [CrossRef]
  79. Ushida, A. Anomalous Phenomena of Complex Fluids in Small-Sized Flow Fields and Effect of Fine Bubble Mixtures. Nihon Reoroji Gakkaishi 2016, 44, 237–243. [Google Scholar] [CrossRef] [Green Version]
  80. Saffari, H.; Moosavi, R.; Gholami, E.; Nouri, N.M. The effect of bubble on pressure drop reduction in helical coil. Exp. Therm. Fluid Sci. 2013, 51, 251–256. [Google Scholar] [CrossRef]
  81. Dinsmore, C.; Aminfar, A.; Princevac, M. Dissipative effects of bubbles and particles in shear flows. J. Fluids Eng. 2017, 139, 061302. [Google Scholar] [CrossRef] [Green Version]
  82. Gvozdić, B.; Alméras, E.; Mathai, V.; Zhu, X.; Van Gils, D.; Verzicco, R.; Huisman, S.-G.; Sun, C.; Lohse, D. Experimental investigation of heat transport in homogeneous bubbly flow. J. Fluid Mech. 2018, 845, 226–244. [Google Scholar] [CrossRef] [Green Version]
  83. Gan, N.; Yao, X.; Cheng, S.; Chen, Y.; Ma, G. Experimental investigation on dynamic characteristics of ventilation bubbles on the surface of a vertical moving body. Ocean Eng. 2022, 246, 110641. [Google Scholar] [CrossRef]
  84. Yun, H.; Lyu, X.; Wei, Z. Experimental study on vertical water entry of two tandem spheres. Ocean Eng. 2020, 201, 107143. [Google Scholar] [CrossRef]
  85. Kitagawa, A.; Denissenko, P.; Murai, Y. Effect of wall surface wettability on collective behavior of hydrogen microbubbles rising along a wall. Exp. Therm. Fluid Sci. 2017, 80, 126–138. [Google Scholar] [CrossRef] [Green Version]
  86. Kitagawa, A.; Denissenko, P.; Murai, Y. Behavior of bubbles moving along horizontal flat plates with different surface wettability. Exp. Therm. Fluid Sci. 2019, 104, 141–152. [Google Scholar] [CrossRef]
  87. Bullee, P.A.; Verschoof, R.A.; Bakhuis, D.; Huisman, S.G.; Sun, C.; Lammertink, R.G.; Lohse, D. Bubbly drag reduction using a hydrophobic inner cylinder in Taylor–Couette turbulence. J. Fluid Mech. 2020, 883, A61. [Google Scholar] [CrossRef] [Green Version]
  88. Hu, H.; Wen, J.; Bao, L.; Jia, L.; Song, D.; Song, B.; Pan, G.; Scaraggi, M.; Dini, D.; Xue, Q.; et al. Significant and stable drag reduction with air rings confined by alternated superhydrophobic and hydrophilic strips. Sci. Adv. 2017, 3, e1603288. [Google Scholar] [CrossRef] [Green Version]
  89. Mail, M.; Moosmann, M.; Häger, P.; Barthlott, W. Air retaining grids—A novel technology to maintain stable air layers under water for drag reduction. Philos. Trans. R. Soc. A 2019, 377, 20190126. [Google Scholar] [CrossRef]
  90. Xu, M.; Grabowski, A.; Yu, N.; Kerezyte, G.; Lee, J.W.; Pfeifer, B.R. Superhydrophobic drag reduction for turbulent flows in open water. Phys. Rev. Appl. 2020, 13, 034056. [Google Scholar] [CrossRef]
  91. Karatay, E.; Haase, A.S.; Visser, C.W.; Sun, C.; Lohse, D.; Tsai, P.A.; Lammertink, R.G. Control of slippage with tunable bubble mattresses. Proc. Natl. Acad. Sci. USA 2013, 110, 8422–8426. [Google Scholar] [CrossRef] [Green Version]
  92. Yin, L.; Zhang, H.F.; Shi, S.Y.; Lu, Y.; Wang, Y.; Liu, X.W. Numerical investigation of relationship between water contact angle and drag reduction ratio of superhydrophobic surfaces. Front. Phys. 2016, 11, 114701. [Google Scholar] [CrossRef]
  93. Bidkar, R.A.; Leblanc, L.; Kulkarni, A.J.; Bahadur, V.; Ceccio, S.L.; Perlin, M. Skin-friction drag reduction in the turbulent regime using random-textured hydrophobic surfaces. Phys. Fluids 2014, 26, 085108. [Google Scholar] [CrossRef]
  94. Lv, X.; Wu, W.T.; Lv, J.; Mao, K.; Gao, L.; Li, Y. Study on the law of pseudo-cavitation on superhydrophobic surface in turbulent flow field of backward-facing step. Fluids 2021, 6, 200. [Google Scholar] [CrossRef]
  95. Park, H.; Choi, C.-H.; Kim, C.-J. Superhydrophobic drag reduction in turbulent flows: A critical review. Exp. Fluids 2021, 62, 229. [Google Scholar] [CrossRef]
Figure 1. Bubble Drag Reduction Concept.
Jmse 11 01315 g001
Figure 2. Publications in the last 10 years related to Bubble Drag Reduction.
Jmse 11 01315 g002
Figure 3. Towing tank facility.
Jmse 11 01315 g003
Figure 4. Taylor–Couette Experiments Setup where the main dimensions are defined.
Jmse 11 01315 g004
Figure 5. Cavitation Tunnel/Water Tunnel Channel Facilities.
Jmse 11 01315 g005
Figure 6. Scheme of the application of surfaces with different wettability and structures when combined with microbubbles. (a) Hydrophilic plain surface with random roughness, microbubble size and distribution [86,87] (b) Hydrophobic plain surface with random roughness, microbubble size and distribution [86,87] (c) Drag reduction mechanism by the use of air entrapped in hydrophobic surface with microtrenches.
Jmse 11 01315 g006
Figure 7. Different wetted conditions on random roughness surface. (a) Cassie–Baxter state, when most of the air fills the roughness, (b) Wenzel state, which happens when most of air trapped in the roughness is replaced with water.
Jmse 11 01315 g007
Table 1. Searches conducted in the Web of Science.
Search NameSearch Parameters
BDR (TS or TI or AB) = BDR and NRB
BDR & EXP(TS or TI or AB) = BDR and EXP and NRB
BDR & SHIP(TS or TI or AB) = BDR and SHIP and NRB
BDR & SHIP & EXP(TS or TI or AB) = BDR and SHIP and EXP and NRB
BDR & BL (TS or TI or AB) = BDR and BL and NRB
BDR & BL & EXP (TS or TI or AB) = BDR and BL and EXP and NRB
TI = Tittle; TS = Topic; AB = Abstract.
Table 2. Search Parameters.
Search ParameterSearch NameProposed Definition
BDRBubble Drag Reduction(((“Microbubble” or “Bubble”) and (“Drag Reduction”)) or (“Bubbly Drag”))
EXPExperimental(“Experimental”)
NRBNo Recirculation Bubble(not (“Separation Bubble” or “Recirculation Bubble”) not (“Aerodynamics”))
SHIPShips(“Ship” or “Vessel” or “Boat” or “Frigate” or “Barge”)
BLBoundary Layer(“Boundary Layer”)
Table 3. Results of the searches conducted in the Web of Science.
Search NameTotal PublicationsTotal Publications Last 10 YearsMean Number of PublicationsPercentage Publications Last 10 Years
BDR 45927127.159%
BDR & EXP148999.967%
BDR & SHIP84565.667%
BDR & SHIP & EXP29262.690%
BDR & BL 171838.348%
BDR & BL & EXP 5431357%
Table 4. Results of the searches conducted in the Web of Science.
Search NameNumber of Publications per Year
2013201420152016201720182019202020212022
BDR21281628223627362829
BDR & EXP119610111010101210
BDR & SHIP214327812611
BDR & SHIP & EXP1111225445
BDR & BL59587121210510
BDR & BL & EXP3412553233
Table 5. Bubble drag reduction towing tank experiments published in the last decade.
Authors and Year of the PublicationTowing Tank InstitutionTowing Tank DimensionsFrModelAir InjectionSpecific
Instrumentation
Length (m)Width (m)Depth (m)TypeLength (m)Beam (m)Height (m)Draft T(m)ScaleBubble Generation/
Air Injection
Injection LocationAir InjectedShear Stress
Sayyadi et al., 2013 [62]Sharif University of Technology252.51.20.36–1.34Catamaran0.7070.072 0.031-Array of holes (porous plate) of diameter around 1 mmthree positions: fore, midship and stern regionsinjection coefficient: 0.1–1-
Park et al., 2016 [64]Hiroshima University10083.50.32–0.48Ship with Flat Plate Bottom40.50.60.09-Array of holes (porous plate) of diameter around 5 mmat 0.7 m after bowflow rate: 1.5–9 m3/hultrasonic bubble measurement system, wall shear stress sensors and optical-bubble imaging system
Park et al., 2018 [12]-Array of holes (porous plate) of diameter around 100 μmflow rate: 4.5–9 m3/h
Mäkiharju 2017 [65]University of Michigan109.76.73.21.3–7.2Barge4.30.70.30.08-gas-injection tubes (orifice diameter: 6 and 10 mm)at the fore of the flat part with different injection angle (22.5°–157.5°)flow rate: 0.36–43 m3/h-
Barge6.51.50.50.08-gas-injection tubes (orifice diameter: 5, 10, and 20 mm)
Yanuar et al., 2018 [57]Indonesia Hydrodynamic Laboratory234.5115.50.11–0.31Barge20.520.120.051:28Porous medium with holes of diameter of 100 µmat 0.35 L after midshipinjection coefficient: 0.2–0.6Load cell located at 0.35 L after midship
Gunawan et al., 2019 [58]Indonesia Hydrodynamic Laboratory234.5115.50.1–0.35Barge0.2000.0520.0120.091:45Porous media connected to air compressor by 1/4-inch pipe.100 mm after bow (location 1) and 50 mm after mid-ship (location 2)injection coefficient: 0.2–0.6Load cell located at 0.35 L
Hao et al., 2019 [59]Chinese Special Vehicle Research5506.550.12–0.27Flat Plate5.01610.12--with and without cavityat the front of the bottom surfaceideal air thickness: 0–35 mmfour floating-plate-type friction sensors
0.11–0.18Bulk Carrier6.0791--1:38arc air injection device and hole-shaped air injection device (11 through-holes 10 mm in diameter) in the arc-shape bottom cavity (4.32 m × 0.82 m × 25 mm): arc device at the fore-step position of the cavity; hole-shaped on the rear’s of the cavity front step ideal air thickness: 0–6 mm-
Sindagi et al., 2021 [60]Indian Institute of Technology Madras853.22.80.09–0.15Bulk Carrier5.090.870.310.211:23air chamber with an array of holes of 1 mm and air chamber with array of holes of 2 mmin the front of the shipflow rate: 0.85–5.1 m3/h50 Kg load cell
Zhao et al., 2022 [61]Dalian University of Technology17073.70.08–0.2Ship30.60.30.048 Porous medium plate with pore diameter of 50 µmair injection chamber installed at 0.75 m away from the bowflow rate: 0.25–10 m3/hSeaworthiness instrument
Table 6. Main parameter of publications of experiments of Taylor–Couette flow.
Author and Year of
Publication
Inner CylinderGapRadius RatioReynolds
Number
Void
Fraction
Bubble
Diameter
H (mm) R i (mm) d (mm) η Re α δ (%)D (mm)
Maryami et al. [68] (2016)630120100.927·103–7·1040–100.8–1.7
Fokoua et al. [67] (2015)886200200.91632–2·1040.002–0.021–2.5
Table 7. Bubble drag reduction water tunnel experiments published in the last decade.
Author and Year of
Publication
Type of
Facility
Test Section DimensionWater Velocity (m/s)Model/WallModel Dimensions/Injection Distance in Test Section (m)Air injectionSpecific Instrumentation
Length (m)Width (m)Height (m)Bubble Generation/Air InjectionBubble Size (mm)Air Injected (Flow Rate)
Elbing et al., 2013 [73]Cavitation Tunnel133.53.056.3 Flat plate 12.9 × 3.5 × 0.18Backward Facing Step (13 mm) at injection location-0–66 L/minFloating-plate-type, three probe’s traversing system (pitot-static, electrical impedance and time of flight)
Qin et al., 2017 [74]Cavitation Tunnel2.60.60.64–8Flat plate 1.6 × 0.3 × 0.05Line of 25 solenoid-valve actuated air compressed injectors0.1–123.5–118 L/min6 force transducers 100 N capacity and high speed camera for
Wu et al., 2020 [75]Low Turbulence Water Tunnel6.00.40.40.1–1.3 Flat plate 1.2 × 0.38 × 0.01Multiple air holes of diameter 0.2 mm-0.84–206 L/minHigh performance camera
Zhang et al., 2021 [15]Recirculation Closed Water Tunnel0.760.1920.1922–8Upper wall thickened by mounting a 2D Obstacle0.134Grid of 57 needles of 180 µm in diameter0.4–1.30.083–1.33 L/minTime resolved, low spatial resolution, particle image velocimetry, shadowgraphy, low frequency
Evseev et al., 2018 [76]Horizontal Water Channel2.2 0.30.12–11Top and bottom wall0.615 (top wall) and 0.429 (bottom wall)Air injection 20 µm porous medium0.2–1.50–420 L/minFloating element transducer, fiber-optic sensor (void fraction)
Hazuku et al., 2022 [77]Horizontal Water Channel30.20.051–3Upper wall0.8Air injection 1 mm holes1–618–600 L/minDouble conductivity electrical probe
Disclaimer/Publisher’s Note: The statements, opinions and data contained in all publications are solely those of the individual author(s) and contributor(s) and not of MDPI and/or the editor(s). MDPI and/or the editor(s) disclaim responsibility for any injury to people or property resulting from any ideas, methods, instructions or products referred to in the content.

