Abstract
The Tortonian–Messinian transition is associated with important climatic and oceanographic changes in the Mediterranean Basin, which have shaped both the biotic and abiotic nature of this setting. The morphological variability of the planktonic foraminifera Globorotalia menardii, a species that is highly sensitive to water column structure, has been investigated from the sedimentary archive of three Cretan sections across a west–east transect covering the Tortonian–Messinian Boundary. The present work explicitly focuses on test-size and coiling direction changes occurring during the 7.36–7.24 Ma time slice. On such a short timescale, the most important morphological differentiation accounts for the average size of G. menardii, which is mostly associated with evolutionary adaptation to new ecological niches during the latest Tortonian as a response to the environmental perturbations and ecological stress conditions preceding the Tortonian–Messinian Boundary. A combined thermal and/or salinity-driven stratification and thermocline development hypothesis has been suggested to explain the observed size variability. To ameliorate the accuracy of the proposed model and further determine which environmental parameter reflects the optimum conditions of the analysed species, additional sea surface temperature and salinity data derived from the same sampling intervals of the studied or additional Mediterranean sites are needed. The coiling direction of this species within the study time interval remained constant and not environmentally controlled.
1. Introduction
The morphological variability of any organism, both through time and within its paleobiogeographic range, is currently receiving much attention, opening novel fields for biometric investigations. Morphological evolution and speciation in calcareous plankton from selected time slices and key sites in the world oceans is currently one of the most challenging issues in stratigraphy and palaeoceanography. Such an approach, initially labelled by Knappertsbusch [1] as “evolutionary prospection”, requires suitable taxa for mapping the variations in morphological parameters (e.g., size, shape, and coiling direction) reflecting environmental and/or evolutionary changes due to abiotic (e.g., temperature, salinity, water depth, soil acidity, and stratification [2]) and biotic (e.g., competition, predation, mutualisms, and symbiosis [2,3]) drivers, respectively.
Due to the high level of completeness of the deep-sea records [4], the planktonic foraminifera are widely distributed and highly abundant in the world oceans [5] and well preserved in the deep-sea sedimentary records [6,7], with excellent diversification across time and space [8,9], making them ideal for this purpose. As a ubiquitous part of marine life since their evolution from benthic foraminifera in the Jurassic [10,11], planktonic foraminifera have been exposed to a wide range of environmental perturbations to which they successfully adapted, by subtly, but continuously changing their shell morphologies within a species’ capability of genetic constraints. This group also presents an enviable species level record with ~450 identified fossil species, with an at least 81% chance of detection in the Cenozoic Era [12]. The Cenozoic planktonic foraminifera are the best candidates for mapping the biogeographic dynamics of evolution because of their occupation and evolutionary adaptation to new ecological niches emerging during the Cenozoic cooling [13] and due to the rearrangement of oceanic gateways [14]. The mean planktonic foraminiferal shell size has increased [14] during the last 12 Ma, with its long-term size evolution (macro-evolution) being controlled by changing patterns of niche richness related to water column stratification [15], while minor short-term size variations (micro-evolution) are attributed to sudden changes in the environmental conditions [16].
Generally, in an optimal species-specific environment, individuals exhibit a greater maximum test size, while their size decreases the more unfavourable the environment becomes [17]. Such size variability, sometimes combined with additional tenuous morphological differences (i.e., spiral height, keel area), is even more pronounced during a drastic improvement or deterioration of environmental conditions in response to changing water column characteristics (e.g., temperature, salinity, stratification, productivity). However, the relationship between planktonic foraminiferal size and seawater parameters varies among the oceanic basins because of local adaptations in different bioprovinces [18]. Moreover, most of the studies that have tracked this kind of morphological variability have been conducted on Late Quaternary (modern/Holocene [14,19,20,21] or Pleistocene [22,23,24]) planktonic foraminiferal populations rather than on ancient forms [25,26,27].
An interesting case of such short-term morphological changes was observed for the first time in the Late Miocene size evolution of Globorotalia menardii in three Cretan sections named Potamida, Kapariana, and Faneromeni, respectively. No attempt has yet been made to describe the size variations of this species during the Latest Tortonian in the marginal Mediterranean Basin and further assess their controlling factors during the pre-evaporitic Messinian Salinity Crisis interval. In the present study, we focus on the time interval between the First Occurrence (FO) of G. menardii form 5 and its replacement by the representatives of the Globorotalia conomiozea group at the Tortonian/Messinian boundary, thus covering the 7.36–7.24 Ma time interval. The size measurements of G. menardii were further compared to the oxygen (δ18O) and carbon (δ13C) isotopic ratios measured on the surface dweller Globigerinoides obliquus picked from the same samples to examine the paleoclimatic significance of the observed morphological variability.
2. Geological Setting
Crete Island occupies a forearc position above the northward-dipping subduction zone of the Hellenic Arc along which the African plate is subducted beneath the southern edge of the Eurasian plate. The overall architecture of the island is characterised by a pile of thrust nappes, which are subdivided into a lower member consisting of high pressure and low temperature metamorphic rocks and an upper member with no metamorphic rocks, separated by a major shear zone [28]. The pre-Miocene basement rocks were tectonically fragmented into numerous parts because of the uplift and exhumation of the nappe pile, causing the development of Neogene–Quaternary sedimentary basins in large-scale graben or semi-graben systems [29,30]. The complex interplay of tectonics and sedimentation resulted in the deposition of a large variety of sediments such as clastics, carbonates, and evaporites of Middle Miocene to Pliocene age [31]. These deposits were initially assigned to six lithostratigraphic groups by Meulenkamp et al. [32] and particularly for the central Crete updated by Zachariasse et al. [31], with each one of them being characterised by a unique combination of lithology, depositional environment, and stratigraphic position. Because of recent tectonic movements, such Neogene deposits are well exposed along the entire island [31,33,34,35,36] (Figure 1). However, most of the research concerned particularly with Late Miocene marine deposits has been focused on Chania [34,37,38], Messara [39,40,41], and Sitia [34,42,43] sub-basins due to the absence of complete sedimentary records of outcropping in other areas.
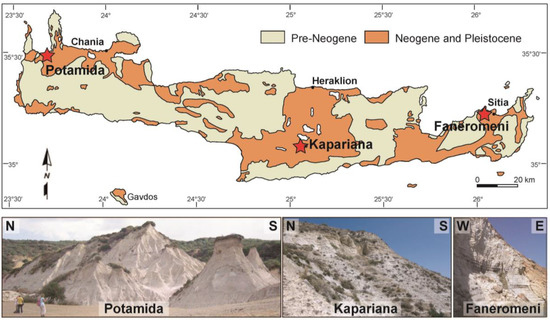
Figure 1.
Geological sketch map of Crete Island, with red asterisks showing the positions of the three analysed sections across the west–east transect.
3. Scientific Context
3.1. Sampling Strategy for Menardellids Preceding the Tortonian–Messinian Boundary
In morphometric studies, when investigating microevolutionary dynamics, the focus tends to be on short-term population dynamics and how species can respond to profound environmental perturbations. Such an approach relies on the premise that conspecific individual differences are not significant or minimised to be ecologically important [44], and that responses to environmental perturbations will be independent of individual variability. Working on that assumption, the mean-based approach of 10 G. menardii specimens was used here with the prime study target of measuring traits (e.g., maximum length) that are more variable between individuals rather than within the selected species lineage.
One way to circumnavigate the time-consuming nature of trait collection is to focus on measuring traits that are functionally important. Such functional traits define the role of an organism in an ecosystem [45] at an individual level [46] and vary through time and space [47]. Given that the functional traits capture how an organism interacts with the environment, they dictate its fate during environmental perturbations [12,48]. For past environments, where we do not have the ability of direct observations for identifying them as for modern ecosystems, this can only be achieved with body-size-related measurements. For instance, the maximum length distribution is one of the most common applicable proxies in marine plankton evolutionary patterns [14] because they are: (i) easily measured, (ii) readily preserved in fossils, (iii) ecologically significant, (iv) extremely variable in time and space, and (v) reflect changes in the growth rate and maturation of shells.
We specifically targeted the subset of genus Globorotalia [49] named menardellid globorotalids. This group of globorotalids radiated during the Late Miocene through to the Pliocene, when several forms lived during short time intervals, thus being important stratigraphic markers. Among them, the most known representative is G. menardii because of its ubiquitous occurrence in (sub)tropical sediments. Except for its distinct tropical nature [50], its large size ranges, strong resistance against carbonate dissolution [51], and morphology (lenticular biconvex shells surrounded by a blunt keel [52]) are advantages making this species an ideal candidate for morphometric studies. In particular, its low trochospiral tests (compared to other architectures such as the globigerinids) can be easily measured and quantified.
Extant G. menardii is a symbiont-bearing species [53] dwelling within the seasonal thermocline [54], with the capability to adapt its depth habitat depending on temperature [55], productivity [56] and/or oxygen concentration [57]. It becomes a relatively larger percentage of sedimentary assemblages when thermocline shoals in the photic zone (i.e., middle to upper thermocline), at depths where a relatively strong nutricline [58] and moderately low oxygen concentrations (~50–100 μmol kg−1) appear. Changes in the shape and size of G. menardii have been noted by several authors and attributed to such changing water mass characteristics (e.g., [26,59]) within the upper water column.
3.2. Targeted Setting: Tortonian–Messinian Transition in the Eastern Mediterranean
For further assessing the plausible relationship between the observed size variability with palaeoceanographic/palaeoclimatic parameters, the present study investigates the environmental conditions preceding the Tortonian–Messinian boundary as those reflected by deep-sea hemipelagic sediments of Potamida, Kapariana, and Faneromeni sections. The Late Miocene climate and palaeoceanographic conditions have become better-known based on integrated geochemical and micropaleontological studies around the Mediterranean [40,41,42,60,61,62,63]. Very warm and salty tropical conditions, even higher (up to 30 °C and 40 °C, respectively) than those documented today, prevailed during the pre-evaporitic Messinian Salinity Crisis (pre-MSC) interval. During the latest Tortonian, the eastern Mediterranean was characterised by enhanced thermally and/or salinity-driven upper water column stratification, leading to ongoing environmental stress [42] exerting more pressure on shell size growth than in the more eutrophic, fresher, and less stratified western Mediterranean. Overall, the juxtaposition between the palaeoceanographic patterns initiated by increasing Mediterranean–Atlantic restriction and the observed size divergence in the plexus of G. menardii allow us to disentangle the environmental processes influencing test-size evolution during latest Tortonian in such a subtropical setting.
4. Material and Methods
The material used in this study comprises a collection of uppermost Tortonian (7.36–7.28 Ma) samples derived from three Cretan sections (from west to east: Potamida, Kapariana, and Faneromeni) and collected during the 2017 expedition for the Thalis project (MIS 375405). The location of these sections in different Neogene basins of Crete (Chania, Heraklion, and Sitia, respectively) through this longitudinal transect (Figure 1) offers a biogeographic (although regional) pattern in terms of size variability and evolutionary processes. The litho-chrono-stratigraphic framework of all sections is illustrated in Figure 2. For additional information regarding the scientific expedition, including fieldwork observations, chronostratigraphic framework, and sampling resolution, we refer to the previously published works of Agiadi et al. [37], Moissette et al. [35], and Kontakiotis et al. [42].
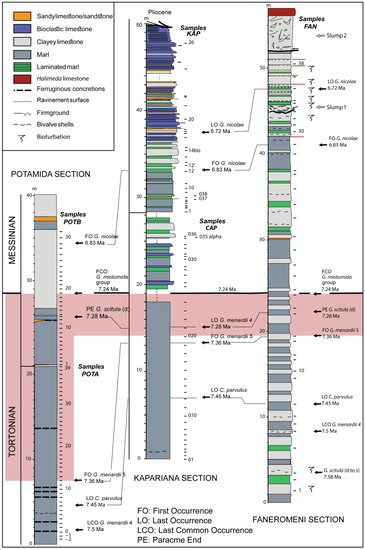
Figure 2.
Litho-chrono-stratigraphic columns of Potamida, Kapariana, and Faneromeni sections. At the right of each litho-stratigraphic column, the sampling intervals and biostratigraphic events are depicted. The black line corresponds to the Tortonian–Messinian boundary. The pink outlined area represents the part studied in this work.
4.1. Micropaleontological Analyses
In total, 40 samples (31 from Potamida, 4 from Kapariana, and 5 from Faneromeni section, respectively) were processed following standard micropaleontological procedures [21]. The differential number of analysed samples among the studied sections is highly dependent on the outcropping conditions and the sampling resolution chosen during the Thalis 2017 fieldwork. For the abundance distribution pattern determination, all samples were split in aliquots containing at least 300 individuals, which were picked, identified, counted, and finally converted into percentages based on the extrapolation of a counted split. For size analysis, approximately 10 specimens of G. menardii form 5 were handpicked from the >250 μm size fraction split per sample for the 7.36–7.24 Ma time interval in all sections, while their coiling direction was also checked. Upon identification, all G. menardii picked specimens placed in separate cells on different microslides (per sample) for archiving. Foraminiferal shells were positioned to capture the maximum silhouette area of each individual in the umbilical side. The material was photographed for size analysis through the maximum diameter of the shells. Images were acquired using a LEICA MZ16 stereo-zoom microscope supplemented by a digital camera connected to a computer via GRYPHAX v2.2.0 software (Figure 3). For testing the potential relationship to environmental perturbations, the subsequent size results were also correlated to regional past hydrographic regime, in terms of temperature–salinity and productivity variations of the upper water column as those reflected by oxygen (δ18O) and carbon (δ13C) isotope data for each analysed section, respectively.
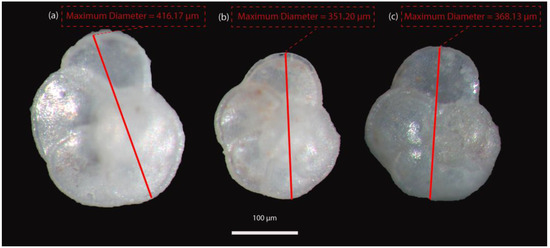
Figure 3.
Images of G. menardii specimens picked from (a) Potamida section (7.266 Ma), (b) Kapariana section (7.363 Ma), and (c) Faneromeni section (7.280 Ma).
4.2. Isotopic Analyses
For stable isotope analysis, we used the published data derived from the same samples of the Faneromeni section [42], while we further performed isotopes for the Potamida and Kapariana sections, regarding the study time slice, in the present work. For consistency, we used the same species for isotopic analyses in all sections. Thus, G. obliquus specimens were handpicked based on their abundance, continuous appearance throughout the study time interval, and their paleoclimatic significance [64]. To minimise ontogenetic, growth rate, and size effects on shell weight, the tests were selected from the narrow 250–300 μm size fraction [65]. Once picked, the samples were sonicated in methanol for ~10 s to remove clay particles adhering to the foraminifera tests and rinsed a further five times in ultraclean water. The observation of the shell microstructure of randomly selected specimens using a Jeol JSM 6360 Scanning Electron Microscope (SEM) showed a ‘frosty’ appearance [66], confirming the relatively good preservation regime. All picking, cleaning, and diagenesis screening were performed at the Department of Historical Geology-Paleontology in Athens. Isotopic analyses were performed using a Thermo GasBench II coupled to a Thermo 253 isotope ratio mass spectrometer in continuous flow mode, thermostated sample tray, and a GC PAL autosampler at the Goethe Universität–Senckenberg BiK-F Joint Stable Isotope Facility. The analytical precision was 0.07‰ for δ18O and 0.06‰ for δ13C, with replicates to reveal a reproducibility and natural sample variability better than 0.1‰. The results are reported against Vienna Pee Dee Belemnite (VPDB) using the standard δ notation expressed in per mil (‰).
5. Results
5.1. G. menardii Size and Concurrent δ18Oforam Changes during the Tortonian–Messinian Transition
The focus in the size evolution of G. menardii was given to the maximum length measurements through time (Figure 4, Table 1). According to Regenberg et al. [59], this morphological parameter is a good proxy for the foraminiferal shell size. In the eastern Mediterranean Sea, the measured specimens from the three selected Cretan sections are significantly smaller compared to the large to giant forms (exceeding 700 μm) identified during the Late Miocene to Middle Pliocene in the Atlantic Ocean [25]. However, the regional latest Tortonian evolutionary trend, as illustrated in Figure 4, reveals a complexity characterised by striking changes in their size distribution over a wide range, which may give evidence of variable palaeoceanographic conditions during that time and/or potential associated shifts in the ecology of G. menardii.
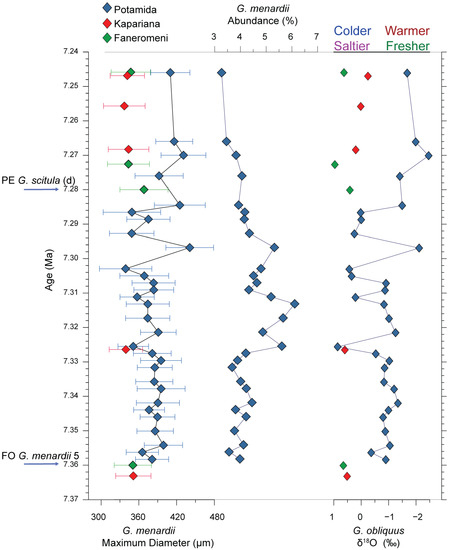
Figure 4.
Test size distribution pattern of Globorotalia menardii and δ18Oforam for the eastern Mediterranean over the latest Tortonian of the studied sections.

Table 1.
Globigerinoides obliquus (δ18Oforam, δ13Cforam) data and Globorotalia menardii size measurements on the three study sections from Crete Island for the 7.36–7.24 Ma time interval.
Between 7.36 and 7.24 Ma, the maximum G. menardii length exhibits several peaks, of which most are associated with the maximum recorded values and, strikingly, with correspondent counter peaks in δ18Oforam (Figure 4). Particularly at 7.297 Ma, the largest G. menardii specimens (up to 590 μm) are measured, with the relevant mean recorded value to be 441 μm (Figure 4), where the δ18Oforam records an outstanding low value peak (−2.1‰). Similarly, some of the smallest G. menardii specimens (in the range of 350 μm) correspond to δ18Oforam high values (in the range of 0.5‰) (Figure 4). Besides the peak values, for periods with constant G. menardii specimens’ size, a corresponding constant of δ18Oforam can be observed. For example, for the 7.355–7.327 Ma and 7.322 and 7.333 Ma intervals, the G. menardii specimen size is ~385 μm with a corresponding high δ18Oforam of ~1‰ (Figure 4). Similarly, in the Potamida record, for the 7.285–7.245 Ma, a larger G. menardii specimen size of ~415 μm appears with corresponding low δ18Oforam in the range of −1.7‰ (Figure 4). For Kapariana and Faneromeni, the 7.285–7.245 Ma interval is characterised by small size G. menardii specimens (~340 μm) and constantly high δ18Oforam values in the range of 0.4‰ (Figure 4).
Based on additional geochemical analyses on the same samples from the Potamida section, the relevant SST value for this sample is 29.2 °C [67], which is consistent with the optimum temperature conditions for the studied species [68]. On the contrary, during the negative peaks in the size distribution record, the mean values in terms of maximum shell diameter are significantly reduced, showing a dominant average size smaller than 350 μm. It is worthy of note that in some cases (7.303 Ma), they almost reach half of the size documented during the positive peaks, thus reflecting different environmental changes (Figure 4). Our integrated dataset from Crete Island displays a pattern mostly characterised by intermittent values around 390 μm during the 7.36–7.30 Ma time slice, followed by a noticeable variability characterised by sudden size increases and reductions up to 7.24 Ma, possibly related to the increasing environmental stress developed in the eastern Mediterranean water column when approaching the Tortonian–Messinian boundary. The δ13C values range between 1.83 and 0.22‰, showing a general trend towards lighter values, indicative of the progressive isolation of the basin during that time (Table 1). The relatively low δ13C values reported here are consistent with those reported from eastern Mediterranean sites (e.g., Faneromeni, Metochia sections; [42,69]), reflecting the oligotrophic nature of this setting.
5.2. Stable Abundance and Coiling Direction Patterns over the Latest Tortonian
Besides the observed size variability, the data show no significant changes in the distributional pattern of G. menardii during the studied time span (Figure 4). In all samples, the analysed species did not attain high percentages (>10%), indicating the almost disappearance of its population preceding the Tortonian–Messinian boundary, possibly due to the extreme environmental conditions that started to develop even before the Messinian, as was initially considered. Apart from the sample POTB5 at 7.297 Ma, in the Potamida record, where a slight increase in its abundance was observed, no other significant variations in its abundance were documented. Moreover, most of the analysed specimens were dextrally coiled (only a few sinistrally coiled specimens that are statistically insignificant), which means that the coiling direction of G. menardii within the Mediterranean over the latest Tortonian remained constant and not environmentally controlled.
6. Discussion
6.1. Environmental Forcing on G. menardii Size Variability
The size of an organism is a key variable for determining the environmental pressures that cause evolutionary changes in palaeobiological studies. In the case of planktonic foraminifera, where their calcification and growth is directly related to the environmental conditions [70,71], such a functional trait is usually used to explain changes during present and/or past oceanographic conditions on short or long time scales, respectively [14]. Due to the complex nature of the environment that hosts the foraminifera, particularly between the different oceanic basins, there are several physico-chemical parameters such as temperature, salinity, stratification, productivity, and oxygen availability that could potentially exert a strong or minor control on morphological variability [23,50,72]. Moreover, it is even more difficult to determine which environmental parameter reflects the optimum conditions of each species, since different species present varying ecological preferences.
Even though foraminiferal test size evidence has become increasingly available over the last decades through species-specific test size distribution patterns, comparatively little is known about the possible mechanism and how exactly it varies in response to brief and extreme environmental changes. Unfortunately, only limited effort has been made to track morphological transitions between succeeding species within a suspected lineage. Particularly for the G. menardii lineage, temperature, salinity, and stratification have been implicated as the primary drivers of its size shifts documented over both the Neogene and Quaternary [25,73,74,75].
During the Tortonian–Messinian transition, the temporal size variation of G. menardii presented here shows a good correlation (R2 = 0.83) with the stable oxygen isotopic composition of the surface dweller G. obliquus measured on the same samples (Figure 5a).
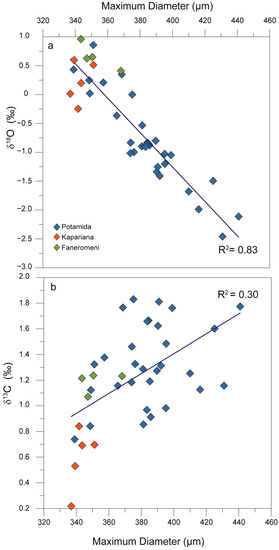
Figure 5.
(a) Strong correlation between Globorotalia menardii maximum diameter and δ18Oforam; (b) poor correlation between Globorotalia menardii maximum diameter and δ13C ratios.
A thorough examination of the entire dataset from all three sections shows that low δ18Oforam values generally coincide with larger average sizes (Figure 4). The above relationship indicates the synergic effect of temperature and/or salinity on average G. menardii size within the marginal Mediterranean Basin, with its large size spectrum observed to probably arise due to relatively large changes in both these environmental parameters documented during the pre-evaporitic MSC interval. Such parameters can indirectly influence deeper living species such as the thermocline-dweller G. menardii, since changes in SST and SSS are expected to mirror variations in the depth and extent of thermocline as well as the upper water column water stratification intensity, respectively—processes that are closely associated with the life history of the studied species [50]. In the generally stable warm late Tortonian eastern Mediterranean environment [42,62], the salinity variations seem to be more plausible compared to temperature changes for interpreting the conspicuous size variability. In the absence of SST and SSS estimates such as those used by Vasiliev et al. [63] and Kontakiotis et al. [41] on younger Kalamaki and Agios Myron sections, respectively, we can only approximate the SST and SSS changes accounting for the δ18Oforam variations depicted in the studied sections.
Foraminiferal δ18O records are a function of temperature and the ambient oxygen isotopic composition of seawater (δ18OSW) in which the shell precipitated, which, in turn, depends on global ice volume and ocean salinity. A higher temperature leads to decreasing δ18OSW because of the increased supply of glacial melt (i.e., fresher ocean), while higher salinity is generally a result of a negative water budget (i.e., excess evaporation) resulting in higher δ18OSW. If the temperature (T) component is accounted for, foraminiferal calcite δ18O can be used to estimate past changes in salinity, because δ18OSW covaries linearly with SSS [76], as both increase with evaporation and decrease through the admixture of low-δ18O freshwater. The observed 3.3‰ variation in δ18Oforam (Figure 4; Table 1) would indicate ~16 °C SST change if the temperature would have been the only modified palaeoceanographic parameter (using the Orbulina universa low-light paleotemperature equation of Bemis et al. [77]). If the SSS would be the single parameter determining the δ18Oforam (i.e., δ18OSW), this would translate to a salinity change of more than 7 (when using the modern δ18Osw–salinity relationship for the Mediterranean Sea of Pierre [78]). A 16 °C SST change is possible, but unlikely, considering the rather stable climate conditions at the end of Tortonian and the important temperature changes appearing after the studied interval [62], but in the range of 10 °C, as reported by Vasiliev et al. [63] and Kontakiotis et al. [41]. A salinity change of ~7 within the studied 125 kyr interval seems large even for a marginal marine basin. However, the connectivity of the Mediterranean to the open marine suffered large modifications around that time, with a reduction in the efficiency of gateways to the Atlantic Ocean because of the tectonic uplift of the Rifian and Betic corridors [79], but only at about 7.2 Ma. Similar ~7 SSS changes are documented in the younger Agios Myron [41] and Kalamaki Messinian [63] sections where they appear rather suddenly, within a few tens of kyrs. However, exclusively SST or SSS changes are highly unlikely to account for the observed δ18Oforam change. It must be a combination of changes affecting the two, SST and SSS, parameters. Considering that the 16 °C approximated SST changes would have been unrealistic, we can safely indicate that the SSS changes were significant in the eastern Mediterranean Basin at the end of the Tortonian, accompanying temperature changes at times; colder or saltier would result in higher δ18Oforam, and warmer or fresher in lower δ18Oforam.
Undoubtedly, strong temperature- or salinity-driven upper water-mass stratification changes could lead to a relatively large variation in the G. menardii size, reflecting the changing patterns of ecological niches within the thermocline [74,75]. The preference of such graduated micro-niches in the upper water column may also confirm their biostratigraphic significance over the Late Miocene. Importantly, our G. menardii size record strongly correlates (R2 = 0.83) with the δ18O measured on G. obliquus, therefore a direct relationship between size and δ18O values is proved.
However, up to now, the lack of consensus of available regional SST and SSS data and subsequent stratification intensity regarding this period makes it impossible to discern which parameter plays the dominant role in this evaporative setting, reflecting, in parallel, the preferred optimum environmental conditions for this species. Only if the temporal gradient of each specific parameter is quantified will we know the distinct SST/SSS-size relationships, better understand evolution or adaptive processes, and apply such measurements as accurate palaeoclimatic and/or palaeoceanographic proxies. Efforts for the quantitative estimation of the Mediterranean upper water column properties similar to those for the Messinian [41,42,63] should be extended into the Tortonian, while further studies on time-equivalent sections from different sub-basins (e.g., the Sorbas basin in Spain, Sicily in Italy) within the Mediterranean Sea are needed to confirm our results.
Doubtless, the problem of the combined T-S effect demands further investigation into potential disentangling between their signals in this setting. Nevertheless, this study clearly indicates that during the latest Tortonian, the temperature and salinity in this basin were close enough to the lower tolerance limits of G. menardii. The combined effect of the temperature decrease (~10 °C in the Mediterranean [41,42]) and any further increase of salinity during the Messinian possibly led to a drastic decrease in its abundance and/or size, as it could not survive under such conditions, and, finally, its replacement by G. conomiozea. Both the higher size variability observed in the Potamida section and the offset in average size measurements between the study sections just before the Tortonian/Messinian boundary (at 7.30–7.24 Ma) may be the signatures of less favourable conditions during that time.
Interestingly, the average G. menardii size and δ13C are poorly correlated (R2 = 0.3) in all three sections (Figure 5b), indicating that primary productivity has a smaller effect on G. menardii size compared to those of sea surface temperature and salinity in this setting. The scattering observed between the Kapariana and Potamida and/or Faneromeni sections reveals that regional differences in productivity might also affect the size in G. menardii. Proportional small productivity changes preceding the Tortonian–Messinian boundary, due to reduced freshwater inputs, can be inferred given the ultra-oligotrophic nature of the study area. For the Atlantic and Pacific Oceans, the test-size evolution of G. menardii during the Late Miocene [74,75] has shown that the larger sizes possibly preferred shallower water levels within the thermocline, due to a stronger chlorophyll maximum developed at the boundary between the surface and subsurface layer where the marine snow accumulates [80]. The increased concentrations of degrading particulate organic matter occurred in that specific layer [81] and the subsequent settlement of G. menardii shells may have led to the optimum test growth and development of larger shells. The high-density contrast probably developed within the Mediterranean upper water column is likely to bring nutrients in such a narrow water mass and favour its survival by promoting growth to a large size [82]. This adaptation may have occurred with a decreased upper thermocline ventilation strength and associated low oxygen saturation levels in accordance with the deglaciation proliferation model for late Quaternary menardiforms of Sexton and Norris [57].
6.2. Testing the Optimum Size Hypothesis
Relevant upper water column controls, in terms of temperature, salinity, and productivity gradients, on the morphology of the same species were recorded earlier by several researchers around the world. Initially, Ericson and Wollin [83] and Sarkar and Guha [84] noted decreased relative abundance or even the near absence of G. menardii during glacial periods in both Atlantic and Indian core transects. Later, Bhonsale and Saraswat [73] showed that such a distinct differential abundance pattern at the glacial–interglacial scale also covaries with its average size, with both to be comparatively higher during the interglacial periods. All of these initial findings seem to confirm the optimum size hypothesis previously proposed by Hecht [17], assuming that planktonic foraminiferal populations are largest at their ecological optimum. Testing this theory, our observations from the eastern Mediterranean only partly (test size, but not abundance) support it. This implies that under extremely stressful conditions such as those developed in the Mediterranean Sea during the MSC, the size is a good measure of preferred growth conditions, particularly for G. menardii, but the relative abundance could not be additionally considered as a determinant of optimum conditions. Our findings are consistent with the more recent work of Rillo et al. [85], which found no relationship between test size and relative abundance for several species (including G. menardii), possibly due to the adaptation strategies of their shells and/or factors influencing their relative abundance at a species level [86]. Under high-stress conditions, a species can narrowly adapt by adopting a stabilising selection strategy that allows only the phenotypes most tolerant to size variations to thrive [87]. Although its relative abundance will be reduced, its survival size ranges will persist under suboptimal conditions in the modified water mass structure. Therefore, each species follows its own ecological preferences by reacting subtly to environmental stress. We speculate that this interpretation fits well with the results presented here. Moreover, the species-specific size response to environmental parameters such as temperature, salinity, and the associated upper water mass structure documented in this work agrees well with the most updated environmental controls of modern planktonic foraminifera as those determined for the tropical Indian Ocean [86] and the subtropical Mediterranean Sea [21].
6.3. Size Evolutionary Constraints versus Late Miocene Mediterranean Palaeoceanography
During the Miocene, the menardiform globorotalids evolved through the G. praescitula-G. archeomenardii-G. praemenardii lineage [52,88] with the subsequent increase in their sizes. Although the diversification rise observed in this lineage parallels that in planktonic foraminiferal species richness observed globally from the middle Miocene [89], the accompanied size increase was not monotonous and it could be characterised as moderate during the Late Miocene and huge during the Pliocene [14,26]. Evidence from the equatorial Pacific and the marginal Caribbean Sea in the Atlantic Ocean [26] has shown a striking size increase from small, normally perforated G. menardii during the Late Miocene to large (sometimes giant) menardiiforms that prevailed during the Pliocene in response to an increase in the latitudinal thermal gradients in the upper water column caused by the emergence of the Isthmus of Panama and the intensification of the Northern Hemisphere Glaciation [56]. Such a size evolutionary trend was also documented in other Late Neogene planktonic foraminiferal populations in the level of single species (e.g., G. crassaformis; [90]), and/or lineages (e.g., G. pleisiotumida/G. tumida [91], G. conoidea/G. inflata [92]).
In the Mediterranean Sea, the measured test-size variations show that the G. menardii lineage consisted of relatively intermediate-sized tests between 7.36 and 7.24 Ma. Such moderate size development (compared to that experienced during the Pliocene) was interpreted as a step increase in the G. menardii evolutionary mode, while the abrupt and short size alterations characterised by maxima and minima sizes were attributed to changing surface water properties. The only discrepancy between our size records can be seen at the top of the study interval (7.27–7.24 Ma), in which larger specimens were reported in Potamida compared to the other two sections. The heavier δ18O values documented in the former could be attributed to the higher water depth (600–700 m [93] or 400–550 m [37]) of the Potamida site compared to those (200–300 m [35,93]) of the Kapariana and Faneromeni sections. The latest Tortonian evidence from the marginal eastern Mediterranean Basin fully supports the low size increase reported in the open ocean [26], and further suggests that the observed species-specific morphological record could mirror the palaeoceanographic history of the Mediterranean during that time by providing hints to changes in the upper water column structure.
During the Late Miocene, the Mediterranean Basin was subjected to complex changes in terms of its ocean gateways configuration, water circulation and subsequent palaeoceanographic reorganisations, and paleoclimatic perturbations [40,41,42,60,63,94]. Since the late Tortonian, changes in the upper water column structure and stratification were accentuated as a response to MSC. The associated Messinian cooling event, well documented within [41,62] and beyond the Mediterranean Sea [95,96], undoubtedly enhanced the stratification and therefore provided new water niches. G. menardii tried to adapt under such environmental stress conditions by searching for new preferred habitats. Although the development of a stronger keel is often indicative of the depth of new habitats [12], no such characteristic can be extracted from our data set, possibly due to the regional and temporarily brief nature of the present work.
Following this scenario, the observed size variability could reflect an adaptive response of this species to the enhanced stratification and changing SSS and SST patterns (Figure 6). Particularly for the 7.30–7.27 Ma time interval when G. menardii tended to develop the largest and the smallest sizes between neighbouring samples in the Potamida section, these alternate size variations probably reflect occupation of shallower and deeper habitats, respectively. The shallower habitats may occur when the mixed layer becomes thin, less ventilated, and thermocline shoals in the photic zone during warming and/or freshening events (Figure 6).
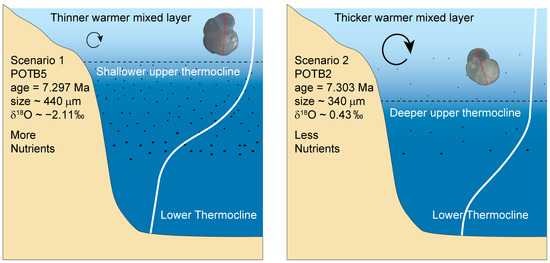
Figure 6.
Schematic illustration of the combined thermal- or salinity-driven stratification and thermocline development hypothesis.
In the Late Miocene, the strong density contrast, possibly due to the combined temperature–salinity gradient between the surface and subsurface water masses, reinforced the stratification intensity. In such a strong thermocline, G. menardii gametes and nutrients are thought to concentrate at a shallower level habitat [82], thus explaining the existence of larger foraminiferal sizes. On the contrary, during cold/salty episodes, the local paleo-wind intensification along with the increased evaporation over the eastern Mediterranean Basin possibly led to a deepening of the mixed layer and a subsequent depression of the thermocline. Under such physical conditions, the accumulation of chlorophyll and organic matter was lower and might have occurred in the intermediate to lower thermocline layers [74]. This weak thermocline structure resulted in the test growth reduction as manifested by intermediate to small shells. The ongoing deterioration in G. menardii viability under enhanced environmental pressure presumably caused its relatively low percentage or barren intervals towards the Tortonian–Messinian boundary (mostly in the Kapariana and Faneromeni sections). In this regard, the above interpretations reveal a direct relationship between the test size and thermal- or salinity-driven upper water column stratification in the habitat of G. menardii by suggesting that the depth migration of this species within the thermocline could be considered possible, reflecting the most favourable conditions for its survival.
7. Conclusions
The morphological variability of G. menardii form 5 has been studied in three Cretan (Potamida, Kapariana, and Faneromeni) sections covering the 7.36–7.24 Ma time interval. Although the abundance and coiling direction of the analysed species do not show any systematic change during this time slice, its temporal size variations signify useful evolutionary constraints in terms of the palaeoecology and palaeoceanography of such a subtropical and high evaporative marginal setting. Such regional data could be characterised as complementary to the relatively scarce, open ocean evolutionary trend in menardiforms known for the Late Miocene in a global context. Our observations from the eastern sector of the Mediterranean indicate a low test-size increase during the latest Tortonian accompanied by significant temporal variability when approaching the Tortonian–Messinian boundary. The latter appears to be associated with abiotic changes in the upper water column structure as a response to changing surface water properties (temperature, salinity, stratification, and productivity) and thermocline development. The better correspondence of average size with oxygen rather than carbon isotopic composition clearly indicates that the size of G. menardii is more affected by sea surface temperature and salinity than primary productivity. The abiotic mechanism for the observed size variability is likely attributed to the temperature- and/or salinity-driven stratification enhancement under stressful conditions that started to develop in the Mediterranean Basin during the latest Tortonian and gradually accentuated during the onset of the Messinian Salinity Crisis and the accompanied changes in G. menardii depth habitats. Based on that scenario, the larger tests may occur within warm/fresh surface water masses of a strong thermocline, while tests reduce in size during cold/salty and weak thermocline conditions. Overall, this study provides new insights into the Neogene evolutionary processes of menardiforms, and a further understanding of its ecological dynamics under environmental stress conditions.
Author Contributions
Conceptualisation, E.B. and G.K.; methodology, E.B., G.K. and A.A.; software, E.B., G.K. and I.V.; validation, E.B., G.K., A.A. and I.V.; formal analysis, E.B. and G.K.; investigation, E.B., G.K., A.A., I.V., P.M. and J.-J.C.; resources, A.A.; data curation, E.B., G.K., A.A. and I.V.; writing—original draft preparation, E.B., G.K. and I.V.; writing—review and editing, E.B., G.K., I.V., P.M., J.-J.C. and A.A.; visualisation, G.K.; supervision, A.A.; project administration, G.K.; funding acquisition, A.A. All authors have read and agreed to the published version of the manuscript.
Funding
This research received no external funding.
Institutional Review Board Statement
Not applicable.
Informed Consent Statement
Not applicable.
Data Availability Statement
The data used in this work are available on request to the corresponding authors.
Acknowledgments
The authors would like to acknowledge the Goethe Universität–Senckenberg BiK-F and the Department of Historical Geology–Paleontology of the National and Kapodistrian University of Athens (NKUA) for providing laboratory facilities.
Conflicts of Interest
The authors declare no conflict of interest.
References
- Knappertsbusch, M. Evolution im marinen Plankton. Mitt. Nat. Ges. Beider 2011, 13, 3–14. [Google Scholar]
- Dunson, W.A.; Travis, J. The Role of Abiotic Factors in Community Organization. Am. Nat. 1991, 138, 1067–1091. [Google Scholar] [CrossRef]
- Lagomarsino, L.P.; Condamine, F.L.; Antonelli, A.; Mulch, A.; Davis, C.C. The abiotic and biotic drivers of rapid diversification in Andean bellflowers (Campanulaceae). New Phytol. 2016, 210, 1430–1442. [Google Scholar] [CrossRef] [PubMed]
- Lazarus David, B. The deep-sea microfossil record of macroevolutionary change in plankton and its study. Geol. Soc. Lond. Spec. Publ. 2011, 358, 141–166. [Google Scholar] [CrossRef]
- Kucera, M. Chapter Six Planktonic Foraminifera as Tracers of Past Oceanic Environments. In Developments in Marine Geology; Hillaire-Marcel, C., De Vernal, A., Eds.; Elsevier: Amsterdam, The Netherlands, 2007; Volume 1, pp. 213–262. [Google Scholar]
- Giamali, C.; Koskeridou, E.; Antonarakou, A.; Ioakim, C.; Kontakiotis, G.; Karageorgis, A.; Rousakis, G.; Karakitsios, V. Multiproxy ecosystem response of abrupt Holocene climatic changes in the northeastern Mediterranean sedimentary archive and hydrologic regime. Quat. Res. 2019, 92, 665–685. [Google Scholar] [CrossRef]
- Kucera, M.; Weinelt, M.; Kiefer, T.; Pflaumann, U.; Hayes, A.; Weinelt, M.; Chen, M.-T.; Mix, A.C.; Barrows, T.T.; Cortijo, E.; et al. Reconstruction of sea-surface temperatures from asseblages of planktonic foraminifera. Quat. Sci. Rev. 2005, 24, 951–998. [Google Scholar] [CrossRef]
- Fraass, A.J.; Kelly, D.C.; Peters, S.E. Macroevolutionary History of the Planktic Foraminifera. Annu. Rev. Earth Planet. Sci. 2015, 43, 139–166. [Google Scholar] [CrossRef]
- Lowery, C.M.; Fraass, A.J. Morphospace expansion paces taxonomic diversification after end Cretaceous mass extinction. Nat. Ecol. Evol. 2019, 3, 900–904. [Google Scholar] [CrossRef]
- Darling, K.F.; Wade, C.M.; Kroon, D.; Brown, A.J.L. Planktic foraminiferal molecular evolution and their polyphyletic origins from benthic taxa. Mar. Micropaleontol. 1997, 30, 251–266. [Google Scholar] [CrossRef]
- Hart, M.B.; Hylton, M.D.; Oxford, M.J.; Price, G.D.; Hudson, W.; Smart, C.W. The search for the origin of the planktic Foraminifera. J. Geol. Soc. 2003, 160, 341–343. [Google Scholar] [CrossRef]
- Ezard, T.H.G.; Aze, T.; Pearson, P.N.; Purvis, A. Interplay Between Changing Climate and Species’ Ecology Drives Macroevolutionary Dynamics. Science 2011, 332, 349–351. [Google Scholar] [CrossRef] [PubMed]
- Zachos, J.; Pagani, M.; Sloan, L.; Thomas, E.; Billups, K. Trends, Rhythms, and Aberrations in Global Climate 65 Ma to Present. Science 2001, 292, 686–693. [Google Scholar] [CrossRef] [PubMed]
- Schmidt, D.N.; Renaud, S.; Bollmann, J.; Schiebel, R.; Thierstein, H.R. Size distribution of Holocene planktic foraminifer assemblages: Biogeography, ecology and adaptation. Mar. Micropaleontol. 2004, 50, 319–338. [Google Scholar] [CrossRef]
- Wade, B.S.; Poole, C.R.; Boyd, J.L. Giantism in Oligocene planktonic foraminifera Paragloborotalia opima: Morphometric constraints from the equatorial Pacific Ocean. Newsl. Stratigr. 2016, 49, 421–444. [Google Scholar] [CrossRef]
- Woodhouse, A.; Jackson, S.; Jamieson, R.; Newton, R.E.; Sexton, P.F.; Aze, T. Adaptive ecological niche migration does not negate extinction susceptibility. Sci. Rep. 2021, 11, 15411. [Google Scholar] [CrossRef]
- Hecht, A.D. An ecologic model for test size variation in Recent planktonic foraminifera; applications to the fossil record. J. Foraminifer. Res. 1976, 6, 295–311. [Google Scholar] [CrossRef]
- Malmgren, B.A.; Kennett, J.P. Test size variation in Globigerina bulloides in response to Quaternary palaeoceanographic changes. Nature 1978, 275, 123–124. [Google Scholar] [CrossRef]
- Morard, R.; Quillévéré, F.; Escarguel, G.; Ujiie, Y.; de Garidel-Thoron, T.; Norris, R.D.; de Vargas, C. Morphological recognition of cryptic species in the planktonic foraminifer Orbulina universa. Mar. Micropaleontol. 2009, 71, 148–165. [Google Scholar] [CrossRef]
- Kontakiotis, G.; Antonarakou, A.; Mortyn, P.G.; Drinia, H.; Anastasakis, G.; Zarkogiannis, S.; Möbius, J. Morphological recognition of Globigerinoides ruber morphotypes and their susceptibility to diagenetic alteration in the eastern Mediterranean Sea. J. Mar. Syst. 2017, 174, 12–24. [Google Scholar] [CrossRef]
- Zarkogiannis, S.D.; Kontakiotis, G.; Antonarakou, A. Recent planktonic foraminifera population and size response to Eastern Mediterranean hydrography. Rev. Micropaléontol. 2020, 69, 100450. [Google Scholar] [CrossRef]
- Eynaud, F.; Cronin, T.M.; Smith, S.A.; Zaragosi, S.; Mavel, J.; Mary, Y.; Mas, V.; Pujol, C. Morphological variability of the planktonic foraminifer Neogloboquadrina pachyderma from ACEX cores: Implications for Late Pleistocene circulation in the Arctic Ocean. Micropaleontology 2009, 55, 101–116. [Google Scholar] [CrossRef]
- Renaud, S.; Schmidt, D.N. Habitat tracking as a response of the planktic foraminifer Globorotalia truncatulinoides to environmental fluctuations during the last 140 kyr. Mar. Micropaleontol. 2003, 49, 97–122. [Google Scholar] [CrossRef]
- Zarkogiannis, S.D.; Kontakiotis, G.; Antonarakou, A.; Mortyn, P.G.; Drinia, H. Latitudinal Variation of Planktonic Foraminifera Shell Masses during Termination I. IOP Conf. Ser. Earth Environ. Sci. 2019, 221, 012052. [Google Scholar] [CrossRef]
- Knappertsbusch, M. Evolutionary prospection in the Neogene planktic foraminifer Globorotalia menardii and related forms from ODP Hole 925B (Ceara Rise, western tropical Atlantic): Evidence for gradual evolution superimposed by long distance dispersal? Swiss J. Palaeontol. 2016, 135, 205–248. [Google Scholar] [CrossRef]
- Knappertsbusch, M.W. Morphological Variability of Globorotalia Menardii in DSDP Sites 68-502 and 68-503; PANGAEA: Brest, France, 2007. [Google Scholar] [CrossRef]
- Mary, Y.; Knappertsbusch, M.W. Morphological variability of menardiform globorotalids in the Atlantic Ocean during Mid-Pliocene. Mar. Micropaleontol. 2013, 101, 180–193. [Google Scholar] [CrossRef]
- Chatzaras, V.; Xypolias, P.; Doutsos, T. Exhumation of high-pressure rocks under continuous compression: A working hypothesis for the southern Hellenides (central Crete, Greece). Geol. Mag. 2006, 143, 859–876. [Google Scholar] [CrossRef]
- Ten, V.; Postma. Neogene tectonics and basin fill patterns in the Hellenic outer-arc (Crete, Greece). Basin Res. 1999, 11, 223–241. [Google Scholar] [CrossRef]
- van Hinsbergen, D.J.J.; Meulenkamp, J.E. Neogene supradetachment basin development on Crete (Greece) during exhumation of the South Aegean core complex. Basin Res. 2006, 18, 103–124. [Google Scholar] [CrossRef]
- Zachariasse, W.J.; van Hinsbergen, D.J.J.; Fortuin, A.R. Formation and fragmentation of a late Miocene supradetachment basin in central Crete: Implications for exhumation mechanisms of high-pressure rocks in the Aegean forearc. Basin Res. 2011, 23, 678–701. [Google Scholar] [CrossRef]
- Meulenkamp, J.E.; Dermitzakis, M.; Georgiadou-Dikeoulia, E.; Jonkers, H.A.; Böger, H. Field Guide to the Neogene of Crete; University of Athens: Greece, Athens, 1979. [Google Scholar]
- Drinia, H.; Antonarakou, A.; Kontakiotis, G. On the occurrence of Early Pliocene marine deposits in the Ierapetra Basin, Eastern Crete, Greece. Bull. Geosci. 2008, 83, 63–78. [Google Scholar] [CrossRef]
- Krijgsman, W.; Hilgen, F.; Langereis, C.G.; Zachariasse, W.J. The age of the Tortonian/Messinian boundary. Earth Planet. Sci. Lett. 1994, 121, 533–547. [Google Scholar] [CrossRef]
- Moissette, P.; Cornée, J.J.; Antonarakou, A.; Kontakiotis, G.; Drinia, H.; Koskeridou, E.; Tsourou, T.; Agiadi, K.; Karakitsios, V. Palaeoenvironmental changes at the Tortonian/Messinian boundary: A deep-sea sedimentary record of the eastern Mediterranean Sea. Palaeogeogr. Palaeoclimatol. Palaeoecol. 2018, 505, 217–233. [Google Scholar] [CrossRef]
- Zachariasse, W.J.; van Hinsbergen, D.J.J.; Fortuin, A.R. Mass wasting and uplift on Crete and Karpathos during the early Pliocene related to initiation of south Aegean left-lateral, strike-slip tectonics. Geol. Soc. Am. Bull. 2008, 120, 976–993. [Google Scholar] [CrossRef]
- Agiadi, K.; Antonarakou, A.; Kontakiotis, G.; Kafousia, N.; Moissette, P.; Cornée, J.J.; Manoutsoglou, E.; Karakitsios, V. Connectivity controls on the late Miocene eastern Mediterranean fish fauna. Int. J. Earth Sci. 2017, 106, 1147–1159. [Google Scholar] [CrossRef]
- Langereis, C.G.; Zachariasse, W.J.; Zijderveld, J.D.A. Late Miocene magnetobiostratigraphy of Crete. Mar. Micropaleontol. 1984, 8, 261–281. [Google Scholar] [CrossRef]
- Brachert, T.C.; Bornemann, A.; Reuter, M.; Galer, S.J.; Grimm, K.I.; Fassoulas, C. Upwelling history of the Mediterranean Sea revealed by stunted growth in the planktic foraminifera Orbulina universa (early Messinian, Crete, Greece). Int. J. Earth Sci. 2015, 104, 263–276. [Google Scholar] [CrossRef]
- Butiseacă, G.A.; van der Meer, M.T.J.; Kontakiotis, G.; Agiadi, K.; Thivaiou, D.; Besiou, E.; Antonarakou, A.; Mulch, A.; Vasiliev, I. Multiple crises preceded the Mediterranean Salinity Crisis: Aridification and vegetation changes revealed by biomarkers and stable isotopes. Glob. Planet. Chang. 2022, 217, 103951. [Google Scholar] [CrossRef]
- Kontakiotis, G.; Butiseacă, G.A.; Antonarakou, A.; Agiadi, K.; Zarkogiannis, S.D.; Krsnik, E.; Besiou, E.; Zachariasse, W.J.; Lourens, L.; Thivaiou, D.; et al. Hypersalinity accompanies tectonic restriction in the eastern Mediterranean prior to the Messinian Salinity Crisis. Palaeogeogr. Palaeoclimatol. Palaeoecol. 2022, 592, 110903. [Google Scholar] [CrossRef]
- Kontakiotis, G.; Besiou, E.; Antonarakou, A.; Zarkogiannis, S.D.; Kostis, A.; Mortyn, P.G.; Moissette, P.; Cornée, J.J.; Schulbert, C.; Drinia, H.; et al. Decoding sea surface and paleoclimate conditions in the eastern Mediterranean over the Tortonian-Messinian Transition. Palaeogeogr. Palaeoclimatol. Palaeoecol. 2019, 534, 109312. [Google Scholar] [CrossRef]
- Krijgsman, W.; Hilgen, F.; Langereis, C.G.; Santarelli, A.; Zachariasse, W.J. Late Miocene magnetostratigraphy, biostratigraphy and cyclostratigraphy in the Mediterranean. Earth Planet. Sci. Lett. 1995, 136, 475–494. [Google Scholar] [CrossRef]
- Bolnick, D.I.; Svanbäck, R.; Fordyce, J.A.; Yang, L.H.; Davis, J.M.; Hulsey, C.D.; Forister, M.L. The Ecology of Individuals: Incidence and Implications of Individual Specialization. Am. Nat. 2003, 161, 1–28. [Google Scholar] [CrossRef]
- Jax, K. Function and “functioning” in ecology: What does it mean? Oikos 2005, 111, 641–648. [Google Scholar] [CrossRef]
- Violle, C.; Enquist, B.J.; McGill, B.J.; Jiang, L.; Albert, C.H.; Hulshof, C.; Jung, V.; Messier, J. The return of the variance: Intraspecific variability in community ecology. Trends Ecol. Evol. 2012, 27, 244–252. [Google Scholar] [CrossRef]
- Akçakaya, H.R.; Rodrigues, A.S.L.; Keith, D.A.; Milner-Gulland, E.J.; Sanderson, E.W.; Hedges, S.; Mallon, D.P.; Grace, M.K.; Long, B.; Meijaard, E.; et al. Assessing ecological function in the context of species recovery. Conserv. Biol. 2020, 34, 561–571. [Google Scholar] [CrossRef]
- McGuire, J.L.; Lauer, D.A. Linking patterns of intraspecific morphology to changing climates. J. Biogeogr. 2020, 47, 2417–2425. [Google Scholar] [CrossRef]
- Cushman, J.A. An outline of a reclassification of the foraminifera. Contrib. Cushman Lab. Foraminifer. Res. 1927, 3, 1–105. [Google Scholar]
- Schiebel, R.; Hemleben, C. Planktic Foraminifers in the Modern Ocean; Springer: Berlin/Heidelberg, Germany, 2017. [Google Scholar]
- Mekik, F.; François, R. Tracing deep-sea calcite dissolution: Agreement between the Globorotalia menardii fragmentation index and elemental ratios (Mg/Ca and Mg/Sr) in planktonic foraminifers. Paleoceanography 2006, 21. [Google Scholar] [CrossRef]
- Kennett, J.P.; Srinivasan, M.S. Neogene Planktonic Foraminifera: A Phylogenetic Atlas; Hutchinson Ross; Distributed by Worldwide by Van Nostrand Reinhold: New York, NY, USA, 1983. [Google Scholar]
- Hemleben, C.; Spindler, M.A.; Anderson, O.R. Modern Planktonic Foraminifera; Hemleben, C., Spindler, M., Anderson, O.R., Eds.; Springer: New York, NY, USA, 1989. [Google Scholar]
- Caley, T.; Giraudeau, J.; Malaizé, B.; Rossignol, L.; Pierre, C. Agulhas leakage as a key process in the modes of Quaternary climate changes. Proc. Natl. Acad. Sci. USA 2012, 109, 6835–6839. [Google Scholar] [CrossRef]
- Gasperi, J.T.; Kennett, J.P. Isotopic evidence for depth stratification and paleoecology of Miocene planktonic foraminifera: Western equatorial Pacific DSDP Site 289. Pac. Neogene-Environ. Evol. Events 1992, 22, 117–147. [Google Scholar]
- Chaisson, W.P. Vicarious living: Pliocene menardellids between an isthmus and an ice sheet. Geology 2003, 31, 1085–1088. [Google Scholar] [CrossRef]
- Sexton, P.F.; Norris, R.D. High latitude regulation of low latitude thermocline ventilation and planktic foraminifer populations across glacial–interglacial cycles. Earth Planet. Sci. Lett. 2011, 311, 69–81. [Google Scholar] [CrossRef]
- Chaisson, W.P.; Ravelo, A.C. Changes in upper water-column structure at Site 925, late Miocene–Pleistocene: Planktonic foraminifer assemblage and isotopic evidence. In Proceedings of the Ocean Drilling Program, Scientific Results, Charleston, SC, USA, 8 January–14 February 1997; p. 154. [Google Scholar] [CrossRef]
- Regenberg, M.; Nielsen, S.N.; Kuhnt, W.; Holbourn, A.; Garbe-Schönberg, D.; Andersen, N. Morphological, geochemical, and ecological differences of the extant menardiform planktonic foraminifera Globorotalia menardii and Globorotalia cultrata. Mar. Micropaleontol. 2010, 74, 96–107. [Google Scholar] [CrossRef]
- Bulian, F.; Kouwenhoven, T.J.; Jiménez-Espejo, F.J.; Krijgsman, W.; Andersen, N.; Sierro, F.J. Impact of the Mediterranean-Atlantic connectivity and the late Miocene carbon shift on deep-sea communities in the Western Alboran Basin. Palaeogeogr. Palaeoclimatol. Palaeoecol. 2022, 589, 110841. [Google Scholar] [CrossRef]
- Mancini, M.; Karakuzu, A.; Cohen-Adad, J.; Cercignani, M.; Nichols, T.E.; Stikov, N. An interactive meta-analysis of MRI biomarkers of myelin. Elife 2020, 9, e61523. [Google Scholar] [CrossRef] [PubMed]
- Tzanova, A.; Herbert, T.D.; Peterson, L. Cooling Mediterranean Sea surface temperatures during the Late Miocene provide a climate context for evolutionary transitions in Africa and Eurasia. Earth Planet. Sci. Lett. 2015, 419, 71–80. [Google Scholar] [CrossRef]
- Vasiliev, I.; Karakitsios, V.; Bouloubassi, I.; Agiadi, K.; Kontakiotis, G.; Antonarakou, A.; Triantaphyllou, M.; Gogou, A.; Kafousia, N.; de Rafélis, M.; et al. Large sea surface temperature, salinity, and productivity-preservation changes preceding the onset of the Messinian Salinity Crisis in the eastern Mediterranean Sea. Paleoceanogr. Paleoclimatol. 2019, 34, 182–202. [Google Scholar] [CrossRef]
- Antonarakou, A.; Drinia, H.; Tsaparas, N.; Dermitzakis, M.D. Micropaleontological parameters as proxies of late Miocene surface water properties and paleoclimate in Gavdos Island, eastern Mediterranean. Geodiversitas 2007, 29, 379–399. [Google Scholar]
- Elderfield, H.; Vautravers, M.; Cooper, M. The relationship between shell size and Mg/Ca, Sr/Ca, δ18O, and δ13C of species of planktonic foraminifera. Geochem. Geophys. Geosyst. 2002, 3, 1–13. [Google Scholar] [CrossRef]
- Antonarakou, A.; Kontakiotis, G.; Vasilatos, C.; Besiou, E.; Zarkogiannis, S.; Drinia, H.; Mortyn, P.; Tsaparas, N.; Makri, P.; Karakitsios, V. Evaluating the Effect of Marine Diagenesis on Late Miocene Pre-Evaporitic Sedimentary Successions of Eastern Mediterranean Sea. IOP Conf. Ser. Earth Environ. Sci. 2019, 221, 012051. [Google Scholar] [CrossRef]
- Besiou, E.; Kontakiotis, G.; Antonarakou, A.; Mulch, A.; Vasiliev, I. Climate and carbon cycle changes drive the hydrographic configuration of the eastern Mediterranean through the Tortonian-Messinian. In Proceedings of the EGU General Assembly 2021, Vienna, Austria, 19–30 April 2021. EGU21-8853. [Google Scholar]
- Schmidt, D.N.; Lazarus, D.; Young, J.R.; Kucera, M. Biogeography and evolution of body size in marine plankton. Earth-Sci. Rev. 2006, 78, 239–266. [Google Scholar] [CrossRef]
- Kouwenhoven, T.J.; Seidenkrantz, M.S.; van der Zwaan, G.J. Deep-water changes: The near-synchronous disappearance of a group of benthic foraminifera from the Late Miocene Mediterranean1NSG Paper No. 99037.1. Palaeogeogr. Palaeoclimatol. Palaeoecol. 1999, 152, 259–281. [Google Scholar] [CrossRef]
- Weinkauf, M.F.G.; Kunze, J.G.; Waniek, J.J.; Kučera, M. Seasonal Variation in Shell Calcification of Planktonic Foraminifera in the NE Atlantic Reveals Species-Specific Response to Temperature, Productivity, and Optimum Growth Conditions. PLoS ONE 2016, 11, e0148363. [Google Scholar] [CrossRef] [PubMed]
- Zarkogiannis, S.D.; Antonarakou, A.; Tripati, A.; Kontakiotis, G.; Mortyn, P.G.; Drinia, H.; Greaves, M. Influence of surface ocean density on planktonic foraminifera calcification. Sci. Rep. 2019, 9, 533. [Google Scholar] [CrossRef] [PubMed]
- Kuroyanagi, A.; Rocha, R.E.d.; Bijma, J.; Spero, H.J.; Russell, A.D.; Eggins, S.M.; Kawahata, H. Effect of dissolved oxygen concentration on planktonic foraminifera through laboratory culture experiments and implications for oceanic anoxic events. Mar. Micropaleontol. 2013, 101, 28–32. [Google Scholar] [CrossRef]
- Bhonsale, S.; Saraswat, R. Abundance and size variation of Globorotalia menardii in the Northeastern Indian Ocean during the late quaternary. J. Geol. Soc. India 2012, 80, 771–782. [Google Scholar] [CrossRef]
- Friesenhagen, T. Test-size evolution of the planktonic foraminifer Globorotalia menardii in the eastern tropical Atlantic since the Late Miocene. Biogeosciences 2022, 19, 777–805. [Google Scholar] [CrossRef]
- Knappertsbusch, M. Morphological evolution of menardiform globorotalids at Western Pacific Warm Pool ODP Hole 806C (Ontong-Java Plateau) Evolution morphologique du groupe de Globorotalia menardii au Site ODP 806C (Ontong-Java Plateau, Pacifique tropical occidental). Rev. Micropaléontol. 2022, 74, 100608. [Google Scholar] [CrossRef]
- LeGrande, A.N.; Schmidt, G.A. Global gridded data set of the oxygen isotopic composition in seawater. Geophys. Res. Lett. 2006, 33, 150–160. [Google Scholar] [CrossRef]
- Bemis, B.E.; Spero, H.J.; Bijma, J.; Lea, D.W. Reevaluation of the oxygen isotopic composition of planktonic foraminifera: Experimental results and revised paleotemperature equations. Paleoceanography 1998, 13, 150–160. [Google Scholar] [CrossRef]
- Pierre, C. The oxygen and carbon isotope distribution in the Mediterranean water masses. Mar. Geol. 1999, 153, 41–55. [Google Scholar] [CrossRef]
- Krijgsman, W.; Hilgen, F.J.; Raffi, I.; Sierro, F.J.; Wilson, D.S. Chronology, causes and progression of the Messinian salinity crisis. Nature 1999, 400, 652–655. [Google Scholar] [CrossRef]
- Möller, K.O.; St John, M.; Temming, A.; Floeter, J.; Sell, A.F.; Herrmann, J.P.; Möllmann, C. Marine snow, zooplankton and thin layers: Indications of a trophic link from small-scale sampling with the Video Plankton Recorder. Mar. Ecol. Prog. Ser. 2012, 468, 57–69. [Google Scholar] [CrossRef]
- Prairie, J.C.; Ziervogel, K.; Camassa, R.; McLaughlin, R.M.; White, B.L.; Dewald, C.; Arnosti, C. Delayed settling of marine snow: Effects of density gradient and particle properties and implications for carbon cycling. Mar. Chem. 2015, 175, 28–38. [Google Scholar] [CrossRef]
- Broecker, W.; Pena, L.D. Delayed Holocene reappearance of G. menardii. Paleoceanography 2014, 29, 291–295. [Google Scholar] [CrossRef]
- Ericson, D.B.; Wollin, G. Pleistocene Climates and Chronology in Deep-Sea Sediments. Science 1968, 162, 1227–1234. [Google Scholar] [CrossRef]
- Sarkar, A.; Guha, A.K. Pleistocene paleoclimatic zonation in northern Indian Ocean as revealed from Globorotalia menardii abundance. Indian J. Mar. Sci. 1997, 26, 84–87. [Google Scholar]
- Rillo, M.C.; Miller, C.G.; Kucera, M.; Ezard, T.H.G. Intraspecific size variation in planktonic foraminifera cannot be consistently predicted by the environment. Ecol. Evol. 2020, 10, 11579–11590. [Google Scholar] [CrossRef]
- Adebayo, M.B.; Bolton, C.T.; Marchant, R.; Bassinot, F.; Conrod, S.; de Garidel-Thoron, T. Environmental Controls of Size Distribution of Modern Planktonic Foraminifera in the Tropical Indian Ocean. Geochemistry 2023, 24, e2022GC010586. [Google Scholar] [CrossRef]
- Weinkauf, M.F.G.; Bonitz, F.G.W.; Martini, R.; Kučera, M. An extinction event in planktonic Foraminifera preceded by stabilizing selection. PLoS ONE 2019, 14, e0223490. [Google Scholar] [CrossRef] [PubMed]
- Bizon, G.; Glacon, G. Morphological Investigations on the Genus Globorotalia from Site 372; U.S. Government Printing Office: Washington, DC, USA, 1978.
- Wei, K.-Y.; Kennett, J.P. Taxonomic evolution of Neogene planktonic foraminifera and paleoceanographic relations. Paleoceanography 1986, 1, 67–84. [Google Scholar] [CrossRef]
- Arnold, A.J. Phyletic evolution in the Globorotalia crassaformis (Galloway and Wissler) lineage; a preliminary report. Paleobiology 1983, 9, 390–397. [Google Scholar] [CrossRef]
- Malmgren, B.A.; Berggren, W.A.; Lohmann, G.P. Evidence for punctuated gradualism in the late Neogene Globorotalia tumida lineage of planktonic foraminifera. Paleobiology 1983, 9, 377–389. [Google Scholar] [CrossRef]
- Malmgren, B.A.; Kennett, J.P. Phyletic gradualism in a Late Cenozoic planktonic foraminiferal lineage; DSDP Site 284, southwest Pacific. Paleobiology 1981, 7, 230–240. [Google Scholar] [CrossRef]
- Kouwenhoven, T.J.; van der Zwaan, G.J. A reconstruction of late Miocene Mediterranean circulation patterns using benthic foraminifera. Palaeogeogr. Palaeoclimatol. Palaeoecol. 2006, 238, 373–385. [Google Scholar] [CrossRef]
- Krijgsman, W.; Capella, W.; Simon, D.; Hilgen, F.; Kouwenhoven, T.; Meijer, P.; Sierro, F.; Tulbure, M.; van den Berg, B.; van der Schee, M.; et al. The Gibraltar Corridor: Watergate of the Messinian Salinity Crisis. Mar. Geol. 2018, 403, 238–246. [Google Scholar] [CrossRef]
- Herbert, T.D.; Lawrence, K.T.; Tzanova, A.; Peterson, L.C.; Caballero-Gill, R.; Kelly, C.S. Late Miocene global cooling and the rise of modern ecosystems. Nat. Geosci. 2016, 9, 843–847. [Google Scholar] [CrossRef]
- Holbourn, A.; Kuhnt, W.; Clemens, S.C.; Kochhann, K.G.D.; Jöhnck, J.; Lübbers, J.; Andersen, N. Late Miocene climate cooling and intensification of southeast Asian winter monsoon. Nat. Commun. 2018, 9, 1584. [Google Scholar] [CrossRef]
Disclaimer/Publisher’s Note: The statements, opinions and data contained in all publications are solely those of the individual author(s) and contributor(s) and not of MDPI and/or the editor(s). MDPI and/or the editor(s) disclaim responsibility for any injury to people or property resulting from any ideas, methods, instructions or products referred to in the content. |
© 2023 by the authors. Licensee MDPI, Basel, Switzerland. This article is an open access article distributed under the terms and conditions of the Creative Commons Attribution (CC BY) license (https://creativecommons.org/licenses/by/4.0/).