Article

Improving the Overall Efficiency of Marine Power Systems through Co-Optimization of Top-Bottom Combined Cycle by Means of Exhaust-Gas Bypass: A Semi Empirical Function Analysis Method

College of Power and Energy Engineering, Harbin Engineering University, Harbin 150001, China
*
Author to whom correspondence should be addressed.
J. Mar. Sci. Eng. 2023, 11(6), 1215; https://doi.org/10.3390/jmse11061215
Submission received: 19 May 2023 / Revised: 9 June 2023 / Accepted: 9 June 2023 / Published: 13 June 2023
(This article belongs to the Section Ocean Engineering)

Abstract

:
The mandatory implementation of the standards laid out in the Energy Efficiency Existing Ship Index (EEXI) and the Carbon Intensity Indicator (CII) requires ships to improve their efficiency and thereby reduce their carbon emissions. To date, the steam Rankine cycle (RC) has been widely used to recover wasted heat from marine main engines to improve the energy-conversion efficiency of ships. However, current marine low-speed diesel engines are usually highly efficient, leading to the low exhaust gas temperature. Additionally, the temperature of waste heat from exhaust gas is too low to be recovered economically by RC. Consequently, a solution has been proposed to improve the overall efficiency by means of waste heat recovery. The exhaust gas is bypassed before the turbocharger, which can decrease the air excess ratio of main engine to increase the exhaust gas temperature, and to achieve high overall efficiency of combined cycle. For quantitative assessments, a semi-empirical formula related to the bypass ratio, the excess air ratio, and the turbocharging efficiency was developed. Furthermore, the semi-empirical formula was verified by testing and engine model. The results showed that the semi-empirical formula accurately represented the relationships of these parameters. Assessment results showed that at the turbocharging efficiency of 68.8%, the exhaust temperature could increase by at least 75 °C, with a bypass ratio of 15%. Moreover, at the optimal bypass ratio of 11.1%, the maximum overall efficiency rose to 54.84% from 50.34%. Finally, EEXI (CII) decreased from 6.1 (4.56) to 5.64 (4.12), with the NOx emissions up to Tier II standard.

1. Introduction

Full-scale decarbonization has become a major goal in the shipping industry among global efforts to combat climate change [1]. To control carbon emissions, the International Maritime Organization (IMO) drew up amendments in MARPOL Annex VI, which came into force on 1 November 2022 [2]. These new regulations made it mandatory for all ships to calculate their attained Energy Efficiency Existing Ship Index (EEXI) and Carbon Intensity Indicator (CII) to measure their energy efficiency [3], and ships that do not meet the requirements of EEXI and CII need to be modified or put out of service [4].
Although recently built ships require only minor adjustments to meet the relevant standards, most old ships still need to reduce carbon emissions through methods such as limiting the engine power, improving the main engine [5], adjusting the waste-heat recovery system, utilizing alternative fuels [6,7,8] and installing emerging energy-conversion devices.
However, the engine power limit significantly increases the sailing time, while main engine improvements and adopting alternative fuels may lead to significant modifications of old ships [9,10,11]. Furthermore, it is difficult to improve the engine efficiency according to current technologies [12,13,14].
Schroer et al. [15] highlighted that combining Waste Heat Recovery Systems (WHRS) with corresponding Variable Frequency Drive (VFD) applications is a viable solution for certain types of ships, and this approach holds significant potential for reducing emissions. Konur et al. [16,17] have emphasized the potential of waste heat recovery in reducing both the propulsion and hotel load of ships. Moreover, Uyanık et al. [18] and Walker et al. [19] have identified a significant carbon reduction potential through their research on the application of waste heat recovery in ship propulsion. Furthermore, Amr et al. [20,21] have demonstrated that recovering waste heat from ships is a successful strategy for enhancing their overall energy efficiency.
Technologies for marine-engine waste-heat recovery [14,20,21,22] primarily include Power Turbines (PT) [23,24], Steam Rankine Cycles (RCs) [25,26], Organic Rankine Cycles (ORC) [27,28,29], Kalina Cycles (KC) [22,27], and Supercritical Carbon Dioxide Brayton Cycles (SCBCs) [30,31], as well as the integration of multiple systems.
Historically, the WHR technologies of marine engines were applied mainly by two methods: supplementing the main engine with an additional WHR system [22,23,25,27,28,29] and employing an integrated engine-WHR top-bottom cycle system. In the former system, WHRS was just regarded as an attachment that could not significantly affect the main engine. However, a highly efficient engine achieved a low exhaust temperature [32,33,34], while the waste-boiler outlet temperature should be higher than acid dew point (ADP) [32,35] to avoid corrosion by the application of sulphur-containing fuel. This caused a small temperature drop from the inlet and the outlet of the waste-heat boiler and thereby a small difference in enthalpy. Therefore, there was no adoptable WHRS for the former application from the perspective of economy [34,36,37]. On the contrary, the latter system belonged to an integrated-style system, in which the integration of the engine and the WHRS was achieved by main engine tuning to meet the available waste-heat requirement of WHRS. Specifically, the main engine was called the topping cycle or the tuning engine while the WHRS was called the bottoming cycle. This type of integration was achieved through the sacrifice of efficiency in the topping cycle, which, however, could obtain the high overall efficiency of the integrated top-bottom cycle system.
These integrated methods have been employed in several previous studies. Singh et al. [38] proposed a strategy aimed at high efficiency by means of increasing the coolant temperatures of light-duty engines, maintaining that the higher coolant temperature could reduce the heat transfer losses in the cylinder but increase NOx emissions. Furthermore, they stated that the temperature increased from 80 °C to 160 °C could improve the ORC bottoming-cycle system performance. The results showed that the strategy could increase the system efficiency by 5.2% and the engine brake efficiency by 1.7%. Further, the authors proposed that Selective Catalytic Reduction could be used to control NOx emissions. However, our group [39,40] proposed two systems aimed at the integration of the tuning engine and the WHRS. One was a combined cycle including SCBC and KC, and the other was integration of RC, PT and ORC. The SCBC and PT, which were applied with the high-temperature heat reservoirs, were used to recover the waste heat of the bypassed exhaust gas; RC and KC were used to recover the waste heat of the engine exhaust gas, and ORC was used to recover the waste heat from the waste heat boiler tail section. Moreover, the tuning engine was applied, in which part of exhaust gas would be bypassed before the turbine to obtain a lower charging air mass flow and thereby a lower air excess ratio. The such solution could reduce the combustion efficiency and improve the exhaust-gas temperature, thereby achieving a higher WHR efficiency, as shown in Figure 1 [41]. In practice, the tuning strategy of bypassing the exhaust gas was first proposed by Larsen et al. [42,43], whose combinations included PT, RC, and PT-RC systems. They indicated that employing PT would provide a 3–5% recovery ratio, while adopting RC would provide a 5–8% recovery ratio, and utilizing PT-RC would provide an 8–11% recovery ratio. Currently, in the view of technical maturity, PT and RC are significantly suit for maritime applications [44,45,46]. However, as noted above, the low-temperature exhaust gas of a high-efficient engine could make RC shut down [22,27,47,48], which was the reason for the tuning strategy. Moreover, the bypassing strategy, which employed a low-air excess ratio and a combustion efficiency operating mode, stood for the transformation of energy flow distribution between topping and bottoming cycles. Furthermore, the higher energy conversion efficiency that PT obtained in the engine could also improve the overall efficiency. The lower exhaust temperature, the higher efficiency of the bottoming cycle, and the limitations of ADP would make the tuning strategy e widely feasible [34,49,50,51]. However, the specific effects of this tuning strategy are lacking, with only approximate ranges reported. Furthermore, the positive effects of the tuning strategy were achieved by a small air mass flow caused by the exhaust-gas bypass. In practice, the bypassing exhaust gas would lead to reduced turbocharger power and thereby air mass flow. However, the extra-low air-excess ratio would cause high NOx emissions.

2. Mathematical Models

2.1. Theory Deduction

The heat balance equation of the main engine can be explained as follows:
m ˙ f H u = Q h + P + ( m ˙ a η v + m ˙ f ) c p e x T T m ˙ a η v c p a T scav
where Qh represents the cooling and heat dissipation of the engine (jacket water, lubricating oil, etc.), P represents the effective work of the diesel engine, Hu is low fuel heat value, ma represents the air mass flow, mf represents the fuel flow, Tscav represents the scavenging temperature, TT represents the exhaust temperature, and cpa (cpex) represents the intake- (exhaust) gas-specific heat capacity.
The air-excess ratio can be calculated as follows:
α = m ˙ a η v m ˙ f L 0
Furthermore, the cylinder heat dissipation Qh and the engine effect power P can be calculated as follows [52]:
P = m f H u η i
Q h = m f H u η h
where [52],
η i = P 5 ( α )
η h = ( a 0 α 4 + a 1 α 3 + a 2 α 2 + a 3 α 1 + a 4 ) n
where P 5 ( α ) stands for quintic polynomial and n is engine speed.
Therefore, the Equation can be shown as follows:
( 1 η h η i ) m ˙ f H u = ( m ˙ a η v + m ˙ f ) c p e x T T m ˙ a η v c p a T s c a v
The engine exhaust temperature can be calculated as follows:
T T = 14.3 α c p a T s c a v + ( 1 η h η i ) H u ( 1 + L 0 α ) c p e x
where L0 represents the air fuel ratio of the fuel, which is usually taken as 14.3 for diesel. Further, the mass conservation process of the engine can be shown as follows:
m ˙ c 0 + m ˙ f 0 = m ˙ t 0
The mass conservation process of the engine equipped with an exhaust bypass valve can be shown as follows:
m ˙ c + m ˙ f = m ˙ t + m ˙ b
The energy conservation process of turbocharger can be shown as follows:
c p a Δ T c m ˙ c = c p e x Δ T t m ˙ t
The entropic efficiency of compressors and turbines is defined as follows:
η c = T 0 Δ T c ( π c k a 1 k a 1 )
η t = Δ T t T T ( 1 π c 1 k e x k e x )
Then:
c p a T 0 ( π c k a 1 k a 1 ) m ˙ c η c = c p e x T T ( 1 π c 1 k e x k e x ) m ˙ t η t
Specifically, the parameter K can be defined as follows:
K = c p a T 0 ( π c k a 1 k a 1 ) c p e x T T ( 1 π t 1 k e x k e x )
The turbocharging efficiency can be calculated as follows:
η T C = η t η c
The exhaust bypass ratio can be defined as follows:
γ b = m ˙ b m ˙ t + m ˙ b
The theory formula can be deduced by combining the following equations:
γ b = 1 α α + η v L 0 K η T C

2.2. The Deduction of the Semi-Empirical Formula

To simplify the calculating process, the parameter C is defined as follows:
C = α α + η v L 0
where,
0.05 < η v L 0 < 0.07
for a 6S50ME-C8.2 diesel engine.
The relationship of the air-excess ratio and C is shown in Figure 2. As can be seen, the extra small change of parameter C can be achieved as the air-excess ratio goes from 2.0 to 4.0. Therefore, C can be set by 0.977, in which the root mean square error is in (0.42%, 0.49%) and the maximum error is 0.95%.
The equation can be simplified as follows:
γ b = 1 C K η T C
The equation demonstrates that the bypass ratio is related to the turbocharging efficiency and parameter K. Then, the value of K depends on the compressing pressure ratio πc of the compressor, the turbine inlet temperature T3 (as well as the cylinder exhaust temperature TT), and the turbine pressure ratio πt. To reduce the number of variables in the equation, the empirical formulas of the above parameters and the air-excess ratio are developed further, which can be combined with the theory formula, to develop a semi-empirical formula.
The relationship between the compressor pressure ratio πc and the diesel-engine intake flow rate mc is shown as follows [53]:
π C = 120 m ˙ c R g T s p 1 n e V e η e + η r ν c m ˙ c 2 p 1
where Rg is the gas constant, P1 is the ambient pressure, ne is the diesel engine speed, Ve is the cylinder volume, ƞe is the inflation coefficient of the diesel engine, ƞr is the resistance coefficient of the intercooler, and vc is the specific volume of the gas at the outlet of the compressor. These parameters can be directly obtained by referring to the calibration conditions. However, the diesel engine intake flow rate mc and the scavenging temperature Ts require additional calculation.
The scavenging temperature Ts can be based on the compressor outlet temperature Tc:
T s = T c η s ( T c T c ω i )
where Tcωi is the cooling medium inlet temperature of the intercooler and ƞs represents the cooling efficiency, which can be directly determined. The outlet temperature Tc of the compressor can be represented by the compressor pressure ratio πc:
T c = T 1 1 + 1 η c π c k a 1 k a 1
where ƞc is the efficiency of the compressor and T1 is the ambient temperature. If the turbocharging efficiency is at a given value, including engine speed, the compressing ratio can be calculated as follows:
π C = f 1 m c
The engine thermal efficiency and compressor mass flow can be the function of the air-excess ratio, as follows:
η i = f 2 α
m c = f 3 α
where,
η i = P m f H u
m f = P η i H u = P f 2 α H u
And then,
π C = f 4 α
T T = f 5 α  
π t = p 3 p 4 = 120 m ˙ c R g T s p 4 n e V e η e Δ p s 3 p 4 = f 6 ( α )  
Additionally, the turbine mass flow can be calculated as follows:
m ˙ t = c p a T 0 ( π c k a 1 k a 1 ) m ˙ c c p e x η t c T T ( 1 π t 1 k e x k e x )
m t = c p a T 0 c p e x ( π c k a 1 k a 1 ) m ˙ c T E b T ( 1 π t 1 k e x k e x ) 1 η t c = c p a T 0 c p e x f 3 ( α ) f 4 α k a 1 k a 1 f 5 ( α ) 1 f 6 α 1 k e x k e x 1 η t c = f 7 α
For K:
K = c p a T 0 ( π c k a 1 k a 1 ) c p e x T E b T ( 1 π t 1 k e x k e x ) = c p a T 0 c p e x f 4 α k a 1 k a 1 f 5 ( α ) 1 f 6 α 1 k e x k e x = f 8 α
Therefore, the bypass ratio can be regarded as the function of the air excess ratio and turbocharging efficiency, as follows:
γ b = f ( α , η T C )
A further assumption about parameter K is proposed as follows,
K = ψ α + B
Finally, the proposed semi-empirical formula can be shown as follows:
γ b = 1 α α + η v L 0 ( K 1 ψ ( α 1 α ) ) η T C
where B and ψ represent the correction factor of K, while K1 and α1 are determined at standard conditions.
The EEXI and CII can be calculated as follows:
E E X I = j = 1 n f j i = 1 n M E P M E ( i ) C F M E ( i ) S F C M E ( i ) + ( P A E C F A E S F C A E ) + j = 1 n f j i = 1 n P T I P P T I ( i ) i = 1 n e f f f e f f ( i ) P A E e f f ( i ) C F A E S F C A E i = 1 n e f f f e f f ( i ) P e f f ( i ) C F M E S F C M E f i f c f l f w C a p a c i t y V r e f
C I I = i j F C i j × C F j D W T × i D i

3. Modeling, Experiment, and Validation

3.1. Modeling and Validation of Engine

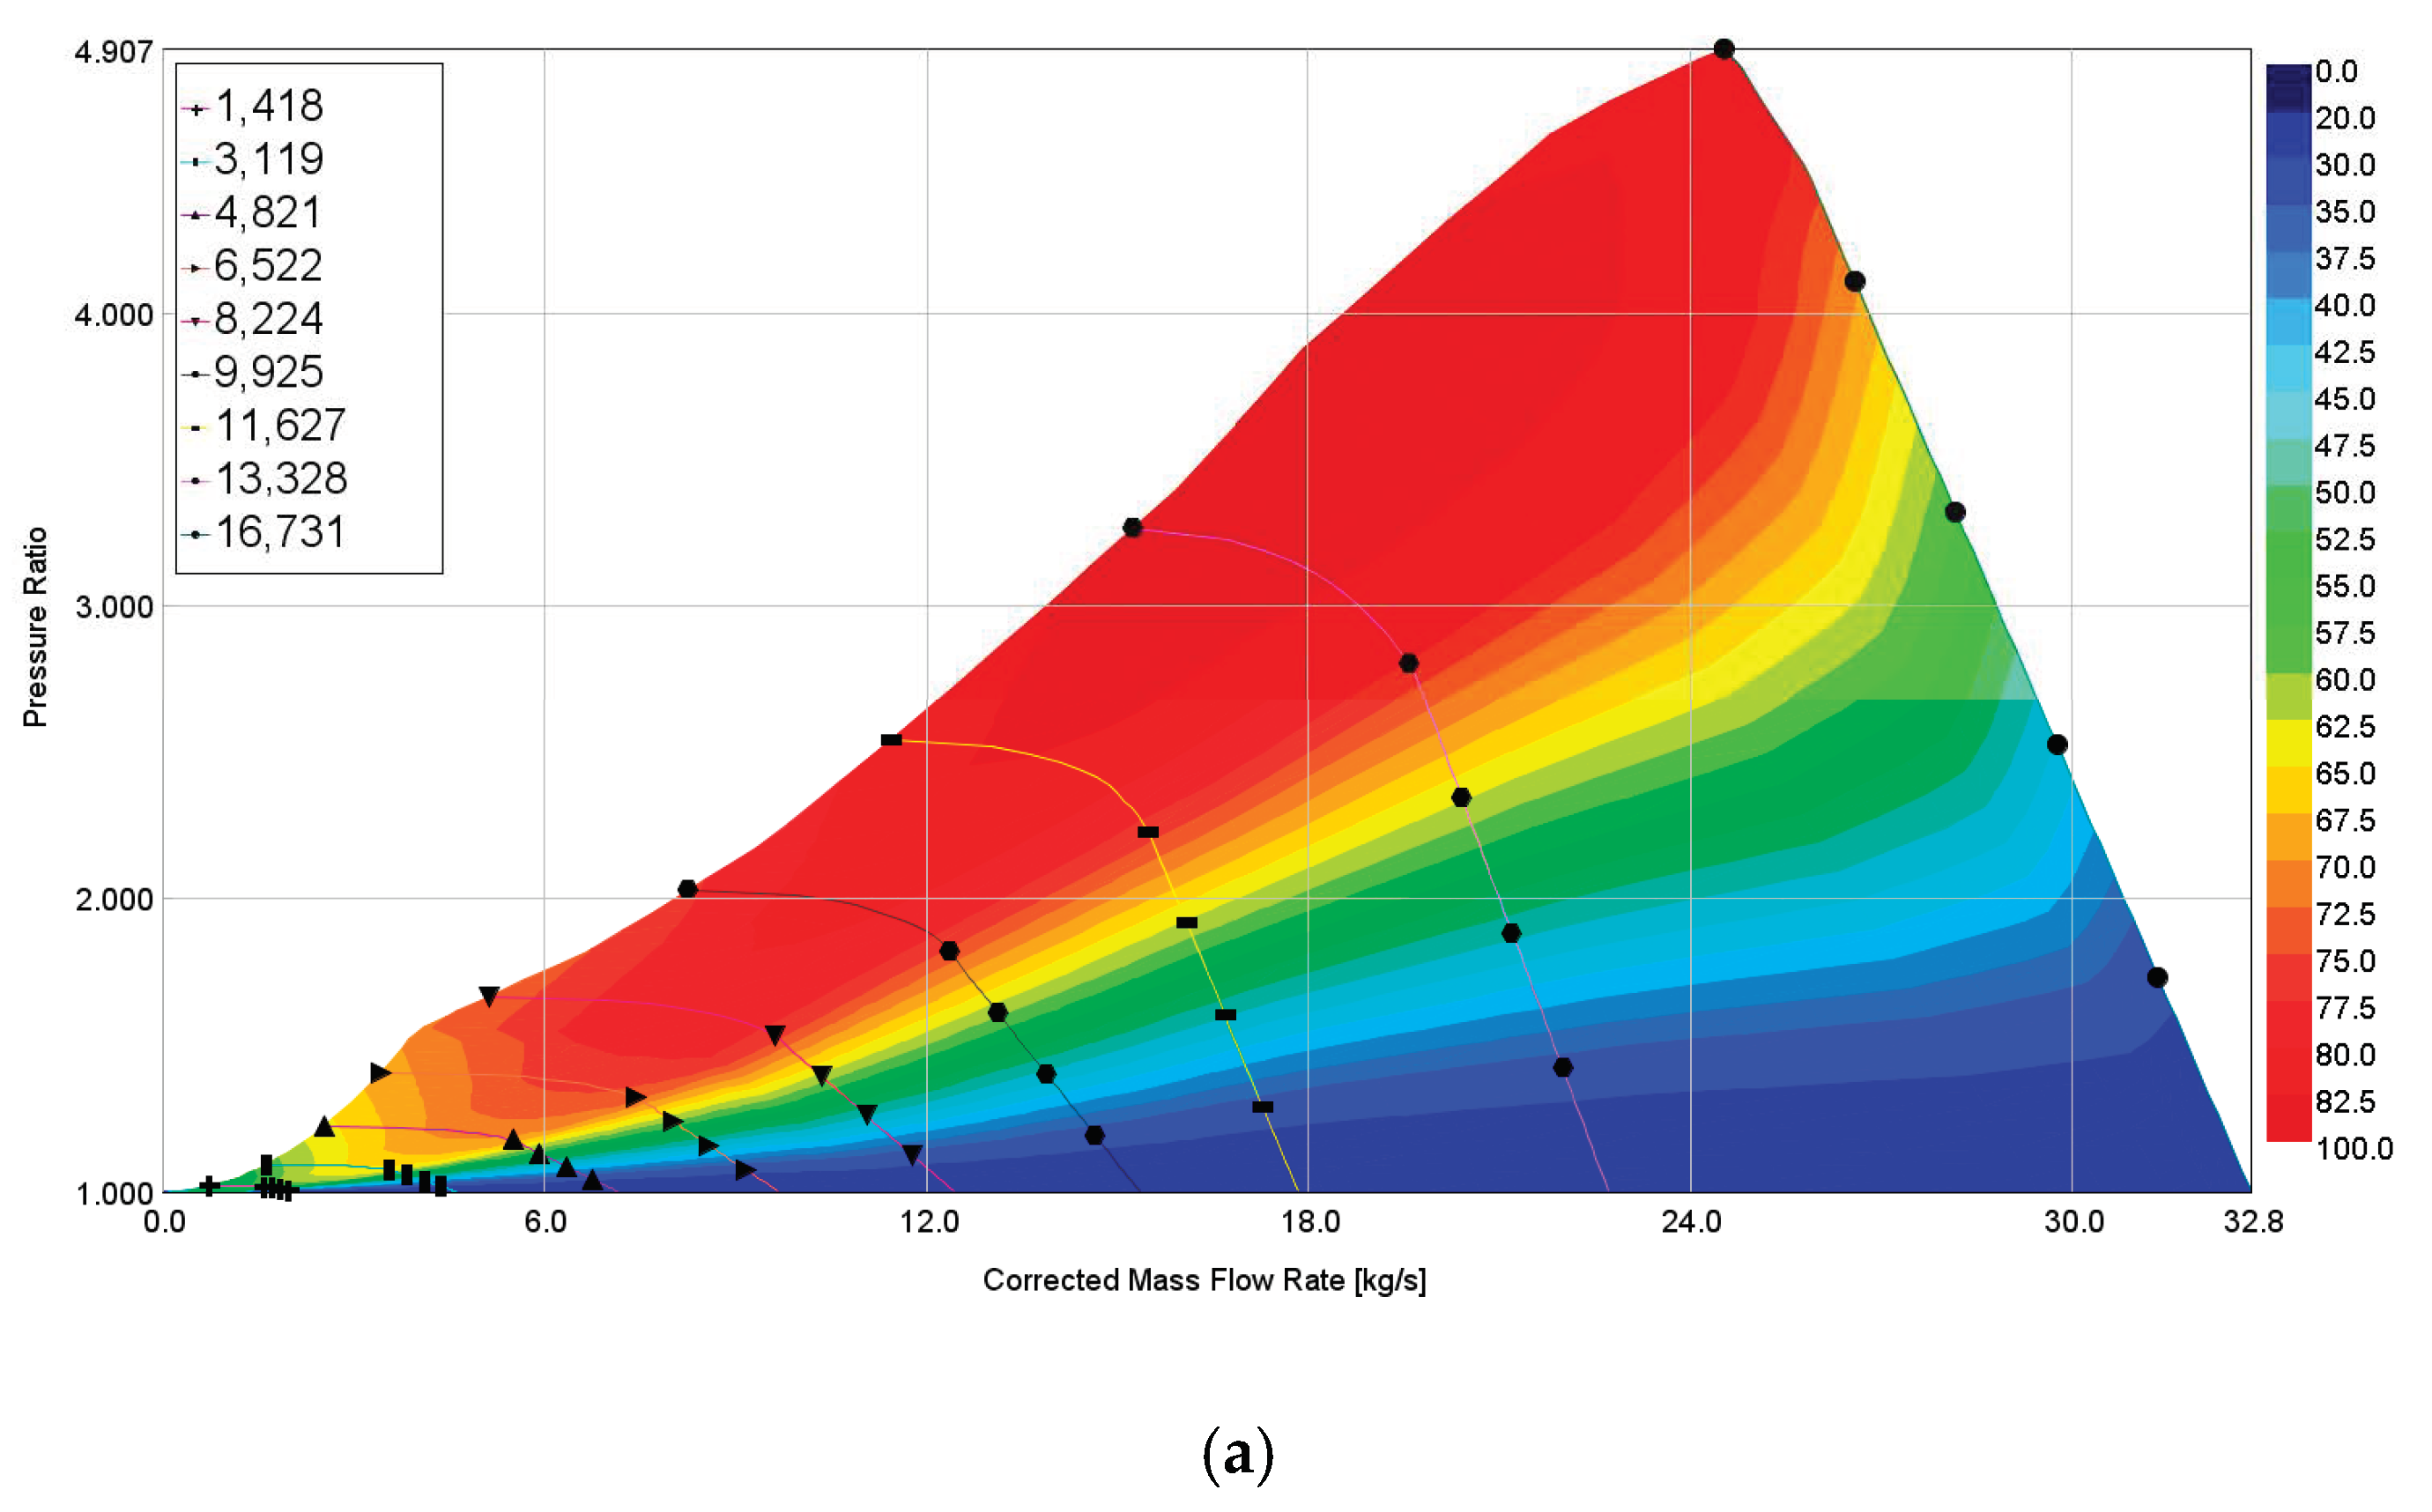
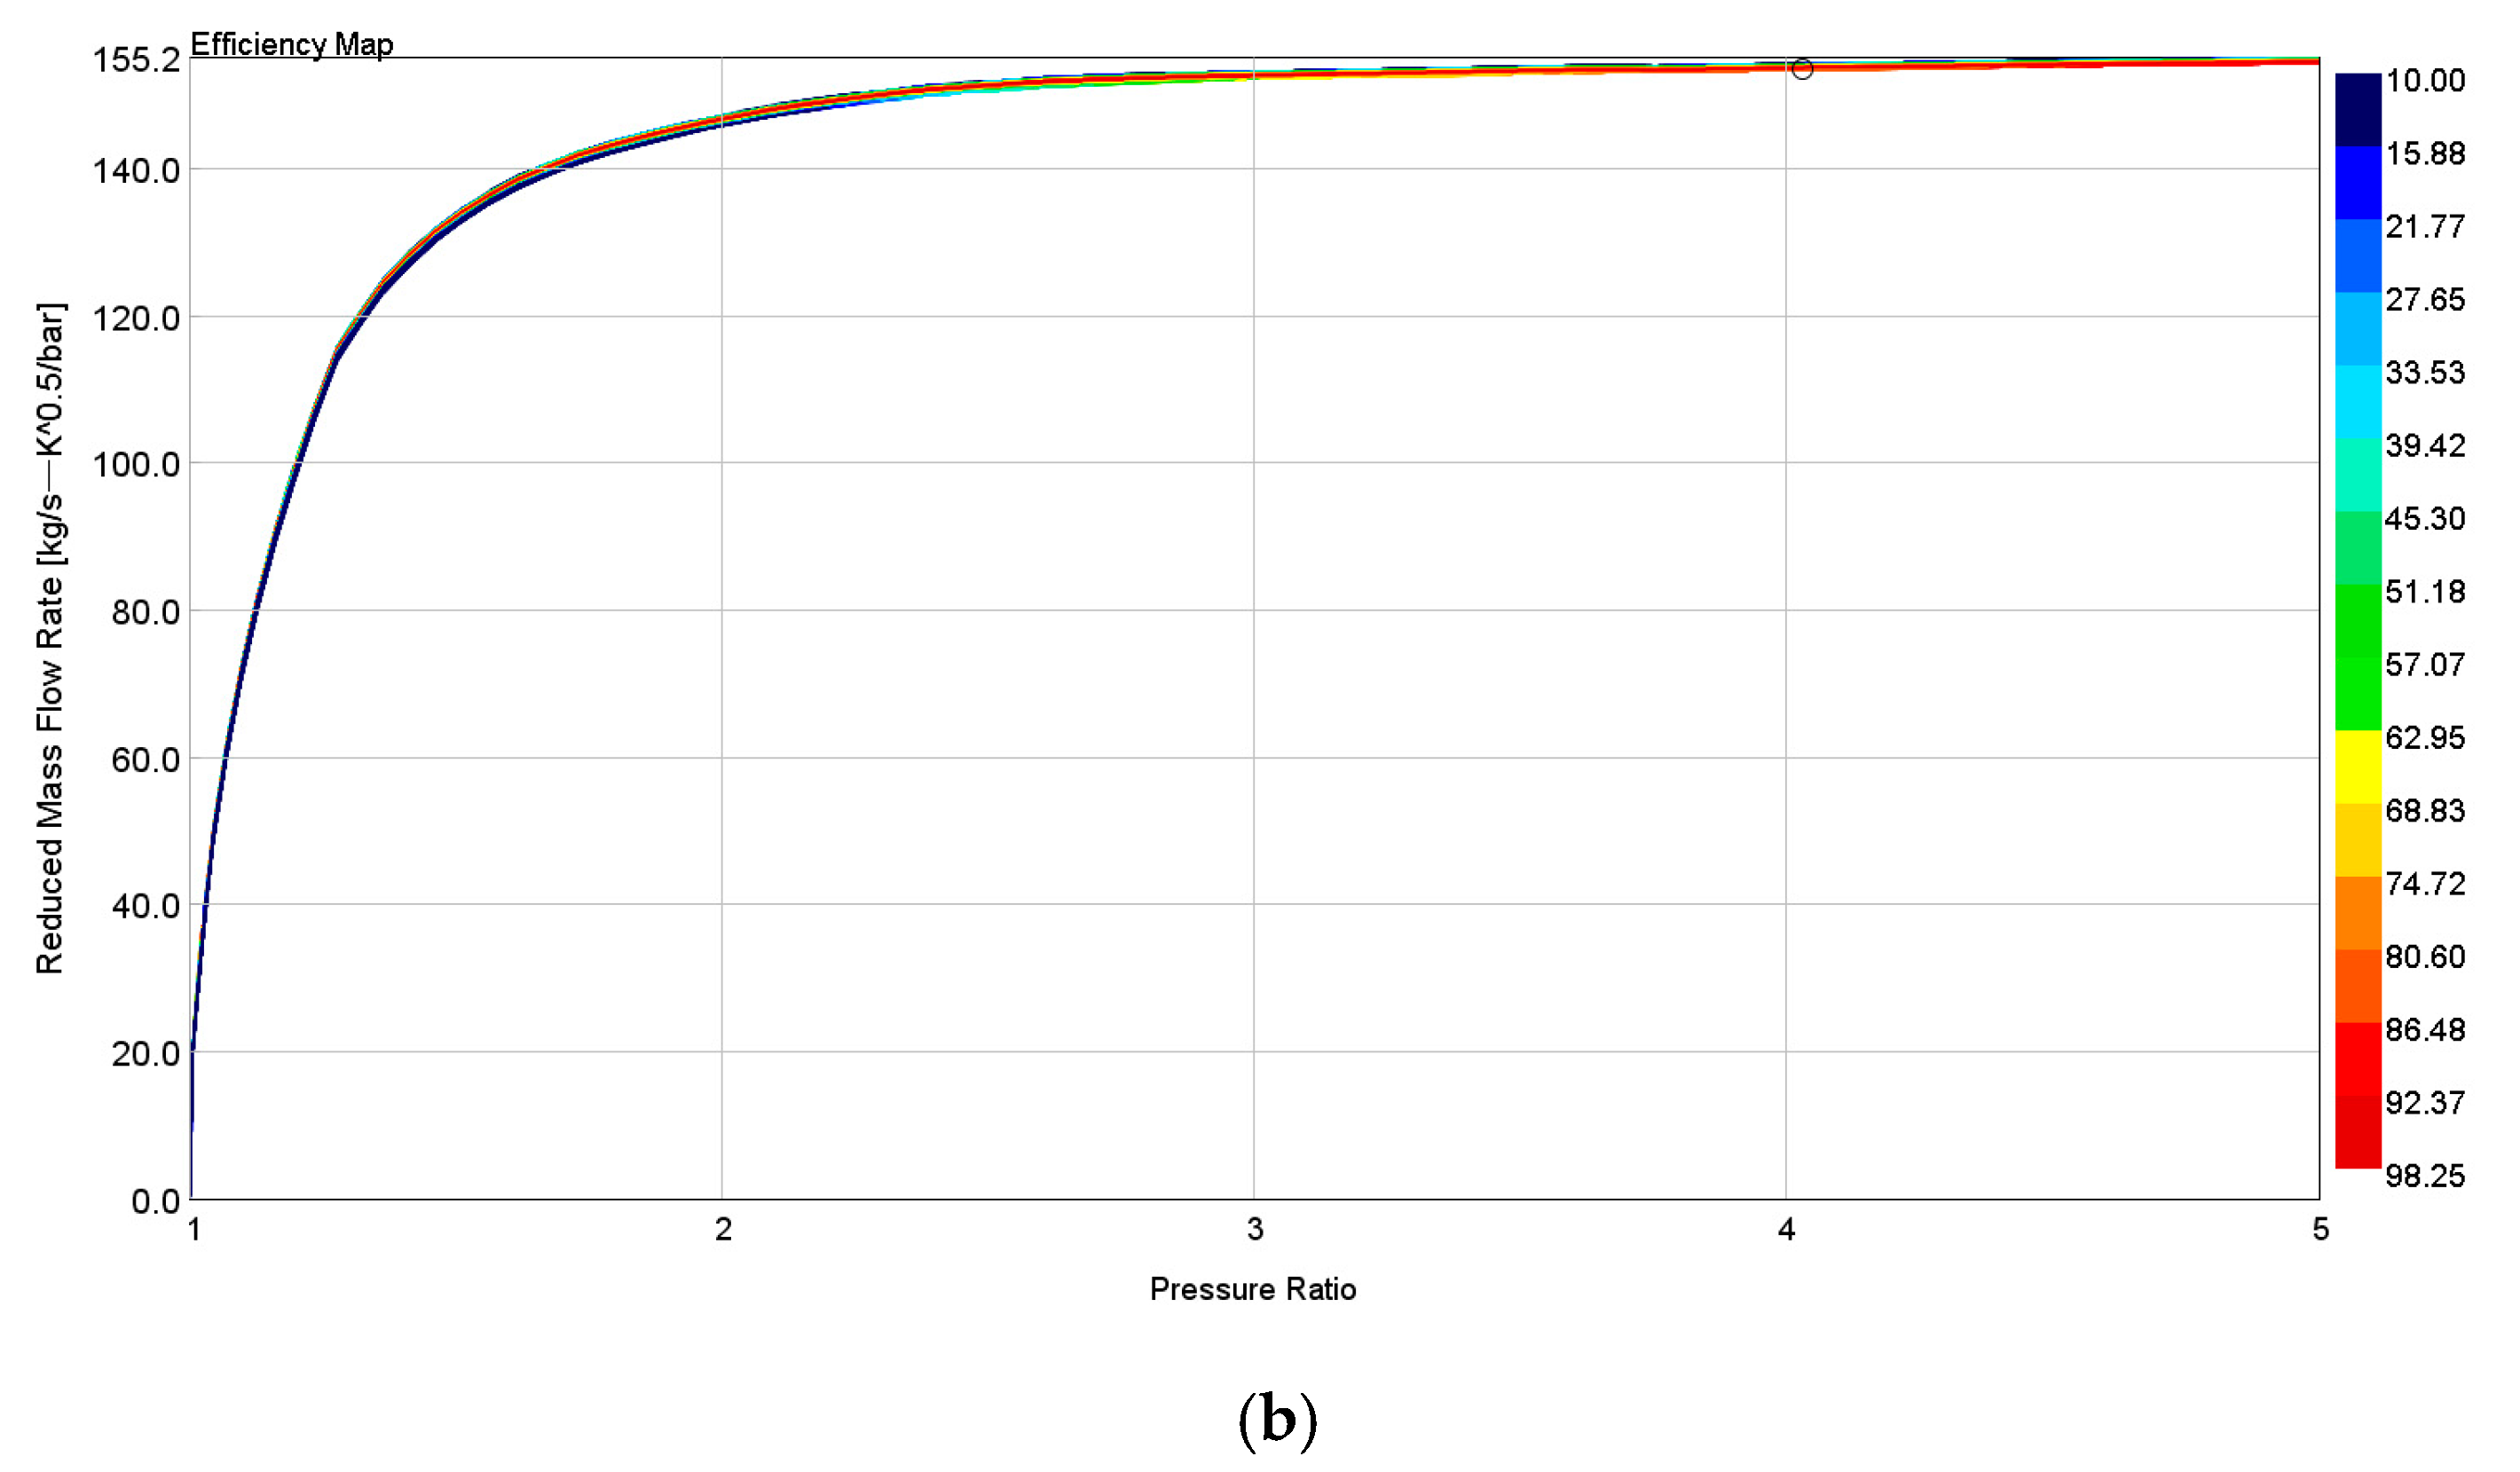
A model standing for the operating processes of a 6S50ME-C8.2 marine two-stroke low-speed diesel engine has been developed, with the parameters shown in Table 1. The chief parameters of the main engine, principally including the 0-D in-cylinder thermodynamic process models and the 1-D system-level model, are depicted. The TCA-66 turbocharger is matched on the diesel engine, and the MAP provided by the manufacturer is shown in Figure 3.
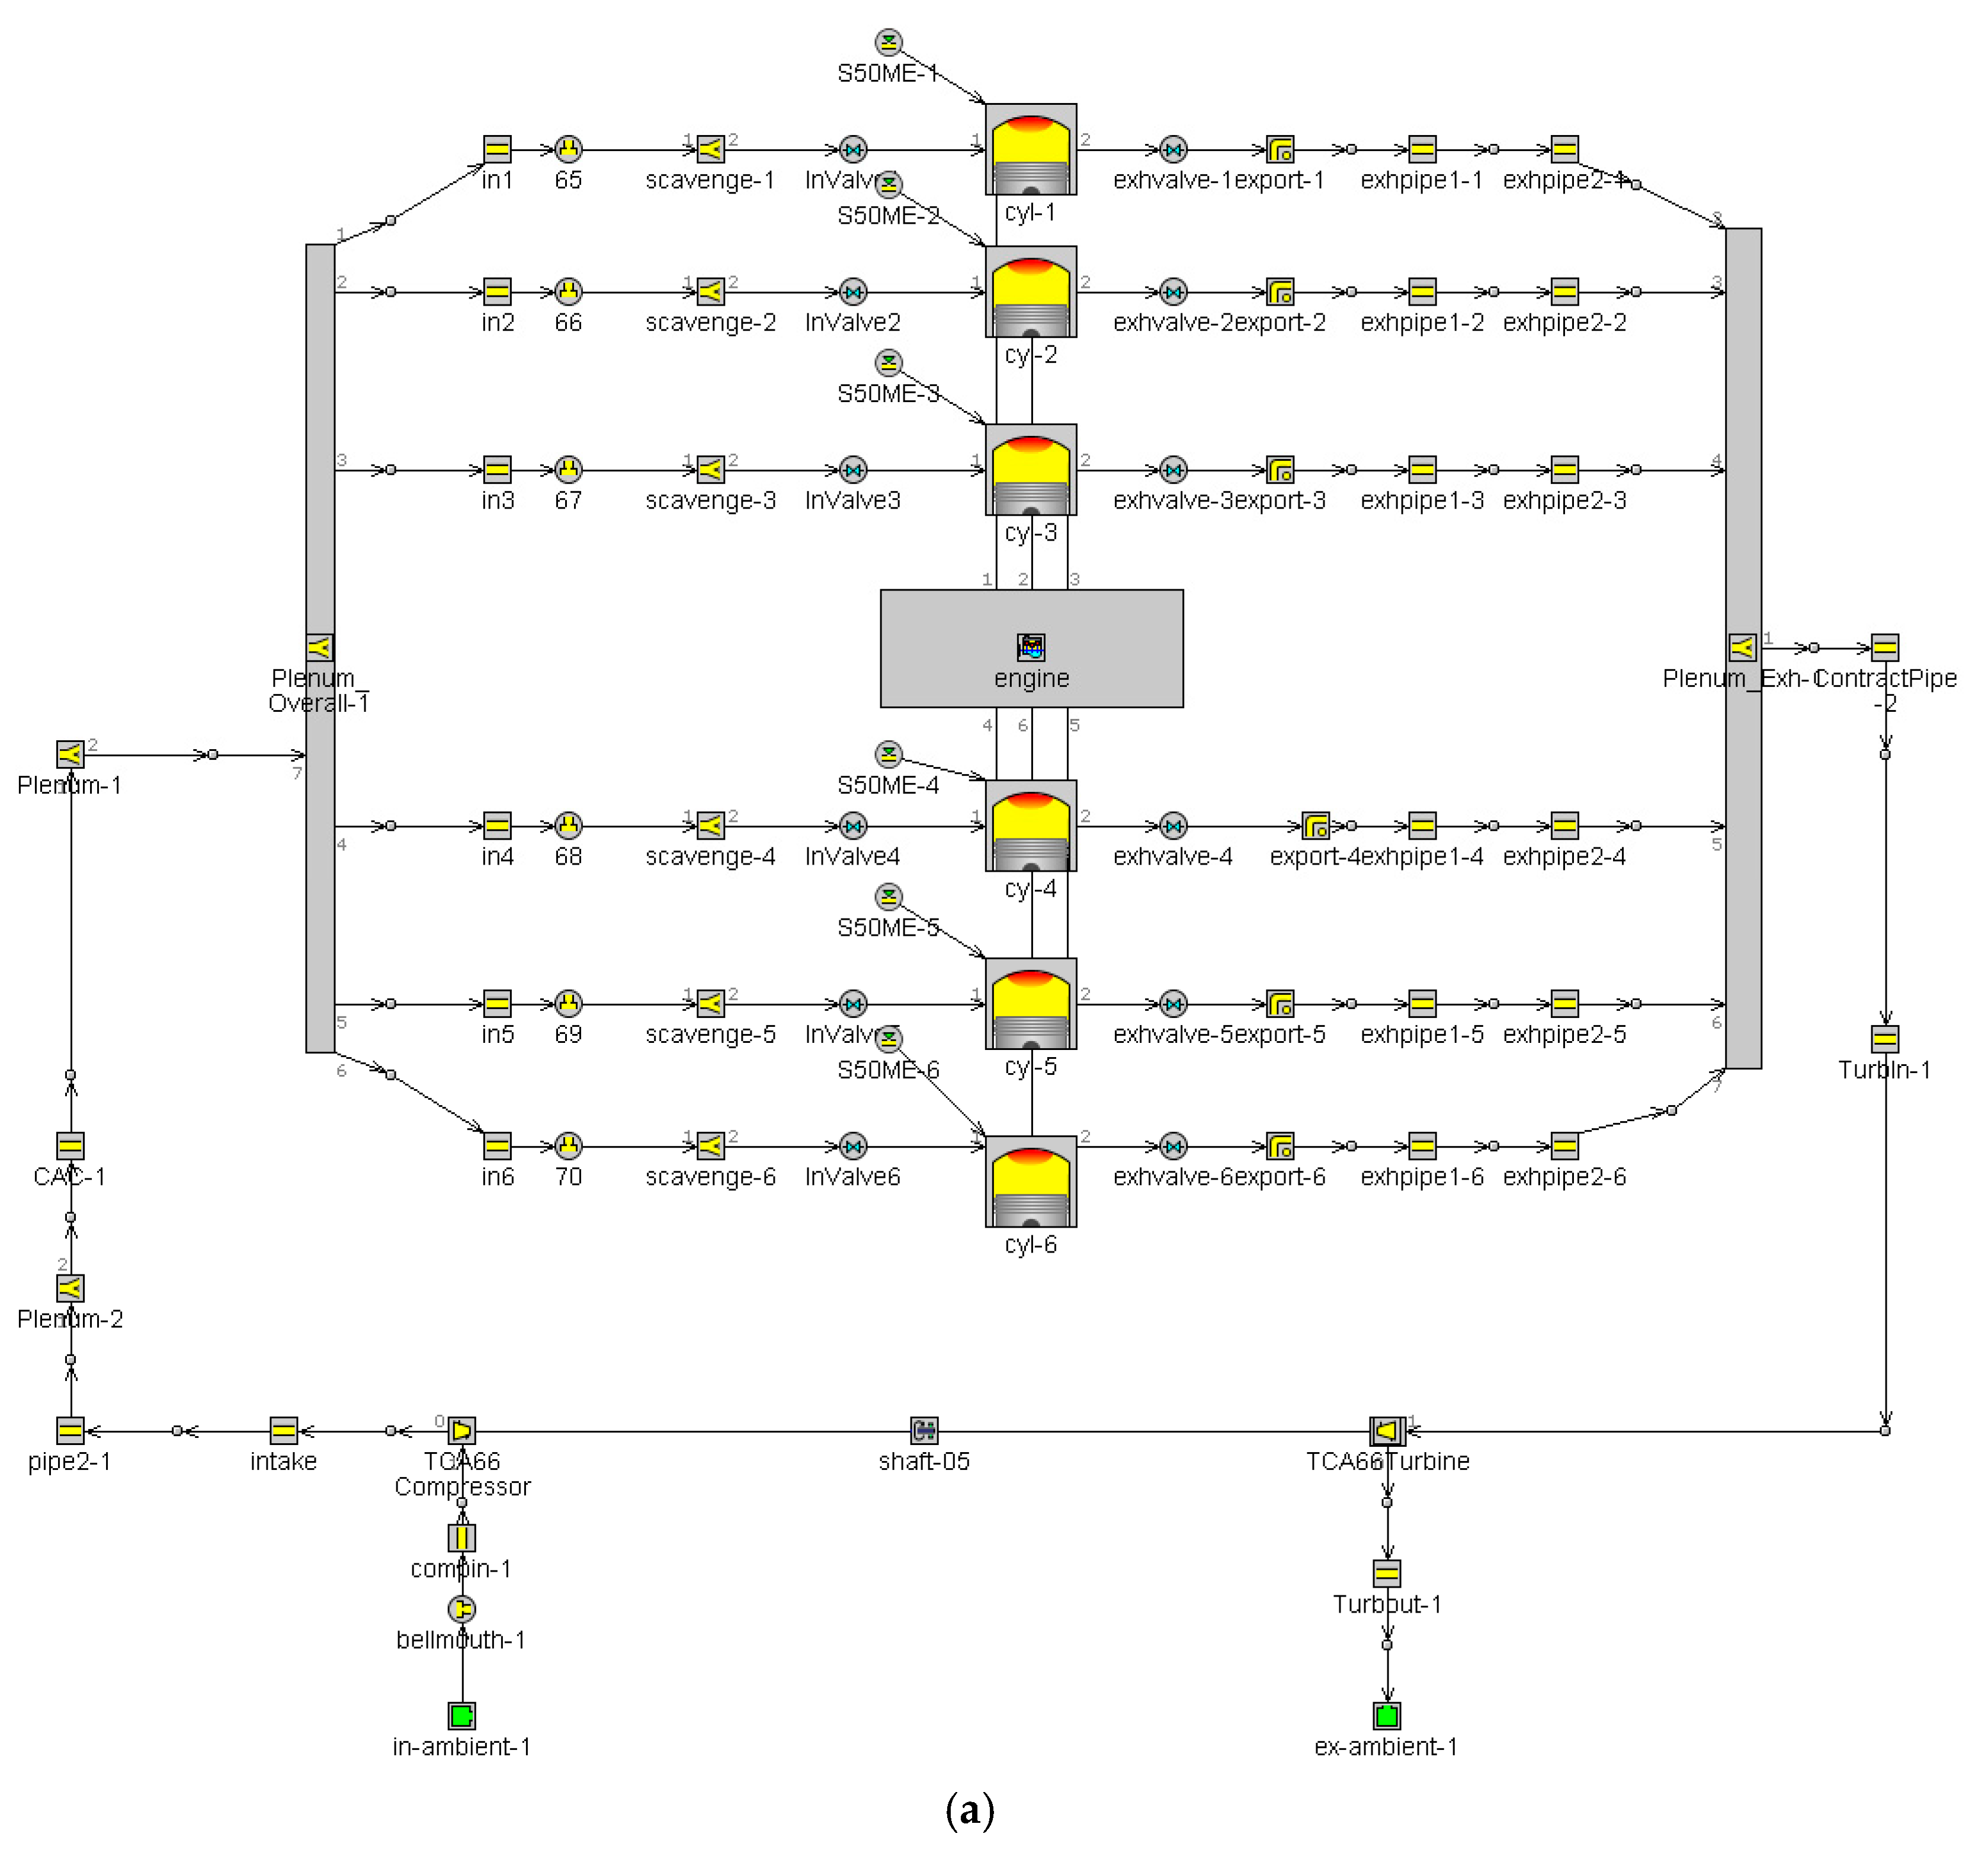
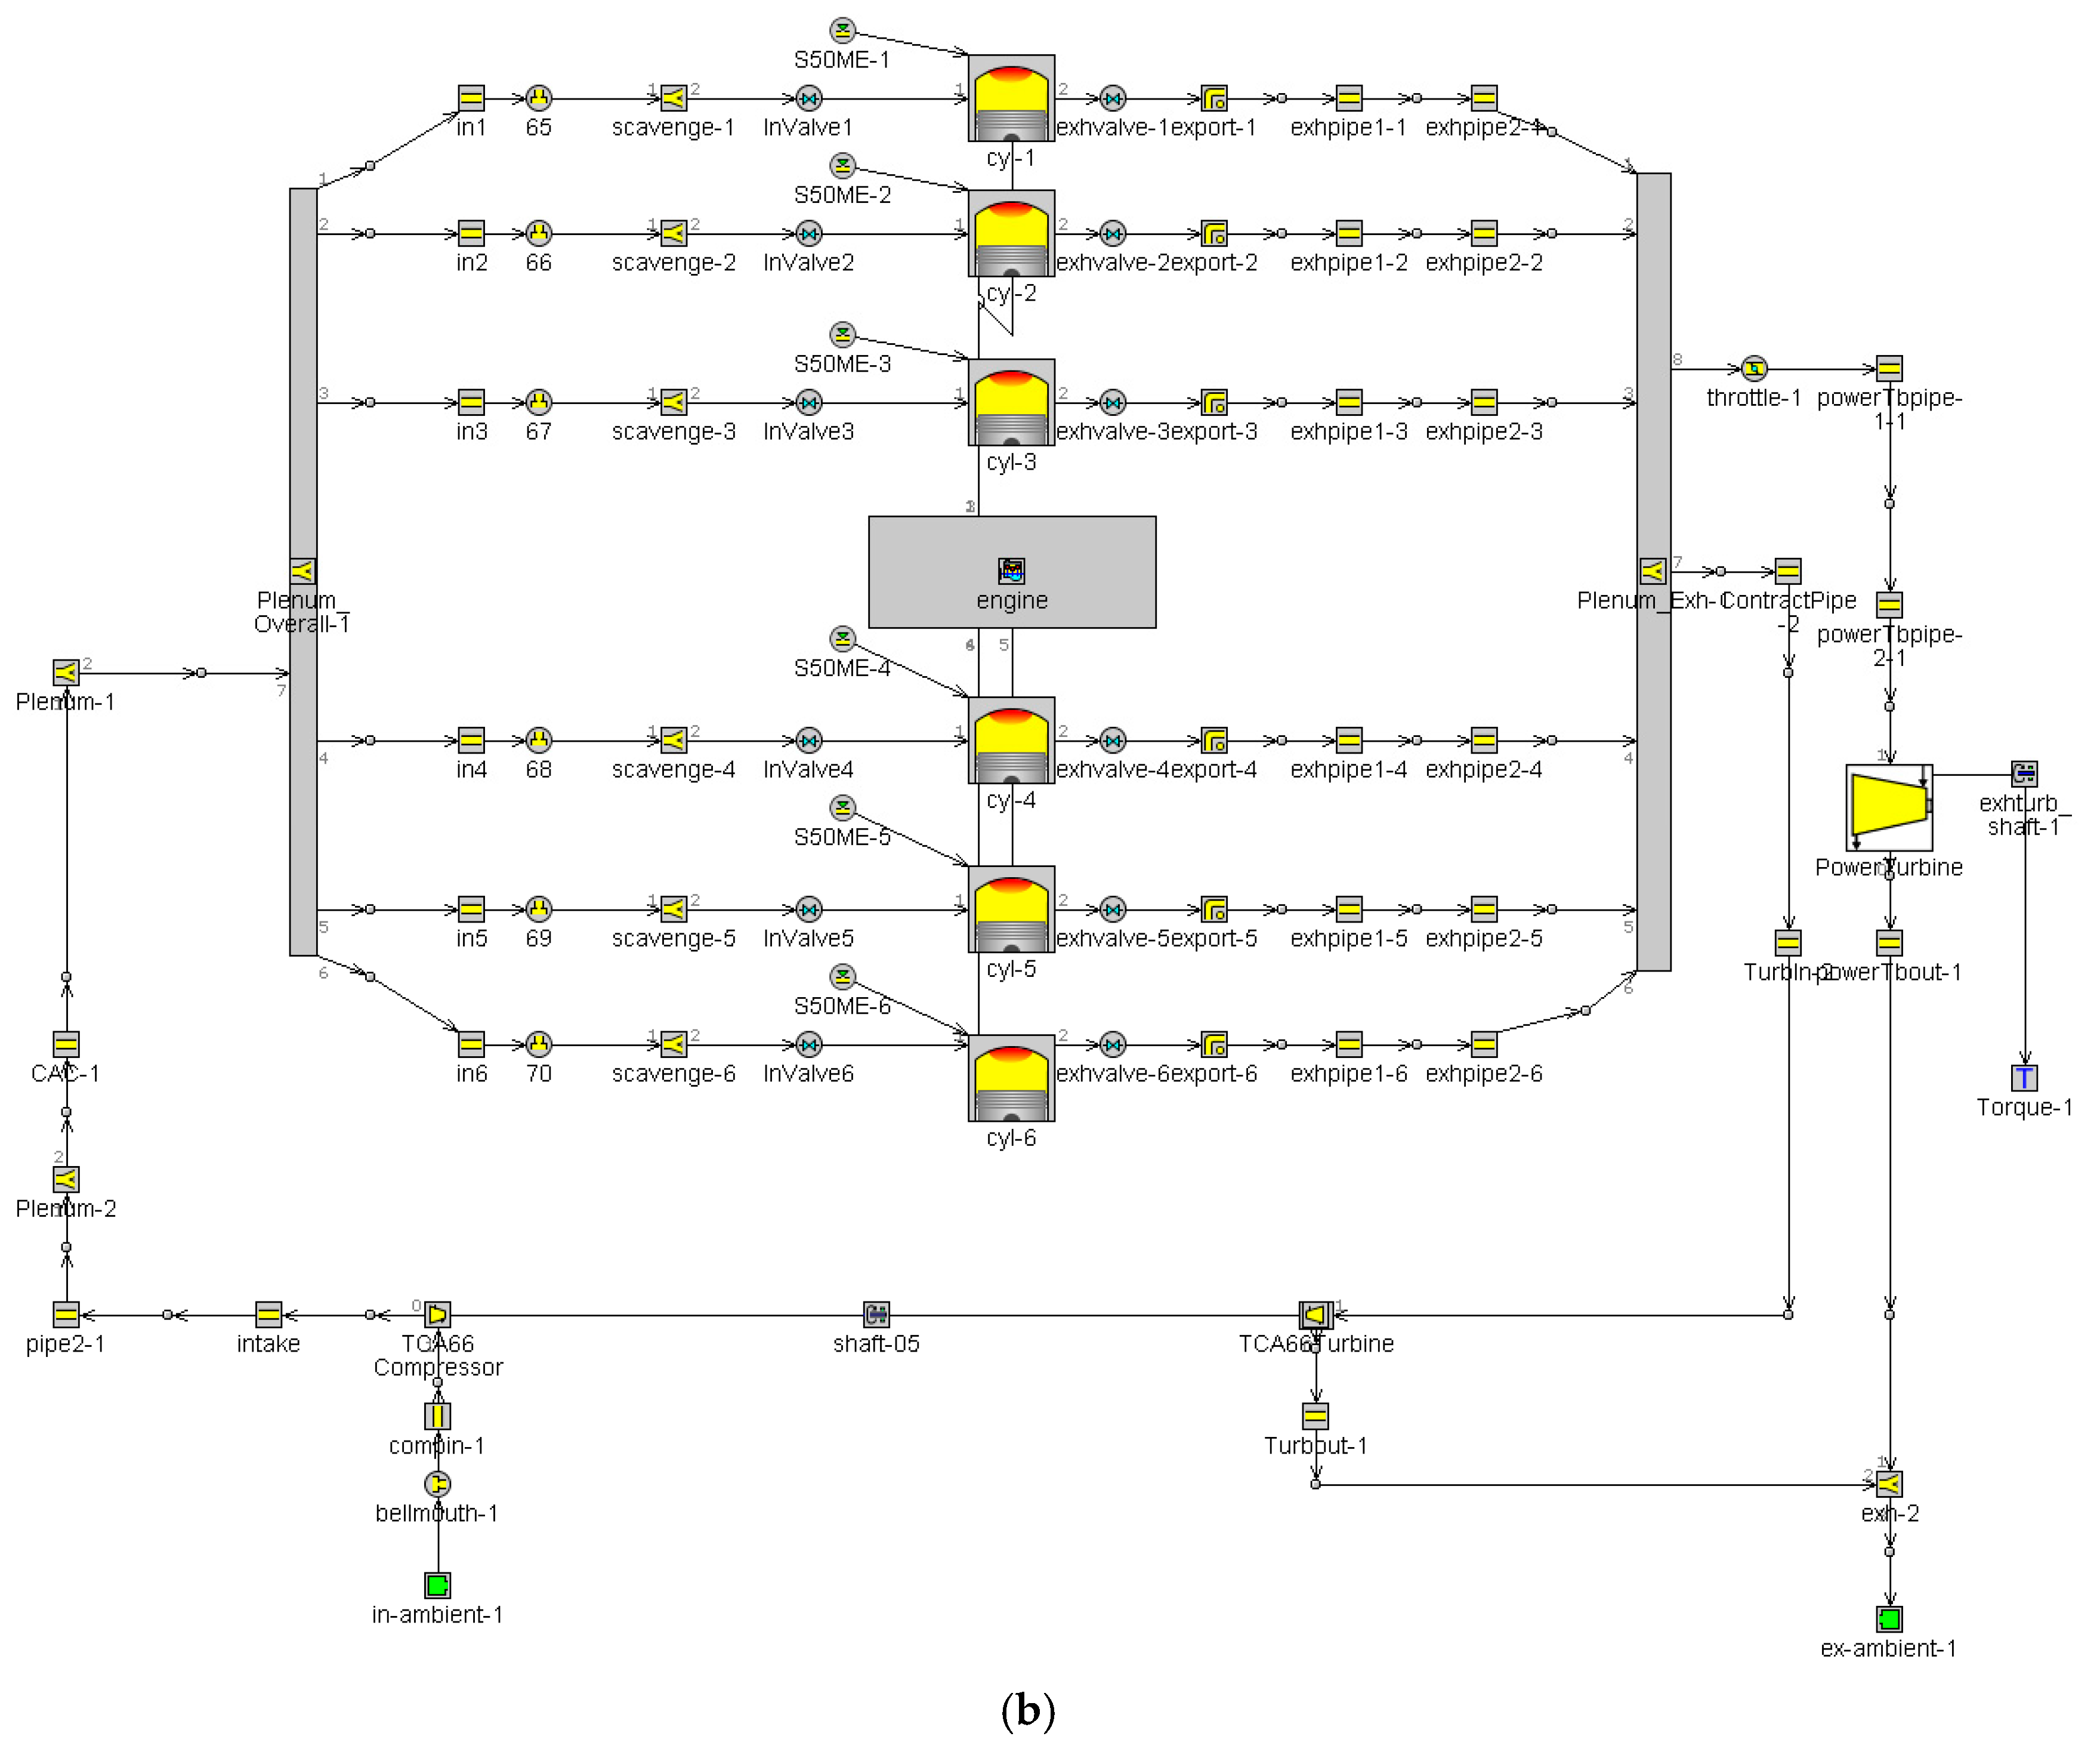
GT-Suite software was used to model the 6S50ME-C8.2 diesel engine, as shown in Figure 4a. The main body of the model consists of the intake and the exhaust systems, the inter-cooling turbocharger, and the cylinder and power turbine modules. Specifically, the Wiebe and the Woshni functions were applied. Further, the 6S50ME-C8.2 tuning diesel-engine model with a bypass valve and a PT system was also established, as shown in Figure 4b.
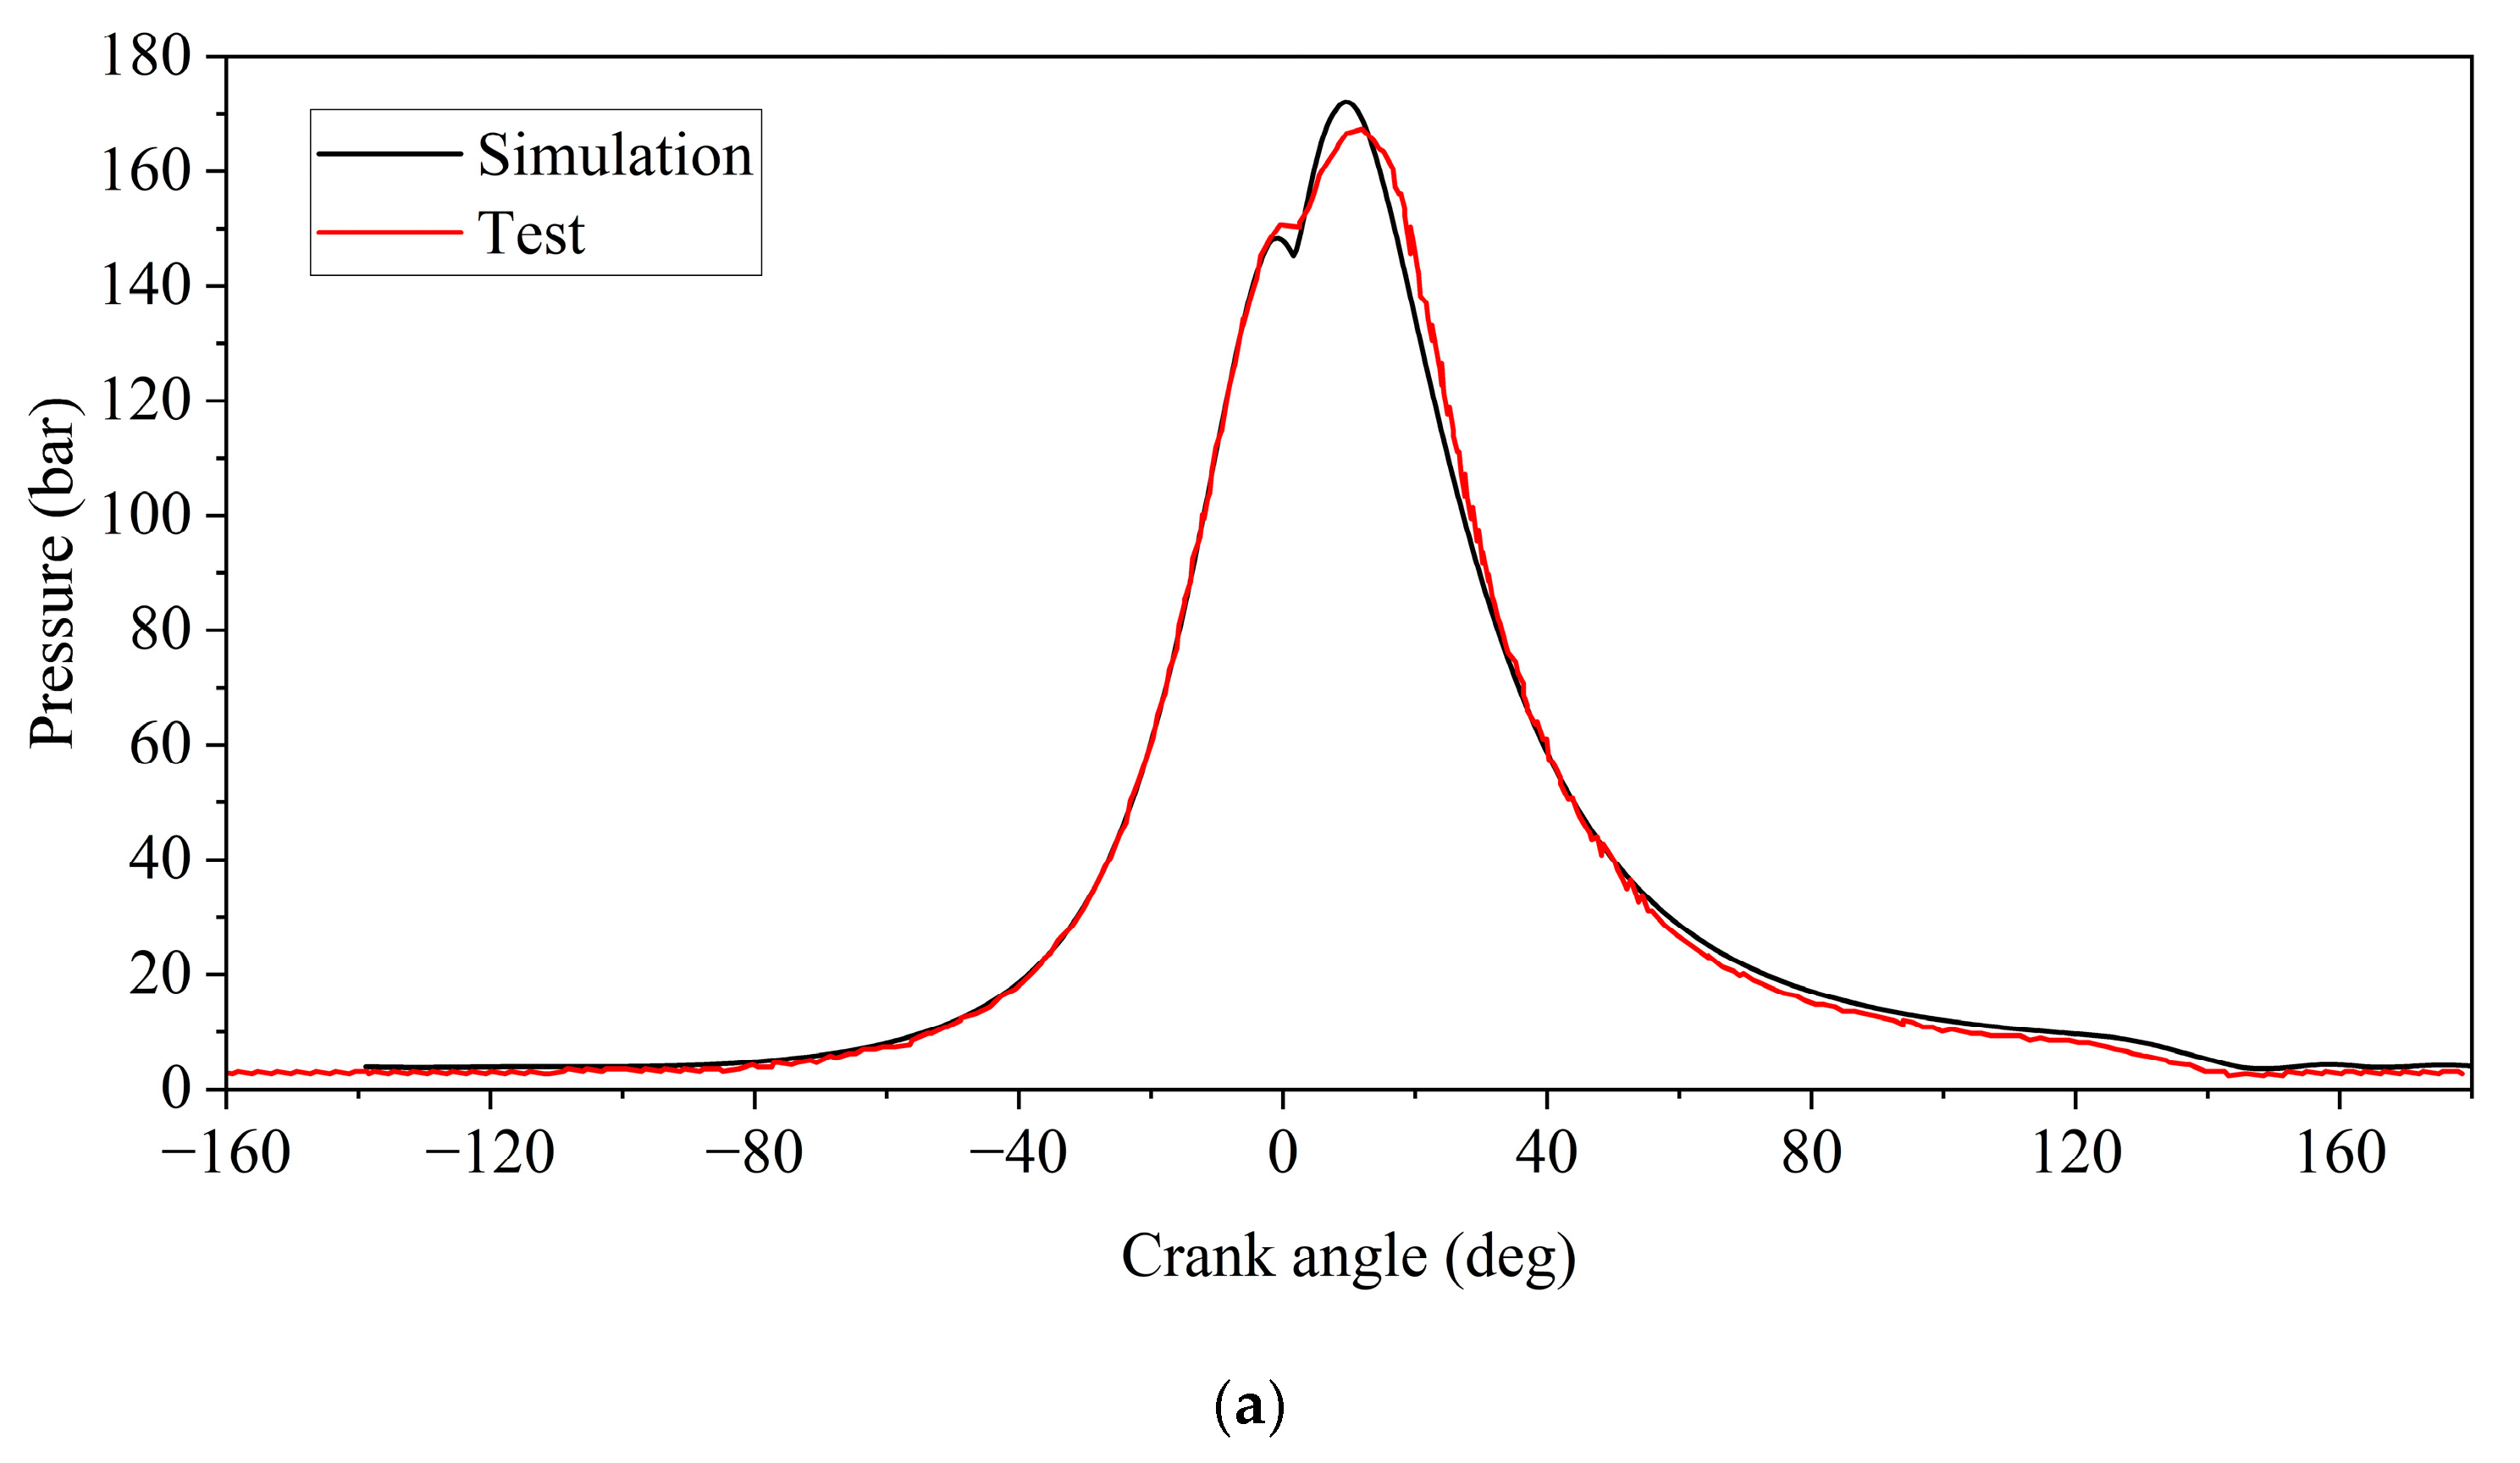
The cylinder pressures of the simulation and the test were compared, as shown in Figure 5. The peak pressures of the model and the test are 172.1 bar and 167.5 bar, respectively, in which the relative error is 2.6%, satisfying the accuracy requirement.
Further verifications were carried out, as shown in Table 2, in which the power, brake-specific fuel consumption (BSFC), exhaust-gas mass flow, and other parameters are compared between the test and simulation. As Figure 5 demonstrates, the changing tendencies of the testing and modeling pressure curves are identical, although there are several relatively large errors between them. In practice, the errors consist of a series of inevitable testing errors caused by sensor accuracy and test conditions, including calculating errors in the processes of solution of PDEs, iterations, fitting and so on. Therefore, reasonable errors can be permitted. The results revealed that maximum relative errors are within 5%, indicating that the simulation model has a high reliability.

3.2. Experiment Setup

Relative tests were conducted to verify the semi-empirical formula. Specifically, the orifice plate was used to replace the bypass valve to derive a different bypass mass flow. More experimental information can be obtained in our previous studies [40]. Two test schemes were proposed at an 85% load of the engine, for which the results are shown as follows:
(a)
The scheme at the orifice diameter of 73 mm: the scavenging pressure was 3.44 bar, which is lower than the design value of 3.7 bar. The exhaust temperature and bypass ratio met the design requirements, but the total exhaust gas flow was about 10% lower than the design value.
(b)
The scheme at the orifice diameter of 60 mm: the scavenging pressure increases to 3.67 bar, the total exhaust gas mass flow rate is slightly lower than the design value, and the exhaust temperature is about 20 °C lower than the design value (444.3 °C).

4. Results

4.1. Verification of the Formulas

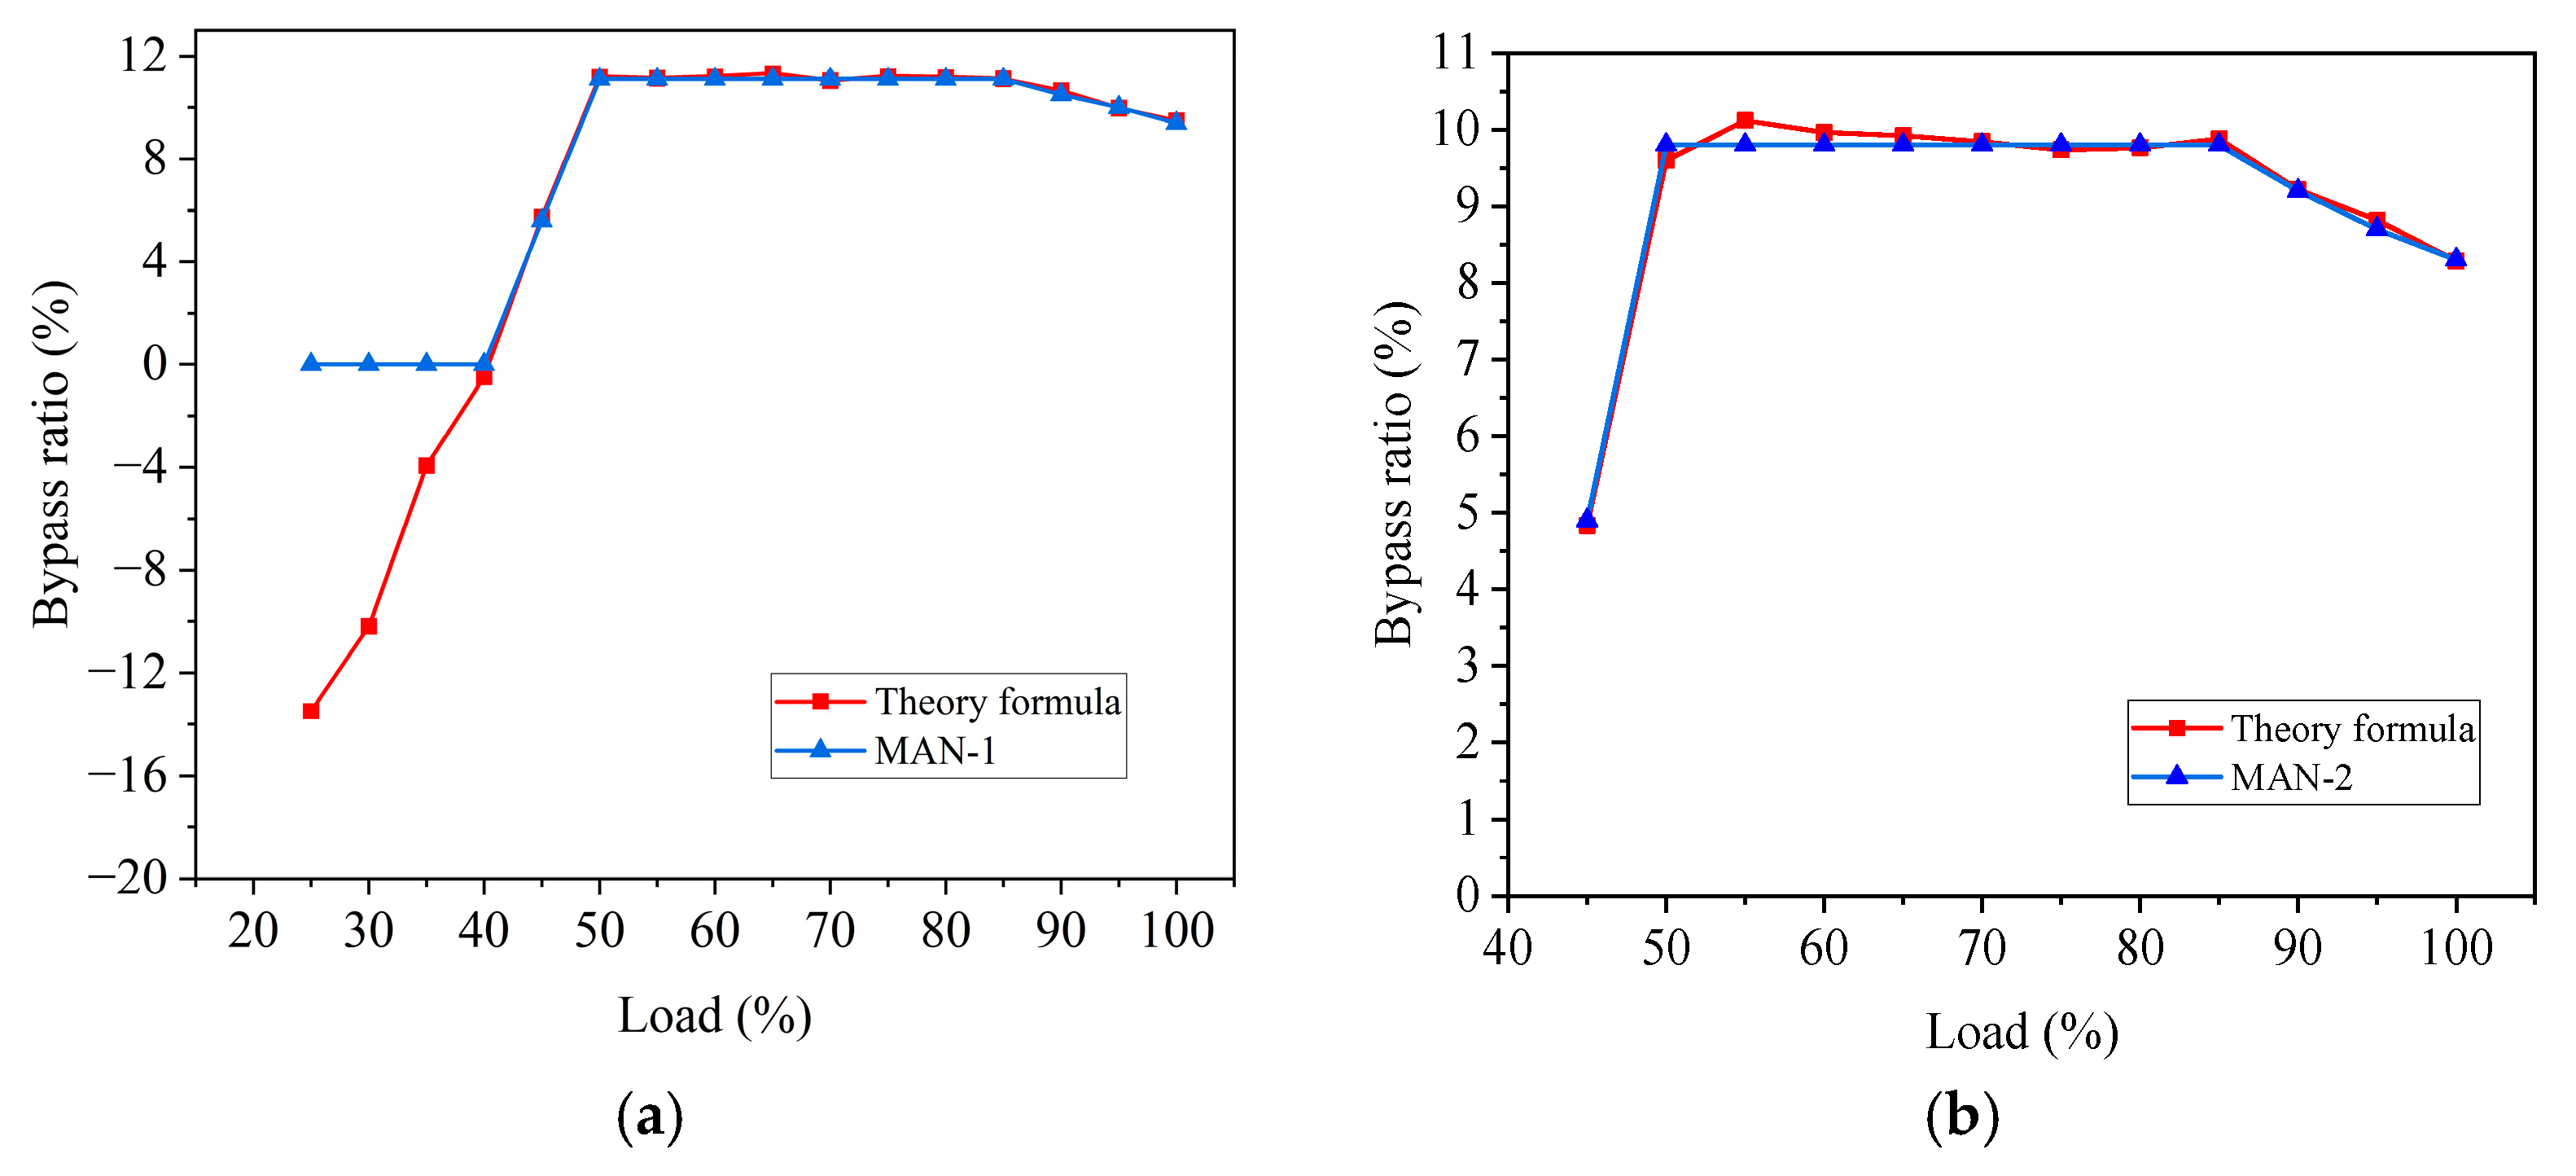
The comprehensive verifications of the theory and semi-empirical formulas are conducted in this subsection. First, we use data such as boost efficiency, turbo pressure ratio, compressor pressure ratio, and turbine inlet temperature to verify equation (18), as shown in Figure 6. The data provided by MAN are used, as shown in Appendix A, Table A1. At a load of over 50%, the results calculated by the equation (18) and provided by MAN are almost the same, while under a load of 50%, the calculated results are negative values, meaning that the exhaust gas cannot be bypassed at the low load. Comparing with the waste gas bypass ratio provided by MAN, the maximum error does not exceed 0.6%. Therefore, it can be agreed that the theory deduction has a high reliability.
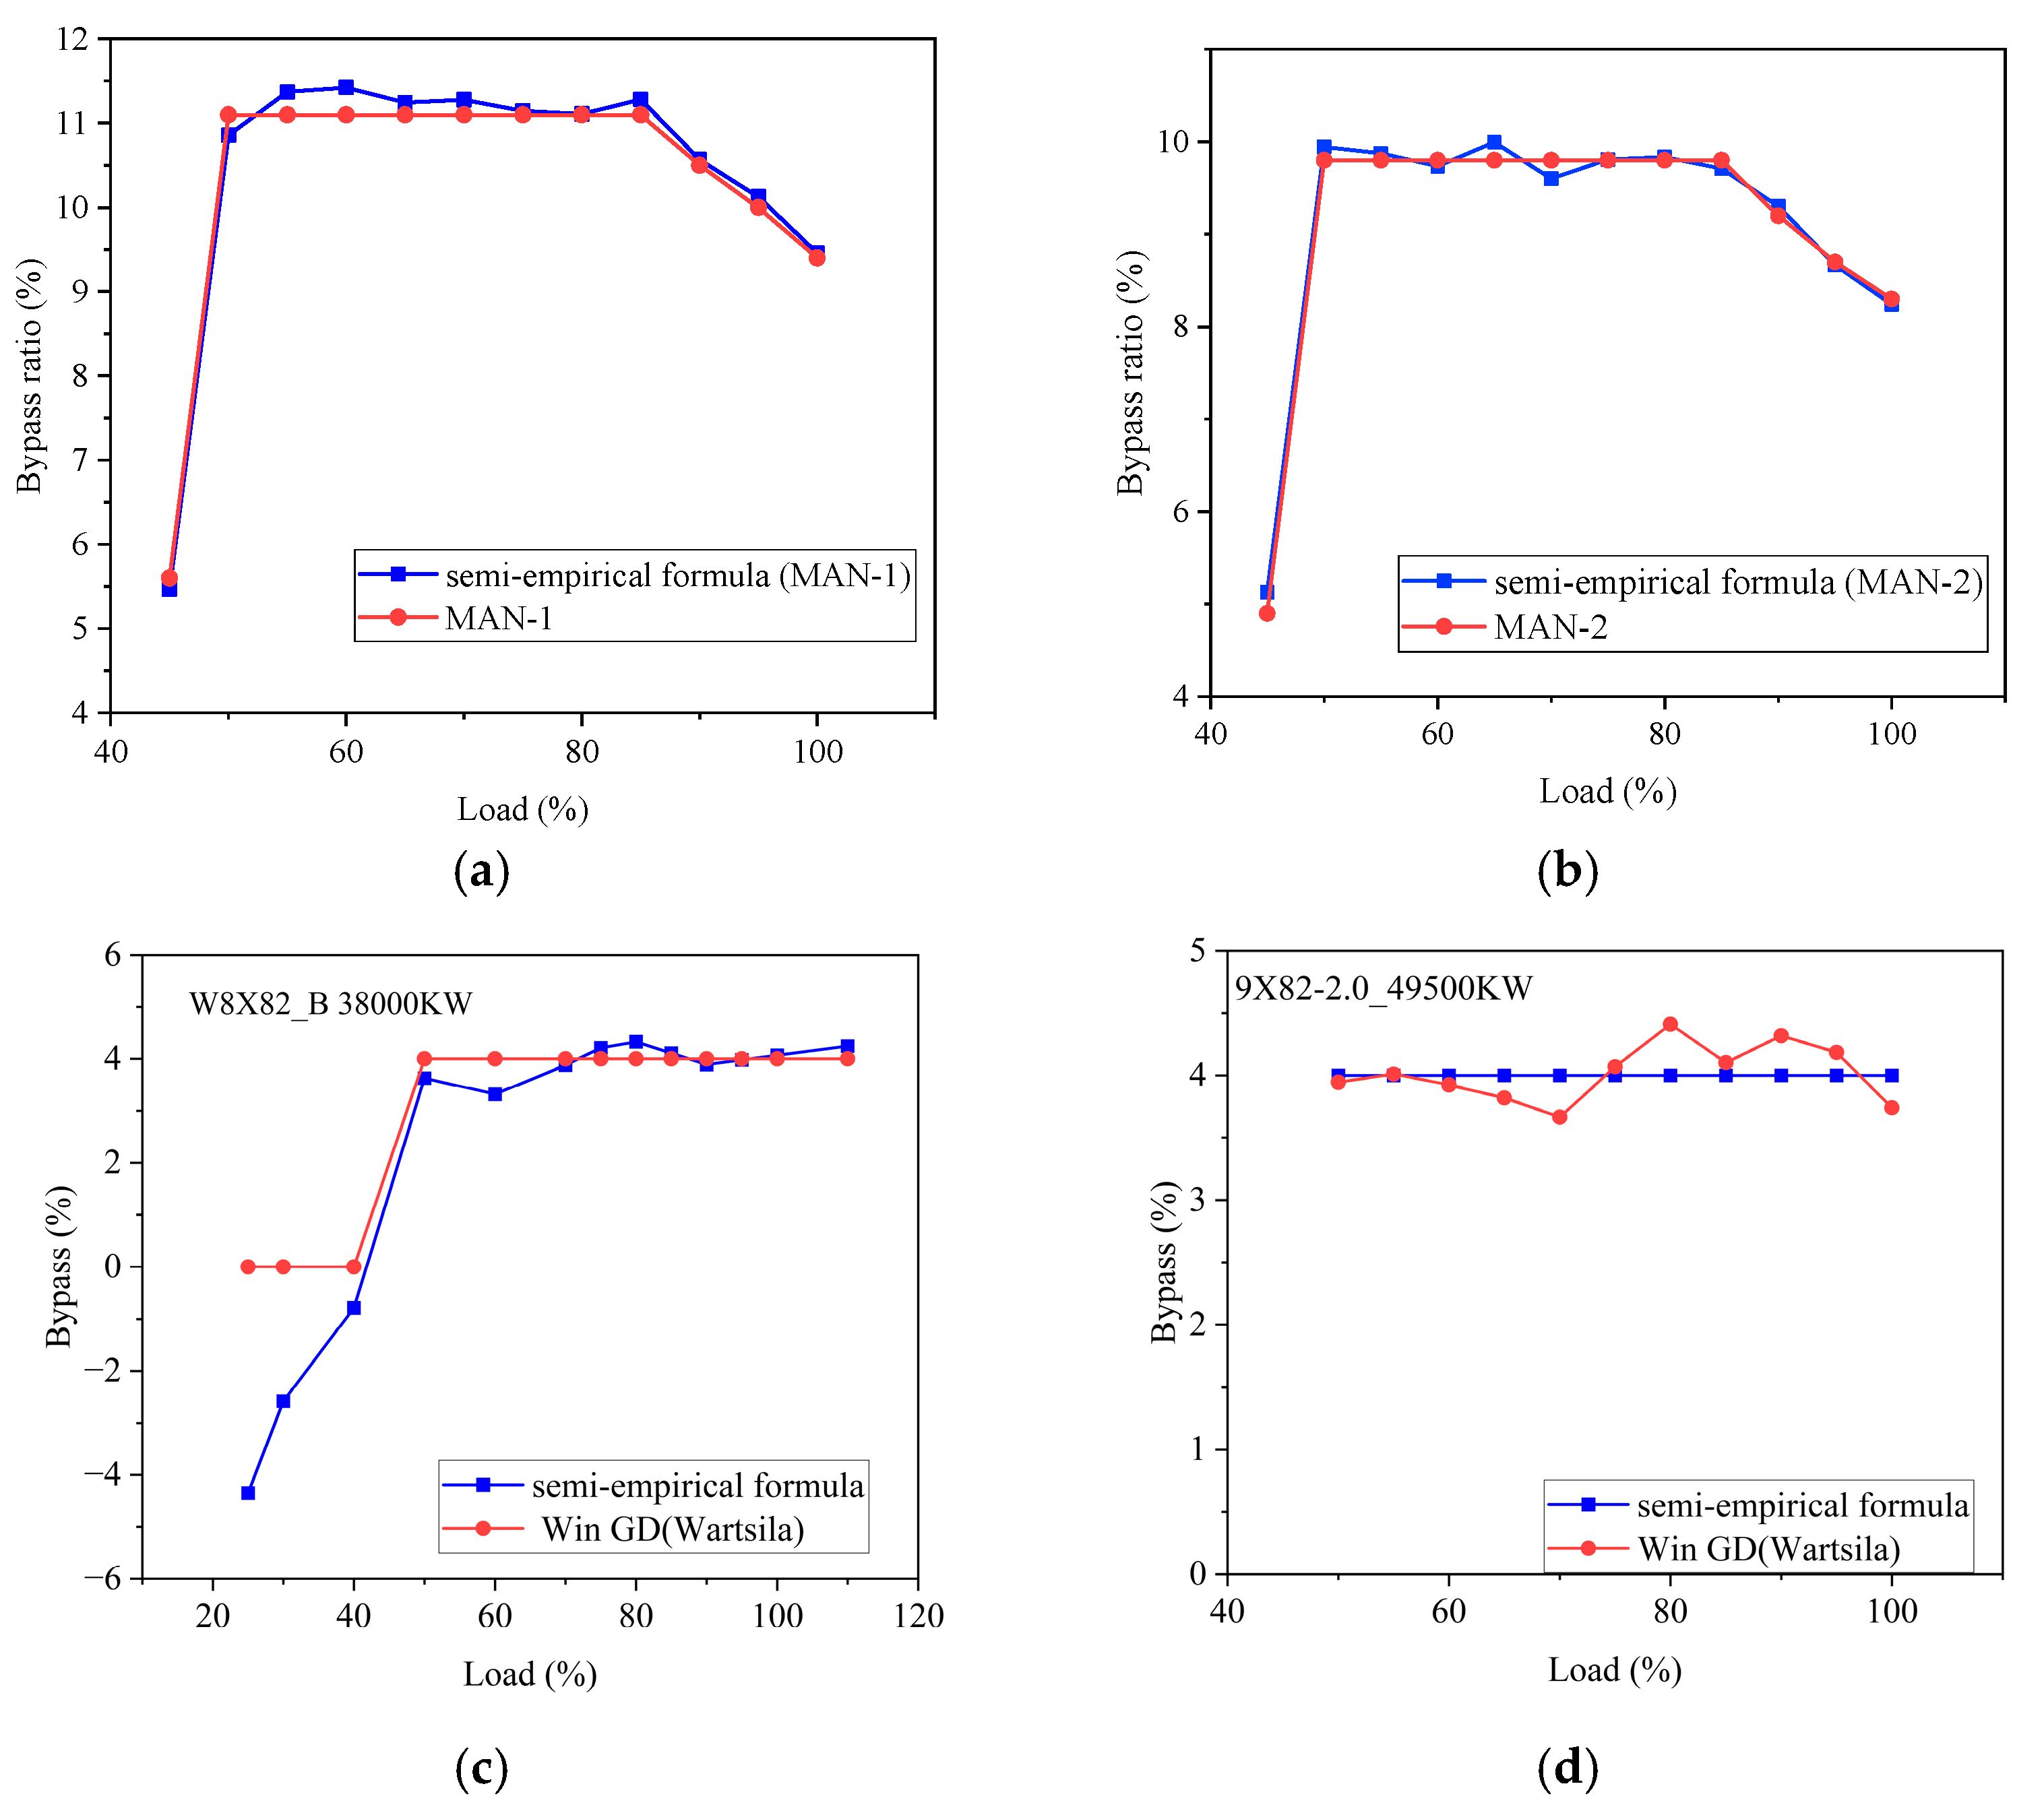
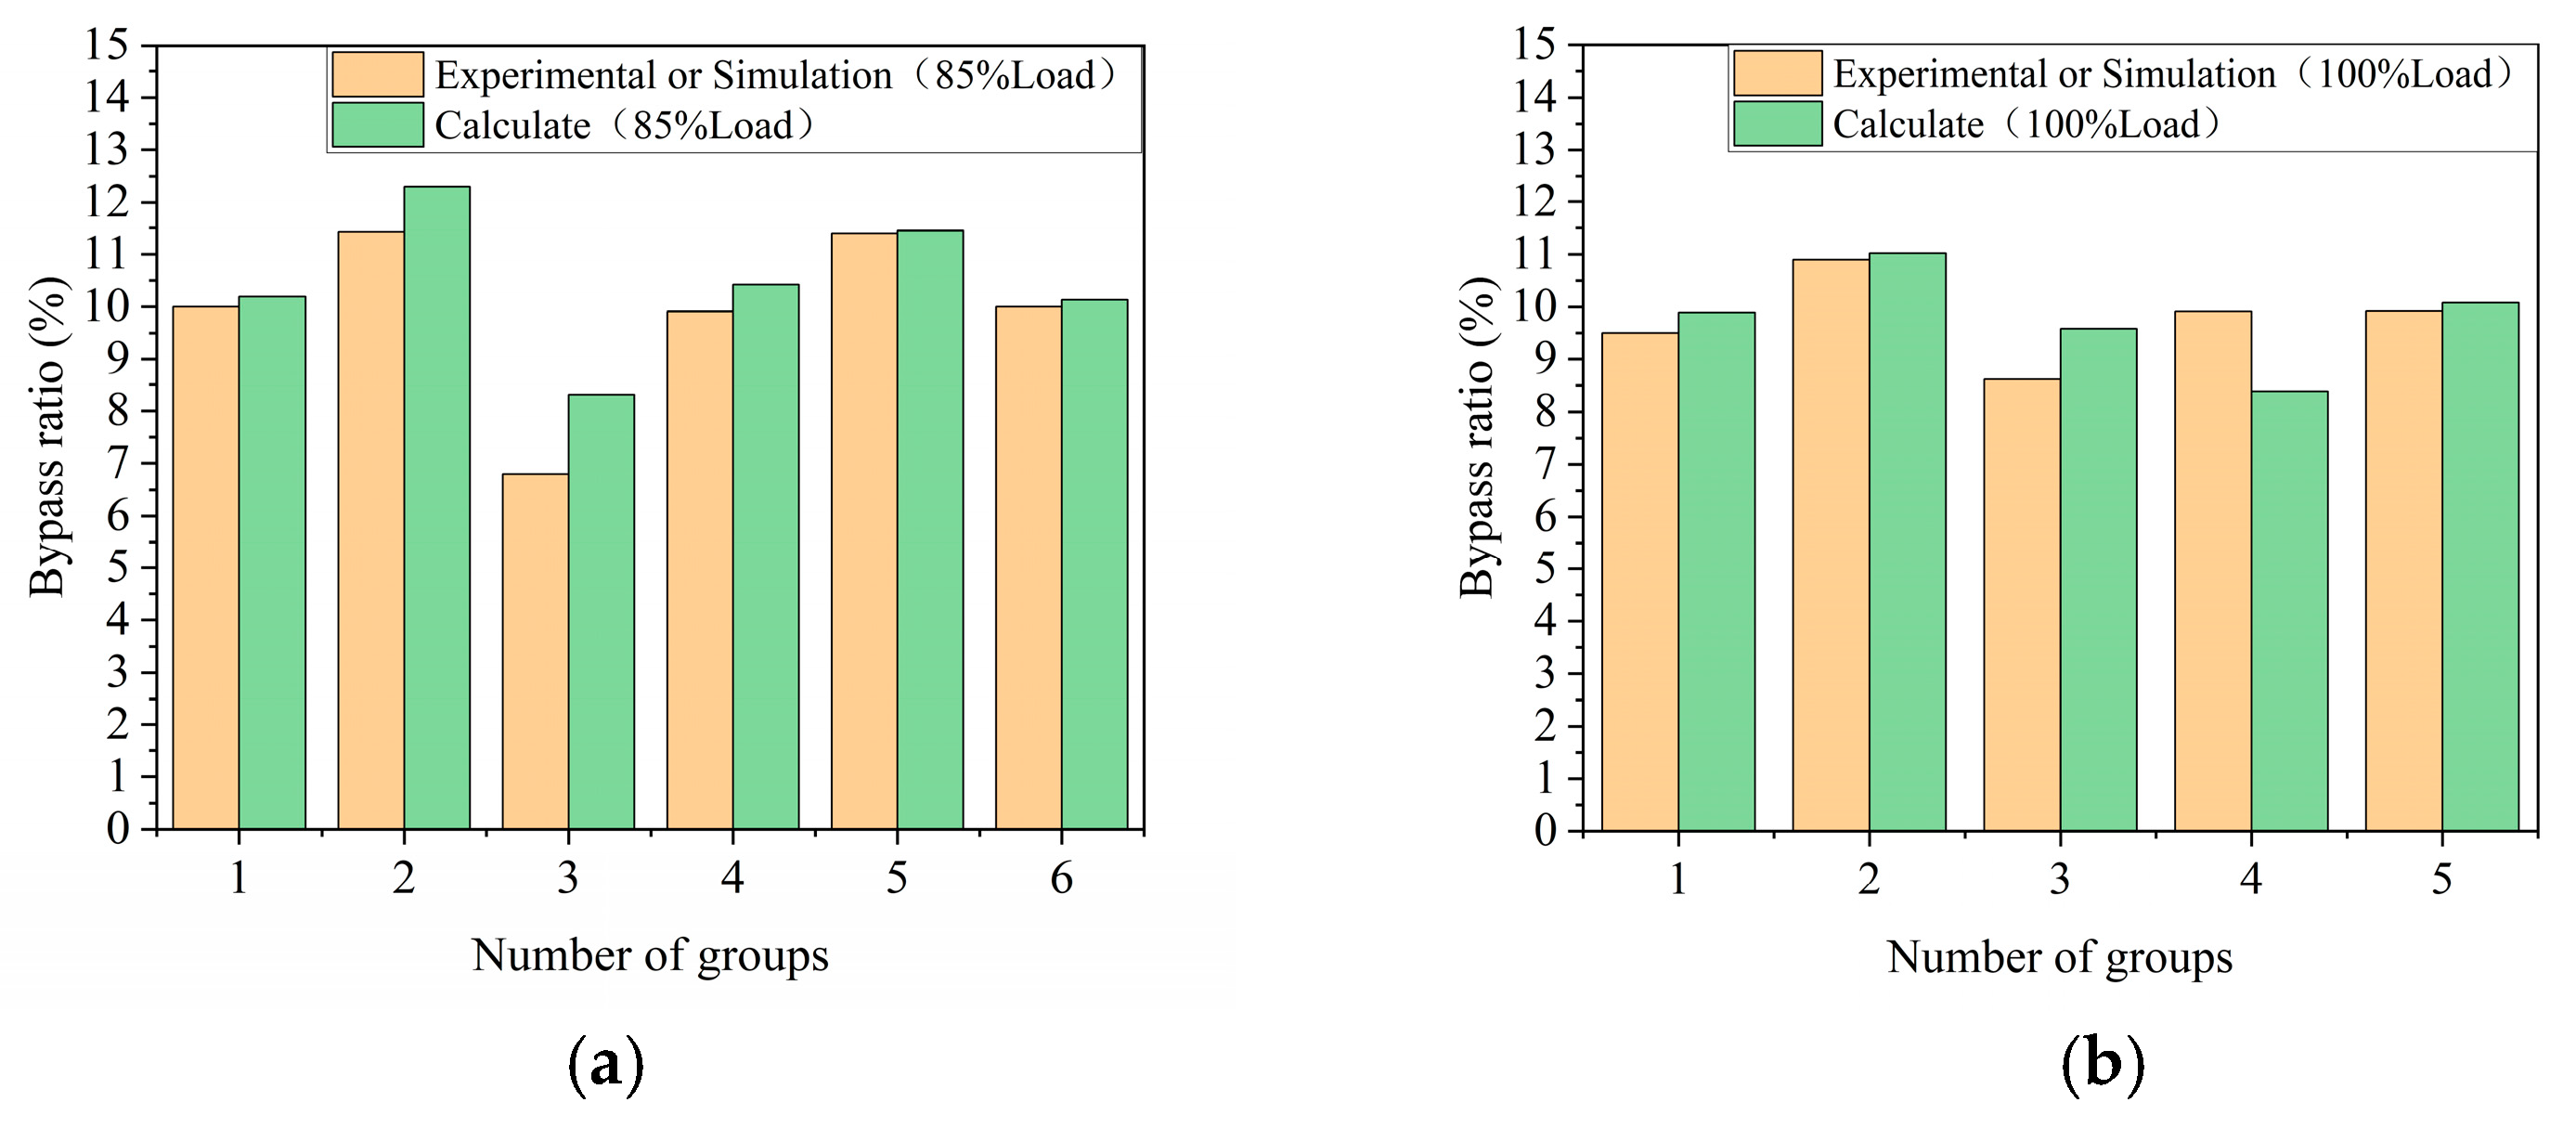
An additional verification of the semi-empirical formula was also performed by the data provided by MAN (or Win GD(Wartsila) Appendix A, Table A2, the simulation data from GT-Power, and test data in the given parameters, including the air excess ratio and turbocharging efficiency, as shown in Figure 7. The comparisons with data provided by MAN (or Win GD(Wartsila) are shown in Figure 7, which reveals that at a different load of over 50%, high accuracy can also be achieved. Meanwhile, the simulation verification and test verification are shown in Figure 8, where the maximum error is about 1%. In summary, the semi-empirical formula, Equation (38), can provide a precise prediction of the bypass ratio in the given air-excess ratio and turbocharging efficiency.

4.2. Determination of Bypass Ratio

Equation (38) can be used to determine the bypass ratio by providing the parameters of air-excess ratio and turbocharging efficiency, as shown in Figure 9. First, it can be concluded that at different ratios of air excess, the different available bypass-gas mass flow can be derived with a different turbocharging efficiency, while the high-air excess ratio needs a high turbocharging efficiency as the bypass ratio starts to be open. For instance, only the turbocharging efficiency is exceeded by about 66.5% at an air-excess ratio of 3.1, so the exhaust gas can be bypassed.
The air-excess ratio usually determines the turbine-inlet temperature, in which a lower air-excess ratio often leads to a higher turbine-inlet temperature, leading to a decrease of the amount of exhaust gas required for the turbocharger to perform at the same power level, thereby resulting in a higher exhaust-gas bypass ratio at a lower excess-air ratio.
The compressor-characteristic maps determine [54,55,56] the maximum flow rate of the compressor. Therefore, with a known turbocharging efficiency, combined with the compressor-characteristic map, the range of the air-excess ratio can be determined, and thereby the theoretical maximum exhaust-bypass ratio design value can be determined.

4.3. Effect of Bypass Ratio on Diesel Engine System

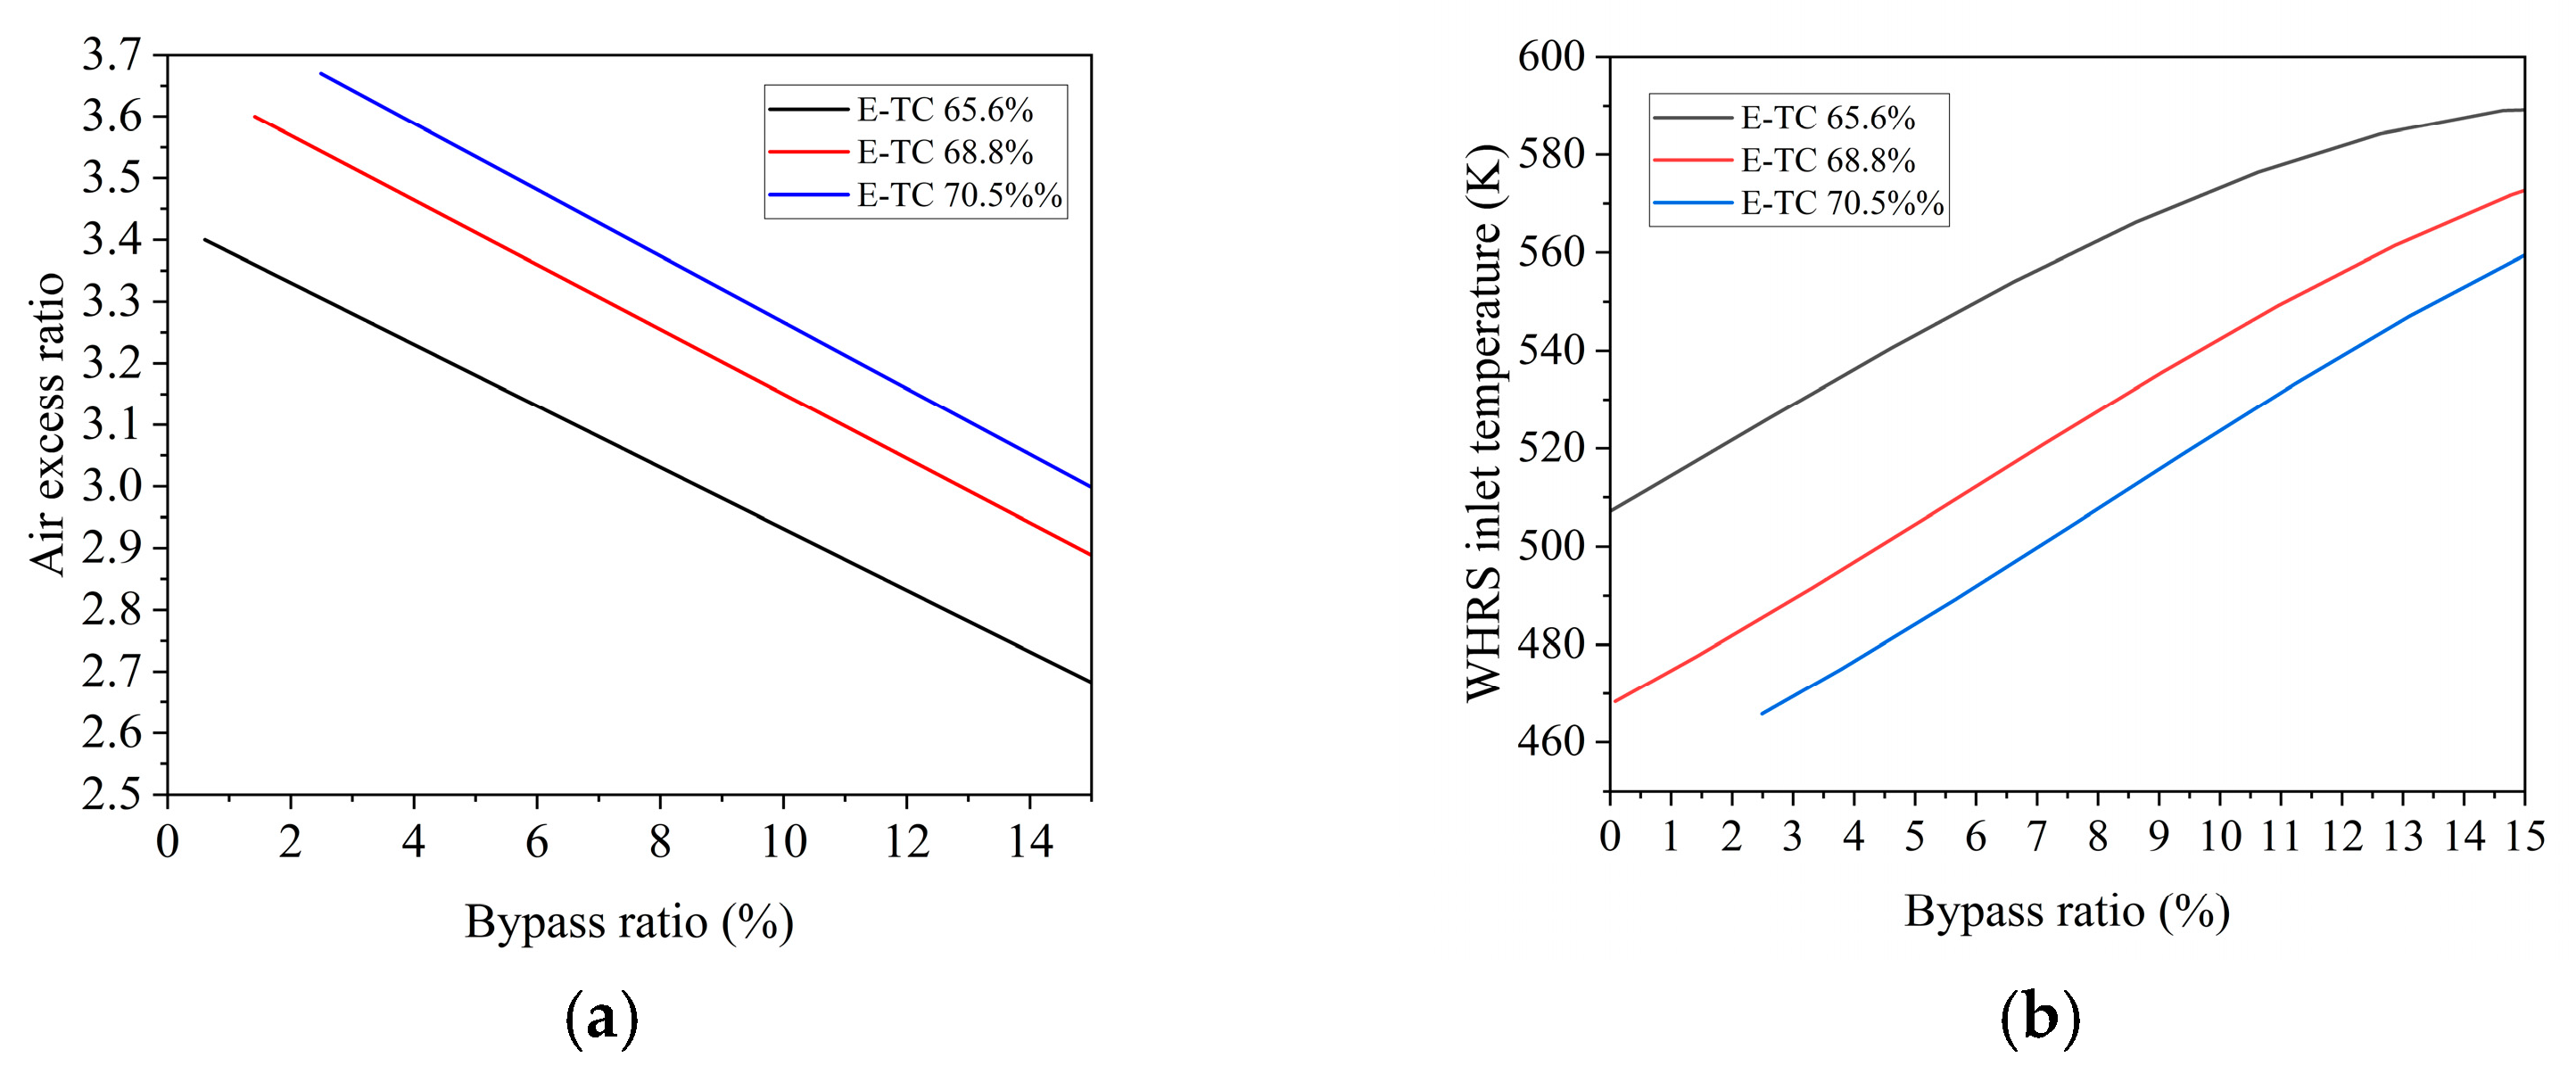
The effects of the bypass ratio on a top-cycle diesel engine, regardless of the compressor-characteristic map limits, are shown in Figure 10. As shown in Figure 10a, the increase of the bypass ratio can lead to the decrease of the air-excess ratio, mainly due to the decrease of the turbine power output at a fixed turbocharging efficiency, which can lead to a decrease of the compressor power and thereby the decrease of engine-inlet mass flow. In addition, enhancing the turbocharging efficiency can improve the air-excess ratio. Further, the higher the bypass ratio, the higher the turbine inlet temperature. This occurs mainly because the lower air-excess ratio is obtained, which can worsen the combustion and lower the combustion efficiency. Consequently, the energy-work conversion efficiency decreases and the cylinder exhaust-gas temperature rises.
This strategy can thus be used to improve the engine exhaust-gas temperature with a slight increase in fuel consumption, leading to the RC’s enhanced waste-heat recovery. However, it must be kept in mind that a low air-excess ratio will lead to high NOx emissions, meaning that in applying such a strategy, one must ensure that the engine meets NOx emission standards [57,58].

4.4. Effect of the Bypass Ratio on the Total System Efficiency

In practical applications, the MAP (mean absolute pressure) chart of a turbocharger limits the increase in bypass ratio. Its maximum value is affected by the efficiency of the turbocharging system, as shown in Figure 11a. Furthermore, the high turbocharging efficiency can improve the value, as shown in Figure 11b. Moreover, considering the whole system, including the tuning engine and the RC, the overall system efficiency first increases and then decreases with the increase of the bypass ratio. With a small enhancement of the bypass ratio, the increase of the RC efficiency can offset the decrease of the engine efficiency, leading to an increase in overall efficiency. Subsequently, as the bypass ratio continues to increase, the air-excess ratio is too low to maintain a slight decrease of engine efficiency, so a significant decrease of engine efficiency cannot be offset by an increase in the RC efficiency. The higher turbocharging efficiency can also achieve a high-peak overall efficiency and maximum bypass ratio.
Because of the assumption that the minimum intake-pressure ratio of a diesel engine remains unchanged under the same load, the maximum excess-air ratio can be obtained by combining it with the compressor characteristic curve, and the maximum exhaust bypass ratio of the diesel engine can be obtained, based on Figure 9. The trend of theoretical system efficiency (I-E) under different bypass conditions is shown in Figure 11.
At a turbocharging efficiency of 68.8%, the exhaust-bypass ratio was adjusted from 0% to 9.0%, and the turbine-inlet temperature increased by 50 °C. The turbocharger exhaust temperature increased more than 40 °C, resulting in an increase of 414 kW in the total power generation, while the overall efficiency increased from 50.34% to 54.84%. Moreover, the results of increasing efficiency were the same as those given in the MAN report [42,43].

4.5. EEXI and CII Assessments

The current investigation aims to explore the semi-empirical equation of waste-gas bypass to further understand how to reduce carbon emissions from ships. Therefore, it is necessary to evaluate the feasibility and carbon reduction potential of waste-gas bypass in maritime transportation through the current main indicators EEXI and CII.
Two types of old ships were selected to calculate the EEXI and CII; the parameters are shown in Table 3 and Table 4.
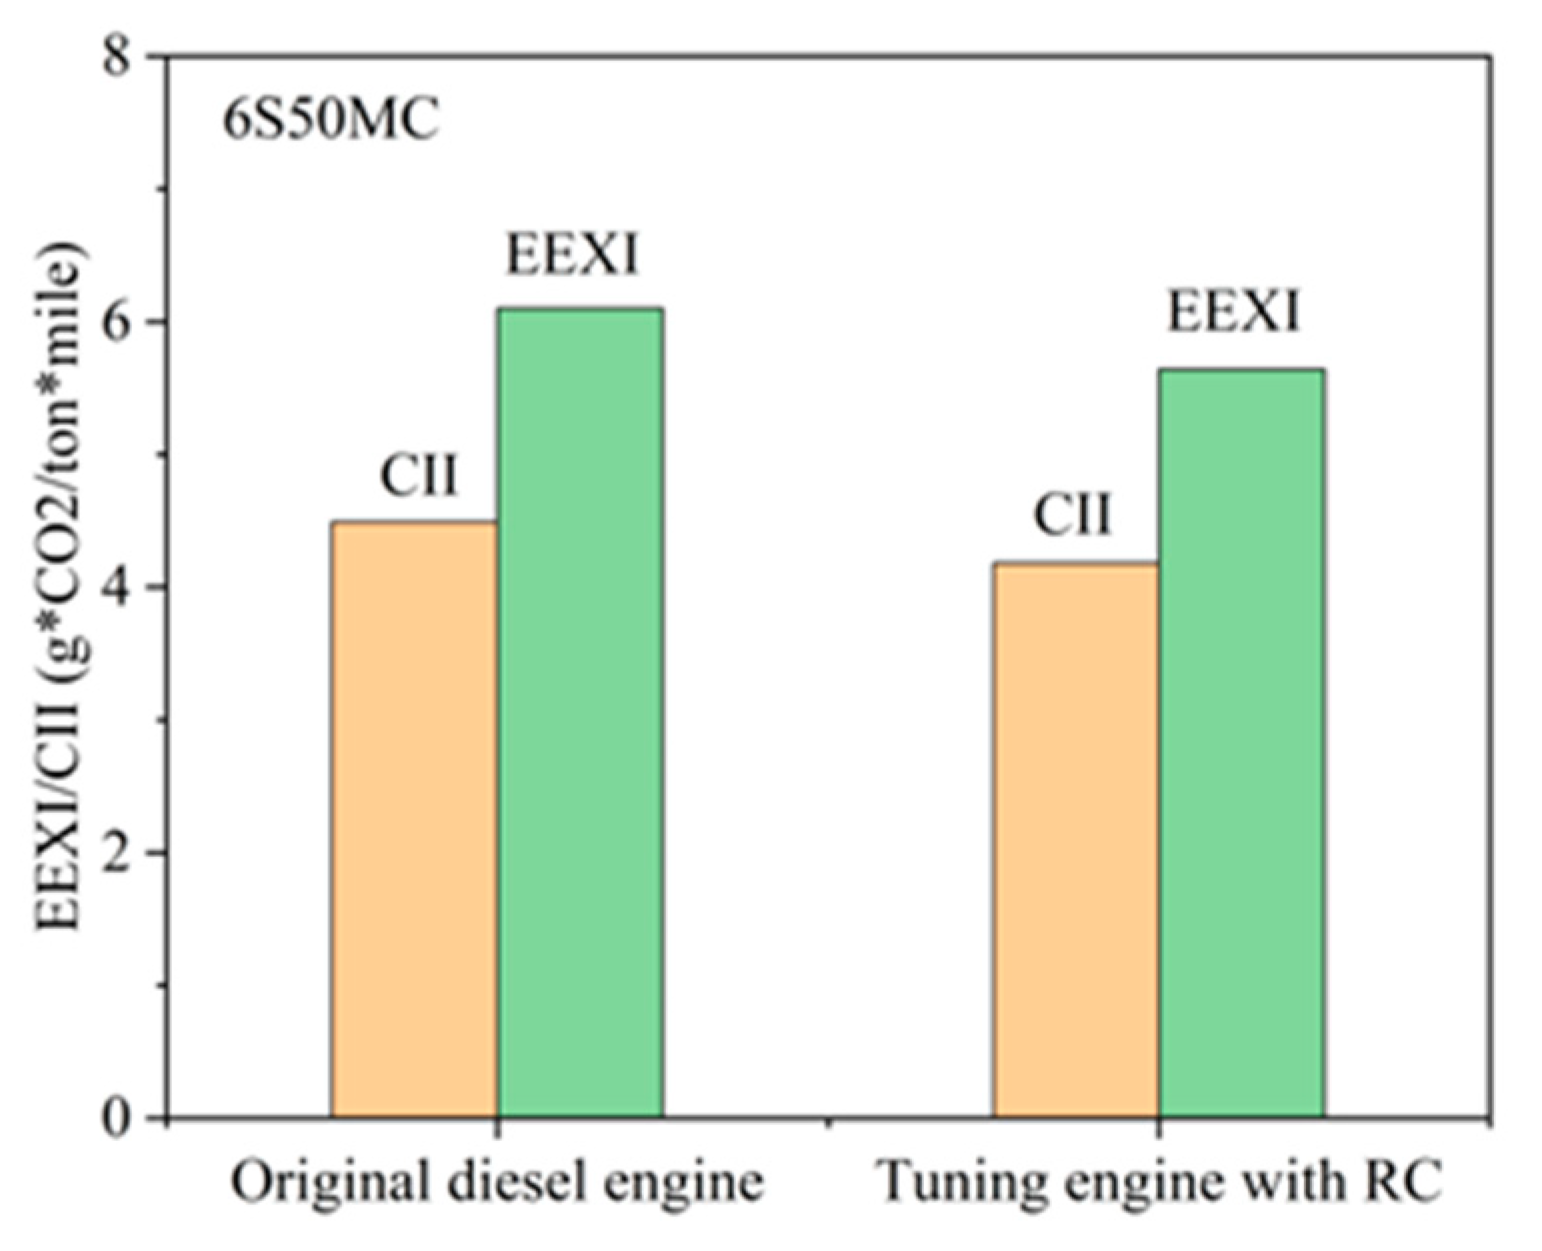
For the 6S50 diesel-engine ship, the results of EEXI and CII are shown in Figure 12. The direct comparison of EEXI for this strategy results in a greater decrease; the decrease of EEXI (CII) ranges from 6.1 (4.56) to 5.64 (4.12), with a decrease of about 7%. Additionally, (in Table 5) the NOx emissions calculated by GT Power increase from 11.36 g/kWh to 12.65 g/kWh and meet the Tier II requirements.
The W8X82 diesel engine can increase the average of about 70 °C under 50–100% load and only 4% exhaust-gas bypass, and the price paid is only to reduce the thermal efficiency of the main engine by an average of less than 1%. The EEXI reduction of 7.2% and the CII reduction of 8.3% can be achieved on the tuning engine with the RC ship, compared to the original diesel-engine ship(shown in Figure 12 and Figure 13).
A good potential exists for using exhaust-gas bypass to reduce EEXI and CII. On the premise of reducing the thermal efficiency of diesel engines by about 1%, the turbine exhaust temperature can be increased. Although fuel consumption may slightly increase, the additional power generated by PT + RC can often compensate for this loss and generate more power, thereby achieving a reduction in EEXI and CII.
Currently, increasingly severe climate changes prompt maritime technology to aim at net-zero emissions. The solution presented in this paper has the ability to effectively remit the greenhouse effect on a short to medium term due to the low complexity of modifying of an old ship [59,60,61,62].

5. Conclusions

A solution to adapt old ships to meet EEXI requirements has been proposed and applied, whereby the RC-PT and WHR systems were combined to recover the waste heat of the marine tuning engine. Tuning the engine was accomplished by bypassing parts of the exhaust gas before the turbine, creating ahigh exhaust temperature and high-quality energy-bypassed exhaust gas. This strategy could reduce the turbocharger powerand the main engine-intake air-mass flow and thereby the air-excess ratio. The low air-excess ratio could accomplish low combustion efficiency and a high exhaust temperature. Even so, the high exhaust temperature could improve WHR efficiency, leading to a high overall efficiency. The quantitative analysis was carried out by a semi-empirical formula developed in this study. The main conclusions are as follows:
The comprehensive analysis of 6S50, W8X82 and 9X82 diesel engines showed that the higher bypass ratio could improve overall efficiency. Despite the decrease of engine efficiency, the high exhaust temperature could improve WHR efficiency. The results showed that increasing the exhaust-bypass ratio could increase the overall efficiency by about 4%.
Further, the available maximum bypass ratio was mainly determined by turbocharger efficiency. In the given turbocharger efficiency, the excess high-bypass ratio could lead to excessive NOx emissions. The high turbocharger efficiency could improve the available maximum bypass ratio and thereby lead to high overall efficiency.
Such a strategy would not only improve efficiency but also affect the emission indicators. The results showed that the NOx emissions were improved from 11.36 g/kWh to 12.65 g/kWh, which still met the Tier II requirements. Additionally, an old 58,000 DWT bulk carrier was equipped with a 6S50ME diesel engine to evaluate the improvement of EEXI. The results showed that the EEXI could decrease from 6.10 to 5.64.
According to our research results, a reasonable exhaust-gas bypass for old ships can effectively improve the overall efficiency of the system, serving as an effective strategy to reduce the EEXI.
The following recommendations are proposed for future study: Because the recovery efficiency of the waste-heat system has a significant impact on the overall efficiency of the system, a more efficient waste-heat system is proposed, which can achieve higher profits when a tuning engine with WHR is utilized. Studying more efficient turbocharging devices to ensure the thermal efficiency of the main engine while achieving a higher exhaust-gas bypass ratio is also of great significance in tuning engines.

Author Contributions

Conceptualization, Y.F.; methodology, Y.Z.; software, J.L.; validation, Y.Z.; formal analysis, J.L.; investigation, J.Q.; resources, Y.Z.; data curation, J.L.; writing—original draft preparation, Y.F.; writing—review and editing, J.Q.; visualization, J.Q.; supervision, J.Q.; project administration, Y.F.; funding acquisition, Y.W. All authors have read and agreed to the published version of the manuscript.

Funding

This research was funded by the Harbin Engineering University grant number (002030290129) and Fundamental Research Funds for the Central Universities (3072022JC0305).

Data Availability Statement

You can search for relevant data on the official website of MAN.

Conflicts of Interest

The authors declare that they have no known competing financial interests or personal relationships that influenced the work covered in this article.

Nomenclature

Abbreviation, Subscripts
CIICarbon Intensity Indicator
EbEBefore heat exchanger
EEXIEnergy efficiency design index
I-EIdeal system efficiency
IMOInternational Maritime Organization
HuFuel heating capacity
kSpecific heat ratio
KCKalina cycle
L0Theoretical air-fuel ratio
LOCLubricating cooler
ORC Organic Rankine cycle
PT Power turbine
PPressure
QEnergy
SEntropy
SFOCSpecific Fuel Oil Consumption
SRC Steam Rankine cycle
T Temperature
TCTurbocharger
WEffective work
WHRWaste heat recovery
CIICarbon intensity indicator
Subscripts
EaPTAfter power turbine
EaTAfter turbine
EbPTBefore power turbine
EbWHRBefore waste heat recovery system
f, f0Fuel
mMass flow rate
MixMixture
scav,scScavenge
T, t0, tTurbine
Greek symbols
αAir-excess ratio
ηEfficiency
γbBypass ratio
η𝑣Scavenging fraction
ηhEnergy-loss fraction
πPressure ratio
ƞtcTurbocharger efficiency

Appendix A

Table A1. Data from MAN.
MAN-1 DATA (6S50)
Load [%]TC Eff [%]Exh Gas Temp [°C]Psca [bar]Pext [bar]Air Excess Ratio
10067.0289.84.394.202.95
9567.7285.14.163.973.00
9068.3281.53.923.743.05
8568.8279.43.73.523.09
8069.2274.43.513.343.16
7569.5270.73.333.173.23
7069.7268.23.152.993.30
6569.72672.962.823.36
6069.7267.32.772.633.42
5569.4269.42.582.453.47
5069.0273.52.372.253.51
4568.4243.22.42.293.85
4067.6219.12.282.174.12
3566.6211.52.12.004.38
3065.4198.81.931.834.76
2564.0198.71.691.614.96
MAN-2 DATA (6S50)
Load [%]TC Eff [%]Exh Gas Temp [°C]Psca [bar]Pext [bar]Air Excess Ratio
10065.8481.04.374.182.93
9566.8465.14.163.983.01
9067.4453.23.943.763.06
8567.7444.33.73.533.09
8067.9433.73.513.343.15
7568.0423.23.323.163.20
7068.2412.53.132.983.27
6568.3402.72.952.813.34
6068.0395.32.752.623.38
5567.5389.92.542.423.41
5066.7385.72.332.213.42
4565.9357.12.312.203.68
Table A2. Data from Win GD (Wartsila).
Win GD (Wartsila) DATA (W8X82)
Load [%]TC Eff [%]Turbocharger Inlet Temperature [°C]Psca [bar]Air Excess Ratio
11066.55234.542.49691
100684944.272.64452
9568.94764.082.73149
9069.74593.862.8035
8570.44453.652.85788
8070.74343.482.92894
75714263.333.01484
7071.14153.083.12812
6071.14082.93.27098
5070.33942.443.26657
4069.33642.113.38221
30663281.833.80015
2564.73241.643.96658
Win GD(Wartsila) DATA (9X82-2.0)
Load [%]TC Eff [%]Exh Gas Temp [°C]Psca [bar]Air-Excess Ratio
100682574.663.17749
9569.12454.393.25163
9070.12354.113.29931
8570.72303.853.33962
8070.92293.673.40886
7571.12283.513.49421
7071.12293.363.59108
6571.12313.183.65335
6070.92342.983.70875
5570.52382.773.73614
5069.92442.553.74577

References

  1. Germond, B.; Mazaris, A.D. Climate change and maritime security. Mar. Policy 2019, 99, 262–266. [Google Scholar] [CrossRef]
  2. Qu, J.; Feng, Y.; Xu, G.; Zhang, M.; Zhu, Y.; Zhou, S. Design and thermodynamics analysis of marine dual fuel low speed engine with methane reforming integrated high pressure exhaust gas recirculation system. Fuel 2022, 319, 123747. [Google Scholar] [CrossRef]
  3. Tadros, M.; Ventura, M.; Soares, C.G. Review of current regulations, available technologies, and future trends in the green shipping industry. Ocean Eng. 2023, 280, 114670. [Google Scholar] [CrossRef]
  4. Díaz-Secades, L.A.; González, R.; Rivera, N.; Montañés, E.; Quevedo, J.R. Waste heat recovery system for marine engines optimized through a preference learning rank function embedded into a Bayesian optimizer. Ocean Eng. 2023, 281, 114747. [Google Scholar] [CrossRef]
  5. Leng, L.; Ma, Z.; Cheng, J.; Shi, L.; Deng, K. Research on exhaust energy distribution regulation for fuel economy improvement of turbocompound diesel engine. Appl. Therm. Eng. 2023, 220, 119708. [Google Scholar] [CrossRef]
  6. Meda, U.S.; Rajyaguru, Y.V.; Pandey, A. Generation of green hydrogen using self-sustained regenerative fuel cells: Opportunities and challenges. Int. J. Hydrogen Energy 2023. [Google Scholar] [CrossRef]
  7. Wu, X.; Feng, Y.; Gao, Y.; Xia, C.; Zhu, Y.; Shreka, M.; Ming, P. Numerical simulation of lean premixed combustion characteristics and emissions of natural gas-ammonia dual-fuel marine engine with the pre-chamber ignition system. Fuel 2023, 343, 127990. [Google Scholar] [CrossRef]
  8. Garcia-Baldovi, A.; Asiri, A.M.; Garcia, H. Photocatalytic CO2 reduction to methanol: How can the dilemma be solved? Curr. Opin. Green Sustain. Chem. 2023, 41, 100831. [Google Scholar] [CrossRef]
  9. Jimenez, V.J.; Kim, H.; Munim, Z.H. A review of ship energy efficiency research and directions towards emission reduction in the maritime industry. J. Clean. Prod. 2022, 366, 132888. [Google Scholar] [CrossRef]
  10. Trapp, A.C.; Harris, I.; Sanchez Rodrigues, V.; Sarkis, J. Maritime container shipping: Does coopetition improve cost and environmental efficiencies? Transp. Res. Part D Transp. Environ. 2020, 87, 102507. [Google Scholar] [CrossRef]
  11. Song, Q.; Tinoco, R.R.; Yang, H.; Yang, Q.; Jiang, H.; Chen, Y.; Chen, H. A comparative study on energy efficiency of the maritime supply chains for liquefied hydrogen, ammonia, methanol and natural gas. Carbon Capture Sci. Technol. 2022, 4, 100056. [Google Scholar] [CrossRef]
  12. Chuah, L.F.; Mokhtar, K.; Ruslan, S.M.M.; Bakar, A.A.; Abdullah, M.A.; Osman, N.H.; Bokhari, A.; Mubashir, M.; Show, P.L. Implementation of the energy efficiency existing ship index and carbon intensity indicator on domestic ship for marine environmental protection. Environ. Res. 2023, 222, 115348. [Google Scholar] [CrossRef]
  13. Ouyang, T.; Wang, Z.; Liu, W.; Qin, P.; Mo, H. Performance investigation and collaborative optimization of power, economy and NOx removal for waste heat cascade utilization system in ocean-going vessels. J. Clean. Prod. 2022, 341, 130939. [Google Scholar] [CrossRef]
  14. Suárez de la Fuente, S.; Cao, T.; Pujol, A.G.; Romagnoli, A. Chapter 4—Waste heat recovery on ships. In Sustainable Energy Systems on Ships; Baldi, F., Coraddu, A., Mondejar, M.E., Eds.; Elsevier: Amsterdam, The Netherlands, 2022; pp. 123–195. [Google Scholar]
  15. Schroer, M.; Panagakos, G.; Barfod, M.B. An evidence-based assessment of IMO’s short-term measures for decarbonizing container shipping. J. Clean. Prod. 2022, 363, 132441. [Google Scholar] [CrossRef]
  16. Konur, O.; Yuksel, O.; Korkmaz, S.A.; Colpan, C.O.; Saatcioglu, O.Y.; Muslu, I. Thermal design and analysis of an organic rankine cycle system utilizing the main engine and cargo oil pump turbine based waste heats in a large tanker ship. J. Clean. Prod. 2022, 368, 133230. [Google Scholar] [CrossRef]
  17. Konur, O.; Yuksel, O.; Korkmaz, S.A.; Colpan, C.O.; Saatcioglu, O.Y.; Koseoglu, B. Operation-dependent exergetic sustainability assessment and environmental analysis on a large tanker ship utilizing Organic Rankine cycle system. Energy 2023, 262, 125477. [Google Scholar] [CrossRef]
  18. Uyanık, T.; Ejder, E.; Arslanoğlu, Y.; Yalman, Y.; Terriche, Y.; Su, C.-L.; Guerrero, J.M. Thermoelectric generators as an alternative energy source in shipboard microgrids. Energies 2022, 15, 4248. [Google Scholar] [CrossRef]
  19. Walker, T.R.; Adebambo, O.; Feijoo, M.C.D.A.; Elhaimer, E.; Hossain, T.; Edwards, S.J.; Morrison, C.E.; Romo, J.; Sharma, N.; Taylor, S.; et al. Environmental effects of marine transportation. In World Seas: An Environmental Evaluation; Elsevier: Amsterdam, The Netherlands, 2019; pp. 505–530. [Google Scholar]
  20. Omar, A.; Saghafifar, M.; Mohammadi, K.; Alashkar, A.; Gadalla, M. A review of unconventional bottoming cycles for waste heat recovery: Part II–Applications. Energy Convers. Manag. 2019, 180, 559–583. [Google Scholar] [CrossRef]
  21. Saghafifar, M.; Omar, A.; Mohammadi, K.; Alashkar, A.; Gadalla, M. A review of unconventional bottoming cycles for waste heat recovery: Part I–Analysis, design, and optimization. Energy Convers. Manag. 2019, 198, 110905. [Google Scholar] [CrossRef]
  22. Singh, D.V.; Pedersen, E. A review of waste heat recovery technologies for maritime applications. Energy Convers. Manag. 2016, 111, 315–328. [Google Scholar] [CrossRef]
  23. Baines, N.; Wygant, K.D.; Dris, A. The Analysis of Heat Transfer in Automotive Turbochargers. Proc. Asme Turbo Expo 2009, 5, 115–126. [Google Scholar]
  24. Wang, Z.; Chen, H.; Xia, R.; Han, F.; Ji, Y.; Cai, W. Energy, exergy and economy (3E) investigation of a SOFC-GT-ORC waste heat recovery system for green power ships. Therm. Sci. Eng. Prog. 2022, 32, 101342. [Google Scholar] [CrossRef]
  25. Ma, Z.S.; Yang, D.; Guo, Q. Conceptual Design and Performance Analysis of an Exhaust Gas Waste Heat Recovery System for a 10000TEU Container Ship. Pol. Marit. Res. 2012, 19, 31–38. [Google Scholar] [CrossRef] [Green Version]
  26. Zhu, S.; Sun, K.; Bai, S.; Deng, K. Thermodynamic and techno-economic comparisons of the steam injected turbocompounding system with conventional steam Rankine cycle systems in recovering waste heat from the marine two-stroke engine. Energy 2022, 245, 123245. [Google Scholar] [CrossRef]
  27. Shi, L.F.; Shu, G.Q.; Tian, H.; Deng, S. A review of modified Organic Rankine cycles (ORCs) for internal combustion engine waste heat recovery (ICE-WHR). Renew. Sustain. Energy Rev. 2018, 92, 95–110. [Google Scholar] [CrossRef]
  28. Andreasen, J.G.; Kaern, M.R.; Pierobon, L.; Larsen, U.; Haglind, F. Multi-Objective Optimization of Organic Rankine Cycle Power Plants Using Pure and Mixed Working Fluids. Energies 2016, 9, 322. [Google Scholar] [CrossRef] [Green Version]
  29. Kumar, P.; Choudhary, T.; Ansari, M.Z. Thermodynamic assessment of a novel SOFC and intercooled GT integration with ORC: Energy and exergy analysis. Therm. Sci. Eng. Prog. 2022, 34, 101411. [Google Scholar] [CrossRef]
  30. Crespi, F.; Gavagnin, G.; Sanchez, D.; Martinez, G.S. Supercritical carbon dioxide cycles for power generation: A review. Appl. Energ. 2017, 195, 152–183. [Google Scholar] [CrossRef]
  31. Wang, Z.; Jiang, Y.; Han, F.; Yu, S.; Li, W.; Ji, Y.; Cai, W. A thermodynamic configuration method of combined supercritical CO2 power system for marine engine waste heat recovery based on recuperative effects. Appl. Therm. Eng. 2022, 200, 117645. [Google Scholar] [CrossRef]
  32. Zuo, W.J.; Zhang, X.Y.; Li, Y.Z. Review of flue gas acid dew-point and related low temperature corrosion. J. Energy Inst. 2020, 93, 1666–1677. [Google Scholar] [CrossRef]
  33. Di Battista, D.; Mauriello, M.; Cipollone, R. Waste heat recovery of an ORC-based power unit in a turbocharged diesel engine propelling a light duty vehicle. Appl. Energy 2015, 152, 109–120. [Google Scholar] [CrossRef]
  34. Michos, C.N.; Lion, S.; Vlaskos, I.; Taccani, R. Analysis of the backpressure effect of an Organic Rankine Cycle (ORC) evaporator on the exhaust line of a turbocharged heavy duty diesel power generator for marine applications. Energy Convers. Manag. 2017, 132, 347–360. [Google Scholar] [CrossRef]
  35. Jafarzad, A.; Asgari, N.; Ranjbar, F.; Mohammadkhani, F. Thermodynamic assessment and optimization of the influences of the steam-assisted turbocharging and organic Rankine cycle on the overall performance of a diesel engine-based cogeneration integrated with a reverse osmosis desalination unit. Sustain. Energy Technol. 2021, 46, 101175. [Google Scholar] [CrossRef]
  36. Geffroy, C.; Lilley, D.; Parez, P.S.; Prasher, R. Techno-economic analysis of waste-heat conversion. Joule 2021, 5, 3080–3096. [Google Scholar] [CrossRef]
  37. Sun, W.Q.; Yue, X.Y.; Wang, Y.H. Exergy efficiency analysis of ORC (Organic Rankine Cycle) and ORC-based combined cycles driven by low-temperature waste heat. Energy Convers. Manag. 2017, 135, 63–73. [Google Scholar] [CrossRef]
  38. Singh, V.; Rijpkema, J.J.; Munch, K.; Andersson, S.B.; Verhelst, S. On the effects of increased coolant temperatures of light duty engines on waste heat recovery. Appl. Therm. Eng. 2020, 172, 115157. [Google Scholar] [CrossRef]
  39. Feng, Y.; Du, Z.; Shreka, M.; Zhu, Y.; Zhou, S.; Zhang, W. Thermodynamic analysis and performance optimization of the supercritical carbon dioxide Brayton cycle combined with the Kalina cycle for waste heat recovery from a marine low-speed diesel engine. Energy Convers. Manag. 2020, 206, 112483. [Google Scholar] [CrossRef]
  40. Qu, J.; Feng, Y.; Zhu, Y.; Zhou, S.; Zhang, W. Design and thermodynamic analysis of a combined system including steam Rankine cycle, organic Rankine cycle, and power turbine for marine low-speed diesel engine waste heat recovery. Energy Convers. Manag. 2021, 245, 114580. [Google Scholar] [CrossRef]
  41. Egashira, S.; Matsuo, T.; Ichiki, Y. Ship propulsion/electric power hybrid system recovering waste heat of marine diesel engine. Mitsubishi Heavy Ind. Tech. Rev. 2013, 50, 54. [Google Scholar]
  42. Larsen, U.; Sigthorsson, O.; Haglind, F. A comparison of advanced heat recovery power cycles in a combined cycle for large ships. Energy 2014, 74, 260–268. [Google Scholar] [CrossRef] [Green Version]
  43. Larsen, U.; Wronski, J.; Andreasen, J.G.; Baldi, F.; Pierobon, L. Expansion of organic Rankine cycle working fluid in a cylinder of a low-speed two-stroke ship engine. Energy 2017, 119, 1212–1220. [Google Scholar] [CrossRef] [Green Version]
  44. Masodzadeh, P.G.; Olcer, A.I.; Ballini, F.; Christodoulou, A. How to bridge the short-term measures to the Market Based Measure? Proposal of a new hybrid MBM based on a new standard in ship operation. Transp. Policy 2022, 118, 123–142. [Google Scholar] [CrossRef]
  45. Salek, F.; Babaie, M.; Naserian, M.M.; Ahmadi, M.H. Power enhancement of a turbo-charged industrial diesel engine by using of a waste heat recovery system based on inverted Brayton and organic Rankine cycles. Fuel 2022, 322, 124036. [Google Scholar] [CrossRef]
  46. Czermański, E.; Oniszczuk-Jastrząbek, A.; Spangenberg, E.F.; Kozłowski, Ł.; Adamowicz, M.; Jankiewicz, J.; Cirella, G.T. Implementation of the Energy Efficiency Existing Ship Index: An important but costly step towards ocean protection. Mar. Policy 2022, 145, 105259. [Google Scholar] [CrossRef]
  47. Raghulnath, D.; Saravanan, K.; Mahendran, J.; Kumar, M.R.; Lakshmanan, P. Analysis and optimization of organic Rankine cycle for IC engine waste heat recovery system. Mater. Today-Proc. 2020, 21, 30–35. [Google Scholar] [CrossRef]
  48. Karabektas, M. The effects of turbocharger on the performance and exhaust emissions of a diesel engine fuelled with biodiesel. Renew. Energy 2009, 34, 989–993. [Google Scholar] [CrossRef]
  49. Cao, T.; Lee, H.; Hwang, Y.; Radermacher, R.; Chun, H.H. Modeling of waste heat powered energy system for container ships. Energy 2016, 106, 408–421. [Google Scholar] [CrossRef]
  50. Chintala, V.; Kumar, S.; Pandey, J.K. A technical review on waste heat recovery from compression ignition engines using organic Rankine cycle. Renew. Sustain. Energy Rev. 2018, 81, 493–509. [Google Scholar] [CrossRef]
  51. Pallis, P.; Varvagiannis, E.; Braimakis, K.; Roumpedakis, T.; Leontaritis, A.D.; Karellas, S. Development, experimental testing and techno-economic assessment of a fully automated marine organic rankine cycle prototype for jacket cooling water heat recovery. Energy 2021, 228, 120596. [Google Scholar] [CrossRef]
  52. Hendricks, E. Mean value modelling of large turbocharged two-stroke diesel engines. SAE Trans. 1989, 98, 986–998. [Google Scholar]
  53. Tang, Y.; Li, H.; Jiang, Y.; Liang, W.; Zhang, J. The Control-Oriented Heat Release Rate Model for a Marine Dual-Fuel Engine under All the Operating Modes and Loads. J. Mar. Sci. Eng. 2023, 11, 64. [Google Scholar] [CrossRef]
  54. Schagerberg, S.; McKelvey, T. Instantaneous Crankshaft Torque Measurements-Modeling and Validation; SAE Technical Paper; SAE International: Warrendale, PA, USA, 2003. [Google Scholar]
  55. Moore, F.K.; Greitzer, E.M. A Theory of Post-Stall Transients in Axial Compression Systems: Part I—Development of Equations; ASME: New York, NY, USA, 1986. [Google Scholar]
  56. Theotokatos, G.; Kyrtatos, N.P. Diesel Engine Transient Operation with Turbocharger Compressor Surging; SAE International: Warrendale, PA, USA, 2001; p. 1241. [Google Scholar] [CrossRef]
  57. Zhang, Y.; Xia, C.; Liu, D.; Zhu, Y.; Feng, Y. Experimental investigation of the high-pressure SCR reactor impact on a marine two-stroke diesel engine. Fuel 2023, 335, 127064. [Google Scholar] [CrossRef]
  58. Shi, J.; Zhu, Y.; Feng, Y.; Yang, J.; Xia, C. A Prompt Decarbonization Pathway for Shipping: Green Hydrogen, Ammonia, and Methanol Production and Utilization in Marine Engines. Atmosphere 2023, 14, 584. [Google Scholar] [CrossRef]
  59. Feng, Y.; Qu, J.; Zhu, Y.; Wu, B.; Wu, Y.; Xiao, Z.; Liu, J. Progress and prospect of the novel integrated SOFC-ICE hybrid power system: System design, mass and heat integration, system optimization and techno-economic analysis. Energy Convers. Manag. X 2023, 18, 100350. [Google Scholar] [CrossRef]
  60. Qu, J.; Feng, Y.; Zhu, Y.; Wu, B.; Wu, Y.; Xiao, Z.; Zheng, S. Assessment of a methanol-fueled integrated hybrid power system of solid oxide fuel cell and low-speed two-stroke engine for maritime application. Appl. Therm. Eng. 2023, 230, 120735. [Google Scholar] [CrossRef]
  61. Sapra, H.; Stam, J.; Reurings, J.; van Biert, L.; van Sluijs, W.; de Vos, P.; Visser, K.; Vellayani, A.P.; Hopman, H. Integration of solid oxide fuel cell and internal combustion engine for maritime applications. Appl. Energy 2021, 281, 115854. [Google Scholar] [CrossRef]
  62. Kersey, J.; Popovich, N.D.; Phadke, A.A. Rapid battery cost declines accelerate the prospects of all-electric interregional container shipping. Nat. Energy 2022, 7, 664–674. [Google Scholar] [CrossRef]
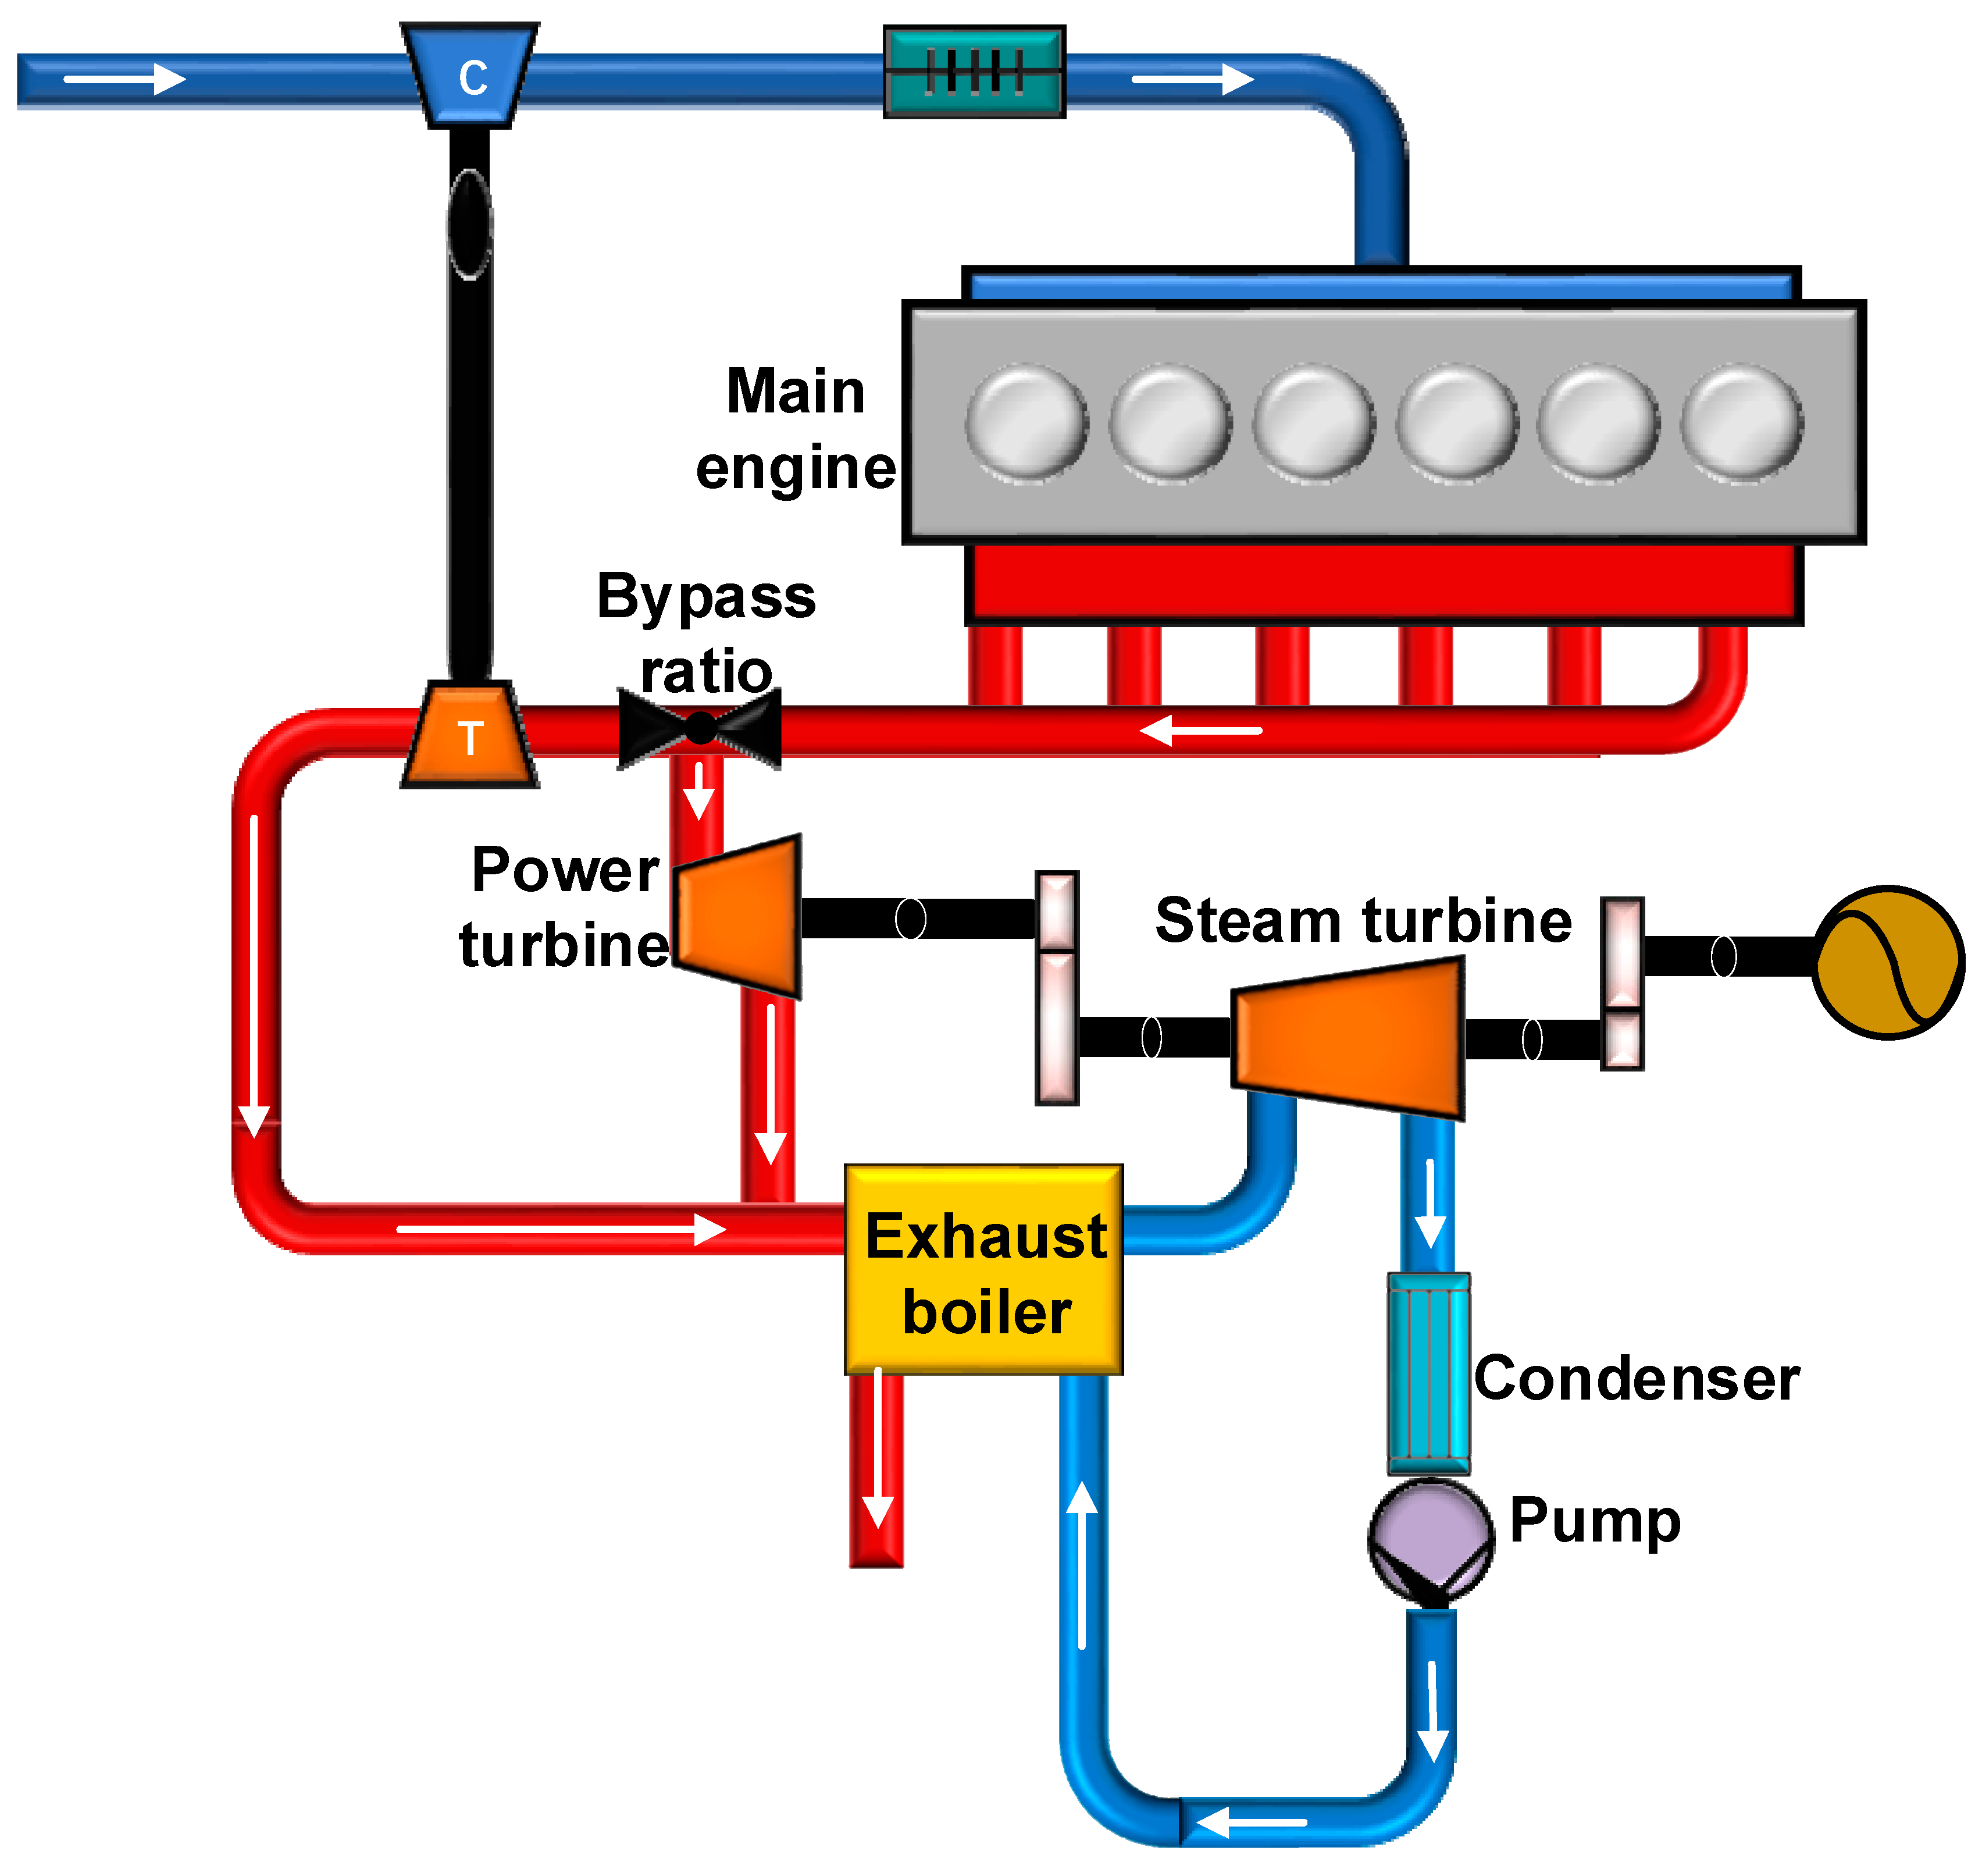
Figure 1. Tuning engine with a bypass valve layout This study established a semi-empirical formula for exhaust gas bypass ratio related to air excess ratio and turbocharger efficiency, in order to accurately predict the exhaust gas bypass ratio and the maximum achievable overall efficiency of high-sulfur emission marine diesel engines. The NOx emissions would limit the bypass ratio unless the air-excess ratio and the turbocharger power were kept constant. Therefore, we have conducted another assessment of the influence of turbocharger efficiency on the aspect ratio. By applying the law of conservation of energy in the matching of the supercharging system with the main engine, and combining empirical correlations of exhaust temperature and air excess ratio, a semi-empirical formula was derived. By using the proposed semi-empirical formula in conjunction with the allowable maximum NOX emissions, the maximum exhaust gas bypass ratio and overall efficiency of the system can be directly calculated. The semi-empirical formula was verified through experimental data and engine models. Then, the impact of varying the exhaust aspect ratio on the overall efficiency of diesel engine systems and ship power generation systems was analyzed. Finally, the potential for reducing EEXI and CII was calculated. The calculation results provide a theoretical basis for the improvement of aging ships attempting to reduce EEXI and CII.
Jmse 11 01215 g001
Figure 2. Relationship of α and C.
Jmse 11 01215 g002
Figure 3. MAPs of TCA-66 turbocharger. (a) Compressor MAP. (b) Turbine MAP.
Jmse 11 01215 g003aJmse 11 01215 g003b
Figure 4. Models of a 6S50ME-C8.2 diesel engine. (a) Model of standard engine. (b) Model of tuning engine.
Jmse 11 01215 g004aJmse 11 01215 g004b
Figure 5. Comparison of the cylinder pressure of the PT-Power and the test engine. (a) 100% load. (b) 75% load; (c) 50% load.
Jmse 11 01215 g005aJmse 11 01215 g005b
Figure 6. Comparisons between the values calculated by the theory formula and data provided by MAN. (a) The calculated value corresponds to the given value of MAN-1. (b) The calculated value corresponds to the given value of MAN-2.
Jmse 11 01215 g006
Figure 7. Comparison between the given and calculated values with MAN and Win GD(Wartsila) under different loads. (a) 6S50, (b) 6S50, (c) W8X82_B, (d) 9X82.
Jmse 11 01215 g007
Figure 8. Comparison of the simulated experimental values with the calculated values. (a) The calculated value is compared with the Experimental (or simulation) value at 85% load. (b) The calculated value is compared with the experimental (or simulation) value at 100% load.
Jmse 11 01215 g008
Figure 9. The peak available bypass ratio vs turbocharging efficiency with different air excess ratios.
Jmse 11 01215 g009
Figure 10. Influence of the bypass ratio on a diesel engine. (a) Influence of bypass ratio change on air excess ratio under different turbocharging efficiency. (b) Influence of bypass ratio change on WHRS inlet temperature under different turbocharging efficiency.
Jmse 11 01215 g010
Figure 11. Influence of bypass ratio and turbocharging efficiency on diesel engine system efficiency. (a) The impact of waste heat recovery efficiency on overall system efficiency. (b) The impact of turbocharger efficiency on overall system efficiency. It is proposed that WHRS efficiency be set by 20%.
Jmse 11 01215 g011
Figure 12. EEXI and CII indicators of the two types of carrier (6S50).
Jmse 11 01215 g012
Figure 13. EXI and CII indicators of the two types of tanker (W8X82).
Jmse 11 01215 g013
Table 1. Main parameters of main engine.
ParameterValue
Diesel typeMAN & Turbo 6S50ME-C8.2
Cylinder number6
Bore [mm]500
Stroke [mm]2000
Compression ratio21.5
TDC clearance height [mm]135
Rated power [kW]9960
Rated speed [RPM]127
Mean effective pressure [bar]19.97
Turbocharger typeTCA-66
Ignition sequence1-5-3-4-2-6
Table 2. Comparison of simulation data with test data.
Parameter ValueValueValueValueValueValue
Load [%] 1008575555035
Power [kW]Test 997384637478548149823477
Simulation997085237448546550553434
BSFC [g/kWh]Test 185.7181.1182.3183.1183.8192.4
Simulation182.6179.2177.9179.6180.1181.5
ma [kg/s]Test 20.117.216.012.011.47.8
Simulation19.717.115.712.111.48.5
ta [°C]Test 223.1188.7.4174.4137.9130.689.6
Simulation204.2176.9163.5132.7125.193.6
mt [kg/s]Test 18.515.814.711.010.47.2
Simulation18.415.914.611.210.58.2
tT [°C]Test 298.4282.4279.3283276.8300
Simulation278.4274.0261.2264.3265.9257.2
mb [kg/s]Simulation1.791.631.511.181.090.48
Bypass Ratio [%]Simulation8.9%9.3%9.4%9.5%9.4%5.5%
Table 3. Data of an old bulk ship.
ParameterValue
Ship typeBulk Carrier
Loa [m]199.94
Weight (DWT)58,000
Capacity [m3]72,800
Lpp [m]194
Vref [kn]14
M/E6S50ME-C
Maximum continuous rating [kW]9480
diesel-generator [kW]373 (3set)
emergency generator [kW]91
Table 4. Data of a tanker.
ParameterValue
Ship typeTanker
Loa [m]333
Weight(DWT)295,000
Capacity [m3]357,000
Lpp [m]319
Vref [kn]16.2
M/EW8X82-B
Maximum continuous rating [kW]38,000
diesel-generator [kW]980 (3set)
emergency generator [kW]290
Table 5. Comparison NOx of EEXI(6S50).
ParameterValueValue
ModelOriginal diesel engineTuning engine with RC
NOx emissions [g/kWh]11.3612.65
Disclaimer/Publisher’s Note: The statements, opinions and data contained in all publications are solely those of the individual author(s) and contributor(s) and not of MDPI and/or the editor(s). MDPI and/or the editor(s) disclaim responsibility for any injury to people or property resulting from any ideas, methods, instructions or products referred to in the content.