Article

Investigation of Vortex-Induced Vibration of Double-Deck Truss Girder with Aerodynamic Mitigation Measures

1
Key Laboratory of New Technology for Construction of Cities in Mountain Area, School of Civil Engineering, Chongqing University, Chongqing 400045, China
2
Chongqing City Infrastructure Construction Investment Co., Ltd., Chongqing 400014, China
*
Author to whom correspondence should be addressed.
J. Mar. Sci. Eng. 2023, 11(6), 1118; https://doi.org/10.3390/jmse11061118
Submission received: 8 May 2023 / Revised: 22 May 2023 / Accepted: 24 May 2023 / Published: 25 May 2023
(This article belongs to the Special Issue Computational Fluid Dynamics in Marine Environments)

Abstract

:
The long-span double-deck truss girder bridge has become a recommend structural form because of its good performance on traffic capacity. However, the vortex-induced vibration (VIV) characteristics for double-deck truss girders are more complicated and there is a lack of related research. In this research, wind tunnel tests were utilized to investigate the VIV characteristics of a large-span double-deck truss girder bridge. Meanwhile, the VIV suppression effect of the aerodynamic mitigation measures was measured. Furthermore, the VIV suppression mechanism was studied from the perspective of vortex shedding characteristics. The results indicated that the double-deck truss girder had a significant VIV when the wind attack angles were +3° and +5°. The aerodynamic mitigation measures had an influence on the VIV response of the double-deck truss girder. The upper chord fairing and lower chord inverted L-shaped deflector plate played a crucial role in suppressing VIV. Numerical analysis indicated that vortex shedding above the upper deck or in the wake region may dominate vertical VIV, while vortex shedding in the wake region of the lower deck may dominate torsional VIV. The upper chord fairing and lower chord inverted L-shaped deflector plate disrupted the original vortex shedding pattern in both regions, thereby suppressing VIV. This research can provide a foundation for bridge design and vibration suppression measures for large-span double-deck truss girder bridges.

1. Introduction

Suspension bridges are commonly utilized for their excellent performance in large-span cross-sea bridges [1,2,3]. Rapid development in highway and rail transportation has resulted in new demands for cross-sea bridges, leading to an increase in the construction of double-deck truss girder bridges, such as the Xinhai Bay Bridge and the Beikou Bridge. Truss girders are widely used for road–rail bridges due to their high rigidity and ability to accommodate double bridge decks [4]. However, truss girders consist of numerous discrete components. Wide bridge decks may result in multiple vortexes migrating across the direction of their width [5,6,7]. Furthermore, different components exhibit varying bluff body aerodynamic characteristics, which results in the generation of multi-scale and multi-frequency vortex shedding, thereby complicating the truss girder’s vortex-induced vibration (VIV) performance. Additionally, the distance between certain components varies along the axis of the bridge, causing complicated aerodynamic disturbance. Consequently, evaluating the VIV performance of double-deck truss girders in the complex marine environment is more challenging than that of other girders and requires a more thorough investigation.
VIV has dual characteristics of self-excited and forced vibration [8]. While VIV generally limits amplitude, it occurs frequently and for extended periods even at low wind speeds. This phenomenon may cause fatigue damage to the structure, and an excessive amplitude may also jeopardize the safety of traffic on the bridge [9,10,11,12,13]. Several bridges, such as the Xihoumen Bridge [14], the Rio–Niteroi Bridge [15], the Second Severn Crossing Bridge [16], the Humen bridge [17], the Great Belt Bridge [18], and the Trans-Tokyo Bay Crossing Bridge [19], have experienced significant VIV during their use. Therefore, it is essential to analyze VIV and implement vibration mitigation measures for long-span truss girder suspension bridges [20,21].
Currently, there are four primary research methods for investigating VIV in suspension bridges: theoretical analysis [22], field measurements [
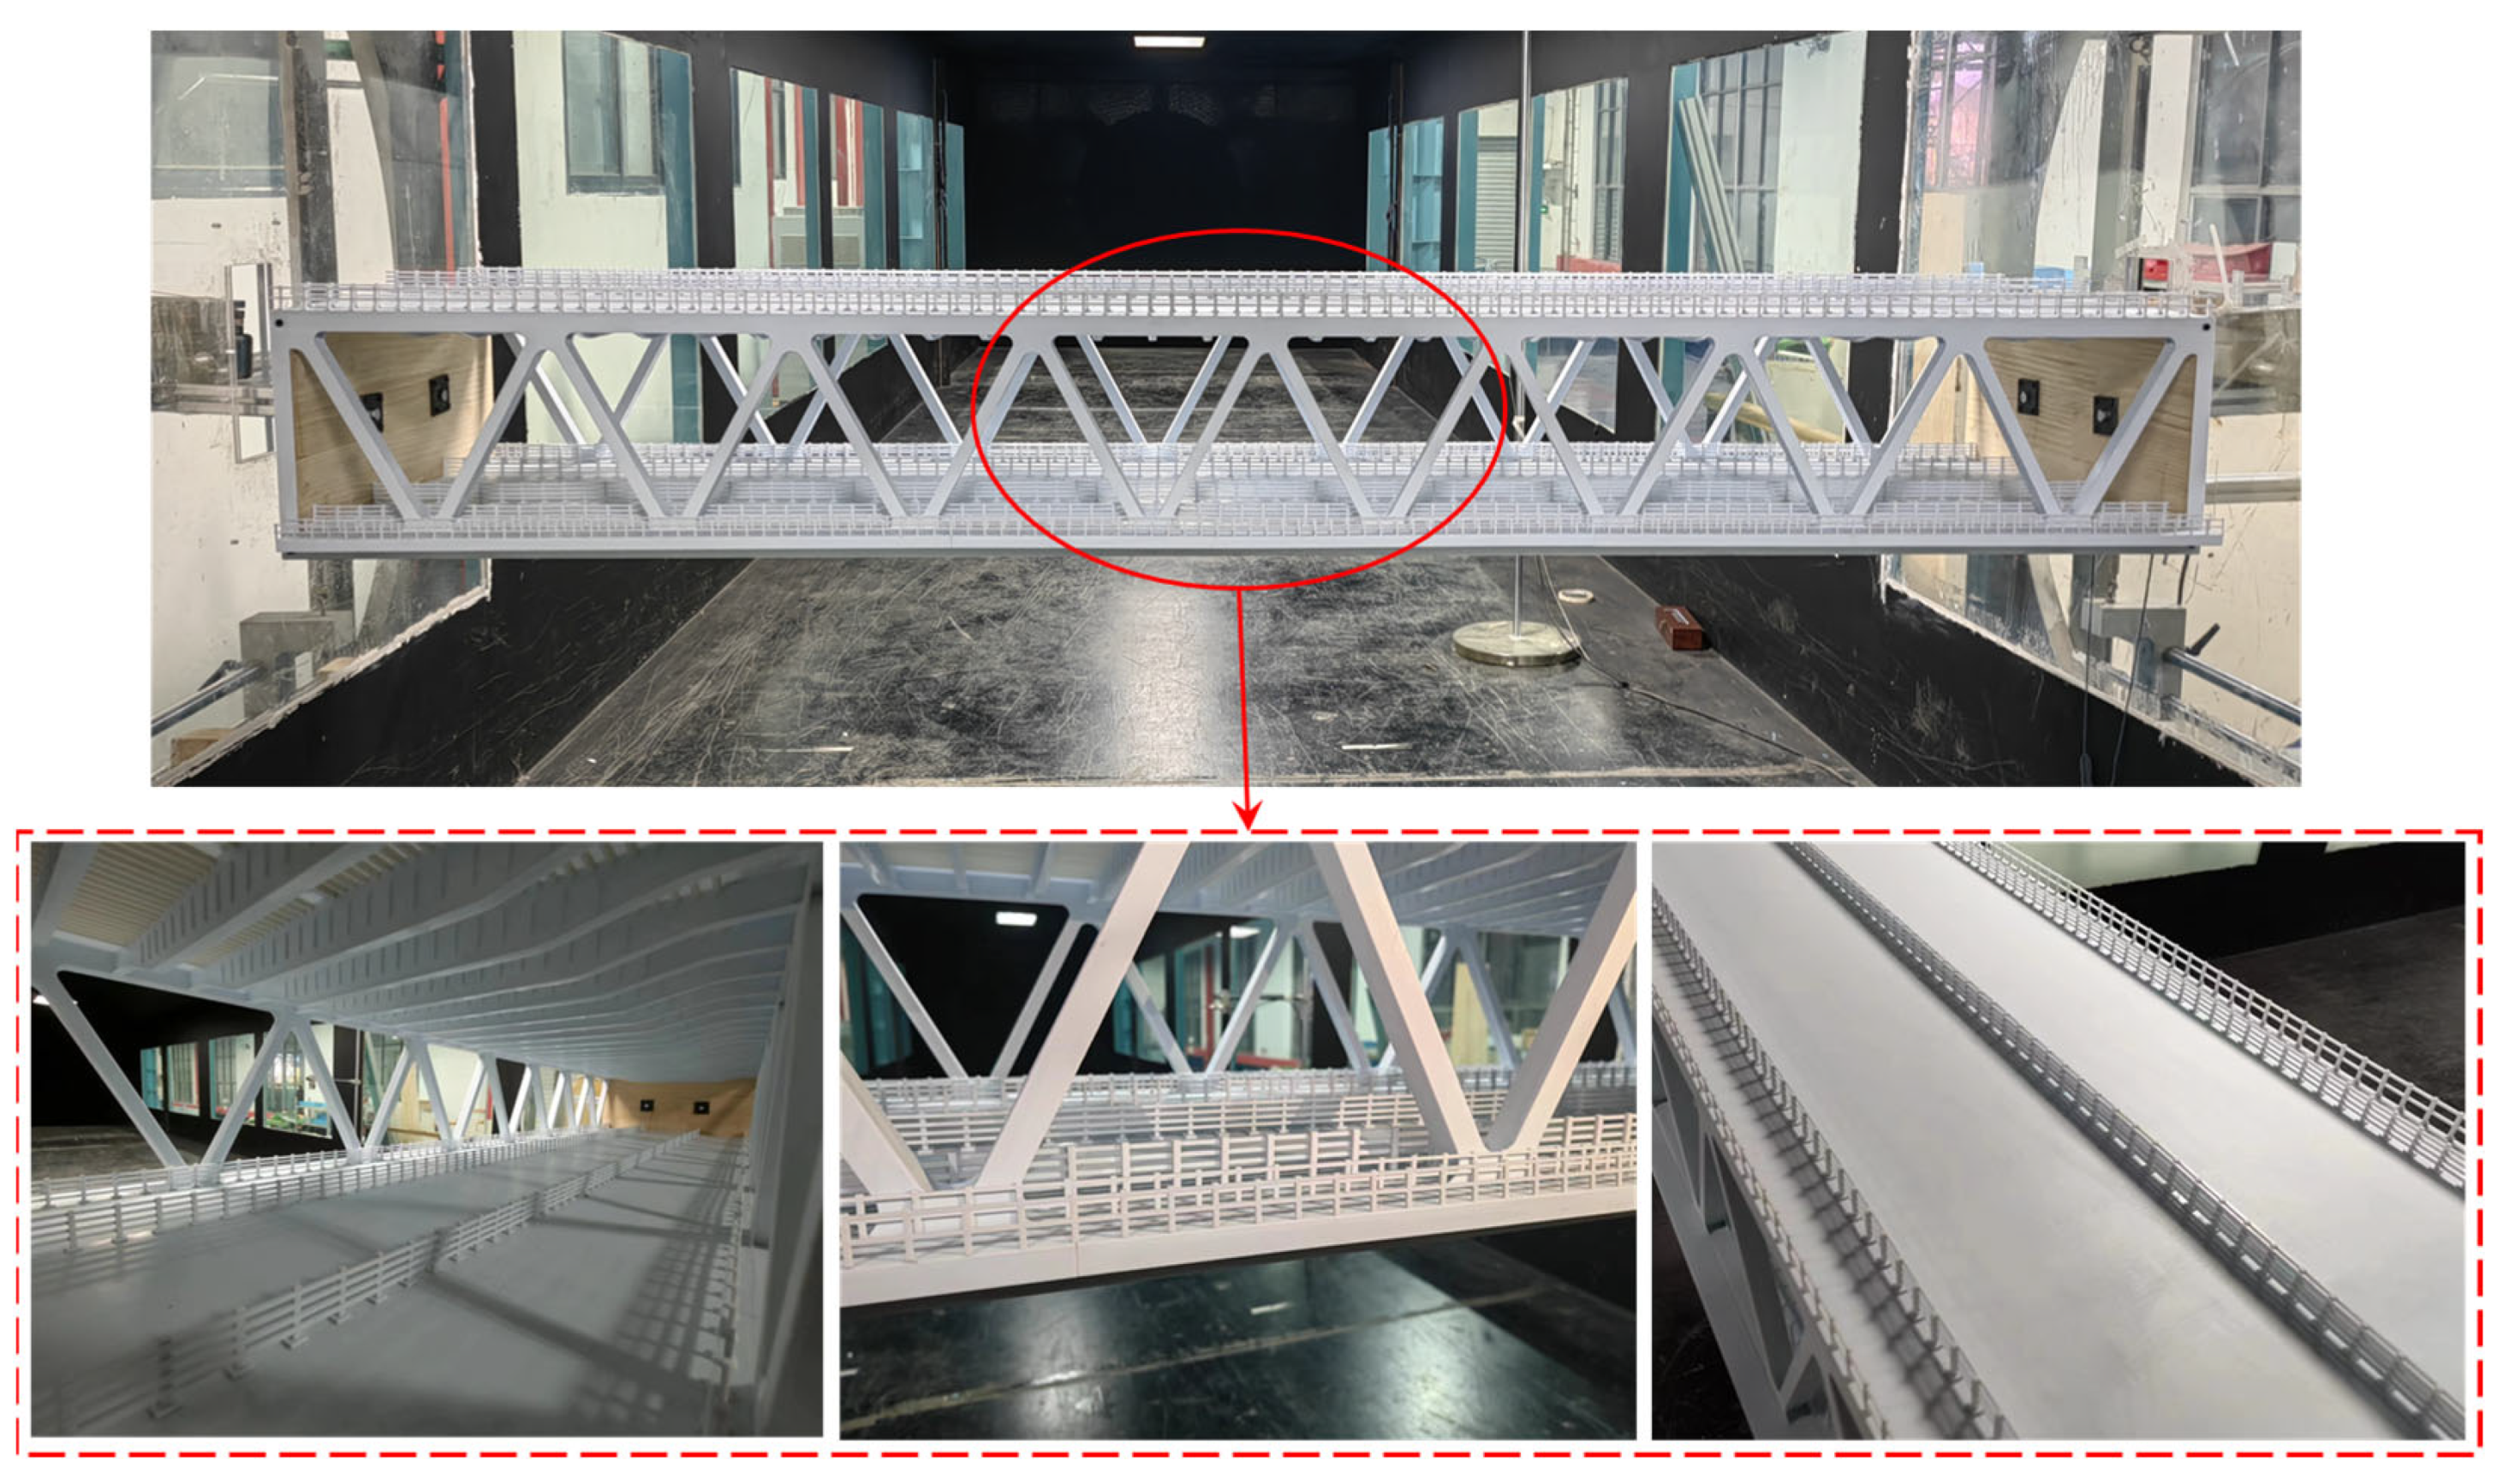
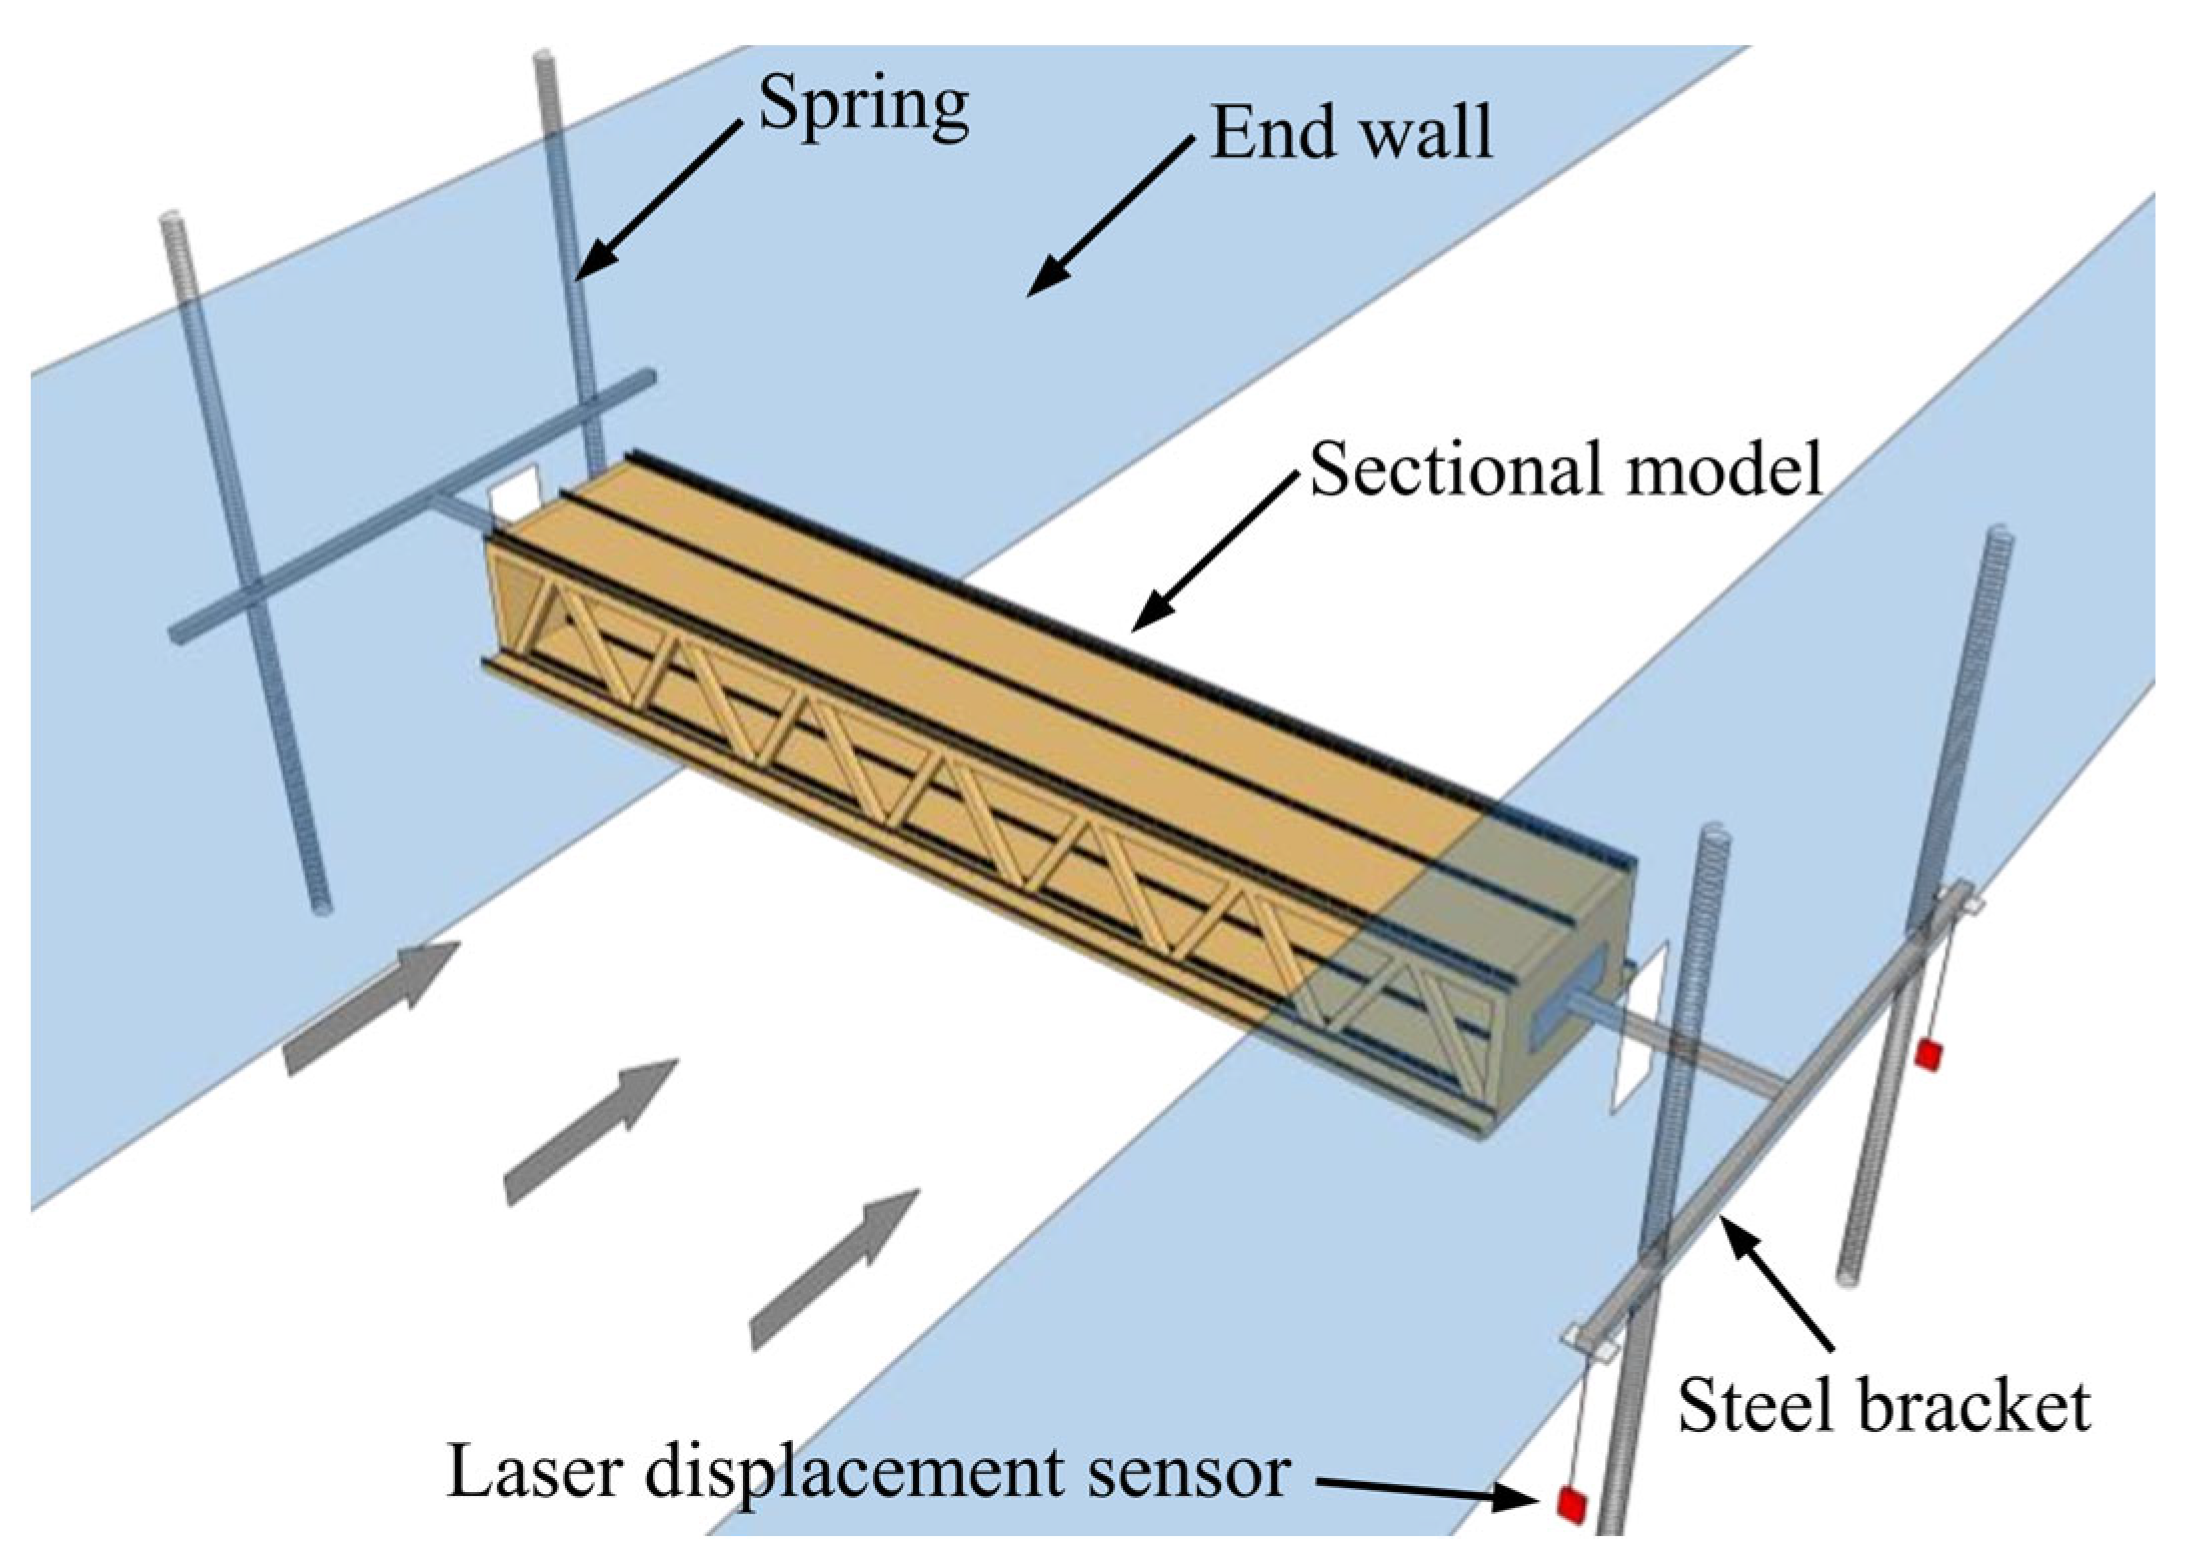
23], wind tunnel tests [24], and numerical simulations [25]. Wind tunnel tests and numerical simulations are the most commonly employed methods. Wind tunnel tests are widely used to simulate the fluid–structure coupling phenomenon of VIV via replicating the wind characteristics and structural dynamic behavior of the atmospheric boundary layer. The dynamic response of sectional models is measured using displacement sensors, accelerometers, and novel optical testing techniques such as digital image correlation (DIC) and three-dimensional laser Doppler velocimetry (3DLDV) [26]. With the advancement of computer technology, numerical simulations can accurately obtain the dynamic characteristics, aerodynamic forces, and flow field properties of bridge structures, making significant contributions to the study of VIV mechanisms. In wind tunnel tests, particle image velocimetry (PIV) can be utilized to obtain the flow field characteristics around the girder, which can serve as a useful cross-check for simulation results [27].
Vibration suppression measures that are commonly used include aerodynamic, mechanical, and structural measures [28,29,30,31,32]. Aerodynamic mitigation measures promote the aerodynamic performance of a girder by altering its shape [33]. Due to their economic, aesthetic, safety, and high reliability advantages, they are widely used in bridge wind engineering [34,35,36,37]. Currently, two methods are used to suppress VIV through aerodynamic measures. The first is to optimize the girder’s original cross-section shape by modifying the guardrail ventilation rate and maintenance track position, etc. The second is to install aerodynamic mitigation measures such as inverted L-shaped deflector plates, fairings, stability plates, and spoiler plates, etc. Although various aerodynamic mitigation schemes exist, more accurate and universally applicable application rules are needed. In practical engineering applications, it is necessary to verify their effectiveness through wind tunnel tests.
Research on the VIV of bridges has mainly focused on box girders and Π-shaped girders. Zhan et al. [38] discovered that the wave barrier has a three-dimensional disturbance effect on the box girder’s wake, which can be used to suppress its VIV. Nagao et al. [39] found that shape factors, such as the position and size of guardrails, significantly influence the sectional VIV performance. Bai et al. [40] investigated the impact of aerodynamic mitigation measures, such as installing a fairing, L-shaped inverted edge plate, central stability plate, and horizontal spoiler plate, on the VIV characteristics of Π-shaped composite girders with different width-to-height ratios. Liu et al. [41] studied the VIV performance of large-span road–rail bridges with two separated parallel decks and found that adjusting fairing angles and installing handrail sealing at intervals can effectively control VIV. Although double-deck truss girders are widely used, there is relatively little research focused on their VIV performance. Only Fang et al. [42] discussed the VIV mechanism based on wind tunnel tests and numerical simulations. Additionally, Tang et al. [43] investigated the influence of high vertical stabilizers on the vortex shedding characteristics, and the corresponding aerodynamic mechanism was discussed. Therefore, research in this area should be strengthened to ensure sufficient safety and reliability.
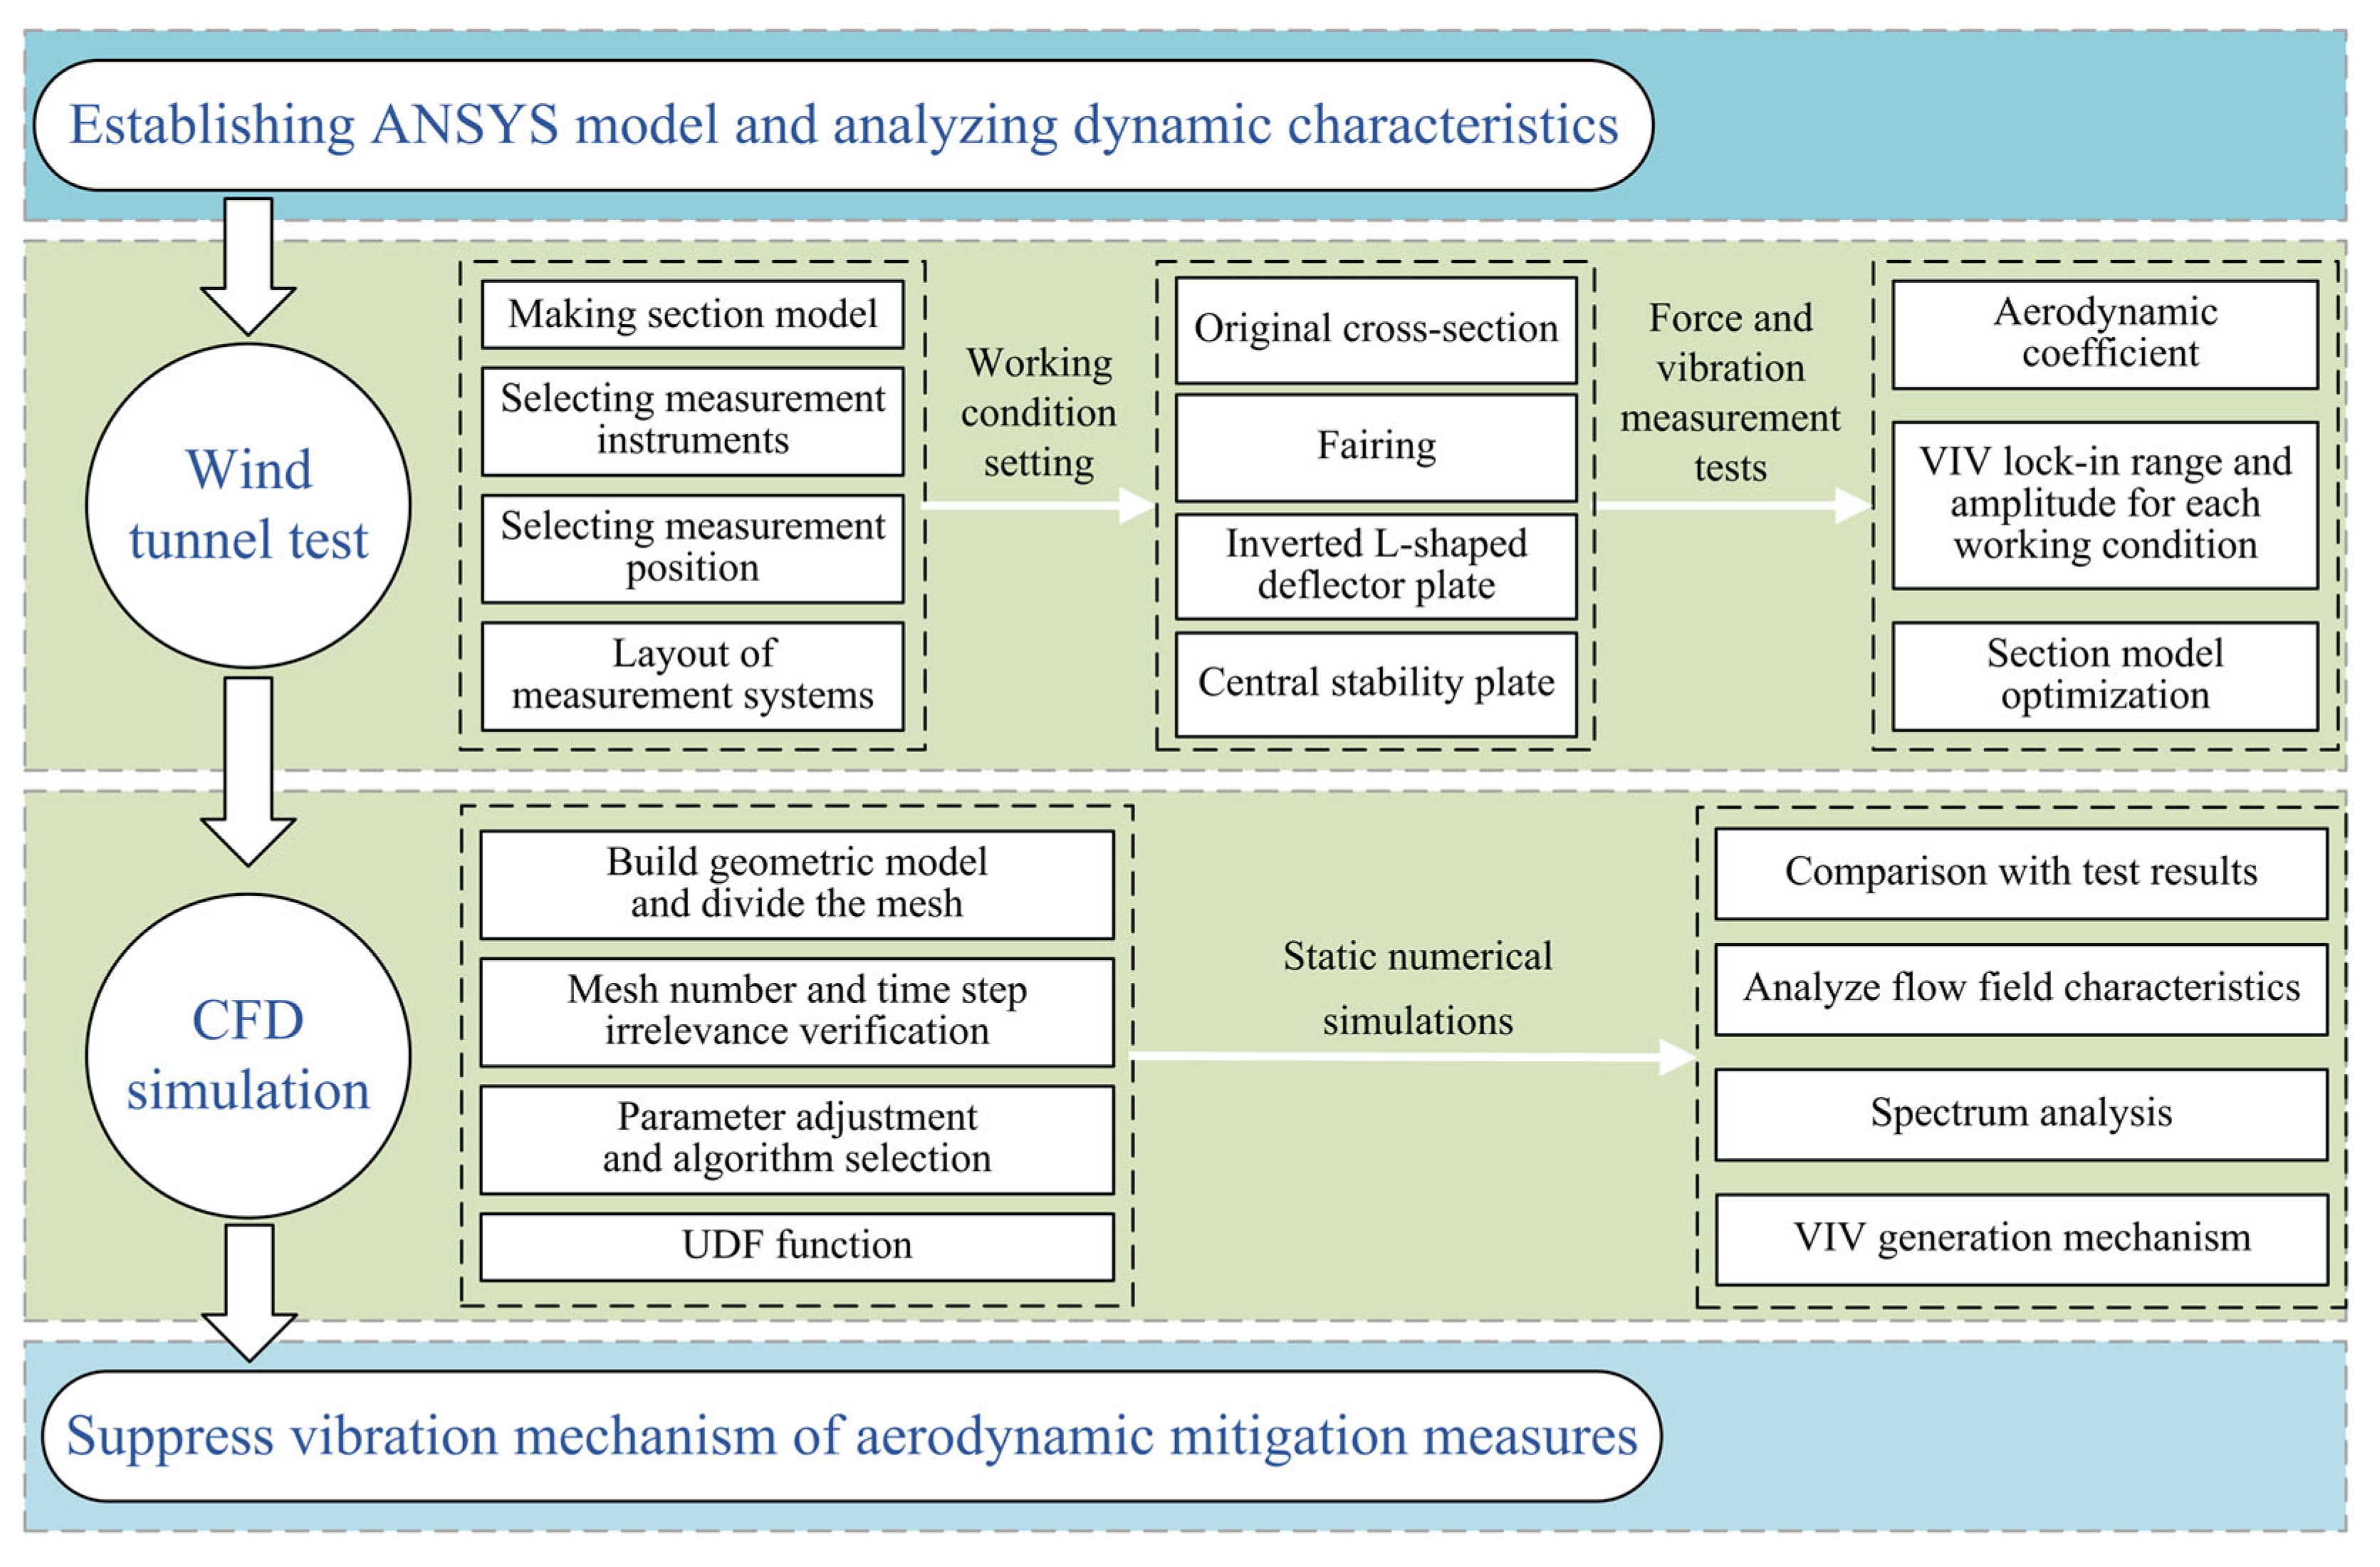
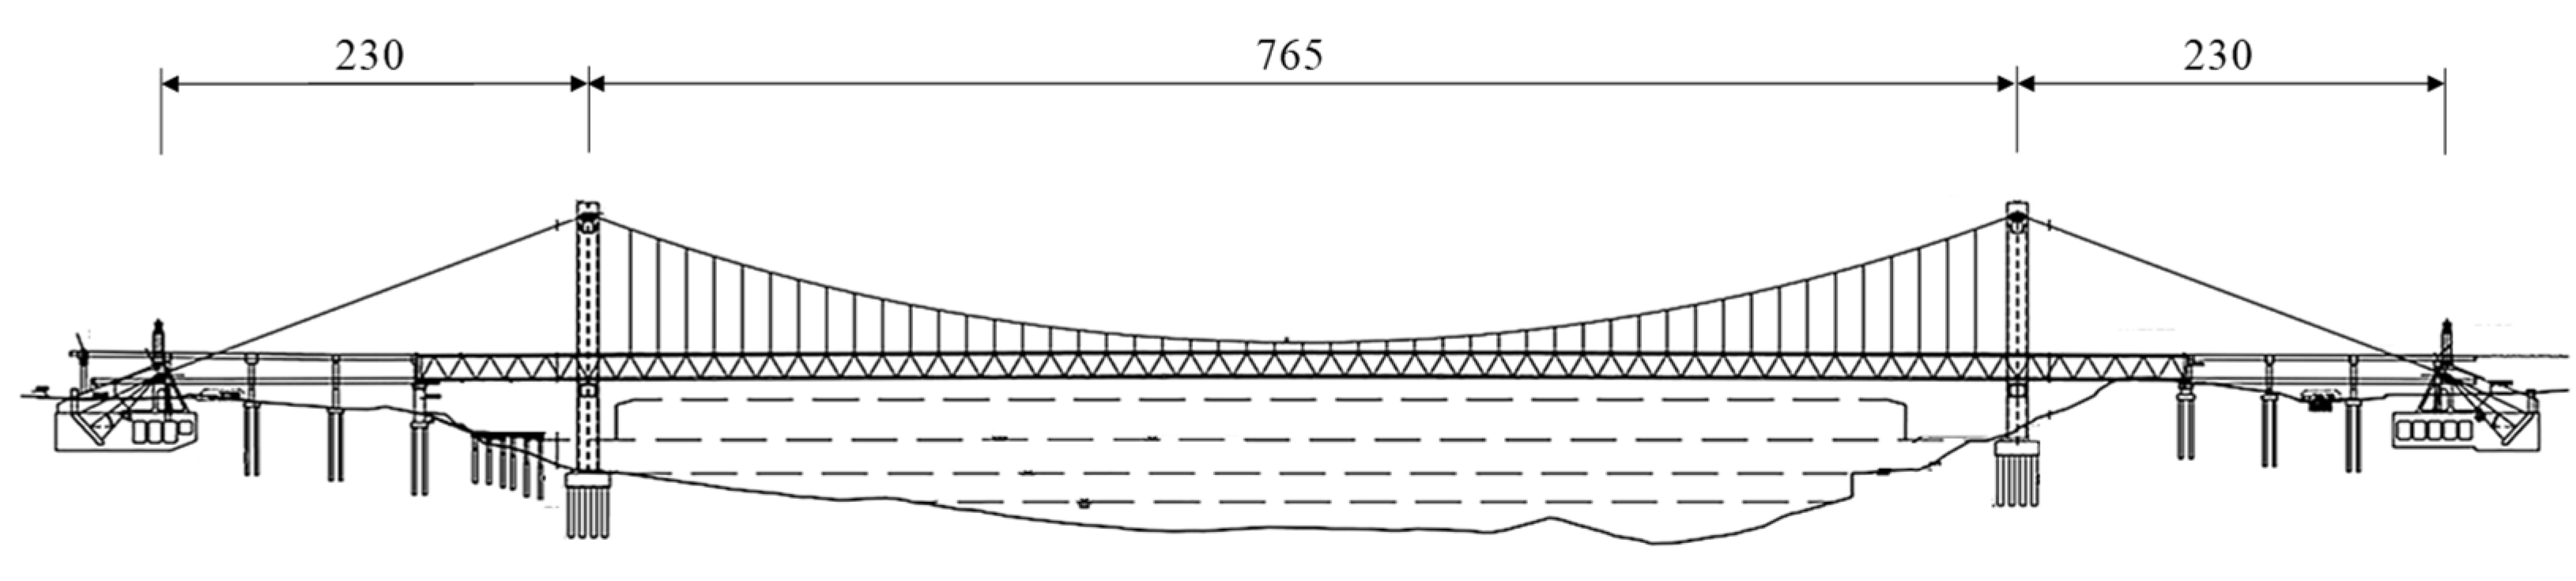
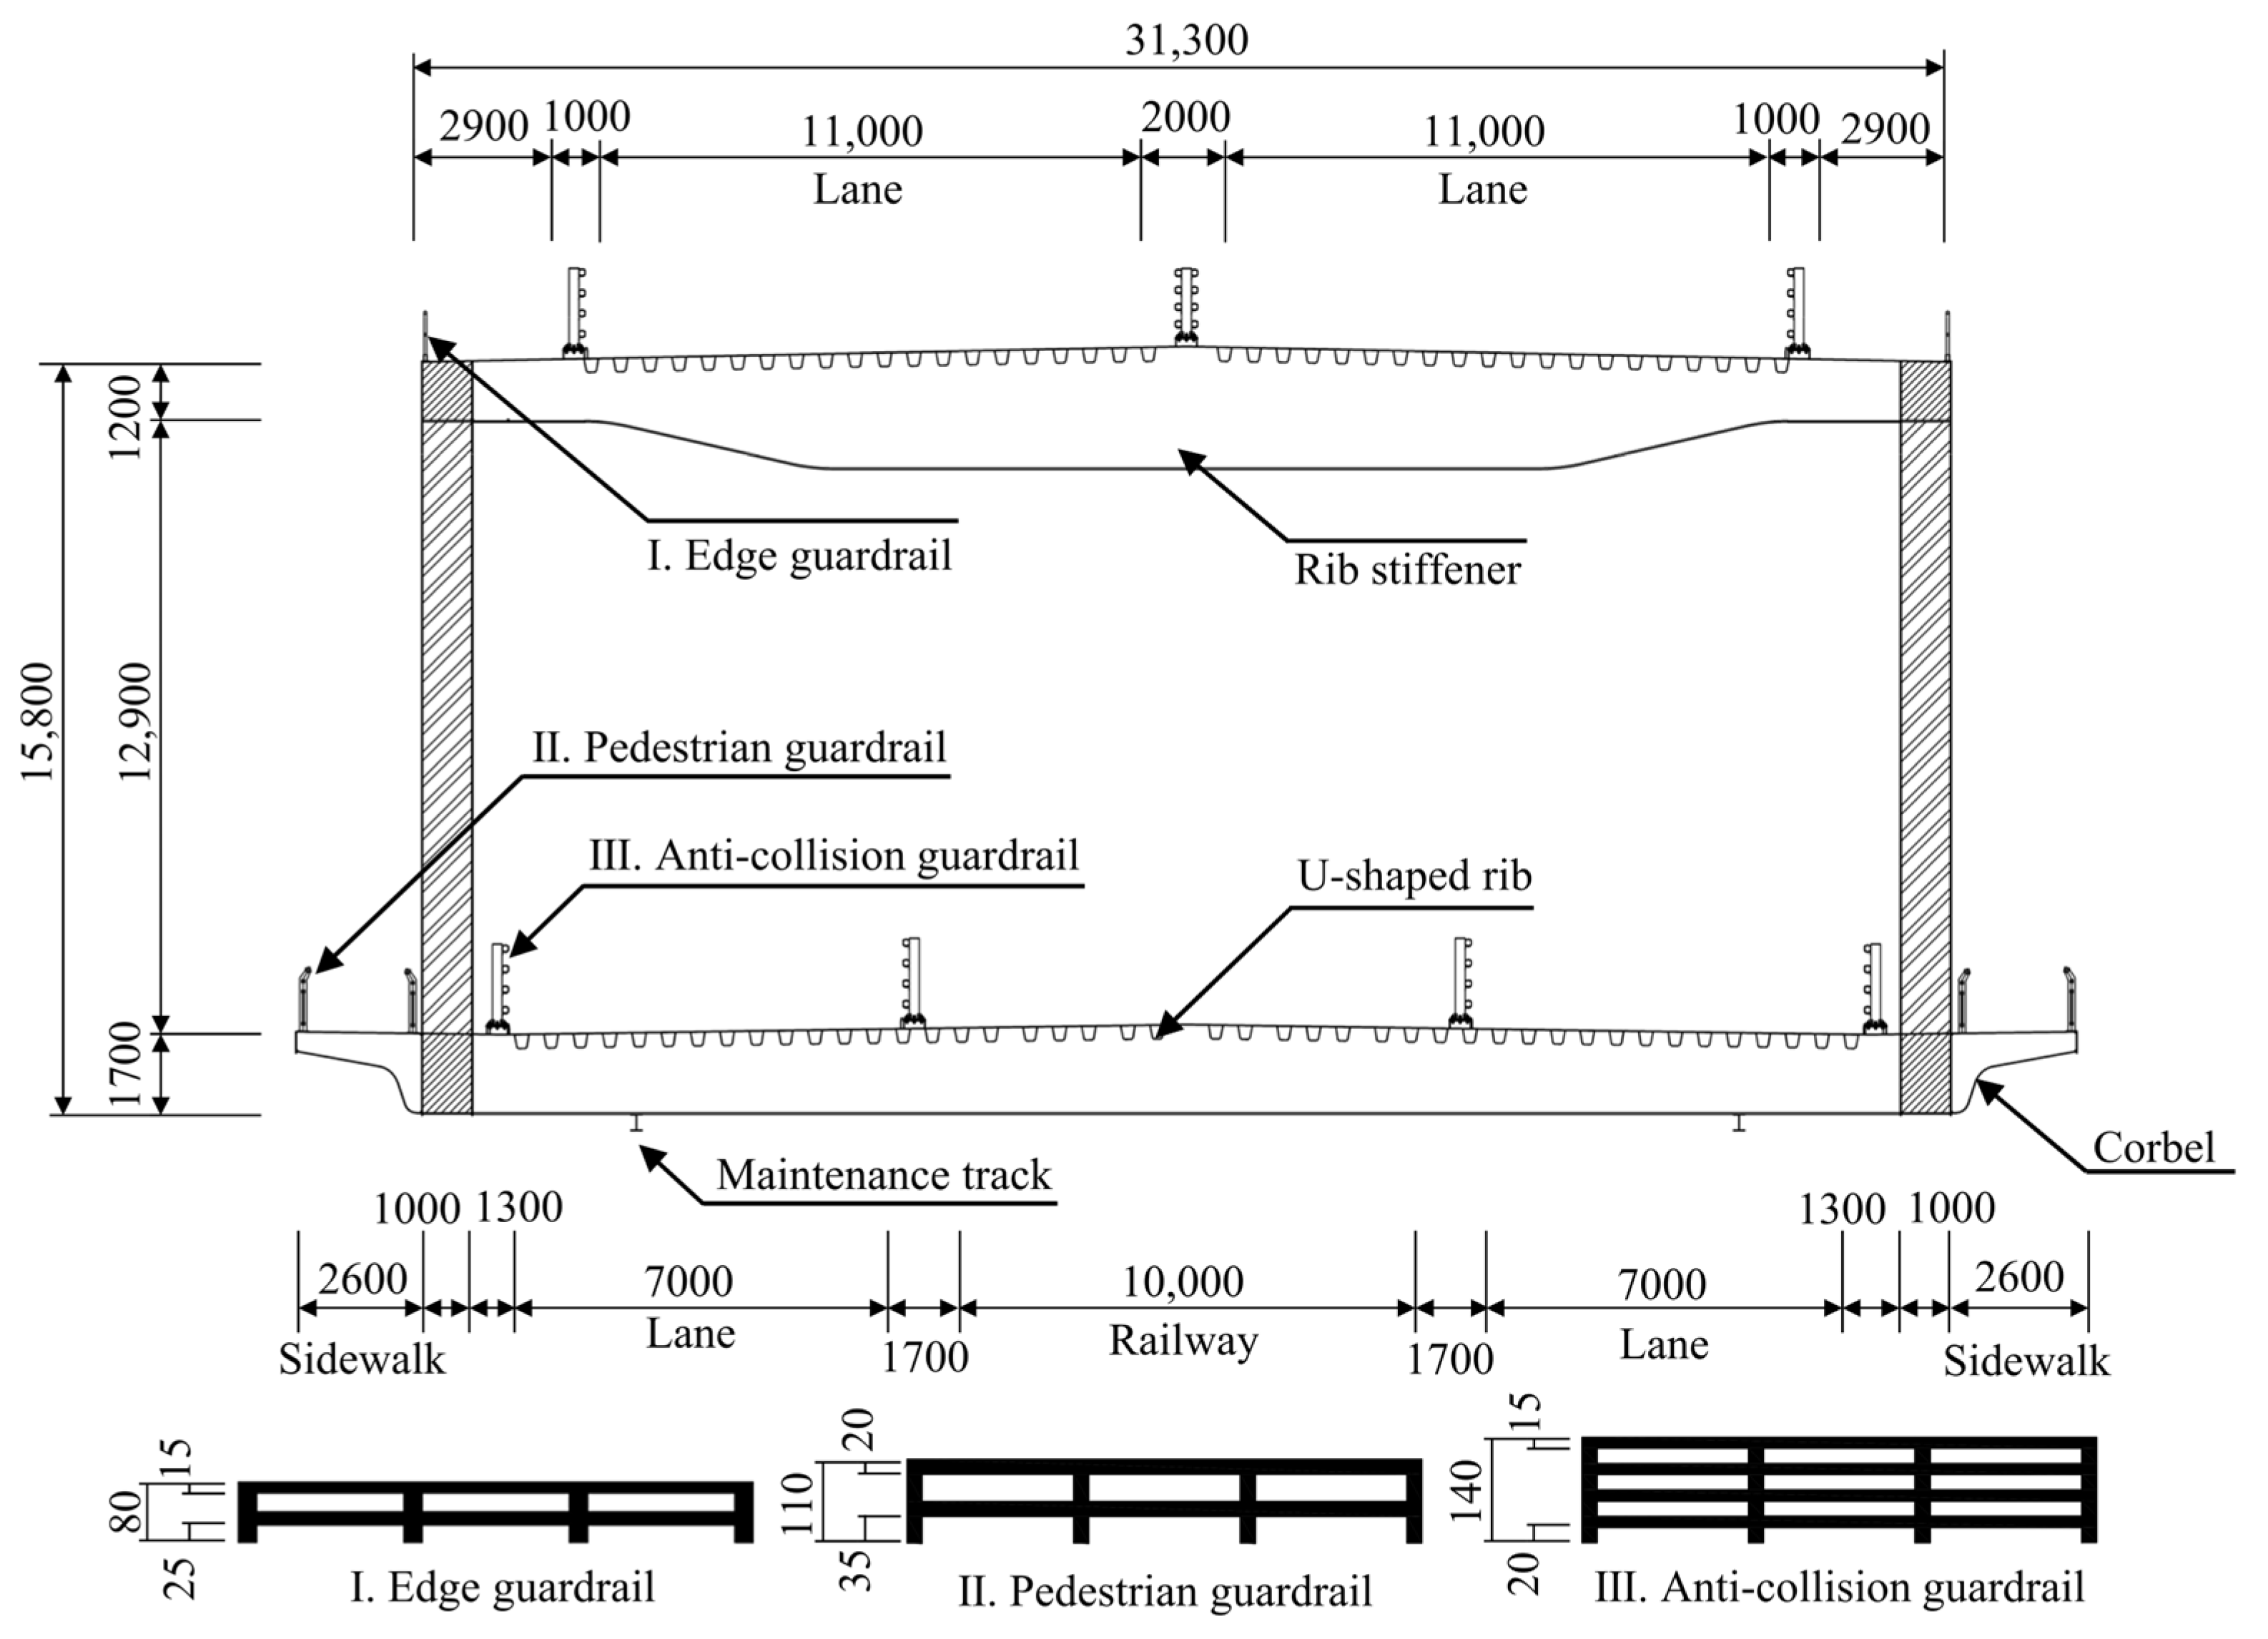
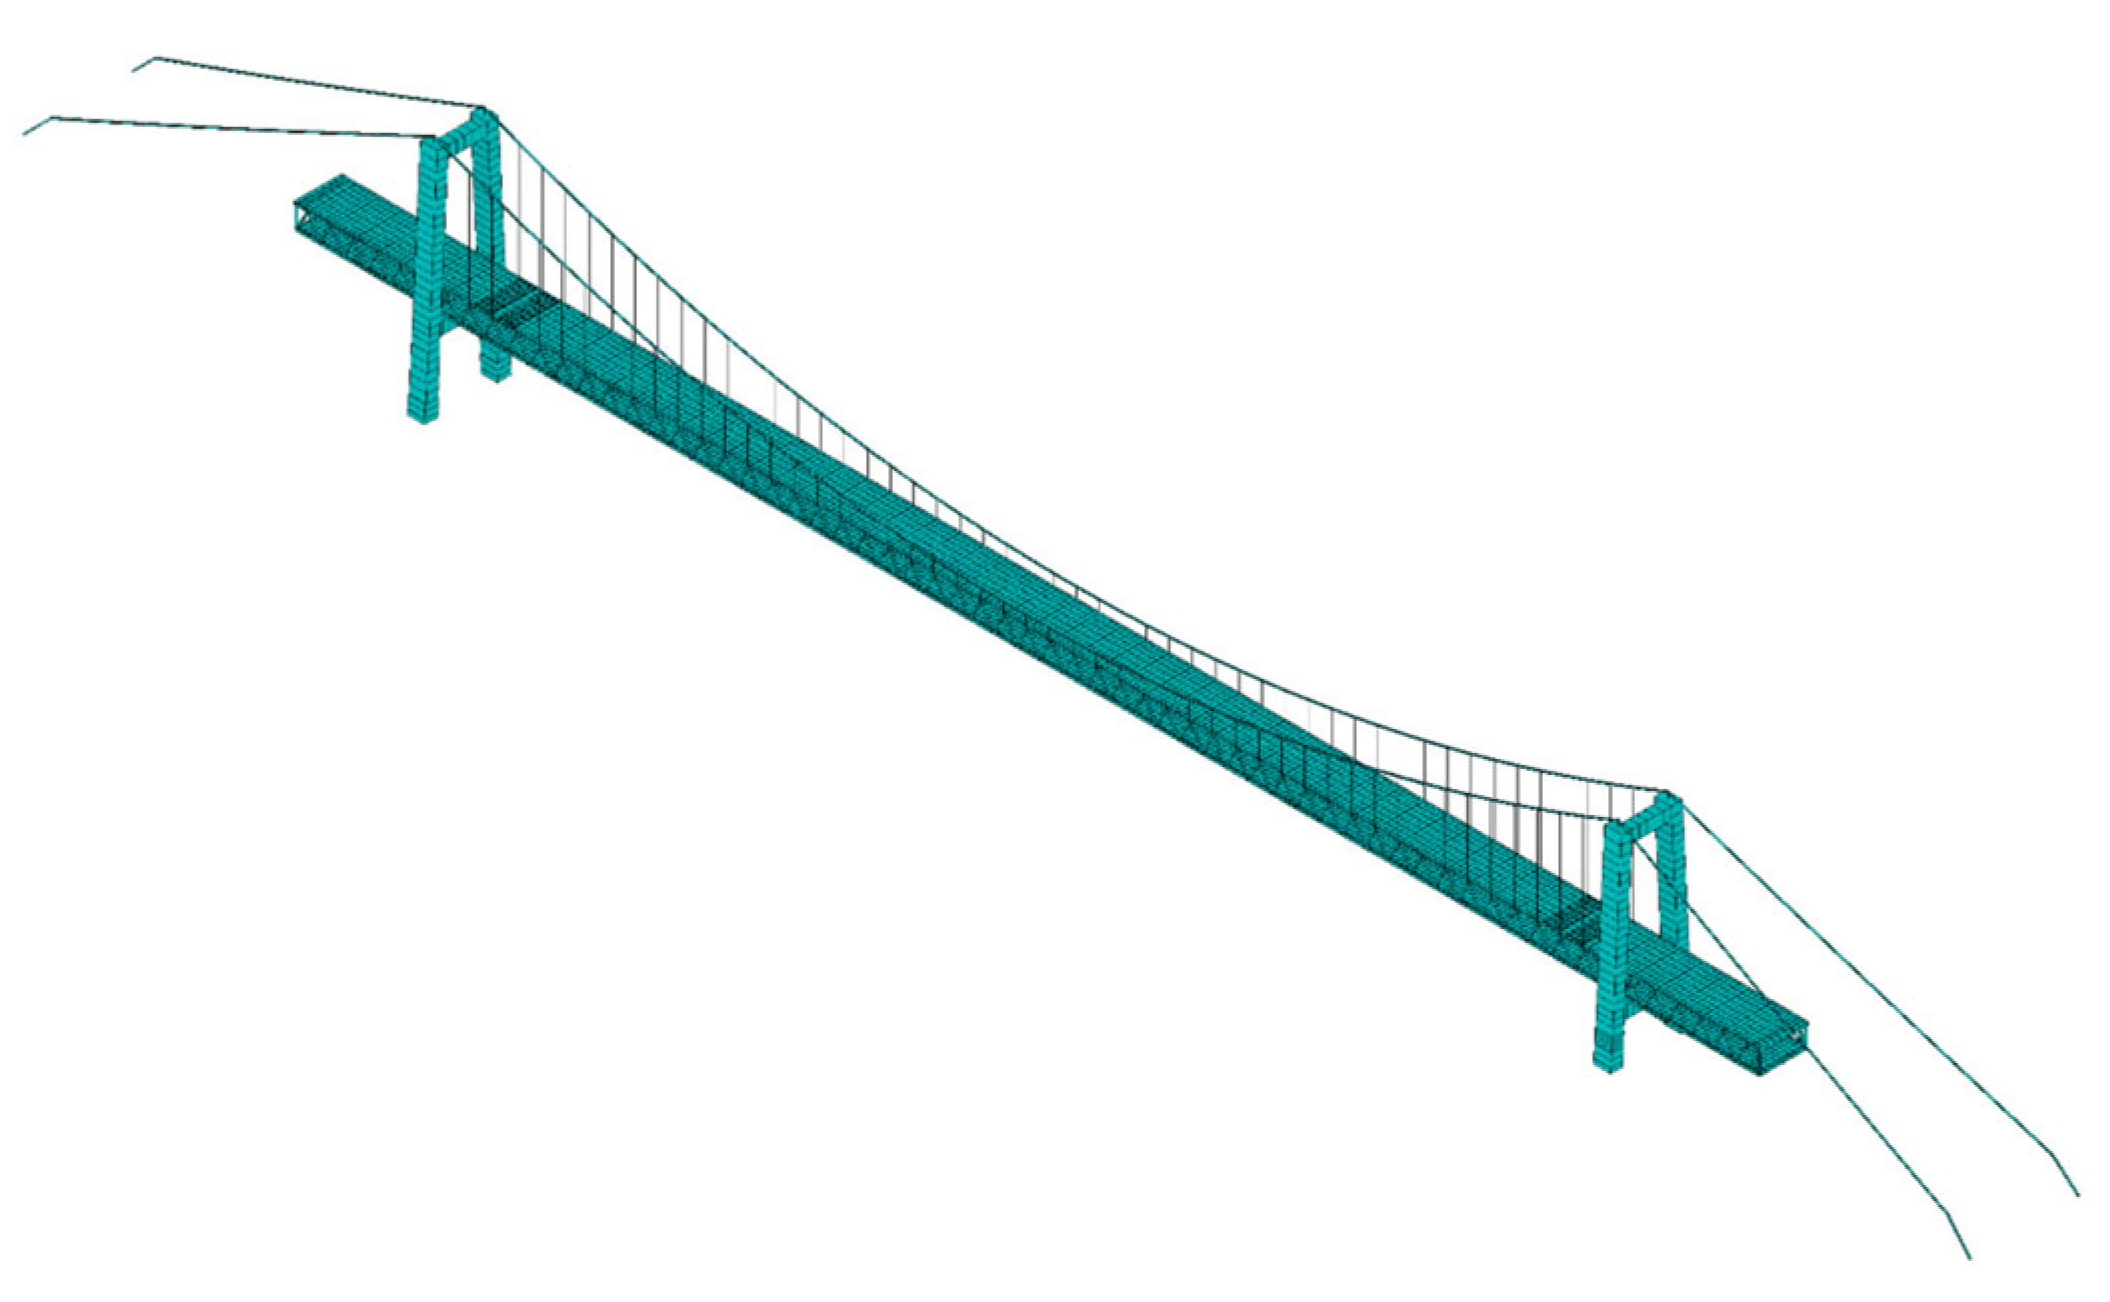
This article investigates the characteristics and cause of VIV on a double-deck truss girder and the effectiveness and mechanism of various aerodynamic mitigation measures. The investigation is based on the engineering background of the Huangjuetuo Yangtze River Bridge and involves employing wind tunnel tests and numerical simulations. The article is organized as follows: Section 2 provides an overview of the bridge’s structural dynamic characteristics. Section 3 investigates the VIV responses of the truss girder and the vibration suppression effect of aerodynamic mitigation measures on a sectional model through wind tunnel tests. Section 4 analyzes the causes of VIV through investigating vortex shedding characteristics using numerical simulations, and explores the vibration suppression mechanism of aerodynamic mitigation measures. Figure 1 depicts the methodology diagram of this paper.

2. Overview of the Target Bridge

2.1. Engineering Background

The Huangjuetuo Yangtze River Bridge is a crucial control project of the Yu Chang Highway’s double-track connecting road with a double-deck layout. The upper deck has six bidirectional lanes, and the lower deck has two bidirectional railroads at the center, with four bidirectional lanes and sidewalks on both sides. The target bridge is a double-deck truss girder suspension bridge supported by two towers with three-span continuous and one-span suspension. Its total length is approximately 945 m, and the main span is 765 m long, as depicted in Figure 2. The cross-section varies slightly along the bridge axis, except for the web members. Therefore, the bridge has a relatively uniform aerodynamic appearance. Figure 3 depicts the standard cross-section of the bridge.

2.2. Structural Dynamic Characteristics

To ensure the rationality and accuracy of the experimental model in the tests, it was crucial to analyze its dynamic characteristics before testing. This analysis includes obtaining results on its frequency, vibration pattern, equivalent mass, and other relevant factors. In this investigation, a three-dimensional (3D) finite element model was established using the finite element software ANSYS to calculate the suspension bridge’s structural dynamic characteristics, as depicted in Figure 4. The truss girder was simulated using a combination of plate shell and beam elements. The suspenders and main cables were simulated using Link8 elements, while the remaining main parts such as the bridge deck, main tower, and diaphragm were simulated using Beam4 elements. Other affiliated members, including guardrails and maintenance vehicle tracks, etc., were simulated using Mass21 elements. Link8, Beam4 and Mass21 are the most commonly used elements in 3D finite element models with nodal degrees of freedom in the Ux, Uy and Uz directions [44]. The ANSYS modal analysis method was used to solve the bridge’s dynamic characteristics. The dynamic characteristic parameters of its main modals and the allowable values of the VIV amplitude calculated according to the Chinese design specification (JTGT3360-01-2018) [45] are shown in Table 1.
In general, the allowable values for VIV are calculated based on the vertical and torsional fundamental frequencies. The allowable value for the vertical VIV amplitude was set at 190 mm, while the torsional VIV amplitude was set at 0.304°. Other admissible amplitude values were obtained as reference values.

3. Sectional Model Wind Tunnel Tests

3.1. Outline of Experimental Procedure

Wind tunnel tests are commonly utilized for wind-induced vibration investigations of large-span bridges [46,47]. The experiments were conducted with a smooth incoming flow at the wind tunnel laboratory of Chongqing University. The straight-flow wind tunnel consists of the intake section, stability section, contraction section, test section, power section, and exit section, as shown in Figure 5. The test section measured 2.4 m (width) × 1.8 m (height) × 15.0 m (length). The wind speed could be continuously regulated from 0.50 to 35.00 m/s, with the turbulence intensity being less than 0.50% of the target wind speed.
In this investigation, the experimental model’s ratio of the geometric scale to that of the actual bridge was 1:55. Wind tunnel tests require not only geometric similarity between the model and the actual bridge but also consistency in the vertical-to-torsional frequency ratio and damping ratio [48]. The test sectional model’s aerodynamic shape strictly followed that of the target bridge, as shown in Figure 6. In addition, Table 2 presents the main design parameters of the model. Endplates were unnecessary due to the model’s aspect ratio exceeding four. The model’s vertical and torsional frequencies were 2.22 Hz and 5.03 Hz, with vertical and torsional damping ratios of 0.27% and 0.41%.
A suspension system was designed to ensure the vertical and torsional vibration of the sectional model during the test, as depicted in Figure 7. The sectional model was fixed to two steel special brackets, which were suspended by eight linear tension springs in the spring-suspended sectional model (SSSM) system. The counterweights simulated the mass and mass moment of inertia. Moreover, the springs provided vertical and torsional stiffness to the system, allowing the sectional model to simulate the vibration characteristics of the two directions, vertical and torsional, accurately. Additionally, the vertical and torsional vibrations of the truss girder were independent. To reduce the ratio of the actual wind speed to the test wind speed, springs with relatively high stiffness were used, resulting in a ratio of 4.48. Two Keyence LK-G155 laser displacement sensors were used to record the dynamic response of the sectional model with a sampling frequency of 1000 Hz [49]. Uniform flow wind speed was measured using an Australia TFI series 100 cobra probe [50]. Additionally, the aerodynamic forces were measured using the high-frequency force balance of the model ATI SI-130-10 [51].
Figure 8 shows the wind attack angle, α, of the incoming flow and the positive directions of the drag force, FH, lift force, FV, and pitching moment, FM, used in this investigation. The aerodynamic mitigation measures included inverted L-shaped deflector plates with a width-to-height ratio of 0.5, 40° pointed fairings, and a central stability plate. The specific working condition settings are presented in Table 3. The experimental wind speed ranged from 0 to 10.0 m/s, with a wind speed loading amplitude of 0.2 m/s, which was reduced to 0.1 m/s when VIV was observed.
The upper chord fairing and inverted L-shaped deflector plate were symmetrically installed on both sides of the upper deck along the longitudinal direction of the truss girder. The lower chord inverted L-shaped deflector plate was symmetrically set along the lower chord, and modified from the original sidewalk corbels. Since the sidewalk corbel was initially considered a fairing, no additional fairing was installed on the lower chord. The central stability plate was arranged along the center of the upper deck in the longitudinal direction. Figure 9 shows the schematic diagrams of the shape and position of the aerodynamic mitigation measures for each working condition, and Figure 10 shows the experimental models.

3.2. VIV Responses of Original Cross-Section

Wind tunnel tests were adopted in the sectional model to investigate the VIV performance for the truss girder under five wind attack angles. Significant VIV was observed at the +3° and +5° wind attack angles. The displacement root mean square (RMS) values of the VIV versus those of the wind speed, U, are shown in Figure 11 and correspond to those of the real situation. Two forms of VIV were observed during the test: vertical VIV and torsional VIV. Both forms of vibration appeared in sequence, with vertical VIV occurring first, followed by torsional VIV. The vertical VIV had a lock-in range with a significant amplitude, and the torsional VIV had a minor and a major lock-in range with smaller and larger amplitudes, respectively. Compared to the wind attack angle of +3°, the maximum amplitude of the vertical VIV was larger at +5°, the onset wind speed was earlier, and the lock-in range was longer, making it more susceptible to vertical VIV at a low wind speed. For the torsional VIV, the maximum amplitude of the minor lock-in range did not show significant changes at +5°, but the onset wind speed was significantly delayed. The maximum amplitude of the major lock-in range was larger, the onset wind speed was delayed, and the lock-in range was significantly longer than that of +3°. The amplitudes of both the vertical and torsional VIVs were within the allowable values of 190 mm and 0.304°. No significant VIV was observed at the 0°, −3°, and −5° wind attack angles.
Figure 12 presents the displacement time histories and amplitude spectra of two laser displacement sensors at the peak response points of the VIVs at +3° and +5° wind attack angles, which were used to analyze the vibration frequency of the truss girder when VIV occurred. The maximum vertical VIV occurred at a wind attack angle of +3° with a wind speed of 6.05 m/s and at a wind attack angle of +5° with a wind speed of 6.06 m/s. The two sensors measured time histories with the same phase, and the main frequencies of the vertical vibration were the same at 2.227 Hz, which is close to the vertical frequency of the sectional model. Similarly, the main frequencies of the torsional vibration were the same at the wind attack angles of +3° and +5° with wind speeds of 8.60 m/s and 15.28 m/s, and 9.22 m/s and 16.67 m/s, respectively, both at 4.289 Hz, which is close to the torsional frequency of the sectional model. The two sensors measured the opposite phase of the time histories. This phenomenon demonstrates that the VIV of the girder may be driven by different vortices with the same shedding frequencies. The frequency will be locked when VIV occurs [52].

3.3. VIV Responses of Different Aerodynamic Mitigation Measures

Aerodynamic shape is a crucial factor that affects the VIV characteristics of truss girders. Generally, the aerodynamic performance of the main girder without any aerodynamic measures could be poor. Since the original cross-section did not experience VIV at the 0°, −3°, and −5° wind attack angles, the tests were conducted only at the +3° and +5° wind attack angles to investigate the effect of the aerodynamic mitigation measures. Figure 13 displays the VIV responses of the truss girder with different aerodynamic mitigation measures corresponding to the real situation.
Figure 13 shows that the upper chord fairing and lower chord inverted L-shaped deflector plate had an obvious inhibiting effect on the VIV of the truss girder. After installing the upper chord fairing, the maximum reduction in vertical and torsional VIVs was 69.0% and 39.0% at the +3° wind attack angle, and 54.8% and 49.8% at the +5° wind attack angle, respectively. Similarly, installing the lower chord inverted L-shaped deflector plate reduced the maximum vertical and torsional VIVs by 55.0% and 63.5% at the +3° wind attack angle, and 55.4% and 61.6% at the +5° wind attack angle. The vertical VIV and the minor torsional VIV lock-in ranges were slightly shortened, and the major torsional VIV lock-in range was significantly shortened, with a delay in the onset wind speed. The upper chord fairing was more effective at suppressing vertical VIV, and the lower chord inverted L-shaped deflector plate was more effective at suppressing torsional VIV. However, the upper chord inverted L-shaped deflector plate had a negative impact, deteriorating the aerodynamic performance of the truss girder. The amplitude of both vertical and torsional VIVs increased significantly, with a maximum increase of 24.1% in vertical VIV and of 16.1% in torsional VIV at a +3° wind attack angle and an increase of 23.5% in vertical VIV and of 32.9% in torsional VIV at a +5° wind attack angle. The lock-in ranges were slightly lengthened, and the onset wind speeds were significantly reduced. The central stability plate had little effect on the amplitude of VIV, with only a slight decrease in the amplitude of vertical VIV. The lengths of lock-in ranges remained unchanged, but the onset wind speeds were significantly increased. The Strouhal numbers of the truss girder were calculated to analyze the mechanism of VIV occurrence, using the formula
St = fD/U.
The calculation results are presented in Table 4 [53].

4. Analysis of VIV Mechanism via Numerical Simulations

The vortex shedding characteristics of the truss girder were further investigated to determine the cause of VIV. Due to the complexity of accurately building a 3D model of the truss girder with multiple components, a 2D computational fluid dynamics (CFD) numerical simulation was conducted. Two-dimensional CFD simulations are frequently used to evaluate the aerodynamic performance of structures because of their efficiency and simplicity [54,55]. The CFD model was created at a scale of 1:55, which is the same as that of the experiment model. Some members of the truss girder, such as corbels and stiffening ribs, were not considered in the CFD numerical simulations due to discontinuities along the bridge span. Therefore, the model was simplified to some extent. To accurately replicate the aerodynamic features of the truss girder, the model was constructed based on several principles, including ensuring similar aerodynamic interference for horizontal components, considering an equivalent total area for the wind’s impact on vertical components, and applying the same aerodynamic shape to all components. Despite a few of the simplifications, this approach proves to be an effective means of investigating the aerodynamic mechanisms underlying wind-induced vibrations in truss girders [56,57].
Transient calculations were performed using Ansys Fluent 15.0 software for the numerical simulations [58]. The k-ω shear stress transport (SST) turbulence model was adopted with unsteady Reynolds-averaged Navier–Stokes (URANS) simulations, which are suitable for modeling the flow around bluff bodies because of their efficiency and accuracy [59]. The air flow governing equation for the SST k-ω model is
{ ρ k t + x j ( ρ u j ¯ k ) = x j ( Γ k k x j ) + G k + S k Y k ρ ω t + x j ( ρ u j ¯ ω ) = x j ( Γ ω ω x j ) + D ω + G ω + S ω Y ω
The two equations are the turbulent kinetic energy transport equation and the specific dissipation rate transport equation, where ω is the specific dissipation rate used to determine the flow scale; k is the turbulent kinetic energy used to determine the turbulent energy; Dω is the orthogonal divergence term; Гk and Гω are effective diffusion terms; Sk and Sω are source terms; Gk and Gω are generation terms; Yk and Yω are divergence terms. The discretized problem was solved using the pressure–velocity coupling algorithm. Furthermore, the second-order upwind scheme was selected for a specific dissipation rate, turbulent kinetic energy, and momentum, and adopted a time step of 1 × 10⁻⁴ s to meet the Courant number requirement.

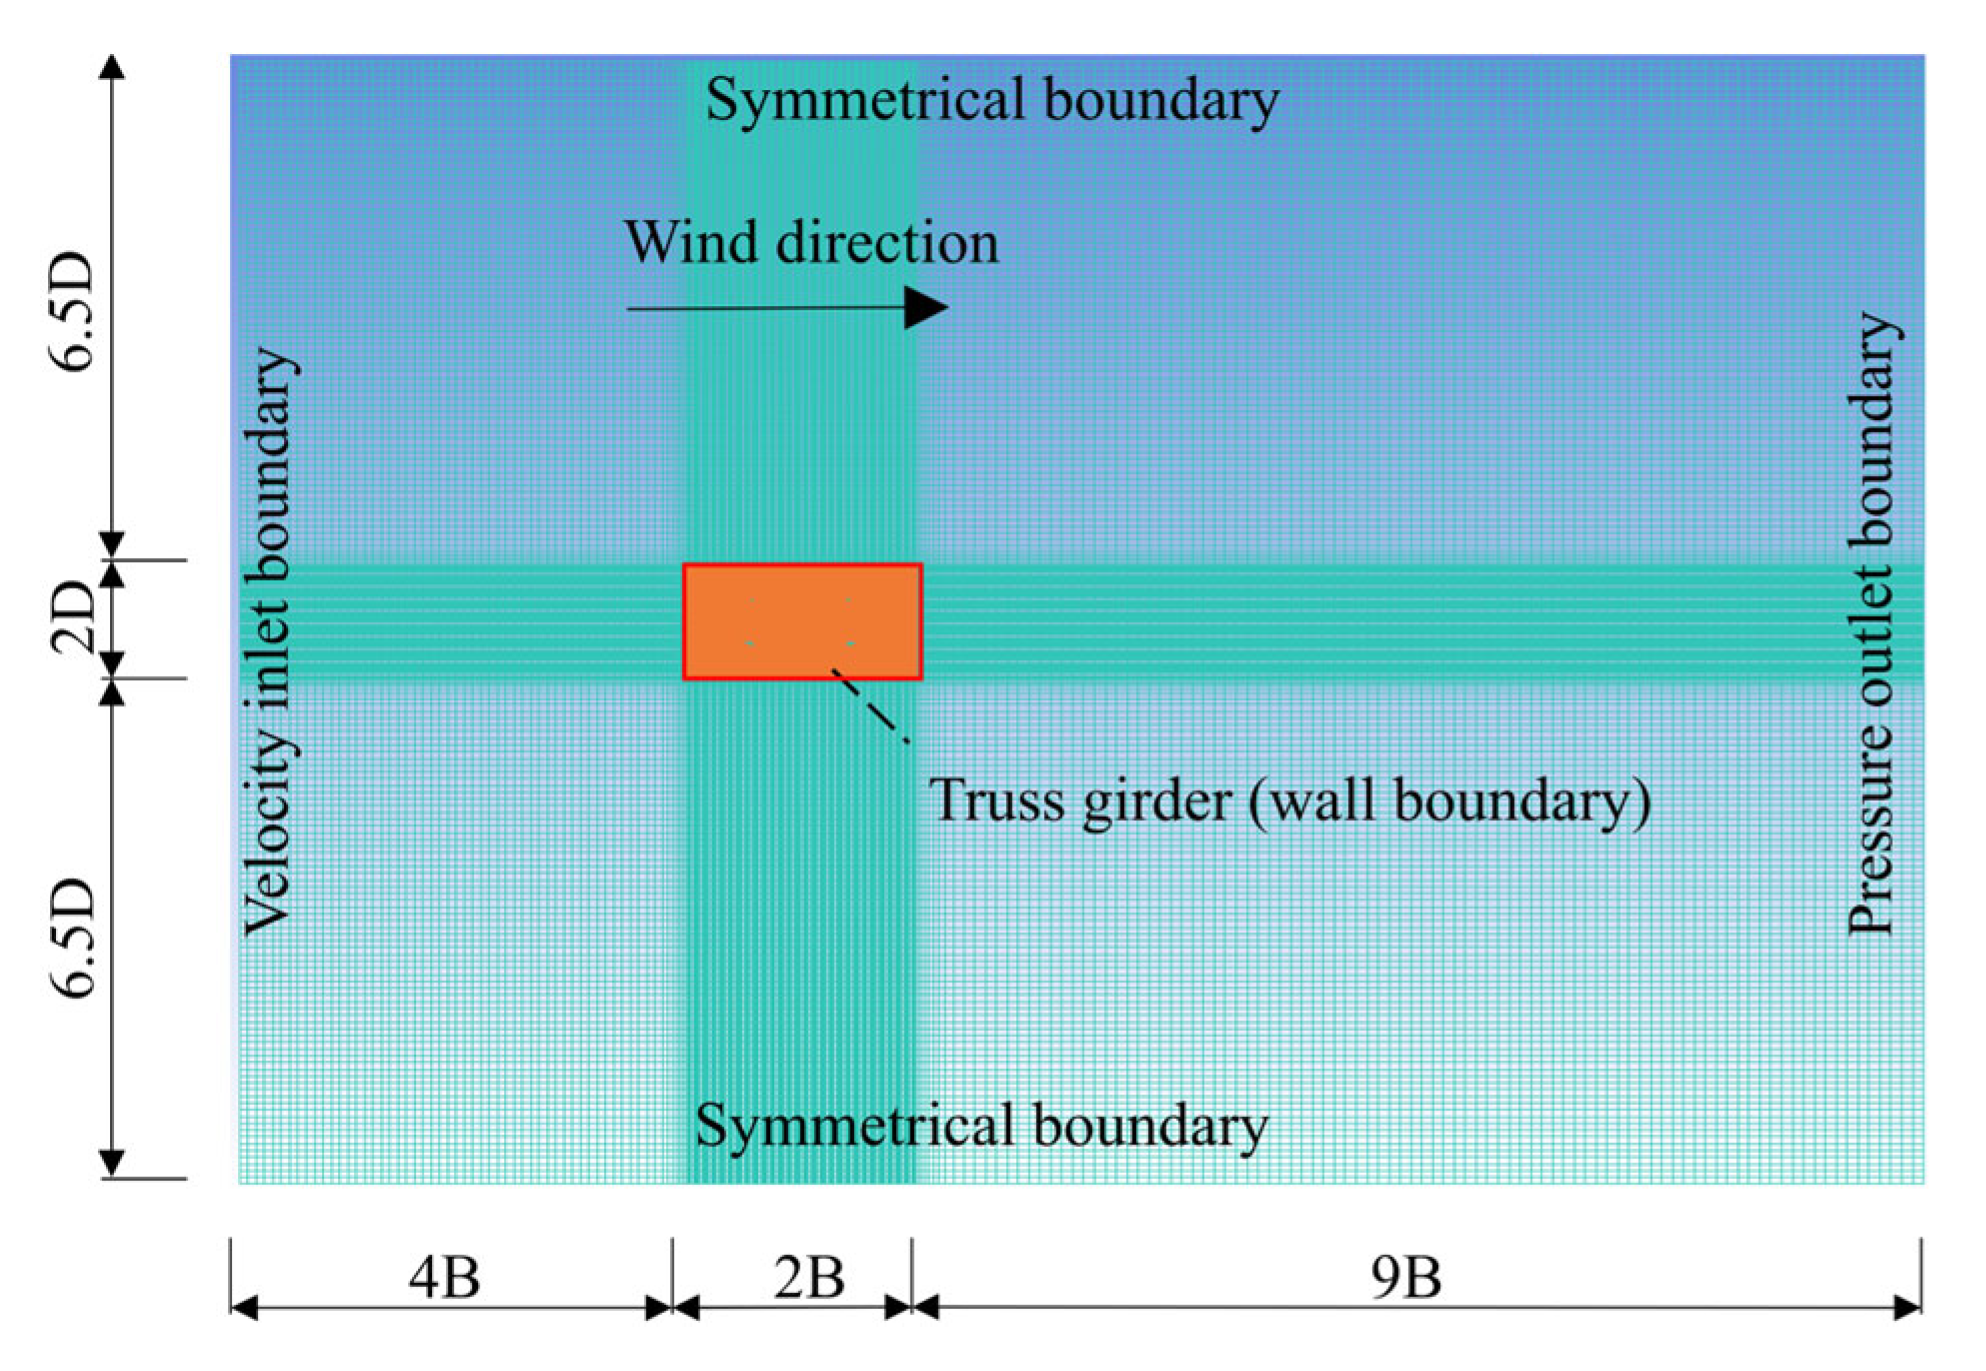
4.1. Computational Domain Meshing

An overlapping mesh was created using ICEM pre-processing software, and the computational domain was divided into two parts: the internal and external domains [60]. The computational domain was made large enough to minimize the impact of the cross-sectional flow field boundaries. The external domain’s length and height were 15 B and 15 D, respectively, in the mean flow and crossflow directions, while the internal domain was 2B by 2D. The blocking ratio of the model in the computational domain was 0.5%, which is lower than the allowable value of 5% [61]. The windward boundary condition was set to a velocity inlet boundary, indicating uniform incoming flow, while the leeward boundary condition was set to a pressure outlet boundary, indicating a zero pressure difference. The upper and lower boundaries were set as symmetrical boundaries. Furthermore, the truss girder cross-section was set as the smooth wall boundary.
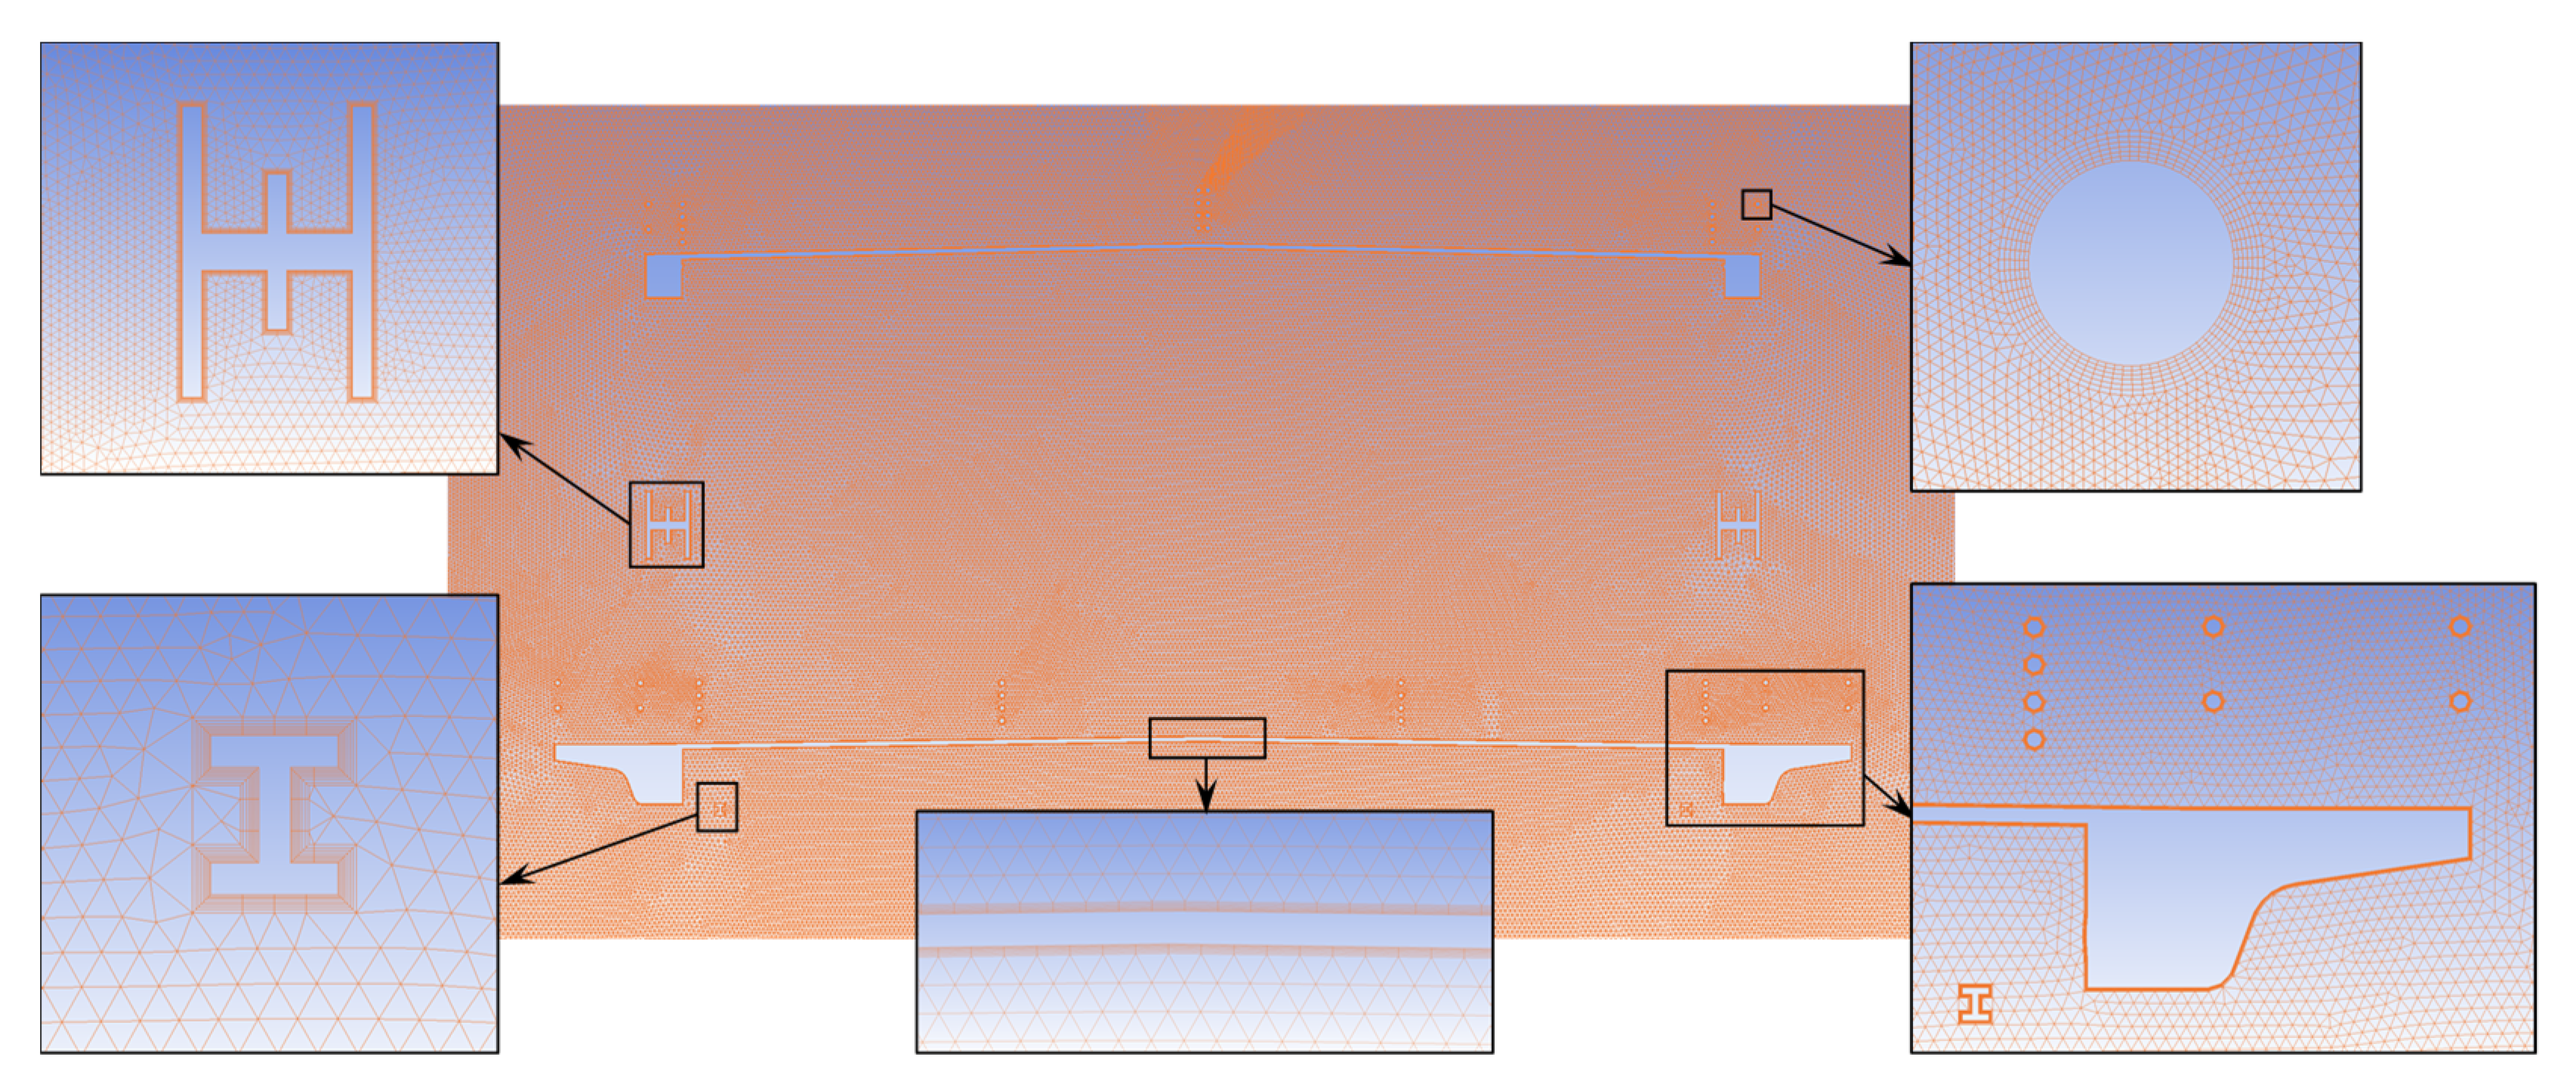
 Figure 14 and Figure 15 illustrate the boundary conditions and mesh details of the computational domain used in this investigation.
The external domain’s mesh was classified as a structured mesh with a size close to the maximum size of the internal mesh, while the internal domain was classified as an unstructured mesh. The cross-section was divided into three parts: the upper and lower chords were designated as B, the diagonal bracing members as H, and the guardrails as LG. To simulate the surface attachment, movement, and shedding of the vortex, the Y-plus value was assumed to be 1 when dividing the mesh. The height of the boundary layer clinging to the girder surface was calculated to be approximately 0.05 mm, based on the set wind speed, air density, and dynamic viscosity. The maximum size of the internal computational domain mesh was set to 0.04 mm. For the B and H sections, the mesh size was set to 0.035 mm with a boundary layer of ten layers and a linear growth rate of 1.1. For the LG section, which has smaller cross-sectional dimensions, the mesh size was set to 0.02 mm with a boundary layer of ten layers and a linear growth rate of 1.1. Gradually increasing mesh size ensures smooth transitions [62]. The total mesh number was 148,367. 
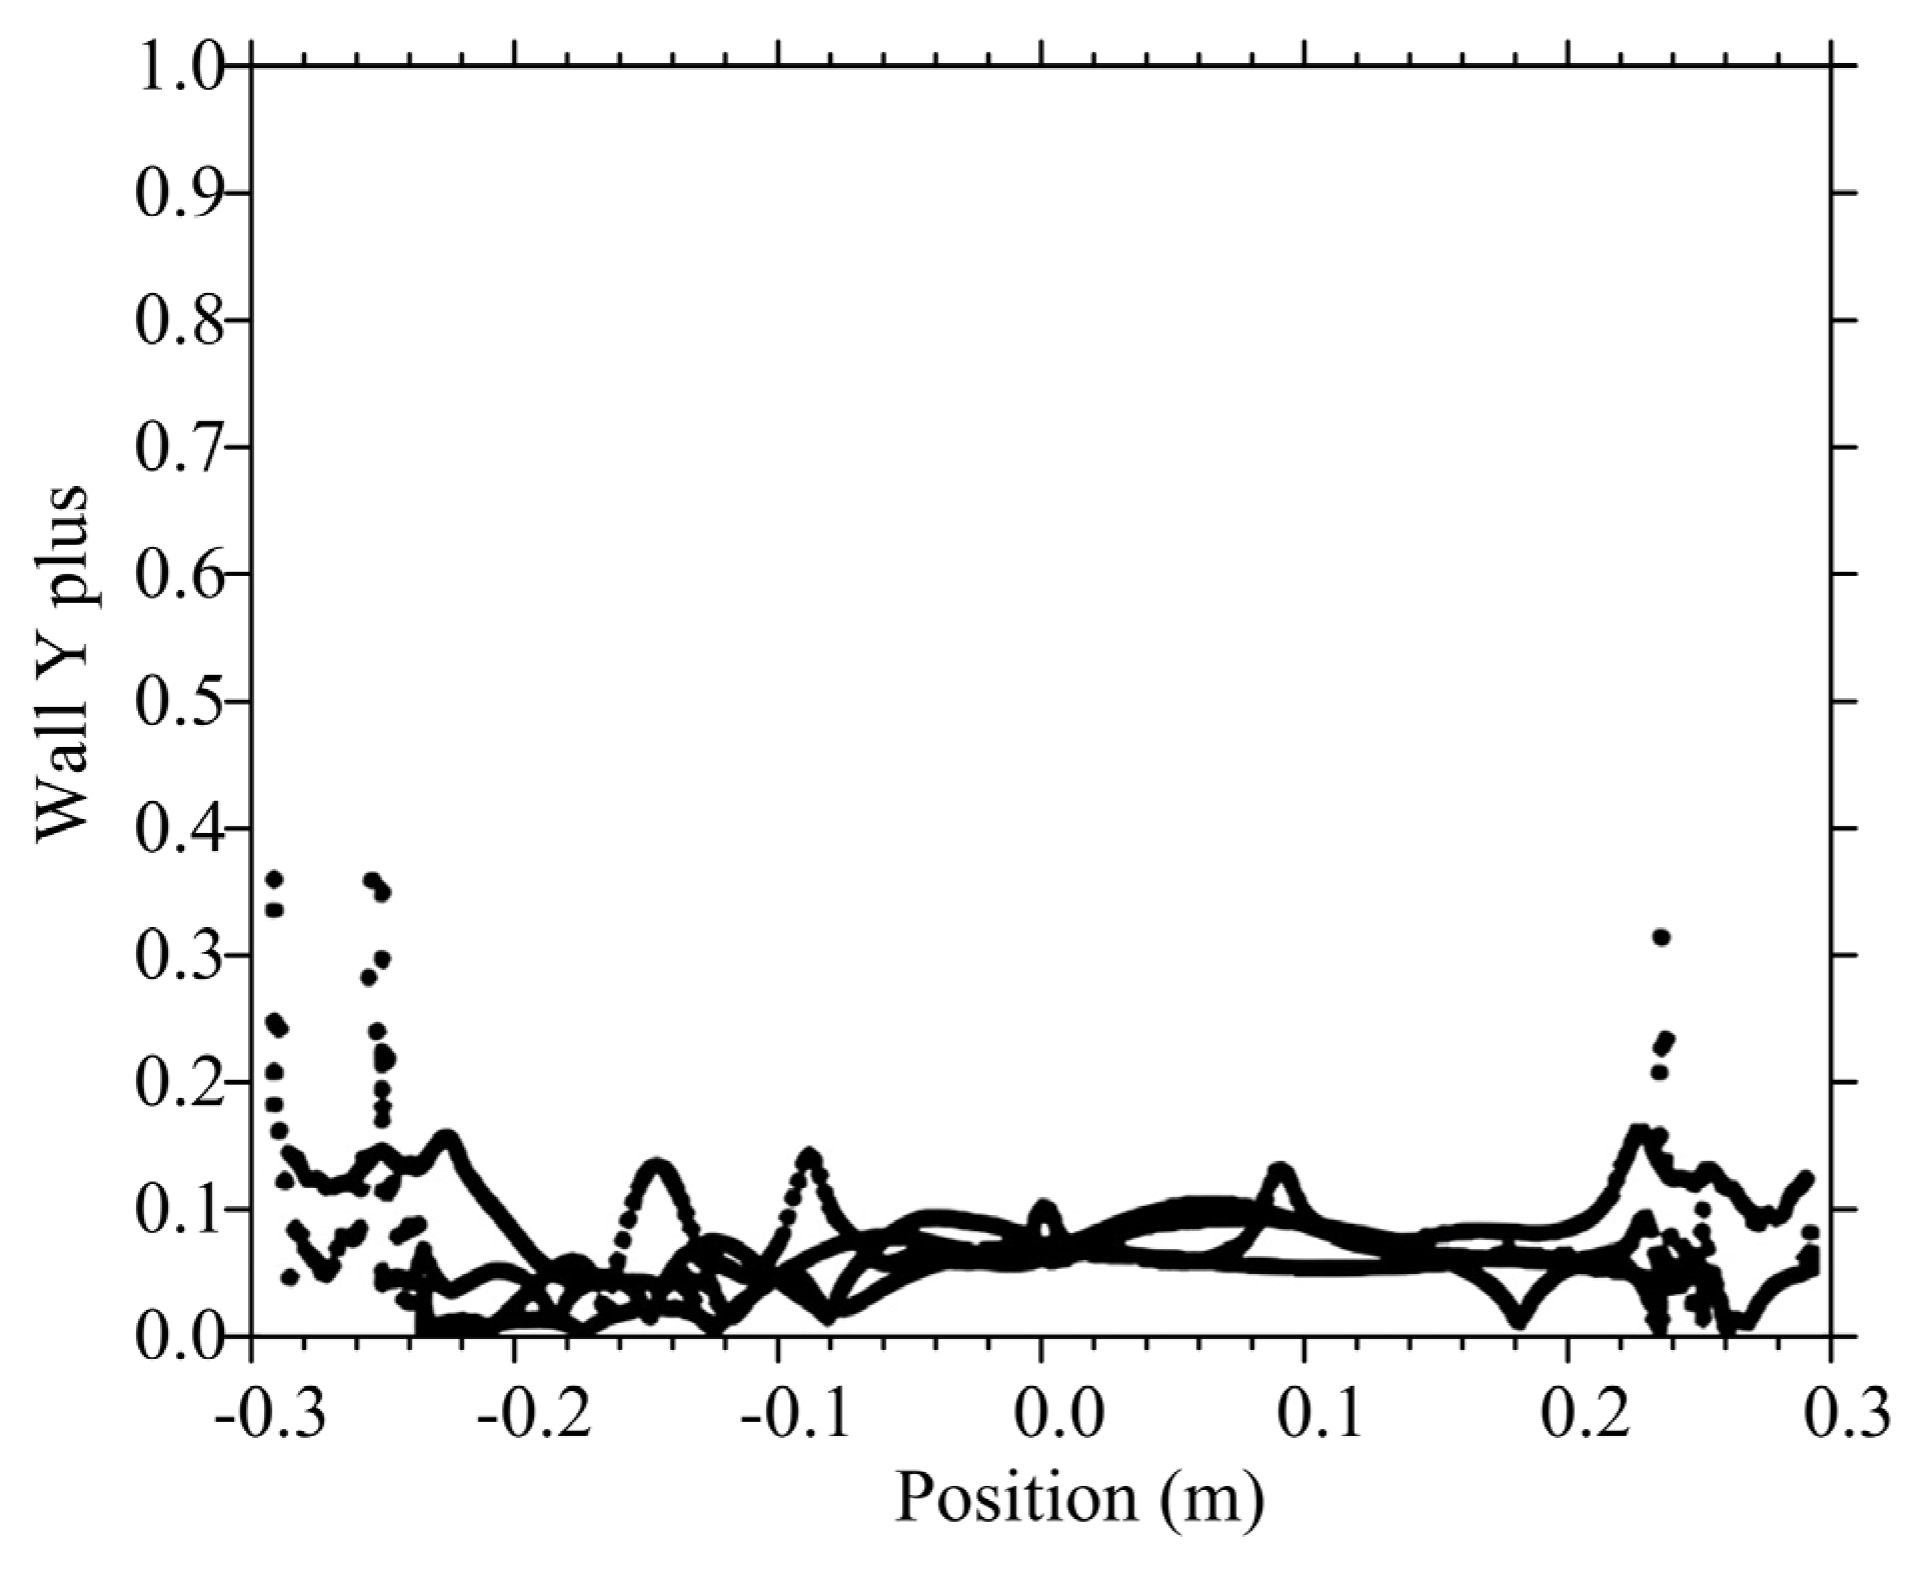
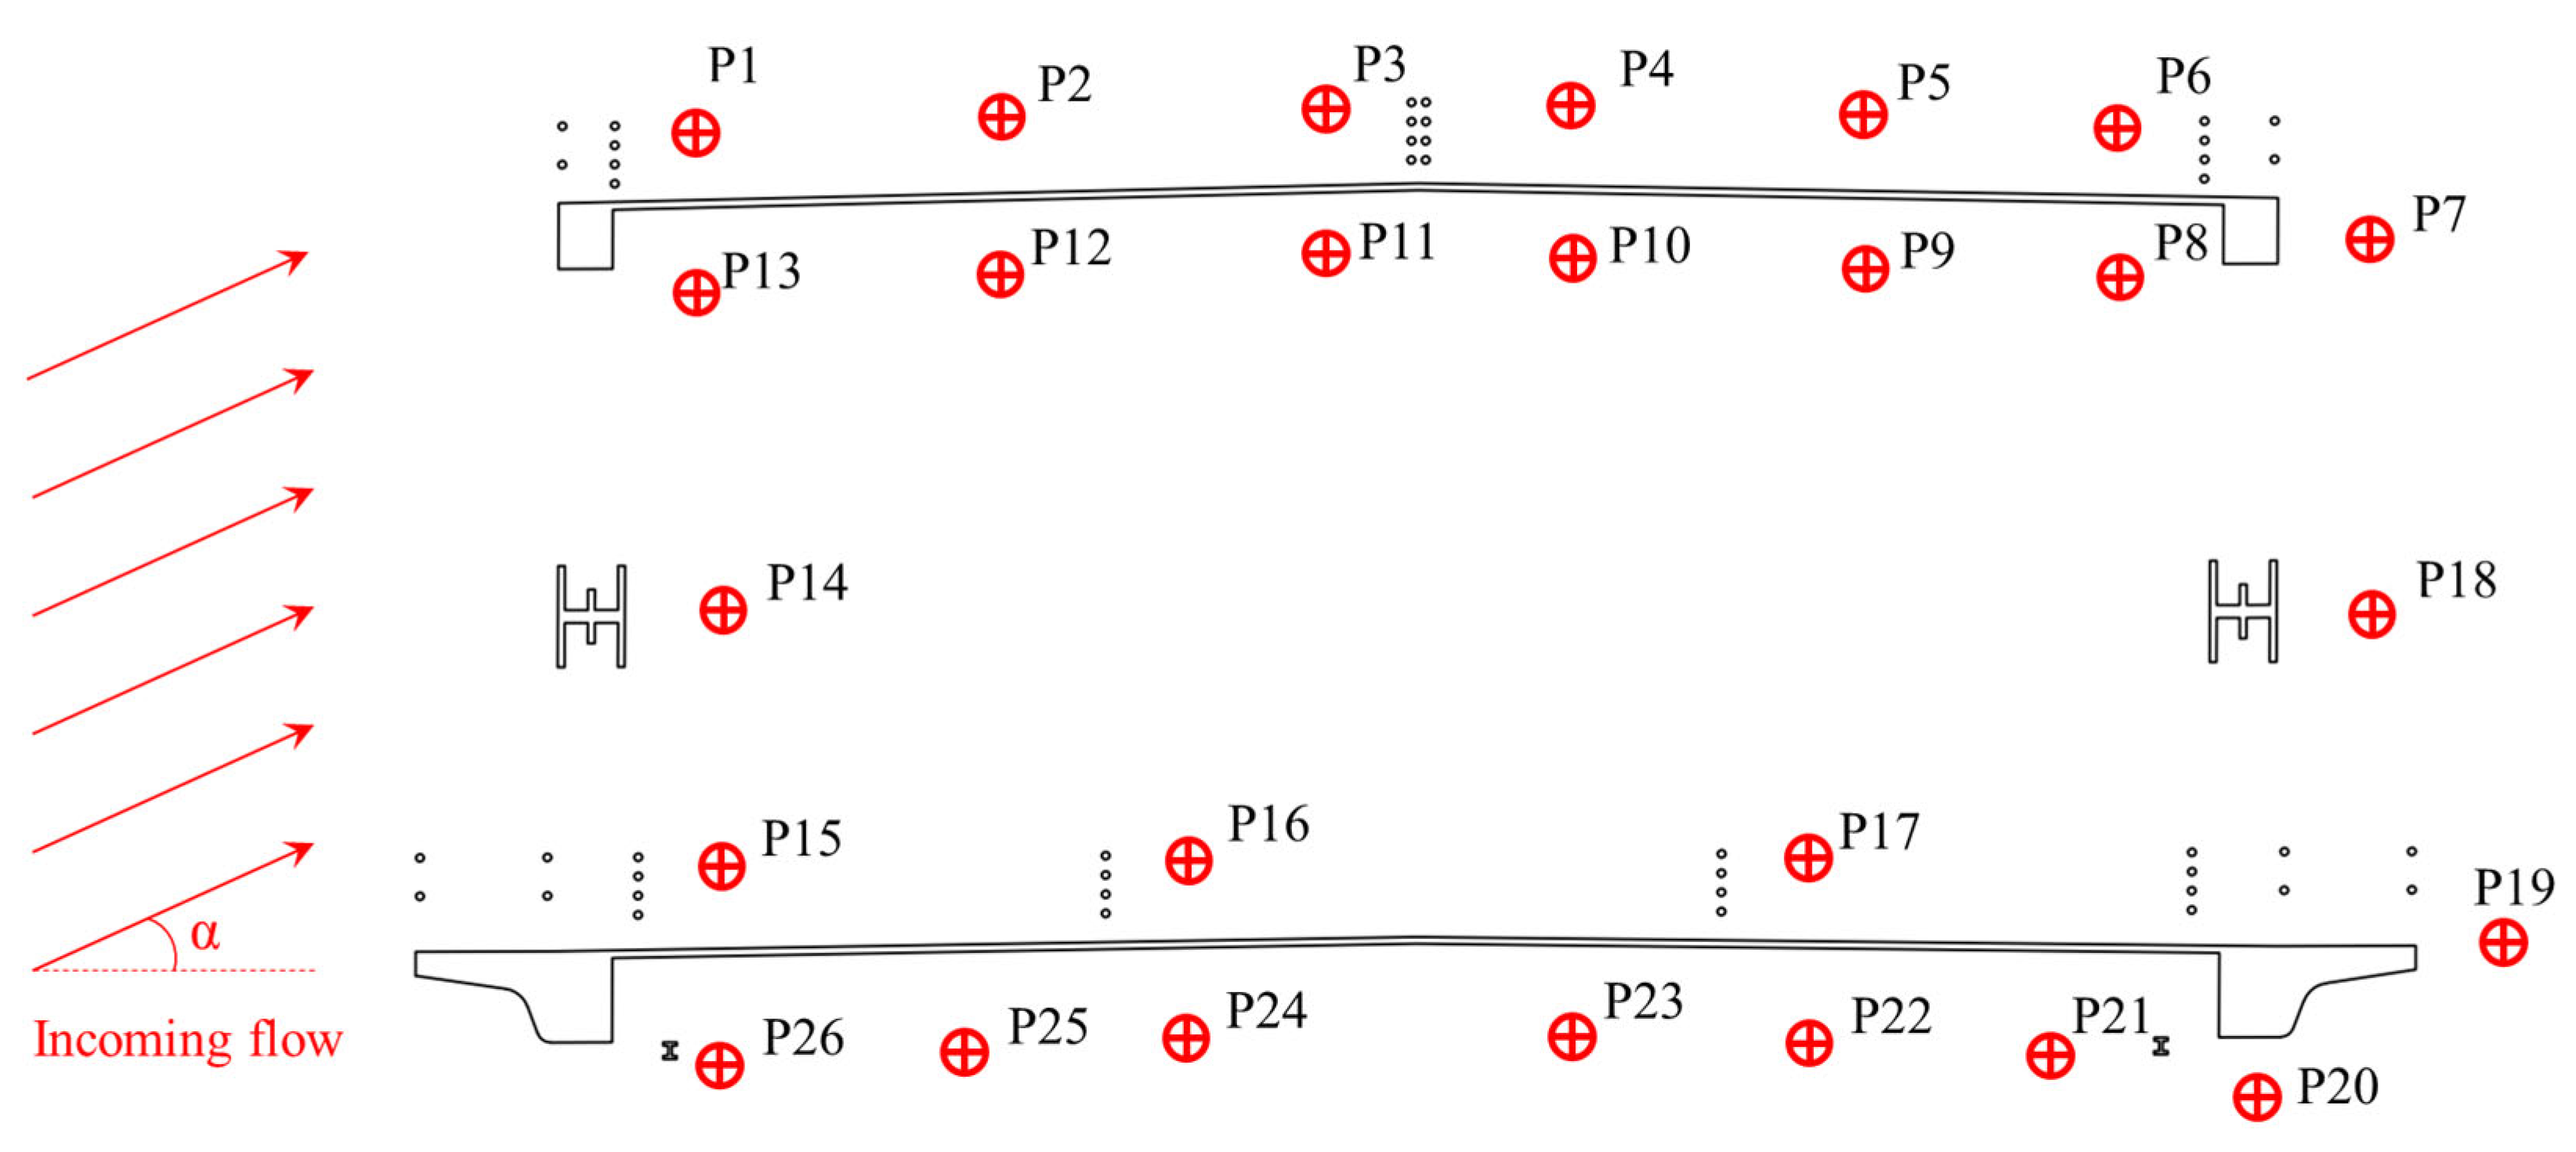
Figure 16 shows the distribution of Y-plus values for the truss girder’s cross-section. All Y-plus values were below 1, meeting the requirements of the SST k-ω model, indicating that the mesh of the wall boundary layer was feasible. Furthermore, in order to further understand the mechanism of the VIV and reveal the vortices propelling the truss girder toward experiencing VIV, there were twenty-six monitoring points set up at diverse locations to record the wind speeds. The monitoring point locations are displayed in Figure 17.

4.2. Verification of Mesh Number and Time Step Irrelevance

The SST k-ω model uses a time averaging process for the Navier–Stokes equations. If the time step is too large, a number of minuscule unsteady flow characteristics might be counteracted. Therefore, it is essential to ensure an appropriate time step and a large total number of meshes to accurately capture these vortices. To illustrate this, a +3° wind attack angle and 10 m/s wind speed were considered, with time steps of 1 × 10⁻³, 5 × 10⁻⁴, 1 × 10⁻⁴, 5 × 10⁻⁵, and 1 × 10
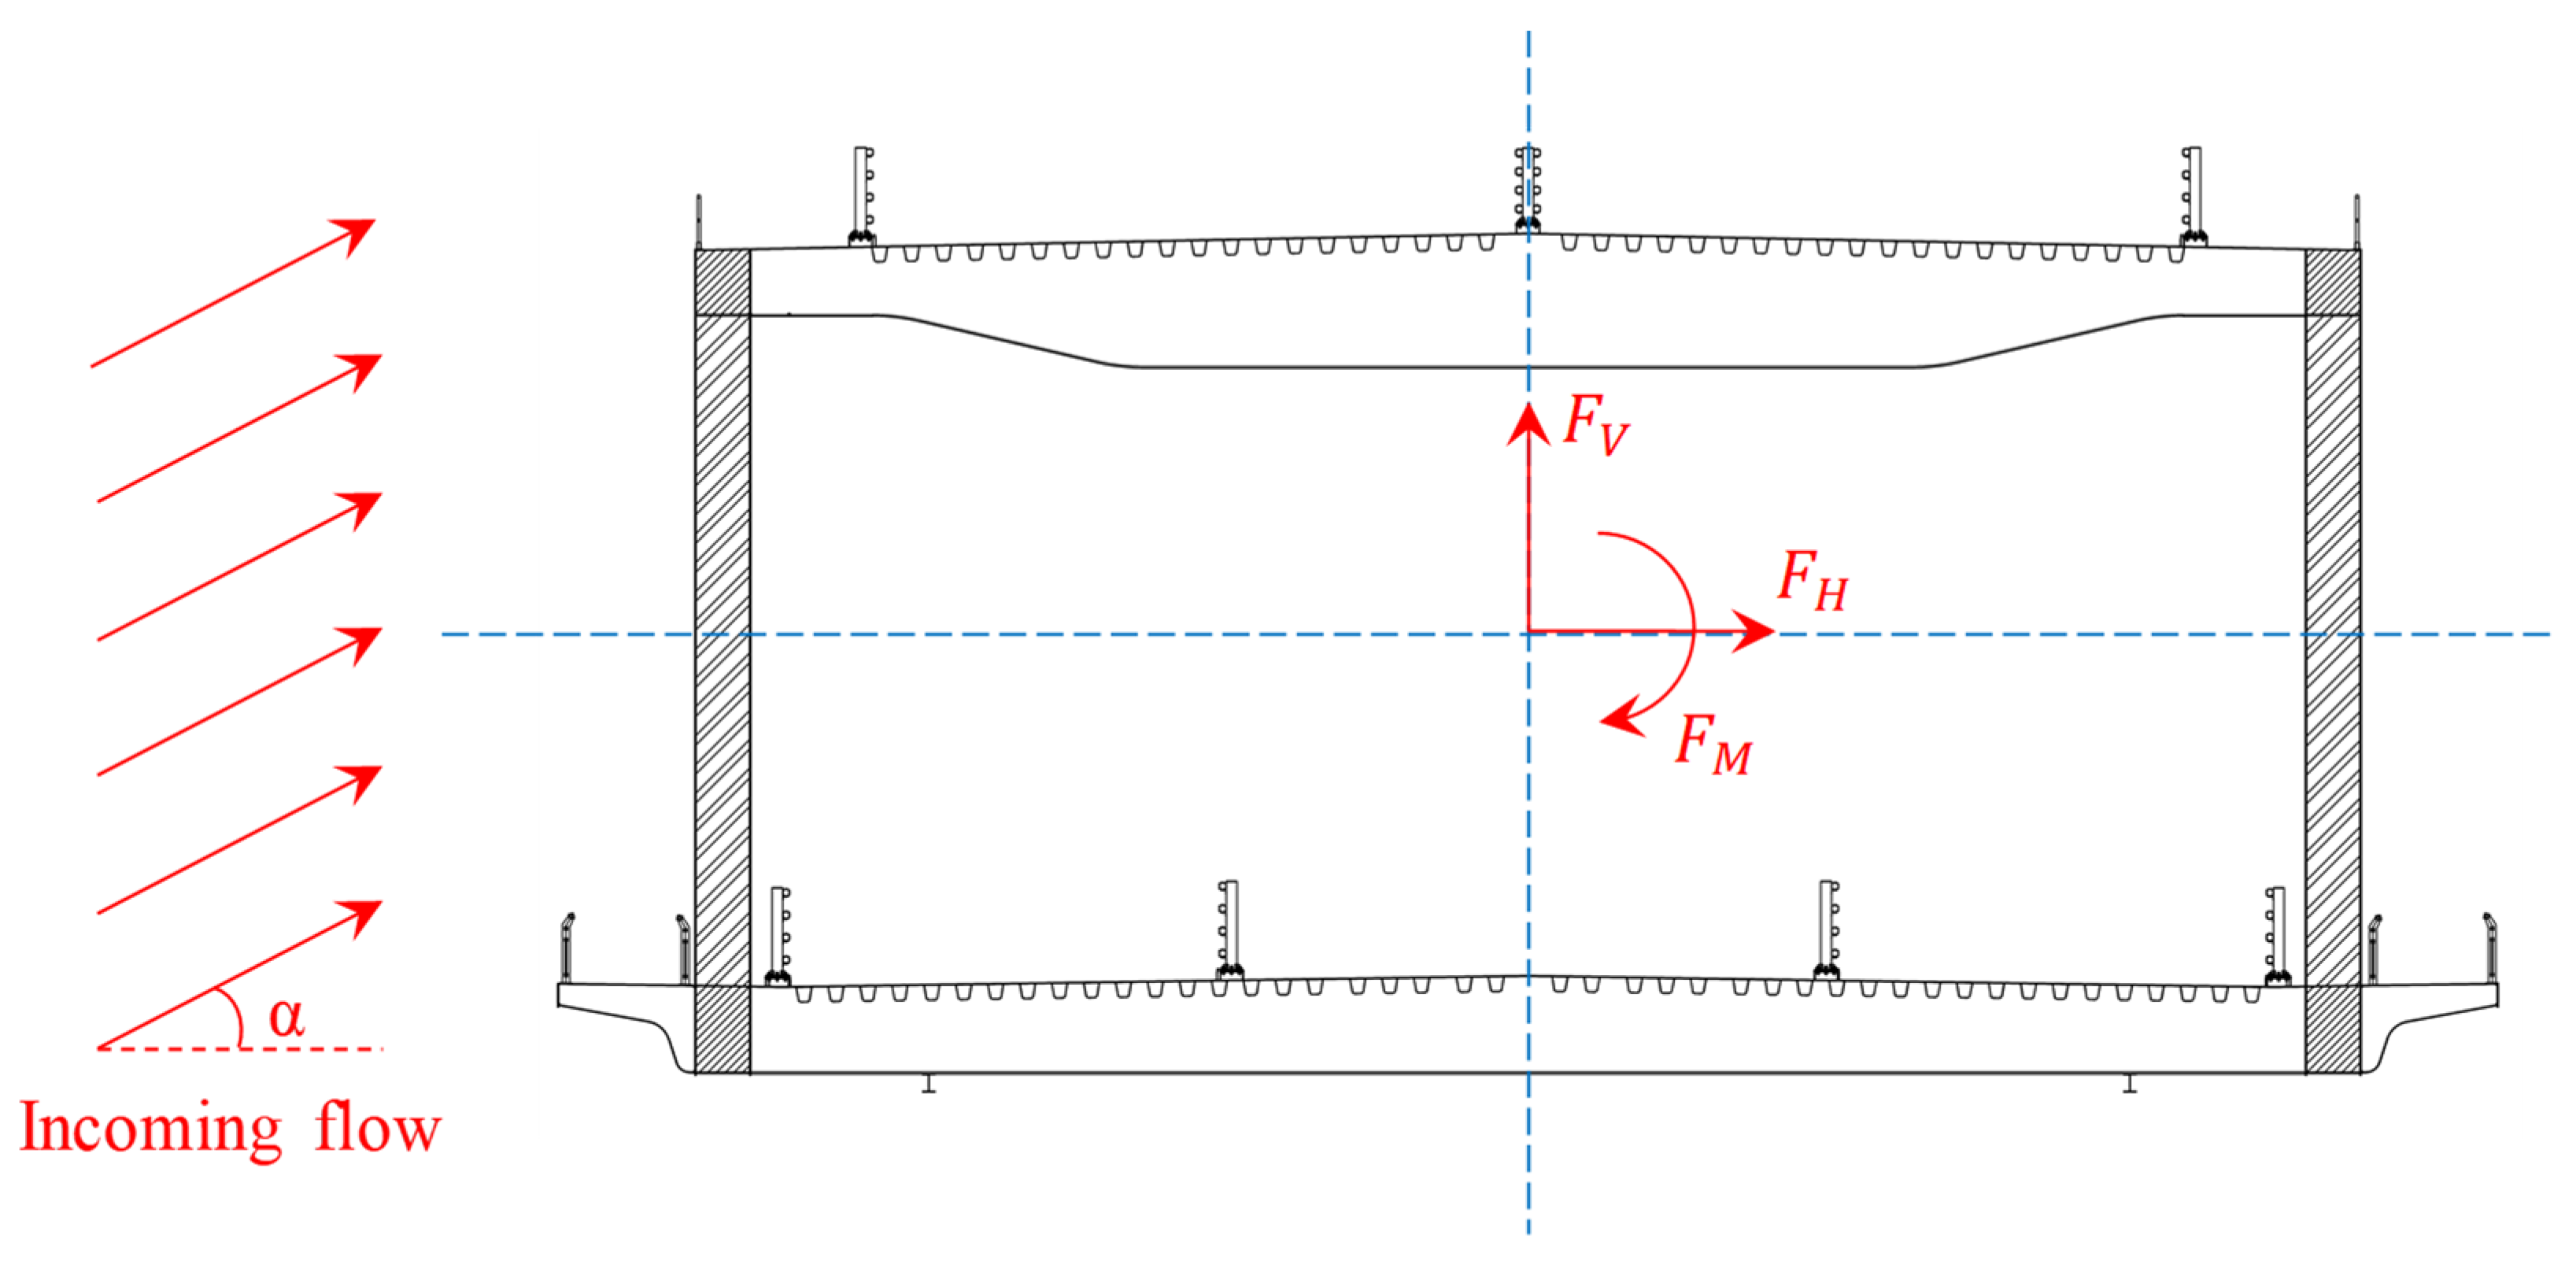
⁻⁵. Additionally, the total number of meshes of 0.07 million, 0.15 million, 0.24 million and 0.45 million. The lift, drag, and moment coefficients of the girder were calculated, and defined as
CV = FV/(0.5ρU2B),
CH = FH/(0.5ρU2D),
CM = FM/(0.5ρU2B2).
FV, FH, and FM represent the lift, drag, and pitching moment, respectively; B and D are the width and height of the truss girder after scaling; ρ is the air density; U is the wind speed. After calculating convergence, we selected the data from twenty shedding cycles to calculate the average and standard deviation of the aerodynamic coefficients, and these are presented in Table 5 and Table 6.
The results indicated that the average of the aerodynamic coefficients calculated using the time steps of 1 × 10⁻³ and 5 × 10⁻⁴ was relatively more minor than that using the other three time steps. When the time step was reduced to 1 × 10⁻⁴, further reductions had a minor impact on the results. Similarly, the average of the aerodynamic coefficients calculated using the total mesh number of 0.07 million was relatively smaller than that using the other three mesh numbers. When the total mesh number continued to increase above 0.15 million, it had only a minor impact on the results. Considering both the efficiency and accuracy of the numerical simulations, a time step of 1 × 10⁻⁴ and a total mesh number of 0.15 million were used in successive calculations.

4.3. Verification of Numerical Simulation Accuracy

To validate the numerical simulation model’s reliability, the aerodynamic coefficients were calculated using the model at +3° and +5° wind attack angles and a 10.0 m/s wind speed. This was the same wind speed as that used in the measurement of aerodynamic coefficients in wind tunnel tests. The calculated results were compared with the results from wind tunnel tests, and the comparisons are presented in Table 7. The simulated values were found to be approximately equal to the test values for the aerodynamic coefficients.
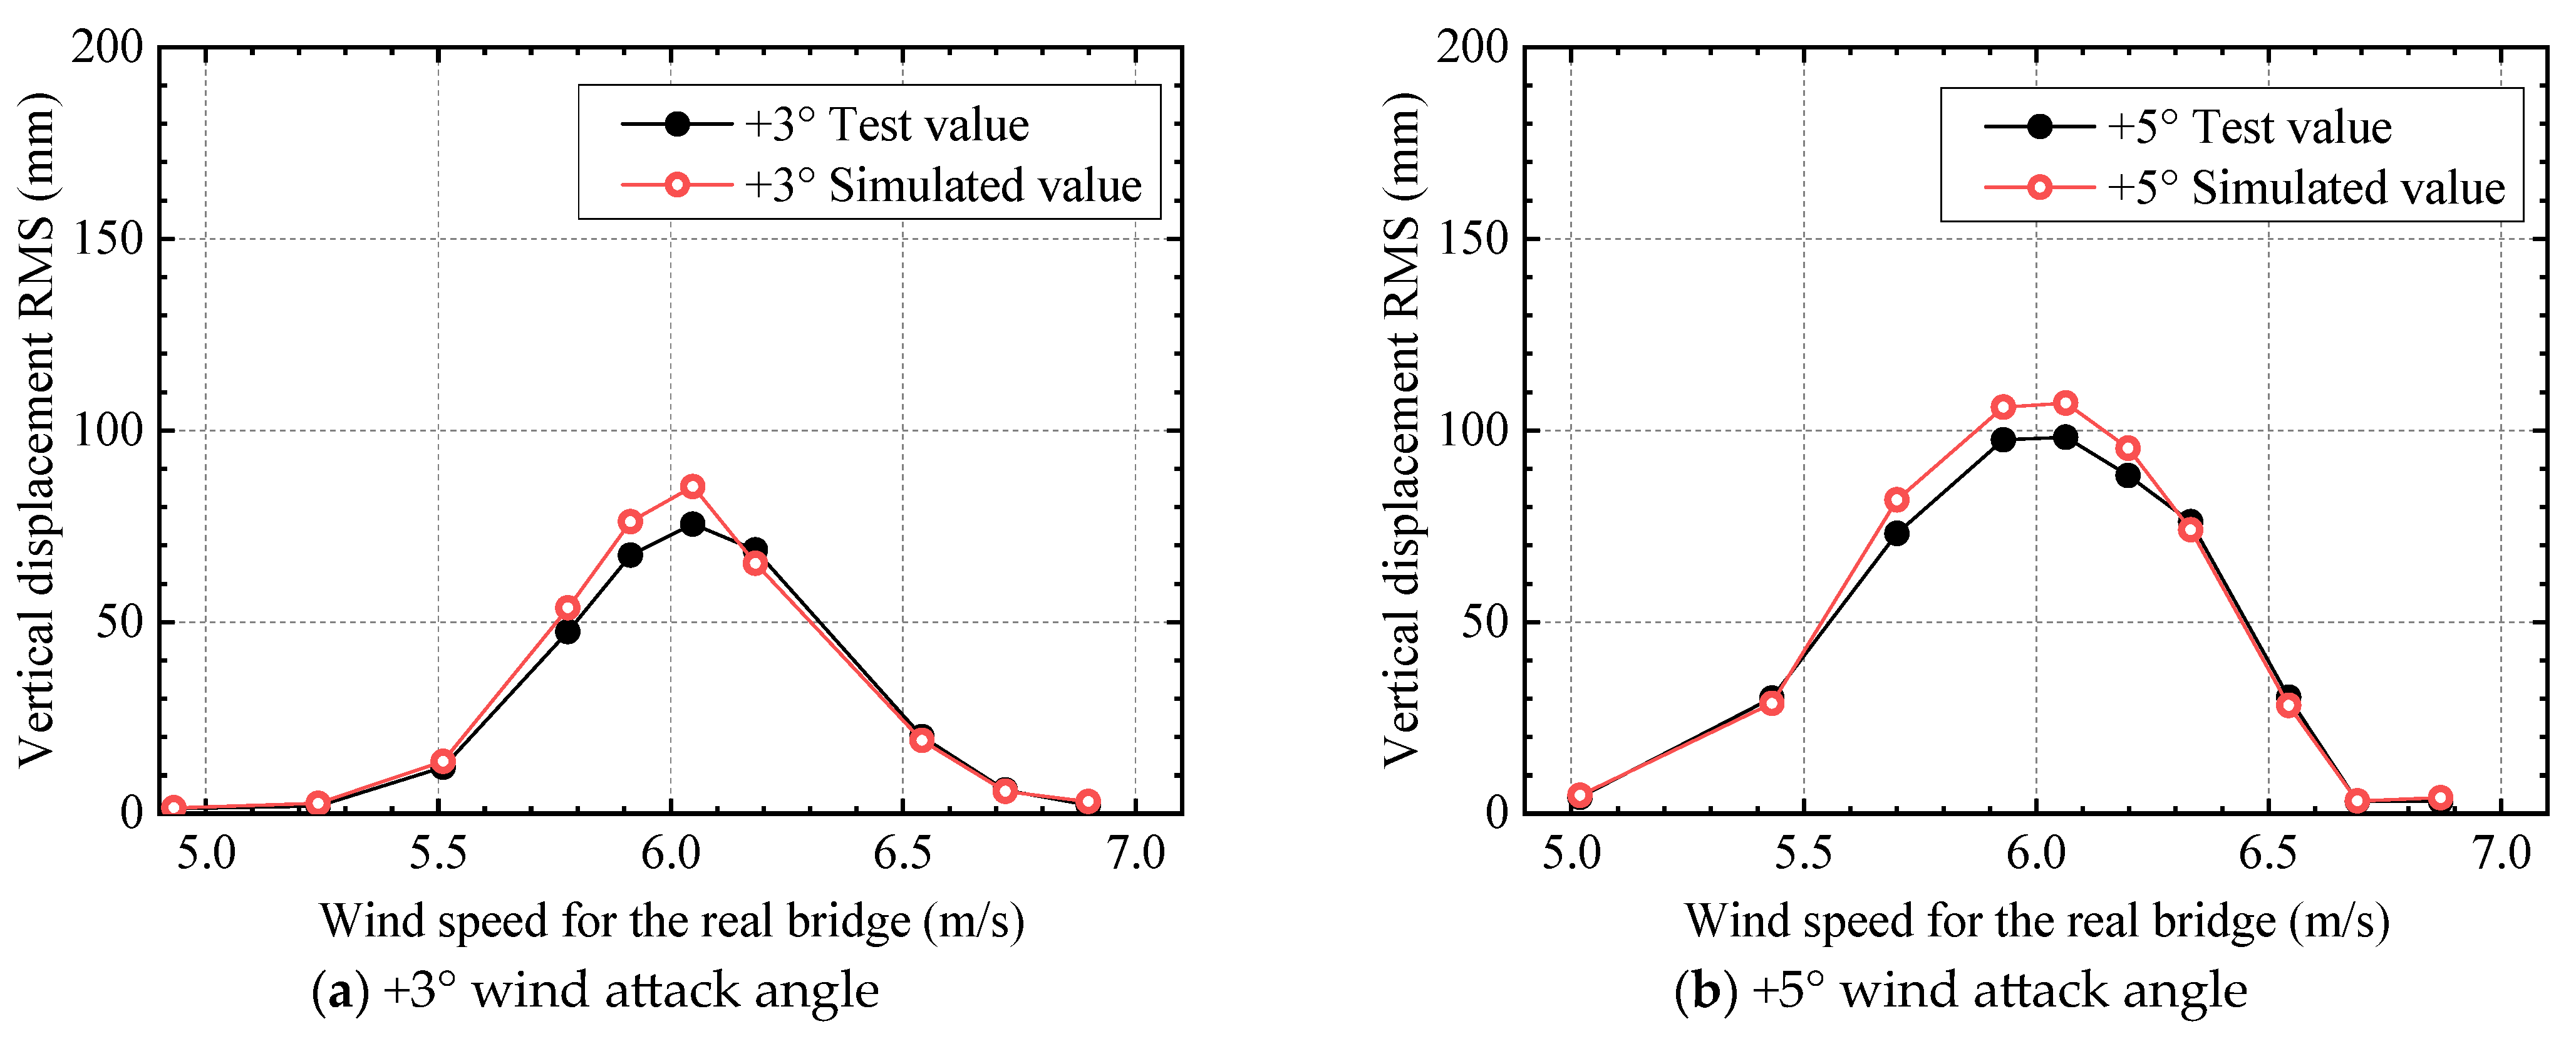
The original cross-section’s working condition was calculated using the user-defined function program in the ANSYS software, with +3°and +5° wind attack angles and the vertical VIV lock-in range’s wind speeds in the wind tunnel tests. The amplitude comparisons between the simulation results and the test results are presented in Figure 18, indicating that the vertical VIV amplitude and lock-in range are in agreement.
The maximum error between the test and simulation of the aerodynamic coefficient was 11.61% with an average error of 7.92%. Additionally, the maximum error of the amplitude of vertical VIV was 13.01% with an average error of 5.64%. The small errors in the simulation results indicate the mesh division and numerical simulation algorithms’ accuracy and the model’s high credibility. Therefore, this model can be used to analyze the vortex shedding characteristics of the truss girder’s cross-section.

4.4. Numerical Simulation Results

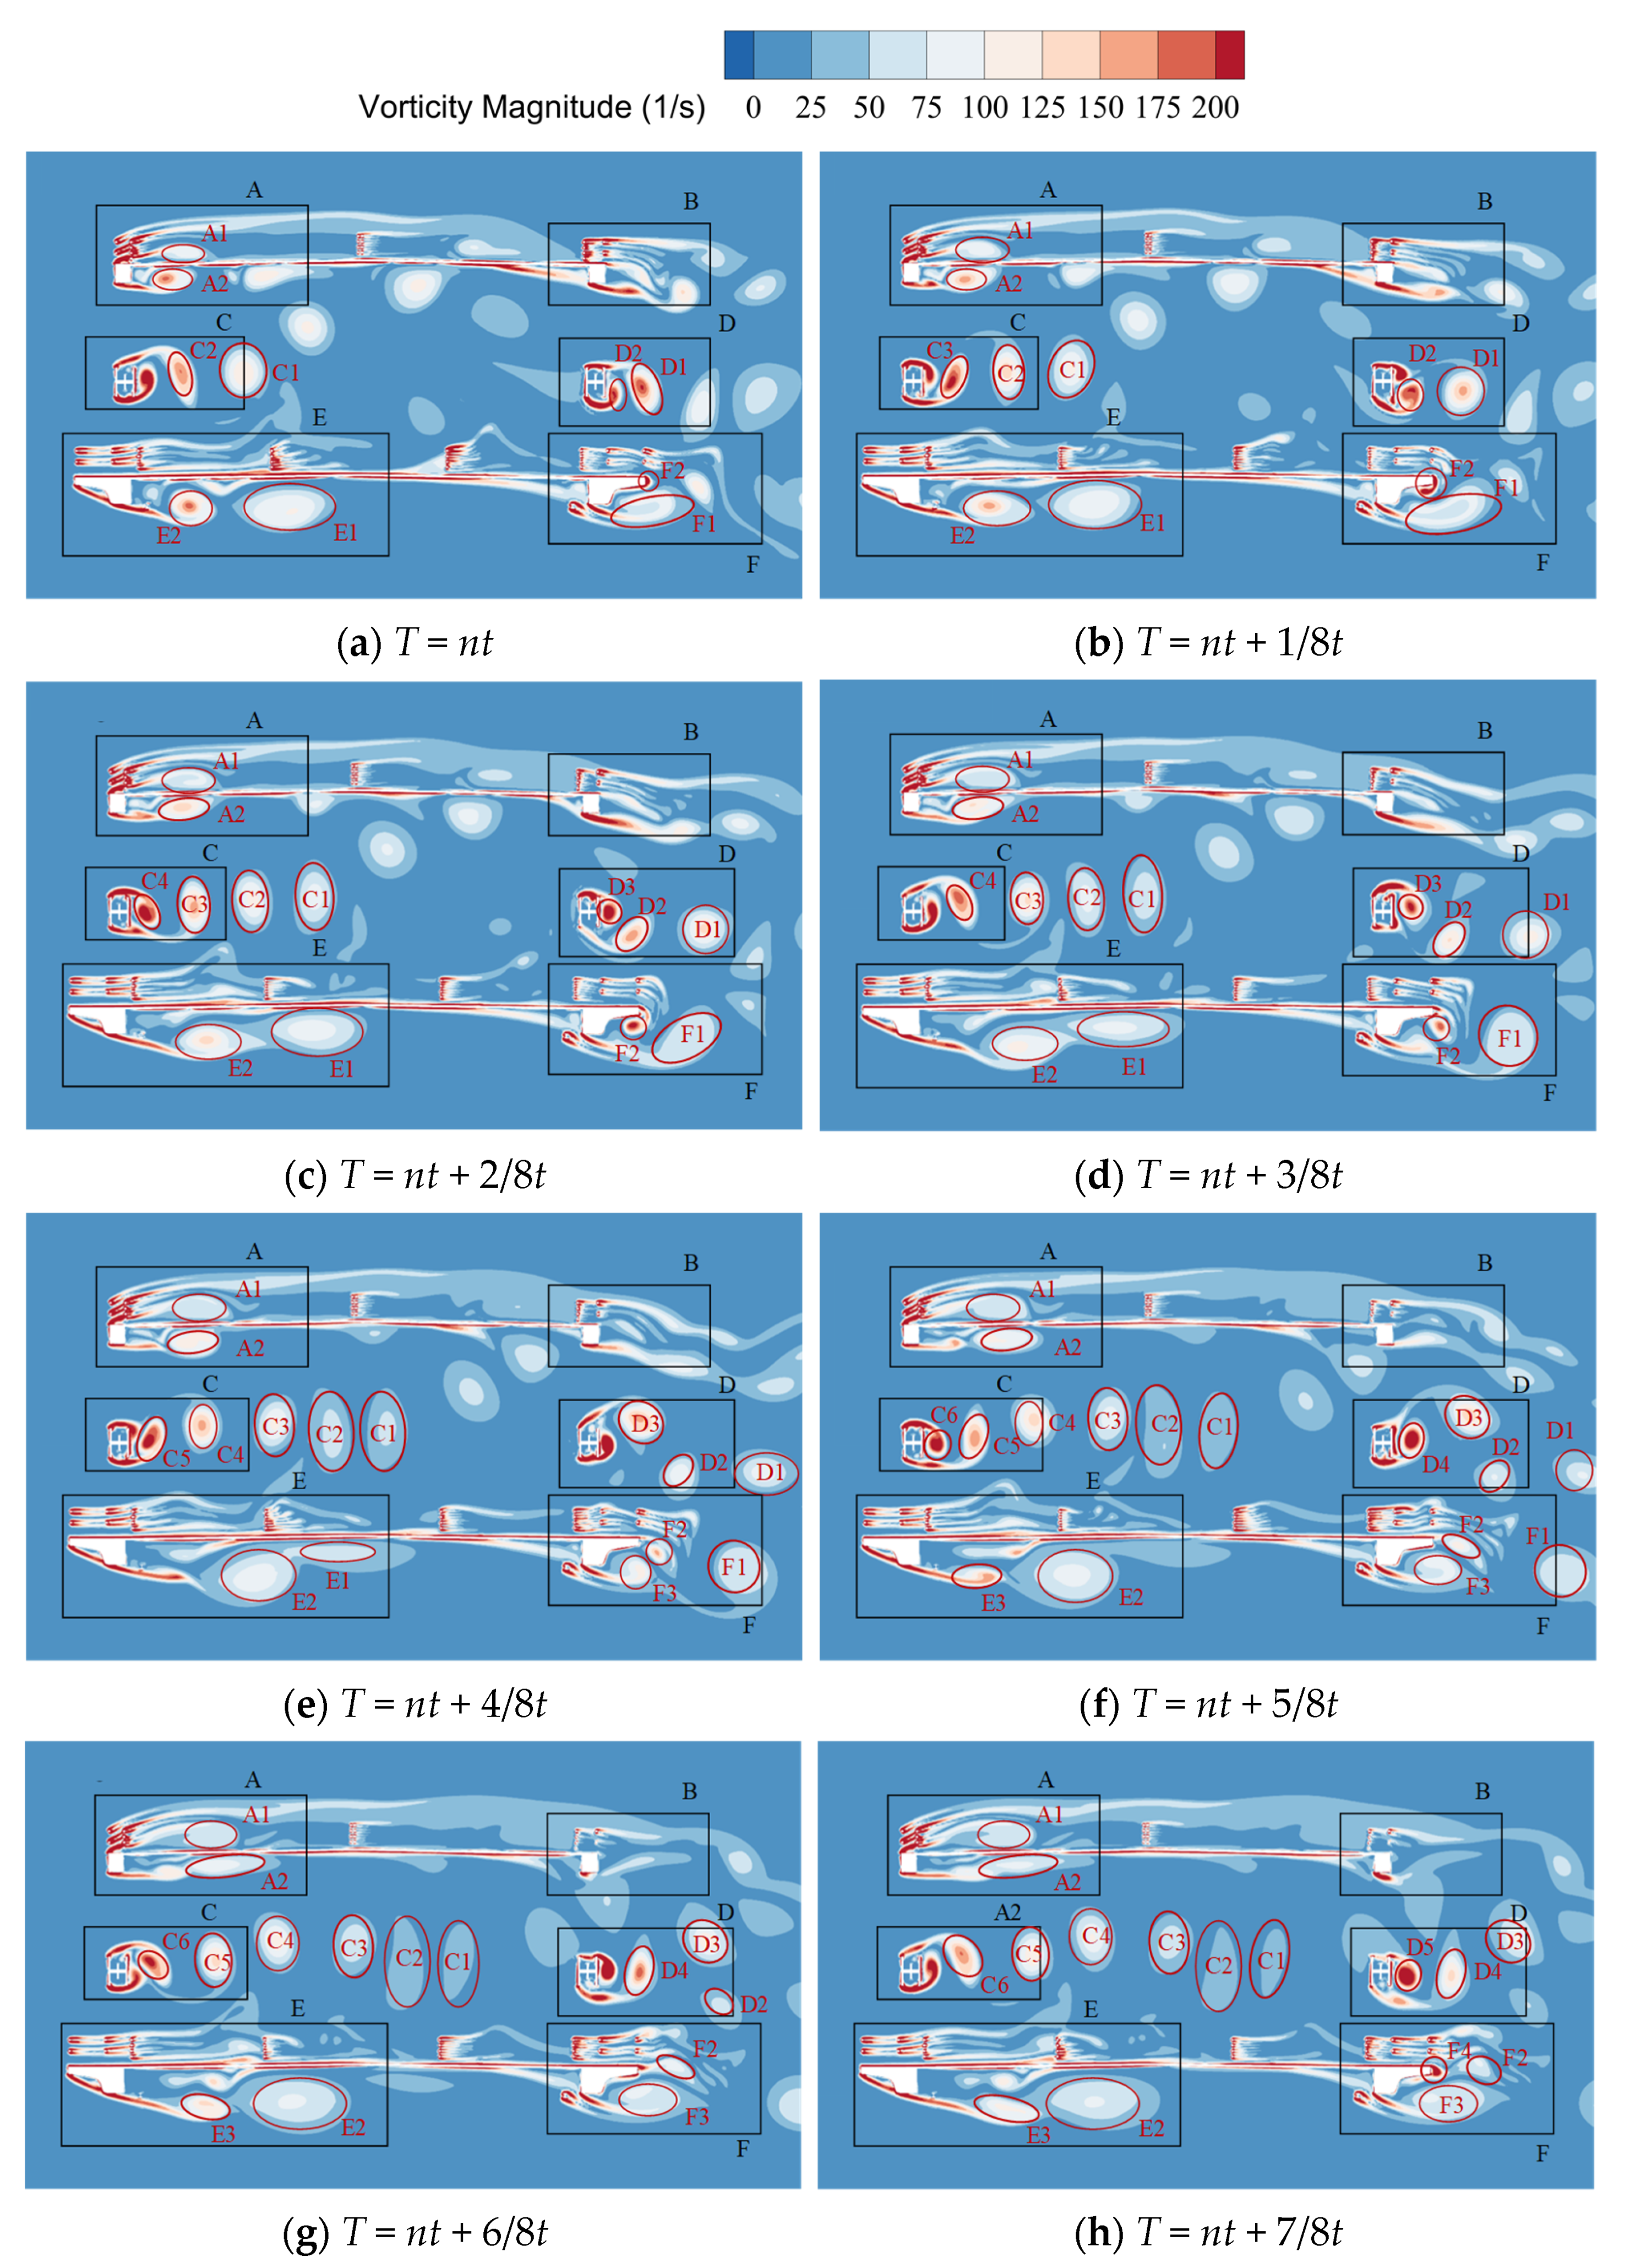
To analyze the process of vortex generation, attachment, and dissipation more effectively, Figure 19 displays the vorticity contours of the truss girder during one vortex shedding cycle obtained from the numerical simulation at the +3° wind attack angle and 6.05 m/s wind speed. These conditions correspond to the most prominent vertical VIV that occurred in the wind tunnel tests.
Figure 19 illustrates the separation of the incoming flow after being influenced by the windward upper chord, diagonal bracing member, lower chord, and guardrail. The upper incoming flow experiences reattachment on the windward surface of the upper deck and forms a large vortex region, A. Vortices A1 and A2 are, respectively, formed on the upper and lower sides of the upper chord member, moving downstream with a width of about 0.1 B. Smaller vortices are continuously generated and shed below the leeward side of the upper deck, forming vortex region B. No large vortices are generated in this region, as the upper deck plate’s upper side is separated by the guardrail. The windward diagonal bracing member affects the middle incoming flow, causing vortex shedding on both sides, forming vortex region C, which is a typical Karman vortex street phenomenon. A staggered shedding vortex is generated behind the leeward side’s diagonal bracing member, forming vortex area D. The lower incoming flow is influenced by the windward guardrail, sidewalk, and lower chord, forming a downstream-moving vortex E1 with a width of about 0.28 B in vortex region E behind the maintenance track. However, there is no incoming flow reattachment on the lower deck’s upside. The incoming flow passes through the lower deck’s leeward side, alternately generating vortices on the outside of the sidewalk and the inside of the lower chord, which are then shed from the surface.
After observing the vortex motion of one cycle on the cross-section of the double-deck truss girder, it becomes apparent that various vortices of different sizes and shedding frequencies are generated easily behind components of different shapes and positions in the girder. When the shedding frequency of these vortices approaches the natural frequency of the structure, fluctuating aerodynamic forces may drive VIV [63,64]. 
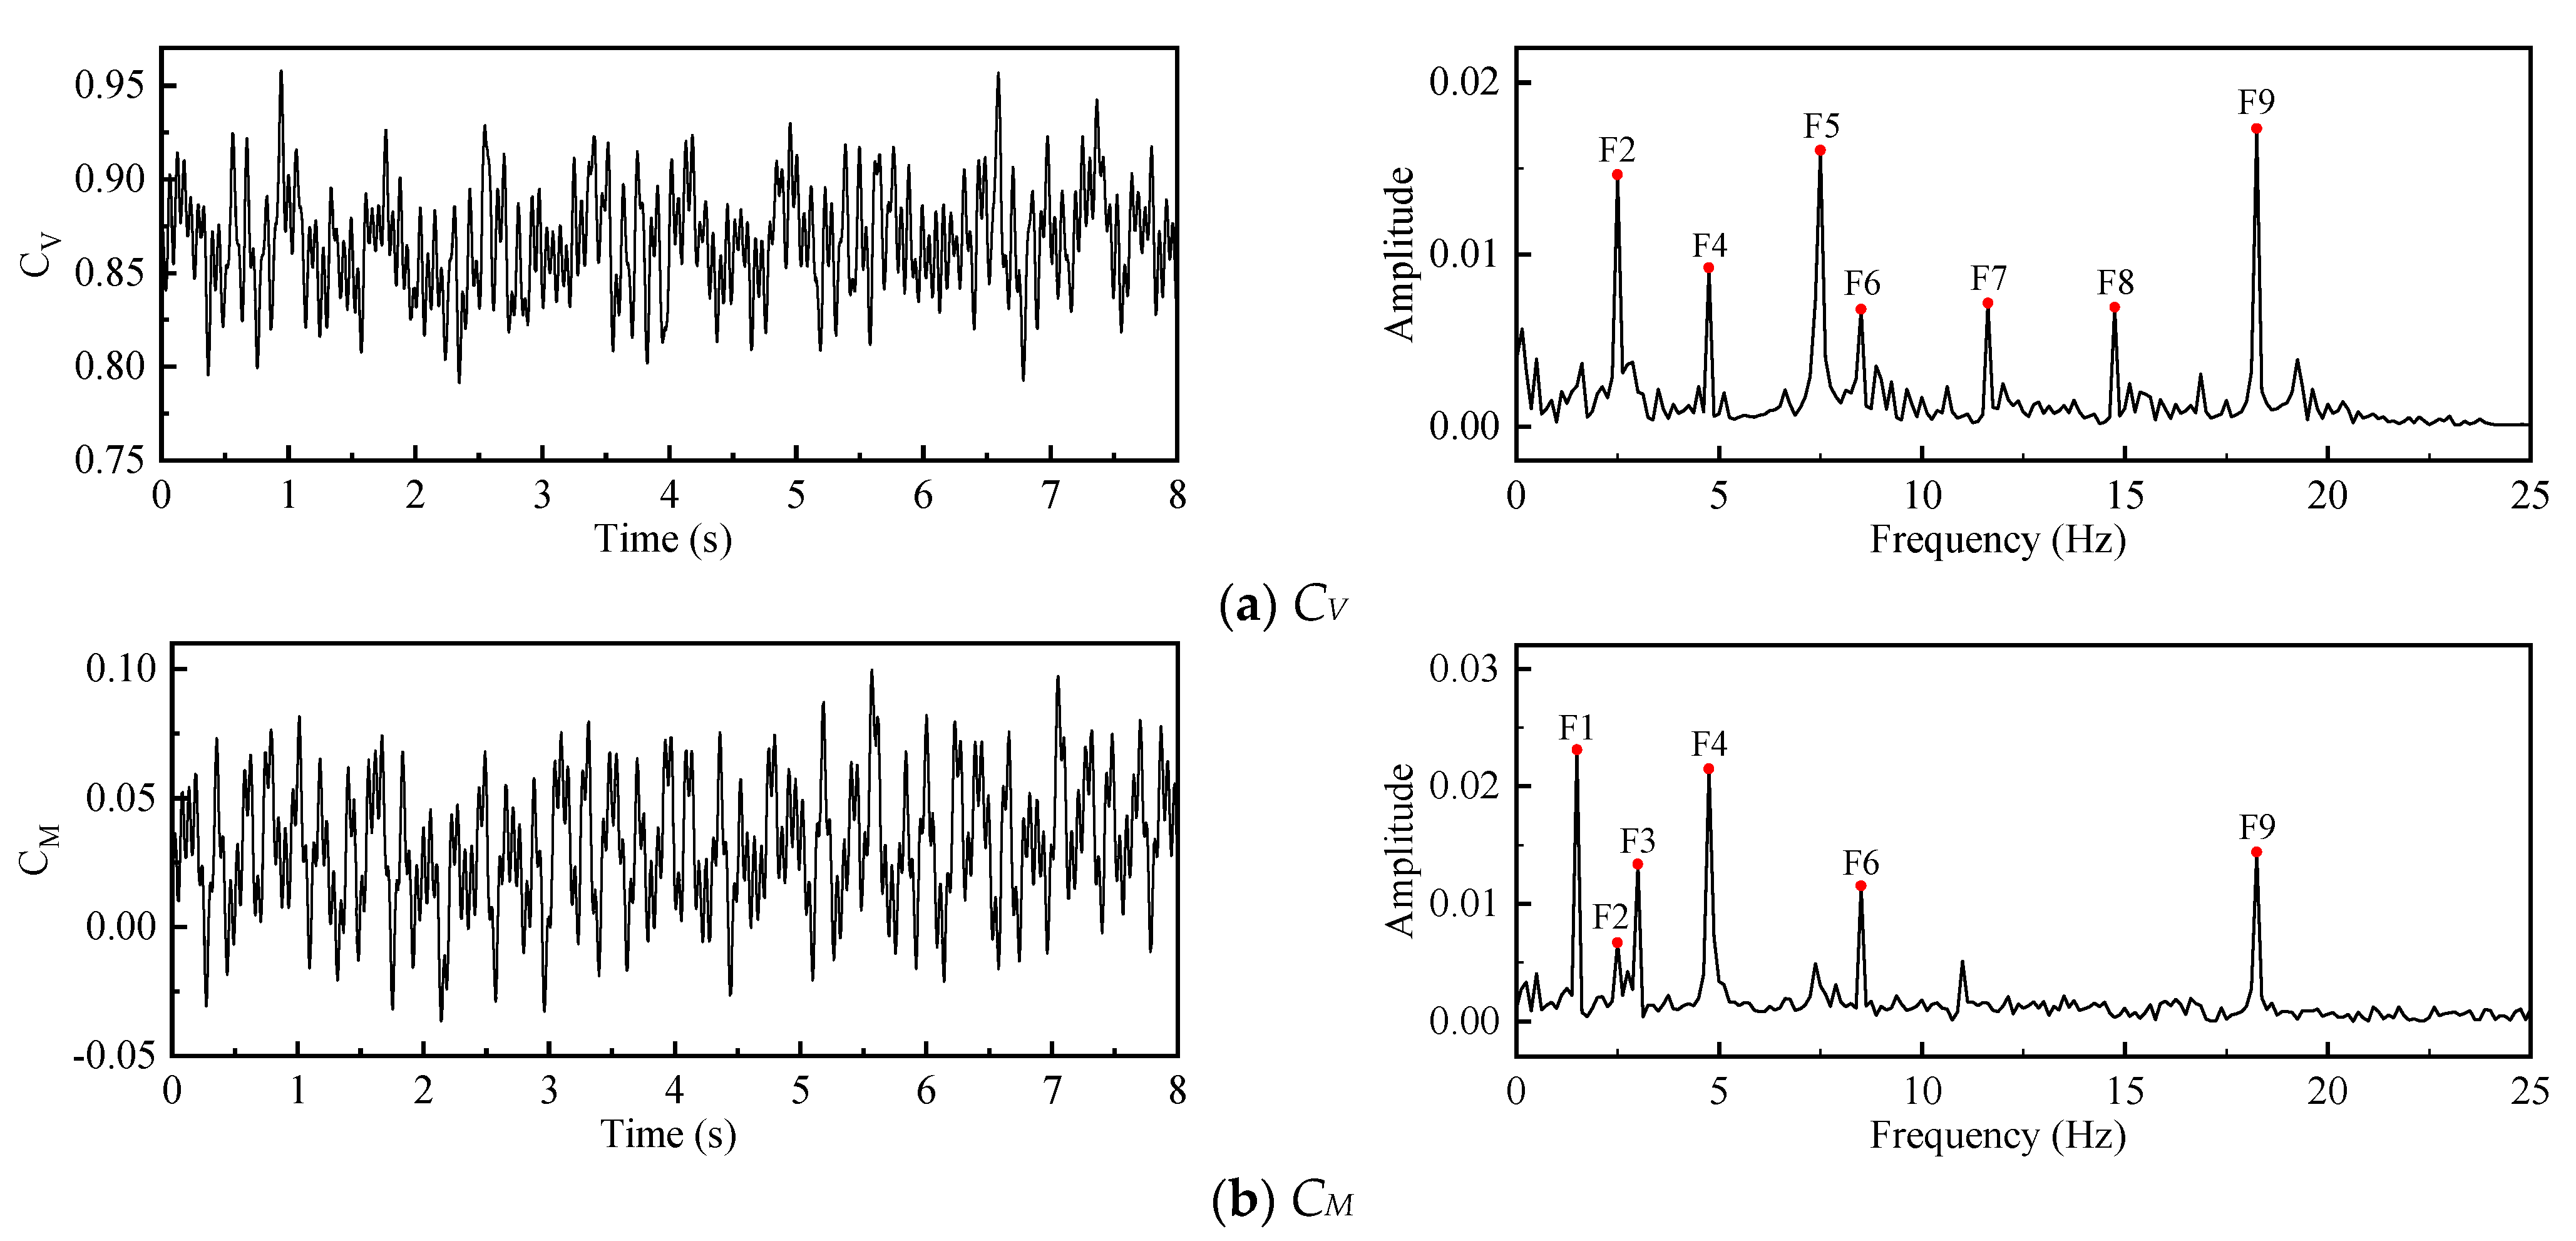
Figure 20 shows the time histories of the girder’s lift coefficient and moment coefficient after numerical simulation convergence. The vibrational frequencies of several peak components were obtained via Fourier transform, and their Strouhal numbers were calculated as shown in Table 8. The frequency with the highest amplitude corresponds to peak F5 of the lift coefficient at 7.46 Hz (St = 1.58) and peak F1 of the moment coefficient at 1.56 Hz (St = 0.33).
To investigate the impact of different areas of the truss girder’s VIV, monitoring points were positioned at various locations to record wind speed time histories. Table 9 shows the frequency domain analysis of the wind speed time histories recorded at the monitoring points. The monitoring points captured the frequencies of almost all the peaks in Table 8, as well as frequencies that had not been observed previously. The various peak components of the aerodynamic coefficients were caused by the vortices shedding with different frequencies generated by individual components of the truss girder.
In wind tunnel tests, the Strouhal number for vertical VIV at the +3° wind attack angle was 0.47, and that for the minor and major lock-in peaks of torsional VIV was 0.64 and 0.36, respectively. Monitoring points P1–P7 recorded a result of 0.52, which was relatively close to the Strouhal number of the vertical VIV. Similarly, monitoring point P19 gave recorded results of 0.33 and 0.64, which were relatively close to the Strouhal numbers of the torsional VIV. Monitoring point P19 is situated on the side of the girder where shedding vortices are more likely to drive the occurrence of torsional VIV on the bridge. Therefore, it can be considered that the vertical VIV of the truss girder may be mainly dominated by shedding vortices from the region above the upper deck or the wake region of the upper deck. Extraordinary consideration should be given to the aerodynamic shape in this region when considering measures to suppress the vertical VIV. Similarly, the torsional VIV of the truss girder may be mainly dominated by shedding vortices from the wake region of the lower deck. Extraordinary consideration should be given to the aerodynamic shape in this region when considering measures to suppress the torsional VIV.

4.5. Suppression Mechanism of Aerodynamic Mitigation Measures

During wind tunnel tests, the upper chord fairing and the lower chord inverted L-shaped deflector plate were discovered to have an obvious suppression effect on the VIV response of the double-deck truss girder. To explore the vibration suppression mechanism, numerical simulations of the truss girder’s cross-section with the upper fairing and lower chord inverted L-shaped deflector plate were conducted, and its effect on the flow field was analyzed. The wind speed was set to 6.05 m/s in the calculations, which corresponds to that of the real bridge.
Monitoring points P1–P7 allowed us to record wind speed histories, the frequency of which was close to the first-order vertical natural frequency of the double-deck truss girder. This suggests that the vortex shedding from the region above the upper deck or the wake region of the upper deck may dominate the vertical VIV. In wind tunnel tests, fairings were installed on both sides of the upper chord, resulting in a significant suppression of VIV. This indicates that the fairings may have disrupted the original pattern of vortex shedding in this region. To confirm this conjecture, numerical simulations were used to analyze it. Figure 21 shows the variations in vorticity within one complete vortex shedding cycle of the related region at +3° and +5° wind attack angles.
Compared to the vortex shedding pattern in the region above the upper deck (zone A) and wake region (zone B) of the original cross-section in 
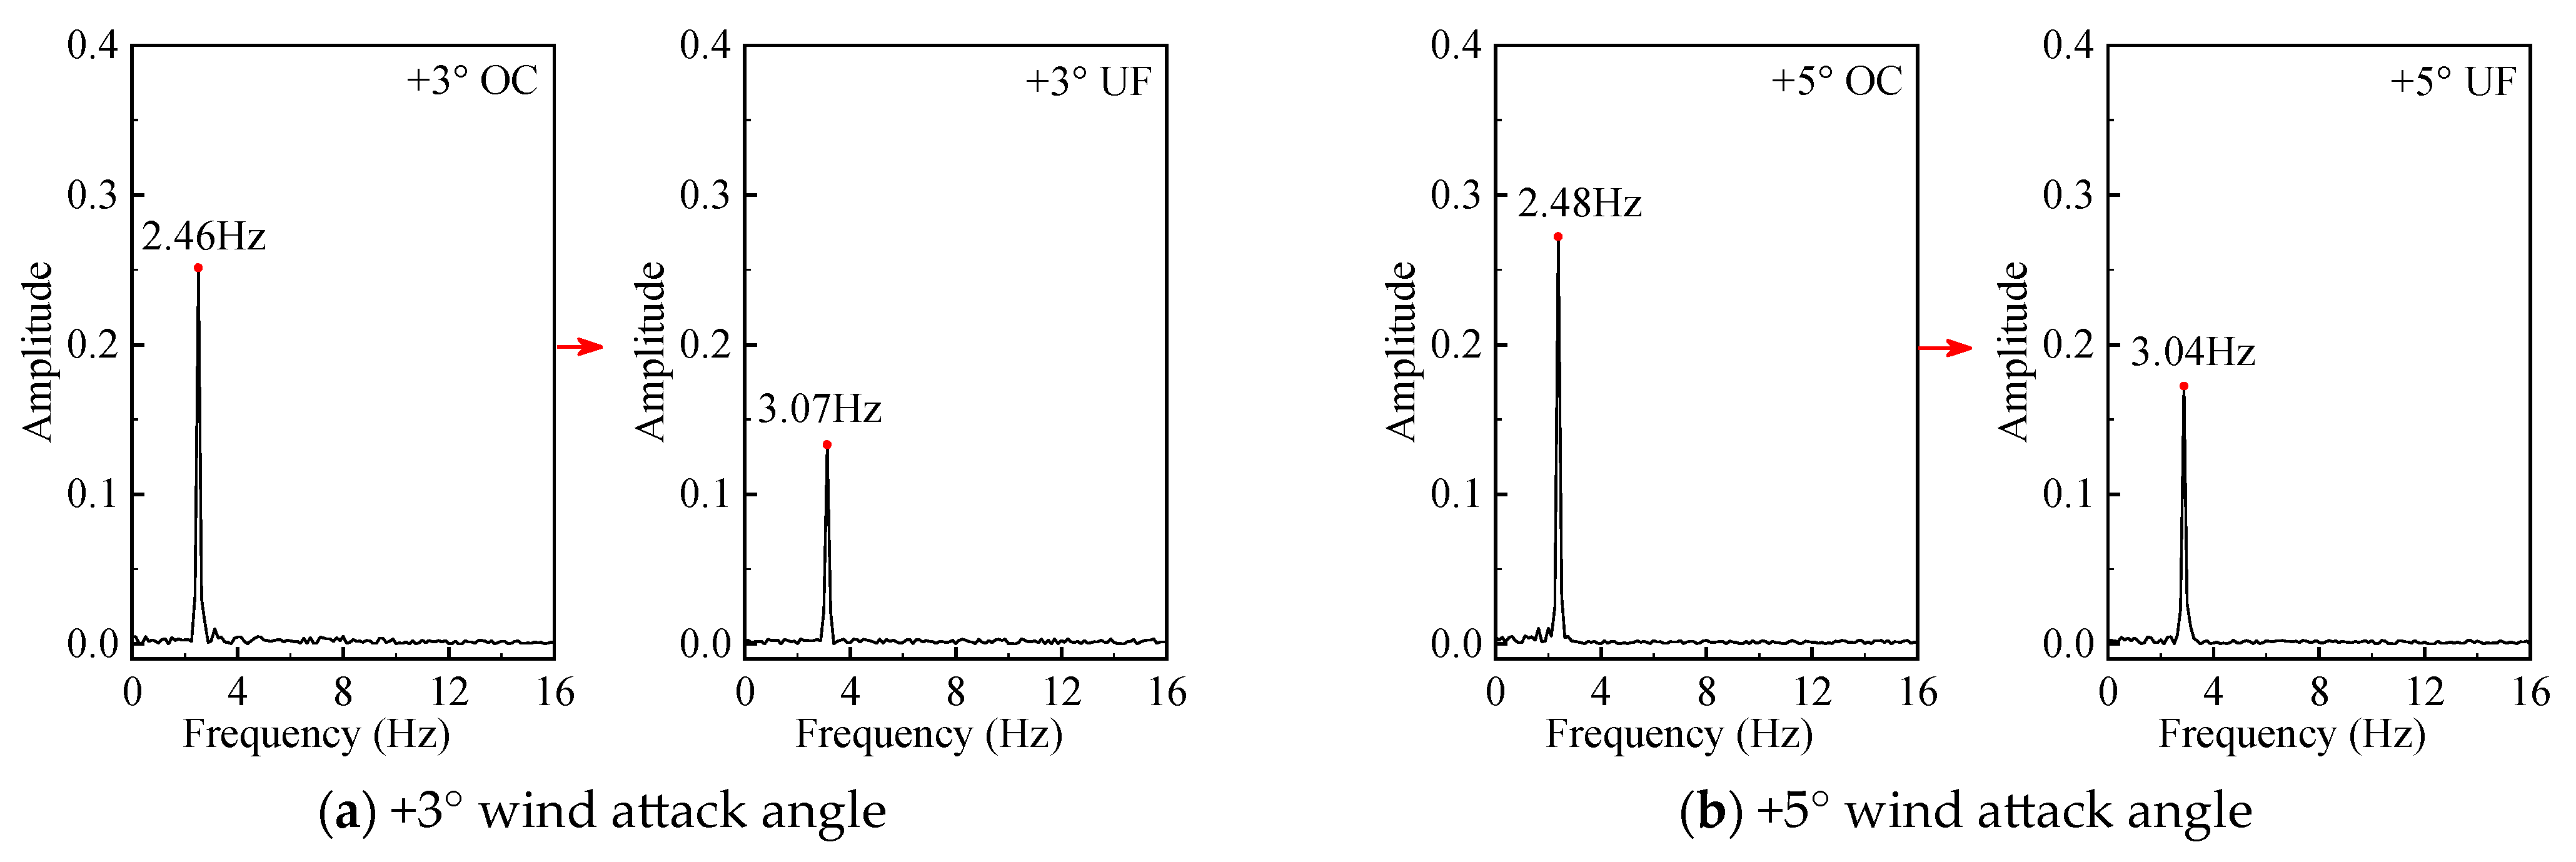
Figure 19, the installation of the upper chord’s fairing disrupted the original vortex shedding pattern. The fairing splits the incoming flow in half on the windward side of the upper deck. The guardrail blocks the incoming flow above, resulting in almost no vortex shedding, while the vorticity below is significantly reduced. The guardrail also blocks the flow in the wake region and forms a negligible small vortex at the top of the fairing. The shedding pattern in this region has changed from alternating shedding on both sides of the upper chord to shedding on only one side below, resulting in a significant reduction in vorticity. Spectral analysis was performed on the wind speed histories recorded at monitoring point P7, and the spectra variations are shown in Figure 22. The frequency of the vortex shedding increased from 2.46 Hz in the original cross-section to 3.07 Hz (St = 0.65) at +3° and from 2.48 Hz to 3.04 Hz (St = 0.64) at +5°. The corresponding Strouhal numbers of the vertical VIV at +3° and +5° wind attack angles were both 0.47 in the wind tunnel tests, which is far from the Strouhal number of monitoring point P7 after installing the upper chord fairing. This indicates that the wake area of the upper deck no longer drives the girder toward experiencing vertical VIV after installing the upper chord’s fairing. Monitoring points P1–P6 still recorded a similar Strouhal number of 0.51, indicating that the vortex shedding in the region above the upper deck may still dominate the vertical VIV of the truss girder. The upper chord’s fairing has improved the vortex shedding pattern in the region above the upper deck and in the wake region, resulting in a significant reduction in vorticity above the upper deck and the elimination of the driving force for the vertical VIV in the wake area. This has effectively improved the aerodynamic performance of the truss girder and achieved the goal of suppressing VIV.
The wind speed histories’ feedback from monitoring point P19 has a frequency that is close to the first-order torsional natural frequency of the double-deck truss girder. This suggests that the vortex shedding from the wake region of the lower deck may dominate the torsional VIV. In wind tunnel tests, the shape of the sidewalk corbel on both sides of the lower deck was changed into that of the inverted L-shaped deflector plate, resulting in a significant suppression of VIV. This indicates that the inverted L-shaped deflector plate may have disrupted the original pattern of vortex shedding in this region. To confirm this conjecture, numerical simulations were used to analyze it. 
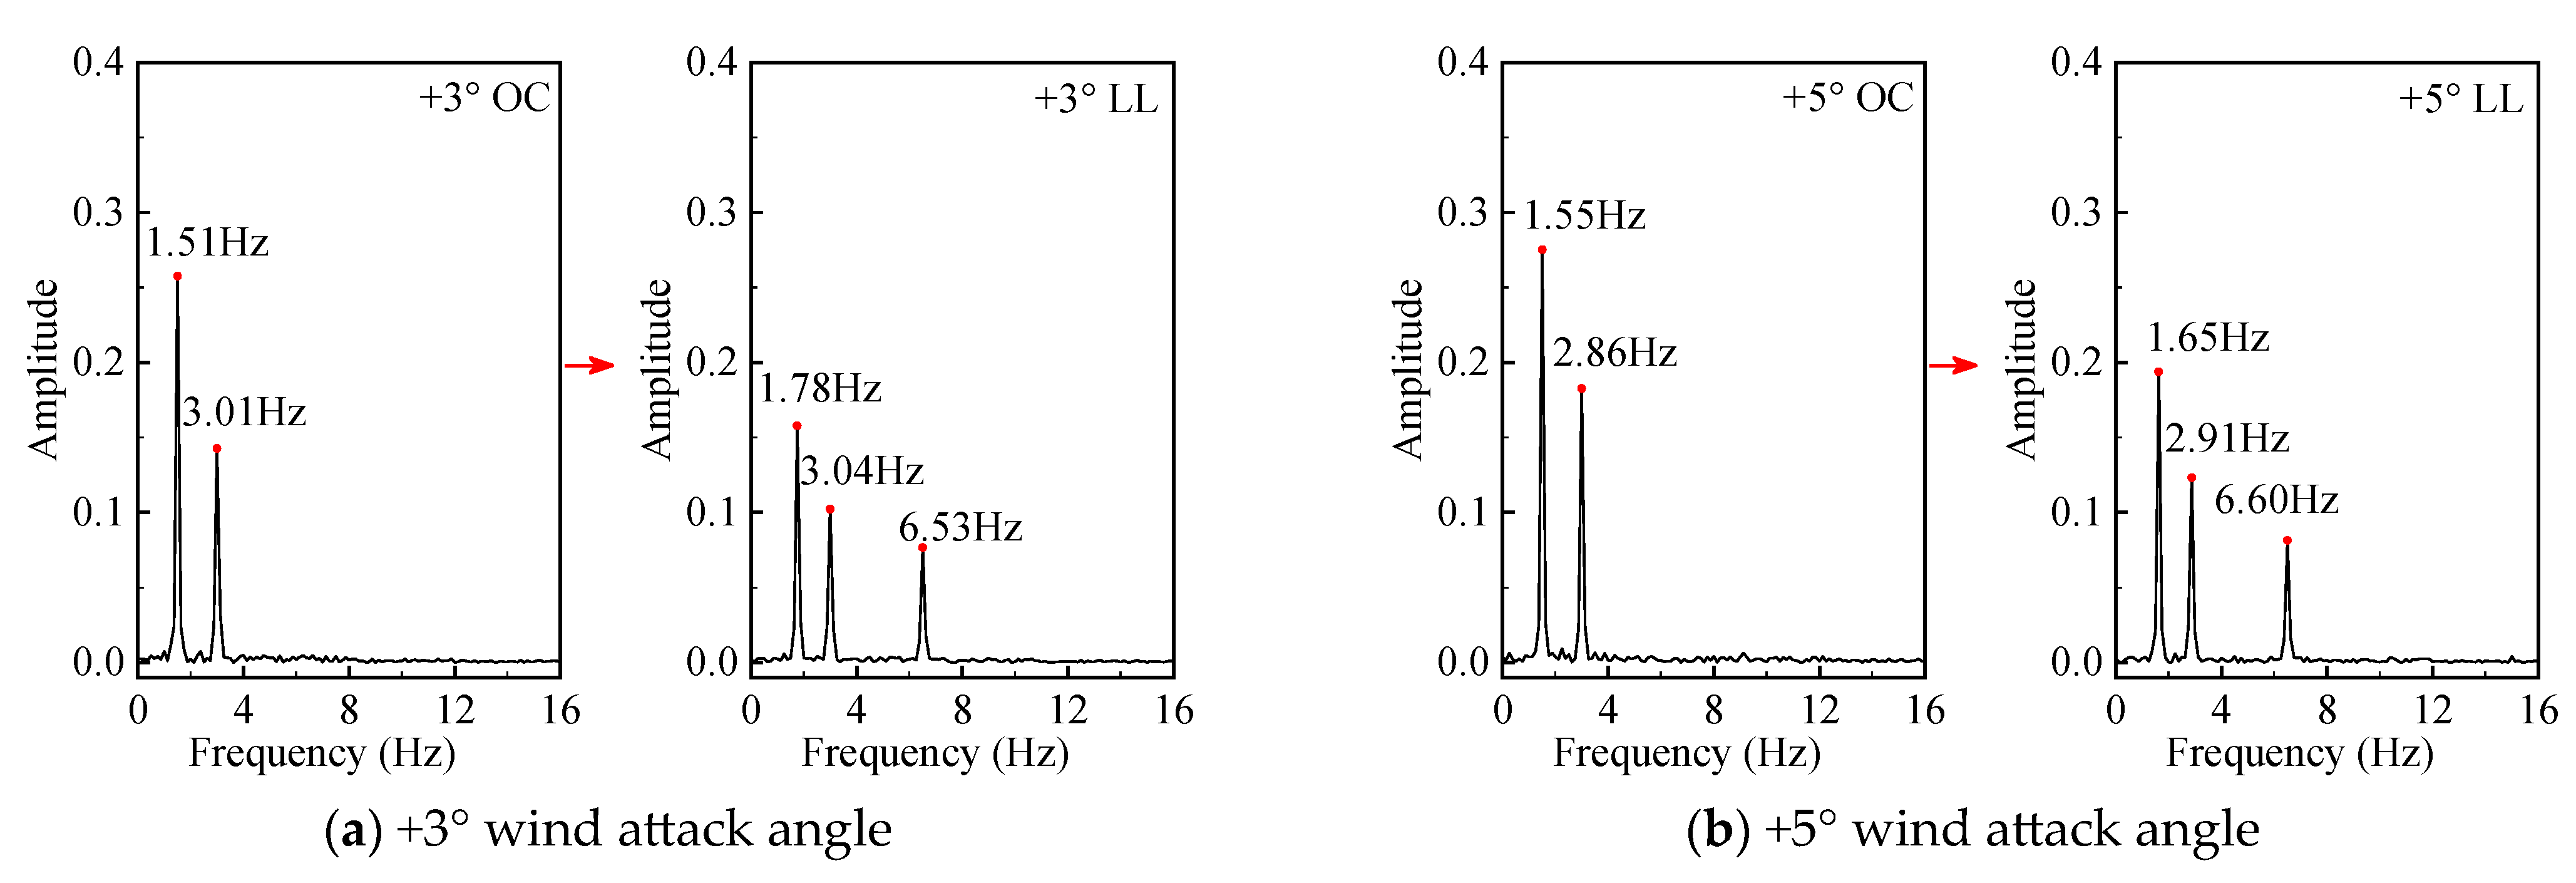
Figure 23 shows the variations of vorticity within one complete vortex shedding cycle of the related region at +3° and +5° wind attack angles.
Compared to the lower deck wake region (zone F) of the original cross-section in Figure 19, installing the lower chord inverted L-shaped deflector plate significantly changed the original vortex shedding pattern. The vortex shedding in the lower chord wake region changed from shedding away from the lower chord to shedding after leaving the end plate of the inverted L-shaped deflector plate, resulting in the further dissipation of vortex energy, a reduction in vortex size, and a significant decrease in vorticity. Spectral analysis was performed on the wind speed histories recorded at monitoring point P19, and the spectra variations are shown in Figure 24. The frequencies of the vortex shedding changed from 1.51 Hz and 3.01 Hz of the original cross-section to 1.78 Hz (St = 0.38) and 3.04 Hz (St = 0.64) at +3°. Due to the blocking effect of the inverted L-shaped deflector plate, a new peak component appeared near 6.53 Hz (St = 1.38). At a +5° wind attack angle, the frequencies changed from 1.55 Hz and 2.86 Hz to 1.65 Hz (St = 0.35) and 2.91 Hz (St = 0.62), and a new peak component appeared near 6.60 Hz (St = 1.40). The Strouhal numbers of the major and minor lock-in ranges for torsional VIV were 0.38 and 0.62 at +3° and 0.35 and 0.58 at +5° after installing the lower chord inverted L-shaped deflector plate in the wind tunnel tests, respectively. These values are similar to those of the first two peak components obtained at monitoring point P19 in the numerical simulation. However, the new peak component, which is significantly different from the Strouhal number corresponding to VIV, is unlikely to drive the bridge toward experiencing VIV. Moreover, it dissipates some of the energy of the airflow, which reduces the energy transferred to the vibration and weakens the response of VIV. The lower chord inverted L-shaped deflector plate has successfully disrupted the original pattern of alternating vortex shedding in this region, improving the aerodynamic performance of the truss girder, and achieving the goal of suppressing VIV.

5. Conclusions

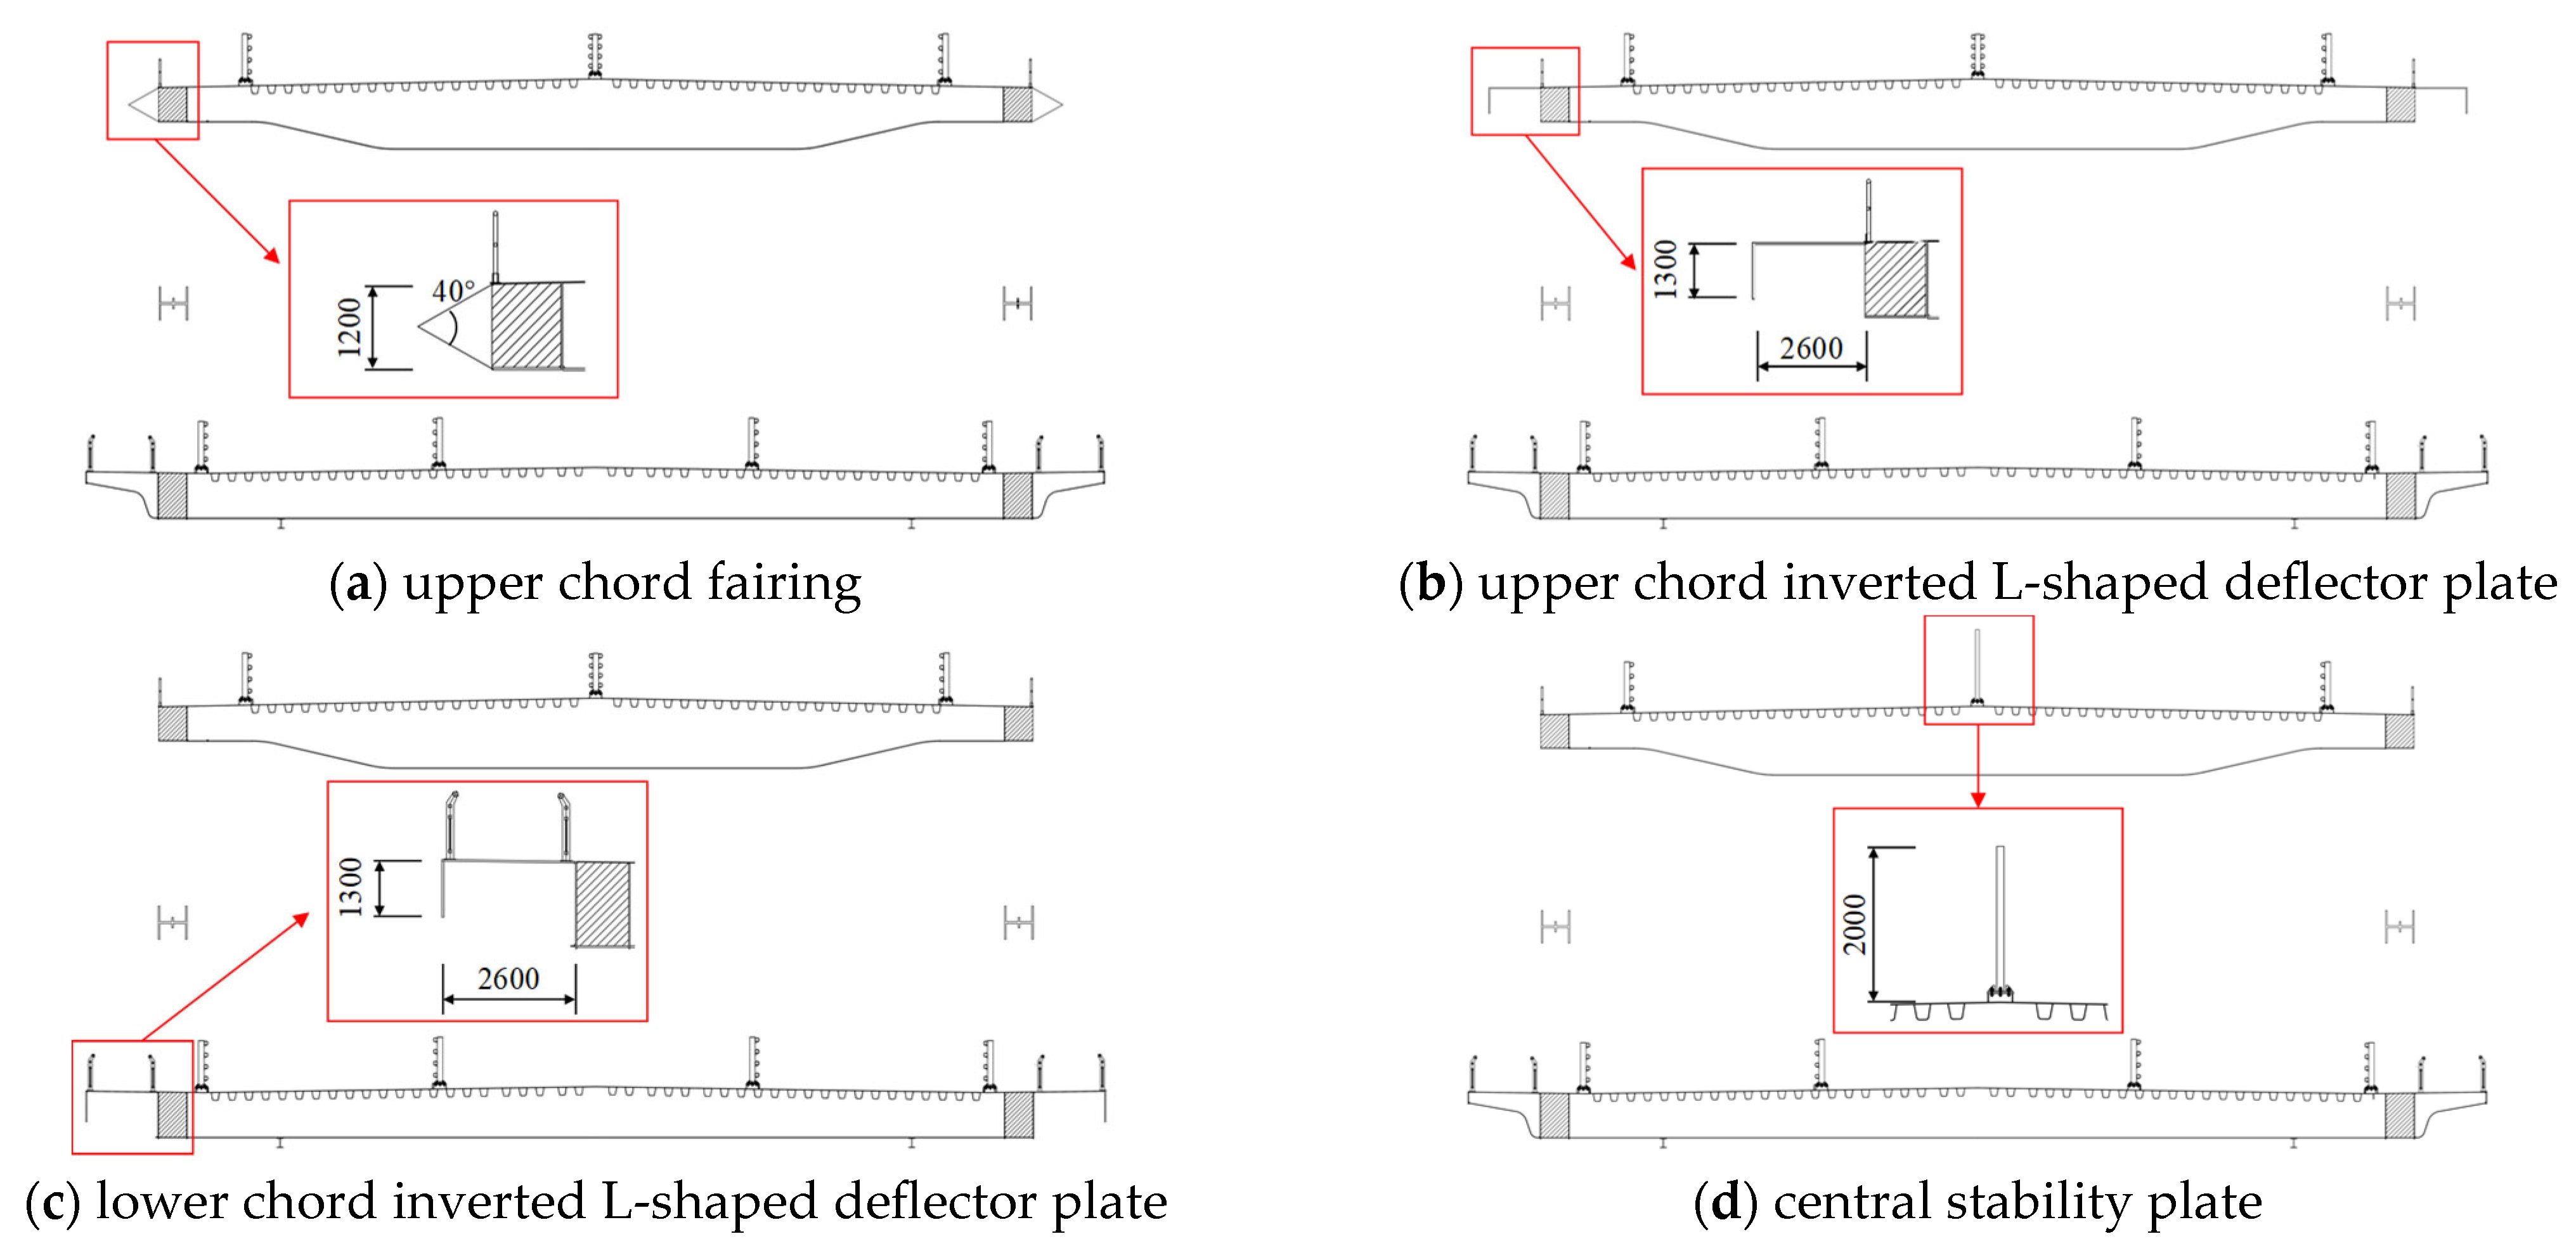
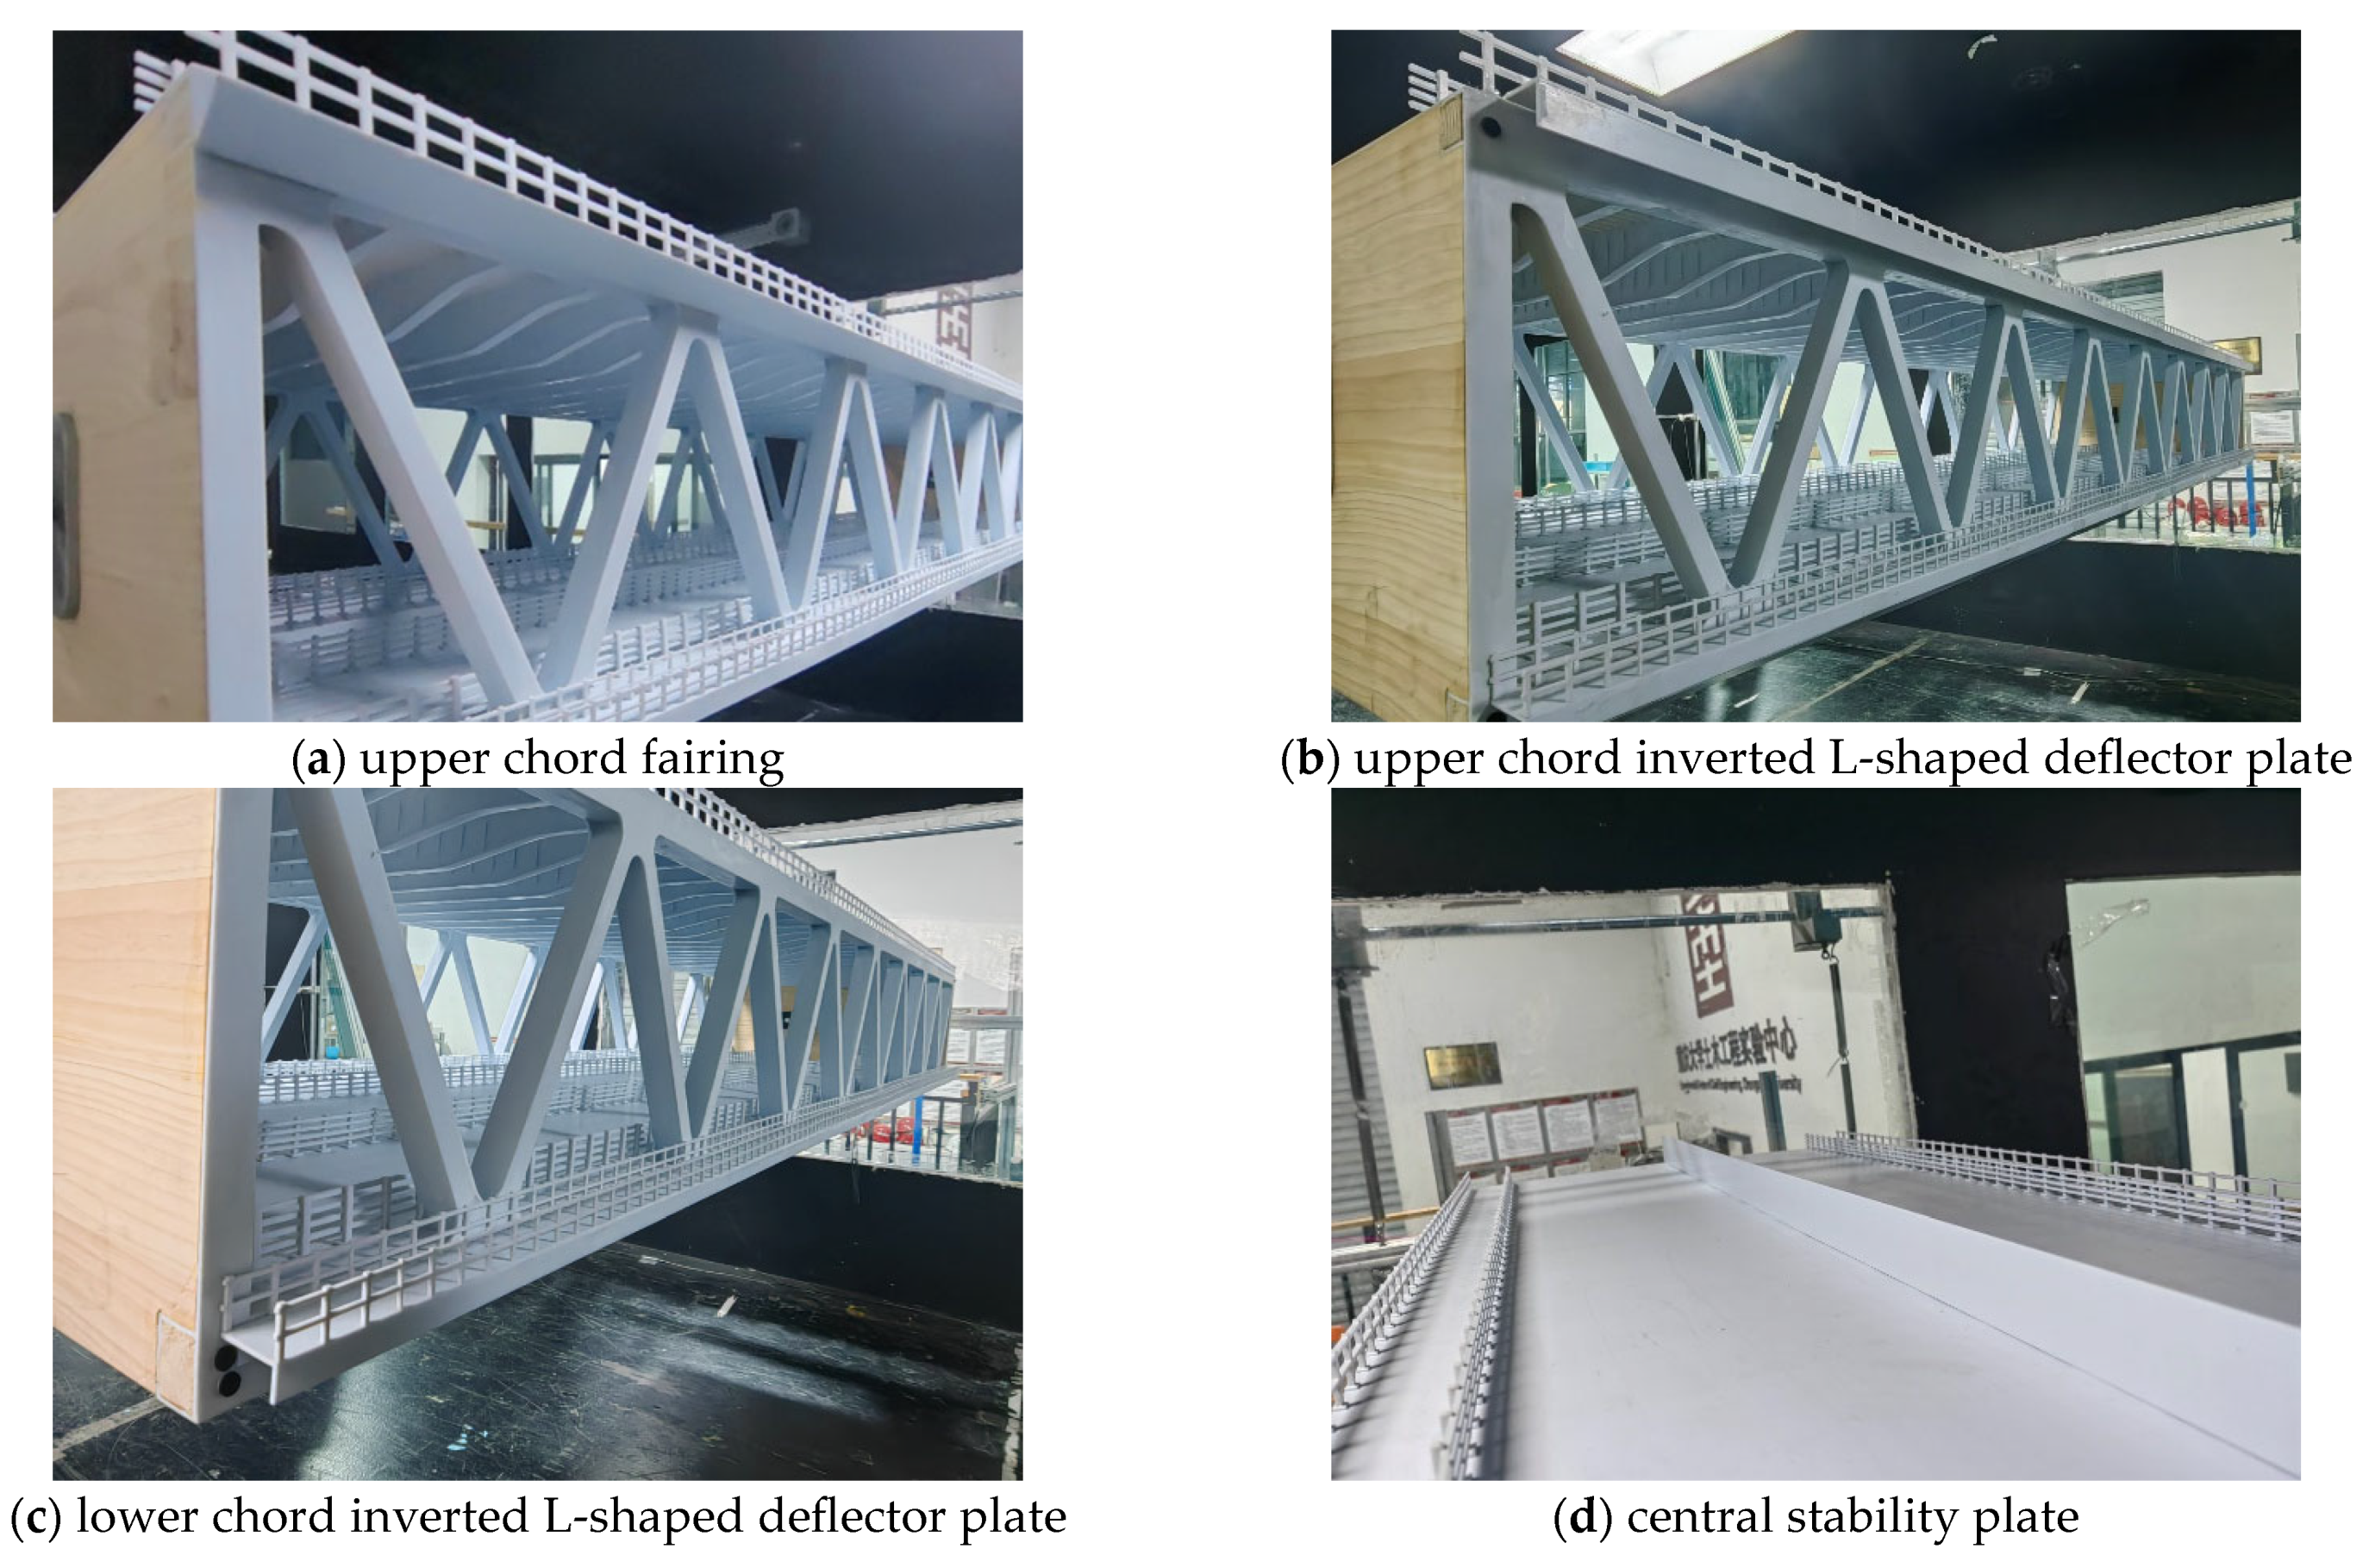
This paper investigates the characteristics of VIV of a double-deck truss girder and the effectiveness and mechanism of various aerodynamic mitigation measures. The investigation is based on the engineering background of the Huangjuetuo Yangtze River Bridge and involves employing wind tunnel tests and numerical simulations. The aerodynamic mitigation measures include the upper chord inverted L-shaped deflector plate, upper chord fairing, central stability plate, and lower chord inverted L-shaped deflector plate. The major conclusions are as follows.
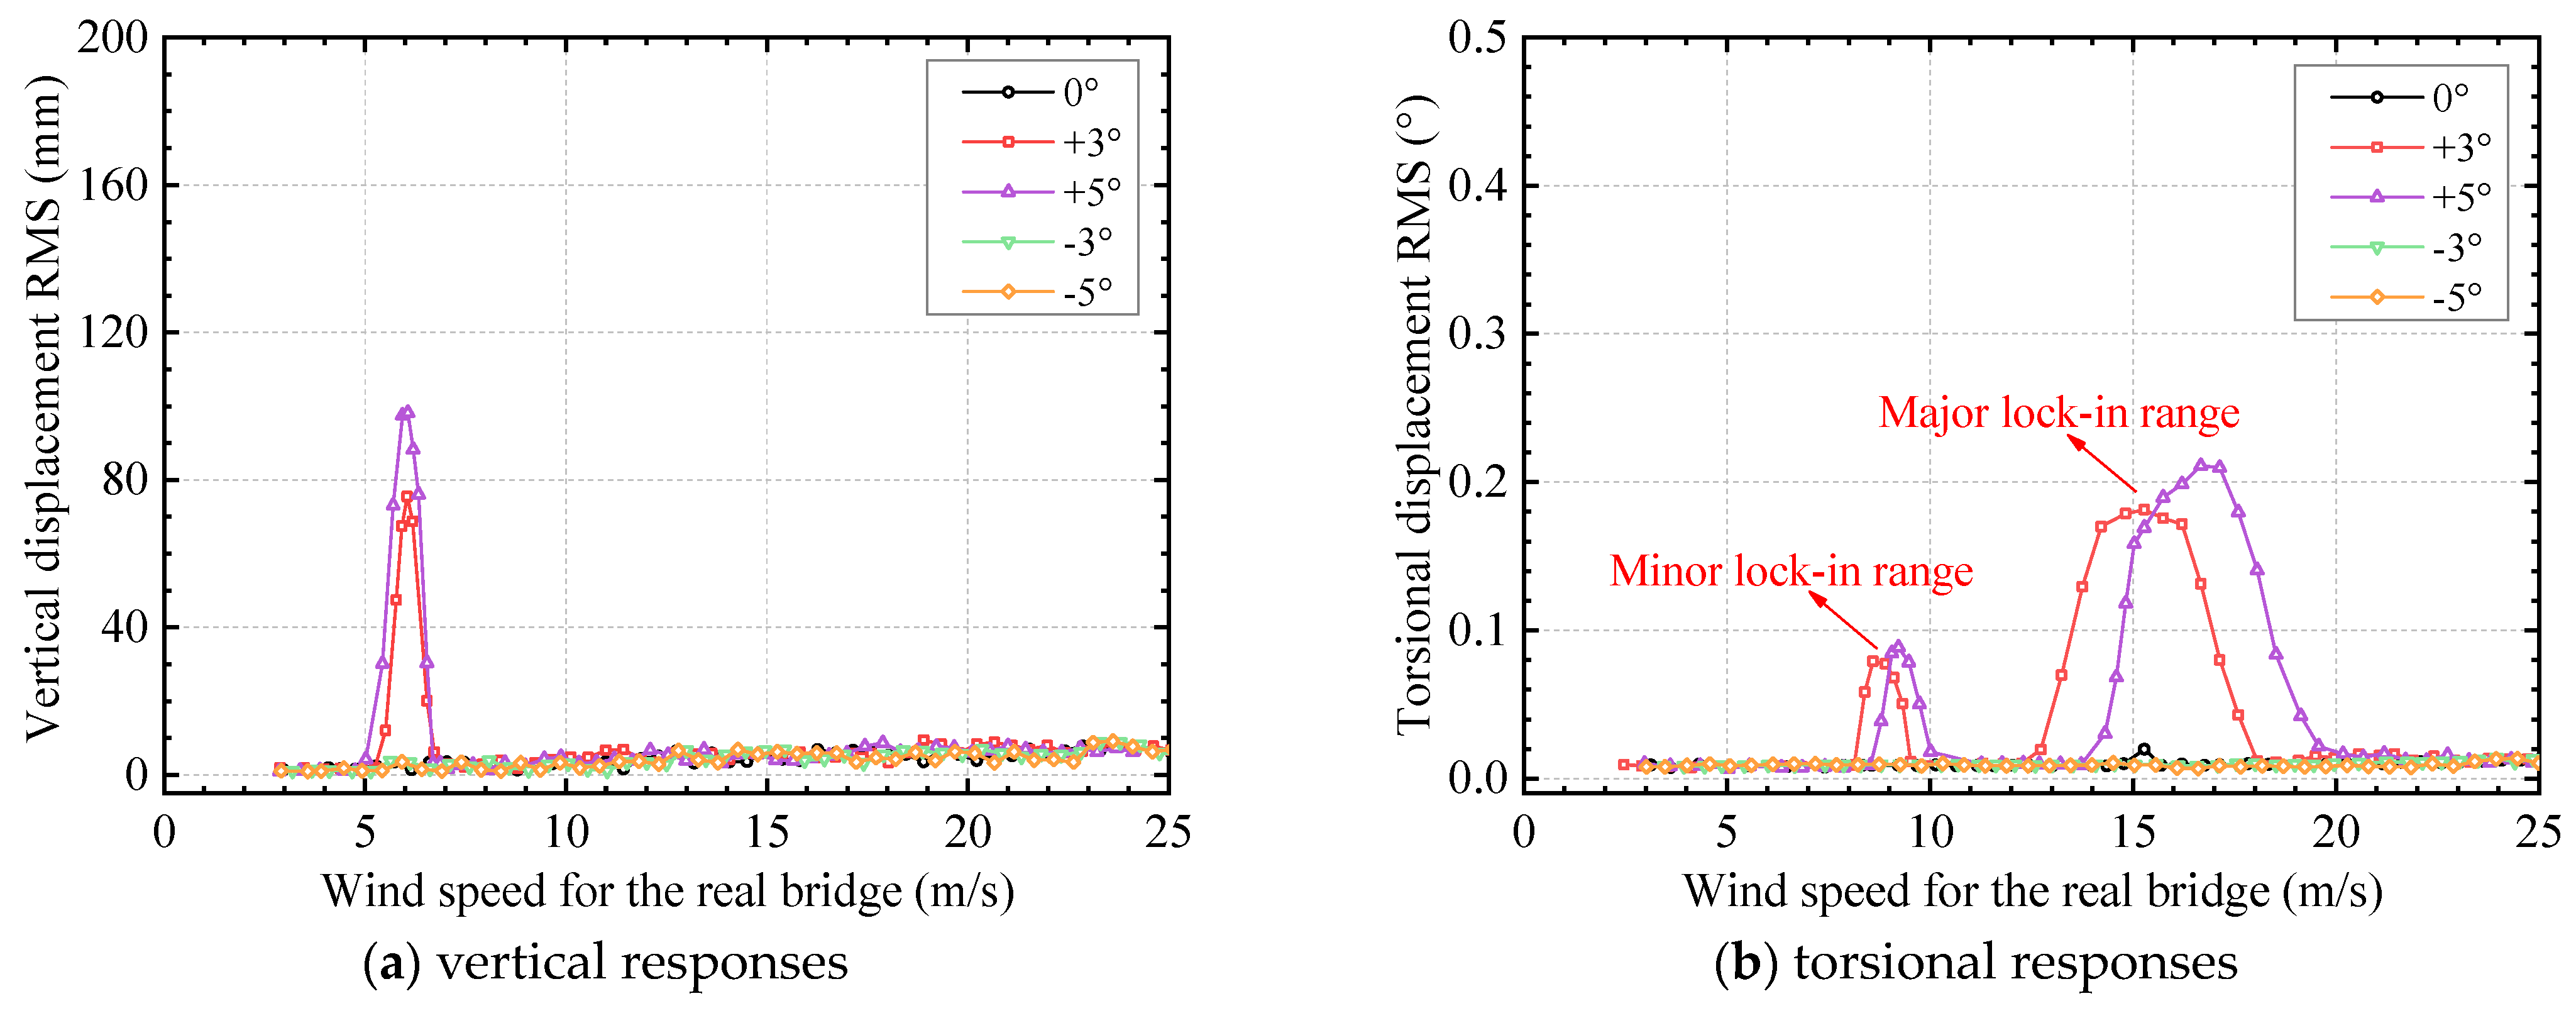
(1) Wind tunnel tests revealed obvious VIV on the sectional model at +3° and +5° wind attack angles. The maximum amplitude of VIV at the +5° wind attack angle was significantly higher than that at +3° for the original cross-section, and both were within the allowable values specified by the design code. The length of lock-in ranges for VIV did not show significant changes, but the major lock-in range for torsional VIV at the +5° wind attack angle was significantly increased.
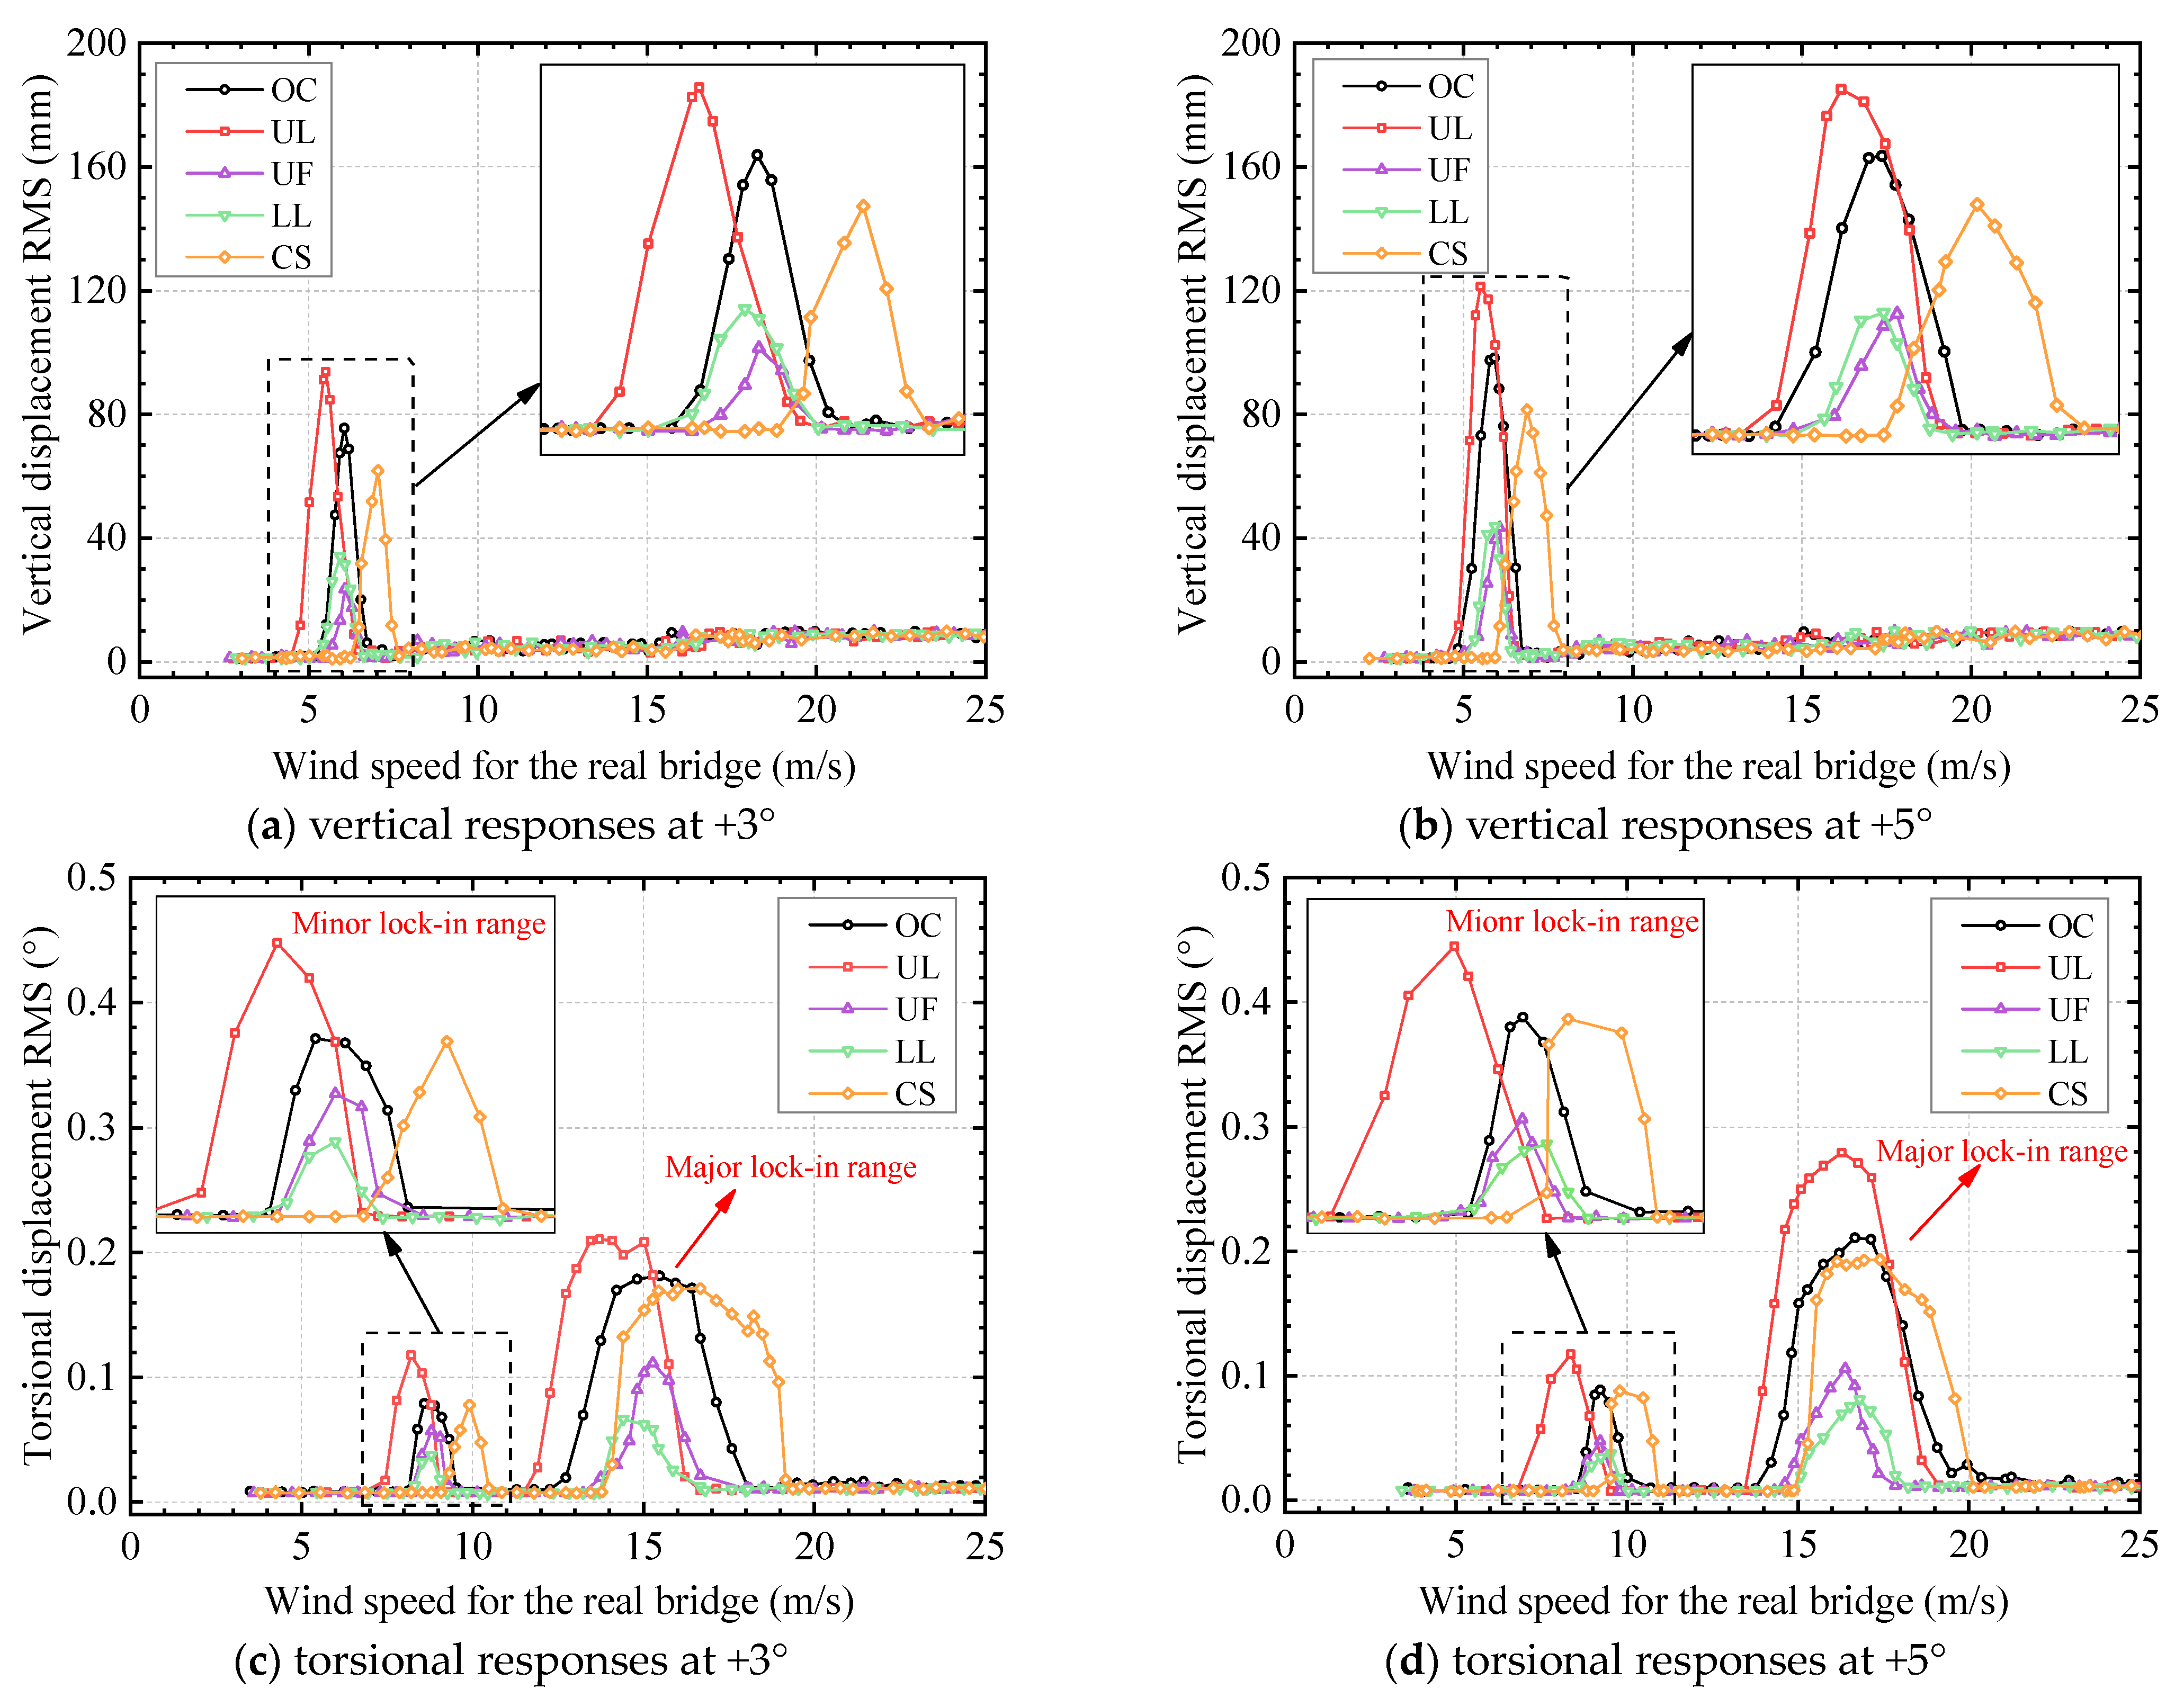
(2) Wind tunnel tests were utilized on the truss girder with four aerodynamic mitigation measures. The results showed that the upper chord inverted L-shaped deflector plate had a counterproductive effect on suppressing VIV, increasing the maximum amplitude of vertical VIV by 23.5% and that of torsional VIV by 32.9%, while significantly reducing the onset wind speed. The central stability plate had no significant impact on the maximum amplitude of VIV, but it significantly increased the onset wind speed. In contrast, the upper chord fairing and lower chord inverted L-shaped deflector plate had a significant inhibitory effect on VIV. The upper chord fairings reduced vertical VIV by up to 69.0% and torsional VIV by up to 49.8%, while the lower chord inverted L-shaped deflector plates reduced vertical VIV by up to 55.4% and torsional VIV by up to 63.5%. Additionally, both aerodynamic measures reduced the length of lock-in ranges for VIV.
(3) The double-deck truss girder has a complex structure, and the flow characteristics vary significantly at different locations. Numerical analysis shows that the incoming flow passing through the discrete components of the girder generates vortices of varying sizes and frequencies. When the frequency of vortex shedding is close to the natural frequency of the bridge, the vortices may become the primary driver of VIV. It is believed that vortex shedding from the region above the upper deck and the wake region of the upper deck may mainly dominate vertical VIV, while vortex shedding from the wake region of the lower deck may mainly dominate torsional VIV.
(4) Numerical analysis was conducted on the truss girder’s cross-section with the upper chord fairing and lower chord inverted L-shaped deflector plate to investigate the vibration suppression mechanism. The results showed that the upper chord fairing significantly decreased the vortex intensity around the upper deck, and the wake region no longer drove the bridge toward experiencing VIV. The lower chord inverted L-shaped deflector plate dissipated some of the incoming flow’s energy, significantly decreasing the vortex intensity in the wake region. These measures successfully disrupted the original vortex shedding pattern of the girder, suppressing the formation or reducing the intensity of vortices and thereby suppressing VIV.
(5) The aerodynamic mitigation measures implemented to suppress VIV require further investigation to determine their impact on other wind-induced vibration issues. Furthermore, conduction a more precise investigation of VIV in truss girders, 3D CFD simulations and cross-checking the CFD results with PIV analysis are recommended for subsequent studies.

Author Contributions

Conceptualization, G.Y.; methodology, G.Y., Y.C. and Y.Y.; software, Y.C. and L.W.; validation, Y.C. and Y.Y.; formal analysis, G.Y.; investigation, G.Y. and Y.Y.; resources, Y.Z.; data curation, Y.C. and H.D.; writing—original draft preparation, Y.C.; writing—review and editing, G.Y. and Y.Y.; funding acquisition, Y.Z.; supervision, Y.Y. and Y.Z.; project administration, Y.Y.; visualization, Y.C. and H.D. All authors have read and agreed to the published version of the manuscript.

Funding

This research was funded by Chongqing City Infrastructure Construction Investment Co., Ltd., grant number CQCT-JSA-GC-2021-0140.

Institutional Review Board Statement

Not applicable.

Informed Consent Statement

Not applicable.

Data Availability Statement

Not applicable.

Conflicts of Interest

The authors declare no conflict of interest.

References

  1. Liang, L.T.; Feng, Z.Q.; Xu, Y.Q.; Chen, Z.Q.; Liang, L.N. A Parallel Scheme of Friction Dampers and Viscous Dampers for Girder-End Longitudinal Displacement Control of a Long-Span Suspension Bridge under Operational and Seismic Conditions. Buildings 2023, 13, 16. [Google Scholar] [CrossRef]
  2. Kusano, I.; Montoya, M.C.; Baldomir, A.; Nieto, F.; Jurado, J.A.; Hernandez, S. Reliability based design optimization for bridge girder shape and plate thicknesses of long -span suspension bridges considering aeroelastic constraint. J. Wind Eng. Ind. Aerodyn. 2020, 202, 14. [Google Scholar] [CrossRef]
  3. Yang, Y.; Gang, Y.; Wei, F.J.; Qin, W.H. Buffeting performance of long-span suspension bridge based on measured wind data in a mountainous region. J. Vibroeng. 2018, 20, 621–635. [Google Scholar] [CrossRef]
  4. Li, H.; He, X.H.; Hu, L.; Xu, G.J. Quantification of aerodynamic forces for truss bridge-girders based on wind tunnel test and kriging surrogate model. Adv. Civ. Eng. 2021, 24, 2161–2175. [Google Scholar] [CrossRef]
  5. Deniz, S.; Staubli, T. Oscillating rectangular and octagonal profiles: Interaction of leading- and trailing-edge vortex formation. J. Fluids Struct. 1997, 11, 3–31. [Google Scholar] [CrossRef]
  6. Taylor, Z.J.; Palombi, E.; Gurka, R.; Kopp, G.A. Features of the turbulent flow around symmetric elongated bluff bodies. J. Fluids Struct. 2011, 27, 250–265. [Google Scholar] [CrossRef]
  7. Nakamura, Y.; Nakashima, M. Vortex excitation of prisms with elongated rectangular, h and perpendicular-to cross-sections. J. Fluid Mech. 1986, 163, 149–169. [Google Scholar] [CrossRef]
  8. Franzini, G.R. An elastic rotative nonlinear vibration absorber (ERNVA) as a passive suppressor for vortex-induced vibrations. Nonlinear Dyn. 2021, 103, 255–277. [Google Scholar] [CrossRef]
  9. Li, H.; Laima, S.J.; Ou, J.P.; Zhao, X.F.; Zhou, W.S.; Yu, Y.; Li, N.; Liu, Z.Q. Investigation of vortex-induced vibration of a suspension bridge with two separated steel box girders based on field measurements. Eng. Struct. 2011, 33, 1894–1907. [Google Scholar] [CrossRef]
  10. Zhou, S.; Hua, X.G.; Chen, Z.Q.; Chen, W. Experimental investigation of correction factor for VIV amplitude of flexible bridges from an aeroelastic model and its 1:1 section model. Eng. Struct. 2017, 141, 263–271. [Google Scholar] [CrossRef]
  11. Yang, Y.; Yang, L.; Wu, B.; Yao, G.; Li, H.; Robert, S. Safety Prediction Using Vehicle Safety Evaluation Model Passing on Long-Span Bridge with Fully Connected Neural Network. Adv. Civ. Eng. 2019, 2019, 12. [Google Scholar] [CrossRef]
  12. Kim, S.J.; Kim, H.K.; Calmer, R.; Park, J.; Kim, G.S.; Lee, D.K. Operational field monitoring of interactive vortex-induced vibrations between two parallel cable-stayed bridges. J. Wind Eng. Ind. Aerodyn. 2013, 123, 143–154. [Google Scholar] [CrossRef]
  13. Fujino, Y.; Siringoringo, D.M.; Ikeda, Y.; Nagayama, T.; Mizutani, T. Research and Implementations of Structural Monitoring for Bridges and Buildings in Japan. Engineering 2019, 5, 1093–1119. [Google Scholar] [CrossRef]
  14. Yang, Y.X.; Zhang, J.J.; Cao, F.C.; Ge, Y.J.; Zhao, L. Evaluation and improvement of wind environment and vehicle safety on long-span bridge deck under strong crosswind. J. Wind Eng. Ind. Aerodyn. 2022, 228, 8. [Google Scholar] [CrossRef]
  15. Battista, R.C.; Pfeil, M.S. Reduction of vortex-induced oscillations of Rio-Niteroi bridge by dynamic control devices. J. Wind Eng. Ind. Aerodyn. 2000, 84, 273–288. [Google Scholar] [CrossRef]
  16. MacDonald, J.H.G.; Irwin, P.A.; Fletcher, M.S. Vortex-induced vibrations of the Second Severn Crossing cable-stayed bridge—Full-scale and wind tunnel measurements. Proc. Inst. Civ. Eng.-Struct. Build. 2002, 152, 123–134. [Google Scholar] [CrossRef]
  17. Gao, D.L.; Deng, Z.; Yang, W.H.; Chen, W.L. Review of the excitation mechanism and aerodynamic flow control of vortex-induced vibration of the main girder for long-span bridges: A vortex-dynamics approach. J. Fluids Struct. 2021, 105, 28. [Google Scholar] [CrossRef]
  18. Larsen, A.; Esdahl, S.; Andersen, J.E.; Vejrum, T. Storebae lt suspension bridge-vortex shedding excitation and mitigation by guide vanes. J. Wind Eng. Ind. Aerodyn. 2000, 88, 283–296. [Google Scholar] [CrossRef]
  19. Fujino, Y.; Yoshida, Y. Wind-induced vibration and control of Trans-Tokyo Bay Crossing bridge. J. Struct. Eng.-ASCE 2002, 128, 1012–1025. [Google Scholar] [CrossRef]
  20. Wu, B.; Zhang, L.; Yang, Y.; Liu, L.; Li, H. Investigation and Control of VIVs with Multi-Lock-in Regions on Wide Flat Box Girders. J. Control Sci. Eng. 2017, 2017, 7208241. [Google Scholar] [CrossRef]
  21. Nariman, N.A. Influence of fluid-structure interaction on vortex induced vibration and lock-in phenomena in long span bridges. Front. Struct. Civ. Eng. 2016, 10, 363–384. [Google Scholar] [CrossRef]
  22. Larsen, A. A generalized-model for assessment of vortex-induced vibrations of flexible structures. J. Wind Eng. Ind. Aerodyn. 1995, 57, 281–294. [Google Scholar] [CrossRef]
  23. Delaunay, D.; Grillaud, G. Field measurements of the wind-induced response of a cable stayed bridge: Validation of previsional studies. J. Wind Eng. Ind. Aerodyn. 1998, 74–76, 883–890. [Google Scholar] [CrossRef]
  24. Nguyen, D.T.; Hargreaves, D.M.; Owen, J.S. Vortex-induced vibration of a 5:1 rectangular cylinder: A comparison of wind tunnel sectional model tests and computational simulations. J. Wind Eng. Ind. Aerodyn. 2018, 175, 1–16. [Google Scholar] [CrossRef]
  25. Noguchi, K.; Ito, Y.; Yagi, T. Numerical evaluation of vortex-induced vibration amplitude of a box girder bridge using forced oscillation method. J. Wind Eng. Ind. Aerodyn. 2020, 196, 10. [Google Scholar] [CrossRef]
  26. Guinchard, M.; Angeletti, M.; Boyer, F.B.; Catinaccio, A.; Gargiulo, C.G.; Lacny, L.L.; Laudi, E.L.; Scislo, L.S. Experimental Modal Analysis of Lightweight Structures Used in Particle Detectors: Optical Non-Contact Method; JACoW Publishing: Geneva, Switzerland, 2018; p. WEPMF079. [Google Scholar] [CrossRef]
  27. Szczepanik-Scislo, N.; Antonowicz, A.; Scislo, L. PIV measurement and CFD simulations of an air terminal device with a dynamically adapting geometry. SN Appl. Sci. 2019, 1, 9. [Google Scholar] [CrossRef]
  28. Fujino, Y.; Siringoringo, D. Vibration Mechanisms and Controls of Long-Span Bridges: A Review. Struct. Eng. Int. 2013, 23, 248–268. [Google Scholar] [CrossRef]
  29. Zhou, R.; Yang, Y.X.; Ge, Y.J.; Mendis, P.; Mohotti, D. Practical countermeasures for the aerodynamic performance of long-span cable-stayed bridges with open decks. Wind Struct. 2015, 21, 223–239. [Google Scholar] [CrossRef]
  30. Xu, K.; Bi, K.M.; Han, Q.; Li, X.P.; Du, X.L. Using tuned mass damper inerter to mitigate vortex-induced vibration of long-span bridges: Analytical study. Eng. Struct. 2019, 182, 101–111. [Google Scholar] [CrossRef]
  31. Gao, G.Z.; Zhu, L.D.; Li, J.W.; Han, W.S. Application of a new empirical model of nonlinear self-excited force to torsional vortex-induced vibration and nonlinear flutter of bluff bridge sections. J. Wind Eng. Ind. Aerodyn. 2020, 205, 15. [Google Scholar] [CrossRef]
  32. Zhou, R.; Ge, Y.J.; Liu, S.Y.; Yang, Y.X.; Du, Y.L.; Zhang, L.H. Nonlinear flutter control of a long-span closed-box girder bridge with vertical stabilizers subjected to various turbulence flows. Thin-Walled Struct. 2020, 149, 13. [Google Scholar] [CrossRef]
  33. Chen, J.J.; Chen, M.Z.Q.; Hu, Y.L. Vortex-Induced Vibration Suppression of Bridges by Inerter-Based Dynamic Vibration Absorbers. Shock Vib. 2021, 2021, 18. [Google Scholar] [CrossRef]
  34. Larsen, A.; Wall, A. Shaping of bridge box girders to avoid vortex shedding response. J. Wind Eng. Ind. Aerodyn. 2012, 104, 159–165. [Google Scholar] [CrossRef]
  35. Wang, Q.; Liao, H.; Li, M.; Ma, C. Influence of aerodynamic configuration of a streamline box girder on bridge flutter and vortex-induced vibration. J. Mod. Transp. 2011, 19, 261–267. [Google Scholar] [CrossRef]
  36. Omidi, J.; Mazaheri, K. Aerodynamic Enhancement and Improving the Performance of a Six-Megawatt DOWEC Wind Turbine by Micro-Plasma Actuator. Int. J. Mech. Sci. 2021, 195, 18. [Google Scholar] [CrossRef]
  37. Hua, X.G.; Wang, C.Q.; Li, S.L.; Chen, Z.Q. Experimental investigation of wind-induced vibrations of main cables for suspension bridges in construction phases. J. Fluids Struct. 2020, 93, 17. [Google Scholar] [CrossRef]
  38. Zhan, J.; Xin, D.B.; Ou, J.P.; Liu, Z.W. Experimental study on suppressing vortex -induced vibration of a long -span bridge by installing the wavy railings. J. Wind Eng. Ind. Aerodyn. 2020, 202, 13. [Google Scholar] [CrossRef]
  39. Nagao, F.; Utsunomiya, H.; Yoshioka, E.; Ikeuchi, A.; Kobayashi, H. Effects of handrails on separated shear flow and vortex-induced oscillation. J. Wind Eng. Ind. Aerodyn. 1997, 71, 819–827. [Google Scholar] [CrossRef]
  40. Bai, H.; Li, R.; Xu, G.J.; Kareem, A. Aerodynamic performance of II-shaped composite deck cable-stayed bridges including VIV mitigation measures. J. Wind Eng. Ind. Aerodyn. 2021, 208, 26. [Google Scholar] [CrossRef]
  41. Liu, L.L.; Zou, Y.F.; He, X.H.; Yang, J.F.; Wang, Z.; Guo, D.Y. Experimental investigation on vortex-induced vibration of a long-span rail-cum-road bridge with twin separated parallel decks. J. Wind Eng. Ind. Aerodyn. 2022, 228, 27. [Google Scholar] [CrossRef]
  42. Fang, C.; Hu, R.J.; Tang, H.J.; Li, Y.L.; Wang, Z.W. Experimental and numerical study on vortex-induced vibration of a truss girder with two decks. Adv. Civ. Eng. 2021, 24, 841–855. [Google Scholar] [CrossRef]
  43. Tang, H.J.; Shum, K.M.; Tao, Q.Y.; Jiang, J.S. Vortex-induced vibration of a truss girder with high vertical stabilizers. Adv. Civ. Eng. 2019, 22, 948–959. [Google Scholar] [CrossRef]
  44. Hossain, T.; Okeil, A.M.; Cai, C.S. Field Test and Finite-Element Modeling of a Three-Span Continuous-Girder Bridge. J. Perform. Constr. Facil. 2014, 28, 136–148. [Google Scholar] [CrossRef]
  45. China’s Ministry of Transportation. JTG/T 3360-01-2018 Wind-Resistant Design Specification for Highway Bridges; China Communications Press: Beijing, China, 2018. [Google Scholar]
  46. Hu, C.X.; Zhao, L.; Ge, Y.J. Mechanism of suppression of vortex-induced vibrations of a streamlined closed-box girder using additional small-scale components. J. Wind Eng. Ind. Aerodyn. 2019, 189, 314–331. [Google Scholar] [CrossRef]
  47. Laima, S.J.; Li, H.; Chen, W.L.; Ou, J.P. Effects of attachments on aerodynamic characteristics and vortex-induced vibration of twin-box girder. J. Fluids Struct. 2018, 77, 115–133. [Google Scholar] [CrossRef]
  48. Yao, G.; Yang, Y.; Wu, B.; Liu, L.J.; Zhang, L.L. Aerodynamic admittance influence on buffeting performance of suspension bridge with streamlined deck. J. Vibroengineering 2019, 21, 198–214. [Google Scholar] [CrossRef]
  49. Chen, W.L.; Yang, W.H.; Li, H. Self-issuing jets for suppression of vortex-induced vibration of a single box girder. J. Fluids Struct. 2019, 86, 213–235. [Google Scholar] [CrossRef]
  50. Dai, Y.Q.; Dai, X.W.; Bai, Y.; He, X.H. Aerodynamic Performance of an Adaptive GFRP Wind Barrier Structure for Railway Bridges. Materials 2020, 13, 16. [Google Scholar] [CrossRef]
  51. An, M.; Li, S.Y.; Liu, Z.W.; Yan, B.F.; Li, L.A.; Chen, Z.Q. Galloping vibration of stay cable installed with a rectangular lamp: Field observations and wind tunnel tests. J. Wind Eng. Ind. Aerodyn. 2021, 215, 12. [Google Scholar] [CrossRef]
  52. Huang, Z.W.; Li, Y.Z.; Hua, X.G.; Chen, Z.Q.; Wen, Q. Automatic Identification of Bridge Vortex-Induced Vibration Using Random Decrement Method. Appl. Sci. 2019, 9, 20. [Google Scholar] [CrossRef]
  53. Williamson, C.H.K.; Govardhan, R. Vortex-induced vibrations. Annu. Rev. Fluid Mech. 2004, 36, 413–455. [Google Scholar] [CrossRef]
  54. Wei, Z.L.; Shen, M.H.; Song, X.D.; Chen, X.Y.; Lv, M.T.; Jia, S.M. Study on the Correspondence of Vortex Structures and Vortex-Induced Pressures for a Streamlined Box Girder. Appl. Sci. 2022, 12, 16. [Google Scholar] [CrossRef]
  55. Sarwar, M.W.; Ishihara, T. Numerical study on suppression of vortex-induced vibrations of box girder bridge section by aerodynamic countermeasures. J. Wind Eng. Ind. Aerodyn. 2010, 98, 701–711. [Google Scholar] [CrossRef]
  56. Tang, H.J.; Li, Y.L.; Wang, Y.F.; Tao, Q.Y. Aerodynamic optimization for flutter performance of steel truss stiffening girder at large angles of attack. J. Wind Eng. Ind. Aerodyn. 2017, 168, 260–270. [Google Scholar] [CrossRef]
  57. Wang, Z.W.; Tang, H.J.; Li, Y.L.; Guo, J.J.; Liu, Z.H. Windproof ability of aerodynamic measures to improve the wind environment above a truss girder. Wind Struct. 2021, 32, 423–437. [Google Scholar] [CrossRef]
  58. Chen, X.; Ma, C.M.; Xian, R.; Liu, T.C. Effects of gap configuration on vortex-induced vibration of twin-box girder and countermeasure study. J. Wind Eng. Ind. Aerodyn. 2022, 231, 11. [Google Scholar] [CrossRef]
  59. Zanotti, A.; Nilifard, R.; Gibertini, G.; Guardone, A.; Quaranta, G. Assessment of 2D/3D numerical modeling for deep dynamic stall experiments. J. Fluids Struct. 2014, 51, 97–115. [Google Scholar] [CrossRef]
  60. Wang, C.Q.; Hua, X.G.; Huang, Z.W.; Tang, Y.; Chen, Z.Q. Post-critical behavior of galloping for main cables of suspension bridges in construction phases. J. Fluids Struct. 2021, 101, 21. [Google Scholar] [CrossRef]
  61. Dong, L.; Jia, J.; Zhang, L.X. Numerical Analysis on Spanwise Correlation of Vortex-Induced Force of Split Double-Box Beam. Appl. Sci. 2022, 12, 21. [Google Scholar] [CrossRef]
  62. Ricciardelli, F. Effects of the vibration regime on the spanwise correlation of the aerodynamic forces on a 5:1 rectangular cylinder. J. Wind Eng. Ind. Aerodyn. 2010, 98, 215–225. [Google Scholar] [CrossRef]
  63. Wang, C.Q.; Huang, Z.W.; Hua, X.G.; He, X.H.; Zhou, S.; Chen, Z.Q. Aerodynamic mechanism of triggering and suppression of vortex-induced vibrations for a triple-box girder. J. Wind Eng. Ind. Aerodyn. 2022, 227, 16. [Google Scholar] [CrossRef]
  64. Wang, Y.; Chen, X.Z. Extraction of aerodynamic damping and prediction of vortex-induced vibration of bridge deck using CFD simulation of forced vibration. J. Wind Eng. Ind. Aerodyn. 2022, 224, 16. [Google Scholar] [CrossRef]
Figure 1. Methodology diagram.
Jmse 11 01118 g001
Figure 2. Schematic layout of the bridge (unit: m).
Jmse 11 01118 g002
Figure 3. Double-deck truss girder cross-section (unit: mm).
Jmse 11 01118 g003
Figure 4. Three-dimensional finite element model.
Jmse 11 01118 g004
Figure 5. Wind tunnel laboratory of Chongqing University.
Jmse 11 01118 g005
Figure 6. Sectional model in the experiment and local enlargements.
Jmse 11 01118 g006
Figure 7. The suspension system used in the tests.
Jmse 11 01118 g007
Figure 8. Positive directions of incoming flow and aerodynamic coefficients.
Jmse 11 01118 g008
Figure 9. Schematic diagram of the shape and location of the aerodynamic mitigation measures (corresponding to the real situation, unit: mm).
Jmse 11 01118 g009
Figure 10. Experimental models of the truss girder with aerodynamic mitigation measures.
Jmse 11 01118 g010
Figure 11. VIV responses of the original section of the truss girder corresponding to those of the real situation.
Jmse 11 01118 g011
Figure 12. Time histories and spectra at different critical wind speeds.
Jmse 11 01118 g012
Figure 13. VIV responses of the truss girder with four aerodynamic mitigation measures corresponding to the real situation.
Jmse 11 01118 g013
Figure 14. Boundary conditions of the computational domain.
Jmse 11 01118 g014
Figure 15. Mesh used in the CFD simulations.
Jmse 11 01118 g015
Figure 16. Y-plus values of the original cross-section.
Jmse 11 01118 g016
Figure 17. The arrangement of monitoring points.
Jmse 11 01118 g017
Figure 18. Comparisons of VIV responses between tests and numerical simulations.
Jmse 11 01118 g018
Figure 19. Vorticity contours in one vortex shedding cycle of the original cross-section.
Jmse 11 01118 g019
Figure 20. Time histories and spectra of the aerodynamic coefficients.
Jmse 11 01118 g020
Figure 21. Vorticity contours in one vortex shedding cycle of the upper deck region.
Jmse 11 01118 g021
Figure 22. Variations of the spectra for wind speed at monitoring point P7.
Jmse 11 01118 g022
Figure 23. Vorticity contours in one vortex shedding cycle of the lower deck wake region.
Jmse 11 01118 g023
Figure 24. Variations in the spectra for wind speed at monitoring point P19.
Jmse 11 01118 g024
Table 1. Dynamic characteristic parameters of the bridge’s main modals.
Order NumberFrequency (Hz)Vibration Mode *Modal Shape (Front View)Allowable Values
30.2108S-V-1Jmse 11 01118 i001190 mm
40.2368AS-V-1Jmse 11 01118 i002169 mm
80.4017S-V-2Jmse 11 01118 i003100 mm
110.4777S-T-1Jmse 11 01118 i0040.304°
200.5707AS-V-2Jmse 11 01118 i00570 mm
250.7055AS-T-1Jmse 11 01118 i0060.206°
* S: symmetric; AS: antisymmetric; V: vertical; T: torsional.
Table 2. Parameters for the sectional model.
ParameterSymbolUnitScaling FactorPrototypeModel
HeightDm1:5515.80.286
WidthBm1:5531.30.569
Massmkg/m1:55268,45022.628
Mass moment of inertiaImkg·m2/m1:55413,090,0001.4305
Radius of gyrationrm1:5513.82880.2514
Vertical frequencyFvHz-0.21082.22
Torsional frequencyHz-0.47775.03
Table 3. Working conditions for the wind tunnel tests.
CaseSymbolWind Attack AnglesTest Content
1OC0°, ±3°, ±5°Original cross-section
2UF+3°, +5°Upper chord fairing
3UL+3°, +5°Upper chord inverted L-shaped deflector plate
4LL+3°, +5°Lower chord inverted L-shaped deflector plate
5CS+3°, +5°Central stability plate
Table 4. Strouhal numbers of the truss girder corresponding to different working conditions.
Working ConditionOSUDUWLDCS
+3°+5°+3°+5°+3°+5°+3°+5°+3°+5°
S t for vertical VIVMajor peak0.470.470.520.520.470.470.480.480.400.41
S t for torsional VIVMinor peak0.640.600.670.660.620.600.620.580.560.56
Major peak0.360.330.400.360.360.340.380.350.330.32
Table 5. Aerodynamic coefficients calculated using different time steps.
Time Step (s) 1 × 10−35 × 10−41 × 10−45 × 10−51 × 10−5
Average values C ¯ H 0.52040.54170.56770.56610.5689
C ¯ V 0.84140.85390.86350.86520.8631
C ¯ M 0.02490.02610.02740.02820.0289
Standard deviation values C H 0.01610.01850.01990.01760.0191
C V 0.04750.05360.05630.05010.0480
C M 0.03850.03730.03460.03260.0427
Table 6. Aerodynamic coefficients calculated using different mesh numbers.
Total Mesh Number (Million) 0.070.150.240.45
Average values C ¯ H 0.53920.56770.56690.5684
C ¯ V 0.82130.86350.86510.8627
C ¯ M 0.02310.02740.02780.0279
Standard deviation values C H 0.02740.02610.05740.0341
C V 0.07170.03830.06780.0499
C M 0.01400.02390.01630.0145
Table 7. Comparisons of simulated values and test values of aerodynamic coefficients.
Wind Attack Angle Simulated ValuesTest ValuesError
+3° C ¯ H 0.56770.639811.27%
C ¯ V 0.86350.89483.49%
C ¯ M 0.02740.031011.61%
+5° C ¯ H 0.61540.66727.76%
C ¯ V 1.04371.10125.22%
C ¯ M 0.04140.04518.20%
Table 8. Frequencies and Strouhal numbers of the peak components in Figure 20.
Peak Number F1F2F3F4F5F6F7F8F9
Frequency (Hz)CV-2.46-4.787.468.4710.0614.7418.23
CM1.562.463.014.78-8.47--18.23
St 0.330.520.641.011.581.792.123.123.86
Table 9. Frequencies and Strouhal numbers of incoming flow recorded at monitoring points.
Monitoring PointFrequency (Hz)StPeak Number (in Table 8)
P191.56, 3.010.33, 0.64F1, F3
P1–P72.460.52F2
P20–P264.781.01F4
P20, P267.461.58F5
P1~P6, P8–P13, P15–P17, P20–P258.471.79F6
P14, P1810.062.12F7
P8, P910.442.20/
P1–P3, P11–P13, P14–P1614.743.12F8
P1–P3, P24–P2618.233.86F9
Disclaimer/Publisher’s Note: The statements, opinions and data contained in all publications are solely those of the individual author(s) and contributor(s) and not of MDPI and/or the editor(s). MDPI and/or the editor(s) disclaim responsibility for any injury to people or property resulting from any ideas, methods, instructions or products referred to in the content.

