Article

Comprehensive Investigation on Spatiotemporal Variations of Tropical Cyclone Activities in the Western North Pacific, 1950–2019

1
School of Geography and Planning, Sun Yat-sen University, Guangzhou 510275, China, and Southern Marine Science and Engineering Guangdong Laboratory (Zhuhai), Zhuhai 519082, China
2
Guangdong Provincial Engineering Research Center for Public Security and Disasters, Guangzhou 510275, China
3
Guangdong Center for Marine Development Research, Guangzhou 510220, China
*
Authors to whom correspondence should be addressed.
J. Mar. Sci. Eng. 2023, 11(5), 946; https://doi.org/10.3390/jmse11050946
Submission received: 16 March 2023 / Revised: 24 April 2023 / Accepted: 26 April 2023 / Published: 28 April 2023
(This article belongs to the Section Physical Oceanography)

Abstract

:
Tropical Cyclones (TCs) are the most severe natural disasters in the Western North Pacific Ocean (WNP). While previous studies reported evident changes over certain regions or seasons between typical periods, there is a lack of a complete picture of the long-term variations in TC activities in the WNP. This study carried out a comprehensive investigation on the spatiotemporal variations in TC genesis locations and transit pathways in the WNP, based on the TC best-track datasets from the China Meteorological Administration Shanghai Typhoon Institute. The results showed that the TC genesis and occurrence frequencies showed drastic decreases and westward shifts in the WNP from 1950 to 2019. The greatest decrease in TC genesis occurred for Tropical Depressions (TDs: 10.8−17.1 m/s) and Typhoons (TYs: > 32.7 m/s). The number of Tropical Storms (TSs: 17.2−32.6 m/s) and the mean intensity (2 min maximum sustained wind speed) of TCs overall showed no evident change. The decadal average of TC genesis frequency increased by 63% in the near-coast seas (WNPO), but decreased by 46% near the central Pacific Ocean (WNCP), demonstrating a westward shift for TC genesis locations. The TC genesis and occurrence frequencies also showed significant declines in the southern Philippine Sea (SPS) and South China Sea (SCS), while they showed a lower reduction in the Eastern East China Sea (EECS), the northern ocean edge of TC genesis areas, resulting in an increase in the average latitude of TC genesis locations, a spurious northward shift. The La Niña and El Niño years showed contrasting effects on TC genesis frequency and landfall ratios. There were greater instances of TC genesis and greater landfall ratios during the La Niña mature phase, while there were fewer TC formations and lower landfall ratios during the short duration (SD) El Niño developing phase. The TC genesis locations showed a distinct northwestward shift during La Niña years compared to those during El Niño years.

1. Introduction

Tropical cyclones (TCs), also known as typhoons, are one of the most severe types of natural disasters in the Western North Pacific (WNP) [1]. Over one-third of global TCs occurred in this area, and nine TCs made landfall in the coast of mainland China per year from 1950 to 2019. Landfall TCs brought heavy rains, storm surges, and wind disasters, and were the greatest threat to coastal areas [2,3]. The economic losses caused by TCs have dramatically increased with rising sea levels and rapid economic development in coastal areas [4]. Particularly super-strong typhoons caused huge damages to people’s lives and properties in the coastal areas of China. The damages caused by TCs were closely associated with the number, intensity (wind speed), landfall locations, and moving tracks [5,6].
The number of TCs in the WNP has decreased, while their mean intensity has increased, since the 1950s [7,8]. Zhao analyzed the TC data from 1979 to 2015 from the Joint Typhoon Warming Center (JTWC) and found that there was a significant reduction in the number of TCs in the boreal summer (July–October) over the WNP since 1998 [7]. Yao analyzed the best-track data from the China Meteorological Administration (CMA) from 1973 to 2017, and found that the intensity of severe landfall typhoons in peak summer (July–September) in China experienced significant strengthening from 1987 to 2003 [8]. Using the JTWC best-track data, studies found that, although the intensity of typhoons increased with the rise in local sea surface temperature (SST) in the WNP, their development duration and occurrence frequency were reduced [9,10].
The variations in the number of TCs and their intensity were closely related to several factors. More TCs occurred in the South China Sea (SCS) in La Niña years from 1979 to 2016 [11]. The SST demonstrated a significant influence on extreme climate and weather. Previous studies found that the rising SST increased the frequency of strong typhoons due to higher genesis potential, i.e., favorable environmental conditions to TC occurrence [11,12,13,14,15]. SST warming was related to the Pacific Ocean’s oscillations and the prolonged and exceptionally strong La Niña climate, which affected global atmospheric circulation and extreme weather conditions such as droughts, floods, TCs, and storms over the WNP in the late 1990s [10,16]. The increased intensity of landfall typhoons was mostly attributed to the strengthened intensification rates, which, in turn, were tied to the locally enhanced SST warming on the rim of East and Southeast Asia [13]. Understanding these trends is essential to better determine the possible future changes in coastal TC disaster risk.
The impact of a typhoon is closely related to its genesis location, transit pathways, and intensity. While previous studies chose to report the evident changes over certain regions, seasons, or between two typical periods, there is a lack of comprehensive investigation on the spatiotemporal variations of TC genesis and occurrence frequencies and intensities over the WNP, and on the TC landfall ratios to mainland China since 1949.
This study aims to comprehensively investigate the spatiotemporal variations in TC genesis locations and their transit pathways over the WNP, based on the TC best-track dataset from the China Meteorological Administration Shanghai Typhoon Institute [17,18], and to analyze the influence of El Niño–Southern Oscillation (ENSO) on TC genesis and landfall frequency, which are of great significance to understand and assess the TC disaster risk over the WNP and to mainland China.

2. Materials and Methods

2.1. Datasets

The TC best-track datasets over the WNP from 1950 to 2019 were downloaded from the China Meteorological Administration (CMA) Shanghai Typhoon Institute (STI), including TC center position (latitude and longitude), the 2 min Maximum Sustained Wind speed (MSW), and sea-level pressure. The datasets have a 6 h interval, and the first position of each TC is defined as the genesis location [17,18].
The CMA TC best-track data are the multi-source, multi-time-scale, multi-spatial-scale, and comprehensive TC database that covers the WNP. The final best-track TC datasets had been passed through rigorous quality control in collaboration with the Typhoon and Marine Meteorological Expert Working Group of the CMA. The CMA TC data can be divided into two stages, i.e., the reanalysis stage for the TC seasons from 1949 to 1971, and the annual postseason analysis stage for TC seasons from 1972 to present. The former included the input data from historical atlases of TC tracks, station observations, ship weather reports, automated surface observations, synoptic charts, radiosonde data, aircraft reconnaissance, and real-time TC warning advice from various agencies. The latter included the input data of observations used in the reanalysis era, but also satellite and coastal radar observations. As aircraft reconnaissance ended in 1987, various satellite data, with an increasing resolution, have been used [17].
The convention for designating MSW changed twice. The first significant change was to update the satellite-based wind estimation table between 1994 and 1995, and the second change was to integrate the FengYun-2 satellite products between 1997 and 1998. Meanwhile, the best-track TC data were smoothed to reduce unrealistically abrupt changes in either track or intensity over the 6-, 12-, 18-, and 24-hour periods [17]. More detailed information on CMA TC data and data quality were described by Ying et al. [17] and Lu et al. [18]. Although these datasets are unique and authoritative, inhomogeneities of the CMA TC best-track datasets are likely to reduce the confidence of the observed trends, due to changes in the input data and the technique development of different periods [17].
The Oceanic Niño Index (ONI, 1950–2019) was downloaded from the US National Oceanic and Atmospheric Administration (NOAA). Warm (El Niño) and cold (La Niña) periods were determined by a threshold of ±0.5 °C based on the 3-month running mean of ERSST.v5 (Extended Reconstructed Sea Surface Temperature version 5) SST anomalies in the Niño 3.4 region (5° N–5° S,120°–170° W) [19].

2.2. TC Classification

In order to investigate the change features in different ranges of intensities, all TCs were divided into three groups according to China Meteorological Administration standards (GB/T 19201-2006) on the MSW wind speed near TC center along a TC track, i.e., Tropical Depressions (TDs: 10.8–17.1 m/s), Tropical Storms (TSs: 17.2–32.6 m/s), and Typhoons (TYs: > 32.7 m/s) [20].

2.3. TC Genesis Frequency and TC Occurrence Frequency

The TC (Landfall TC, LFTC) Genesis Frequency (TGF) was defined as the total TC genesis (LFTC) points/number in a 5° × 5° grid per year. The TC Occurrence Frequency (TOF) was defined as the total number of TC occurrences (all 6-hourly recorded points) passing through a 2.5° × 2.5° grid per year, since the number of TC occurrence points is over ten times that of TC genesis locations [9].

2.4. TC Track Clusters

A plane coordinate system was set up with the origin point (130° E, 0° N) in the WNP (Figure 1). A TC track was separated into two segments from the middle point, and then their angles were calculated with the horizontal X-axis in the longitudinal direction. The angle between the first segment from the genesis point to the middle point and the X-axis was named a1, and a2 was between the second segment, from the middle point to the dissipation point, and the X-axis. Thus, all TC tracks were classified into 3 clusters that had dominant directions of north, west, and west–east turn tracks, in addition to another cluster with irregular directions (Figure 1):
(1)
120° < a2, west tracks;
(2)
60° < a2 ≤ 120°, north tracks;
(3)
90° < a1 ≤ 180° and 0° < a2 ≤ 60°, west–east turn tracks;
(4)
Others, irregular tracks.

2.5. El Niño and La Niña Years

An El Niño or La Niña year is determined from the ONI by the method of Bamston [21]. A year with ONI ≥ 0.5 (June to December mean) was defined as an El Niño year, a year with ONI ≤ −0.5 (January to September Mean) was defined as a La Niña year, and a median value between the two was defined as a neutral year. The El Niño events (years) were divided into two subtypes based on their duration: Short Duration (SD) El Niño events and Long Duration (LD) El Niño events [5,22,23]. The SD El Niño events decayed rapidly into La Niña events after reaching their peak intensity and normally lasted less than 12 months, whereas LD El Niño events extended to the end of the decaying year and usually lasted over 16 months. Accordingly, an El Niño year was further divided into a developing phase and a decaying phase, i.e., SD (LD) El Niño developing and SD (LD) El Niño decaying; a La Niña year was divided into three phases, i.e., La Niña developing, La Niña mature, and La Niña decaying phases. In total, the 70-year study period, from 1950 to 2019, was divided into 8 categories with different types and phases of El Niño and La Niña, which were used to assess their effect on TC activities in the WNP.

3. Results

3.1. Temporal Variations in TC Genesis and LFTC

(1)
Seasonal variations
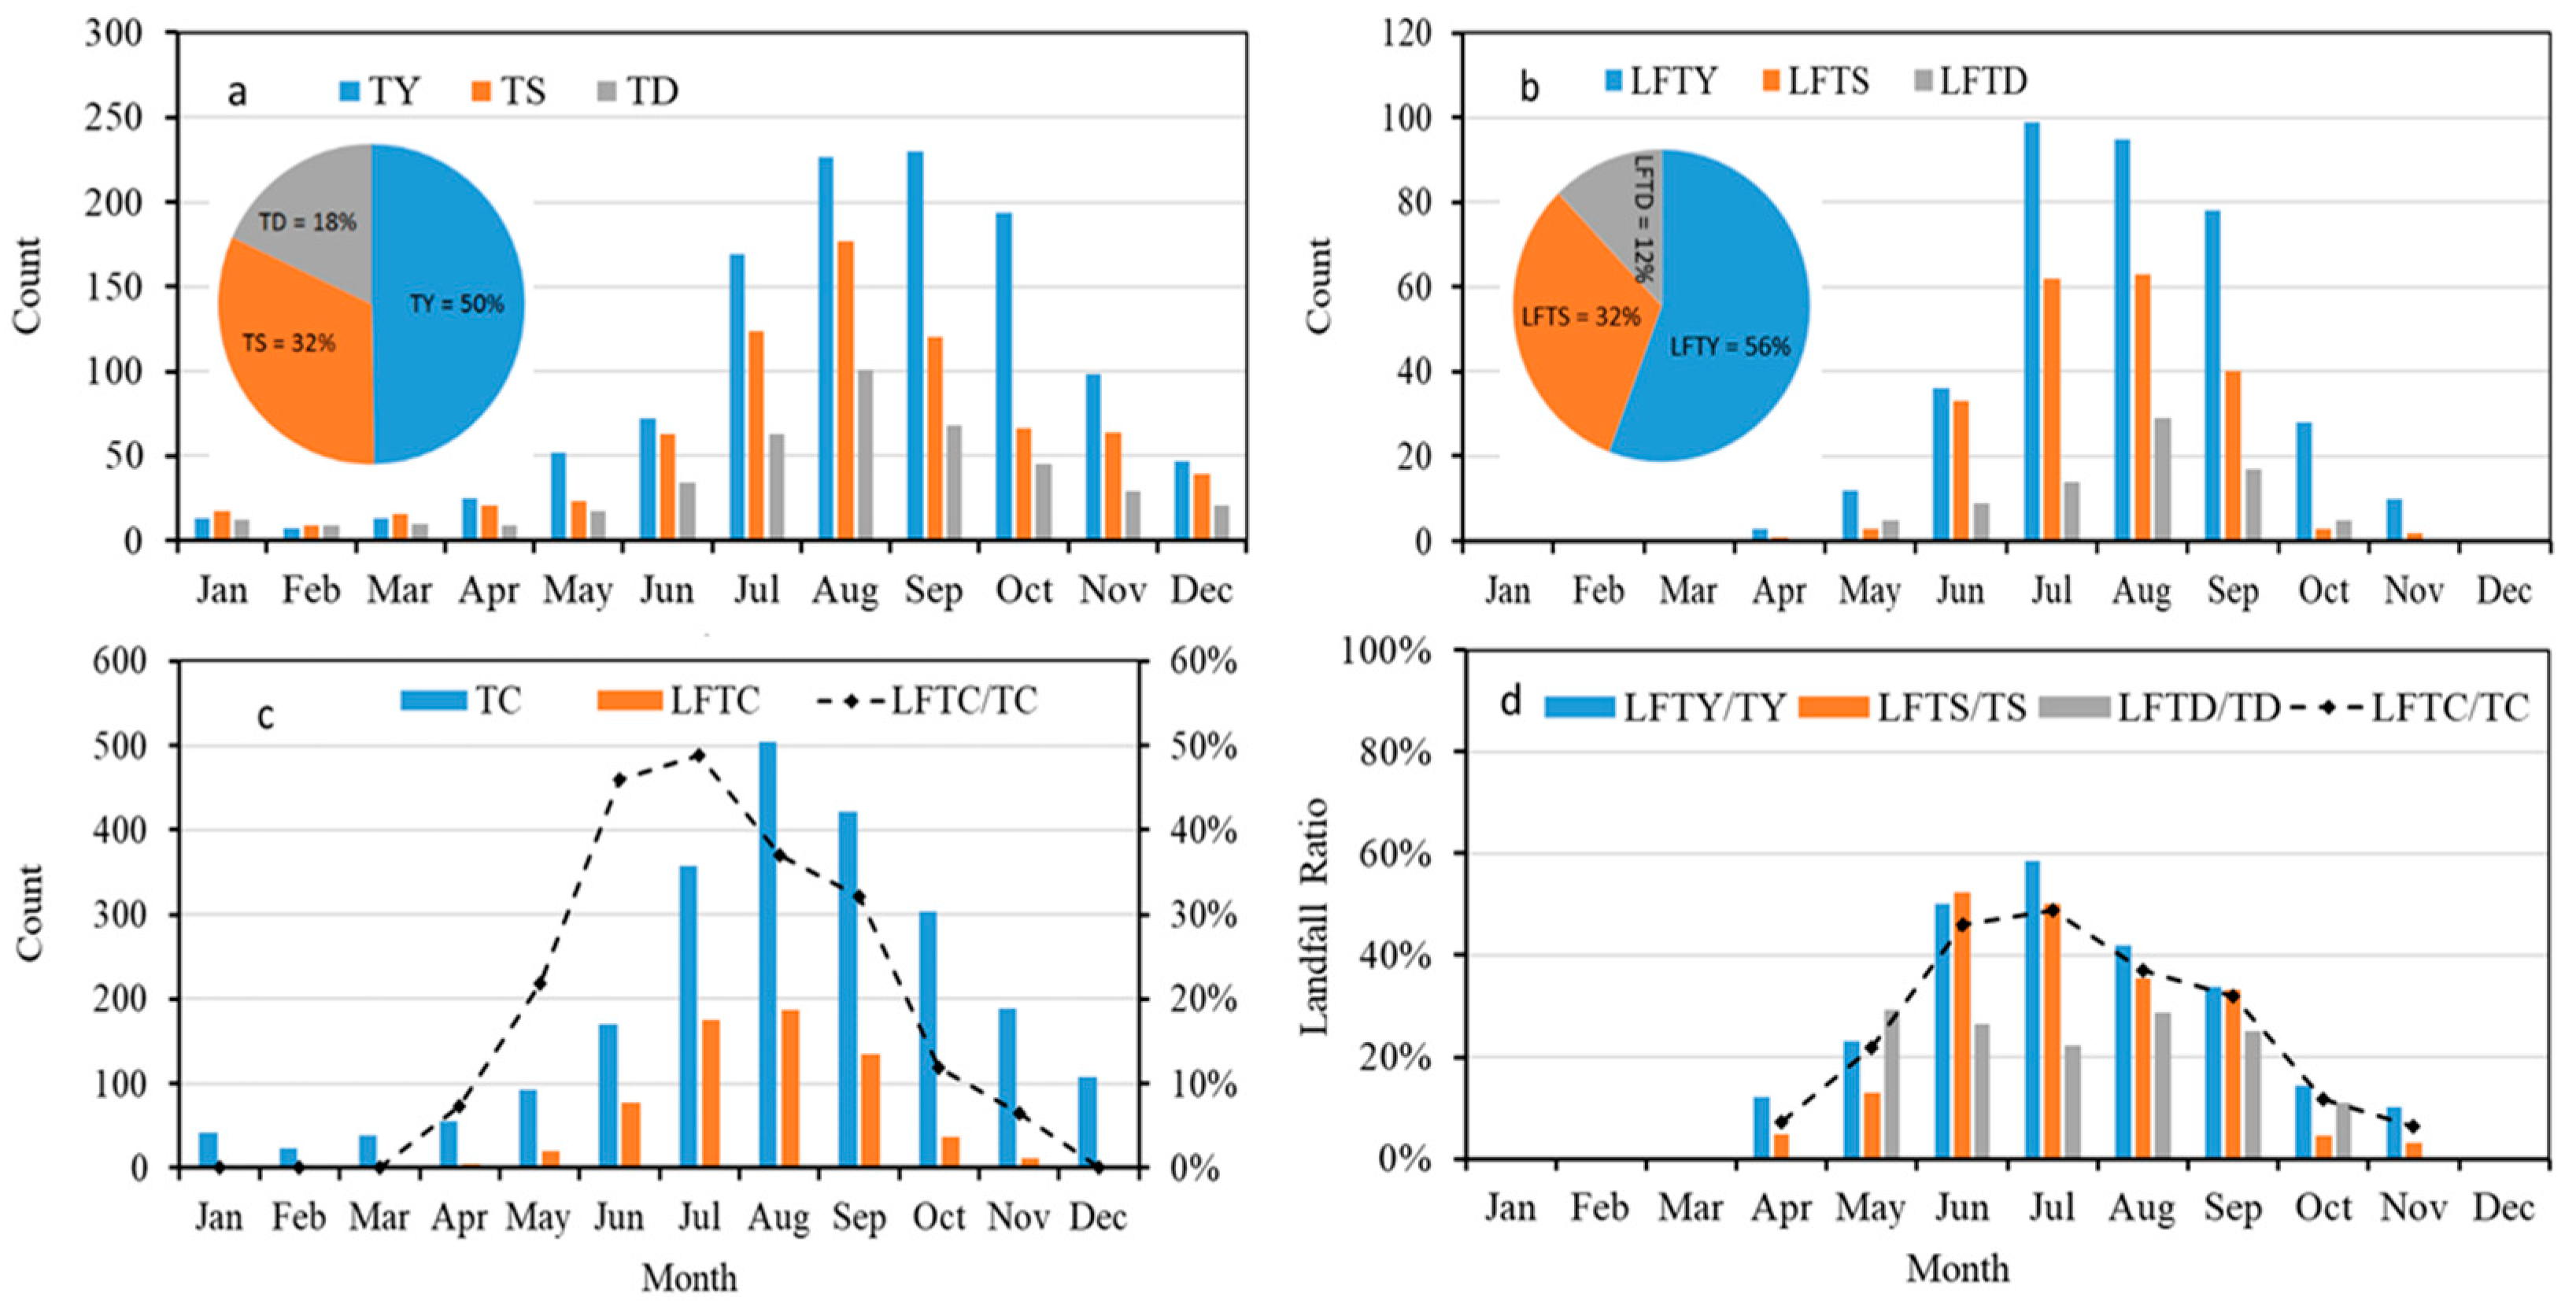
The average annual incidence of TC genesis in the WNP from 1950 to 2019 was 33, (28.1%) of which 9 made landfall (LF) in mainland China. The majority of TC genesis (84.5%) and landfall TCs (96.3%) occurred during the typhoon season, from June to November (Figure 2c). TYs had the highest proportion, with 50%, among the three categories (Figure 2a), while LFTYs even took a greater proportion, with 56%, for landfall TCs (Figure 2b). TDs (18%) and LFTDs (12%) had the lowest proportion. The average annual landfall ratio (LFTC/TC) was 28.1% for all TCs. The higher landfall ratios occurred in June (46%) and July (49%), and then declined to 12% in October and 6% in November (Figure 2c). TYs and TSs had similar landfall ratios (probability), with 35% and 33%, respectively, while TDs had a much lower value, with 22% (Figure 2d).
(2)
Annual variations
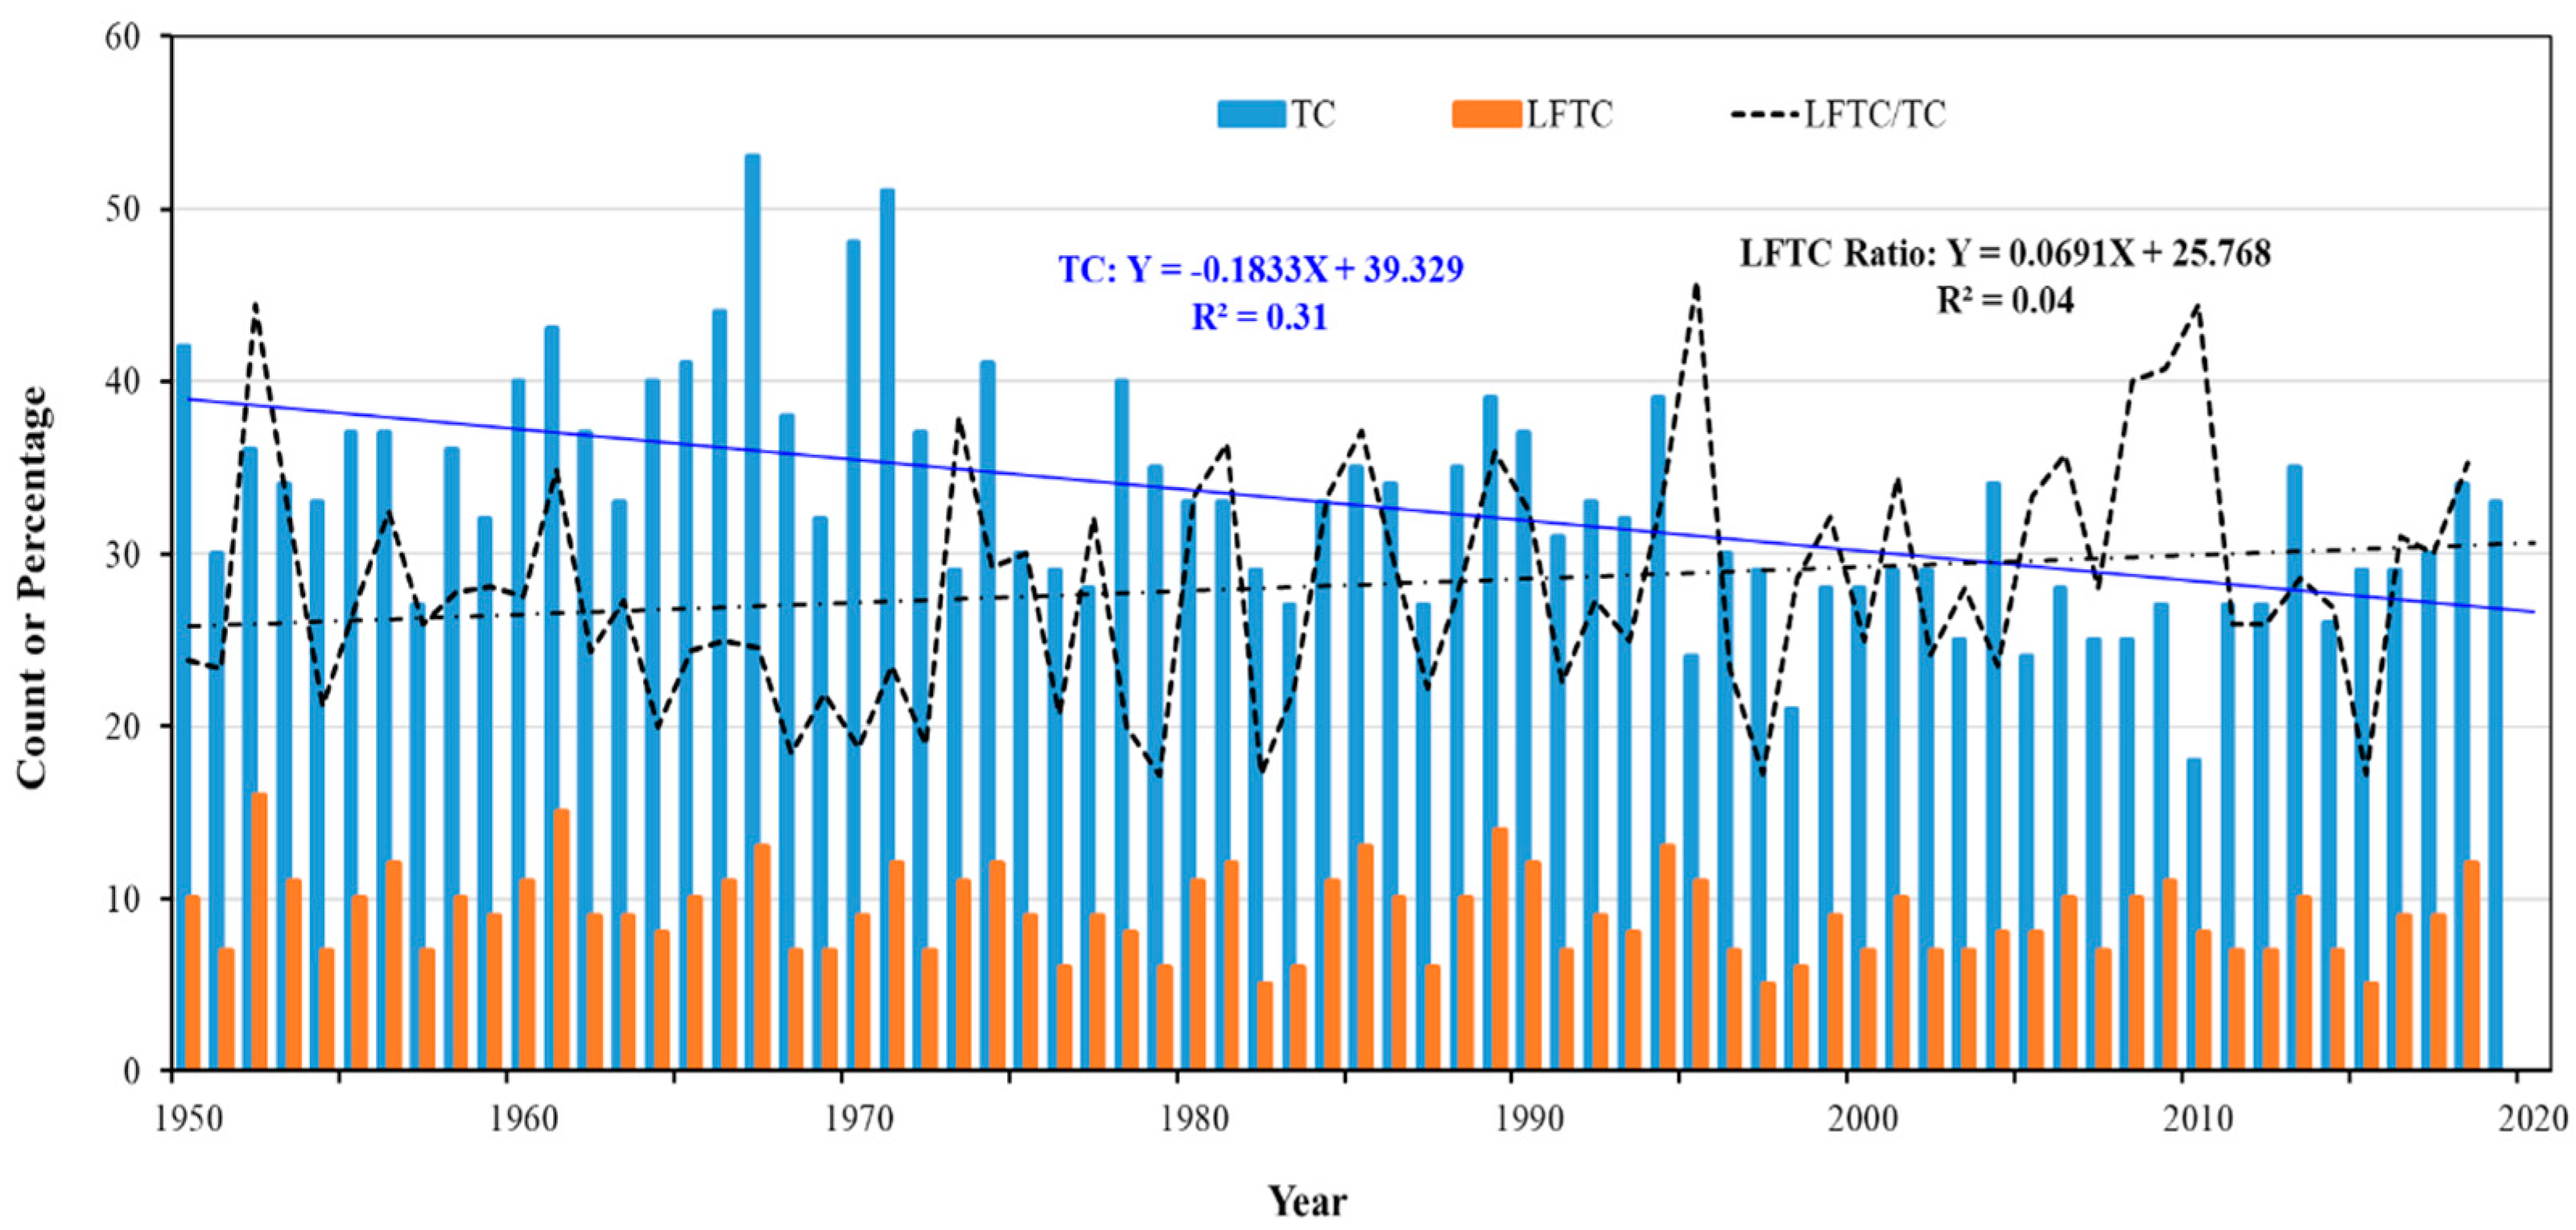
The annual occurrence of TC genesis showed a significant declining trend over the past seventy years from 1950 to 2019, while no trend was observed for the variations of landfall TCs. TCs demonstrated a greater landfall ratio (probability) in recent years (Figure 3).
(3)
Decadal variations
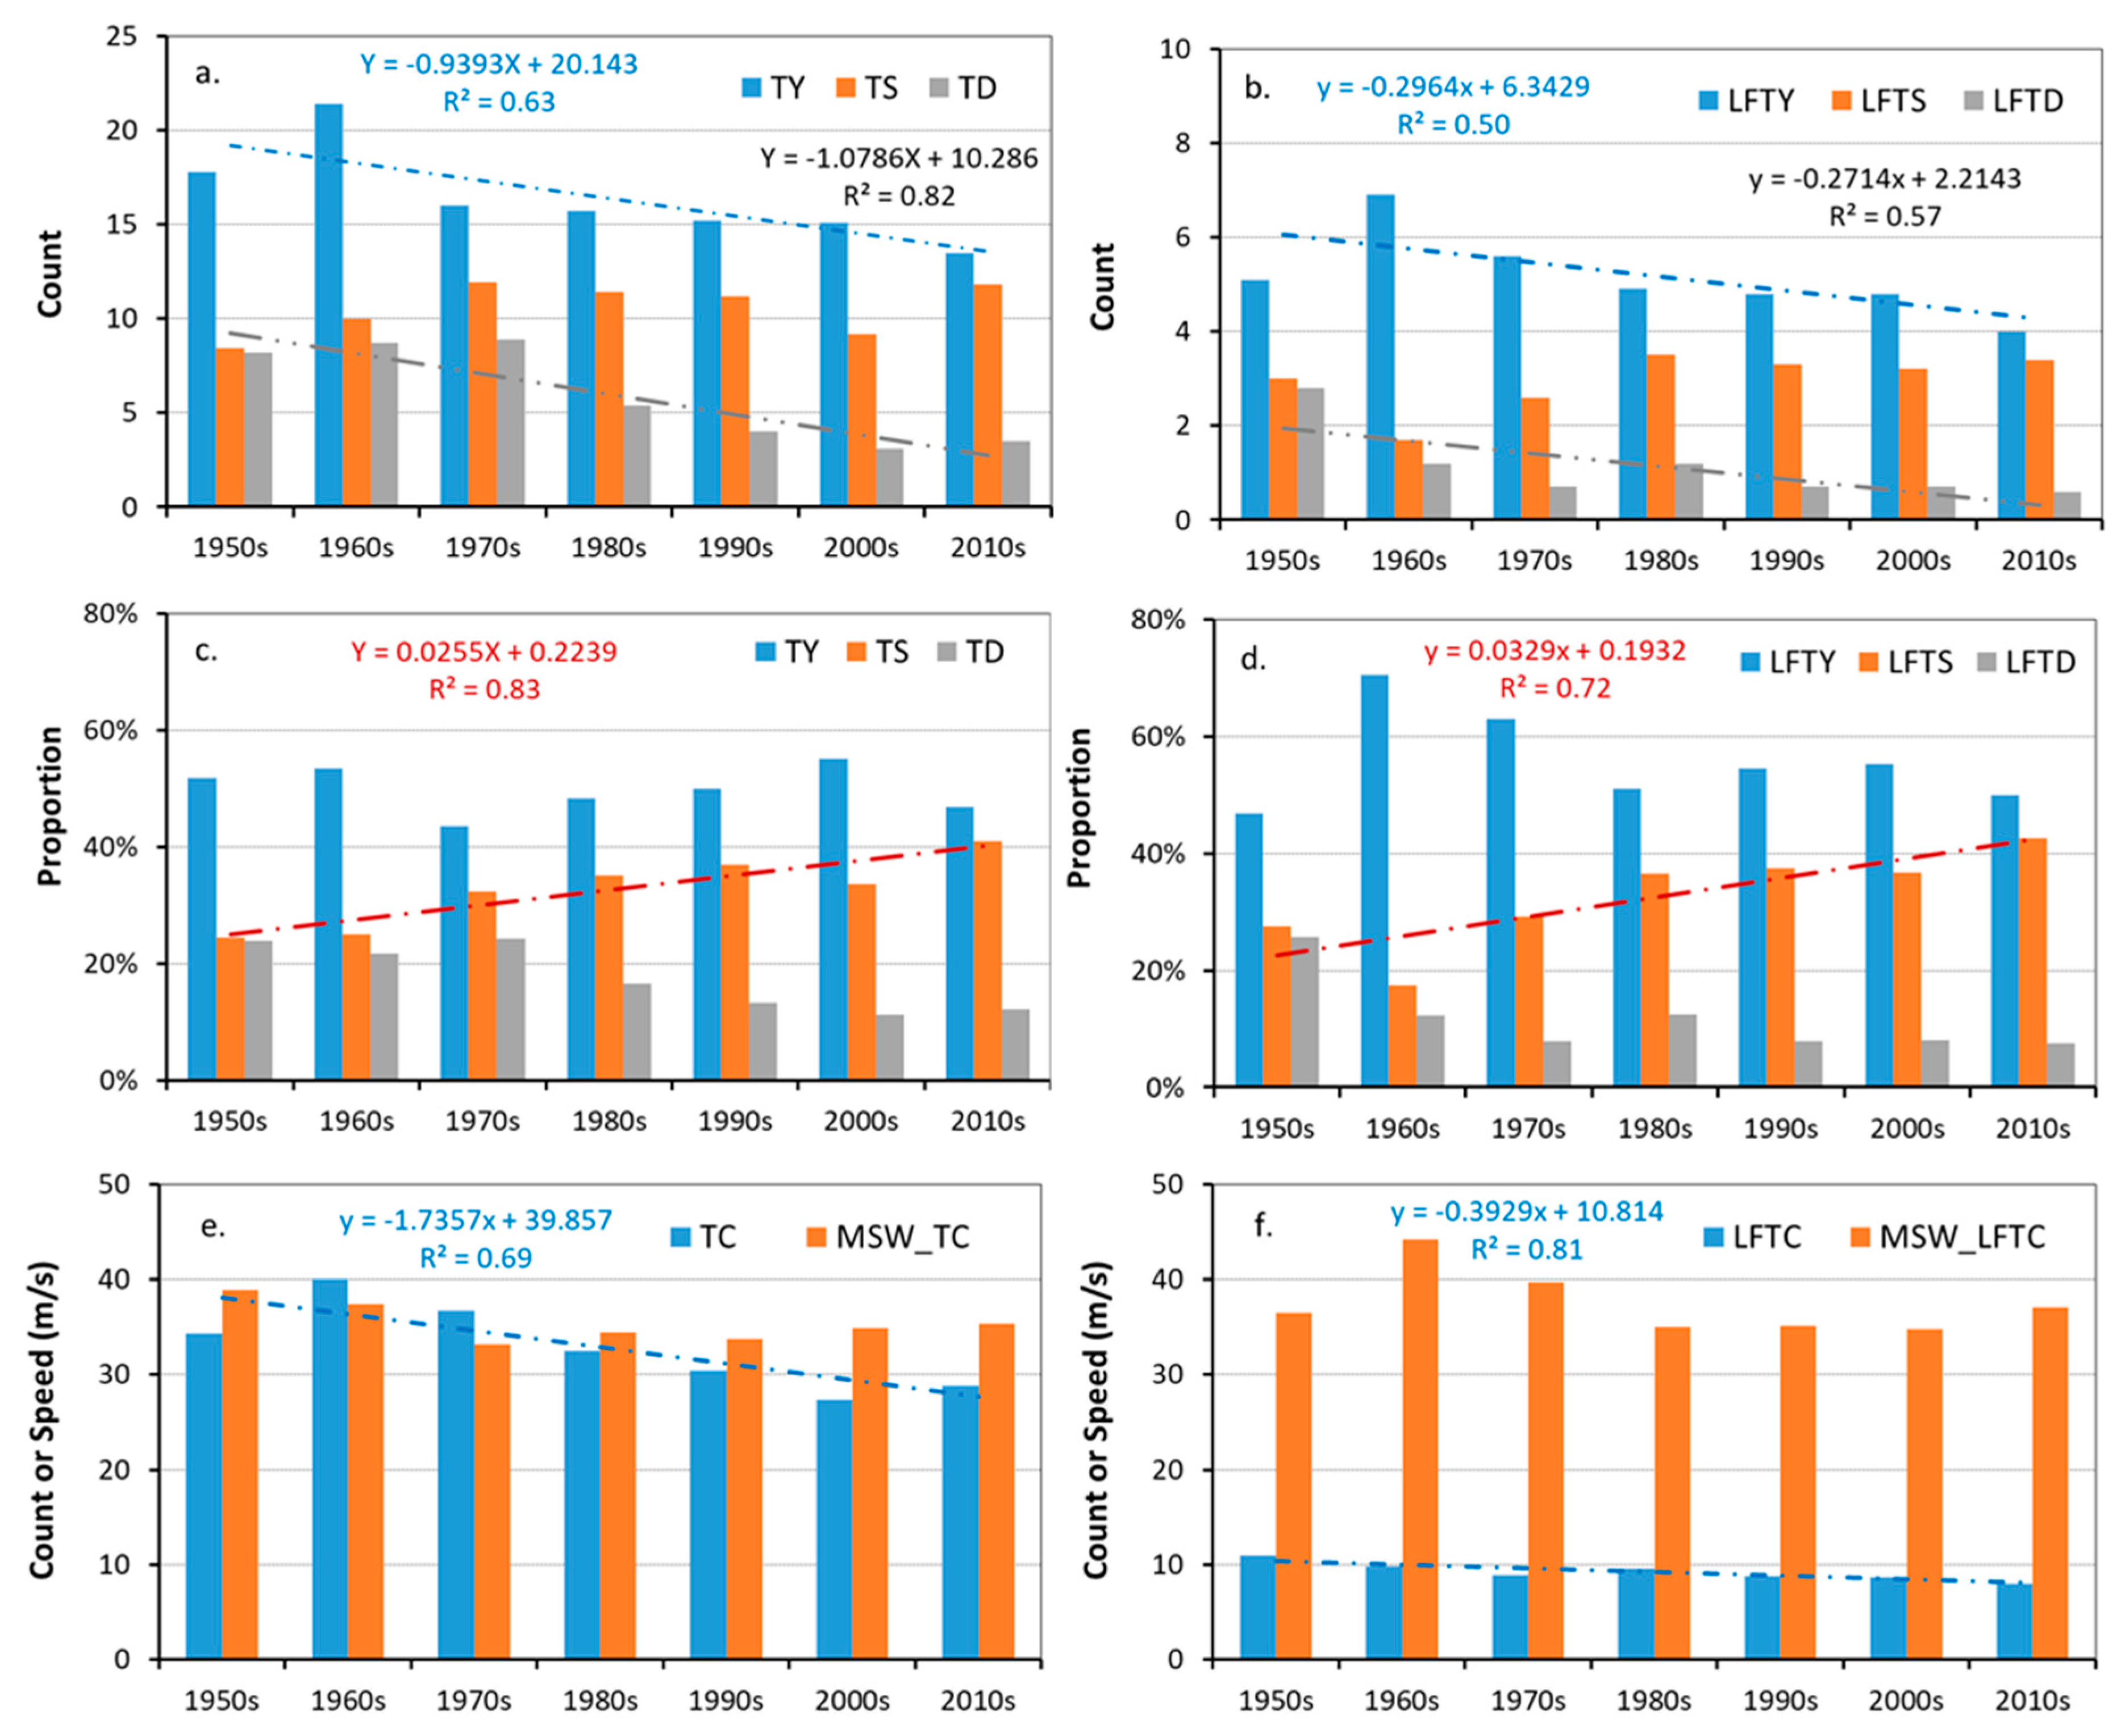
The reduction in TC genesis could be attributed to the significant reduction in TYs and TDs, while the incidence of TSs showed no evident change (Figure 4a,e), resulting in a significant increasing trend in the TS proportion and a declining trend in that of TDs (Figure 4c). The count of LFTCs also showed a slight decreasing trend, caused by the significant decline in LFTYs and LFTDs (Figure 4b,f) and resulted in a higher proportion of LFTSs, which increased from 17% in the 1960s to 43% in the 2010s (Figure 4d).
The average maximum sustained wind speed (MSW, intensity) of LFTCs (37.5 m/s) was 2.1 m/s stronger than that of TCs overall (35.4 m/s). The decadal average MSW of TCs had a decreasing trend that declined from 38.9 m/s in the 1950s to 33.2 m/s in the 1970s, then increased to 35.3 m/s in the 2010s (Figure 4e and Table 1). The decadal average MSW of LFTCs had a maximum value (44.2 m/s) in the 1960s, then decreased to 34.8 m/s in the 2000s, and increased to 37.1 m/s in the 2010s (Figure 4f and Table 2).

3.2. Spatial Variations in TC and LFTC Genesis Locations

There were, in total, 2304 TC genesis occurrences (32.9 TCs per year) in the WNP from 1950 and 2019. The annual counts (also called TC genesis frequency) of TCs and landfall TCs were calculated in a 5-degree grid within the TC genesis region of 0°–35° N and 105°–180° E, which was further divided into six subregions (Figure 5), i.e., the South China Sea (SCS, 105°–120° E, 0°–25° N), Southern Philippine Sea (SPS, 120°–180° E, 0°–10° N), Philippine Sea (PS, 120°–180° E, 10°–20° N), Eastern East China Sea (EECS, 120°–180° E, 20°–35° N), Western North Pacific Off-Coast (WNPO,120°–130° E,0°–35° N), and Western North Central Pacific (WNCP160°–180° E, 0°–35° N). The WNPO and WNCP were chosen to compare the longitudinal shift of TC genesis locations from east to west, and overlapped with the EECS, PS, and SPS, but did not overlap with the SCS. The EECS, PS, and SPS were used to compare the latitudinal shift of TC genesis locations from south to north. The sum of TC (LFTC) proportion in the SPS, PS, EECS, and SCS equals 100%.
(1)
Distribution of TC genesis locations and landfall ratios
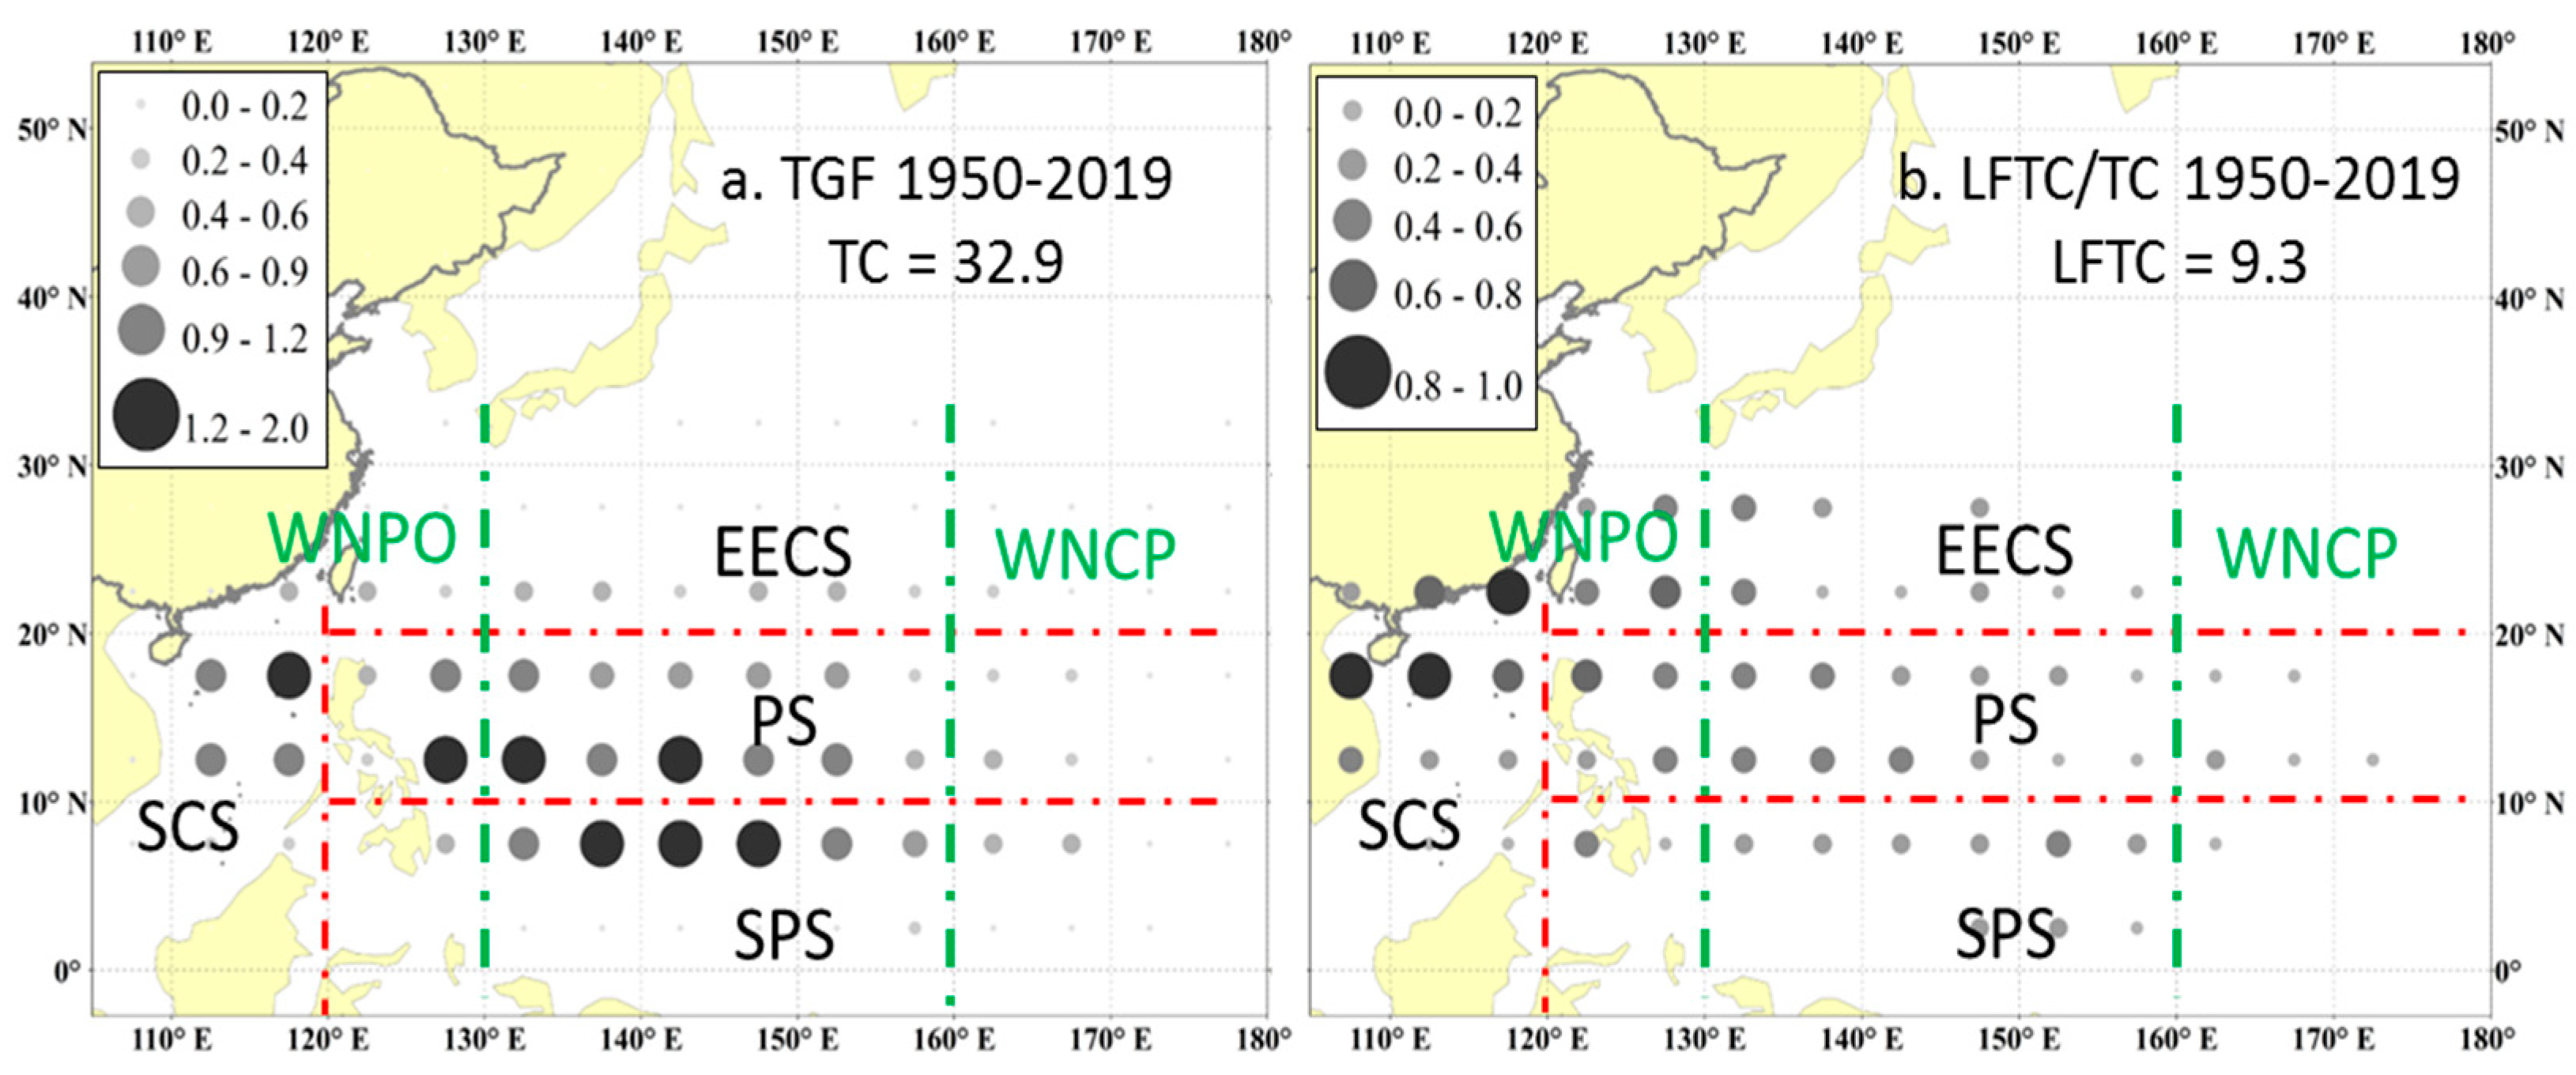
The SCS, PS, and SPS had the highest TC genesis frequencies, with up to 1.2–2.0 TCs per year in a 5-degree grid, while the EECS north of 20° N and WNCP east of 160° E had the lowest TC genesis frequencies, with fewer than 0.6 TCs per year (Figure 5a). Most TCs were generated in the Philippine Sea from 1950 and 2019, i.e., PS genesis of 43% (while this region contains 26% of the area proportion), followed by the SPS with 26%, and the SCS with 18% (Table 1). The EECS had a proportion of 14%, the WNCP with 10%, and the WNPO with 13%.
The landfall TCs were mainly generated in the PS (44%) and SCS (28%), and the northern SCS had a higher landfall ratio (0.8–1.0) than other regions (Figure 5b, Table 2). The near-coast seas (WNPO, < 130° E) also had high landfall ratios of 0.6–0.8, especially in the overlapping sea with the PS, and had a total LFTC proportion, with 20%. The TCs in the SPS had low landfall ratios, less than 0.4, and an LFTC proportion, with 18%. The TCs in the WNCP had the lowest landfall ratios, < 0.2, and the lowest proportion, with 2%.
(2)
Distributions of TD, TS, and TY landfall ratios
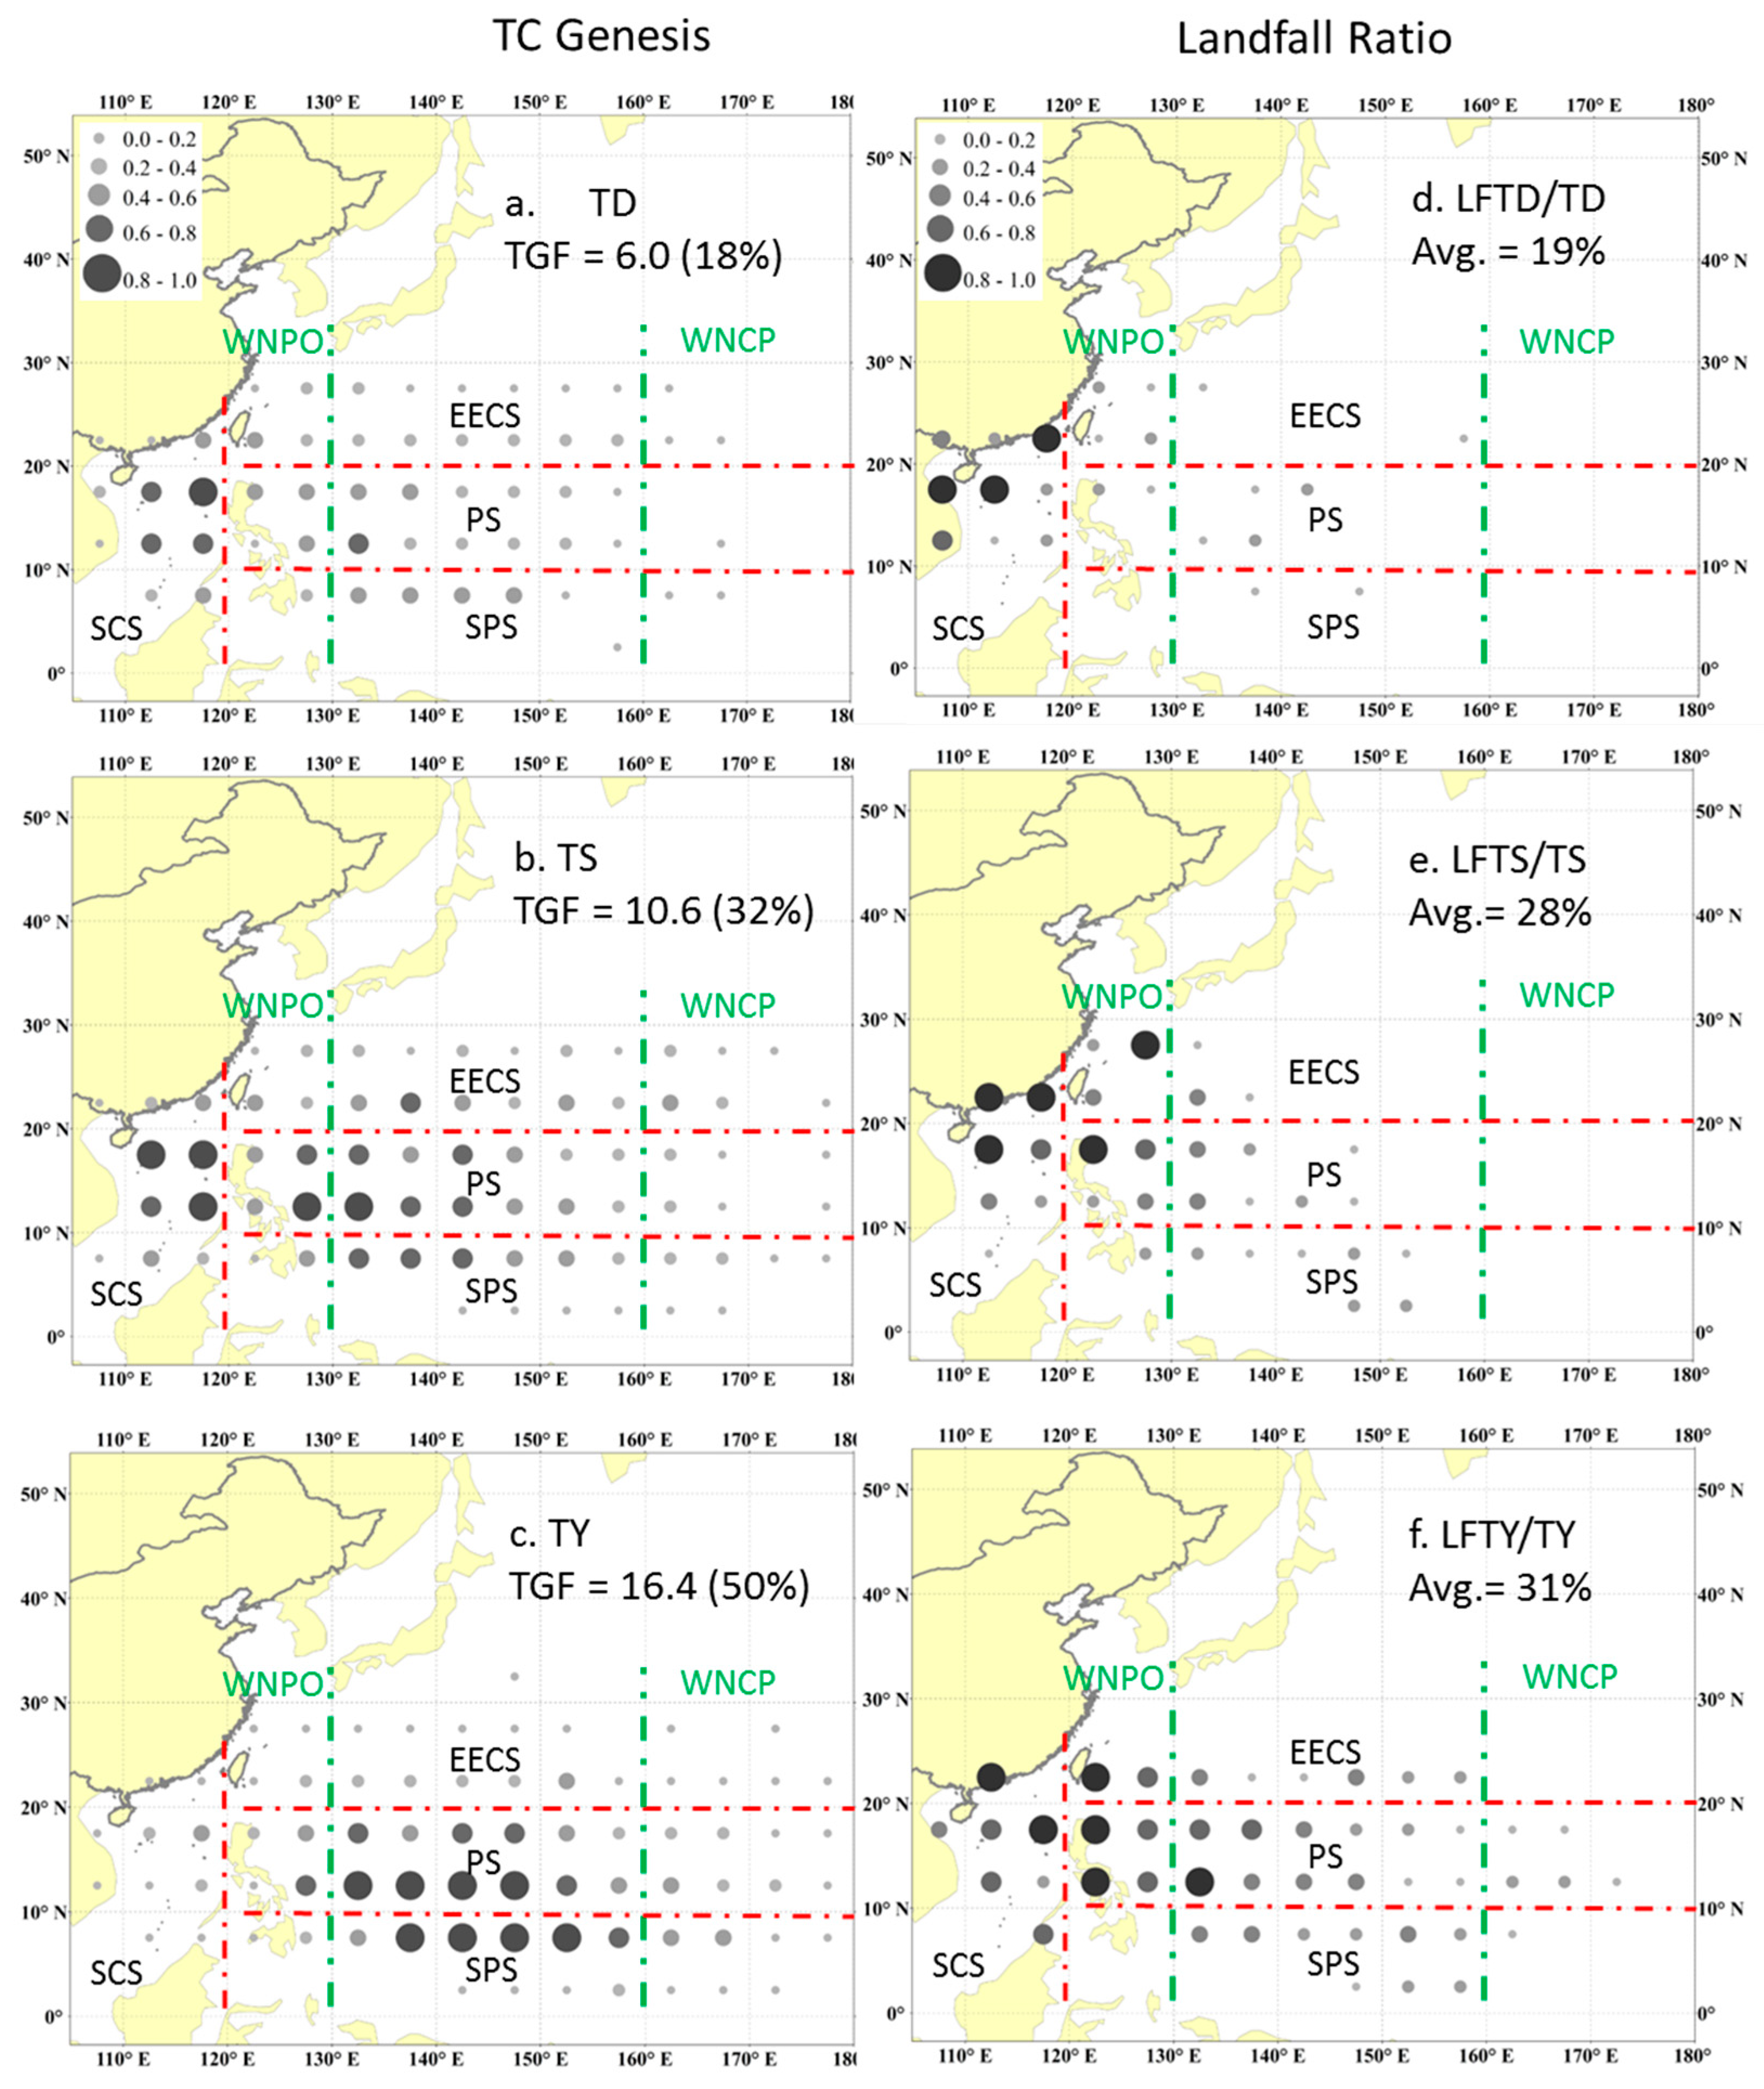
The spatial distribution of TCs demonstrated a significant contrast with their intensity. TDs had a greater genesis frequency, up to 0.8–1.0, in the SCS and the lowest value (<0.2) in the WNCP, while having almost the same genesis frequency in the remaining EECS, PS and SPS (north of 5° N) (Figure 6a). Accordingly, TDs had the highest landfall ratio in the northern SCS, followed by the northern WNPO and central PS, while few TDs generated in other regions could make landfall in mainland China (Figure 6b). In contrast, TYs were mainly generated in the central part of the PS and SPS between the WNPO and WNCP, having the highest frequency, 0.8–1.0, and their landfall ratios decreased with their distance away from the coast. The TY genesis frequencies in the SCS and WNPO were low, but their landfall ratios were high. TSs had a higher genesis frequency in the SCS and the western PS, and much higher landfall ratios in the SCS and the northern WNPO near the coast of mainland China. The average landfall ratios of TDs, TSs, and TYs were 19%, 28%, and 31% in the WNP, respectively, from 1950 to 2019 (Figure 6).
(3)
TC decadal changes in six subregions
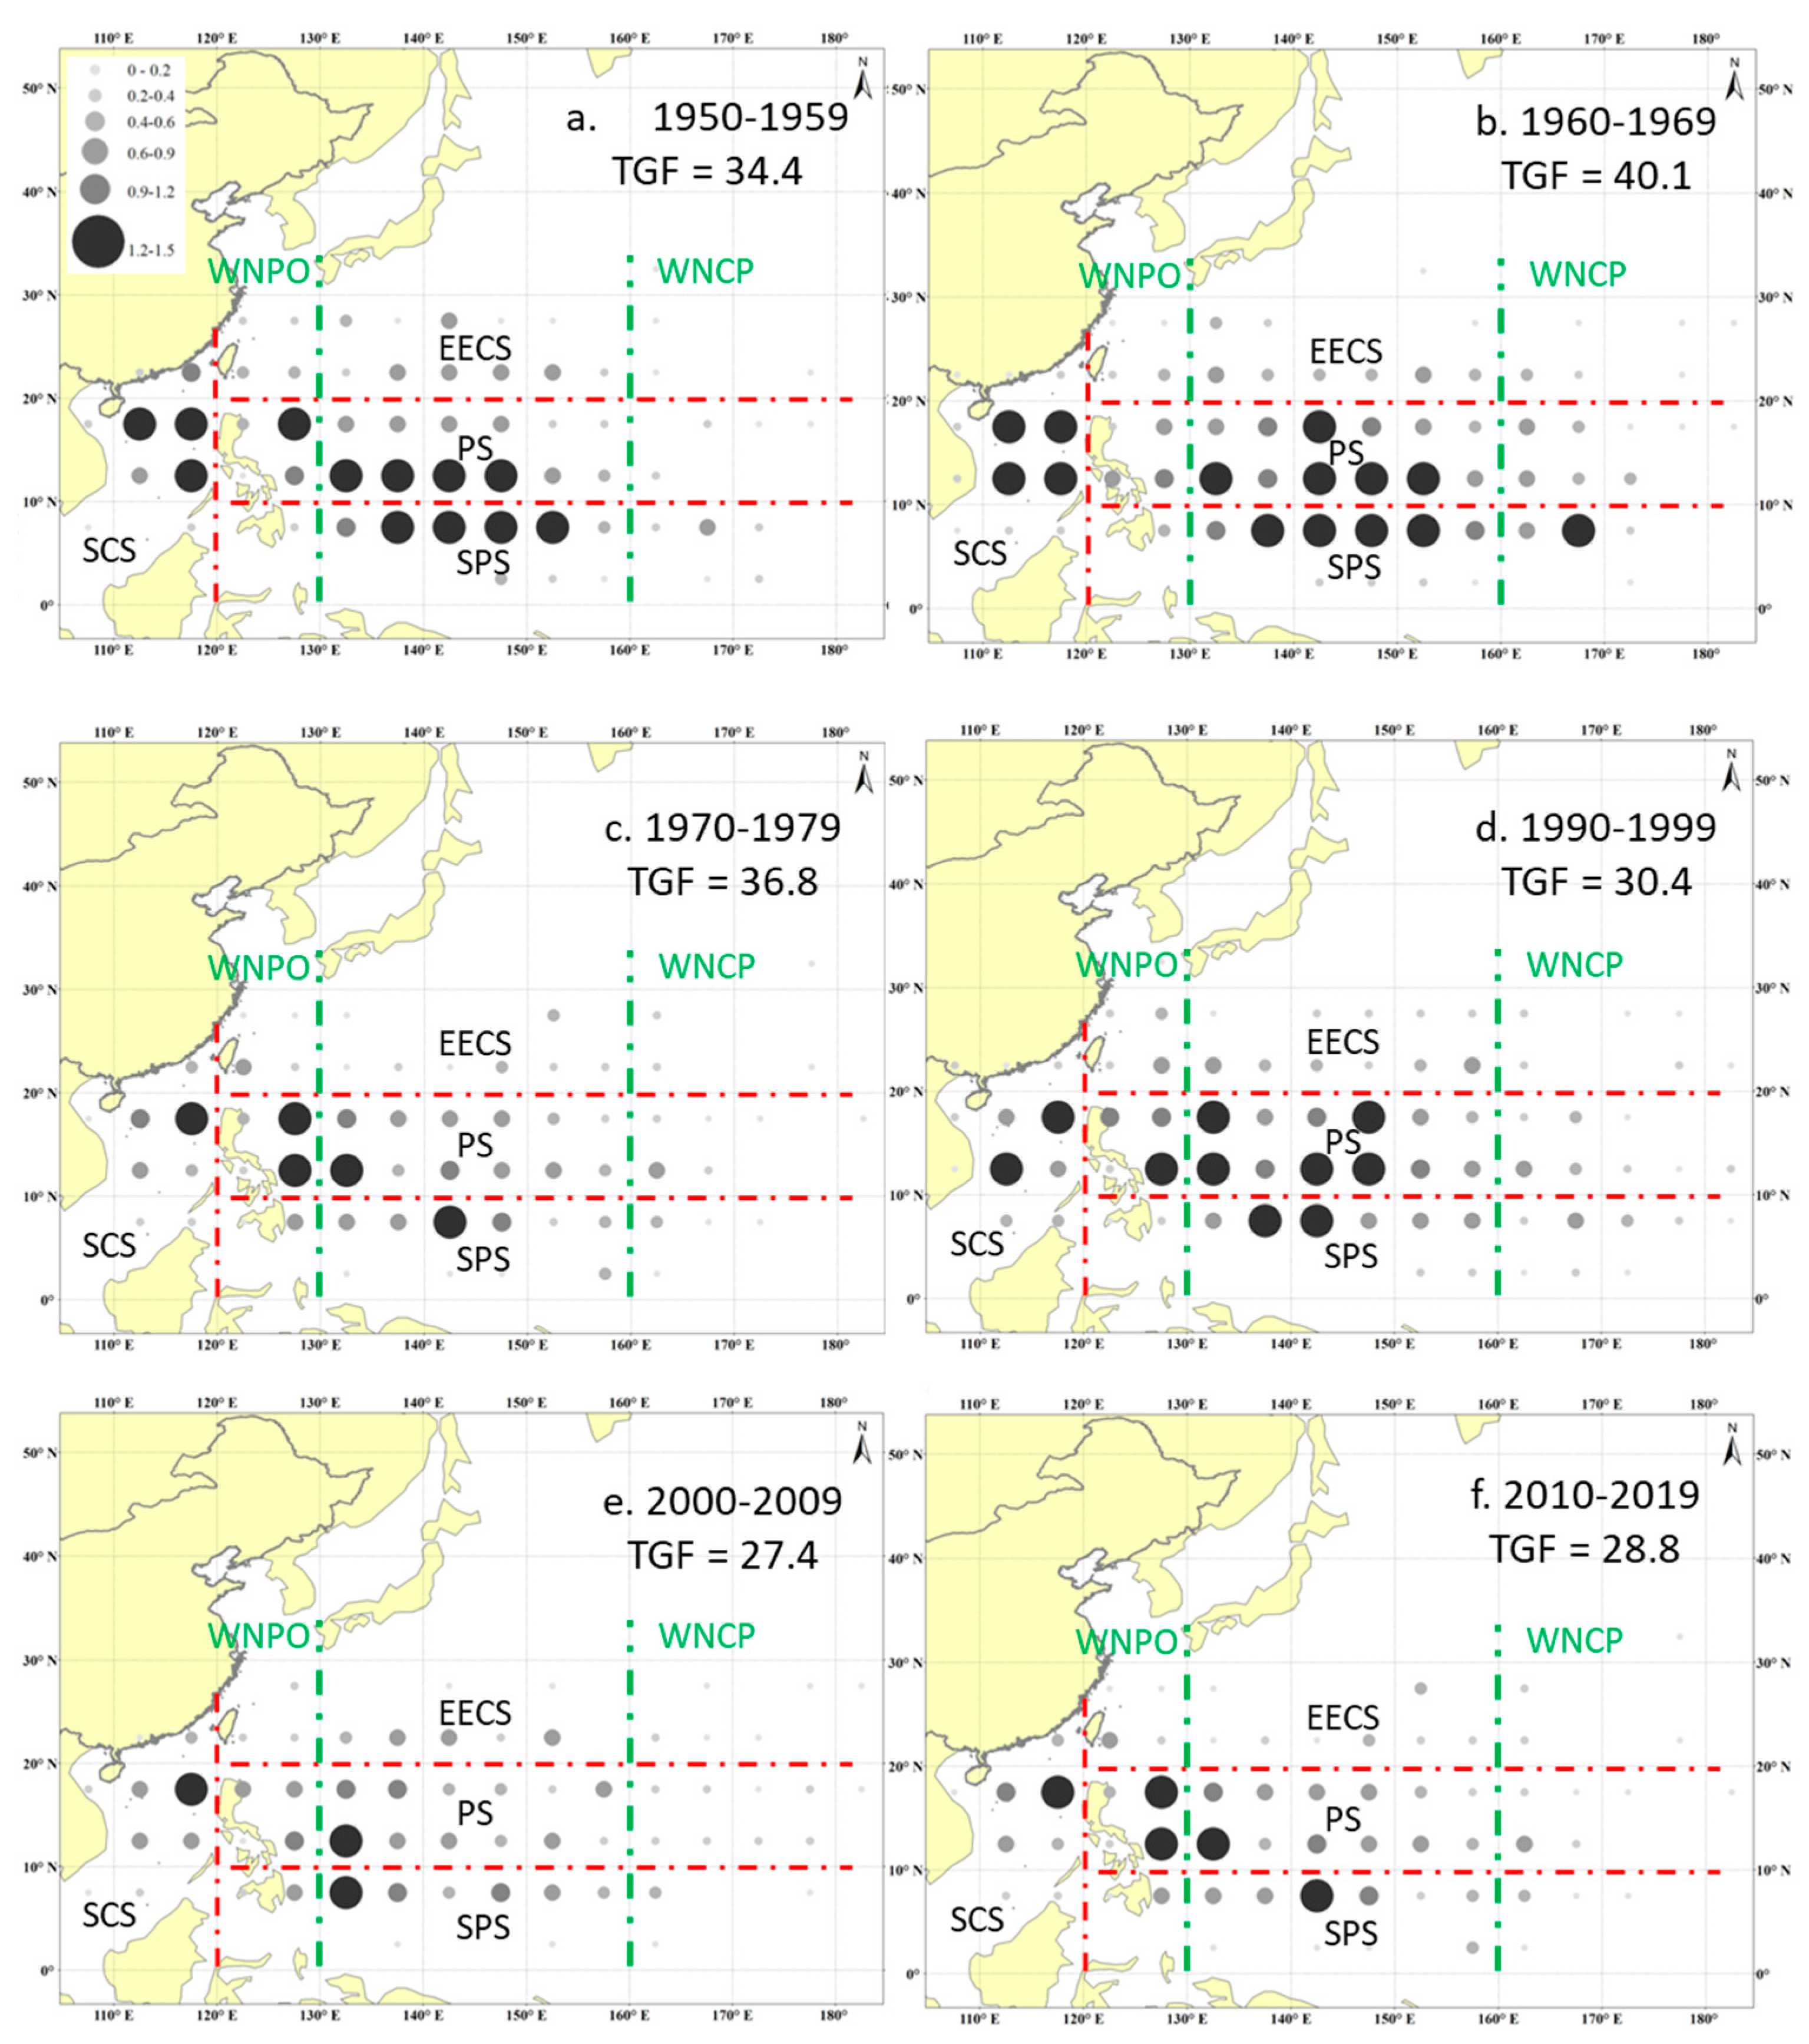
Figure 3 and Figure 4 demonstrated the significant reduction in TC genesis in the WNP from 1950 to 2019. Figure 7 and Figure 8 further illustrated where and how those changes occurred during each decade and in the six subregions. Generally, the TC genesis frequency (TGF) reached its peak, 40.1, in the 1960s, then reduced to its lowest value in the 2000s, 27.4, and slightly increased to 28.8 in the 2010s (Table 1).
The six subregions showed different change patterns from 1950 to 2019 (Figure 7 and Figure 8). The decadal average of TC genesis frequency in most grid boxes, and the sum of annual TC genesis count in most regions, showed a substantial reduction, by a range of −11% in the PS to −46% in the SPS and WNCP between the 2010s and the 1960s, except for the WNPO, where the decadal average of TC genesis increased by 63% (Table 1, Figure 8). The increase in TC genesis in the WNPO and the decrease in the WNCP verified that the TC genesis had shifted westwards. Meanwhile, the reduction in TC genesis in the EECS, PS, and SPS showed no evident northward shift, but a greater reduction was observed in the SPS and SCS than in the PS, resulting in greater values of average latitude in the WNP (Figure 8, Table 1).
The LFTC had a similar decreasing trend, with but a different change pattern from TC genesis from 1950 to 2019. The decadal average of LFTCs decreased by 21%, from 10.2 in the 1960s to 8.1 in the 2010s (Table 2). The dominant reduction in LFTCs occurred in the SPS (−73%) and SCS (−19%). The count and fraction of LFTCs were quite limited in the WNCP and EECS. The frequency of LFTCs in the PS and WNPO increased by 8% and 170%, respectively, from the 1960s to the 2010s, resulting in a dramatic increase in the proportion of LFTCs (Figure 8d).

3.3. TC Moving Tracks and Occurrence Frequency

The TC occurrence had further range than the TC genesis locations, and made landfall and dissipation inland and over higher latitude areas up to the eastern Japan seas (Figure 9). The EECS had the greatest TC occurrence proportion, 39% (while this region contains 49% of the area proportion), followed by the PS with 32%, SCS with 21%, and SPS with only 8% from 1950 to 2019 (Table 3). The WNPO (the coastal and off-coast areas) had a proportion of 23%, while the WNCP (the central Pacific) only had a proportion of 7%.
According to their moving path and directions, all TC tracks were classified into three dominant clusters, i.e., the north tracks, west tracks, and west–east turn tracks, each taking a share of 21%, 38%, and 31% (Figure 9b–d), respectively, plus another 9% with irregular tracks. The west tracks had the highest landfall ratios of 46%, followed by the north tracks with 27% (Table 4). The west–east turn tracks had the greatest TY proportion of 66%, 56% of which were generated from August to October and mainly occurred in the EECS (48%) and PS (34%) (Table 3). In total, 65% of north tracks were generated from July to September, of which TYs comprised 51%, and mainly occurred in the EECS (52%) and PS (31%). In total, 60% of west tracks were generated from July to September, of which TYs comprised 42%, and mainly occurred in the SCS (36%) and PS (35%).
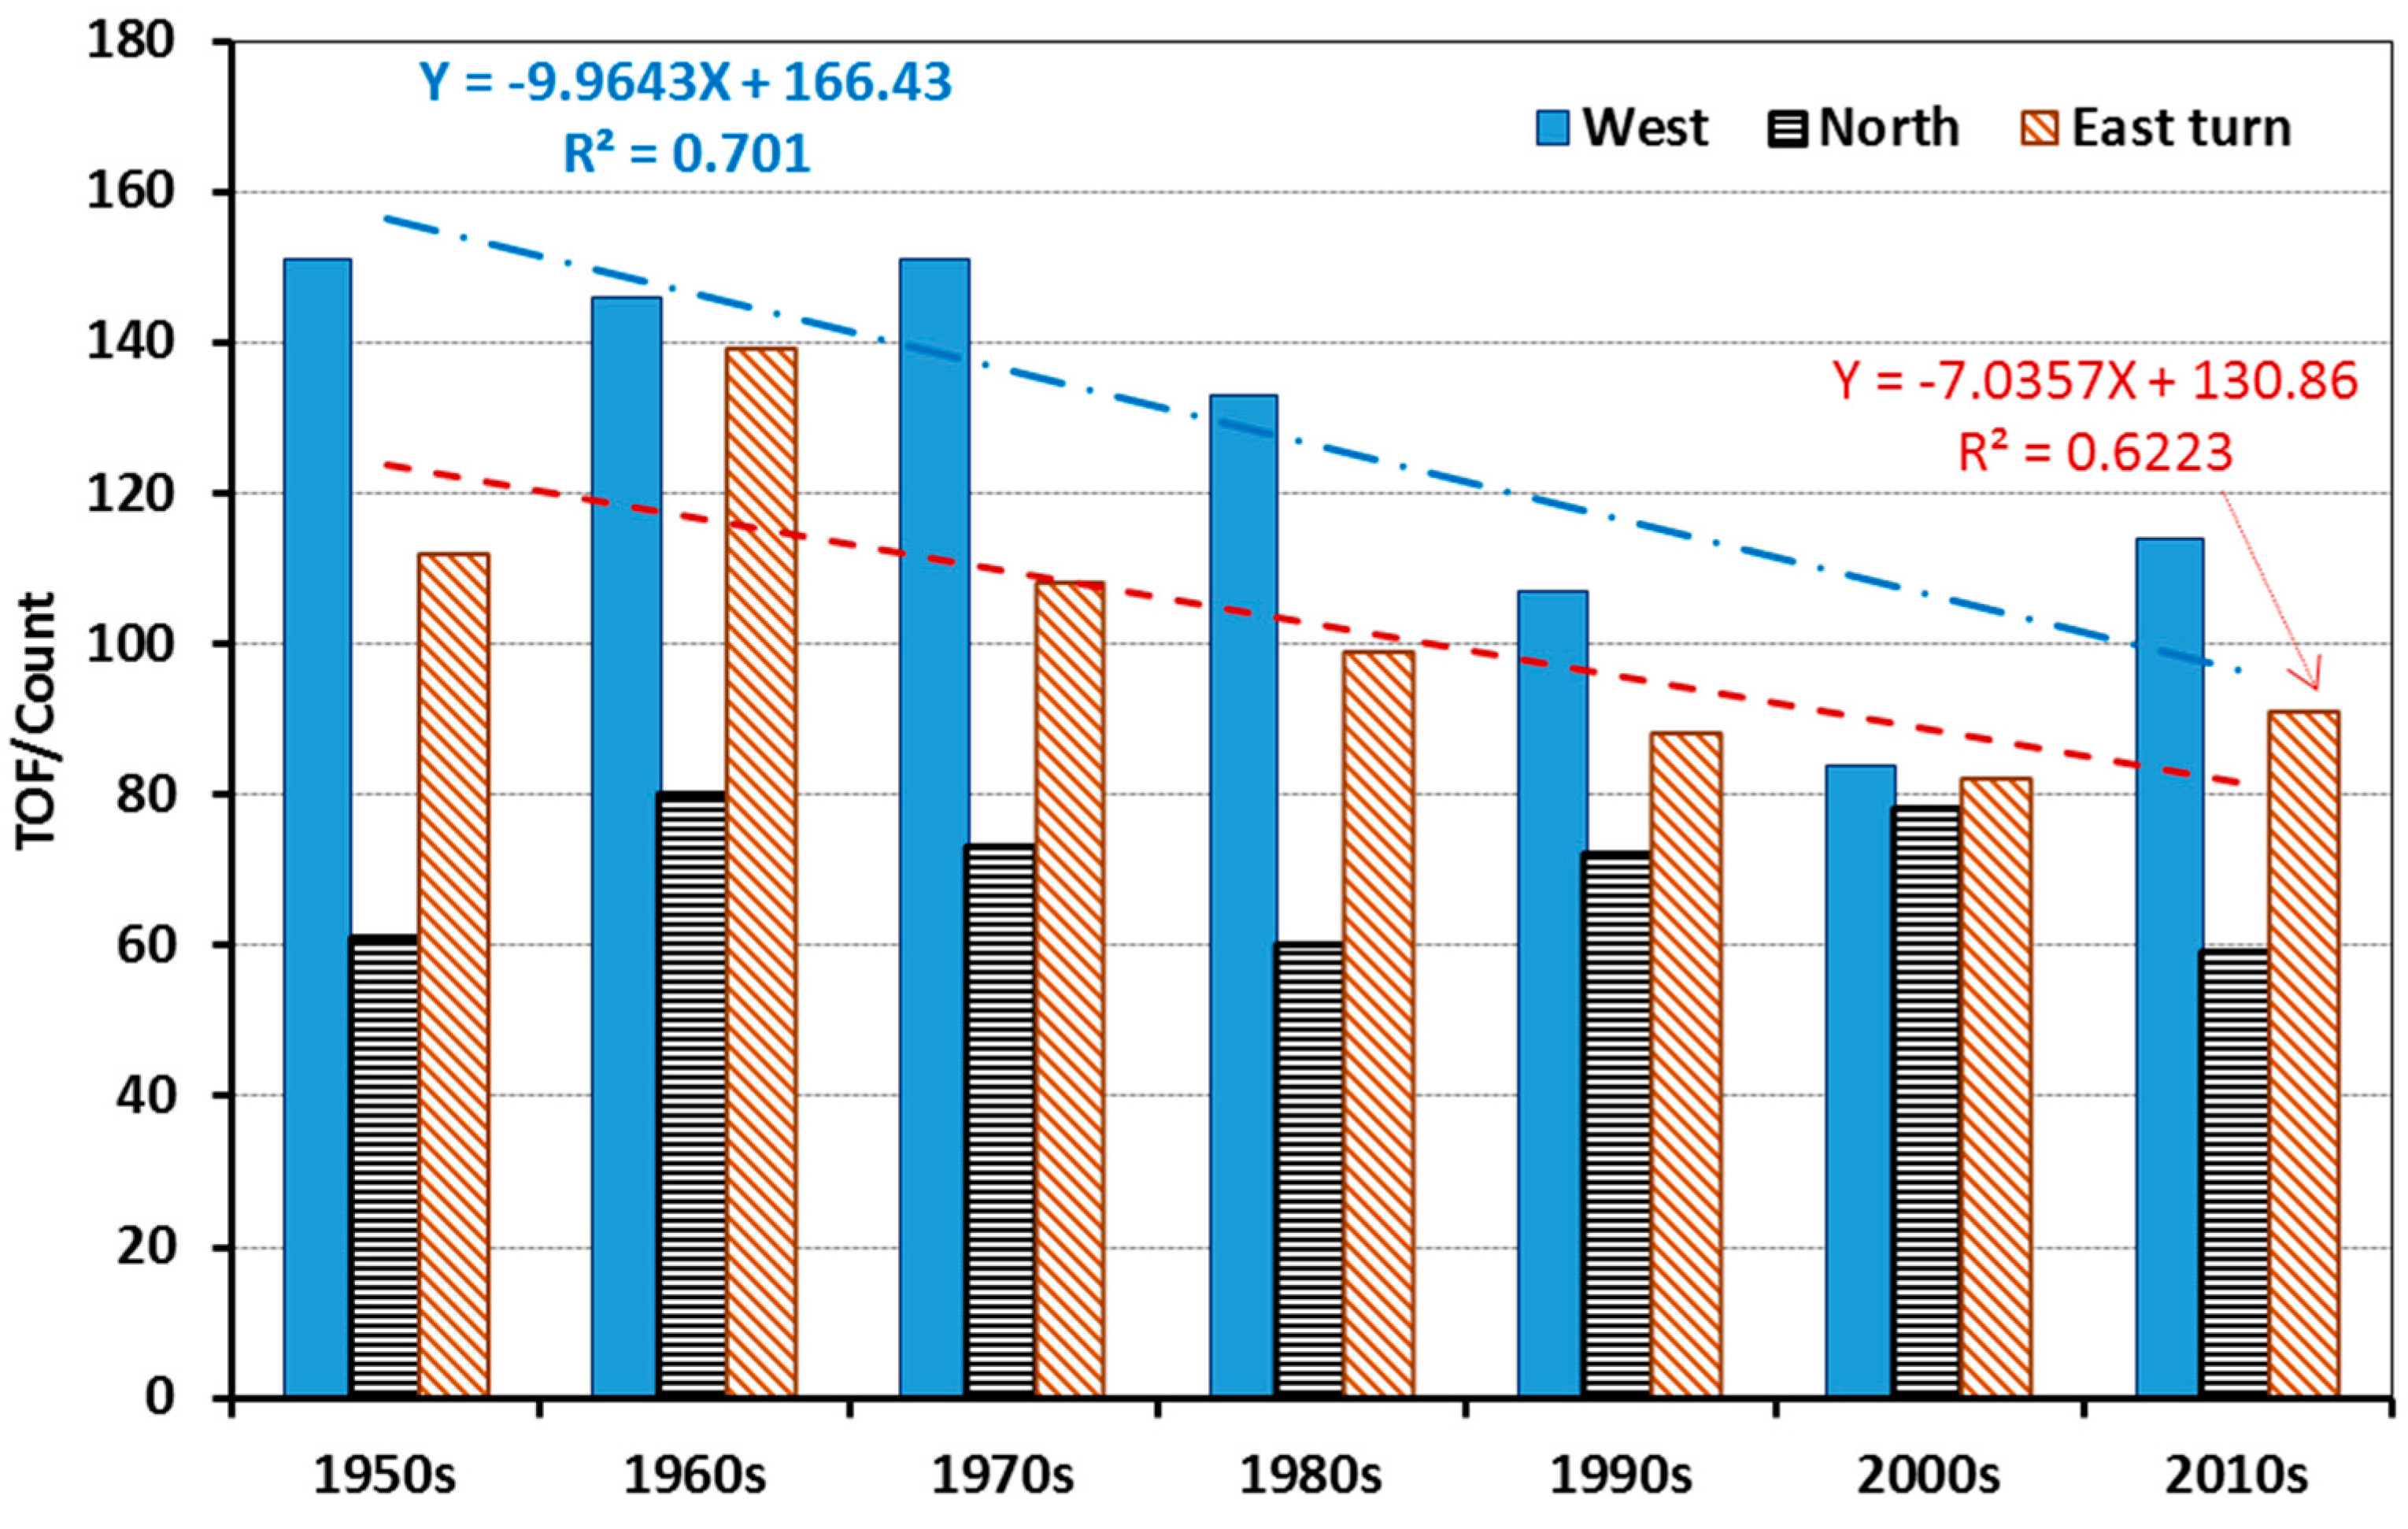
The 1960s had the highest TOF, while the 2000s had the lowest TOF in nearly all six subregions, showing substantial reductions by a range of −55% in the SPS to −23% in the WNPO (Table 3). The coastal region of the WNPO had a lower reduction, with −23%, and the lower latitude area of the SPS and the Central Pacific, WNCP, had greater reductions of −55% and −48%, respectively. Meanwhile, the average TOF in the WNP remained relatively stable in three decades recently, from the 1990s to the 2010s (Table 3). Among the three clusters with dominant moving pathways, both the west tracks and west–east turn tracks showed significant declining trends, while the north tracks did not show any change in trend (Figure 10).

3.4. Influence of ENSO on TC Genesis and Landfall

We adopted a similar method to that of Guo and Tan [5] to separate ENSO events into various durations and phases, and compared their influence on TC genesis frequency and landfall ratios (Figure 11 and Table 5). According to the Niño 3.4 index, the 70 years from 1950 to 2019 were separated into 12 SD and 12 LD El Niño years, 24 La Niña years, and 22 neutral years (Table 5). The El Niño events were further divided into developing and decaying phases, while the La Niña events were divided into developing, mature, and decaying phases (Figure 11). Thereafter, we computed the statistics on the average TC genesis, landfall TC, and landfall ratios during different ENSO phases/years (Table 5).
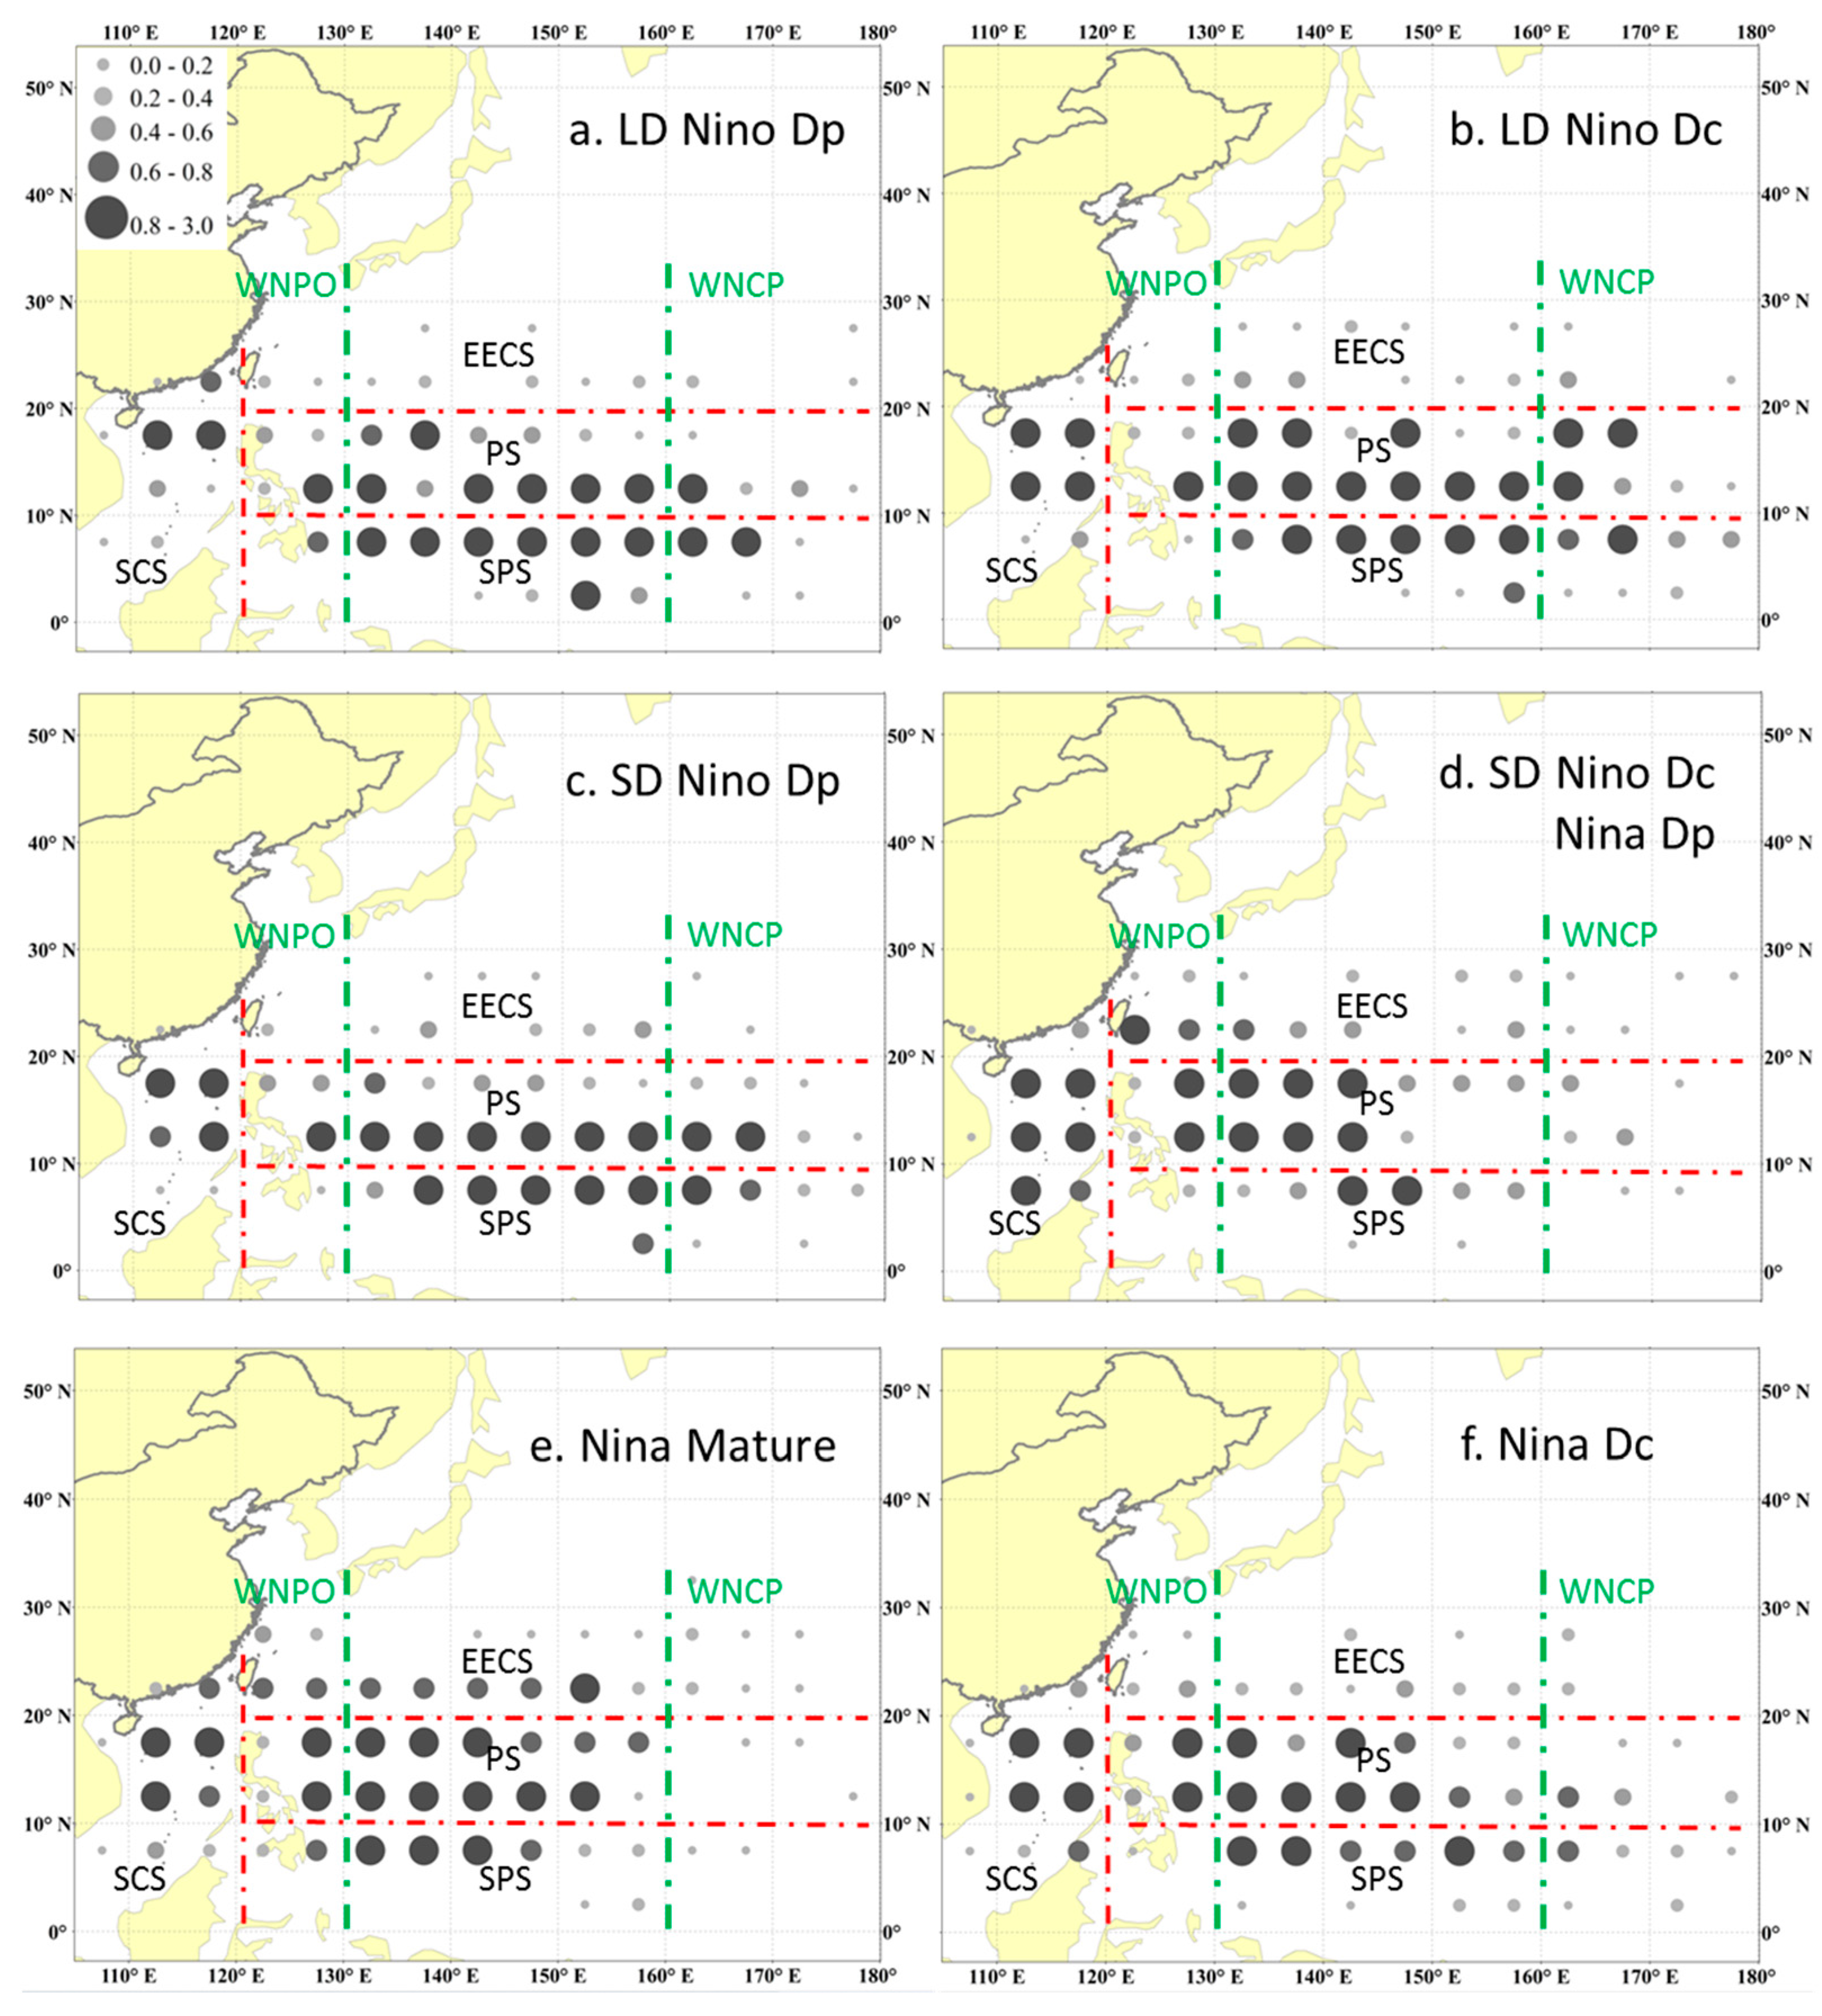
The SD El Niño events had a longer developing duration and greater ENSO index than the LD El Niño events, leading to the lowest TGF of 30.7, landfall TCs of 6.2, and landfall ratios of 20% (Table 5). The SD El Niño decaying phase was usually followed by a La Niña developing phase and had a negative mean ENSO index of −0.88, resulting in a greater number of TC genesis occurrences, more landfall TCs, and higher landfall ratios than those of the SD El Niño developing phases, such as in the SCS and WNPO, and showing evident northward and westward shifts (Figure 12c,d).
The LD El Niño events had shorter developing phases and longer decaying phases than the SD El Niño events, leading to a greater number of TC genesis occurrences and higher landfall ratios in the developing phase, and fewer landfall TCs and lower landfall ratios in the decaying phase, than the SD El Niño events (Table 5). There were evident northward and westward shifts during SD Niño decaying periods against the LD Niño decaying years (Figure 12b,d).
The La Niña developing phase usually followed an SD El Niño decaying phase (Figure 11). The total duration (ENSO months = 23.5) of La Niña events was much longer than that of El Niño events, i.e., 14.0 months for SD and 16.8 months for LD (Table 5). The greatest number of TC genesis occurrences, the most landfall TCs, and the highest landfall ratios were recorded during the La Niña mature years. The La Niña developing and decaying years had slightly lower TC genesis frequencies, but more landfall TCs and higher landfall ratios than the LD El Niño events. There were much lower TGFs in the SPS and WNCP and higher TGFs in the EECS, SCS, WNPO, and northern PS during the Niña developing, mature, and even decaying years than those during LD Niño developing and decaying, and SD Niño developing years, resulting in a northwestward shift in TGF during La Niña events (Figure 12d–f).
The average ENSO index was close to zero (−0.03) during neutral years. The TC genesis frequency was slightly lower than those during La Niña mature and LD El Niño decaying years, although they had the second highest occurrence of landfall TCs and landfall ratios (Table 5).

4. Discussion

4.1. TC Genesis Reduction and Intensification

There were consistent findings that the annual TC genesis number (or frequency/TGF) in the WNP showed a significant declining trend since the 1950s (Figure 3 and Figure 4), with maxima occurring in the 1960s [9,24,25]. The magnitude, or rate of TC genesis number change, were different in the six subregions (Table 1), and the most significant reductions occurred in the SCS, PS, SPS, and WNCP [26,27]. In contrast, in the WNPO, the near-coastal region of mainland China, the TC genesis number increased by 63% in the 2010s compared to that in the 1960s (Figure 8). This was the only region in which we found TC genesis increase, which was attributed to the western shift of TC genesis locations in the WNP [5,9]. In addition, we identified significant decreases (−23%) for TC genesis number and TC occurrence frequency (−33%) in the EECS, which was different from two previous studies that found an increase in TC occurrence frequency during the June–October season from 1961 to 2010 [28,29]. Although the TGF in the 2010s increased by 63% compared to that in the 1960s over the WNPO, the TOF in the 2000s had a reduced by −23%, which was mainly caused by the overall reduction in TGF in other subregions (Table 1 and Table 3).
Although the observed trends in TC genesis and occurrence frequency from the CMA TC best-track datasets were generally consistent with those reported from the JTWC TC best-track data in the literature [9,24,25], inhomogeneities in the CMA TC best-track datasets are likely to reduce the confidence of those observed trends, due to changes in the input data and the technique development of different periods [17]. One of the most significant changes in the CMA TC data was the input data switch from aircraft reconnaissance to satellite images, such as adding the FengYun-2 satellite products between 1997 and 1998. As aircraft reconnaissance ended in 1987, various satellite data with increasing resolution have been used. These changes might have a greater influence on the CMA TC best-track data over open oceans, especially for the extreme intensity values, whose annual occurrence frequency (MSW > 60 m/s) from 1988 to 2010 was drastically lower than that from 1965 to 1987 over open seas, but showed much lower magnitudes of intensity decrease over the near-shore seas [17]. Generally, the improvement of TC detections with more satellite input data and advanced techniques tends to detect more TCs and an eastward shift of TC genesis locations, especially over the open seas, such as in the WNCP [30], while we observed a decreasing trend in TC occurrence and a westward shift of TC genesis locations. This confirms the credibility of the CMA TC data and the observed trends in this study. Thus, the observed decrease in TC occurrence and the westward shift in TC genesis locations are likely to be a real climate trend, which may have a greater magnitude than that in our observation.
The variations in TC maximum intensity (wind speed) were not consistent among different studies. Zhao and Wang found that, although the total frequency of TCs influencing China has decreased from 1949 to 2009, the extreme landfall intensity has increased since 2000 [31]. We found that the number of TY and TD genesis occurrences showed a significant decreasing trend from the 1950s to the 2010s, while the number of TSs remained relatively stable (Figure 4), resulting in a much greater proportion of TSs among all TCs in recent decades. The average maximum sustained wind speed had the greatest value (38.9 m/s) in the 1950s, decreased to its lowest value (33.2 m/s) in the 1970s, and then increased to 35.3m/s in the 2010s (Figure 4e and Table 1). The literature reported TC intensifications since the 1970s, and ignored the decreasing process from the 1950s to the 1970s [13]. Compared to the 1950s, the MSW in recent decades was still much lower. In other words, when referring to different periods, we may draw different conclusions. In fact, even compared to the 1970s, with the low frequency of TC genesis [25], the number of TY genesis occurrences did not show an evident increase, but a decrease (Figure 4e and Table 1). The so-called intensification was attributed to the average MSW, which was mainly caused by the reduction in TD genesis, instead of an increase in the number of TY genesis occurrences.
The different changes in the trends of TC maximum intensity observed in the literature could partially attribute the time difference defining the MSW among different TC datasets, such as the 1 min for the JWTC, 2 min for the CMA-STI, and 10 min for the JMA [13,18]. The time difference defining MSW among different TC datasets raised more questions, such as TC genesis, maximum intensity, and dissipation locations, and made it more difficult to compare the changes in TC formation and intensity trends observed from different TC datasets. That is one of the reasons why this study only chose the most comprehensive CMA TC datasets. A thorough analysis is needed to investigate and clarify how the time difference defining the MSW in the TC datasets of JTWC, CMA, and JMA could affect the TC genesis and occurrence frequency, the westward and northward shifts of TC formation, dissipation, and the lifetime maximum intensity (LMI) location, as well as the change in intensity trends.

4.2. Spatial Shift of TC Genesis Locations

The spatial shifts of TC genesis locations ware reported as poleward migration and westward migration, in terms of average latitude and longitude, in the literature [9,32,33,34]. For instance, based on the 6-hourly best-track positions of TCs over the WNP provided by the JTWC from 1979 to 2012, and compared with the TC genesis locations occurring before and after the late 1990s, the TC genesis number exhibited an evident decrease over the southern WNP (5°–20° N, 105°–170° E), and an increase over the northern WNP, resulting in a significant northward migration in the seasonal mean latitudinal location of TC genesis, i.e., from 17.2° N to 18.7° N [9]. Our analysis found that the annual mean latitude of the TC genesis locations was only 13.50° N in the 1960s and 14.21° N in the 2000s and the 2010s in the WNP. Although our analysis did reveal a radical decrease in the TC genesis number in the PS, SPS and EECS, there was no evident increase in the TC genesis number in the northern WNP, such as in the EECS (20°–35° N, 120°–180° E) (Figure 7). Such a northward shift was only shown in terms of average latitude that was caused by the greater reduction in the southern WNP, i.e., the SCS, SPS, and PS, but the TC genesis number did not increase in the northern WNP, such as in the EECS. In other words, such a northward shift was relatively in proportion, instead of the absolute number of TC formation or occurrences.
In addition to the TC genesis location, the average latitude at which tropical cyclones achieved their lifetime maximum intensity had increased by 0.5° N (53 km), from 1982 to 2012, in the Northern Hemisphere, where the WNP was the main contributor [35]. In addition, Guo and Tan [5] found that the mean rapid-intensification occurrence position of TCs migrated westward by ~8.0° longitude during short duration El Niño events, which was mainly caused by reduced vertical wind shear, increased mid-tropospheric humidity, and enhanced tropical cyclone heat potential over the westernmost WNP [5].
Our analysis confirmed the westward migration of the TC genesis location in the WNP (Figure 7, Table 1). In the central Pacific area, such as in the WNCP, the TC genesis number decreased from an average count of 5.5 in the 1960s to 2.8 in the 2010s. In contrast, the annual TC genesis number in the western off-coast subregion (WNPO) increased from 3.5 in the 1960s to 5.4 in the 2010s. The east–westward shift of the TC genesis location was mainly due to the pronounced westward shift of the tropical upper-tropospheric trough [32] and/or the interdecadal change of the WNP monsoon trough [36,37].

4.3. ENSO Influence on TC Genesis and Landfall

It was previously found that specific humidity, sea surface temperature, and relative vorticities were the dominant factors controlling the interannual TGF from 1950 to 1976, 1977 to 1998, and 1999 to 2014, respectively [38]. The El Niño–South Oscillation (ENSO) events include different atmospheric and oceanic conditions that could affect TC genesis frequency and intensity. Previous studies identified that the TGF variations were closely associated with ENSO behaviors [10,33,39,40,41]. Guo and Tan found that ENSO significantly affected the TC rapid intensification occurrence position in the WNP [5].
We confirmed that TC activity in the WNP depends on ENSO phases [10]. More (fewer) TCs occurred in the WNP during La Niña mature and El Niño decaying (developing) phases, which was consistent with the finding of Shi et al. that more TCs occurred in South China Sea (SCS) in La Niña years from 1979 to 2016 [11]. The SD El Niño developing phase had the lowest TC genesis frequency and landfall ratio. Li found that a 6-month lead or lag correlation between TC genesis frequency and the Niño 3.4 index during the period from 1970 to 2010 was statistically significant [42]. The anomalous anticyclone in the WNP was most visible and maintained during strong El Niño events, such as the SD El Niño events, which leads to lower TGF [43,44]. The circulation anomaly during El Niño developing phases from 1997 to 1998 was responsible for the southeastward shift of the TC genesis location, but had little effect on overall TC genesis frequency [10,38]. The ENSO behaviors during different decadal periods were responsible for the changes of main environmental controlling variables, thus resulting in various TGFs and TOFs in the WNP. However, we were still not certain what caused the ENSO behavior change and the global variations in TC genesis frequency [45].

5. Conclusions

This study carried out comprehensive investigations on the spatiotemporal variations in TC genesis and occurrence frequency in the WNP based on the TC best-track dataset from CMA-STI. The observed trends may be partially related to the inhomogeneities of the CMA TC best-track datasets, especially in the early decades, before the 1970s. The main conclusions are summarized below.
The TC genesis and occurrence frequencies showed a drastic decrease and a westward shift in the WNP from 1950 to 2019. Most decreases in TC genesis occurred for TDs and TYs, while the number of TSs and the mean intensity (maximum wind speed) of TCs overall showed no evident change. The decadal average of TC genesis frequency increased by 63% in the coast/off-coast area (WNPO), but decreased by 46% near the Central Pacific Ocean (WNCP), demonstrating a westward shift for the TC genesis locations. The TC genesis and occurrence frequencies showed a significant decline in the southern Philippine Sea (SPS) and South China Sea (SCS), while they showed a lower reduction in the Eastern East China Sea (EECS), the northern ocean edge of TC genesis areas, resulting in a decrease in the average latitude of TC genesis locations, a spurious northward shift. Moreover, the TC occurrence frequency in the north tracks only demonstrated a minor fluctuation, compared with significant reductions in those of the west tracks and west–east turn tracks.
The La Niña and El Niño years showed contrasting effects on TC genesis and landfall ratios. The highest TC genesis frequency and the landfall ratios occurred during the La Niña mature phase, while the lowest TC genesis and landfall ratios were recorded during the short duration (SD) developing phase. The TC genesis location showed a distinct northwestward shift during La Niña years compared to those during El Niño years. Those are of great significance to understand and assess the TC disaster risk over the WNP and for mainland China.

Author Contributions

Conceptualization, Q.Y. and X.W.; methodology, Q.Y. and X.W.; data curation, Q.Y. and Y.F.; formal analysis, Q.Y., B.X. and R.W.; investigation, Y.N. and P.Y.; writing—original draft preparation, Q.Y.; writing—review and editing, X.W.; project administration, X.W.; resources, B.X. and R.W.; and funding acquisition, X.W. All authors have read and agreed to the published version of the manuscript.

Funding

This study was financially supported by the National Key R&D Program of China (2021YFC3001000), the National Natural Science Foundation of China (41871085), and the Innovation Group Project of Southern Marine Science and Engineering Guangdong Laboratory (Zhuhai) (311021004).

Institutional Review Board Statement

Not Applicable.

Informed Consent Statement

Not Applicable.

Data Availability Statement

TC best-track datasets are available from the China Meteorological Administration Shanghai Typhoon Institute: https://tcdata.typhoon.org.cn/index.html (accessed on 15 March 2023). The Oceanic Niño Index is available from the US National Oceanic and Atmospheric Administration: https://origin.cpc.ncep.noaa.gov/products/analysis_monitoring/ensostuff/ONI_v5.php (accessed on 15 March 2023).

Acknowledgments

The TC best–track dataset provided by the China Meteorological Administration Shanghai Typhoon Institute and the Oceanic Niño Index provided by the US National Oceanic and Atmospheric Administration (NOAA) are highly appreciated.

Conflicts of Interest

The authors declare no conflict of interest.

References

  1. Emanuel, K. Tropical Cyclones. Annu. Rev. Earth Planet. Sci. 2003, 31, 75–104. [Google Scholar] [CrossRef]
  2. Woodruff, J.D.; Irish, J.L.; Camargo, S.J. Coastal flooding by tropical cyclones and sea-level rise. Nature 2013, 504, 44–52. [Google Scholar] [CrossRef] [PubMed]
  3. Seo, N.S.; Bakkensen, L.A. Is tropical cyclone surge, not intensity, what kills so many people in South Asia. Weather Clim. Soc. 2017, 9, 71–81. [Google Scholar] [CrossRef]
  4. Peduzzi, P.; Chatenoux, B.; Dao, H.; De Bono, A.; Herold, C.; Kossin, J.; Mouton, F.; Nordbeck, O. Global trends in tropical cyclone risk. Nat. Clim. Chang. 2012, 2, 289–294. [Google Scholar] [CrossRef]
  5. Guo, Y.-P.; Tan, Z.-M. Westward migration of tropical cyclone rapid-intensification over the Northwestern Pacific during short duration El Niño. Nat. Commun. 2018, 9, 1507. [Google Scholar] [CrossRef]
  6. Chan, K.T.F.; Chan, J.C.L.; Wong, W.K. Rainfall asymmetries of landfalling tropical cyclones along the South China coast. Meteorol. Appl. 2018, 26, 213–220. [Google Scholar] [CrossRef]
  7. Zhao, H.; Wang, C. On the relationship between ENSO and tropical cyclones in the western North Pacific during the boreal summer. Clim. Dyn. 2019, 52, 275–288. [Google Scholar] [CrossRef]
  8. Yao, C.; Xiao, Z.; Yang, S.; Luo, X. Increased severe landfall typhoons in China since 2004. Int. J. Clim. 2021, 41, E1018–E1027. [Google Scholar] [CrossRef]
  9. He, H.; Yang, J.; Gong, D.; Mao, R.; Wang, Y.; Gao, M. Decadal changes in tropical cyclone activity over the western North Pacific in the late 1990s. Clim. Dyn. 2015, 45, 3317–3329. [Google Scholar] [CrossRef]
  10. Hu, C.; Zhang, C.; Yang, S.; Chen, D.; He, S. Perspective on the Northwestward Shift of Autumn Tropical Cyclogenesis Locations over the Western North Pacific from Shifting ENSO. Clim. Dyn. 2018, 51, 2455–2465. [Google Scholar] [CrossRef]
  11. Shi, Y.; Du, Y.; Chen, Z.; Zhou, W. Occurrence and impacts of tropical cyclones over the southern South China Sea. Int. J. Clim. 2019, 40, 4218–4227. [Google Scholar] [CrossRef]
  12. Knutson, T.R.; McBride, J.L.; Chan, J.; Emanuel, K.; Holland, G.; Landsea, C.; Held, I.; Kossin, J.P.; Srivastava, A.K.; Sugi, M. Tropical cyclones and climate change. Nat. Geosci. 2010, 3, 157–163. [Google Scholar] [CrossRef]
  13. Mei, W.; Xie, S.P. Intensification of Landfalling Typhoons over the Northwest Pacific since the Late 1970s. Nat. Geosci. 2016, 9, 753–757. [Google Scholar] [CrossRef]
  14. Li, R.C.Y.; Zhou, W.; Shun, C.M.; Lee, T.C. Change in Destructiveness of Landfalling Tropical Cyclones over China in Recent Decades. J. Clim. 2017, 30, 3367–3379. [Google Scholar] [CrossRef]
  15. Zhan, R.; Wang, Y.; Liu, Q. Salient differences in tropical cyclone activity over the western North Pacific between 1998 and 2016. J. Clim. 2017, 30, 9979–9997. [Google Scholar] [CrossRef]
  16. Zhao, H.; Raga, G.B.; Klotzbach, P.J. Impact of the boreal summer quasi-biweekly oscillation on Eastern North Pacific tropical cyclone activity. Int. J. Clim. 2017, 38, 1353–1365. [Google Scholar] [CrossRef]
  17. Ying, M.; Zhang, W.; Yu, H.; Lu, X.; Feng, J.; Fan, Y.; Zhu, Y.; Chen, D. An Overview of the China Meteorological Administration Tropical Cyclone Database. J. Atmos. Ocean. Technol. 2014, 31, 287–301. [Google Scholar] [CrossRef]
  18. Lu, X.; Yu, H.; Ying, M.; Zhao, B.; Zhang, S.; Lin, L.; Bai, L.; Wan, R. Western North Pacific Tropical Cyclone Database Created by the China Meteorological Administration. Adv. Atmos. Sci. 2021, 38, 690–699. [Google Scholar] [CrossRef]
  19. Huang, B.; Thorne, P.W.; Banzon, V.F.; Boyer, T.; Chepurin, G.; Lawrimore, J.H.; Menne, M.J.; Smith, T.M.; Vose, R.S.; Zhang, H.-M. Extended Reconstructed Sea Surface Temperature, Version 5 (ERSSTv5): Upgrades, Validations, and Intercomparisons. J. Clim. 2017, 30, 8179–8205. [Google Scholar] [CrossRef]
  20. GB/T 19201-2006; Grade of Tropical Cyclones. Standardization Administration of China: Beijing, China, 2006. Available online: http://www.gov.cn/ztzl/2006-07/27/content_347790.htm (accessed on 26 April 2022).
  21. Bamston, A.G.; Chelliah, M.; Goldenberg, S.B. Documentation of a highly ENSO-related sst region in the equatorial pacific: Research note. Atmosphere-Ocean 1997, 35, 367–383. [Google Scholar] [CrossRef]
  22. Boo, K.-O.; Lim, G.-H.; Kim, K.-Y. On the low-level circulation over the western north Pacific in relation with the duration of El Niño. Geophys. Res. Lett. 2004, 31, L10202. [Google Scholar] [CrossRef]
  23. Chen, W.; Park, J.-K.; Dong, B.-W.; Lu, R.Y.; Jung, W.-S. The relationship between ENSO and the western North Pacific summer climate in a coupled GCM: Role of the duration of El Niño decaying phases. J. Geophys. Res. 2012, 117, D12111. [Google Scholar]
  24. Matsuura, T.; Yumoto, M.; Iizuka, S. A mechanism of interdecadal variability of tropical cyclone activity over the western North Pacific. Clim. Dyn. 2003, 21, 105–117. [Google Scholar] [CrossRef]
  25. Liu, K.S.; Chan, J. Inactive Period of Western North Pacific Tropical Cyclone Activity in 1998–2011. J. Clim. 2013, 26, 2614–2630. [Google Scholar] [CrossRef]
  26. Kubota, H.; Chan, J. Interdecadal Variability of Tropical Cyclone Landfall in the Philippines from 1902 to 2005. Geophys. Res. Lett. 2009, 36, L12802. [Google Scholar] [CrossRef]
  27. Wang, L.; Huang, R.; Wu, R. Interdecadal variability in tropical cyclone frequency over the South China Sea and its association with the Indian Ocean sea surface temperature. Geophys. Res. Lett. 2013, 40, 768–771. [Google Scholar] [CrossRef]
  28. Wu, L.; Wang, B.; Geng, S. Growing typhoon influence on east Asia. Geophys. Res. Lett. 2005, 32, 1–4. [Google Scholar] [CrossRef]
  29. Yokoi, S.; Takayabu, Y.N. Attribution of Decadal Variability in Tropical Cyclone Passage Frequency over the Western North Pacific: A New Approach Emphasizing the Genesis Location of Cyclones. J. Clim. 2013, 26, 973–987. [Google Scholar] [CrossRef]
  30. Velden, C.; Harper, B.; Wells, F.; Beven, J.L.; Zehr, R.; Olander, T.; Mayfield, M.; Guard, C.; Lander, M.; Edson, R.; et al. The Dvorak Tropical Cyclone Intensity Estimation Technique: A Satellite-Based Method that Has Endured for over 30 Years. Bull. Am. Meteorol. Soc. 2006, 87, 1195–1210. [Google Scholar] [CrossRef]
  31. Zhao, S.S.; Wang, X.L. Decadal variations of extreme tropical cyclones influencing China during 1949-2009. Adv. Clim. Chang. Res. 2012, 3, 121–127. [Google Scholar] [CrossRef]
  32. Wu, L.; Wang, C.; Wang, B. Westward shift of western North Pacific tropical cyclogenesis. Geophys. Res. Lett. 2015, 42, 1537–1542. [Google Scholar] [CrossRef]
  33. Feng, X.; Klingaman, N.P.; Hodges, K.I. Poleward migration of western North Pacific tropical cyclones related to changes in cyclone seasonality. Nat. Commun. 2021, 12, 1–11. [Google Scholar] [CrossRef]
  34. Hu, F.; Li, T.; Liu, J.; Bi, M.; Peng, M. Decrease of tropical cyclone genesis frequency in the western North Pacific since 1960s. Dyn. Atmos. Oceans 2018, 81, 42–50. [Google Scholar] [CrossRef]
  35. Kossin, J.; Emanuel, K.; Vecchi, G. The poleward migration of the location of tropical cyclone maximum intensity. Nature 2014, 509, 349–352. [Google Scholar] [CrossRef] [PubMed]
  36. Huang, F.J.; Huang, R.; Chen, W.; Feng, T.; Wu, L. Interdecadal Variation of Tropical Cyclone Genesis and Its Relationship to the Monsoon Trough over the Western North Pacific. Int. J. Climatol. 2017, 37, 3587–3596. [Google Scholar] [CrossRef]
  37. Feng, X.; Wu, L. Roles of interdecadal variability of the western North Pacific monsoon trough in shifting tropical cyclone formation. Clim. Dyn. 2021, 58, 87–95. [Google Scholar] [CrossRef]
  38. Hu, F.; Li, T.; Liu, J.; Peng, M. Cause of interdecadal change of tropical cyclone controlling parameter in the western North Pacific. Clim. Dyn. 2017, 51, 719–732. [Google Scholar] [CrossRef]
  39. Wu, M.C.; Chang, W.L.; Leung, W.M. Impacts of El Niño–Southern Oscillation Events on Tropical Cyclone Landfalling Activity in the Western North Pacific. J. Clim. 2004, 17, 1419–1428. [Google Scholar] [CrossRef]
  40. Liu, P.; Kajikawa, Y.; Wang, B.; Kitoh, A.; Yasunari, T.; Li, T.; Annamalai, H.; Fu, X.; Kikuchi, K.; Mizuta, R.; et al. Tropical Intraseasonal Variability in the MRI-20km60L AGCM. J. Clim. 2009, 22, 2006–2022. [Google Scholar] [CrossRef]
  41. Yeh, S.-W.; Kang, S.-K.; Kirtman, B.P.; Kim, J.-H.; Kwon, M.-H.; Kim, C.-H. Decadal change in relationship between western North Pacific tropical cyclone frequency and the tropical Pacific SST. Meteorol. Atmos. Phys. 2010, 106, 179–189. [Google Scholar] [CrossRef]
  42. Li, T. Synoptic and climatic aspects of tropical cyclogenesis in western North Pacific. In Cyclones: Formation, Triggers and Control; Oouchi, K., Fudeyasu, H., Eds.; Nova Science Publishers: New York, NY, USA, 2012; Chapter 3; pp. 61–94. [Google Scholar]
  43. Wang, B.; Chan, J.C.L. How Strong ENSO Events Affect Tropical Storm Activity over the Western North Pacific. J. Clim. 2002, 15, 1643–1658. [Google Scholar] [CrossRef]
  44. Wang, B.; Wu, R.; Li, T.I.M. Atmosphere–warm ocean interaction and its impacts on Asian–Australian monsoon variation. J. Clim. 2003, 16, 1195–1211. [Google Scholar] [CrossRef]
  45. Sobel, A.H.; Wing, A.A.; Camargo, S.J.; Patricola, C.M.; Vecchi, G.A.; Lee, C.; Tippett, M.K. Tropical Cyclone Frequency. Earth’s Futur. 2021, 9, e2021EF002275. [Google Scholar] [CrossRef]
Figure 1. Illustration of the three clusters of TC tracks with dominant directions of west, north, and west–east turn, which matched the background image of the average TC Occurrence Frequency (TOF, all 6–hourly recorded points in a 2.5° × 2.5° grid per year) from 1980 to 1989.
Jmse 11 00946 g001
Figure 2. Seasonal variations in TC genesis count in the WNP and landfall (LFTC) count in mainland China from 1950 to 2019: (a) Typhoons (TYs), Tropical Storms (TSs), and Tropical Depressions (TDs), (b) LFTYs, LFTSs, and LFTDs; (c) TCs, LFTCs, and LFTC/TC; and (d) landfall ratios of LFTY/TY, LFTS/TS, LFTD/TD, and LFTC/TC.
Jmse 11 00946 g002
Figure 3. Annual count of TCs (blue column), Landfall TCs (orange column) and the landfall ratios of LFTC/TC (dashed curve) in the WNP from 1950 to 2019, plus the linear trends of TCs (blue line) and landfall ratios (dotted line). The threshold value of R2 for the significance test of linear trends is 0.07 at the confidence level of 95% (α = 0.025, n = 70).
Jmse 11 00946 g003
Figure 4. Decadal average of annual count of (a) TYs, TSs and TDs; (b) LFTYs, LFTSs, and LFTDs; and the proportion of (c) TYs, TSs, and TDs against TCs; (d) LFTYs, LFTSs and LFTDs against LFTCs; (e) TCs and maximum sustaining wind speed (MSW); and (f) LFTCs and MSW from the 1950s to the 2010s. The R2 threshold value for the significance test of linear trends is 0.33 at the confidence level of 95% (α = 0.025, n = 7).
Jmse 11 00946 g004
Figure 5. Average annual genesis frequency (count) in 5° grids for (a) TCs and (b) landfall ratios from 1950 to 2019 in the WNP, which was divided into six subregions, i.e., the South China Sea (SCS), Southern Philippine Sea (SPS), Philippine Sea (PS), Eastern East China Sea (EECS), Western North Pacific Off-Coast (WNPO), and Western North Central Pacific (WNCP).
Jmse 11 00946 g005
Figure 6. Average annual genesis frequency (count) in 5° grids in the WNP for (a) TDs, (b) TSs, (c) and TYs, and (df) their landfall ratios in mainland China from 1950 to 2019.
Jmse 11 00946 g006
Figure 7. The decadal average of annual TC genesis frequency (count) in 5° grids from 1950 to 2019. The neutral decade, 1980–1989 (TGF = 32.5), was skipped for better layout.
Jmse 11 00946 g007
Figure 8. The decadal sum of TC genesis count in (a) the SPS and EECS, (b) the WNPO and WNCP, (c) the SCS and PS, and (d) their proportions in each subregion from 1950 to 2019. The R2 threshold value for the significance test of linear trends is 0.33 at the confidence level of 95% (α = 0.025, n = 7).
Jmse 11 00946 g008
Figure 9. The average TC Occurrence Frequency (TOF) in 2.5° grids from 1950 to 2019 (a), and the three clusters with dominant moving directions of (b) north tracks, (c) west tracks, and (d) west–east turn tracks.
Jmse 11 00946 g009
Figure 10. Variations in decadal average TC Occurrence Frequency (TOF) for the three clusters with dominant moving directions of north, west, and west–east turn from 1950 to 2019. The R2 threshold value for the significance test of linear trends is 0.33 at the confidence level of 95% (α = 0.025, n = 7).
Jmse 11 00946 g010
Figure 11. The Niño 3.4 indices for two types of El Niño: (a) Short Duration (SD) and (b) Long Duration (LD), and (c) the three phases of La Niña, from 1950 to 2019.
Jmse 11 00946 g011
Figure 12. The average TC genesis frequency in different ENSO years, from 1950 to 2019, over the WNP. (a) LD Niño developing, (b) LD Niño decaying, (c) SD Niño developing, (d) SD Niño decaying and/or Niña developing, (e) Niña mature, and (f) Niña decaying years.
Jmse 11 00946 g012
Table 1. The decadal average of TC Genesis Frequency (TGF) and (MSW) in the WNP, and the proportion of TCs and their change rates between the 2010s and the 1960s in the six subregions.
YearsSCSSPSPSEECSWNPOWNCPWNPMSW
m/s
1950s7.010.212.15.13.92.134.4 38.9
1960s7.312.715.84.33.25.240.1 37.5
1970s6.08.716.25.94.33.836.8 33.2
1980s5.28.913.15.34.52.732.5 34.4
1990s5.76.314.83.64.63.530.4 33.7
2000s4.76.812.23.74.02.527.4 34.9
2010s4.66.914.03.35.22.828.8 35.3
1950–201918%26%43%14%13%10%32.9 35.4
Area proportion12%27%26%36%13%30%100%n.a.
Change rates−37%−46%−11%−23%63%−46%−28%−5.7%
Note: The WNPO and WNCP overlap with the EECS, PS, and SPS, but not with the SCS. WNP = SCS + EECS + PS + SPS.
Table 2. The decadal average of LFTC Genesis Frequency (LGF) and MSW in the WNP, the proportion of LFTCs and their change rates between the 2010s and the 1960s in the six subregions.
YearsSCSSPSPSEECSWNPOWNCPWNPMSW
m/s
1950s3.92.92.90.61.30.110.336.5
1960s2.62.64110.310.244.2
1970s2.11.35.10.61.509.139.7
1980s2.523.91.21.70.29.635.0
1990s2.81.24.40.62.209.035.1
2000s2.31.34.30.92.40.28.834.8
2010s2.10.74.312.70.28.137.1
1950–201928%18%44%9%20%2%9.337.5
Area proportion12%27%26%36%13%30%100%n.a.
Change rates−19%0%8%−73%170%−33%−21%−16.1%
Note: The WNPO and WNCP overlap with the EECS, PS, and SPS, but not with the SCS. WNP = SCS + EECS + PS + SPS.
Table 3. The decadal average of TC Occurrence Frequency (TOF), the proportion of TOF, and change rates between the 2000s and the 1960s in six subregions and in three clusters of tracks.
YearsSCSSPSPSEECSWNPOWNCPWNP
1950s1849530037721860955
1960s228110415503258991257
1970s24884326410249811068
1980s2057431434821460942
1990s1786029333919570869
2000s1585025233719951796
2010s1846326534922957860
1950–201921%8%32%39%23%7%964
Area proportion12%20%19%49%13%29%100%
Change rates−31%−55%−39%−33%−23%−48%−37%
West Tracks36%10%35%19%27%4%324
North Tracks11%6%31%52%25%8%202
West–East Turn11%8%34%48%20%9%353
Note: The proportion sum of the SCS, EECS, PS, and SPS equals one. The WNPO and WNCP overlap with the EECS, PS and SPS, but not with the SCS. TOF is the decadal average of annual TC Occurrence in the WNP.
Table 4. Statistics of TC genesis and occurrence in three clusters with dominant tracks.
West TracksNorth TracksWest-East Turn Tracks
TC Genesis886483719
Genesis proportion38%21%31%
Genesis date mode60% (July–September)65% (July–September)56% (August–October)
TY42%51%66%
TS35%32%26%
TD23%17%8%
Landfall ratio46%27%11%
Table 5. Statistics on TC genesis in the WNP and landfall TCs in mainland China during Short Duration (SD) and Long Duration (LD) El Niño and La Niña years, from 1950 to 2019.
ItemsENSO PhaseYearsENSO Index* ENSO Months* Total MonthsAll TCsLandfall TCsLFTC/TC
SD El NiñoEl Niño Developing61.659.814.0#30.76.220.0%
El Niño Decaying & La Niña Developing6−0.886.014.032.28.827.4%
LD El NiñoEl Niño Developing60.836.216.832.07.222.5%
El Niño Decaying60.789.016.833.58.023.5%
La NiñaLa Niña Developing8−0.977.623.531.19.030.5%
La Niña Mature8−0.6210.023.535.410.630.5%
La Niña Decaying80.114.123.531.69.128.9%
Neutral Years22−0.03n/an/a33.29.829.4%
* ENSO months represent those whose ENSO index was above 0.5 or below −0.5 in a year, and the total months were the ENSO months spanning two or three consecutive years. # Highlighted values in bold font have significant difference (p < 0.025) against those in La Niña Mature years at a confidence level of 95%.
Disclaimer/Publisher’s Note: The statements, opinions and data contained in all publications are solely those of the individual author(s) and contributor(s) and not of MDPI and/or the editor(s). MDPI and/or the editor(s) disclaim responsibility for any injury to people or property resulting from any ideas, methods, instructions or products referred to in the content.