Abstract
Jinhae Bay in South Korea is a common typhoon shelter, but there are no established criteria for the area or vessel capacity. The aim of this study was to determine the optimal capacity and arrangement of typhoon shelters for vessels in the sea area surrounding Jinhae Bay. The study identified several areas that could serve as typhoon shelters and conducted a survey with experienced VTS operators and ship operators to identify the best typhoon avoidance areas. The study found that the Japanese and Spanish design criteria for anchoring in strong winds were useful in computing the optimal capacity of typhoon shelters. A nesting algorithm based on the genetic algorithm and the No-Fit-Polygon theory was used to optimize the arrangement of shelters. The study found that the Jinhae Bay typhoon shelter can be effectively managed by arranging shelter-seeking vessels based on the nesting algorithm. The study contributes to supporting quantitative methodology-based decision-making and has practical significance for managing typhoon shelters in the Jinhae Bay area. Further research is needed to evaluate the proposed arrangement plan for typhoon shelters and confirm the validity of the results through simulation and practical implementation. Additionally, the time complexity for vessels to approach the anchorage should be considered in future studies.
1. Introduction
Due to its geographical location, South Korea is hit by two or three typhoons each year, causing ships in nearby waters to seek shelter in topographically safe shelters [1]. Jinhae Bay is a well-known typhoon shelter in South Korea, but the crowded conditions during a typhoon increase the risk of marine accidents [2].
Anchorages are typically established by designating specific areas on the sea surface based on officially recognized design criteria outlined in regulations for port facility operation. These designated areas, known as typhoon shelters, are not commonly used for regular anchorage but serve as safe havens in emergency situations. However, the typhoon shelters in the Jinhae Bay area of South Korea are not officially recognized and are operated irregularly under the direction of the Vessel Traffic Service (VTS) during emergencies [3]. Since these areas are not officially designated as typhoon shelters, the exact location for anchoring and the maximum capacity for ships are not specified. During typhoons, a large number of vessels gather in the area, leading to anchor dragging, which is supported by strong winds and increases the risk of marine accidents [4]. Therefore, it is crucial to identify the appropriate anchorage area and establish its optimal capacity to ensure efficient and safe shelter operations during typhoons.
This study was initiated by the need to efficiently and safely manage typhoon shelters that are conventionally formed. Jinhae Bay, when used as a typhoon shelter, is not regulated. Therefore, there is no choice but to operate the bay using the experience of Masan VTS operators. The results of this study can provide appropriate anchorage capacity as an academically quantified technique and can support the decision-making of the VTS operator in terms of policy.
This study aimed to examine the anchorage area and estimate the optimal capacity for ships seeking shelter in typhoon shelters near Jinhae Bay, ensuring effective and safe operation. The status of Jinhae Bay typhoon shelters was analyzed and the shelter areas were geographically and logistically defined through surveys of VTS operators and ship operators. Design criteria were analyzed, and relevant regulations for typhoon events were considered to compute the suitable capacity for the identified areas. The nesting algorithm, which is commonly used in industrial sites for optimal arrangement and utilization of raw materials, was used to efficiently determine the anchorage capacity.
2. Literature Review
Typhoons can cause significant damage if proper measures are not taken [5,6,7]. Their impact varies based on geographical factors, leading to many recent studies that predict the probability of typhoon paths and speeds at each location to model the berthing capacity of ports [8,9,10].
One study was conducted on the critical wind speed for anchoring vessels seeking shelter in Jinhae Bay, a commonly used typhoon shelter in South Korea, by analyzing typhoons that hit the sea near Jinhae Bay [1]. The safety measures of Jinhae Bay typhoon shelter were evaluated through a survey of operators [2]. Despite this, there are limited studies on the establishment and operation of shelter zones and the calculation of shelter capacity.
Anchorage, a crucial component of ports, is typically established based on each country’s design criteria [11,12,13,14]. The capacity and suitability of anchorages have been extensively studied to accommodate as many ships as possible within a limited geographical area, considering factors such as traffic density and occupied area [15,16,17,18].
However, the nature of a typhoon shelter demands the use of all available sea areas in an emergency, leading to high marine traffic density. Therefore, the capacity of the typhoon shelter must be determined based on its meteorological conditions and geographical characteristics during a typhoon.
There are many studies related to anchorage capacity. One study proposed a river terminal system for bulk cargo operations where the anchorage area was modeled as a simple first-in–first-out queue with a fixed capacity independent of the size of the vessels [19]. A more general model for anchorage area capacity was also presented [15]. In this study, the capacity of an anchorage was defined as the maximum number of vessels that can be accommodated by the anchorage over a period of time. The study suggests that the factors affecting anchorage capacity are types of arriving vessels, average anchor time, and average berth size. A simulation-based model was developed to assess capacity and utilization of anchorages [16,20]. One study proposed two disk-packing algorithms for anchorage planning, namely MHDF and WALLPACK-MHDF, with which they achieved significant improvements over current practices. In terms of computational experiments, we compared our multi-objective strategy against these two algorithms [21]. A mathematical model was developed that simultaneously optimizes the navigation channel traffic and anchorage area utilization [22]. An optimization model was presented using a mixed integer linear program (MILP) to analyze the maximum theoretical reduction in congestion anchoring, depending on the flexibility of vessel arrival time changes [23].
Regarding typhoons, a hybrid algorithm integrating Genetic Algorithm (GA) with Receding Horizon Control (RHC) was introduced, which considers real-time typhoon data, marine environment data, including ocean currents and reefs, etc., as well as safety operation requirements for marine voyage to solve the path optimization problem for marine vessels under typhoon scenarios [24]. Some studies have analyzed the berthing capacity of Santa Yazhou fishing port using a typhoon prediction model [8].
The characteristic of this study in the literature review is to derive the number of ships that can be anchored in emergency situations such as typhoons. This is to focus on the maximum number of ships in consideration of safety in case of danger, rather than the process of anchoring. Additionally, to consider safety, the opinions of VTS operators and ship operators were reflected.
3. Analysis of the Current Situation of Anchorages in the Jinhae Bay
South Korea experiences an average of two to three typhoons annually due to its geographical location and the influence of westerly winds. Jinhae Bay serves as a primary typhoon shelter in the southeastern seas of South Korea [1]. In particular, the area saw an average of ten typhoons each year in 2019 and 2020, and 1679 ships sought shelter there during that period [2]. When a typhoon is expected to hit, there is a surge in ship traffic as they all converge on Jinhae Bay. The risk of marine accidents increases due to anchoring between shelter-seeking vessels and anchor dragging caused by strong winds. Calculating the optimal capacity, such as the maximum number of vessels that can be anchored, is crucial for efficient anchorage management during typhoons. This chapter analyzes the anchoring situation in Jinhae Bay as a basis for estimating the optimal capacity of the Jinhae Bay typhoon shelter.
3.1. General Information
3.1.1. Study Area and Geographic Location
Jinhae Bay is situated in the southeast region of South Korea and is surrounded by the mainland opposite the northwest coast of Geoje Island, the second-largest island in the country. The Jinhae route entrance is located in the northeast of the bay, while the entrance to Gadeoksudo can be found in the southeast, and the South Sea is accessible through the Gyeonnaeryang Strait in the southwest.
As depicted in Figure 1, the study area encompasses Jinhae Bay, Gohyeon Bay, and the surrounding waters near Yeondo Island, Jamdo Island, and Chorido Island, collectively known as Jinhae Bay.
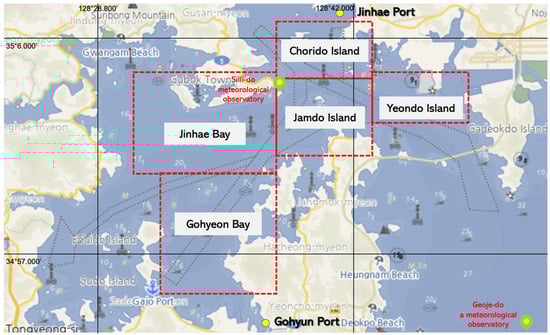
Figure 1.
Location of study area.
3.1.2. Designation of Anchorages
Jinhae Bay is a designated anchorage area according to the Masan Port Facility Management Rules and the Gyeongsangnam-do Port Facility Management Rules, which include Masan Port, Jinhae Port, and Goyeon Port. However, it does not include the commonly used typhoon avoidance routes, such as the Masan, Jinhae, Goheyon, Wonjeon, Anjeong, Jangjwa, and Naesan routes [25,26]. Ships often seek shelter in Jinhae Bay during typhoons, but their anchoring is not officially recognized. As a result, the anchorage capacity, such as the maximum number of vessels and anchorages, is not clear. This study aimed to determine the anchoring capacity in the water area surrounding the Jinhae Bay route, excluding the anchorages at Masan Port, Jinhae Port, and Goyeon Port.
3.1.3. Typhoons
South Korea is vulnerable to typhoons due to its geographical location and experiences the direct and indirect impact of typhoons every year. In 2019, 29 typhoons formed in the Northwest Pacific, with 6 of them impacting the Korean Peninsula. These typhoons, including Danas, Francisco, Krosa, Lingling, Tapah, and Mitag, occurred between July and October [27].
In 2020, 23 typhoons formed in the Northwest Pacific, and 4 of them impacted the Korean Peninsula, including Jangmi, Bobby, Mysak, and Highsun, which struck in August and September [28].
The maximum wind speeds of typhoons affecting the Korean Peninsula during 2019–2020 were recorded by the Geoje-do weather buoys and the Silli-do meteorological observatory. Table 1 summarizes the instantaneous maximum wind speeds. The Silli-do observatory recorded wind speeds exceeding 25 m/s for typhoons Tapah, Maisak, and Highsun, which posed a significant risk of anchor dragging and other marine accidents.

Table 1.
Instantaneous maximum wind speed for each typhoon according to the meteorological observatory [unit: m/s].
According to the International Association of Classification Societies (IACS), anchoring equipment must be designed to withstand a maximum wind speed of 25 m/s and a maximum current speed of 2.5 m/s in calm, sheltered sea areas. Any wind speeds or current speeds exceeding these limits may lead to anchor dragging [29].
3.1.4. Other Water Facilities
Numerous vessels, including tugboats and fishing boats, operate in the vicinity of Jinhae Bay at ports such as Busan New Port, Masan Port, Jinhae Port, Anjeong Port, Goyeon Port, and Tongyeong Port. These ports have several designated routes, including the Masan, Jinhae, Goheyon, Wonjeon, Anjeong, Jangjwa, and Naesan routes, as well as the Gadeoksudo and Busan Port Route 5 (New Port Route) [30].
Seasons of fishing are frequent along the Masan, Tongyeong, Jinhae, and Anjeong routes, as well as in the nearby seas surrounding Jinhae Bay. These areas have a large number of fishing gear installations, making navigation challenging and posing risks to safe sailing [31]. The study area around Jinhae Bay, including Chorido Island, Jamdo Island, Yeondo Island, and Gohyeon Bay, has several fishing grounds, such as fish farms and fixed shore nets, along its coastline. Fish farms are also present in these areas and are relevant to the Jinhae Bay typhoon shelter, the main focus of this study.
As previously mentioned, ships often anchor outside of the designated anchorage during typhoons, and in some cases, even on the sea routes, when the capacity has been exceeded. As a result, the waters surrounding Jinhae Bay have been found to be significantly different from those frequently used by ships. In Section 4, we will delve into the specifics of creating typhoon shelters and zones.
3.2. Analysis of the Risks of Typhoon Shelters
3.2.1. General Marine Accidents
Figure 2 displays the occurrence of marine accidents (collision, grounding, contact, sinking, and capsizing) in the sea surrounding Jinhae Bay over the past two years (2019–2020). The Korea Maritime Safety Tribunal reported 185 marine accidents in the Jinhae Bay region during the same period. Although the locations of the accidents were generally dispersed, a concentration of accidents was observed near the entrance to Jinhae Bay, in the vicinity of Chorido Island and Geoga Bridge [32].
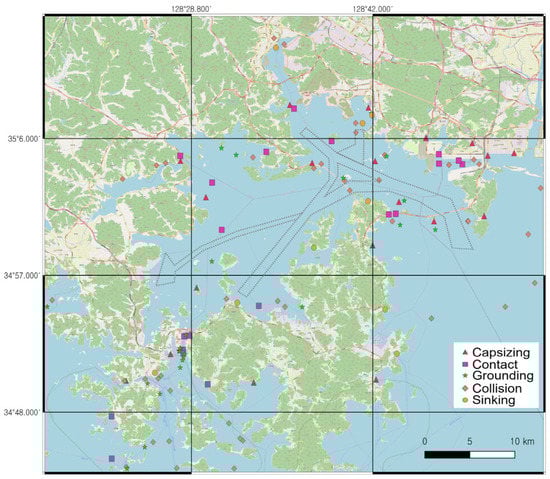
Figure 2.
Marine accidents related to traffic in target area (2019–2020).
3.2.2. Marine Accident Cases during Typhoons
The designated anchorage areas and the capacity for ships to anchor are not clearly defined, leading to potential hazards such as anchor dragging or collisions with anchored ships during adverse weather conditions.
Table 2 lists the marine accidents that occurred during typhoons.
Table 2.
Marine accidents during typhoons.
As Table 2 illustrates, the accidents that took place in the vicinity of Jinhae Bay during typhoons from 2019–2020 included ship-to-ship collisions as ships moved to anchor, anchor dragging of anchored ships that posed a collision threat with other anchored ships, and ships that ran aground while adrift due to anchor dragging. The number of ships seeking shelter in Jinhae Bay during typhoons has seen a sharp rise each year. However, the unclear distance between anchored ships and the extent and capacity of eligible anchorage areas demand further investigation.
3.3. Analysis of the Traffic of Shelter-Seeking Vessels
The last typhoon-seeking vessel’s arrival date was analyzed using Automatic Identification System (AIS) track information to evaluate the maritime traffic situation of ships seeking shelter at Jinhae Bay. The data are presented in Table 3. The AIS traffic information at the time of arrival of the final typhoon-seeking ship for each typhoon was analyzed. The analysis was based on 24 h track data, starting at 09:00 on the day of the typhoon’s impact and ending at 09:00 the following day.
Table 3.
Times of the last shelter-seeking vessels during each typhoon (2019~2020).
Analysis of AIS data from typhoons in 2019 and 2020 revealed that a total of 1728 ships sought shelter at Jinhae Bay. Typhoon Mitag saw the highest number of vessels seeking shelter (240). The findings are depicted in Figure 3, which shows the number of vessels that sought shelter during each typhoon.

Figure 3.
Number of vessels that took shelter during each typhoon.
The results of the analysis on the number of ships seeking shelter during typhoons in various sub-sea areas of Jinhae Bay from 2019 to 2020 showed that the majority of ships took shelter in the Jinhae Bay area (869 vessels), followed by the Gohyeon Bay area (410 vessels), Jamdo Island area (301 vessels), Chorido Island area (75 vessels), and Yeondo Island area (43 vessels). The predominant types of shelter-seeking vessels were cargo ships (658 vessels, 38.08%) and tankers (539 vessels, 31.19%), followed by fishing boats (200 vessels, 11.57%), towing vessels (137 vessels, 7.93%), and other vessels (98 vessels, 5.67%). The remaining shelter-seeking vessels were comprised of unidentified vessels (86 vessels, 4.98%), government ships (9 vessels, 0.52%), and one passenger ship (0.06%).
Based on the weight of the shelter-seeking vessels, the majority were between 3000 to 5000 tons (24.77%) and 1000 and 3000 tons (23.32%). Additionally, there were 299 vessels weighing less than 1000 tons (17.30%) and 288 vessels weighing 5000 to 7000 tons (16.67%). The vessels weighing 7000 to 10,000 tons (7.35%) and those weighing 10,000 tons or more (4.80%) accounted for a smaller portion of the shelter-seeking fleet, with 100 vessels of unknown weight (5.79%) also recorded. In conclusion, ships in the weight range of 1000 to 5000 tons were the most frequent shelter-seekers.
3.4. Anchor-Dragging Vessels during Typhoons
During typhoons, vessels seek shelter at Jinhae Bay, but strong winds often result in significant anchor dragging. Table 4, based on data from the Masan Port VTS, summarizes the anchor-dragging rates of vessels in Jinhae Bay that sought shelter during typhoons in 2020. In the case of Typhoon Maysak, nearly all of the vessels had dragging anchors, with a rate of 92.8%. The proportion of vessels with dragging anchors in Typhoon Haishen was also high, at 71%. The highest wind speeds measured at the Silli-do meteorological observatory in Jinhae Bay during these typhoons were 12.1 m/s for Jangmi, 14.0 m/s for Bavi, 35.4 m/s for Maysak, and 22.2 m/s for Haishen. These high wind speeds led to a high anchor dragging rate during Maysak and Haishen.
Table 4.
Ratio of vessels with dragging anchors to shelter-seeking vessels in 2020.
Table 5 summarizes the anchor-dragging ratios of ships by tonnage during typhoons that impacted the Korean Peninsula in 2020. The highest proportion was observed in ships weighing between 5000 and 7000 GT, with a ratio of 47.7%. The 7000 to 10,000 GT segment followed closely with a ratio of 41.7%, while ships weighing 10,000 GT or above had a ratio of 40%. In general, it was found that the anchor-dragging ratio increased as the size of the ship increased.
Table 5.
Ratio of vessels with dragging anchors to shelter-seeking vessels by tonnage in 2020 [unit: %].
The results of the survey indicate a high incidence of anchor-dragging incidents caused by typhoons in the vicinity of Jinhae Bay, which is traditionally considered a safe haven. While no major accidents have occurred, it is imperative to ensure proper maintenance of the Jinhae Bay typhoon shelter as the risk of marine accidents is significant.
4. Scope of Jinhae Bay Typhoon Shelter
The cumulative track map for ships that sought shelter in the Jinhae Bay area during Typhoon Mitag, which saw the highest number of shelter-seeking vessels, is shown in Figure 4. The map reveals that the Jinhae Bay area and the surrounding sea route are both used as typhoon shelters. However, the strong winds pose a risk of grounding and collision as the anchorage areas are not clearly defined and the capacity and average separation distance for each area are unknown. To ensure the safe use of the sea area as a shelter during emergencies, safety management procedures must be established.
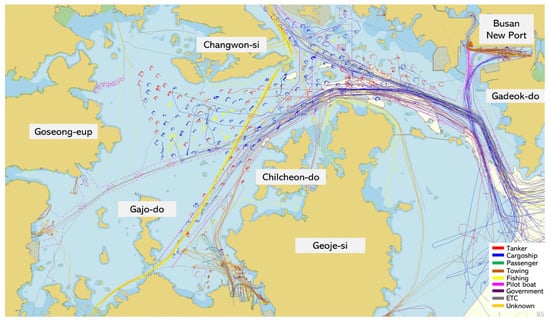
Figure 4.
Cumulative track map by ship type on 2 October 2019 (Mitag).
In this chapter, the anchorage capacity of the typhoon shelter near Jinhae Bay was determined using a survey of experts and users of the sea area, and the findings were applied to the area.
4.1. Analysis of Separation Distance of Shelter-Seeking Vessels
A survey was conducted among 14 VTS operators and 32 ship operators who had sought shelter in Jinhae Bay during a typhoon to determine the safe separation distance required between ships anchoring in the typhoon shelter.
The results, shown in Figure 5, display the average separation distance between vessels, the average separation distance between cargo ships, the average separation distance between cargo ships and tankers, and the average separation distance between tankers, based on the responses of the VTS operators and ship operators. The survey also included tugboats and barges, but only the results for cargo ships and dangerous cargo carriers are presented.
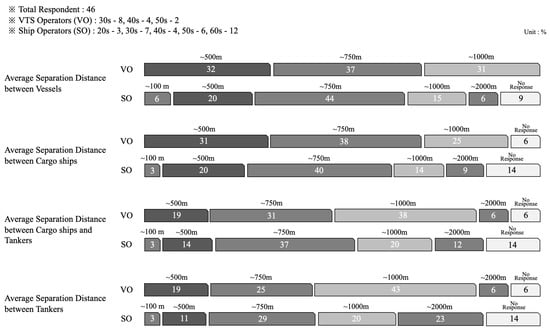
Figure 5.
Results of survey on average separation distance with VTS operators and ship operators.
The results showed that the largest average separation distance between vessels was in the range of 500 m to 750 m, and when dangerous cargo carriers were included, many respondents chose the 1000 m range as well.
4.2. Selecting Sea Areas Where Vessels Can Take Shelter
The appropriate areas for Jinhae Bay typhoon shelters were determined through a survey of ship operators who had utilized the VTS that manages the targeted sea area and shelter.
The results of the survey involved asking respondents to mark safe shelter sites on a map of Jinhae Bay and its surrounding waterways.
The locations identified as the safest shelters by VTS operators and ship operators were overlaid to create multiple layers.
According to the survey results of VTS operators and ship operators, the safest typhoon shelter conditions are characterized by: (1) protection from land and islands, which reduces the impact of external forces and clearly identifies the location of fishing grounds; (2) moderate water depth with a mud seabed and minimal interference from obstacles such as fishing grounds; and (3) the ability to maintain a safe distance from surrounding hazardous areas, such as islands and land.
Figure 6 presents the areas around Jinhae Bay where ships can anchor based on environmental factors, barriers, and fishing grounds, as well as the opinions of VTS operators and ship operators.

Figure 6.
Sea areas near Jinhae Bay where anchoring is possible.
4.3. Analysis of Design Criteria Related to Anchorage Capacity
This study aimed to explore the anchoring design criteria for typhoon avoidance in the limited typhoon shelter area near Jinhae Bay, where a large number of ships gather in close proximity. The regulations for anchoring design were analyzed to determine the minimum anchorage area required for a single ship to safely avoid typhoons. In addition to the standard wind speed criteria, specific design requirements were established to account for the possibility of high wind speeds.
4.3.1. South Korean Harbor and Fishery Design Criteria
The Harbor and Fishery Design Criteria in South Korea specify the criteria for choosing an anchorage, which include a calm and ample water surface, favorable seabed conditions for anchoring, well-maintained buoys, and favorable weather conditions. Table 6 [11] provides the anchorage size for each ship based on anchoring method and seabed condition. However, it should be noted that these anchorage sizes are based on the assumption of offshore standby or unloading and do not include specific guidelines for emergency situations such as typhoon avoidance.
Table 6.
Anchorage sizes in South Korea’s Harbor and Fishery Design Criteria.
4.3.2. PIANC Design Criteria
The PIANC (The World Association for Waterborne Transport Infrastructure) provides recommendations for the design of navigation channels to ensure safe and efficient passage of vessels in and out of ports and harbors. Equation (1) represents the minimum anchorage radius for the weather and seabed conditions recommended by the PIANC Harbor Approach Channels Design Guidelines, revised in 2014 [12].
Here, Ra is the anchorage radius, LOA is the overall length of the ship, h is the anchorage depth, and the constant term 30 represents an additional 30 m radius defining a margin of water area for anchor dragging.
The PIANC Harbor Approach Channels Design Guidelines provide Spanish design examples. The Spanish design criteria present the anchoring area for a ship according to the anchoring method and environmental conditions. Equation (2) represents the anchorage area by Spanish design, and Figure 7 show the criteria for calculating the anchoring area for a single anchor, which needs the largest anchoring area [14].
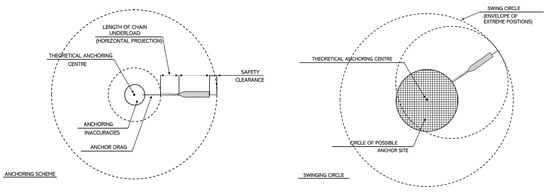
Figure 7.
Criteria for calculating the anchorage radius on the Spanish port design criteria.
Here, (Anchoring inaccuracies): Error caused by position and time measuring method, etc., for which 25–50% of the ship length is applied.
(Anchoring drag): This is a margin radius for preliminary notification during anchor dragging, and Table 7 is applied according to the seabed condition and wind speed.
Table 7.
Anchoring drag values according to wind speed among Spain’s port design criteria.
- ○
- (Chain length): This can be calculated as a function of the water depth, the height of the ship, and the weight of the chain. However, 7 to 9 shackles for evaluating the risk of anchor dragging were applied in this study.
- ○
- (Ship length): The overall length of the ship is applied.
- ○
- (Safety clearance): The larger value between 10% of the ship length and 20 m is applied as a margin radius for accident prevention.
4.3.3. Japanese Design Criteria
The Japan Coast Guard took preventive measures against anchor dragging accidents in response to the Kansai International Airport connection bridge collision in 2019. An expert review meeting was held to discuss ways to avoid such accidents in the future. To this end, the length of chain extension was adjusted based on weather conditions, as outlined in Table 8. The anchoring radius for each ship can be calculated by summing the length of the ship with the amount of chain extension, as indicated in the table [33].
Table 8.
Anchorage radius for each ship in Japan’s anchor dragging prevention measures.
5. Calculation of Optimal Capacity through Nesting Algorithm
5.1. Overview of Nesting Algorithm
The nesting algorithm is a method used to arrange shapes in a way that minimizes wasted space or material [34]. The algorithm is commonly used in a variety of industries, such as shipbuilding, vehicle and machine part manufacturing, and clothing and shoe production, among others. The goal of the algorithm is to find the optimal layout of shapes to minimize waste. In this study, the nesting algorithm was used to determine the optimal arrangement of typhoon shelters. Building on earlier work, Yamauchi and Tezuka combined the nesting algorithm with a genetic algorithm to find the optimal arrangement of shapes [35]. Fujita et al. introduced the concept of Schemata to evaluate the superiority of the genetic algorithm [36]. Han and Na further optimized material loss by introducing a method for efficiently arranging complex two-dimensional patterns [37]. Fang et al. proposed a nesting algorithm combined with reinforcement learning [38]. Struckmeier and Leon applied nesting to sheet metal industry dealing with constraints of flatbed laser-cutting machines [39].
The No-Fit-Polygon (NFP) method is a technique for expressing shapes that involves combining all the positions where two shapes can be positioned in close proximity without overlapping [40]. The NFP method can be used to determine if shapes overlap and to calculate the direction and magnitude of displacement required to resolve overlaps (Ryu & Kim, 2004). Another technique for expressing shapes is pixel representation, which involves dividing shape outlines into grids and classifying each grid as either belonging to the interior or boundary of the shape or not belonging to the shape [41]. Falkenauer proposed a solution to the nesting problem using a genetic algorithm [42]. The cost function used by Falkenauer [42] is as follows:
Maximize
where N is the number of bins used, is the sum of the sizes of objects in bin i, C is the bin capacity, and k is a constant, k > 1. In this study, we used the Falkenauer [42] algorithm.
5.2. Applying the Algorithm
The capacity of vessels that could seek shelter in a single area was determined by the permissible tonnage difference and was evaluated based on the opinions of Masan Port VTS operators and ship operators. The number of vessels that can find shelter was calculated using a nesting program, which is an optimization technique for industrial raw material placement and cutting. The program was based on the genetic algorithm and the No-Fit-Polygon (NFP) theory. The calculation process is illustrated in Figure 8.

Figure 8.
Calculation process for identifying the maximum tonnage that can take refuge.
The anchorage radii for each ship are presented in Table 9 in descending order of ship size. The ships were categorized into six groups based on their typhoon avoidance performance during typhoons over the past two years. The average length of each group was calculated, and this information was used to determine the anchorage area required for each ship tonnage class. The sizes of the 93 unknown ships were randomly selected to be between 1000 and 3000 tons, which is the widest range of sizes for typhoon-seeking ships. The criteria for determining the necessary anchorage area for each ship were based on the Japanese regulations for stormy weather conditions, which are similar to those in South Korea. Graphic work was carried out on the anchorage area for each ship size and the overall anchorage area to use the nesting program that supports CAD work files.
Table 9.
Data preprocessing items for identifying the maximum tonnage that can take refuge.
The optimization process was carried out by utilizing nesting software that combines No Fit Polygon and a genetic algorithm to restrict the maximum ship size for shelter. The results of the optimization were then compared. Figure 9 shows the change in total capacity as the maximum ship size for shelter varies. The study found a total capacity of 163 vessels when the maximum ship size was restricted to 7000 tons. This number is comparable to the number of shelter-seeking vessels recorded during the 2020 Mysak typhoon, which had the highest incidence of anchor dragging, with a total of 168 vessels.

Figure 9.
Total capacity according to maximum tonnage difference.
5.3. Result of Deriving the Optimum Capacity
To estimate and compare the optimal capacity within the typhoon avoidance area, typhoon avoidance records and anchoring area guidelines for each ship size from the previous two years were used. The optimal capacity was calculated using nesting software, and the typhoon avoidance ratios for each ship size, as presented in Table 9, were used as input values. This study only considered stormy weather conditions and three criteria based on wind strength under good seabed conditions, which are included in Japanese port design requirements to prevent anchor dragging. It was concluded that ships of 10,000 tons or more could only anchor in the area near Yeondo Island.
5.3.1. Japanese Criteria
Table 10 and Figure 10 present the anchoring radius calculation (L + 4D + 145) during stormy weather conditions, a measure used to prevent anchor dragging in Japan. The results indicate a total capacity of 209 vessels, slightly higher than the average number of vessels that sought shelter (173 vessels) during the past 2 years during 10 typhoons.
Table 10.
Number of vessels that can be deployed based on the criterion of Japan Coast Guard (L + 4D + 145 m).

Figure 10.
Deployment of vessels based on the criterion of Japan Coast Guard (L + 4D + 145 m).
5.3.2. Spanish Criteria
Table 11 and Figure 11 present the results of computing the optimal capacity based on three levels of wind speed under favorable seabed conditions using the Spanish port design criteria for anchoring drag value by wind speed. The results show that the optimal capacity varied depending on the wind speed. The comparison between the optimal capacity and the actual number of shelter-seeking vessels in Jinhae Bay over the past two years showed a significant difference, with the maximum being 240 and the minimum being 72. However, no sea area was suitable for anchoring large ships of 10,000 tons or more during mid-level typhoons with wind speeds of 20 m/s or higher.
Table 11.
Number of vessels that can be deployed according to Spanish criteria.
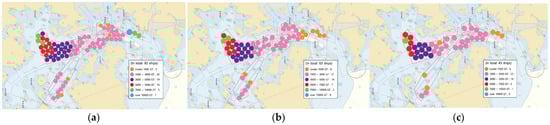
Figure 11.
Deployment of vessels based on Spanish criteria. (a) Weak typhoon, 0.5 L + 60 + 9 × 27.5 + L + 20, (b) moderate typhoon, 0.5 L + 120 + 9 × 27.5 + L + 20, (c) strong typhoon, 0.5 L + 180 + 9 × 27.5 + L + 20.
6. Discussion
Table 12 compares the number of vessels that sought shelter at Jinhae Bay during the past two years with the maximum capacity for accommodating vessels based on each respective criteria. The results show that when the Spanish criteria were applied, the maximum capacity for accommodating vessels was exceeded in all typhoons except Krosa. During Typhoon Maysak, nearly 3.7 times more vessels sought shelter than what was defined by the Spanish criteria. On the other hand, based on the Japanese criteria, Typhoon Mitag had 1.14 times more vessels seeking shelter than the maximum capacity, while the other typhoons had fewer vessels than the maximum capacity. Despite this, in 6 out of 10 typhoons, more than 80% of the maximum capacity was utilized, and in 3 of those typhoons, more than 90% of the capacity was utilized. This suggests that Jinhae Bay is now accommodating typhoon shelter seekers to near its maximum capacity.
Table 12.
Comparison of the number of vessels that took shelter and the maximum capacity for accommodating vessels over the last two years.
It was noted that there was a difference between the Japanese and Spanish port design criteria. When the two-year average was analyzed, 172.8 ships used Jinhae Bay to avoid typhoons. Japanese criteria was 82.6%, and Spanish criteria was 210.73%. When compared to the actual number of vessels that sought shelter, the Japanese criteria were deemed to be more realistic, likely due to Japan’s proximity and similar climatic conditions. Therefore, when determining the maximum capacity for accommodating vessels at anchorages, it would be reasonable to use Japanese criteria for calculation.
7. Conclusions
The study aimed to determine the optimal capacity for vessels seeking shelter during typhoons in the sea area surrounding Jinhae Bay. It was found that several areas, including Jinhae Bay, Gohyeon Bay, and the Masan, Jinhae, Goheyon, safe, and Jangjwa routes, could serve as typhoon shelters. A survey was conducted with experienced VTS operators and operators to identify the best typhoon avoidance areas. The results showed that the Japanese and Spanish design criteria for anchoring in strong winds were useful in computing the optimal capacity of typhoon shelters. However, the shapes of the typhoon avoidance areas were uneven, which could result in wasted space. To optimize the arrangement of shelters, the study calculated the number of vessels that can take refuge using a nesting algorithm based on the genetic algorithm and the No Fit Polygon theory.
The total number of vessels that can take refuge was found to be 209 using the calculation method based on Japan’s anchorage design criteria for stormy weather. This is slightly higher than the average number of vessels (173) that sought shelter during typhoons over the past two years. On the other hand, the total number of vessels that can find shelter in Spain was estimated to be between 45 and 82, according to the calculation method based on the typhoon class design criteria. This was found to be significantly lower than the average number of vessels (over ten typhoons) that sought shelter in the past two years. The calculated separation distance between ships based on Japan’s anchorage design criteria for stormy weather was close to the average separation distance, according to a survey of VTS operators and ship operators. Given South Korea’s proximity to Japan, it is believed that the Jinhae Bay typhoon shelter can be effectively managed by arranging shelter-seeking vessels based on the first calculation method.
This study is significant in that it quantitatively analyzed typhoon shelters customarily formed in Jinhae Bay. In particular, the use of the nesting algorithm for anchorage capacity has an academic contribution. Additionally, from the VTS operator’s point of view, there is a contribution to supporting quantitative methodology-based rather than experience-based decision-making.
To improve the practical usefulness of this study’s findings, further research is needed in the future. Firstly, the proposed arrangement plan for typhoon shelters in the Jinhae Bay area must be evaluated from different angles. Although this study used the nesting algorithm to arrange the shelters, further exploration and comparison of other algorithms are necessary to determine the most optimal plan. Secondly, the validity of the results should be confirmed through simulation and practical implementation. This can be done by conducting ship steering simulations based on the findings of this study and comparing the results with those obtained from other algorithms. Thirdly, a validation process involving VTS operators and more years of investigation related to typhoon are necessary to ensure the practical applicability of the arrangement plan. Additionally, since the purpose of this study was to find the capacity to operate typhoon shelter, the time interval for vessels to approach the anchorage was not considered. Therefore, future studies should consider time complexity.
Author Contributions
S.P.: Conceptualization, methodology, writing—original draft, writing—review and editing. W.K.: Data curation, methodology, writing—review and editing, visualization. Y.-S.P.: Supervision, writing—review, validation. D.K.: Project administration, software, resources, visualization. All authors have read and agreed to the published version of the manuscript.
Funding
This research was a part of the project titled ‘Development of cloud-based next-generation VTS Integration platform(20210591)’, funded by the Republic of Korea Coast Guard.
Institutional Review Board Statement
Not applicable.
Informed Consent Statement
Not applicable.
Data Availability Statement
Not applicable.
Conflicts of Interest
The authors declare no conflict of interest. The funders had no role in the design of the study; in the collection, analysis, or interpretation of data; in the writing of the manuscript; or in the decision to publish the results.
References
- Kang, B.S.; Jung, C.H.; Park, Y.S.; Kong, G.Y. Minimum Wind Speed of Dragging Anchor for Ships in Jinhae Bay Typhoon Refuge. J. Korean Soc. Mar. Environ. Saf. 2021, 27, 474–482. [Google Scholar] [CrossRef]
- Kim, N.E.; Lee, M.K.; Camliyurt, G.; Park, D.H.; Kim, D.W.; Park, Y.S. A Study on the Safety Measures for Typhoon Shelter in Jinhae Bay Based on AHP Assessment. J. Korean Soc. Mar. Environ. Saf. 2022, 28, 507–514. [Google Scholar] [CrossRef]
- Masan Vessel Traffic Service. Analysis of the Emergency Control Operation in Response to Typhoons; Masan Vessel Traffic Service: Masan, Republic of Korea, 2020; pp. 3–24. [Google Scholar]
- Park, M.J.; Ji, S.H.; Kim, U.H. VTS measures to reduce typhoon evacuation and accidents in Jinhae Bay. In Proceedings of the Korean Institute of Navigation and Port Research Conference, Gyeongju, Republic of Korea, 20 June 2012; pp. 591–593. [Google Scholar]
- Shih, R.; Ravina, D. Ocho Balay: Design of a Permanent Typhoon Shelter for the Rural Areas in the Philippines. Int. J. Eng. Inf. Sci. 2020, 15, 221–232. [Google Scholar] [CrossRef]
- Chang, C.-H.; Shih, H.-J.; Chen, W.-B.; Su, W.-R.; Lin, L.-Y.; Yu, Y.-C.; Jang, J.-H. Hazard Assessment of Typhoon-Driven Storm Waves in the Nearshore Waters of Taiwan. Water 2018, 10, 926. [Google Scholar] [CrossRef]
- Zhao, X.; Du, P.; Chen, J.; Yu, D.; Xu, W.; Lou, S.; Yuan, H.; Peng, K.I. A Typhoon Shelter Selection and Evacuee Allocation Model: A Case Study of Macao (SAR), China. Sustainability 2020, 12, 3308. [Google Scholar] [CrossRef]
- Ge, H.; Wang, Z.; Liang, B.; Zhang, Z.; Yan, Z.; Li, Z. A Systematic Study on Berthing Capacity Assessment of Sanya Yazhou Fishing Port by Typhoon Prediction Model. J. Mar. Sci. Eng. 2021, 9, 1380. [Google Scholar] [CrossRef]
- Kong, C.; Lu, Y.; Han, T. Assessment of typhoon prevention level at fishing port. In IOP Conference Series: Earth and Environmental Science; IOP Publishing: Bristol, UK, 2021. [Google Scholar]
- Sun, Z.; Wang, C.; Zhong, S.; Ji, H. Numerical simulation of storm surge coupled with wave in zhoushan fishing port. Mar. Sci. Bull. 2019, 38, 150–158. [Google Scholar]
- Ministry of Oceans and Fisheries. Port and Fishing Port Design Standards and Commentary; Ministry of Oceans and Fisheries: Sejong, Republic of Korea, 2017; Chapter 4.2; pp. 12–14. [Google Scholar]
- Maritime Navigation Commission of the World Association for Water-Borne Transport Infrastructure (PIANC MARCOM). Harbour Approach Channels Design Guidelines; PIANC MARCOM: Bruxelles, Belgium, 2014. [Google Scholar]
- Park, J.M. Study on the Design Criteria of Anchorage Volume Considering the Safety in a Anchoring Ship; Department of Navigation System Engineering Graduate School of Korea Maritime and Ocean University: Busan, Republic of Korea, 2016; pp. 13–24. [Google Scholar]
- del Estado, P. Recommendations for the Design of the Maritime Configuration of Ports, Approach Channels and Harbour Basins; ROM 3.1-99; V.A Impresores: Tres Cantos, Spain, 2017. [Google Scholar]
- Fan, H.S.L.; Cao, J.M. Sea Space Capacity and Operation Strategy Analysis System. Transp. Plan. Technol. 2007, 24, 49–63. [Google Scholar] [CrossRef]
- Huang, S.Y.; Hsu, W.J.; He, Y.; Song, T.; Charles, D.S.; Rong, Y.; Chuanyu, C.; Stuti, N. Anchorage Capacity analysis using simulation. In Proceedings of the International Conference on Harbor, Maritime & Multimodel Logistics Modeling and Simulation, Puerto de la Cruz, Spain, 23–25 September 2009; pp. 1–6. [Google Scholar]
- Kwon, S.C.; Yu, Y.U.; Park, J.M.; Lee, Y.S. A Basic Study on the Demand Analysis of Waiting Anchorage using Anchorage Capacity Index. J. Korean Soc. Mar. Environ. Saf. 2019, 25, 519–526. [Google Scholar] [CrossRef]
- Park, J.M.; Yun, G.H.; Kang, M.K.; Lee, Y.S. Improvement Plan for Ulsan Anchorage Based on Adequacy Evaluation Criteria. J. Korean Soc. Mar. Environ. Saf. 2021, 27, 247–255. [Google Scholar] [CrossRef]
- Lll Bugaric, U.; Petrovic, D. Increasing the capacity of terminal for bulk cargo unloading. Simul. Model. Pract. Theory 2007, 15, 1366–1381. [Google Scholar] [CrossRef]
- Huang, S.Y.; Hsu, W.J.; He, Y. Assessing capacity and improving utilization of anchorages. Transp. Res. Part E 2011, 47, 216–227. [Google Scholar] [CrossRef]
- Oz, D.; Akaskalli, V.; Alkaya, A.F.; Aydogdu, V. An anchorage planning strategy with safety and utilization considerations. Comput. Oper. Res. 2015, 62, 12–22. [Google Scholar] [CrossRef]
- Jia, S.; Li, C.-L.; Xu, Z. Managing Navigation Channel Traffic and Anchorage Area Utilization of a Container Port. Transp. Sci. 2019, 53, 728–745. [Google Scholar] [CrossRef]
- Jime, P.; Gómez-Fuster, J.M.; Pavón-Mariño, P. HADES: A Multi-Agent Platform to Reduce Congestion Anchoring Based on Temporal Coordination of Vessel Arrivals—Application to the Multi-Client Liquid Bulk Terminal in the Port of Cartagena (Spain). Appl. Sci. 2021, 11, 3109. [Google Scholar]
- Xu, L.; Hu, X. A Study on Marine Vessels’ Path Optimization under Typhoon Scenarios. J. Risk Anal. Crisis Response 2017, 7, 72–81. [Google Scholar] [CrossRef]
- Masan Regional Office of Oceans and Fisheries. Masan Port Facility Operation Rules; Masan Regional Office of Oceans and Fisheries: Masan, Republic of Korea, 2021; Attached Table, p. 1. [Google Scholar]
- Gyeongsangnam-do Port Facility Operation Rules; Gyeongsangnam-do Port: Gyeongnam, Republic of Korea, 2018; pp. 12–14.
- Korea Meteorological Administration. Typhoon Impact Analysis Report on the Korean Peninsula; Korea Meteorological Administration: Seoul, Republic of Korea, 2019; pp. 3–8. [Google Scholar]
- Korea Meteorological Administration. Typhoon Impact Analysis Report on the Korean Peninsula; Korea Meteorological Administration: Seoul, Republic of Korea, 2020; pp. 3–9. [Google Scholar]
- IACS. Classification Technical Rules—Anchoring Equipment; A1.1.4; International Association of Classification Societies: Hamburg, Germany, 2017. [Google Scholar]
- Masan Regional Office of Oceans and Fisheries. Rules for Safety of Navigation in Waters near Jinhae Bay and Geoje, Attached Table; Masan Regional Office of Oceans and Fisheries: Masan, Republic of Korea, 2022; pp. 1–5. [Google Scholar]
- Ministry of Oceans and Fisheries. Report on Maritime Traffic Observation Survey of Unmanned Ship Regulation in Free Zone Demonstration Area in Gyeongsangnam-do; Ministry of Oceans and Fisheries: Sejong, Republic of Korea, 2020; Chapter 3; pp. 22–32. [Google Scholar]
- KMST (Korean Maritime Safety Tribunal). 2021 Annual Report of Marine Accident Statistics. Available online: https://www.kmst.go.kr/ (accessed on 1 February 2023).
- Japan Coast Guard. Experts Investigative Committee on Prevention of Recurrence of Accidents Caused by Dragging Anchors in Stormy Weather; Japan Coast Guard: Tokyo, Japan, 2019. [Google Scholar]
- Sheen, D. Nesting Expert System using Heuristic Search. J. Ocean. Eng. Technol. 2012, 26, 8–14. [Google Scholar] [CrossRef]
- Yamauchi, S.; Tezuka, K. Automatic Nesting System by Use of Genetic Algorithm. J. Soc. Nav. Archit. Jpn. 1995, 178, 707–712. [Google Scholar] [CrossRef]
- Fujita, K.; Akagi, S.; Hirokawa, N. Hybrid Approach for Optimal Nesting using a Genetic Algorithm and a Local Minimization Algorithm, ASME. Adv. Des. Autom. 1993, 65, 477–484. [Google Scholar]
- Han, G.C.; Na, S.J. Nesting Algorithm for Optimal Layout of Cutting parts in Laser Cutting Process. J. Korean Weld. Soc. 1994, 12, 11–19. [Google Scholar]
- Fang, J.; Rad, Y.; Zhao, X.; Du, B. A Hybrid Reinforcement learning algorithm for 2D irregular packing problem. Mathematics 2023, 11, 327. [Google Scholar] [CrossRef]
- Struckmeier, F.; Leoa, F.P. Nesting in the sheet metal industry: Dealing with constraints of flatbed laser-cutting machines. Procedia Manuf. 2019, 29, 575–582. [Google Scholar] [CrossRef]
- Burke, E.K.; Hellier, R.S.R.; Kendall, G.; Whitwell, G. Complete and Robust No-Fit Polygon Generation for the Irregular Stock Cutting Problem. Eur. J. Oper. Res. 2007, 179, 27–49. [Google Scholar] [CrossRef]
- Oliveira, J.F.; Ferreira, J.S. Algorithms for Nesting Problems, Applied Simulated Annealing. In Lecture Notes in Economics and Mathematical Systems; Vidal, R.V.V., Ed.; Springer: Berlin, Germany, 1993; Volume 396, pp. 255–274. [Google Scholar]
- Falkenauer, E. Genetic Algorithms and Grouping Problems; John Wiley and Sons: Hoboken, NJ, USA, 1998. [Google Scholar]
Disclaimer/Publisher’s Note: The statements, opinions and data contained in all publications are solely those of the individual author(s) and contributor(s) and not of MDPI and/or the editor(s). MDPI and/or the editor(s) disclaim responsibility for any injury to people or property resulting from any ideas, methods, instructions or products referred to in the content. |
© 2023 by the authors. Licensee MDPI, Basel, Switzerland. This article is an open access article distributed under the terms and conditions of the Creative Commons Attribution (CC BY) license (https://creativecommons.org/licenses/by/4.0/).