Article

Modification of a Constitutive Model for Gassy Clay

1
MOE Key Laboratory of Marine Environment and Ecology, Ocean University of China, Qingdao 266100, China
2
Laboratory for Marine Geology, Qingdao National Laboratory for Marine Science and Technology, Qingdao 266061, China
*
Author to whom correspondence should be addressed.
J. Mar. Sci. Eng. 2023, 11(5), 1013; https://doi.org/10.3390/jmse11051013
Submission received: 24 March 2023 / Revised: 27 April 2023 / Accepted: 2 May 2023 / Published: 10 May 2023
(This article belongs to the Section Ocean Engineering)

Abstract

:
Gassy clays containing large, discrete gas bubbles are widely spread in deposits in shallow waters. The existence of gas bubbles may impair the original soil structure, resulting in the instability of offshore foundations and the occurrence of submarine landslides. Although gassy clay was found to exhibit different undrained shear behaviors with variations of the initial pore water pressures and initial gas volume fractions, more experimental studies and theoretical interpretations of the relationship between the effective confining pressure and undrained responses are required. A series of undrained triaxial compression tests is conducted to compare the responses of reconstituted gassy and saturated specimens at an effective confining pressure of 200, 400, or 600 kPa. An existing elastoplastic constitutive model based on the critical state is improved by updating its stress-dilatancy function and yield surface. The dilatancy equation proposed has the potential to quantify the effect of gas bubbles on the dilatancy of the soil matrix. The yield surfaces are reproduced reasonably well by optimizing the expressions of shape parameters under a variety of effective confining pressures. The model developed can describe the stress-dilatancy and stress-strain responses of both the gassy and saturated specimens.

1. Introduction

The gas bubbles spread in soil may originate from biogenic or thermogenic processes and volcanic eruptions [1,2], which are usually composed of methane, carbon dioxide, hydrogen sulfide, and nitrogen [3,4]. Usually, dissolved gases have little effect on the mechanical behavior of soil unless the ambient pressure is reduced or the temperature is remarkably increased [2]. However, the presence of undissolved gas bubbles may change the shear strength, stiffness, and compressibility of soil [5,6], potentially resulting in submarine landslides and failures of offshore foundations [7,8,9]. The typical diameter of gas bubbles in clay is usually several orders larger than the average grain diameter, forming gassy soil where the discrete gas bubble is surrounded by the so-called “soil matrix”, composed of soil grains and porous water [10,11,12]. The pore space of gassy clay is occupied by water and gas bubbles, and the void ratio of the soil matrix, ew, is used to represent the volume of pore water in the soil matrix [13]. The water saturation Sr is thus defined as
Sr = ew/e
where e is the void ratio of the soil. The volume fraction of gas bubbles, A, is introduced to quantify their relative volume in soil:
A = e ( 1 S r ) ( 1 + e )
During shearing under undrained conditions, the volume fraction A is varied since e is not a constant value due to the expansion or compression of gas bubbles. As the water saturations of gassy clays are usually larger than 90%, Sills et al. [14] and Puzain et al. [15] suggested that the principle of effective stress remains valid.
It was found in the previous undrained triaxial tests that the existence of gas bubbles may enhance or impair the soil’s strength, depending on the initial pore water pressure uw0 and initial gas volume fraction A0 [13,16]. For example, Pietruszczak and Pande [17] and Grozic et al. [18] proposed that the compressibility of gas-liquid mixtures increased due to the gas bubble; consequently, the excess pore water pressure was suppressed and the undrained shear strength was enhanced. Sultan and Garziglia [19] suggested that the damaging effect was caused by the expansion and exsolution of gas bubbles and could be quantified by a parameter related to A0. A limited number of constitutive models have been developed to predict the behavior of gassy clays. The enhancing and damaging effects were captured simultaneously in a thermodynamic model by Yang and Bai [20] and a traditional elastoplastic model developed by Hong et al. [21]. Compared with other models, the model by Hong et al. [21] accounted for the coupling influences of uw0 and A0 on the stress-dilatancy relation and yield surface of gassy clay. Moreover, the model parameters could be calibrated more easily. However, the model by Hong et al. [21] was based on the undrained triaxial tests with an effective confining pressure pc′ of 200 kPa only. It is not clear if the model can reasonably describe gassy clay under high pc′.
The aim of this paper is to develop a constitutive model of gassy clay that can simultaneously capture the impairment and enhancement of undrained strength caused by the existence of gas bubbles, especially in terms of a wide range of pc′. A series of undrained triaxial compression tests of gassy kaolin are conducted, with A0 no larger than 6% and pc′ up to 600 kPa. The expressions of the dilatancy and yield surface in [21] are modified to improve the predictions of undrained shear responses under high effective confining pressures. The reliability of the model developed is verified against the triaxial tests conducted here and the ones reported publicly. It is found that the model developed can capture the stress-dilatancy relations and effective stress paths of gassy clay more accurately under high effective confining pressures. The flowchart of this study is shown in Figure 1.

2. Testing Procedures

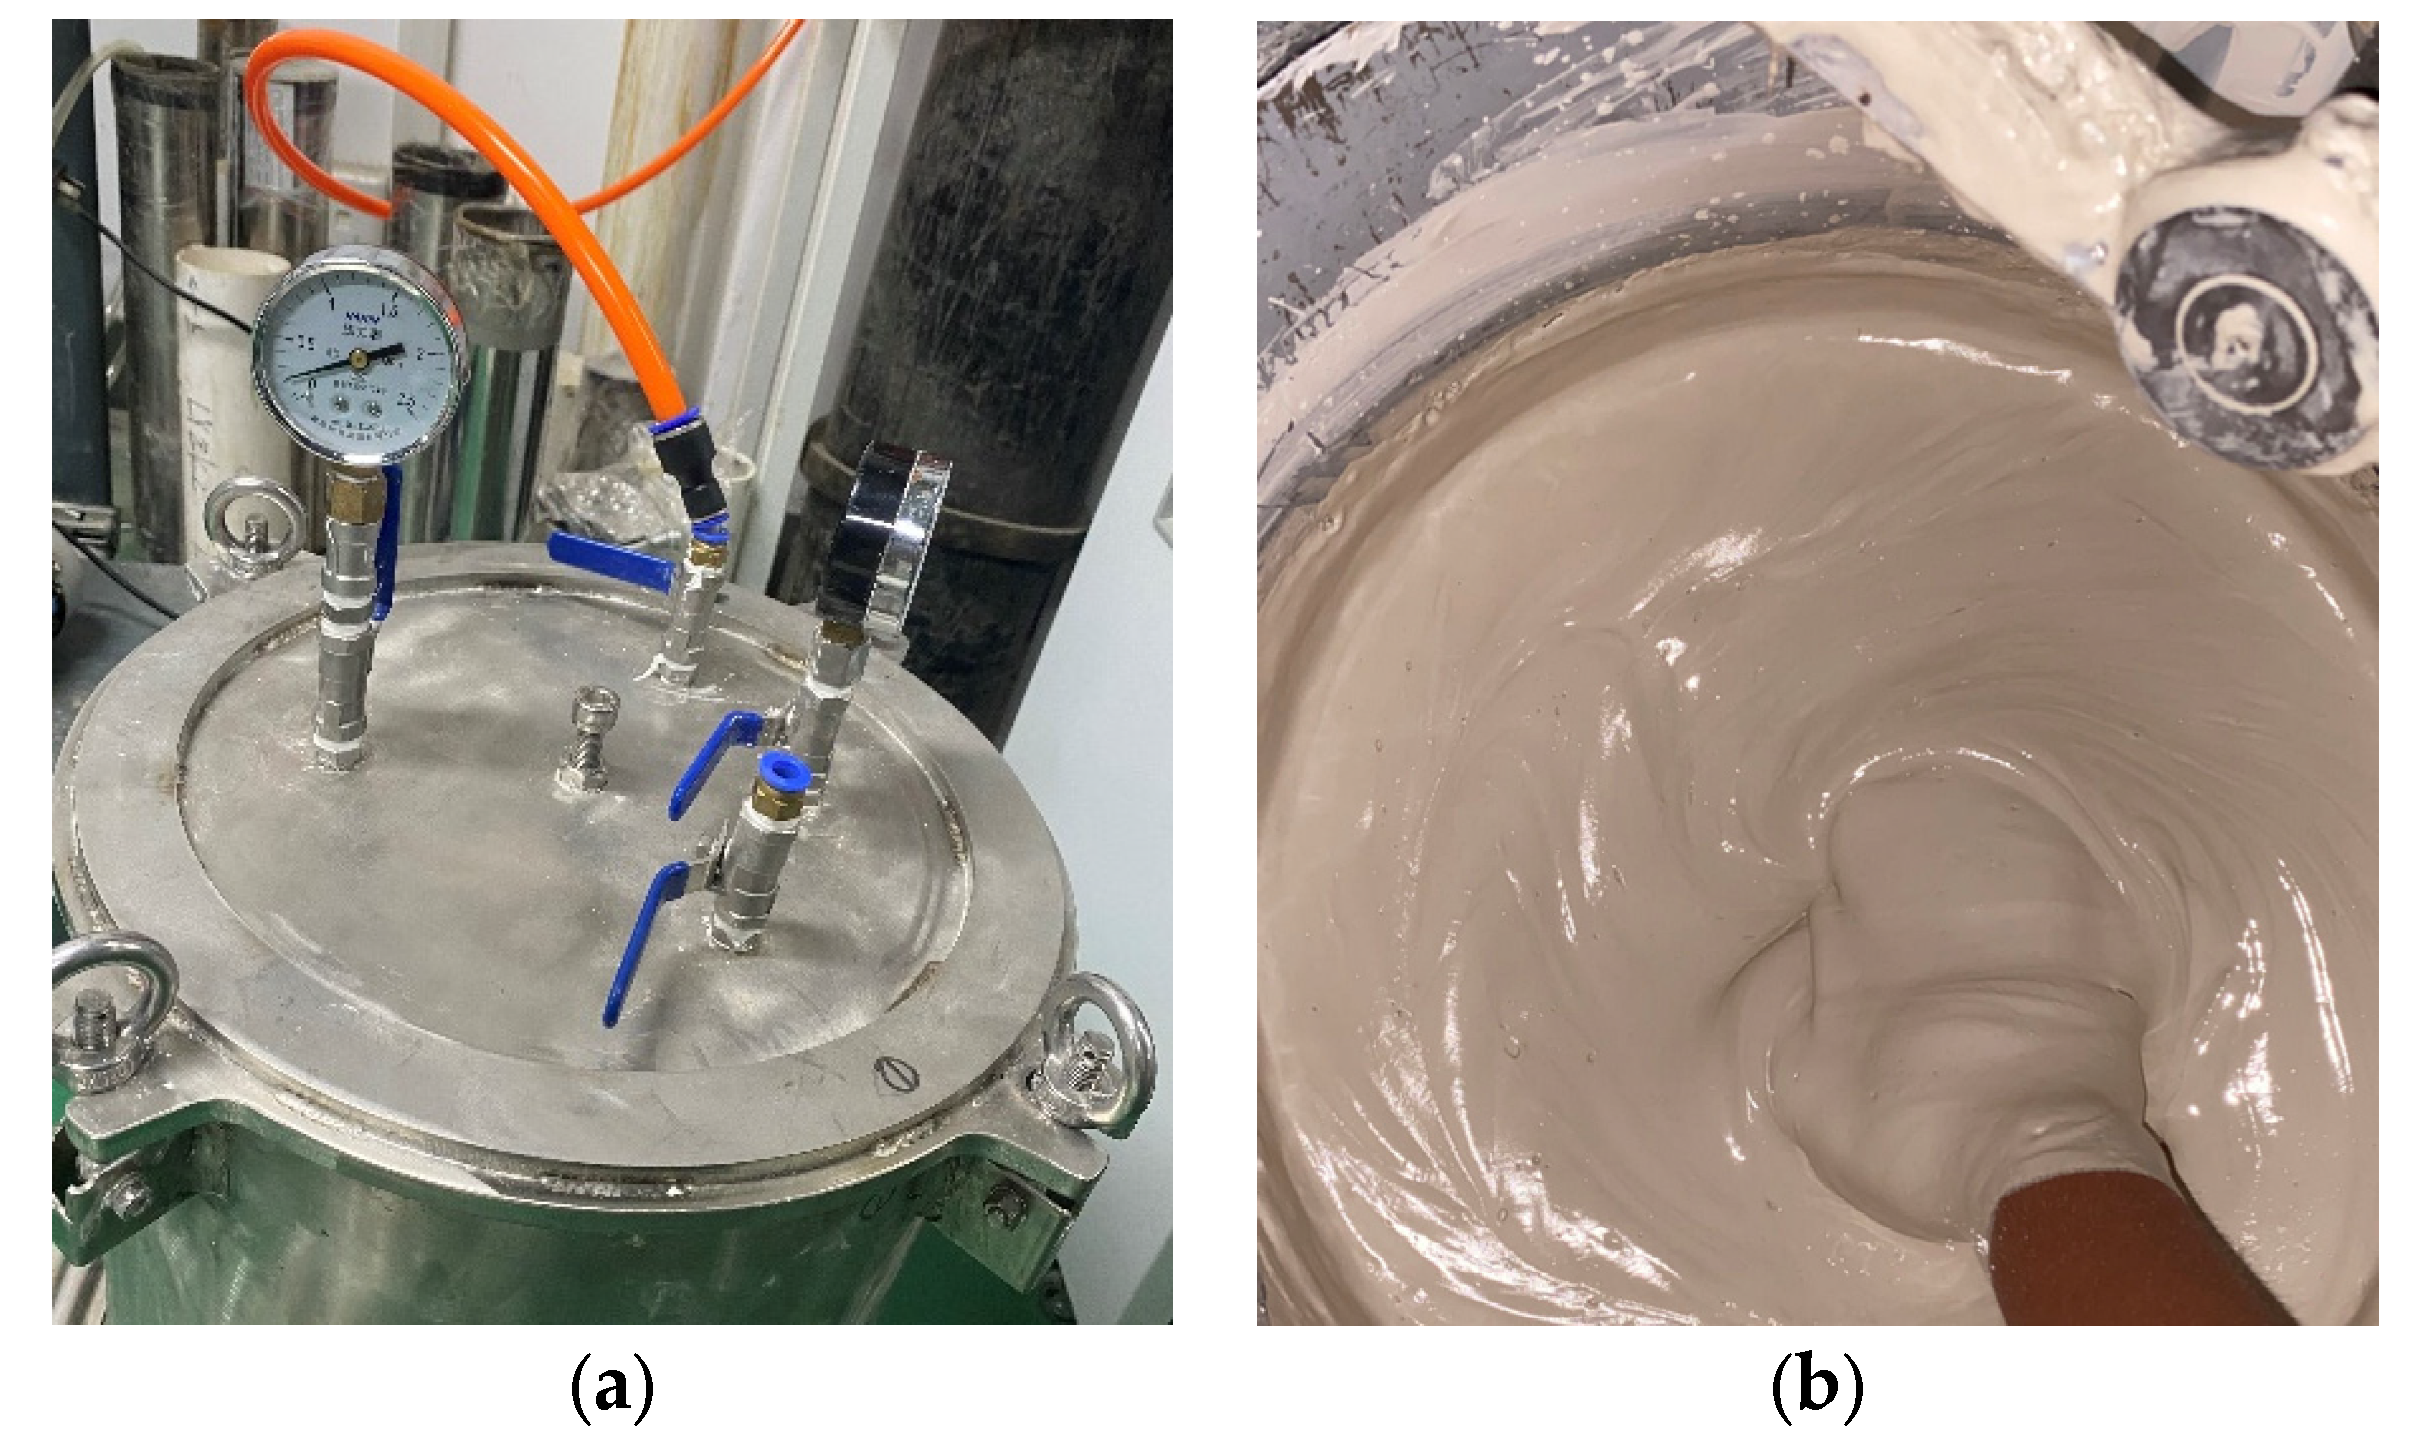
It was very hard to recover undisturbed or slightly disturbed gassy soil specimens from the seabed since the confining pressure was released as the sample was moved from its natural depth. The reduction of confining pressure led to the expansion and exsolution of the gas bubbles, causing irreversible damage to the sample [22,23]. The zeolite molecular sieve technique was adopted here to prepare gassy specimens containing a homogeneous and repeatable distribution of gas bubbles [12,15]. Zeolites were a group of inert chemicals with a strong affinity for water, while other molecules of a suitable size like methane and nitrogen could be taken into the crystal in the absence of water. The zeolite was dried at a temperature of 105 °C for 24 h and then held in a vacuum of −100 kPa for 8 h in a sealed cylinder. Nitrogen was charged into the zeolite powders at a pressure of 200 kPa for 24 h in the same cylinder (Figure 2a), without exposure to the atmosphere. The solubility of nitrogen in water was lower than that of methane, but nitrogen is much safer in soil lab tests. The mechanical behaviors of gassy clays charged with nitrogen or methane were similar [12], so nitrogen was adopted in our tests. According to the procedure above, most of the pore volume of the zeolite could be occupied by gas.
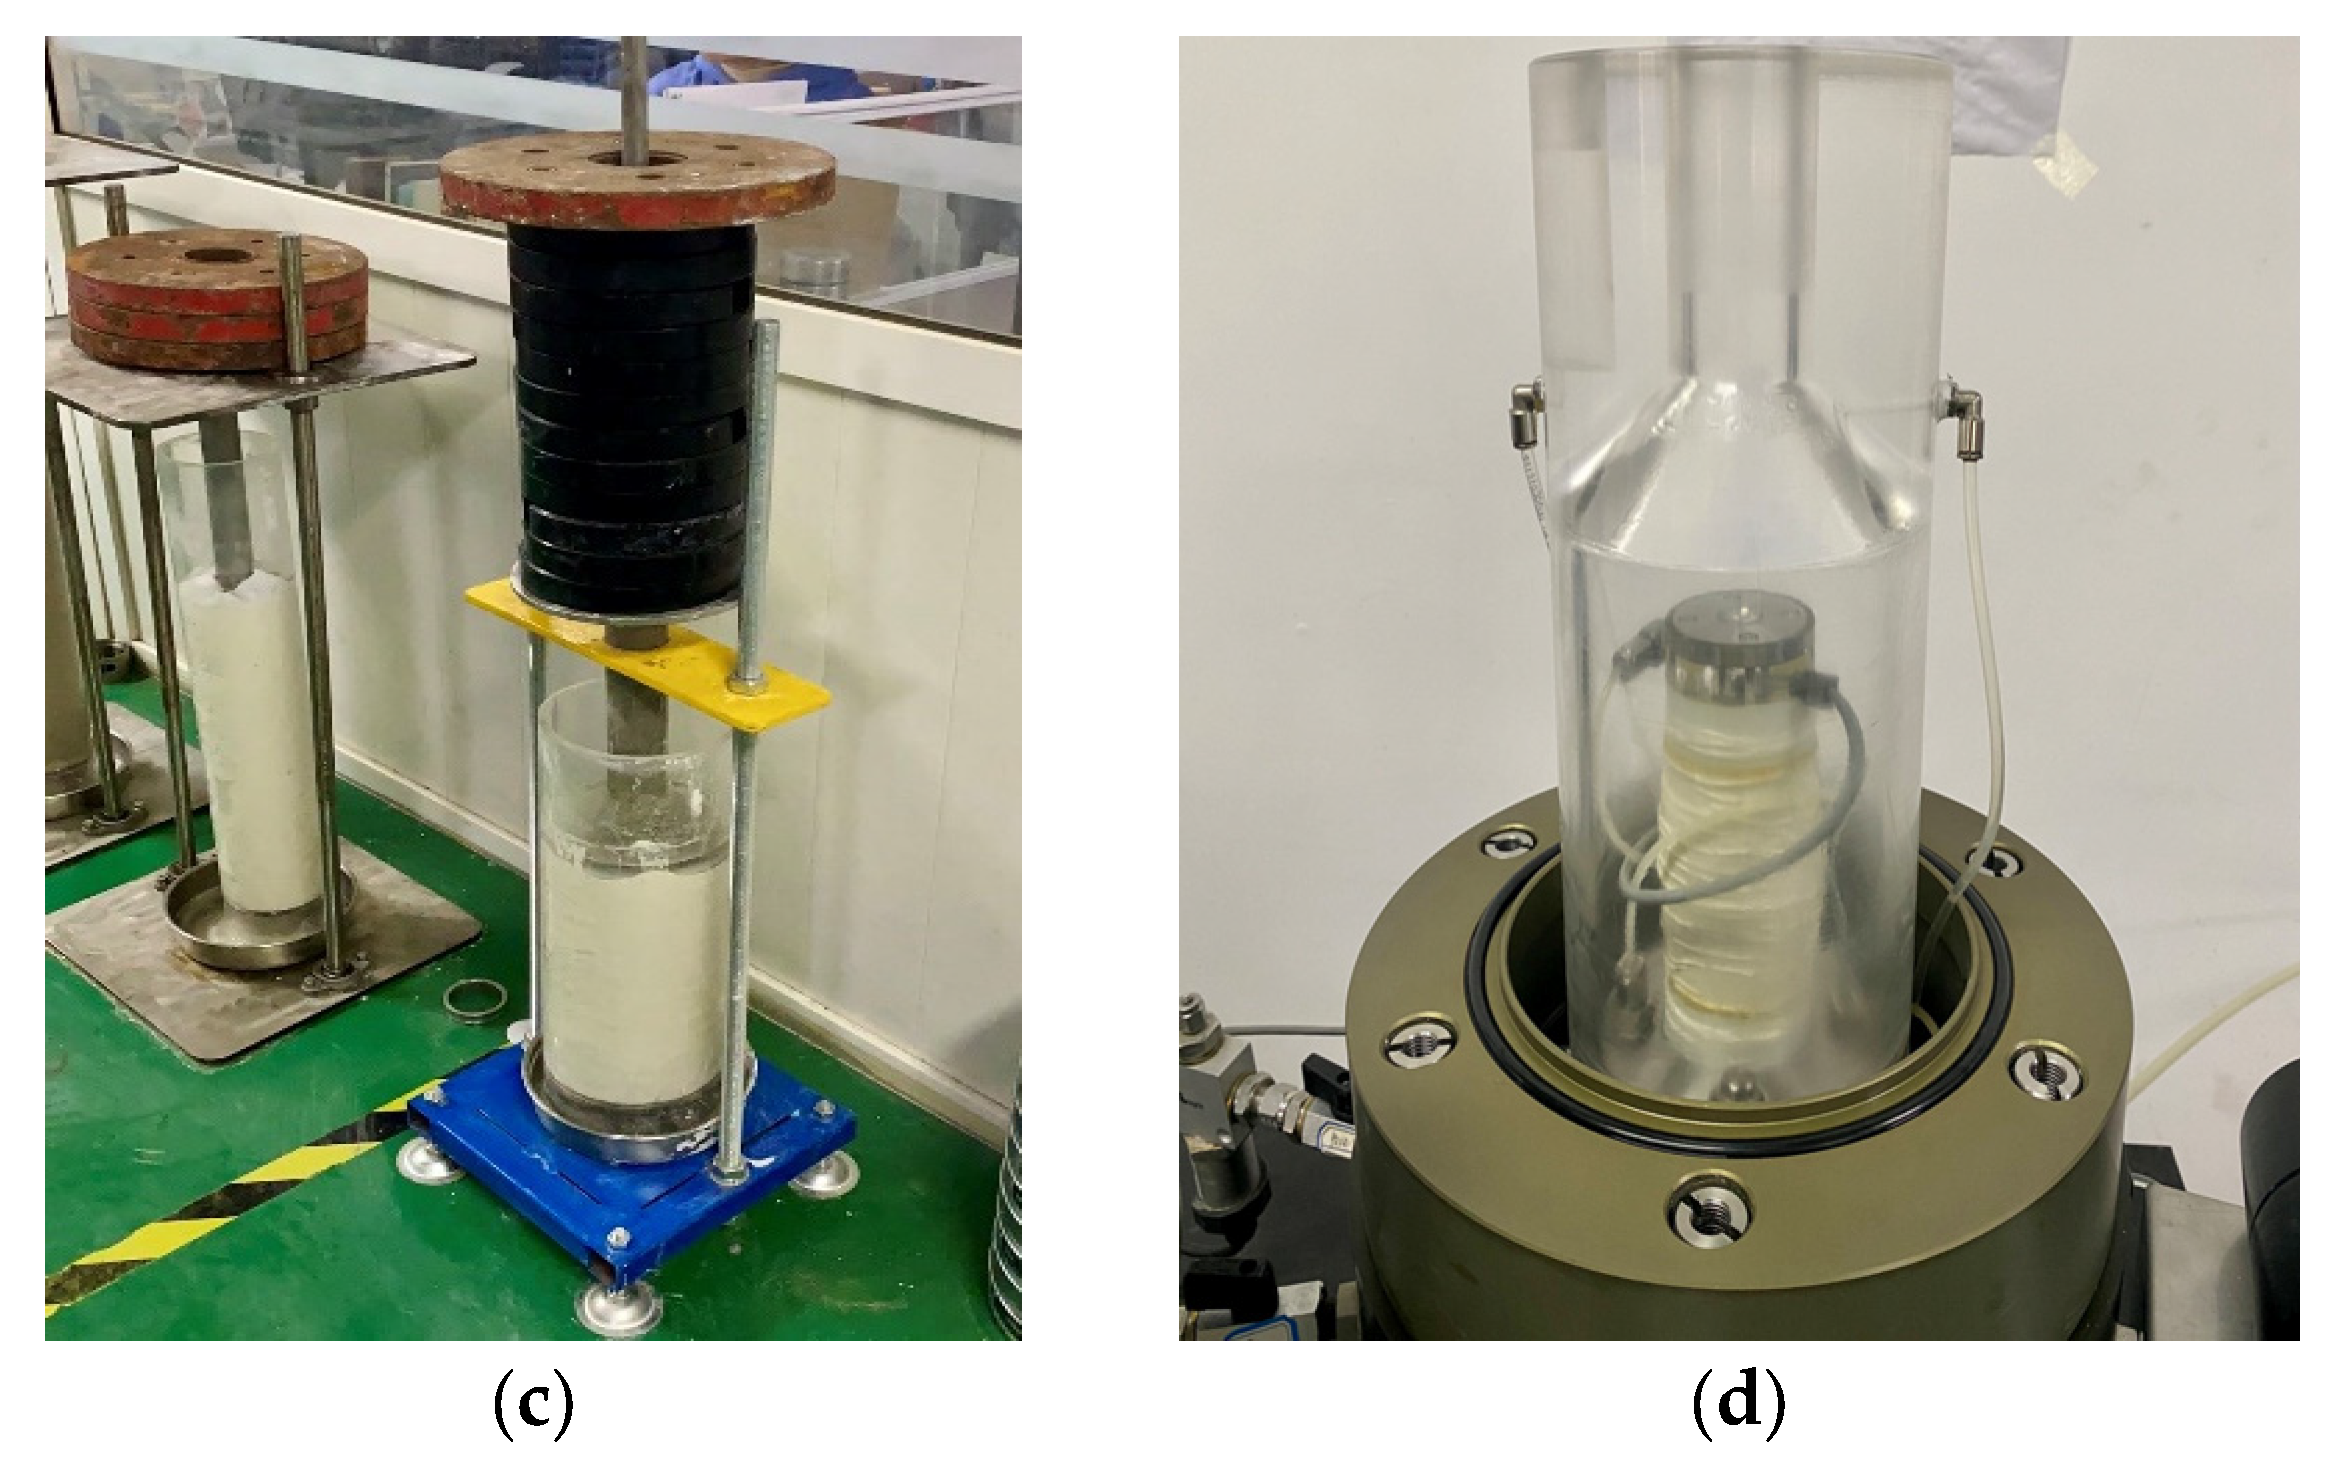
The Malaysian kaolin used in a few physical model tests was taken as the sample [24,25,26]. The liquid and plastic limits of the Malaysian kaolin were measured at 80% and 35%, respectively, and the plasticity index was 45%. This soil is located near the boundary between clay and silt according to the plasticity chart in BS 5930 [27], categorizing it as a clay with very high plasticity. Other index properties of Malaysian kaolin are summarized in Table 1. The nitrogen-saturated zeolite powers used were 20% of the dry soil’s weight. The zeolite powders were mixed with the kaolin slurry with a water content of 1.05 times the liquid limit, as shown in Figure 2b. The mixed slurry was poured into a rigid container (Figure 2c), and a pressure with an amplitude of 12.5 kPa was applied immediately using a heavy plate. After the consolidation was nearly complete, the pressure was increased to 25 kPa. The maximum pressure was 60 kPa for consolidation. The specimens were drained at both ends to speed the consolidation procedure. It took about 4 days for consolidation, sufficiently long to release the nitrogen captured in the zeolite powders. The load duration is 24 h for each increment, as recommended by Test Method A in ASTM D2435-11 [28]. Each reconstituted specimen was then trimmed to produce a triaxial specimen.
A total of 15 undrained triaxial compression tests were conducted following the ASTM D4767-11 standard [29]. The gassy specimen was consolidated isotopically in the triaxial apparatus prior to shearing under an effective confining pressure pc′ ranging between 200 and 600 kPa and an initial pore water pressure uw0 of 0–600 kPa. To measure the total volume change accurately, the triaxial apparatus was equipped with a high-accuracy differential pressure transducer (see Figure 2d) [30]. The volume change caused by the change in confining pressure and the deformation of the connecting tubes must be calibrated before the tests, according to a program suggested by Ng et al. [31]. De-aired water was used in the inner cell and the reference tube. Both the total volume and water volume changes during consolidation were recorded to determine the initial void ratio e0 and initial water saturation Sr0. The conditions of all the tests are listed in Table 2. The specimens were sheared with an axial strain rate of 0.02 mm/min.

3. The Established Constitutive Model

An elastoplastic model of gassy clay proposed by Hong et al. [21] is to be addressed first, followed by the presentation of the modifications based on 15 triaxial tests. In [21], the stress-strain behavior of the soil matrix is controlled by the effective stress principle, and the volume change of the gas bubbles is governed by Boyle’s law. The constitutive equations of this model are presented collectively in Table 3, with a non-associate flow rule adopted. In Table 3, the elastic and plastic strains are denoted by the superscripts e and p, respectively; dεv and dεq are the volumetric and deviatoric strain increments of the soil matrix; p′ is the mean effective stress; q is the deviatoric stress; K and G are the elastic bulk and shear modulus of the soil matrix, respectively; α and μ are two parameters dominating the shape of the yield surface; a and b are fitting parameters of α; D is the dilatancy function with fitting parameters ξ and χ; uw0_ref is a reference pore water pressure; stress ratio η = q/p′; M is the stress ratio at the critical state; and L is the loading index, which is enclosed in the McCauley brackets such that L = L if L 0 and L = 0 if L < 0 .
According to Table 3, there are ten parameters in the model, among which five are identical to those of the Modified Cam-clay model: λ and eN are the slope and intercept of the virgin consolidation line in the ew in p′ plane; κ is the slope of the swelling line; M is the critical stress ratio; and v is the Poisson’s ratio. The other five parameters are: ξ and χ controlling the contractive response at various combinations of uw0 and A0, are fitted by the stress-dilatancy relations; a and b control the yield surface shape, determined by the effective stress paths in the q-p′ space; and δ is used to calculate the volumetric change of the gas bubbles due to gas compression. The parameters ξ, χ, a, and b were calibrated based on undrained triaxial tests with a particular effective confining pressure of 200 kPa [21].
Based on our experimental data, it appears that the model in [21] is unable to accurately simulate the mechanical behavior of gassy clay with varying initial pore water pressures under high effective confining pressures. In fact, in some cases, the model cannot simulate it at all. This is due to the fact that while the yield surface equation and stress-dilatancy equation in Table 3 do consider the effects of initial pore water pressure and gas volume fraction, they do not match up with the results of laboratory tests that were conducted under high effective confining pressures.

4. Improvements to a Critical State Model for Gassy Clay

The model by Hong et al. [21] is modified here to quantify the influences of gas bubbles on the deformation and strength of samples, especially against a wide range of pc′. A new dilatancy function is proposed to capture the calculated stress-dilatancy relation, while the yield surface is improved by redefining the expressions of parameters α and μ.

4.1. Stress-Dilatancy Function

For the undrained triaxial tests of conventional saturated clays, the plastic volume increment during shearing is equal to the elastic one in magnitude but with the opposite sign [32,33,34]. The plastic volume increment of the soil matrix in gassy clay is calculated in the same way since the porous water is nearly impossible to drain into the gas bubbles during undrained shearing as A0 < 8% [35]. The deviatoric strain increment of the soil matrix is close to the measured one in terms of the entire sample, as the gas bubbles cannot take any shearing.
The elastic strain increments are calculated using the poro-elastic parameters κ and v. The dilatancy of the soil matrix is thus determined by the following equation:
D = d ε v p d ε q p = d ε v e d ε q d ε q e = κ d p 1 + e w 0 p d ε q 2 κ ( 1 + ν ) d q 9 ( 1 2 ν ) 1 + e w 0 p
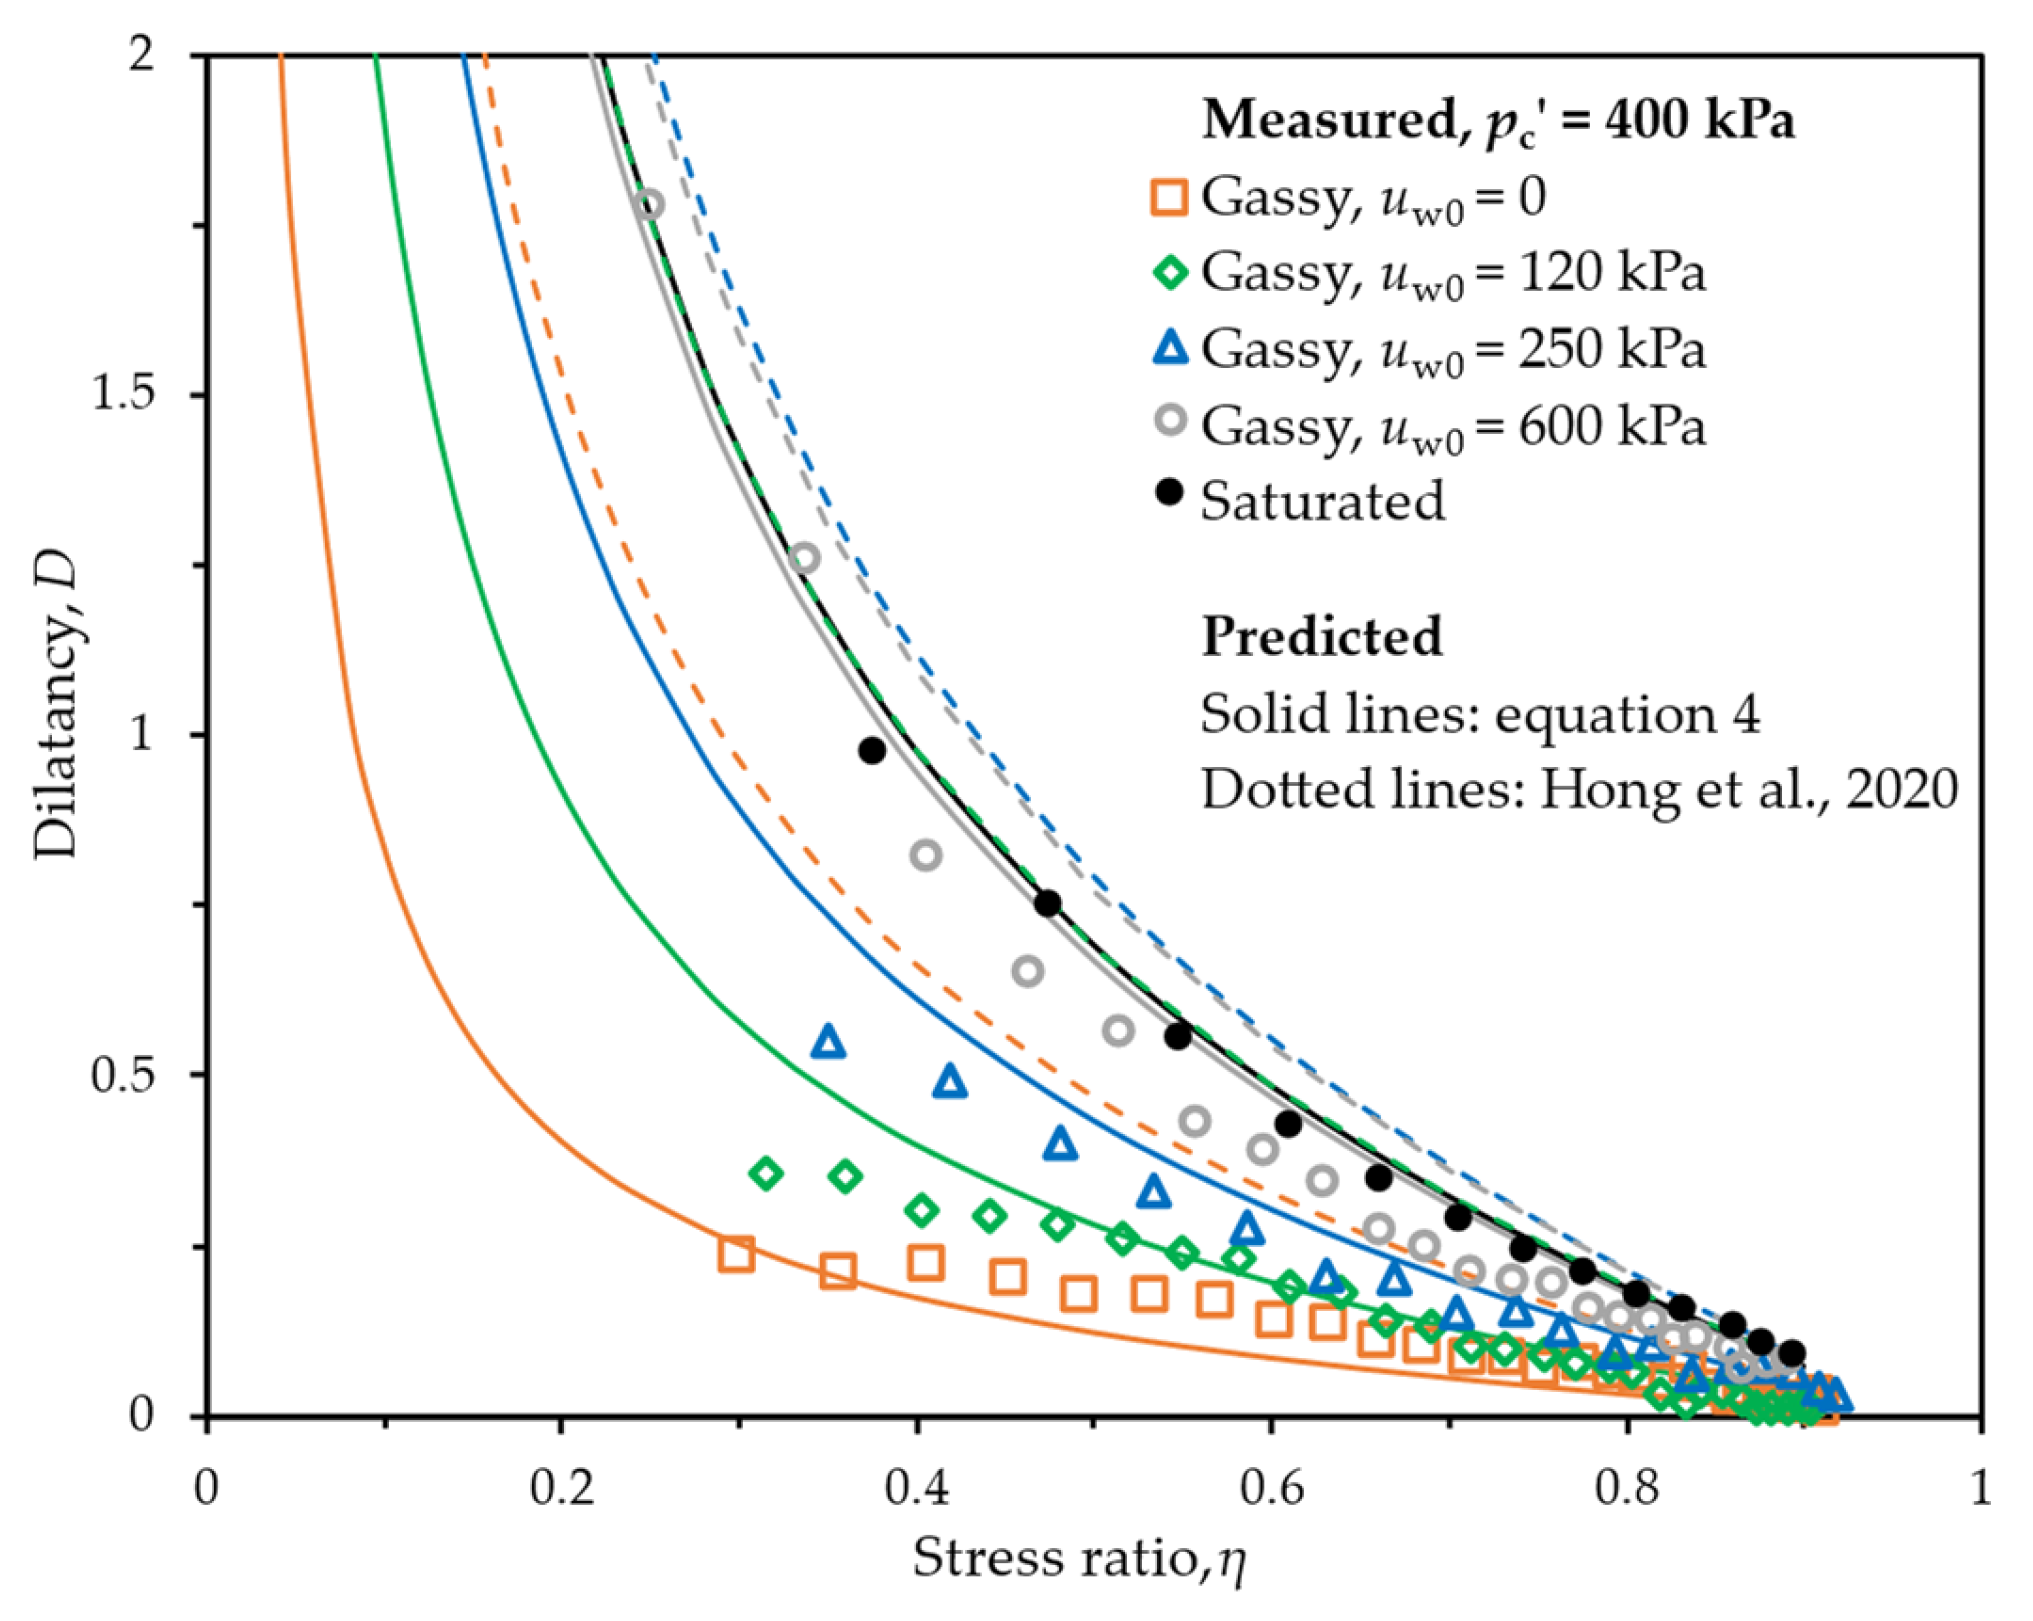
Figure 3 shows the stress-dilatancy curves for gassy clay with various initial gas volume fractions at a typical effective confining pressure of 400 kPa. For both the gassy and saturated specimens, the stress ratio η remains increased and D is decreased during shearing. As pc′ and η are given, the contraction of the gassy specimen becomes remarkable with increasing uw0.
The dilatancy function for gassy clay is usually regarded as a sole function of η [18,19], similar to those for saturated clays. The dilatancy function in [21] captured the stress-dilatancy relations of gassy clay as pc′ = 200 kPa; however, the dilatancies are overestimated as pc′ = 400 or 600 kPa, as shown in Figure 3. The overestimation becomes more remarkable when uw0 is lower. By observing our triaxial tests, the dilatancy function in Table 3 is updated to:
D = tanh ( m 1 u w 0 p c ) β ln A 0 M 2 η 2 2 η
where the parameter m1 defines the slope of the stress-dilatancy curve at the critical state and β is associated with the curvature in proximity to η = 0, where the curve has a vertical asymptote. They are calibrated through the calculated dilatancies. The tanh function involved in Equation (4) is to describe the steep inclinations at low stress ratios, i.e., the dilatancy is decreased rapidly owing to a small increment of η during the very early stage of shearing.
Two extreme conditions can be satisfied in Equation (4): (a) at the isotropic stress state with η = 0, no plastic shear strain occurs and the dilatancy tends to be infinity; and (b) at the critical state with η = M, the dilatancy is 0. For the saturated soils, the expression of D becomes (M2η2)/2η, which is identical to that of the traditional modified Cam-clay model. The dilatancies predicted by Equation (4) are also plotted in Figure 3, in reasonable agreement with the experimental data. Compared with the expression in [21], the performance of Equation (4) is better at describing the stress-dilatancy curves. The experimental dilatancies at η < 0.3 are not plotted in Figure 3, since both the measured values of d ε v p and d ε q p are minimal and the ratio between them is potentially accompanied by significant error.
According to the original expression in [21], the dilatancy D at each η has to remain constant when uw0 = uw0_ref, regardless of the value of A0. This is inconsistent with the findings by Wheeler [13] and Sham [35]. Under the same uw0_ref but different A0, the rates of excess pore water pressure in gassy clay that develop with axial strain are different, hence the different dilatancy. Therefore, Equation (4) is more suitable to describe the dilatancy of gassy clay.

4.2. Yield Function

A general formula for the yield function proposed by Lagioia et al. [36] has been adopted in a few models [37,38,39]. The yield function is capable of describing almost all the yield surface shapes observed in the previous tests, which may be transferred gradually from teardrop to bullet in shape with increasing uw0, expressed as:
f = p p c ( 1 + η M K 2 ) K 2 ( 1 μ ) ( K 1 K 2 ) ( 1 + η M K 1 ) K 1 ( 1 μ ) ( K 1 K 2 ) = 0
K 1 , 2 = μ ( 1 α ) 2 ( 1 μ ) ( 1 ± 1 4 α ( 1 μ ) μ ( 1 α 2 ) )
where α and μ are parameters controlling the shape of the yield surface. For fixed values of M and pc′, α controls the rounding of the curve corner at p′ = pc′, and μ determines how close the shape is to a bullet. Lagioia et al. [36] suggested that α was ranged between 10–6 and 2 and μ between 0.2 and 2. By varying α and μ, it is possible to describe the gradual evolution of the yield surface’s shape.
In the model by Hong et al. [21], μ is taken as a constant of 0.915, and α is related to uw0 and A0 as:
α = 0.4 exp ( 5 Λ A 0 a + h ( Λ ) b )
where a and b are determined by fitting the q-p′ curves of gassy clays; Ʌ = (uw0uw0_ref)/pc′ with uw0_ref determined by trial calculations; and the Heaviside step function h(Ʌ) is to capture the sensitivity of yield surface to A0, being 1 as Ʌ > 0 and 0 as Ʌ < 0. For saturated specimens (A0 = 0), α had a constant value of 0.4. When uw0 > uw0_ref, α is smaller than 0.4, simulating the damaging role of gas bubbles in shrinking the yield surface during shearing. When uw0 < uw0_ref, α exceeds 0.4, indicating an enhancing effect by the bubbles on expanding the yield surface.
In our triaxial tests with pc′ = 200 kPa, the excess pore water pressures calculated by Equations (5)–(7) match the experimental data reasonably well. For tests with pc′ = 400 kPa, the divergence of the excess pore water pressures at 15% axial strain between gassy specimens with various uw0 is up to 28%, while the predicted divergence by Equations (5)–(7) is only 5%. This is due to the fact that the range of α has narrowed while μ has remained constant. Additionally, the requirement of 4 α ( 1 μ ) μ ( 1 α 2 ) < 1 in Equation (6) cannot be satisfied in tests with high pc′ and low uw0; for example, α is estimated as 0.75 with uw0 = 0 and pc′ = 600 kPa. Equation (7) is thus replaced by:
α = 0.3 exp ( 5 Λ A 0 a + h ( Λ ) b )
where uw0_ref in the expression of Ʌ is taken as 120 kPa.
The shape parameter μ is specified to increase linearly with A0 rather than a constant value, expressed as:
μ = c A 0 + 0.72
where the parameter c shows the effectiveness of A0 in controlling the yield surface shape. With a positive value of c, an increase in A0 can lead to the yield surface transitioning from a teardrop to a bullet shape. The shape parameters μ and α are set as 0.72 and 0.3 at A0 = 0, respectively, which can capture the elliptical yield surface of saturated specimens. The predictions at uw0 = 0 are captured by Equations (8) and (9), rather than Equation (7), at pc′ > 200 kPa. Furthermore, the predictions by Equations (8) and (9) are more accurate than those by Equation (7), especially at an effective confining pressure of 600 kPa.

5. Verification of the Model Developed

There are 10 parameters in the modified model, among which five Modified Cam-clay parameters are obtained through triaxial tests of the saturated specimens (see Table 2) as λ = 0.244, eN = 2.35, κ = 0.053, v = 0.3, and M = 0.97. The parameters m1 and β determining the stress-dilatancy are calibrated based on the results of four undrained triaxial tests as m1 = 0.9 and β = 0.5, which are undertaken at two values of pc′, with a relatively high uw0 and a relatively low uw0 at each pc′. The parameters a, b, and c controlling the shapes of the yield surface are calibrated by fitting the undrained effective stress paths of the same triaxial tests mentioned in the calibrated proceeding of m1 and β, as a = 0.16, b = 0.33, and c = 8.63.
The results of triaxial tests conducted on gassy Malaysian kaolin clay in both Hong et al.’s study [21] and the present study were used to evaluate the effectiveness of the developed model. As shown in Figure 4, the triaxial tests in [21] are well reproduced by the model developed here.
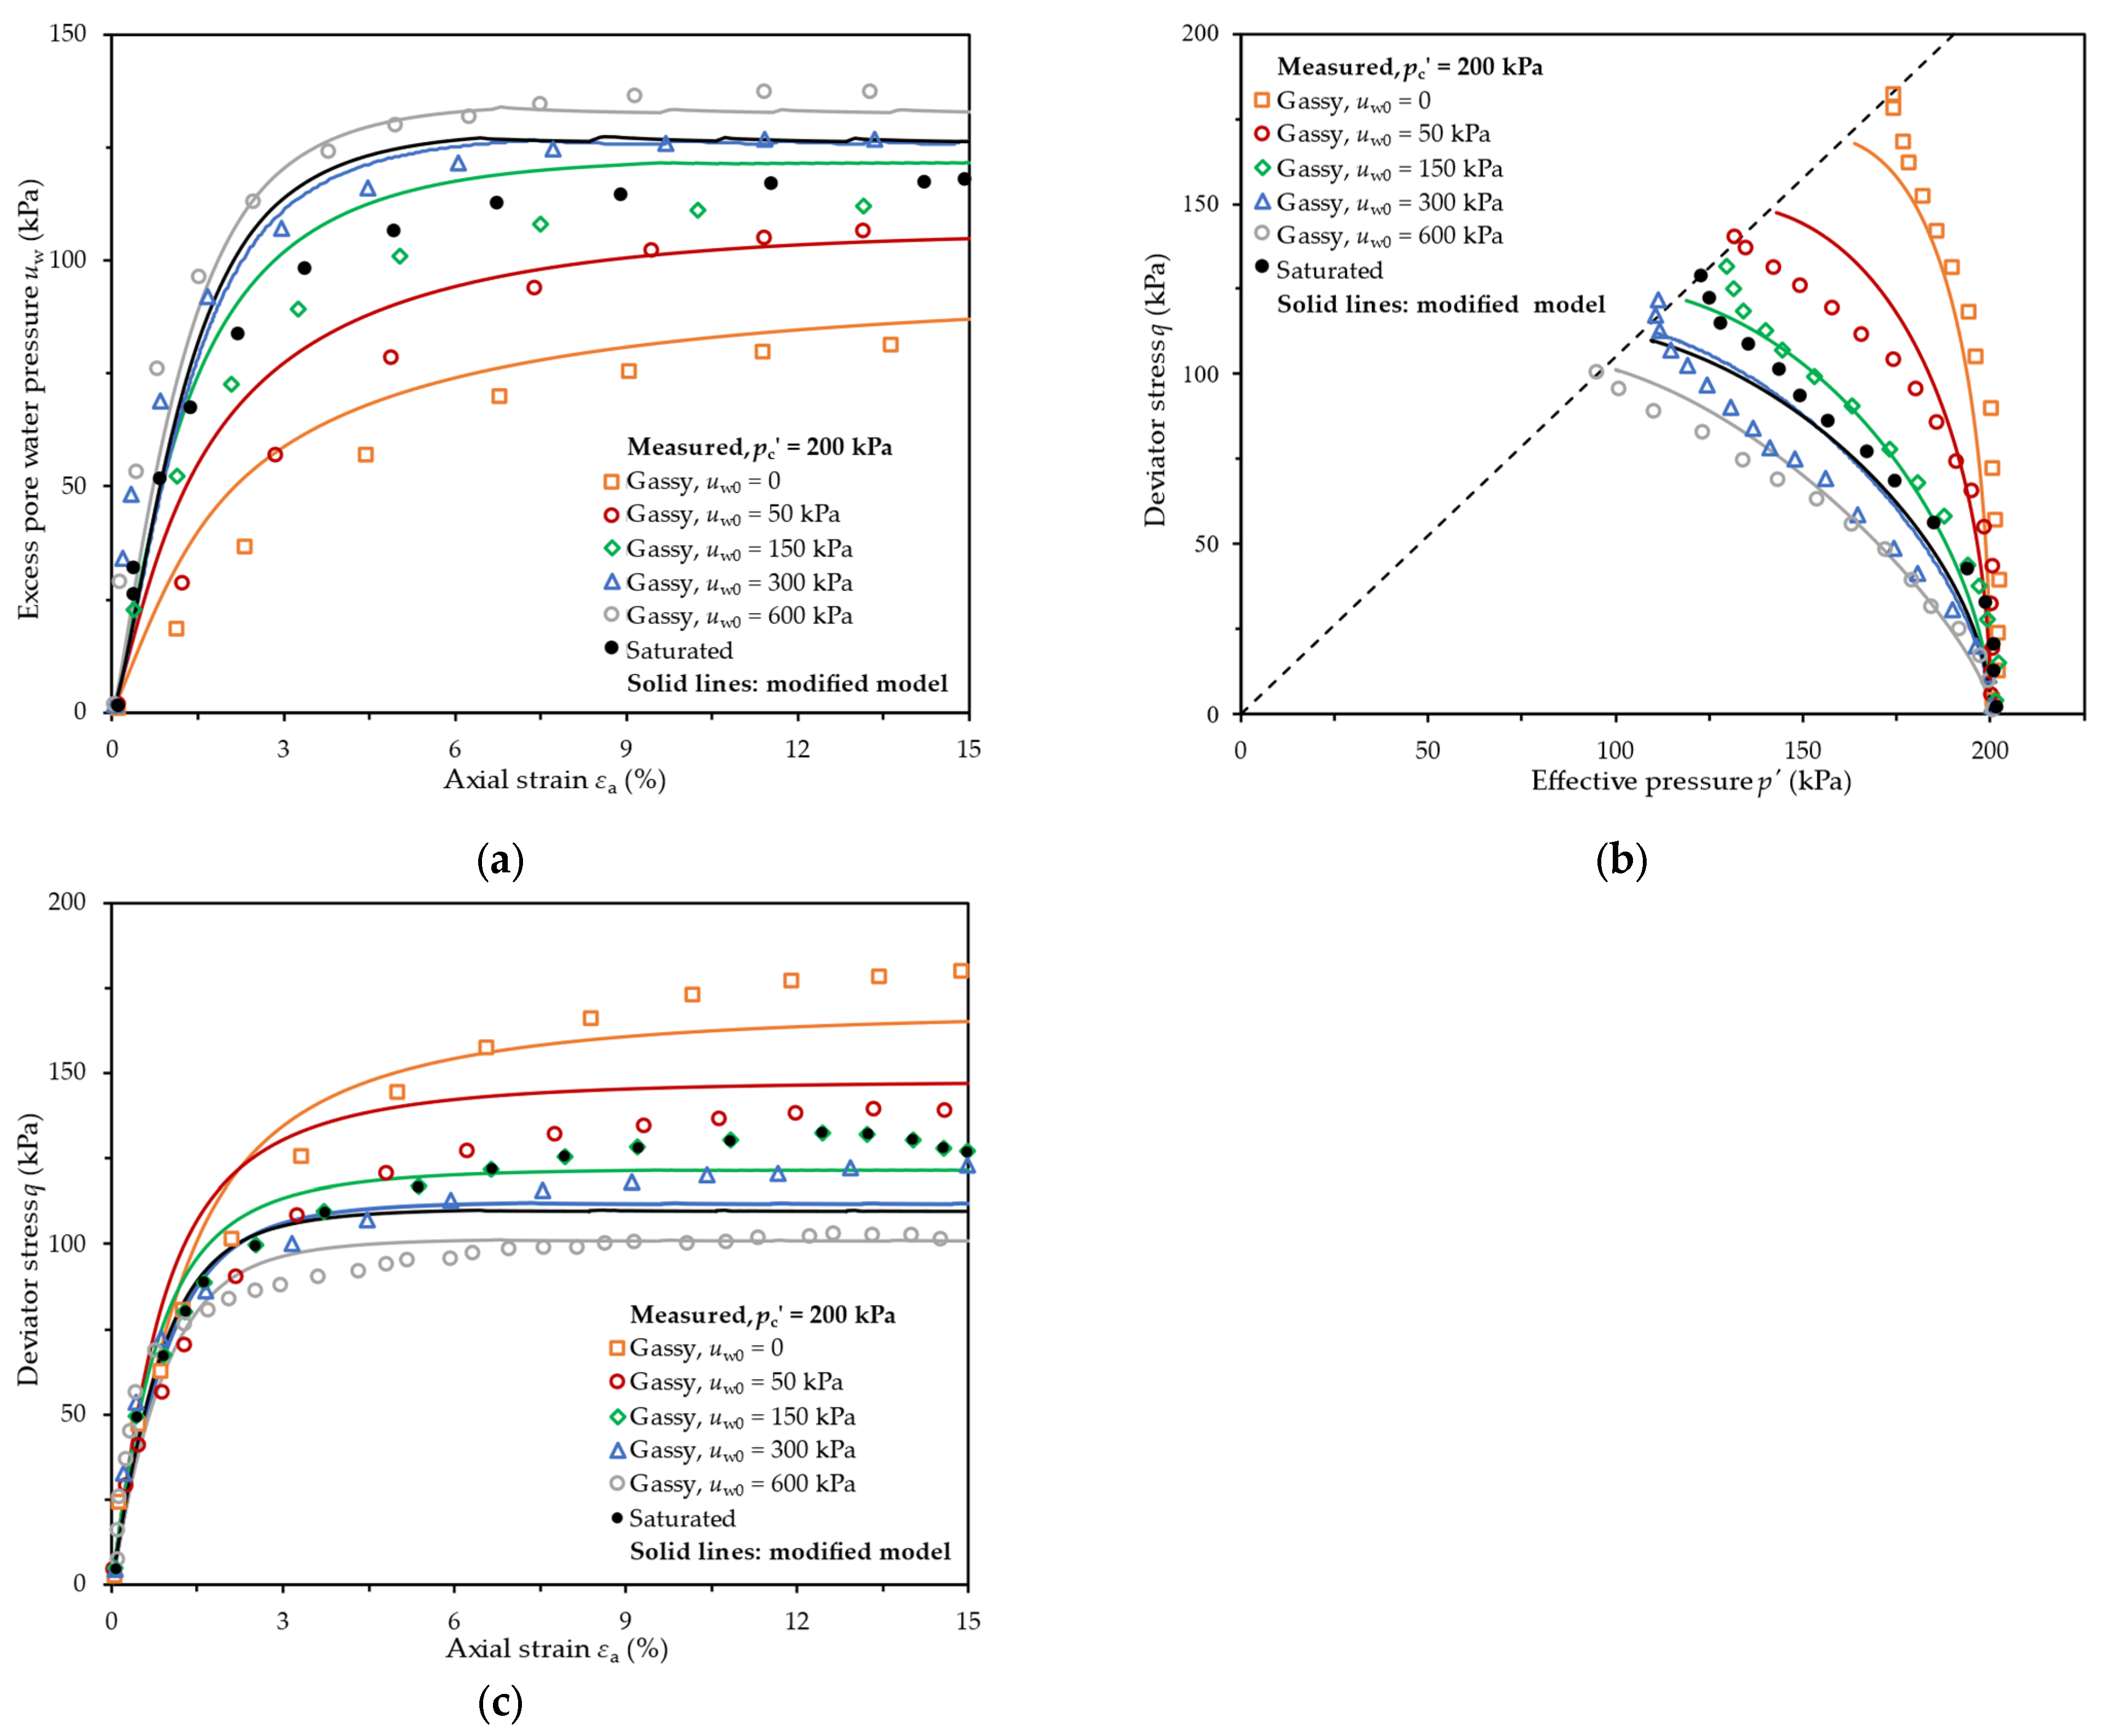
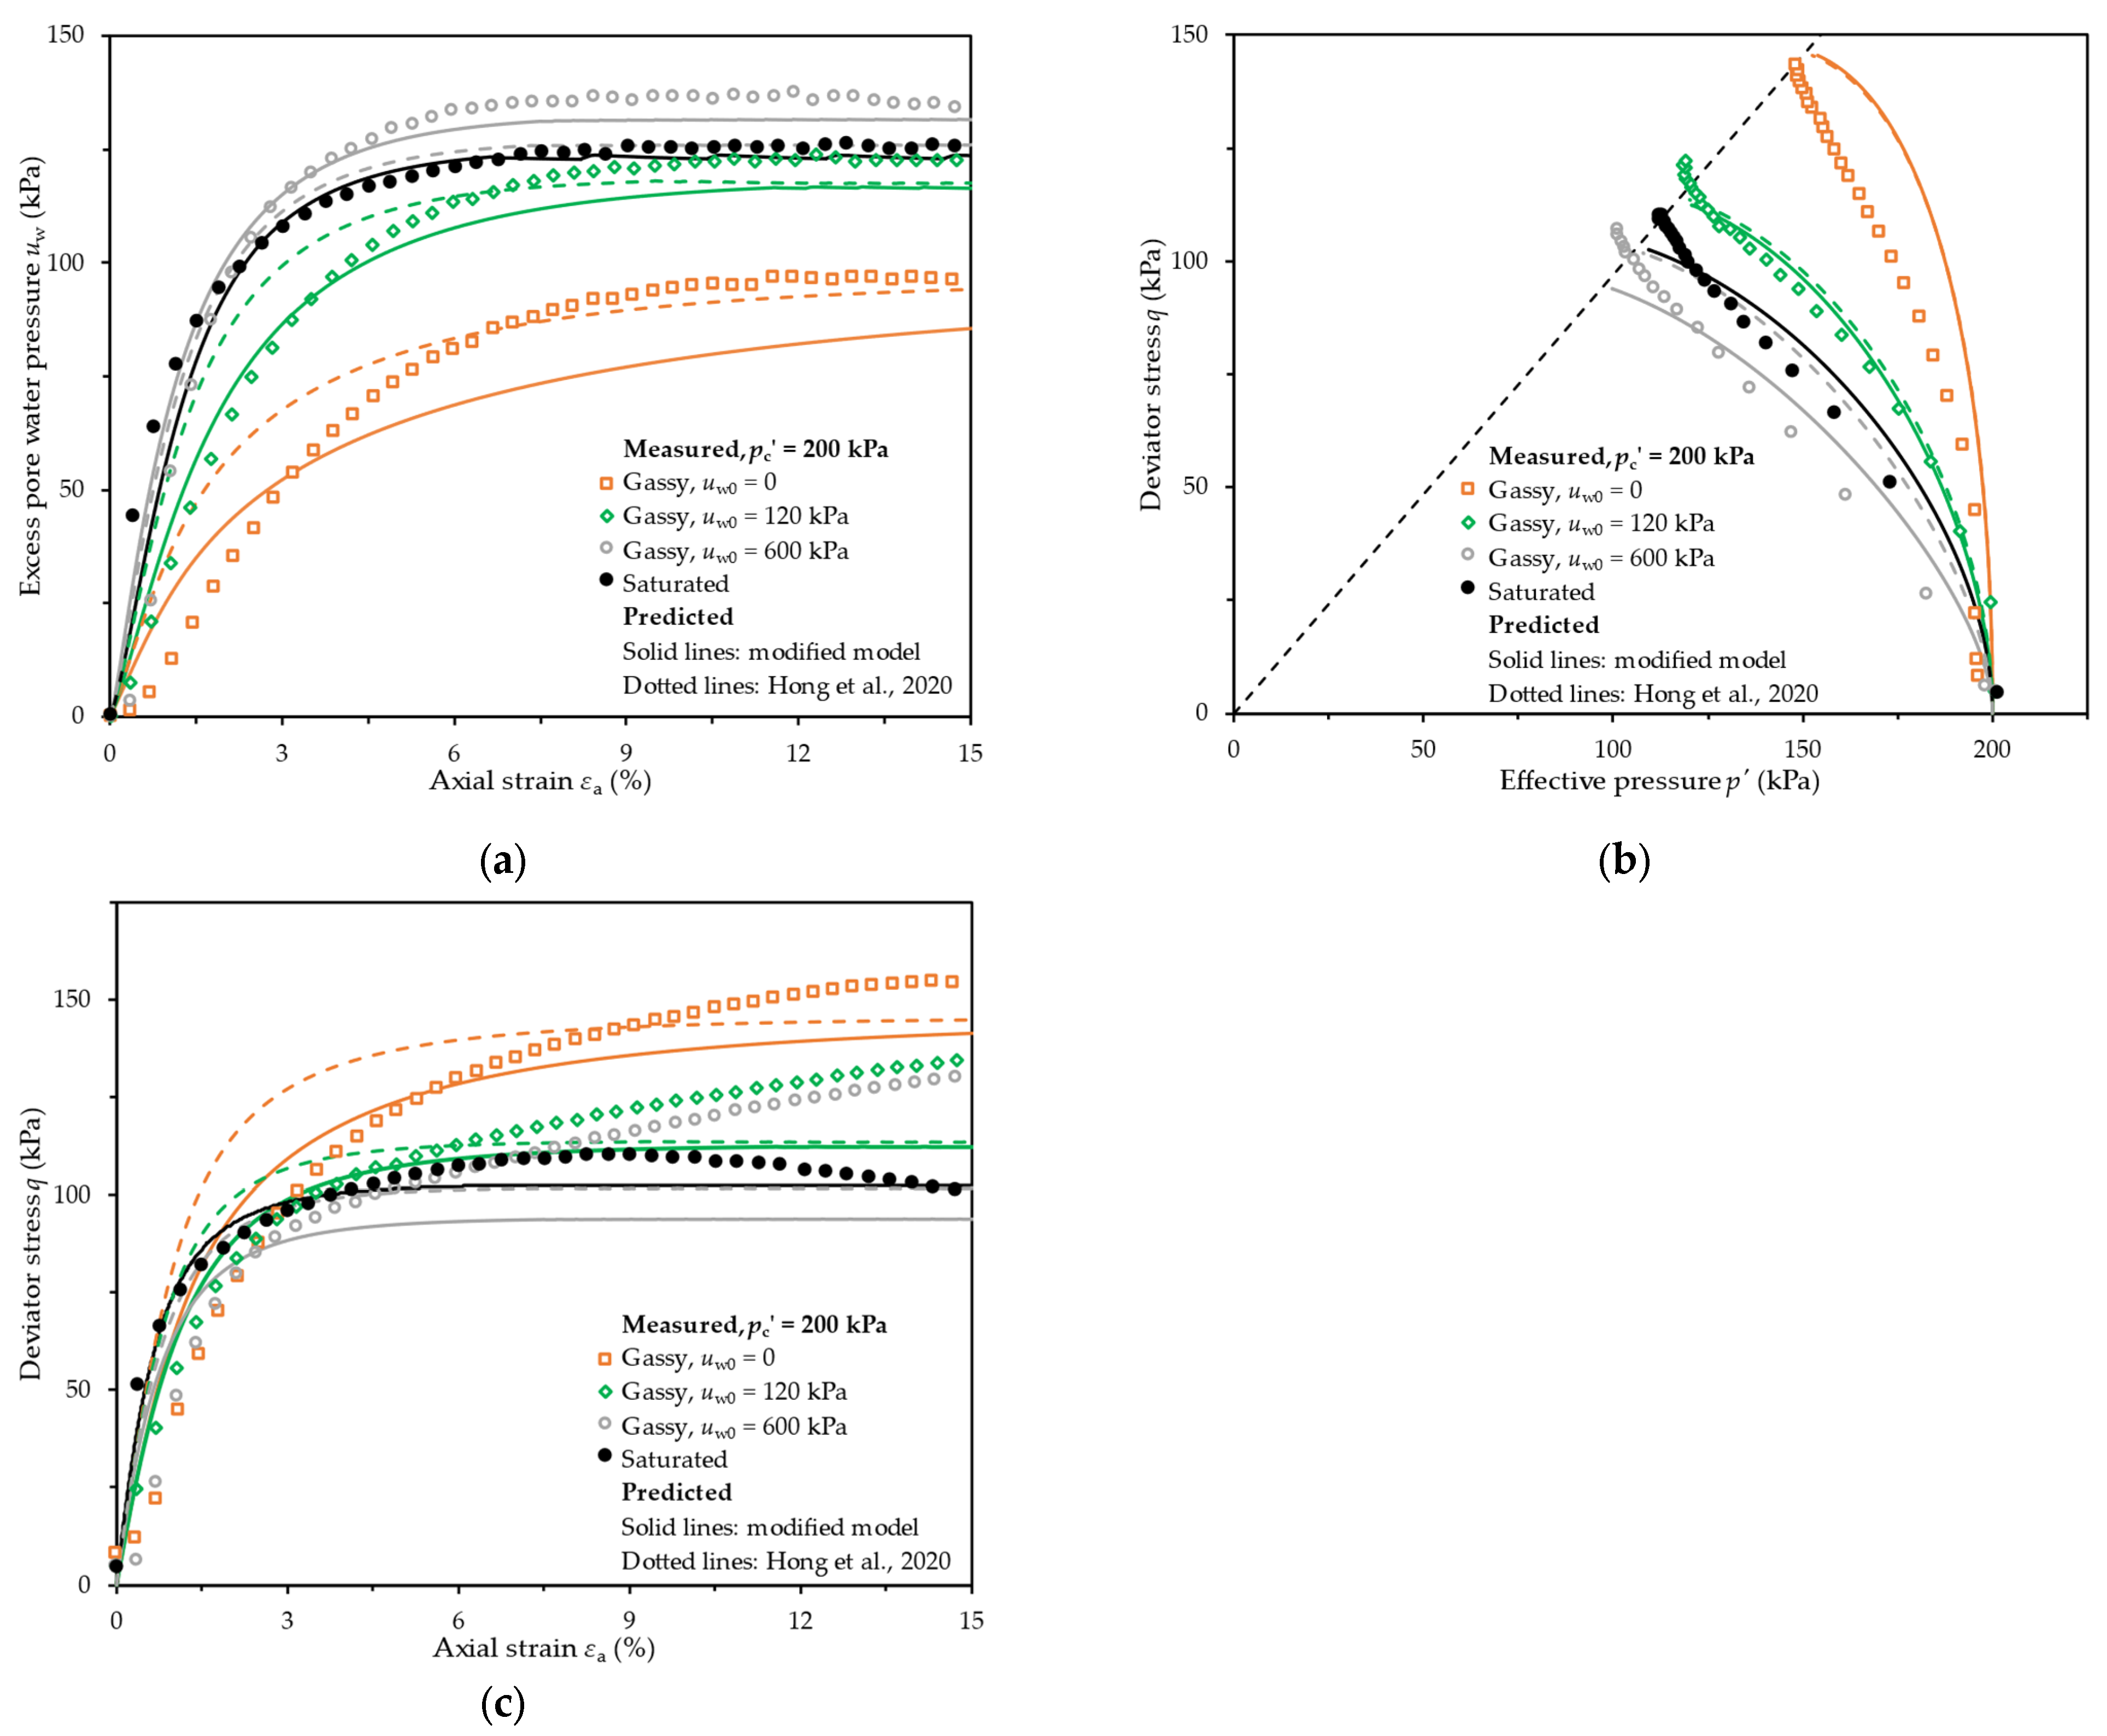
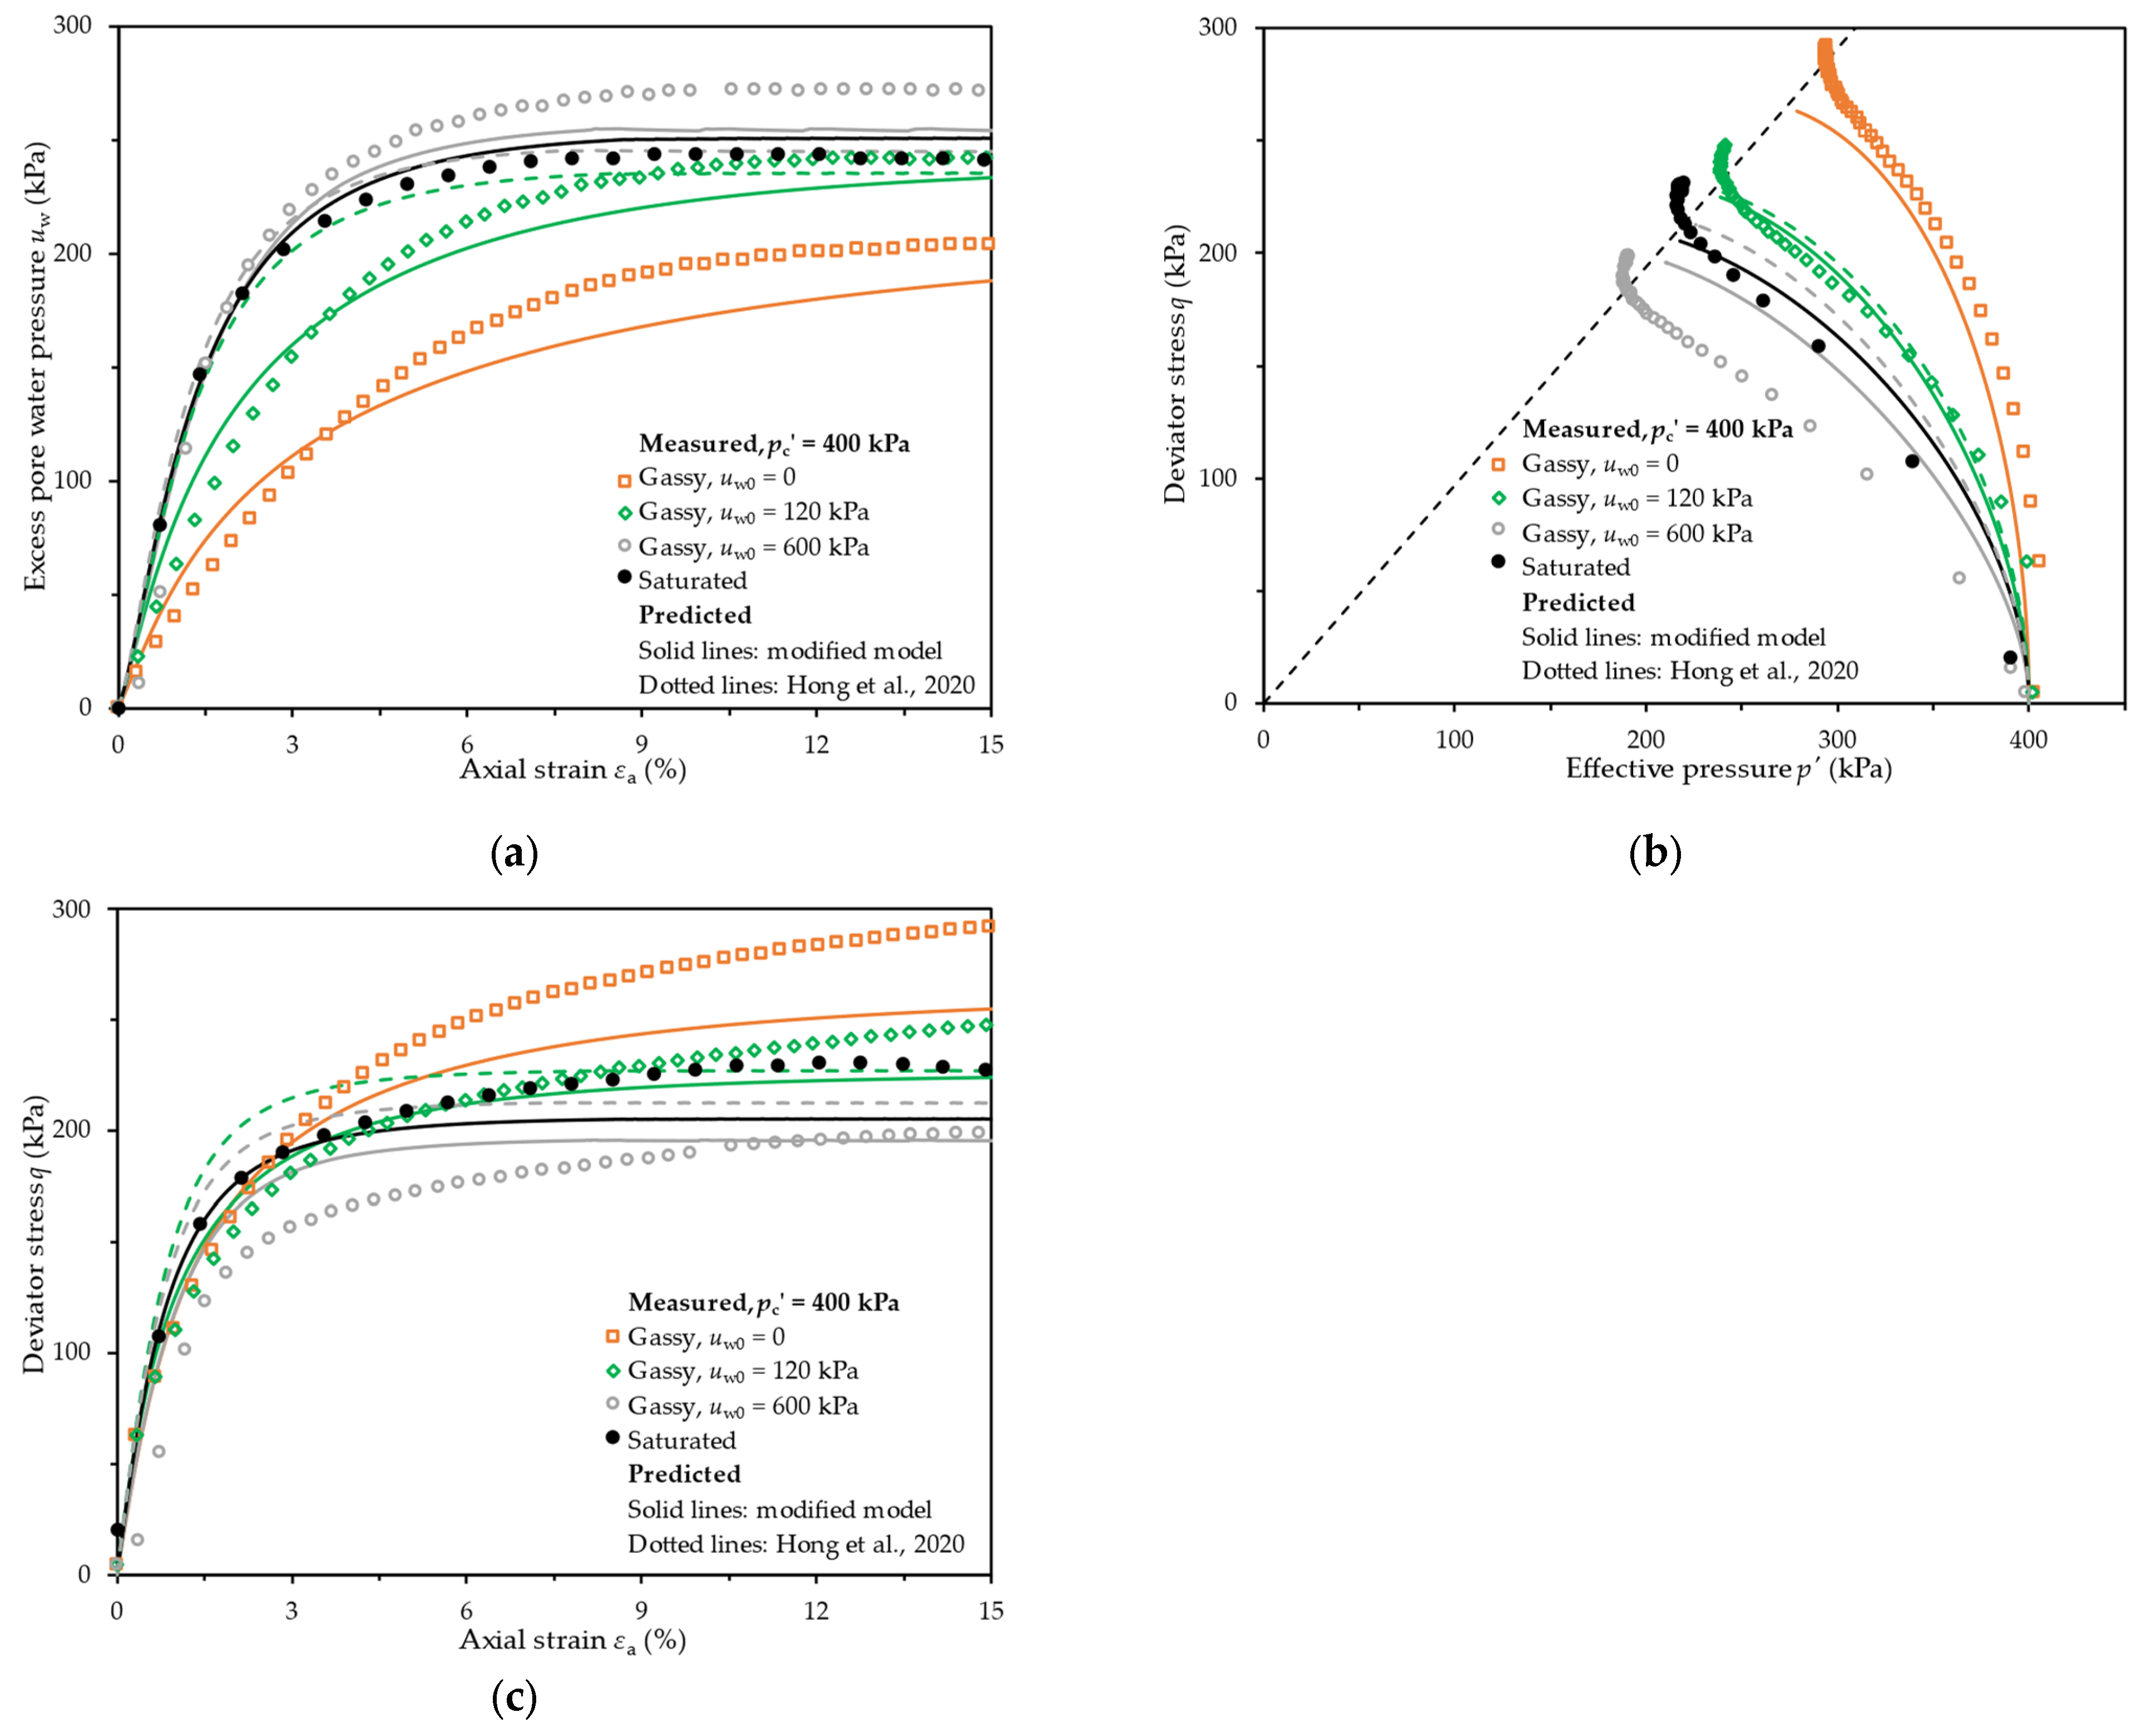
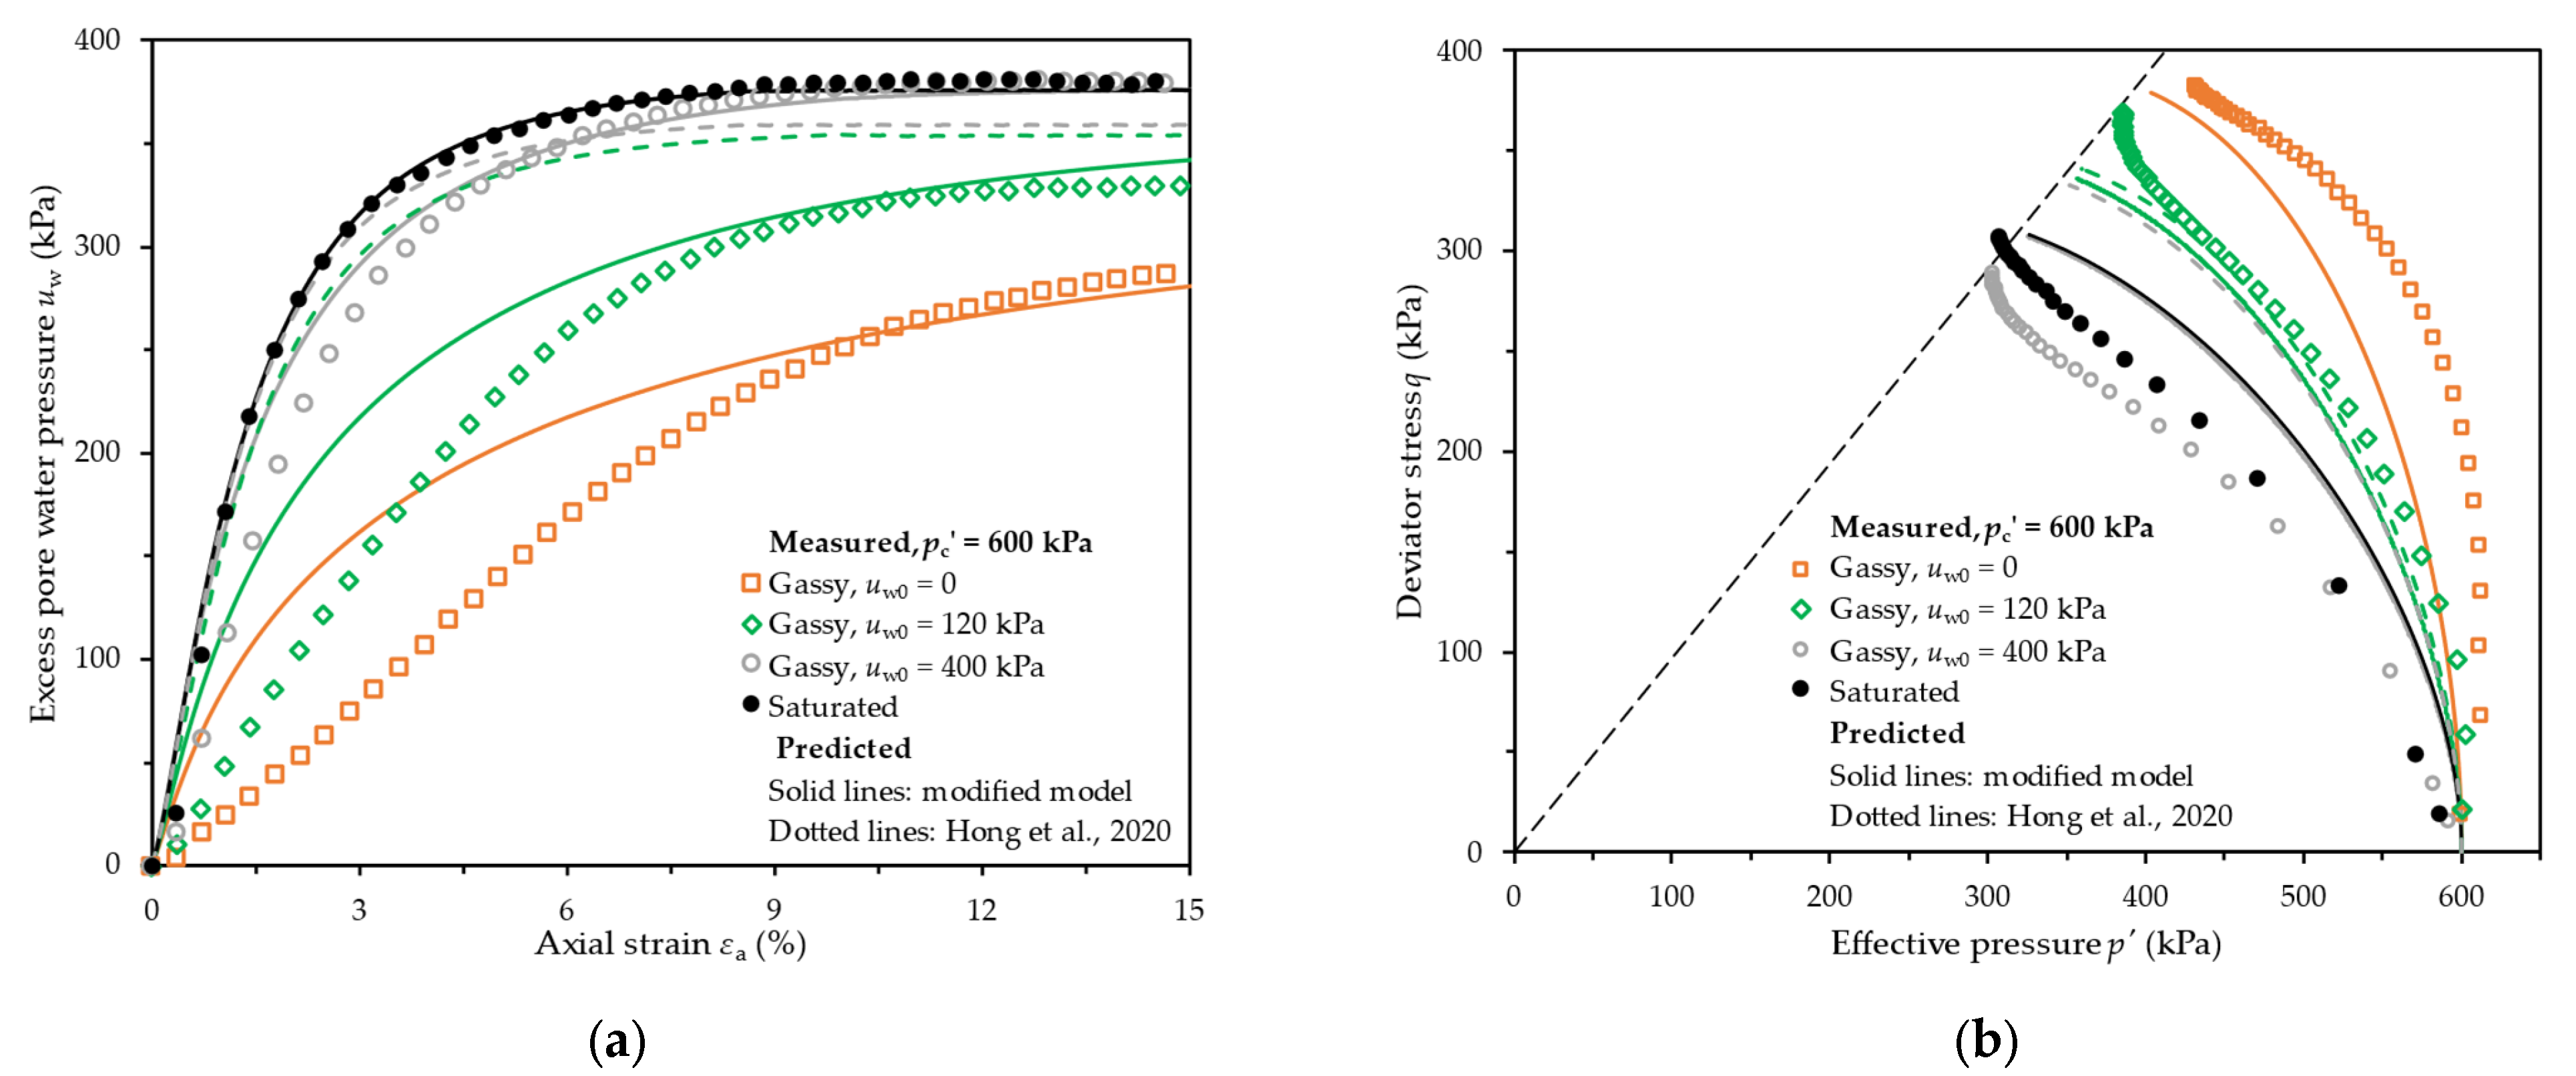
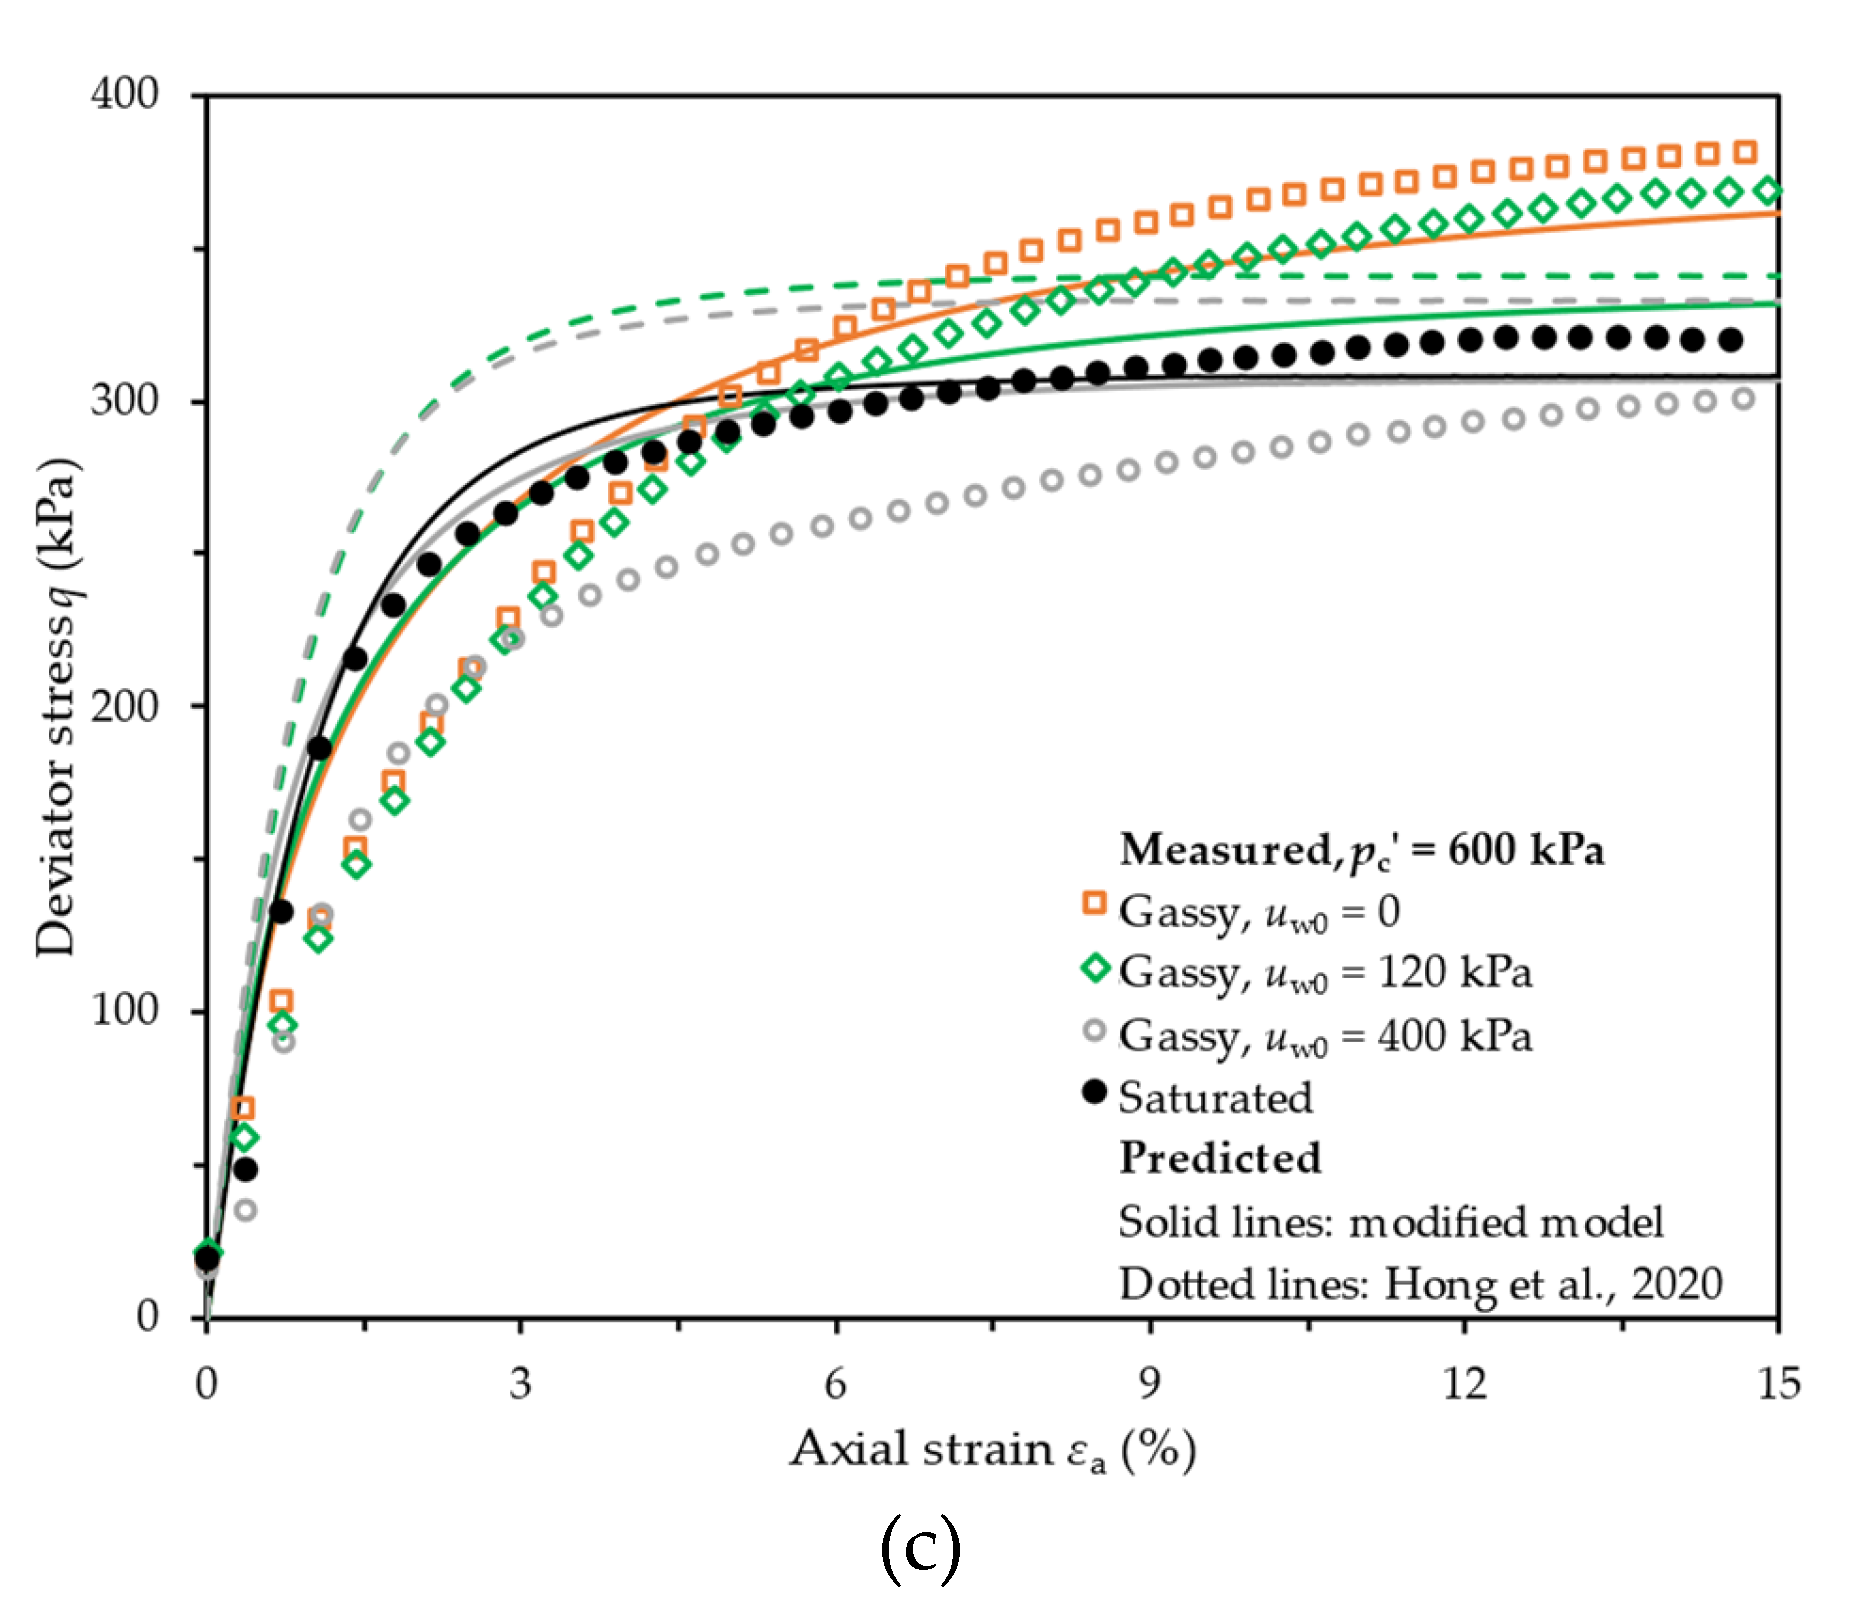
Figure 5, Figure 6 and Figure 7 compare the predictions of the developed model with our experimental data. For pc′ = 200 kPa, the model in [21] and the model developed show similar performances. For the tests with pc′ > 200 kPa, the predictions of the model developed are closer to the experimental date than those of the constitutive model in [21]. Taking the typical predicted results of pc′ equal to 400 kPa as an example, for the test with uw0 = 0, the model in [21] cannot predict the responses since there is no solution for Equation (6).
The measured and predicted excess pore water pressures are shown in Figure 6a. The gassy specimens exhibit greater excess pore water pressure with increasing uw0, and the rates of excess pore water pressure developed with axial strain are faster for a higher uw0. It is suggested that the presence of gas bubbles at higher uw0 levels causes the soil matrix to be more contractive. This phenomenon is better reflected by the hyperbolic tangent (tanh) function in Equation (4). Our predictions are in good agreement with the testing data with errors less than 10%, which is due to the fact that the dilatancy derived by Equation (4) is smaller than that of the model in [21] under the same uw0 and pc′. For pc′ = 600 kPa, the model developed underestimates the excess pore water pressure when uw0 = 400 kPa; this is due to the fact that μ is approaching its lowest value of 0.72.
The measured and predicted effective stress paths are compared in Figure 6b. The model developed is able to capture the directions at the beginning of the effective stress paths and the trend that the effective stress paths of gassy clay shrink with increasing uw0. The failure deviatoric stress is defined as the point where the effective stress path almost reaches the critical stress line in the q-p′ plane. The presence of gas bubbles causes the failure deviatoric stress to rise by 23% when uw0 = 0, while it decreases the failure deviatoric stress by 13% when uw0 = 600 kPa. It is suggested that the measured effective stress paths diverge by up to 46% for various uw0, whereas the maximum difference predicted by the model in [21] is only 5%. This difference predicted by Equation (9) approaches 31%. In addition, the model developed indicates that the failure deviatoric stress of gassy clay decreases with increasing uw0, and the divergence between the predicted and measured values is less than 11%. However, the deviatoric stress of gassy clay at failure is larger than the measured value when uw0 is high, as α is overestimated by Equation (8), and the size of the yield surface becomes larger.
The measured and predicted stress-strain curves are shown in Figure 6c. The predicted stress-strain curves predicted by the model developed match the observed response well at lower strain levels. However, there are some differences in the peak deviatoric stress values between the predicted and observed results. This is because the axial strain of specimens is different when they nearly approach the critical state; that is, the failure axial strain is different. The failure axial strain for saturated specimens is approximated as εa = 7%, while the failure axial strain of gassy specimens decreases with increasing uw0. The failure axial strain is 12% when uw0 = 0, while it decreases to 8% when uw0 increases to 600 kPa for gassy specimens. The damaging effect of gas bubbles on soil elastic stiffness is more noticeable with increasing pc′. However, this effect is not considered in this study, resulting in predicted stress-strain curves that are stiffer than the experimental observations at the initial stage, as shown in Figure 7c.

6. Results and Discussion

This study presents a series of triaxial tests on gassy specimens consolidated to different pc′ (200–600 kPa) and with a wide range of initial pore water pressure uw0 (0–600 kPa). Three benchmark tests on saturated specimens with pc′ = 200 kPa, 400 kPa, and 600 kPa were also carried out in this comparative study. The presence of gas bubbles has a damaging influence on soil at a relatively high uw0 (600 kPa), and vice versa. The excess pore water pressure of the gassy specimens is increasing with uwo, indicating distinct stress-dilatancy relations. The dilatancy functions used in the existing models for gassy clay cannot capture the effects of uw0 and A0 under pc′ > 200 kPa, and therefore a new dilatancy function is proposed. The function can be readily implemented into critical state models. Although the existing model can consider the detrimental effect of gas on the stress-strain behavior of gassy clay, the capacity to predict the strengthening effect still needs to improve for pc′ > 200 kPa. This is achieved by specifying the shape parameter μ to increase linearly with A0 rather than as a constant value. Compared with the original model, the total number of model parameters is increased by one, but the prediction ability of the undrained shearing response of gassy clay for pc′ > 200 kPa is obviously improved. The modified model should be implemented in open-source finite element software to solve real boundary value problems in the future, enabling the assessment of submarine landslides on the gassy seabed.

7. Conclusions

This paper updates an elastoplastic model of gassy clay to better present the undrained shear behavior under relatively high effective confining pressures. A critical state model proposed by Hong et al. [21] has shown potential for capturing both the beneficial and damaging effects of gas bubbles on clays. However, the stress-dilatancy and yield functions of the model have not been effectively validated due to a lack of sufficient experimental data for gassy soils. To address this, we conducted 15 well-designed triaxial tests on gassy kaolin and improved the model by updating the expressions of the stress-dilatancy function and yield surface. This function can describe stress-dilatancy relationships of both gassy and saturated clays, and the predicted dilatancy of gassy clays is no longer affected by the reference pore water pressure, which has a more reasonable physical meaning. The yield surface developed allows for more reasonable quantification of effective stress paths over a wide range of effective confining pressures and satisfies the mathematical requirements at low initial pore water pressure. In addition, the model developed is validated by the predictions of the conducted and published undrained triaxial tests. It is suggested that the predicted excess pore water pressures and effective stress paths by the model developed are in reasonable agreement with the experimental data.

Author Contributions

Conceptualization, D.W., T.A., and X.Y.; methodology, T.A.; software, D.W. and T.A.; validation, D.W., T.A., and X.Y.; formal analysis, T.A.; investigation, D.W., T.A., and X.Y.; data curation, T.A.; writing—original draft preparation, T.A.; writing—review and editing, D.W. and X.Y.; funding acquisition, D.W. All authors have read and agreed to the published version of the manuscript.

Funding

This research was funded by the National Natural Science Foundation of China, grant number No. 42025702.

Institutional Review Board Statement

Not applicable.

Informed Consent Statement

Not applicable.

Data Availability Statement

Not applicable.

Conflicts of Interest

The authors declare no conflict of interest.

Nomenclature

SymbolDefinition
SrWater saturation
ewWater void ratio
eTotal void ratio
AGas volume fraction
A0Initial gas volume fraction
uw0Initial pore water pressure
LLLiquid limit
PLPlastic limit
GsSpecific gravity
cvCoefficient of consolidation
pcEffective confining pressure
pMean effective stress
qDeviatoric stress
K, GElastic bulk and shear modulus of the soil matrix
α, μShape parameters of the yield surface
a, b, cParameters controlling the yield surface
DDilatancy
ξ, χ, m1, βParameters governing the stress-dilatancy
ηStress ratio
MStress ratio at critical state
λSlope of the virgin consolidation line
κSlope of the swelling line
d ε q ,   d ε q e ,   d ε q p Increment of total, elastic, and plastic deviatoric strain of the soil matrix, respectively.
d ε v ,   d ε v e ,   d ε v p Increment of total elastic and plastic volumetric strain of the soil matrix, respectively.
fYield function
K1, 2Constant of the yield function
uw0_refReference pore water pressure
eNIntercept of the virgin consolidation line
vPoisson’s ratio
εaAxial strain
uwExcess pore water pressure

References

  1. Floodgate, G.D.; Judd, A.G. The origins of shallow gas. Cont. Shelf Res. 1992, 12, 1145–1156. [Google Scholar] [CrossRef]
  2. Sultan, N.; De Gennaro, V.; Puech, A. Mechanical behaviour of gas–charged marine plastic sediments. Geotechnique 2012, 62, 751–766. [Google Scholar] [CrossRef]
  3. Claypool, G.E.; Kaplan, I.R. The origin and distribution of methane in marine sediments. In Natural Gases in Marine Sediments; I.R. Kaplan: New York, NY, USA, 1974; pp. 99–139. [Google Scholar]
  4. Grozic, J.L.; Robertson, P.K.; Morgenstern, N.R. Cyclic liquefaction of loose gassy sand. Can. Geotech. J. 2000, 37, 843–856. [Google Scholar] [CrossRef]
  5. Liu, T.; Yang, X.T.; Zhang, Y. A Review of Gassy Sediments: Mechanical Property, Disaster Simulation and In-Situ Test. Front. Earth Sci. 2022, 10, 915735. [Google Scholar] [CrossRef]
  6. Vega-Posada, C.A.; Finno, R.J.; Zapata-Medina, D.G. Effect of Gas on the Mechanical Behavior of Medium-Dense Sands. J. Geotech. Geoenviron. Eng. 2014, 140, 04014063. [Google Scholar] [CrossRef]
  7. Locat, J.; Lee, H.J. Submarine landslides: Advances and challenges. Can. Geotech. J. 2002, 39, 193–212. [Google Scholar] [CrossRef]
  8. Riboulot, V.; Cattaneo, A.; Sultan, N.; Garziglia, S.; Ker, S.; Imbert, P.; Voisset, M. Sea–level change and free gas occurrence influencing a submarine landslide and pockmark formation and distribution in deepwater Nigeria. Earth Planet Sci. Lett. 2013, 375, 78–91. [Google Scholar] [CrossRef]
  9. Jommi, C.; Muraro, S.; Trivellato, E.; Zwanenburg, C. Experimental results on the influence of gas on the mechanical response of peats. Geotechnique 2019, 69, 753–766. [Google Scholar] [CrossRef]
  10. Gao, Z.W.; Hong, Y.; Wang, L.Z. Constitutive modelling of fine-grained gassy soil: A composite approach. Int. J. Numer. Anal. Methods Geomech. 2020, 44, 1350–1368. [Google Scholar] [CrossRef]
  11. Hong, Y.; Wang, L.Z.; Ng, C.W.W.; Yang, B. Effect of initial pore pressure on undrained shear behaviour of fine–grained gassy soil. Can. Geotech. J. 2017, 54, 1592–1600. [Google Scholar] [CrossRef]
  12. Nageswaran, S. Effect of Gas Bubbles on the Seabed Behaviour. Ph.D. Thesis, St. Catherine’s College, Oxford University, Oxford, UK, 1983. [Google Scholar]
  13. Wheeler, S.J. The undrained shear strength of soils containing large gas bubbles. Geotechnique 1988, 38, 399–413. [Google Scholar] [CrossRef]
  14. Sills, G.C.; Wheeler, S.J.; Thomas, S.D.; Gardner, T.N. Behaviour of offshore soils containing gas bubbles. Geotechnique 1991, 41, 227–241. [Google Scholar] [CrossRef]
  15. Puzain, A.M.; Tront, J.; Schmid, A.; Hughes, J.B. Engineered use of microbial gas production to decrease primary consolidation settlement in clayey soils. Geotechnique 2011, 61, 785–794. [Google Scholar]
  16. Kaminski, P.; Urlaub, M.; Grabe, J.; Berndt, C. Geomechanical behaviour of gassy soils and implications for submarine slope stability: A literature analysis. Geol. Soc. Lond. Spec. Publ. 2020, 500, 277–288. [Google Scholar] [CrossRef]
  17. Pietruszczak, S.; Pande, G.N. Constitutive relations for partially saturated soils containing gas inclusions. Geotech. Eng. 1996, 122, 50–59. [Google Scholar] [CrossRef]
  18. Grozic, J.L.H.; Nadim, F.; Kvalstad, T.J. On the undrained shear strength of gassy clays. Comput Geotech. 2005, 32, 483–490. [Google Scholar] [CrossRef]
  19. Sultan, N.; Garziglia, S. Mechanical behaviour of gas–charged fine sediments: Model formulation and calibration. Geotechnique 2014, 64, 851–864. [Google Scholar] [CrossRef]
  20. Yang, G.; Bai, B. A thermodynamic model to simulate the thermo-mechanical behavior of fine-grained gassy soil. B Eng. Geol. Environ. 2020, 79, 2325–2339. [Google Scholar] [CrossRef]
  21. Hong, Y.; Wang, L.Z.; Zhang, J.F.; Gao, Z.W. 3D elastoplastic model for fine–grained gassy soil considering the gas–dependent yield surface shape and stress–dilatancy. J. Eng. Mech. 2020, 146, 04020037. [Google Scholar] [CrossRef]
  22. Best, A.I.; Tuffin, M.D.J.; Dix, J.K.; Bull, J.M. Tidal height and frequency dependence of acoustic velocity and attenuation in shallow gassy marine sediments. J. Geophys. Res. 2004, 109, B08101. [Google Scholar] [CrossRef]
  23. Yang, S.; Choi, J.C.; Vanneste, M.; Kvalstad, T. Effects of gas hydrates dissociation on clays and submarine slope stability. B Eng. Geol. Environ. 2018, 77, 941–952. [Google Scholar] [CrossRef]
  24. Ilyas, T.; Leung, C.F.; Chow, Y.K.; Budi, S.S. Centrifuge model study of laterally loaded pile groups in clay. J. Geotech. Geoenviron. 2004, 130, 274–283. [Google Scholar] [CrossRef]
  25. Wang, L.Z.; Lai, Y.Q.; Hong, Y.; Masin, D. A unified lateral soil reaction model for monopiles in soft clay considering various length–to–diameter (L/D) ratios. Ocean Eng. 2020, 212, 107492. [Google Scholar] [CrossRef]
  26. Xie, Y.; Leung, C.F.; Chow, Y.K. Centrifuge modelling of spudcan–pile interaction in soft clay. Geotechnique 2012, 62, 799–810. [Google Scholar] [CrossRef]
  27. BS 5930; Code of Practice for Site Investigations. British Standards Institution: London, UK, 2015.
  28. ASTM D2435-11; Standard Test Methods for One Dimensional Consolidation Properties of Soils Using Incremental Loading. ASTM International: West Conshohocken, PA, USA, 2011.
  29. ASTM D4767-11; Standard Test Method for Consolidated Undrained Triaxial Compression Test for Cohesive Soils. ASTM International: West Conshohocken, PA, USA, 2011.
  30. Wilkens, R.H.; Richardson, M.D. The influence of gas bubbles on sediment acoustic properties: In situ, laboratory, and theoretical results from Eckernforde Bay, Baltic sea. Cont. Shelf Res. 1998, 18, 1859. [Google Scholar] [CrossRef]
  31. Ng, C.W.W.; Zhan, L.T.; Cui, Y.J. A new simple system for measuring volume changes in unsaturated soils. Can. Geotech. J. 2002, 39, 757–764. [Google Scholar] [CrossRef]
  32. Rahman, M.A.; Shahin, H.M.; Nakai, T. Stress–strain–dilatancy relationships of normally consolidated dhaka clay. Int. J. Geomate. 2018, 15, 188–194. [Google Scholar] [CrossRef]
  33. Wheeler, S.J.; Näätänen, A.; Karstunen, M.; Lojander, M. An anisotropic elastoplastic model for soft clays. Can. Geotech J. 2003, 40, 403–418. [Google Scholar] [CrossRef]
  34. Wang, L.Z.; Yin, Z.Y. Stress dilatancy of natural soft clay under an undrained creep condition. Int. J. Geomech. 2015, 15, A4014002. [Google Scholar] [CrossRef]
  35. Sham, W.K. The Undrained Shear Strength of Soils Containing Large Gas Bubbles. Ph.D. Thesis, Department of Civil Engineering, Queen’s University, Belfast, UK, 1989. [Google Scholar]
  36. Lagioia, R.; Puzrin, A.M.; Potts, D.M. A new versatile expression for yield and plastic potential surfaces. Comput. Geotech. 1996, 19, 171–191. [Google Scholar] [CrossRef]
  37. Kaminski, P.; Sager, T.; Grabe, J.; Urlaub, M. A new methodology to assess the potential of conjectural trigger mechanisms of submarine landslides exemplified by marine gas occurrence on the Balearic Promontory. Eng. Geol. 2021, 295, 106446. [Google Scholar] [CrossRef]
  38. Weber, R.C.; Romero, E.; Lloret, A. Shear strength and yield surface of a partially saturated sandy silt under generalized stress states. Can. Geotech. J. 2022, 59, 1188–1204. [Google Scholar] [CrossRef]
  39. Oliynyk, K.; Ciantia, M.O.; Tamagnini, C. A finite deformation multiplicative plasticity model with non–local hardening for bonded geomaterials. Comput. Geotech. 2021, 137, 104209. [Google Scholar] [CrossRef]
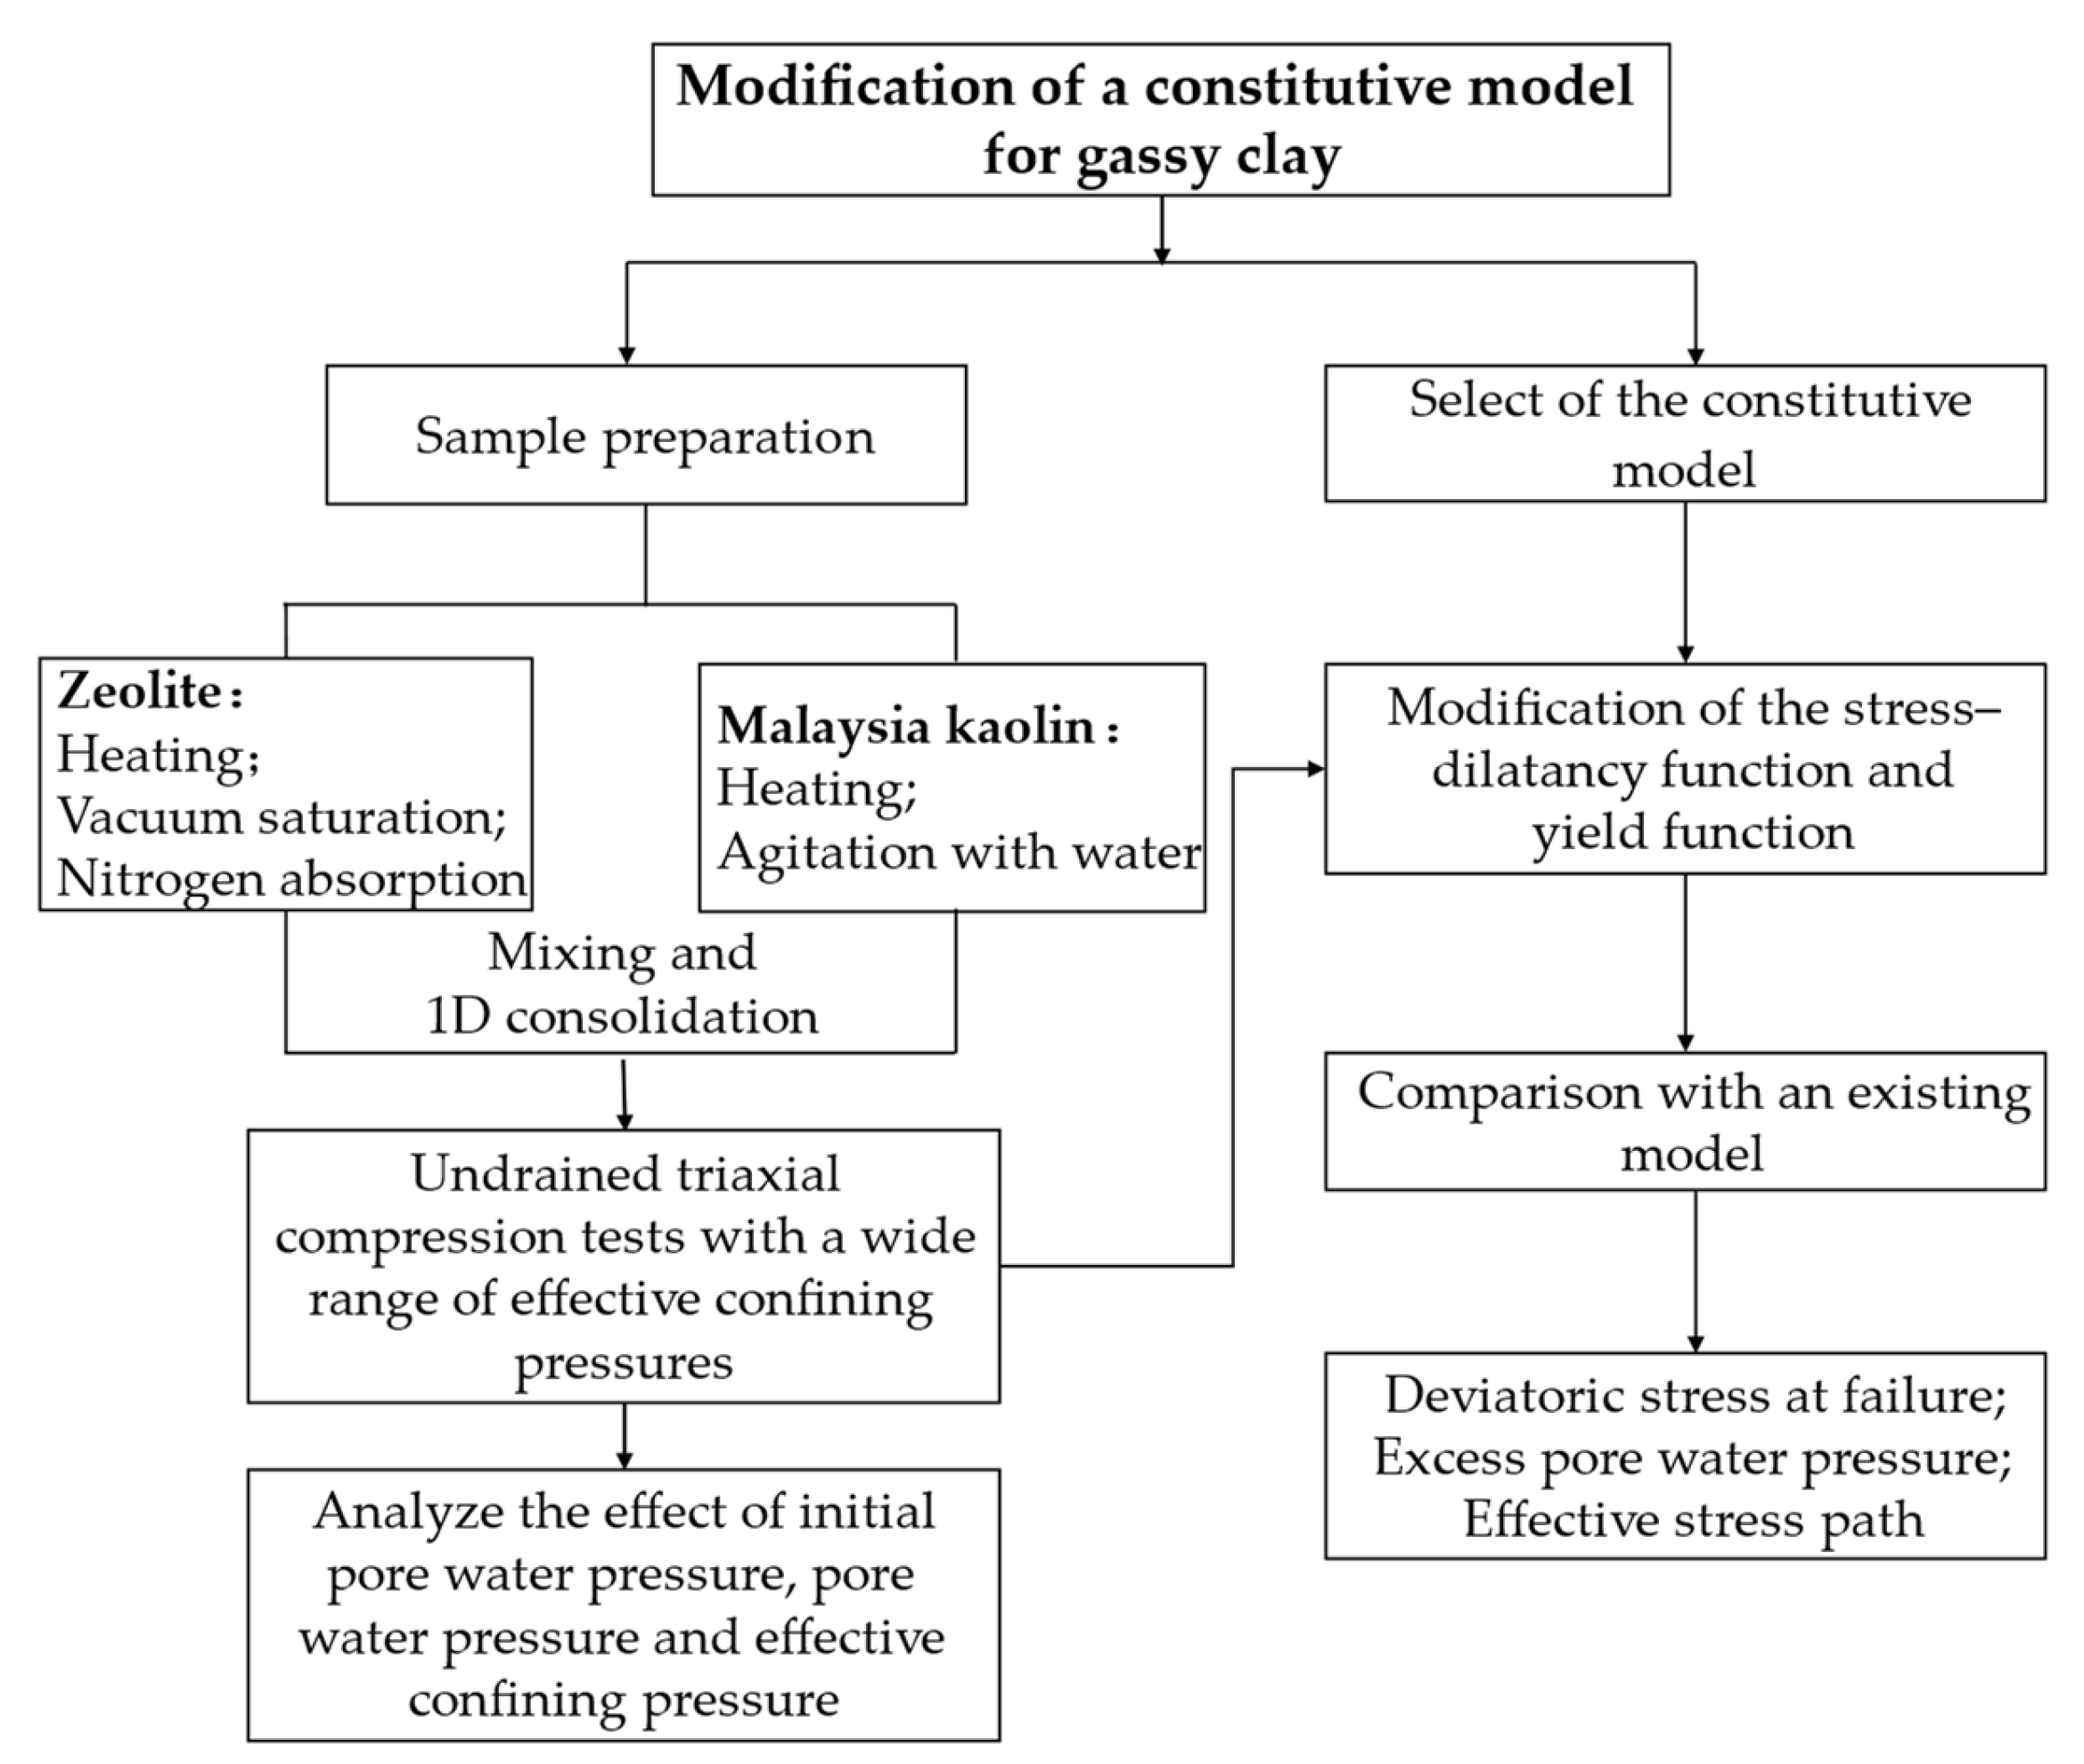
Figure 1. The logical flowchart of this study.
Jmse 11 01013 g001
Figure 2. Testing procedures: (a) zeolite charged with nitrogen; (b) Zeolite mixed with the kaolin slurry; (c) one–dimensional consolidation; and (d) a total volume change measuring system.
Jmse 11 01013 g002aJmse 11 01013 g002b
Figure 3. Measured and predicted dilatancies at pc′ = 400 kPa (dotted lines by [21]).
Jmse 11 01013 g003
Figure 4. Comparisons with the triaxial tests under pc′ = 200 kPa. Date after Hong et al. [21]: (a) excess pore water pressure; (b) effective stress path; and (c) stress-strain curve.
Jmse 11 01013 g004
Figure 5. The measured and predicted results of gassy clays with pc′ = 200 kPa: (a) excess pore water pressure; (b) effective stress path; and (c) stress-strain curve (dotted lines by [21]).
Jmse 11 01013 g005
Figure 6. The measured and predicted results of gassy clays with pc′ = 400 kPa: (a) excess pore water pressure; (b) effective stress path; and (c) stress-strain curve (dotted lines by [21]).
Jmse 11 01013 g006
Figure 7. The measured and predicted results of gassy clays with pc′ = 600 kPa: (a) excess pore water pressure; (b) effective stress path; and (c) stress-strain curve (dotted lines by [21]).
Jmse 11 01013 g007aJmse 11 01013 g007b
Table 1. Properties of Malaysian kaolin clay.
ParameterValue
Liquid limit, LL: %80
Plastic limit, PL: %35
Specific gravity, Gs2.60
Coefficient of consolidation (at 100 kPa), cv: m2/year 40
Table 2. Test conditions for triaxial compression.
Effective Confining Pressure, pc’: kPaInitial Pore Water
Pressure, uw0: kPa
Initial Water Void
Ratio, ew0
Initial Degree of
Saturation, Sr0: %
Initial Gas Volume
Fraction, A0: %
20000.9790.05.2
1201.0293.53.4
2501.1398.11.0
6001.1198.80.6
1.43100.00
40001.0489.25.8
1201.0994.13.2
2501.0496.71.7
6001.0898.60.7
0.93100.00
60000.8689.25.3
1200.9493.63.2
2501.0295.12.5
4001.0898.80.6
0.94100.00
Table 3. The constitutive equations of the model in [21].
DescriptionEquations
Elastic behavior d ε v e = d p K ;   d ε q e = d q 3 G
Yield function f = p p c ( 1 + η M K 2 ) K 2 ( 1 μ ) ( K 1 K 2 ) ( 1 + η M K 1 ) K 1 ( 1 μ ) ( K 1 K 2 ) = 0 ;   K 1 , 2 = μ ( 1 α ) 2 ( 1 μ ) ( 1 ± 1 4 α ( 1 μ ) μ ( 1 α 2 ) )
Dilatancy D = 1 + ξ u w 0 u w 0 _ ref p c exp χ A 0 M 2 η 2 2 η
Flow rule d ε v p = L f q D   ;   d ε q p = L f q
Hardening d p c = 1 + e w 0 λ κ p c d ε v p
Disclaimer/Publisher’s Note: The statements, opinions and data contained in all publications are solely those of the individual author(s) and contributor(s) and not of MDPI and/or the editor(s). MDPI and/or the editor(s) disclaim responsibility for any injury to people or property resulting from any ideas, methods, instructions or products referred to in the content.