Abstract
The present study aims to systematically investigate the effects of a high Reynolds number on the flow-induced motion and energy conversion of the Cir-T-Att oscillator. Experiments are conducted in six Reynolds number ranges (2.89 × 10⁴~6.51 × 10⁴ < Re < 7.71 × 10⁴~15.21 × 10⁴) in regimes of TrSL2, TrSL3 and TrBL0. The system total damping ratio (ζtotal) is adjusted by varying excitation voltages (VB) with a controllable magnetic damping system. The VB is varied from 0 V to 165 V, corresponding to 0.082 ≤ ζtotal ≤ 1.153. The amplitude, frequency, fluid force, spectral content, active power, and upper limit of power output are analyzed. The results show that the Reynolds number affects both amplitude and global response characteristics. The active power increases with an increasing Reynolds number within the upper branch. The maximum power output of the Cir-T-Att oscillator reaches 10.43 W, appearing at Re = 14.67 × 10⁴ (D = 0.16 m, ζtotal = 0.468, Ur = 6.34), while the maximum upper limit of power output is 17.80 W at Re = 15.21 × 10⁴ (D = 0.16 m, ζtotal = 0.678, Ur = 6.57).
1. Introduction
In recent years, to realize carbon neutrality, energy savings, and emission reduction have remained a critical research hotspot [1]. Researchers aim at harvesting green energy from nature so as to achieve the adjustment of energy structure [2]. However, as a renewable resource with abundant reserves in the environment, water resources still have great development value [3,4,5,6,7], such as harvesting energy from flow induced motions [8]. Previous research has focused on adopting oscillators with various sections [9,10,11,12], employing mechanical non-linearities [13], or basing on different energy conversion principles (electromagnetic [14], piezoelectric [15], and so on) to improve the energy conversion ability [16]. The relevant reviews systematically introduced more developments [2,17].
Despite large progress on the flow-induced motion energy conversion system (FIMECS), few researchers have systematically studied the influence of the Reynolds number (Re = ρ·U·D/μ, ρ is the fluid density, U is the current velocity, D is the characteristic width, and μ is the viscosity) on energy conversion in laboratory tests. Over a long period of time, due to the limitations of material strength and test equipment condition, studies on flow-induced motion at a high Reynolds number have been very scarce, with research mainly measuring the Strouhal number of the stationary cylinder [17]. The influence of Reynolds number on flow-induced vibration of a cylinder is regarded as weak in early research. As reviewed by Govardhan and Williamson [18], the effect of Reynolds number on vibration response has been revealed by many scholars at a low Reynolds number regime. Additionally, many researchers have carried out a lot of research on flow-induced vibration of cylinders in the high Reynolds number range during the past decade [19,20,21] and found that the Reynolds number range has a significant impact on the range and amplitude of the synchronous range. In addition, Prassath et al. [22] applied a cartesian grid to simulate the wake flow features of a triangular prism with different slenderness ratios and different directions of incoming flow under a low Reynolds number regime and successfully predicted the critical Reynolds numbers when the triangular prism began to shed a vortex under different conditions. Subsequently, Tu et al. [23] have simulated the wake patterns of stationary regular triangular prism under different Reynolds numbers and different attack angles; also, the wake patterns of rotating regular prism under different attack angles, Reynolds numbers, aptitudes, and rotation frequencies are investigated, and the Reynolds number affects the wake morphology and lift coefficient of the prism significantly. The effect of Reynolds number on the flow-induced motion of the non-circular cylinders and the rounded flowing pattern is significant.
According to the fluid characteristics of the separated shear layer and the near-surface boundary layer of the cylinder, Zdravkovich et al. [24] and Bearman et al. [25] classified the flow pattern around the smooth cylinder into 15 flow zones. When 1 × 10³ < Re < 1 × 10⁴ (TrSL1, TrSL2), the lift coefficient of the cylinder is small, but with the increase of Re, the lift coefficient increases rapidly. When 1 × 10⁴ < Re < 1 × 10⁵, the wake flow pattern is located at the end of TrSL2, and in TrSL3, a platform appears in the lift curve of the cylinder at this time. When Re increases to 1 × 10⁵ ~ 1 × 10⁶, the wake flow pattern is located in the TrBL regime, and the lift curve of the cylinder changes sharply, which is corresponding to the transition of the boundary layer, and the turbulent boundary layer increases the stress in the wake. As noticed by Unal et al. [26], the lifting force on the cylinder is closely related to the magnitude of the velocity fluctuation in the shear layer. Additionally, the wake flow characteristics of the cylinder are affected by the roughness of the cylinder surface [27]. As seen from Chang et al. [28] and Park et al. [29], the boundary layer transition can be effectively triggered by installing rough attachments on the symmetric position on the surface of a smooth cylinder, that is, in the range of subcritical (laminar) Reynolds numbers, the fluid will show the flow characteristics of supercritical (turbulent) flow.
As summarized above, it can be seen that both the flow-induced motion of circular cylinders and non-circular cylinders are sensitive to the effect of Reynolds number; the summary of a representative investigation of Reynolds number effect on vortex induced vibration is summarized in Table 1. So far, the studies of the flow regime around a circular cylinder are relatively complete at different Reynolds numbers, while the understanding of the wake pattern and vibration response of noncylinders in different Re number ranges is far from systematic and in-depth. Meanwhile, in our previous studies on different combined cross sections [30], we found that the Cir-T-Att oscillator has a great advantage in flow-induced motion energy harvesting, so this study is related to the Cir-T-Att oscillator under different Reynolds numbers. In the present study, experiments are conducted in a recirculating water channel, and the controllable magnetic damping system is applied to examine the effect of system damping on the output power and system efficiency under different Reynolds numbers.

Table 1.
Representative studies.
In the present study, the experimental setup and the mathematical relations of the FIMECS are presented in Section 2. In Section 2.3, the validation of the physical model is briefly described. Section 3 illustrates the results and discussion of FIMECS under different Reynolds number ranges. In Section 3.1, the response of amplitude and frequency under different Reynolds numbers is presented and discussed. Section 3.2 and Section 3.3, respectively, give the effects of the Reynolds number on the fluid force and spectral content of the Cir-T-Att oscillator. Additionally, the active power and the upper limit of power output are analyzed to reveal the Reynolds number effect on the levels of the harvested power in Section 3.4 and Section 3.5. Finally, the main conclusions are mentioned in Section 4.
2. Experimental Setup
2.1. Test Apparatus and Method
The experiment was conducted in the State Key Laboratory in the Hydraulic Engineering Simulation and Safety Testing Hall at Tianjin University. As shown in Figure 1, the test system is composed of an open horizontal circulation channel, a supplement tank, the power part, the control section, and the test device of flow-induced motion and energy conversion system. The total length of the flow channel is about 50 m. It has a 2-m-wide channel section, a curved channel section, a contraction channel section, and a 1-m-wide channel section along the flow direction. At the same time, the channel wall is made of transparent glass, which allows for complete visualization of the flow and test section. The power part applies a large frequency conversion tubular pump to promote water movement, and the power of the power pump can be up to 90 kW. The size of the makeshift water tank is 5 m × 5 m × 2 m, with a water storage capacity of about 200 m3. The control box mainly uses the frequency converter to adjust the pump speed and control the outflow speed. The frequency conversion range of the frequency converter is 0.0~50.0 Hz. The test device for flow-induced motion and the energy conversion system is arranged in a 1-m-wide channel section, the water depth is controlled at 1.34 m, and the incoming flow velocity is 0~2 m/s.
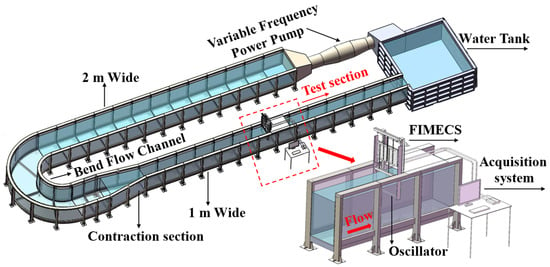
Figure 1.
Layout of experiment.
The principle of FIMECS is shown in Figure 2. It is composed of an oscillation part, a transmission part, and a power take-off part [33]. The model of FIMECS considered in this study includes the coupling effects of water flow, generator, and resistance. We simplified it as a mass-stiffness-damping model. The incoming fluid flows vertically to the oscillator, and because the oscillator is subject to the lateral limit, it can only vibrate transversely with a single degree of freedom under the action of the flow force. Then its motion can be approximated by the linear dynamic Equation (1). Then, the movement of the oscillator drives the rotor movement of the generator through the transmission part, and the kinetic energy of the fluid is converted into electrical energy. Moreover, the magnetic flux density of the generator can be changed by an external excitation voltage. Finally, the generated electric energy is supplied to the internal R0 loss of the generator and the power consumption of the external load RL.
where mosc is the oscillation mass, ma is the added water mass, and y, , and are the displacement, velocity, and acceleration of the oscillator, respectively. ctotal is the total damping, K is the system stiffness, and FL is the fluid force in the transverse direction.
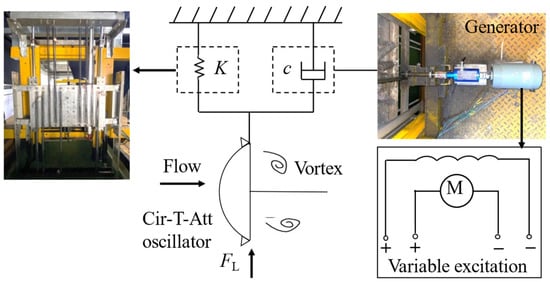
Figure 2.
Layout of experiment.
During the test, the displacement of the oscillator is measured by a magnetic induction displacement transducer; the testing range is 0–800 mm; the sensitivity is 0.1%; and the accuracy is ±0.05% under full scale. The amplitude A is the average of all amplitudes in a time series of displacements measured in 60 s. The amplitude ratio A* is the ratio of amplitude and diameter (A* = A/D), and the maximum error of A* is ±0.004. The f* is the frequency ratio (f* = fosc/fn,air), fosc is the main frequency of oscillation obtained from the displacement time-history curves by the FFT method, and fn,air is the natural frequency in air.
To calculate the lift coefficient cL(t), the torque at the end of the transmission part is measured by the HCNJ-103 torque sensor. The testing range is 0~2 Nm, the accuracy is 0.5%, and the maximum error of FT is less than ±0.3333 N. The cL(t) is shown in Equation (2).
where T(t) and Rm (0.03 m) are the torque and the gear radius at the end of the transmission part, respectively, and c is the mechanical damping.
The active power is calculated by Equation (3), and the upper limit of power for FIMECS can be expressed by Equation (5). The voltage variation of the external resistance is collected in real time; the measurement range is from −10 V to +10 V with accuracy within ±0.1% FS. The maximum error of Pharn is less than ±0.0026 W.
2.2. Test Condition
In the present study, we focus on investigating the influence of Reynolds number on the FIMECS with the Cir-T-Att oscillator; therefore, the total system mass, the system stiffness, and the length L of the Cir-T-Att oscillator in different Re ranges are controlled to be the same. Referring to the methods of previous representative studies [21], different Reynolds numbers are achieved by changing the characteristic width of the oscillator D. The oscillator model is shown in Figure 3, and the relevant parameters are shown in Table 2.

Figure 3.
Physical model of the Cir-T-Att oscillator.

Table 2.
Test condition.
All oscillators were 0.9 m long and made of polymethyl methacrylate. Considering the boundary effect zone, two end plates are set at both ends of the oscillator, and the thickness of the end plate is designed as δ = 0.01 m. Model diameters are 0.06, 0.08, 0.10, 0.12, 0.14, and 0.16 m. As referred to in the flow regime classification by Zdravkovich et al. [25], the test range is in the TrSL2, TrSL3, and TrBL0 regimes.
2.3. Validation of Physical Model
In this section, repeated free decay tests are conducted to obtain the natural frequencies of FIMECS in air and water under different system damping. To ensure the natural frequencies of FIMECS with different characteristic width oscillators are identical, various weights are added or reduced to the FIMECS. The total damping ratio ζtotal, the oscillation mass mosc, the additional water mass ma, and the total damping ctotal are derived as Equations (6)–(9), respectively. The results of the free decay test in air for different characteristic width oscillators are similar, so the detailed results of D = 0.06 m are listed in Table 3 as representative. The results of free decay tests in the water are listed in Table 4. The results illustrate that fn,a and mosc almost remain unchanged under different system damping, with mosc = 43.635 kg, fn,a = 1.03 Hz, and the mechanical damping coefficient c = 47.068 N·s/m.
where fn,w is the natural frequency of the oscillator in water.

Table 3.
Results of free decay tests in the air (D = 0.06 m).

Table 4.
Results of free decay tests in the water.
The calculated total damping ctotal-calculated is calculated by (Equation (10)).
The error between the calculated total damping and the tested total damping is shown in Figure 4. The physical model is in good agreement with the mathematical relations, with almost no deviations higher than 5%. The reason for the deviations between ctotal-tested and ctotal-calculated may be the error of the instrument.
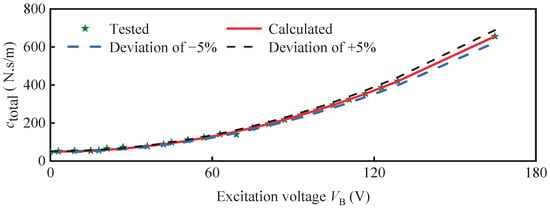
Figure 4.
Deviations of the tested total damping with the calculated total damping.
3. Results and Discussion
Five aspects of energy conversion from flow induced motion are studied to evaluate the effect of Reynolds number on them in this part. To clearly observe rules, we select only 5 typical curves for each oscillator that are not under adjacent conditions to illustrate. On account of oscillation stability and intensity for an oscillator with different characteristic widths, the upper limit of the total damping ratio ζtotal and the current velocity U were reasonably adjusted.
3.1. Influence of Re on Oscillation Response
As shown in Figure 5, Figure 6, Figure 7, Figure 8, Figure 9 and Figure 10, A* and f* versus current velocity (U), reduced velocity (Ur), and Reynolds number (Re) under different ζtotal values for each oscillator are presented. For D = 0.06 m, when ζtotal over 0.122, the oscillation cannot keep itself stable. While for D = 0.08 m, D = 0.10 m, D = 0.12 m, D = 0.14 m, and D = 0.16 m, the maximum system total damping ζtotal,max of different oscillators can overcome is 0.152, 0.246, 0.423, 1.158, and 0.678 respectively. It is noticed that the ζtotal,max increases with an increase the Reynolds number from D = 0.06 m to D = 0.14 m. However, when D is over 0.14, the ζtotal,max decreases, and it may be that the large characteristic width causes an excessive blocking ratio, which leads to the water surface being largely deformed by the oscillator and the oscillation stability and intensity are affected by it. In this study, the maximum system total damping ζtotal,max of different oscillators can overcome is considered the maximum ζtotal until the oscillation cannot keep itself stable.
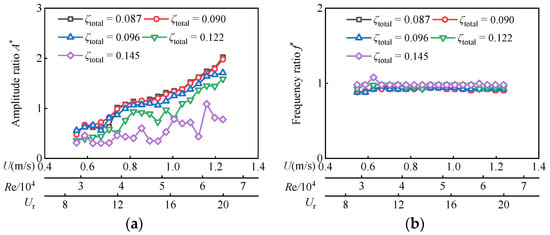
Figure 5.
FIM of Cir-T-Att with D = 0.06 m, Re = 2.89 × 10⁴~6.51 × 10⁴. (a) Amplitude ratio. (b) Frequency ratio.
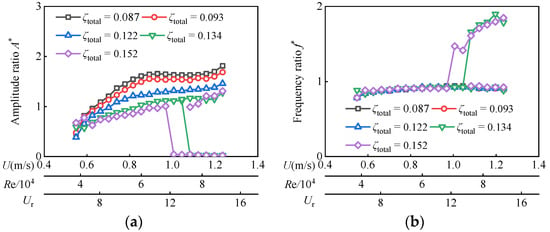
Figure 6.
FIM of Cir-T-Att with D = 0.08 m, Re = 3.86 × 10⁴~8.67 × 10⁴. (a) Amplitude ratio. (b) Frequency ratio.
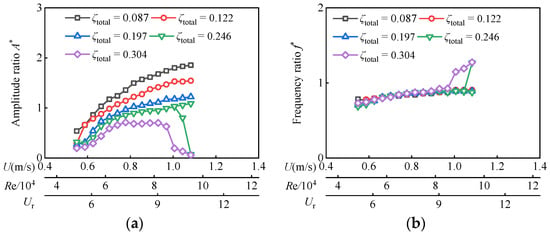
Figure 7.
FIM of Cir-T-Att with D = 0.10 m, Re = 4.82 × 10⁴~9.50 × 10⁴. (a) Amplitude ratio. (b) Frequency ratio.
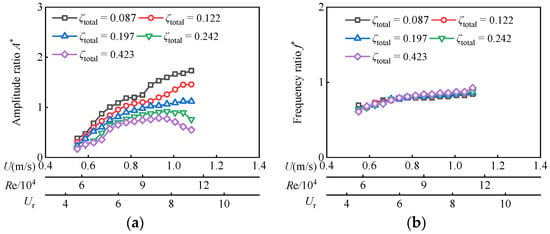
Figure 8.
FIM of Cir-T-Att with D = 0.12 m, Re = 5.79 × 10⁴~1.38 × 10⁵. (a) Amplitude ratio. (b) Frequency ratio.
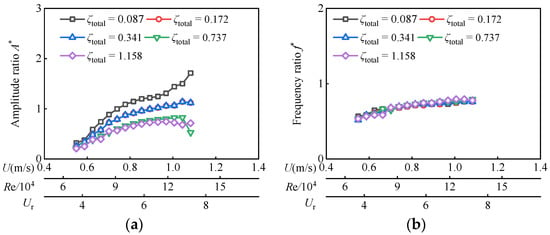
Figure 9.
FIM of Cir-T-Att with D = 0.14 m, Re = 6.75 × 10⁴~1.61 × 10⁵. (a) Amplitude ratio. (b) Frequency ratio.
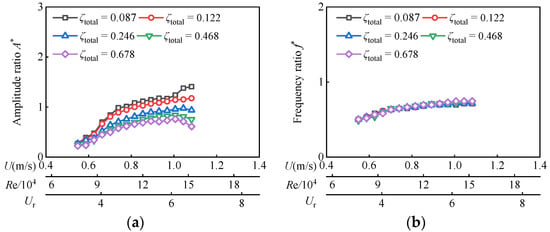
Figure 10.
FIM of Cir-T-Att with D = 0.16 m, Re = 7.71 × 10⁴~1.84 × 10⁵. (a) Amplitude ratio. (b) Frequency ratio.
In Figure 5, the current velocity U is from 0.55 m/s to 1.24 m/s, the reduced velocity Ur ranges from 8.89 to 19.98, and the corresponding Reynolds number Re varies from 2.89 × 10⁴ to 6.51 × 10⁴ for D = 0.06 m. In this Reynolds number range, as ζtotal ≤ 0.122, A* overall trend continues to increase, while f* tends to stabilize at about 0.9. With the increase in Reynolds number, the oscillator successively enters VIV branches and VIV-Galloping transition branches, but galloping branches are not fully developed. The maximum amplitude ratio A*max is 2.02 and appears at Re = 6.51 × 10⁴ (Ur = 19.98) with ζtotal = 0.087.
As shown in Figure 6, the current velocity U is from 0.55 m/s to 1.24 m/s, the reduced velocity Ur ranges from 6.67 to 14.99, and the corresponding Reynolds number Re varies from 3.86 × 10⁴ to 8.67 × 10⁴ for D = 0.08 m. When ζtotal < 0.134, the oscillation undergoes an SG trend, but galloping branches are not clearly observed. As Re increases, A* first increases and then tends to stabilize with a slight increase, and f* levels at approximately 0.9, indicating that the oscillator is in VIV initial branches and VIV upper branches. While the oscillation undergoes a HG trend when 0.134 ≤ ζtotal ≤ 0.152, as Re increases, the oscillator enters VIV initial branches, VIV upper branches, and VIV lower branches in turn. However, the VIV lower branches can be induced to galloping branches with an external excitation. The maximum amplitude ratio A*max is 1.81, appearing at Re = 8.67 × 10⁴ (Ur = 14.99) with ζtotal = 0.087. In Figure 7, the current velocity U is from 0.55 m/s to 1.08 m/s, the reduced velocity Ur ranges from 5.33 to 10.51, and the corresponding Reynolds number Re varies from 4.82×10⁴ to 9.50 × 10⁴ for D = 0.10 m. The oscillation response is similar to that of D = 0.08 m, but when ζtotal exceeds 0.246, the VIV lower branches cannot be pushed into the galloping branch. The maximum amplitude ratio A*max is 1.86, appearing at Re = 9.5 × 10⁴ (Ur = 10.51) with ζtotal = 0.087.
Then, for D = 0.12 m, as shown in Figure 8, the current velocity U is from 0.55 m/s to 1.08 m/s, the reduced velocity Ur varies from 4.44 to 8.76, and the corresponding Reynolds number ranges from 5.79 × 10⁴ to 11.41 × 10⁴. With the increase of Re, A* first increases, then tends to sable with a slight fluctuation, and f* also shows an increase, then tends to sable around 0.9, indicating that the oscillation is in the VIV branch. The maximum amplitude ratio A*max is 1.73, appearing at Re = 11.41 × 10⁴ (Ur = 8.76) with ζtotal = 0.087. As shown in Figure 9 and Figure 10, the oscillation character of D = 0.14 m and D = 0.16 m is similar to that of D = 0.12 m. For D = 0.14 m, the current velocity U is ranges from 0.55 m/s to 1.08 m/s, the reduced velocity Ur varies from 3.81 to 7.51 and corresponding Reynolds number from 6.75 × 10⁴ to 13.31 × 10⁴, its A*max is 1.71 appears at Re = 13.31 × 10⁴ (Ur = 7.51) with ζtotal = 0.087. While for D = 0.16 m, the current velocity U ranges from 0.55 m/s to 1.08 m/s, the reduced velocity Ur varies from 3.33 to 6.57 and the corresponding Reynolds number from 7.71 × 10⁴ to 15.21 × 10⁴, its A*max is 1.41 and appears at Re = 15.21 × 10⁴ (Ur = 6.57) with ζtotal = 0.087. From our experiments, the Reynolds number has a strong influence on the oscillation response; as Re increases, the oscillation intensity and the VIV upper branch range increase.
3.2. Effect of Re on Fluid Force
As shown in Figure 11a–f, variations of the lift coefficient CL with the Reynolds number Re and total damping ratio ζtotal are illustrated. For D = 0.06 m, CL shows an increasing trend with the increase of Re in the VIV branches. As Re keeps on increasing, CL shows a decreasing trend in the VIV-Galloping transition branches. It may be because, with the increase in attack angle α, CL increases before the fluid boundary layer is separated. The angle of attack continues to increase, until it exceeds the critical value.
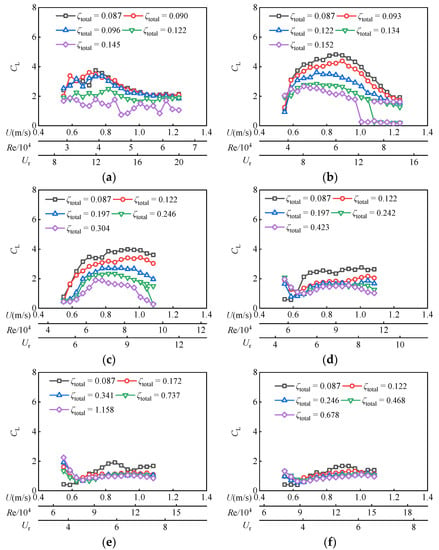
Figure 11.
Fluid force of Cir-T-Att. (a) D = 0.06 m, Re = 2.89 × 10⁴ ~ 6.51 × 10⁴. (b) D = 0.08 m, Re = 3.86 × 10⁴~8.67 × 10⁴. (c) D = 0.10 m, Re = 4.82 × 10⁴~9.48 × 10⁵. (d) D = 0.12 m, Re = 5.79 × 10⁴~1.14 × 10⁵. (e) D = 0.14 m, Re = 6.75 × 10⁴~1.33 × 10⁵. (f) D = 0.16 m, 7.71 × 10⁴~1.52 × 10⁵.
However, when α continues to increase until the fluid boundary layer separates, CL shows a decreasing trend with the increase of Re, leading to oscillator stall, as will be further discussed in the spectrum part. For D = 0.08 m, the oscillation undergoes the SG trend when ζtotal ≤ 0.134, CL first tends to stabilize along with a slightly increasing trend, then decreases, indicating that the oscillation is transitioning from the VIV upper branch to the VIV-Galloping transition branches. However, the oscillation undergoes a HG trend when 0.134 ≤ ζtotal ≤ 0.152, CL suddenly collapses to 0 when the oscillation undergoes into the VIV lower branches. It may be because in the VIV lower branches, the oscillation cannot induce or keep vortex shedding stable.
Additionally, for D = 0.10 m, the CL character is similar to that of D = 0.08 m. However, the CL first increases, then tends to stabilize along with a slightly increasing trend, finally decreasing, which compared with D = 0.08 m, contains the initial branch. This inconsistency may be because the starting reduced velocity of D = 0.10 is lower than that of D = 0.08 m as Re increases. For D = 0.12 m, when Ur is relatively small, the CL shows a fluctuating trend. This may be because the vortices and vertex shedding cannot generate, and the force on the oscillator surface is unstable. As Ur continues to increase, the CL increases steadily, which is because the oscillator is only driven by the lift caused by vortex shedding in the VIV branches. The performance of D = 0.14 m and D = 0.16 m is similar to that of D = 0.12 m, and the lift coefficients strongly depend on reduced velocity in the TrSL3 and TrBL0 flow regimes (D = 0.12 m, D = 0.14 m, and D = 0.16 m).
3.3. Spectral Content Dependence on Re
To study the influence of Re on the growth of harmonic components, the displacement and fluid force spectra of the system damping ratio ζtotal = 0.087 are discussed in detail as a typical example. As shown in Figure 12, Figure 13, Figure 14, Figure 15, Figure 16 and Figure 17, compared with the higher harmonic component in the force spectrum, that of the displacement spectrum has less influence. Higher harmonics are observed at higher Re, and the high amplitudes occurred in the VIV upper branch, which may be because the wake structure is restructuring itself.
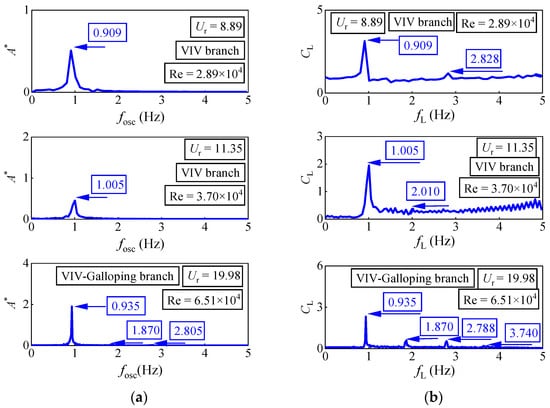
Figure 12.
Spectral of Cir-T-Att with D = 0.06 m, Re = 2.89 × 10⁴~6.51 × 10⁴. (a) Displacement spectral. (b) Fluid force spectral.
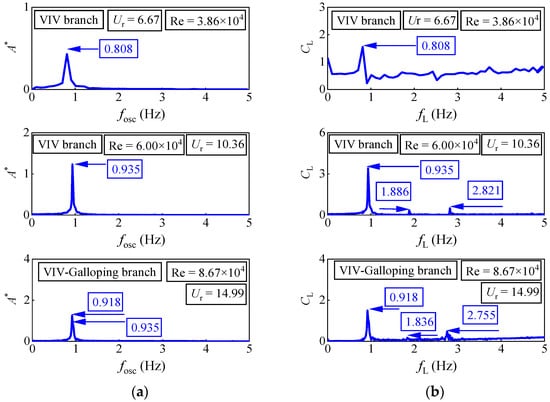
Figure 13.
Spectral of Cir-T-Att with D = 0.08 m, Re = 3.86 × 10⁴~9.21 × 10⁴. (a) Displacement spectral. (b) Fluid force spectral.

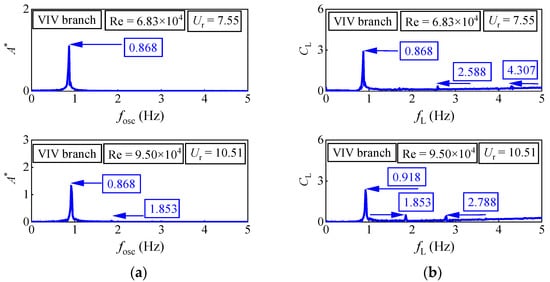
Figure 14.
Spectral of Cir-T-Att with D = 0.10 m, Re = 4.82 × 10⁴~1.15 × 10⁵. (a) Displacement spectral. (b) Fluid force spectral.
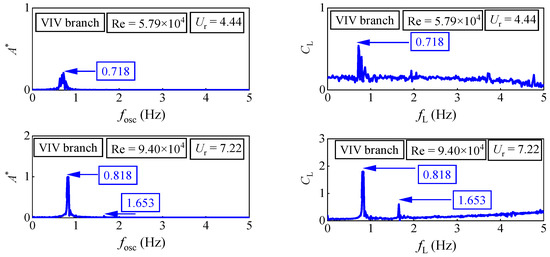

Figure 15.
Spectral of Cir-T-Att with D = 0.12 m, Re = 5.79 × 10⁴~1.38 × 10⁵. (a) Displacement spectral. (b) Fluid force spectral.
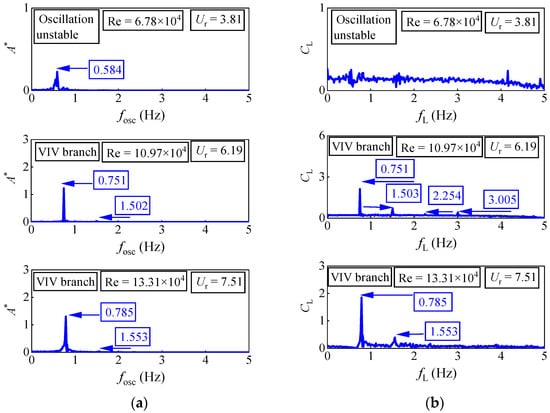
Figure 16.
Spectral of Cir-T-Att with D = 0.14 m, Re = 6.75 × 10⁴~1.61 × 10⁵. (a) Displacement spectral. (b) Fluid force spectral.
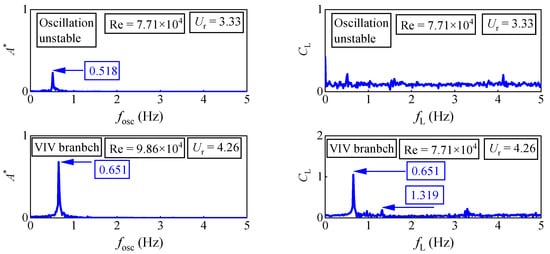

Figure 17.
Spectral of Cir-T-Att with D = 0.16 m, Re = 7.71 × 10⁴~1.84 × 10⁵. (a) Displacement spectral. (b) Fluid force spectral.
The spectral content of six oscillators under three different reduced velocities Ur is observed: For D = 0.06 m, the Re = 2.89 × 10⁴ (Ur = 8.89) is in the VIV branch. There is a prominent peak (fosc = 0.909 Hz) at the first harmonic component of the oscillation frequency. Additionally, in the fluid force spectra, two peaks, fL = 0.929 Hz and fL = 2.828 Hz, are observed at the first harmonic component and the third harmonic component, respectively. In the second range, the Re = 3.70 × 10⁴ (Ur = 11.35) is also referring to the range of the VIV branch. In displacement spectra, only a prominent peak (fosc = 1.005 Hz) is observed at the first harmonic component of the oscillation frequency. There are two peaks, fL = 1.005 Hz and fL = 2.010 Hz, at the first harmonic component and the second harmonic component, respectively. These results corroborate the ideas of Raghavan [21]. In the VIV branch, the main frequency of oscillation is obvious and there is no higher harmonic, which indicates that the fluid is vortex shedding in 2S mode, that is, there is a vortex shedding at the position where the oscillator runs to the maximum displacement of positive and negative. Its force mechanism is that the periodic lifting force caused by vortex shedding drives the oscillator to oscillate.
In the third range, Re = 6.51 × 10⁴ (Ur = 19.98), the following observations are made: a prominent peak (fosc = 0.935 Hz) and a small peak (fosc = 1.870) in the displacement spectra are observed, and there are 4 peaks (fL = 0.935 Hz, fL = 1.870 Hz, fL = 2.788 Hz, and fL = 3.740 Hz) in the force spectra. Referring to the results of Ding et al. and Zhang et al. [34,35] and combining with the spectra curve obtained from the test, the wake vortex shedding mode of the oscillation in the range before jumping from the VIV upper branch to the galloping branch is inferred. In the displacement spectra, the second and third harmonic components of the oscillation frequency are observed, and the vortex structure is in the combination mode of 2P and P + S or the combination mode of 2P and 2S.
For the case of D = 0.08 m, when Re = 3.86 × 10⁴ (Ur = 6.67), the oscillator undergoes a VIV response; a prominent peak is fosc = 0.808 in displacement spectra, and there are 2 peaks (fL = 0.808 Hz and fL = 3.737 Hz) in the force spectra, so the vortex mode is 2S. For Re = 6.00 × 10⁴ (Ur = 10.36), the oscillator is still undergoing a VIV response; only a peak (fosc = 0.935) is observed at the primary oscillating frequency, and there are 3 peaks (fL = 0.935 Hz, fL = 1.886 Hz, and fL = 2.821 Hz) in the force spectra, the vortex structures are also 2S mode. When Re = 8.67 × 10⁴ (Ur = 14.99), the spectra have two prominent peaks fosc = 0.918 and fosc = 0.935, the oscillation is in the transition branch. The oscillation mechanism is that the oscillator oscillates under the dual effects of vortex shedding and lift instability. While 3 peaks (fL = 0.918 Hz, fL = 1.836 Hz, and fL = 2.755 Hz) are observed in the force spectra.
As D = 0.10 m, the following observations are made: when Re = 4.82 × 10⁴ (Ur = 5.33), the displacement spectra only have a peak (fosc = 0.808), and a prominent peak is observed in the force spectra (fL = 0.808 Hz), the vortex mode is 2S in the VIV branch. As Re = 6.83 × 10⁴ (Ur = 7.55), the oscillator is still undergoing a VIV response; a conspicuous peak (fosc = 0.868) is observed in the displacement spectra, and 3 peaks (fL = 0.868 Hz, fL = 2.588 Hz, and fL = 4.307 Hz) are observed in the force spectra. The vortex structures are also in 2S mode. When Re =9.50 × 10⁴ (Ur = 10.51), the oscillation is still in the upper branch but tends to enter the transition branch, a prominent peak (fosc = 0.868) and a small peak (fosc = 1.853) in the displacement spectra, and the second harmonic appears in the spectrum, indicating that the vortex shedding mode of the fluid changes to 2P mode, that is, 2 pairs of vortexes fall off from the oscillator during one oscillation period. Additionally, 3 peaks (fL = 0.918 Hz, fL = 1.853 Hz, and fL = 2.788 Hz) are observed in the force spectra.
For the spectral character of other diameters, as D = 0.12 m at Re = 5.79 × 10⁴ (Ur = 4.44), D = 0.14 m at Re = 6.78 × 10⁴ (Ur = 3.81), and D = 0.16 m at Re = 7.71 × 10⁴ (Ur = 3.33), these reduced velocities are relatively small, the vortex shedding cannot be induced or kept stable, and no prominent peak is observed in the force spectra. For D = 0.16 m at Re = 9.86 × 10⁴ (Ur = 4.26), a prominent peak of fosc = 0.651 Hz is observed in the displacement spectra, and two peaks are observed in the force spectra (fL = 0.651 Hz and fL = 1.319 Hz).
While D = 0.12 m at Re = 9.40 × 10⁴ (Ur = 7.22), there is a prominent peak (fosc = 0.818) at the first harmonic component, another peak is observed in the displacement spectra (fosc = 1.653 Hz), and two prominent peaks are observed in the force spectra (fL = 0.818 Hz and fL = 1.653 Hz). For D = 0.12 m at Re = 11.41 × 10⁴ (Ur = 8.76), there are two peaks at the oscillating frequency (fosc = 0.868 Hz and fosc = 1.736 Hz), and three peaks in the force spectra are observed (fL = 0.868 Hz, fL = 1.736 Hz, and fL = 2.604 Hz). As D = 0.14 m, both Re = 10.97 × 10⁴ (Ur = 6.19) (fosc = 0.751 Hz and fosc = 1.502 Hz) and Re = 13.31 × 10⁴ (Ur = 7.51) (fosc = 0.785 Hz and fosc = 1.553 Hz) have two peaks in the displacement spectra. While Re = 10.97 × 10⁴ (Ur = 6.19), four peaks are observed in the force spectra (fL = 0.751 Hz, fL = 1.503 Hz, fL = 2.254 Hz, and fL = 3.005 Hz), and the force spectra have two peaks when Ur = 7.51, which are fL = 0.785 Hz and fL = 1.553 Hz, respectively. As D = 0.16 m at Re = 15.21 × 10⁴ (Ur = 6.57), in the displacement spectra, two peaks are fosc = 0.735 Hz and fosc = 1.486 Hz, respectively, and four peaks are observed in the force spectra (fL = 0.735 Hz, fL = 1.486 Hz, fL = 2.220 Hz and fL = 3.706 Hz). These results indicate that all of the vortex modes are 2P.
3.4. Energy Conversion Characteristicsr
To study the effect of Re on the levels of energy conversion, the active power versus current velocity (U), reduced velocity (Ur), and Reynolds number (Re) for different ζtotal values for six oscillators are shown in Figure 18a–e. The power outputs are at six Reynolds number ranges, i.e., Re = 28.9 k~65.1 k (D = 0.06 m) and Re = 38.6 k ~ 86.7 k (D = 0.08 m) in the regime of TrSL2, TrSL3; Re = 48.2 k ~95.0 k (D = 0.10 m) in the regime of TrSL3; Re = 57.9 k ~114.1 k (D = 0.12 m); Re = 67.5 k~133.1 k (D = 0.14 m); and Re = 77.1 k ~ 152.1 k (D = 0.16 m) in the regime of TrSL3 and TrBL0.
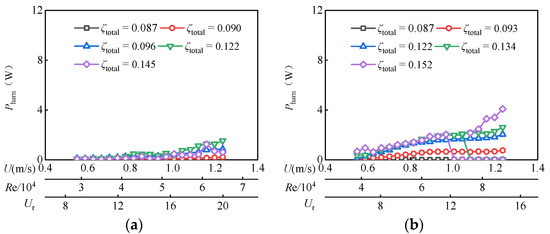
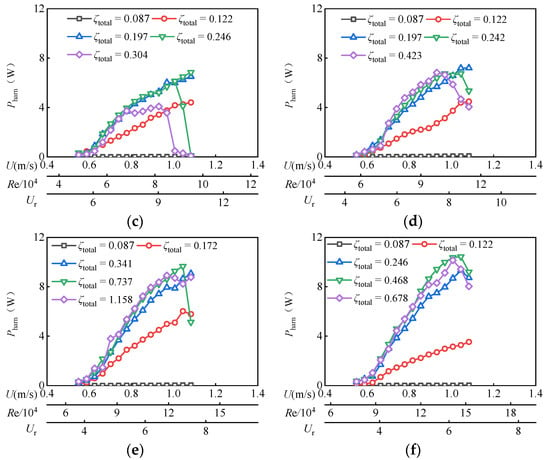
Figure 18.
Active power of Cir-T-Att. (a) D = 0.06 m, Re = 2.89 × 10⁴~6.51 × 10⁴. (b) D = 0.08 m, Re = 3.86 × 10⁴~9.21 × 10⁴. (c) D = 0.10 m, Re = 4.82 × 10⁴~1.15 × 10⁵. (d) D = 0.12 m, Re = 5.79 × 10⁴~1.38 × 10⁵. (e) D = 0.14 m, Re = 6.75 × 10⁴~1.61 × 10⁵. (f) D = 0.16 m, Re = 7.71 × 10⁴~1.84 × 10⁵.
It is worth noting that the Reynolds number affects not only the value but also the overall energy conversion. The maximum active power of D = 0.06 m is about 1.531 W (ζtotal = 0.122, Re = 6.51 × 10⁴, Ur = 19.98) and D = 0.08 m is 4.09 W(ζtotal = 0.152, Re = 8.67 × 10⁴, Ur = 14.99), while that at D = 0.10 m, D = 0.12 m, D = 0.14 m and D = 0.16 m are about 6.85 W(ζtotal = 0.246, Re = 9.50 × 10⁴, Ur = 10.51), 7.21 W (ζtotal = 0.197, Re = 11.40 × 10⁴, Ur = 8.76), 9.66 W(ζtotal = 0.737, Re = 12.84 × 10⁴, Ur = 7.24), and 10.43 W(ζtotal = 0.468, Re = 14.67 × 10⁴, Ur = 6.34), respectively. Similar to the corresponding vibration responses for six different Reynolds number ranges given in Figure 5, as Re increases, the active power shows an increasing trend in the VIV upper branch. However, when the oscillation goes into the VIV-Galloping branch, the active power output tends to decrease with the increase of Re. It is worth mentioning that when D is over 0.14 m, the oscillation stability and intensity are affected by large deformations of the water surface, but the maximum power output of D = 0.16 m is still larger than that of D = 0.14 m. For the same Reynolds numbers range cases investigated, the FIMECS generates more power as the system total damping ratio ζtotal is higher in the VIV upper branch.
3.5. The Upper Limit of Power Output
In this section, the influence of Re on the upper limit of power output PUL is discussed. Figure 19 presents the variation of PUL as a function of velocity at the maximum system total damping ζtotal,max of different oscillators can overcome.
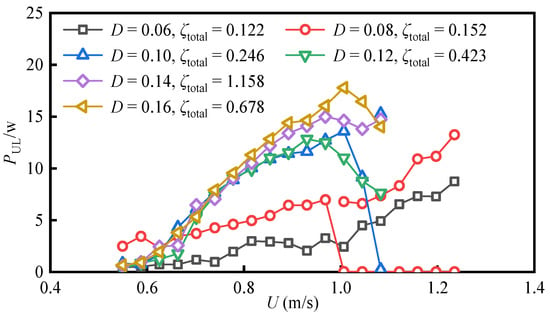
Figure 19.
Variation of maximum power output versus velocity at various Reynolds numbers.
For D = 0.06 m, D = 0.08 m, and D = 0.10 m, the upper limit of harvested power output PUL increases continuously with the Reynolds number Re increasing. While for D = 0.12 m, D = 0.14 m, and D = 0.16 m, the PUL increases with the Re until an optimal value and then decreases. This inconsistency may be because of the vibration response in different branches. Referring to Section 3.1, in the present experiment condition, for D = 0.06 with ζtotal = 0.122, the oscillation undergoes VIV branches and VIV-Galloping transition branches, and its maximum PUL reaches 8.75 W, appearing at Re = 6.51 × 10⁴. For D = 0.08 with ζtotal = 0.152, the oscillation can be induced on a galloping branch, and its maximum PUL reaches 13.25 W, appearing at Re = 16.22 × 10⁴. For D = 0.10 and ζtotal = 0.246, the VIV lower branch cannot enter the galloping branch. Its maximum PUL reaches 15.27 W appearing at Re = 9.51 × 10⁴. As D = 0.12 with ζtotal = 0.423, D = 0.14 with ζtotal = 1.158 and D = 0.16 with ζtotal = 0.678, all of the oscillations enter into VIV branches. Their maximum PUL are 12.83 W (Re = 9.80 × 10⁴), 14.73 W (Re = 13.31 × 10⁴) and 17.80 W (Re = 15.21 × 10⁴) respectively. It is noted that even the optimal total damping ratio of D = 0.14 m is higher than that of D = 0.16 m, but the PUL of D = 0.16 m is larger than that of D = 0.14 m. The larger the characteristic width D of the oscillator, the higher the generating power of FIMECS. It can be seen that increasing the Re number range of the oscillator is conducive to improving the capacity of a single unit of a FIMECS. This is because the larger the Re number is, the larger the maximum system damping ratio that can be overcome by the oscillator is, and the larger system damping ratio is conducive to improving the generating power of the FIMECS.
The effect of Re on the upper limit of power output efficiency is also clearly evaluated in Figure 20. The ηUL first increases with the velocity and then decreases. While the change of ηUL with the Reynolds number is not regularly, these results seem to be due to the power in the current flow Pw varying with the cube of velocity U3. More power does not mean high efficiency. As derived in Equations (11) and (12), when the power available in the flow Pw dominates the variation of efficiency ηUL, even if PUL undergoes a steady increase, ηUL may remain unchanged or even decline. In our test, the maximum ηUL of Cir-T-Att reaches 42.11%, appearing at D = 0.1 m, ζtotal = 0.246, and Re = 6.49(Ur = 7.18, U = 0.74 m/s).
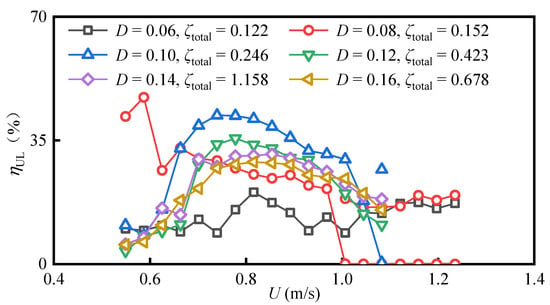
Figure 20.
Variation of maximum power output efficiency versus velocity at various Re.
4. Conclusions
All experiments are performed in the free surface water channel to investigate the influence on energy harnessing from flow-induced motion with the Cir-T-Att oscillator under six Reynolds number ranges (TrSL2, TrSL3, and TrBL0 flow regimes). We applied the controllable magnetic damping system to change the ζtotal by varying excitation voltages (VB) and introduced a torque sensor to calculate fluid force. The VB ranges from 0 V to 165 V, corresponding to ζtotal changes from 0.082 to 1.153. Some important conclusions were given as follows:
- (1)
- As Re increases, the oscillation intensity strengthens, and the range of the upper branch widens. Additionally, the maximum system total damping ζtotal,max of different oscillators can overcome increases;
- (2)
- In our experiments, with the increase of Re, when the oscillation goes into VIV branches, CL shows an increasing trend, but as Re keeps on increasing, CL shows a decreasing trend when the oscillator enters into VIV-Galloping transition branches;
- (3)
- In our measurements, compared with the higher harmonic component in the force spectrum, that of the displacement spectrum has less influence;
- (4)
- Both the global oscillation response and the levels of energy conversion are affected by the Re, the maximum Pharn of Cir-T-Att reaches 10.43 W, appearing at D = 0.16 m with Re = 1.47 × 10⁵(ζtotal = 0.468, Ur = 6.34, and U = 1.04 m/s);
- (5)
- As Re increases, the upper limit of harvested power PUL increases in the VIV upper branch, and the maximum PUL of Cir-T-Att reaches 17.80 W, appearing at D = 0.16 m with Re = 1.41 × 10⁵ (ζtotal = 0.678, Ur = 6.11, and U = 1.01 m/s).
Author Contributions
D.R.: Investigation, Formal analysis, Resources, Writing—original draft, Writing—review and editing. X.Y. (Xiang Yan): Conceptualization, Methodology, Project administration, Funding acquisition. J.L.: Supervision. F.L.: Validation. N.S.: Data curation. X.Y. (Xu Yang): Validation. L.L.: Visualization. All authors have read and agreed to the published version of the manuscript.
Funding
This research was funded by the National Natural Science Foundation of China, grant number No. 51909190.
Institutional Review Board Statement
The study did not involve humans or animals.
Informed Consent Statement
The study did not involve humans.
Data Availability Statement
This statement if the study did not report any data.
Acknowledgments
The authors would like to acknowledge the National Natural Science Foundation of China (Grant number, No. 51909190). All workers from the State Key Laboratory of Hydraulic Engineering Simulation and Safety at Tianjin University are also acknowledged. The writers also acknowledge the assistance of anonymous reviewers.
Conflicts of Interest
The authors declare no conflict of interest.
References
- Bianchi, F.R.; Bosio, B.; Conte, F.; Massucco, S.; Mosaico, G.; Natrella, G.; Saviozzi, M. Modelling and optimal management of renewable energy communities using reversible solid oxide cells. Appl. Energy 2023, 334, 120657. [Google Scholar] [CrossRef]
- Wang, J.; Geng, L.; Ding, L.; Zhu, H.; Yurchenko, D. The state-of-the-art review on energy harvesting from flow-induced vibrations. Appl. Energy 2020, 267, 114902. [Google Scholar] [CrossRef]
- Zhang, M.; Zhang, C.; Abdelkefi, A.; Yu, H.; Gaidai, O.; Qin, X.; Zhu, H.; Wang, J. Piezoelectric energy harvesting from vortex-induced vibration of a circular cylinder: Effect of Reynolds number. Ocean Eng. 2021, 235, 109378. [Google Scholar] [CrossRef]
- Wang, J.; Ran, J.; Zhang, Z. Energy Harvester Based on the Synchronization Phenomenon of a Circular Cylinder. Math. Probl. Eng. 2014, 2014, 1–9. [Google Scholar] [CrossRef]
- Wang, J.; Su, Z.; Li, H.; Ding, L.; Zhu, H.; Gaidai, O. Imposing a wake effect to improve clean marine energy harvesting by flow-induced vibrations. Ocean. Eng. 2020, 208, 107455. [Google Scholar] [CrossRef]
- Wang, J.; Li, G.; Zhang, M.; Zhao, G.; Jin, Z.; Xu, K.; Zhang, Z. Energy harvesting from flow-induced vibration: A lumped parameter model. Energy Sources Part A Recovery Util. Environ. Eff. 2018, 40, 2903–2913. [Google Scholar] [CrossRef]
- Dai, H.; Abdelkefi, A.; Yang, Y.; Wang, L. Orientation of bluff body for designing efficient energy harvesters from vortex-induced vibrations. Appl. Phys. Lett. 2016, 108, 053902. [Google Scholar] [CrossRef]
- Zhu, H.; Lin, P.; Yao, J. An experimental investigation of vortex-induced vibration of a curved flexible pipe in shear flows. Ocean Eng. 2016, 121, 62–75. [Google Scholar] [CrossRef]
- Wang, J.; Zhao, W.; Su, Z.; Zhang, G.; Li, P.; Yurchenko, D. Enhancing vortex-induced vibrations of a cylinder with rod attachments for hydrokinetic power generation. Mech. Syst. Signal Process. 2020, 145, 106912. [Google Scholar] [CrossRef]
- Wang, J.; Zhou, S.; Zhang, Z.; Yurchenko, D. High-performance piezoelectric wind energy harvester with Y-shaped attachments. Energy Convers. Manag. 2019, 181, 645–652. [Google Scholar] [CrossRef]
- Zhu, H.; Gao, Y. Hydrokinetic energy harvesting from flow-induced vibration of a circular cylinder with two symmetrical fin-shaped strips. Energy 2018, 165, 1259–1281. [Google Scholar] [CrossRef]
- Zhang, B.; Song, B.; Mao, Z.; Li, B.; Gu, M. Hydrokinetic energy harnessing by spring-mounted oscillators in FIM with different cross sections: From triangle to circle. Energy 2019, 189, 116249. [Google Scholar] [CrossRef]
- Gu, Y.; Liu, W.; Zhao, C.; Wang, P. A goblet-like non-linear electromagnetic generator for planar multi-directional vibration energy harvesting. Appl. Energy 2020, 266, 114846. [Google Scholar] [CrossRef]
- Chen, Z.; Xia, Y.; He, J.; Xiong, Y.; Wang, G. Elastic-electro-mechanical modeling and analysis of piezoelectric metamaterial plate with a self-powered synchronized charge extraction circuit for vibration energy harvesting. Mech. Syst. Signal Process. 2020, 143, 106824. [Google Scholar] [CrossRef]
- Fan, K.; Cai, M.; Liu, H.; Zhang, Y. Capturing energy from ultra-low frequency vibrations and human motion through a monostable electromagnetic energy harvester. Energy 2019, 169, 356–368. [Google Scholar] [CrossRef]
- Zou, H.X.; Zhao, L.-C.; Gao, Q.-H.; Zuo, L.; Liu, F.R.; Tan, T.; Wei, K.-X.; Zhang, W.-M. Mechanical modulations for enhancing energy harvesting: Principles, methods and applications. Appl. Energy 2019, 255, 113871. [Google Scholar] [CrossRef]
- Williamson, C.H.K.; Govardhan, R. Vortex-induced vibrations. Annu. Rev. Fluid Mech. 2004, 36, 413–455. [Google Scholar] [CrossRef]
- Govardhan, R.N.; Williamson, C.H.K. Defining the ‘modified Griffin plot’ in vortex-induced vibration: Revealing the effect of Reynolds number using controlled damping. J. Fluid Mech. 2006, 561, 147–180. [Google Scholar] [CrossRef]
- Roshko, A. Experiments on the flow past a circular cylinder at very high Reynolds number. J. Fluid Mech. 1961, 10, 345–356. [Google Scholar] [CrossRef]
- Bernitsas, M.M.; Ben-Simon, Y.; Raghavan, K. The VIVACE converter: Model tests at high damping and Reynolds number around 105. J. Offshore Mech. Arct. Eng.-Trans. ASME 2009, 131, 011102. [Google Scholar] [CrossRef]
- Raghavan, K.; Bernitsas, M.M. Experimental investigation of Reynolds number effect on vortex induced vibration of rigid circular cylinder on elastic supports. Ocean Eng. 2011, 38, 719–731. [Google Scholar] [CrossRef]
- Prasath, S.G.; Sudharsan, M.; Kumar, V.V.; Diwakar, S.; Sundararajan, T.; Tiwari, S. Effects of aspect ratio and orientation on the wake characteristics of low Reynolds number flow over a triangular prism. J. Fluids Struct. 2014, 46, 59–76. [Google Scholar] [CrossRef]
- Tu, J.H.; Zhou, D.; Bao, Y.; Han, Z.; Li, R. Flow characteristics and flow-induced forces of a stationary and rotating triangular cylinder with different incidence angles at low Reynolds numbers. J. Fluids Struct. 2014, 45, 107–123. [Google Scholar] [CrossRef]
- Zdravkovich, M.M. Flow Around Circular Cylinders Volume 1: Fundamentals; Oxford Science Publications: Oxford, UK, 1997. [Google Scholar]
- Bearman, P.W. Circular cylinder wakes and vortex-induced vibrations. J. Fluids Struct. 2011, 27, 648–658. [Google Scholar] [CrossRef]
- Unal, M.F.; Rockwell, D. On vortex formation from a cylinder: Control by splitter-plate interference. J. Fluid Mech. 1988, 190, 513–529. [Google Scholar] [CrossRef]
- Wanderley, J.B.V.; Soares, L.F.N. Vortex-induced vibration on a two-dimensional circular cylinder with low Reynolds number and low mass-damping parameter. Ocean Eng. 2015, 97, 156–164. [Google Scholar] [CrossRef]
- Chang, C.C.; Kumar, R.A.; Bernitsas, M.M. VIV and galloping of single circular cylinder with surface roughness at 3.0 × 10⁴ ≤ Re ≤ 1.2 × 10⁵. Ocean Eng. 2011, 38, 1713–1732. [Google Scholar] [CrossRef]
- Park, H.; Kumar, R.A.; Bernitsas, M.M. Enhancement of flow-induced motion of rigid circular cylinder on springs by localized surface roughness at 3.0 × 10⁴ ≤ Re ≤ 1.2 × 10⁵. Ocean Eng. 2013, 72, 403–415. [Google Scholar] [CrossRef]
- Lian, J.; Ran, D.; Yan, X.; Liu, F.; Shao, N.; Wang, X.; Yang, X. Hydrokinetic energy harvesting from flow-induced motion of oscillators with different combined sections. Energy 2023, 269, 126814. [Google Scholar] [CrossRef]
- Skop, R.A.; Griffin, O.M. On a theory for the vortex-excited oscillations of flexible cylindrical structures. J. Sound Vib. 1975, 41, 263–274. [Google Scholar] [CrossRef]
- Ding, J.; Balasubramanian, S.; Lokken, R.; Yung, T. Lift and damping characteristics of bare and staked cylinders at riser scale Reynolds numbers. In Proceedings of the Offshore Technology Conference, Houston, TX, USA, 3–6 May 2004. Paper No. 16341. [Google Scholar]
- Yan, X.; Lian, J.; Liu, F.; Wang, X.; Shao, N. Hydrokinetic energy conversion of Flow-induced motion for triangular prism by varying magnetic flux density of generator. Energy Convers. Manag. 2021, 227, 113553. [Google Scholar] [CrossRef]
- Ding, L.; Zhang, L.; Wu, C.M.; Mao, X.; Jiang, D. Flow induced motion and energy harvesting of bluff bodies with different cross sections. Energy Convers. Manag. 2015, 91, 416–426. [Google Scholar] [CrossRef]
- Zhang, J.; Xu, G.B.; Liu, F.; Lian, J.; Yan, X. Experimental investigation on the flow-induced vibration of an equilateral triangle prism in water. Appl. Ocean Res. 2016, 61, 92–100. [Google Scholar] [CrossRef]
Disclaimer/Publisher’s Note: The statements, opinions and data contained in all publications are solely those of the individual author(s) and contributor(s) and not of MDPI and/or the editor(s). MDPI and/or the editor(s) disclaim responsibility for any injury to people or property resulting from any ideas, methods, instructions or products referred to in the content. |
© 2023 by the authors. Licensee MDPI, Basel, Switzerland. This article is an open access article distributed under the terms and conditions of the Creative Commons Attribution (CC BY) license (https://creativecommons.org/licenses/by/4.0/).