Article

Correlation of the Structural Characteristics of an Artificial Oyster Reef with Its Wake Region

Department of Ocean Engineering, Pukyong National University, Busan 48513, Republic of Korea
*
Author to whom correspondence should be addressed.
J. Mar. Sci. Eng. 2023, 11(4), 775; https://doi.org/10.3390/jmse11040775
Submission received: 5 March 2023 / Revised: 26 March 2023 / Accepted: 29 March 2023 / Published: 3 April 2023
(This article belongs to the Special Issue Ecology and Physiology of Seaweeds and Their Response to Changes)

Abstract

:
Oyster reefs are currently at risk of severe decline due to dangerous human interference and its aftermath; hence, artificial oyster reefs (AORs) have been utilized for their restoration. AORs with high vertical reliefs interact with the surrounding flow, constitute a reverse flow, and create a wake region in which concentrated nutrients and food organisms exist. However, the correlations of the structural characteristics of an AOR with its wake regions have not been studied. Thus, we established 96 AOR models, carried out flow analyses, and obtained their wake volumes, considering shell orientation, composition, penetration depth, and growth stage. We found that the growth stage is the most critical parameter for establishing a normalized wake volume. This implies that the number of oyster shells ( N ) is the most critical factor in securing a normalized wake volume, in which their correlation was linear and significant ( R 2 = 0.89 ). We also found that the correlations of the normalized wake volume with blocking and surface complexity indices were linearly significant, respectively. Additionally, wake volume efficiency increased with the number of oyster shells; specifically, the criterion for wake volume efficiency of EI (efficiency index) ≥ 2.0 was satisfied when N 50 per 900 cm2.

1. Introduction

Oysters form a colony attached to a hard substrate (e.g., rock); such an oyster colony is often called an oyster reef (OR) [1]. ORs provide various ecosystem services. These services include: a space with crevices and substrates for fish, crustaceans, shellfish, seagrass, and seaweeds; an excellent attachment space for the survival of marine life; and a shelter and spawning ground for various marine organisms to rest [2,3,4,5]. ORs also filter seawater to stabilize water quality and reduce wave energy to protect coastlines [6,7].
Such a three-dimensional physical structure formed in the coastal region interacts with currents and waves and generates turbulence in the surrounding flow region [8,9]. ORs therefore promote the movement of nutrients with surrounding sediments and have significant effects on marine organisms’ settlement, food utilization, and survival [9,10,11]. Such a positive impact of ORs is also explained by marine habitat complexity (or substrate diversity) [12]. The habitat heterogeneity hypothesis posits that structurally complex habitats provide many niches and multiple ways to utilize environmental resources and can increase species diversity; this hypothesis has been validated on numerous occasions (e.g., [13]).
Oyster populations have declined rapidly over the centuries. This is due to dangerous human-initiated interference and its aftermath, such as overfishing, seawater pollution, habitat destruction, and global warming [3]. Over the past few years, oyster habitats have declined by ~63% in the United States [14] and ~85% of ORs have been lost globally [15]. To address this population decline, oyster habitat restoration projects using artificial oyster reefs (AORs) are ongoing in Australia, Europe, and the United States [3,16,17,18,19,20,21]. These projects are based on scientific observations that artificially installed ORs can successfully grow and perform the functions of natural ORs [2,3,7,15]. AORs are known to exhibit the flow conditions and characteristics of natural ORs within 1 year after installation [22,23].
The substrates for AORs can be classified into two types [24,25,26]. The first type utilizes natural materials on which oyster reefs accrete, e.g., recycled, fossilized, and dredged native oyster shells. However, these materials are often limited due to the increased demand for OR restoration projects [27], and their use may be unavailable or undesirable due to the biosecurity regulation on dissolution of calcium carbonate shell bases in acidifying oceans [15]. Accordingly, the second type includes crushed limestone or rock, other bivalve shells, standard concrete, concrete with various additives, and biodegradable products. To secure the structural stability of the AORs made from these materials, various fastening methods, such as mesh nets, are used [7]. AORs installed with a relatively flat relief do not dramatically change the surrounding flow. On the other hand, AORs installed with a relatively high relief interact with the surrounding flow to constitute a reverse flow for creating a wake region. Here, the wake region refers to the recirculating flow area where concentrated nutrients and food organisms exist; as such, this is also home to a variety of organisms [28,29]. Therefore, when installing AORs with a relatively high relief, it is necessary to understand how the structural characteristics of the AORs affects their wake regions, as well as how oyster reef growth (or recruitment) affects the wake region. However, little research is available on these aspects of AORs.
In this research, we propose the hypothesis that “a unique wake region is formed around an AOR due to its structural characteristics”. Detailed research questions to test the hypothesis are as follows. Do the structural characteristics (e.g., composition) of oyster shells used to construct an AOR have an effect on its wake region? What is the correlation between the structural characteristics of an AOR and its wake region? To answer these questions, we constructed a total of 96 AOR models, including 48 for the initial stage and 48 for the growth stages. Then, we used computational fluid dynamics to obtain the wake region characteristics and utilized wake volumes for their quantification. We also utilized evaluation indices such as the efficiency index (EI) [28], an improved blocking index, and a surface complexity index to further correlate the structural characteristics to the wake region characteristics.

2. Materials and Methods

2.1. Artificial Oyster Reef Models

The oyster shell model considered in this study was adopted from the oyster species called Crassostrea virginica (C. virginica), which inhabits the east coasts of North and South America [30]. This selection was made due to the habitat restoration projects for the oyster species in these areas. The maximum size of the species reaches ~14.7 cm (length) × 6.8 cm (width) × 4.3 cm (thickness), and the shell has a sharp layered surface with irregularities [30]. We idealized the shell as shown in Figure 1 by selecting a medium size of 5 cm (length) × 4 cm (width) × 0.1 cm (thickness) with a smooth surface and combining two ellipses.
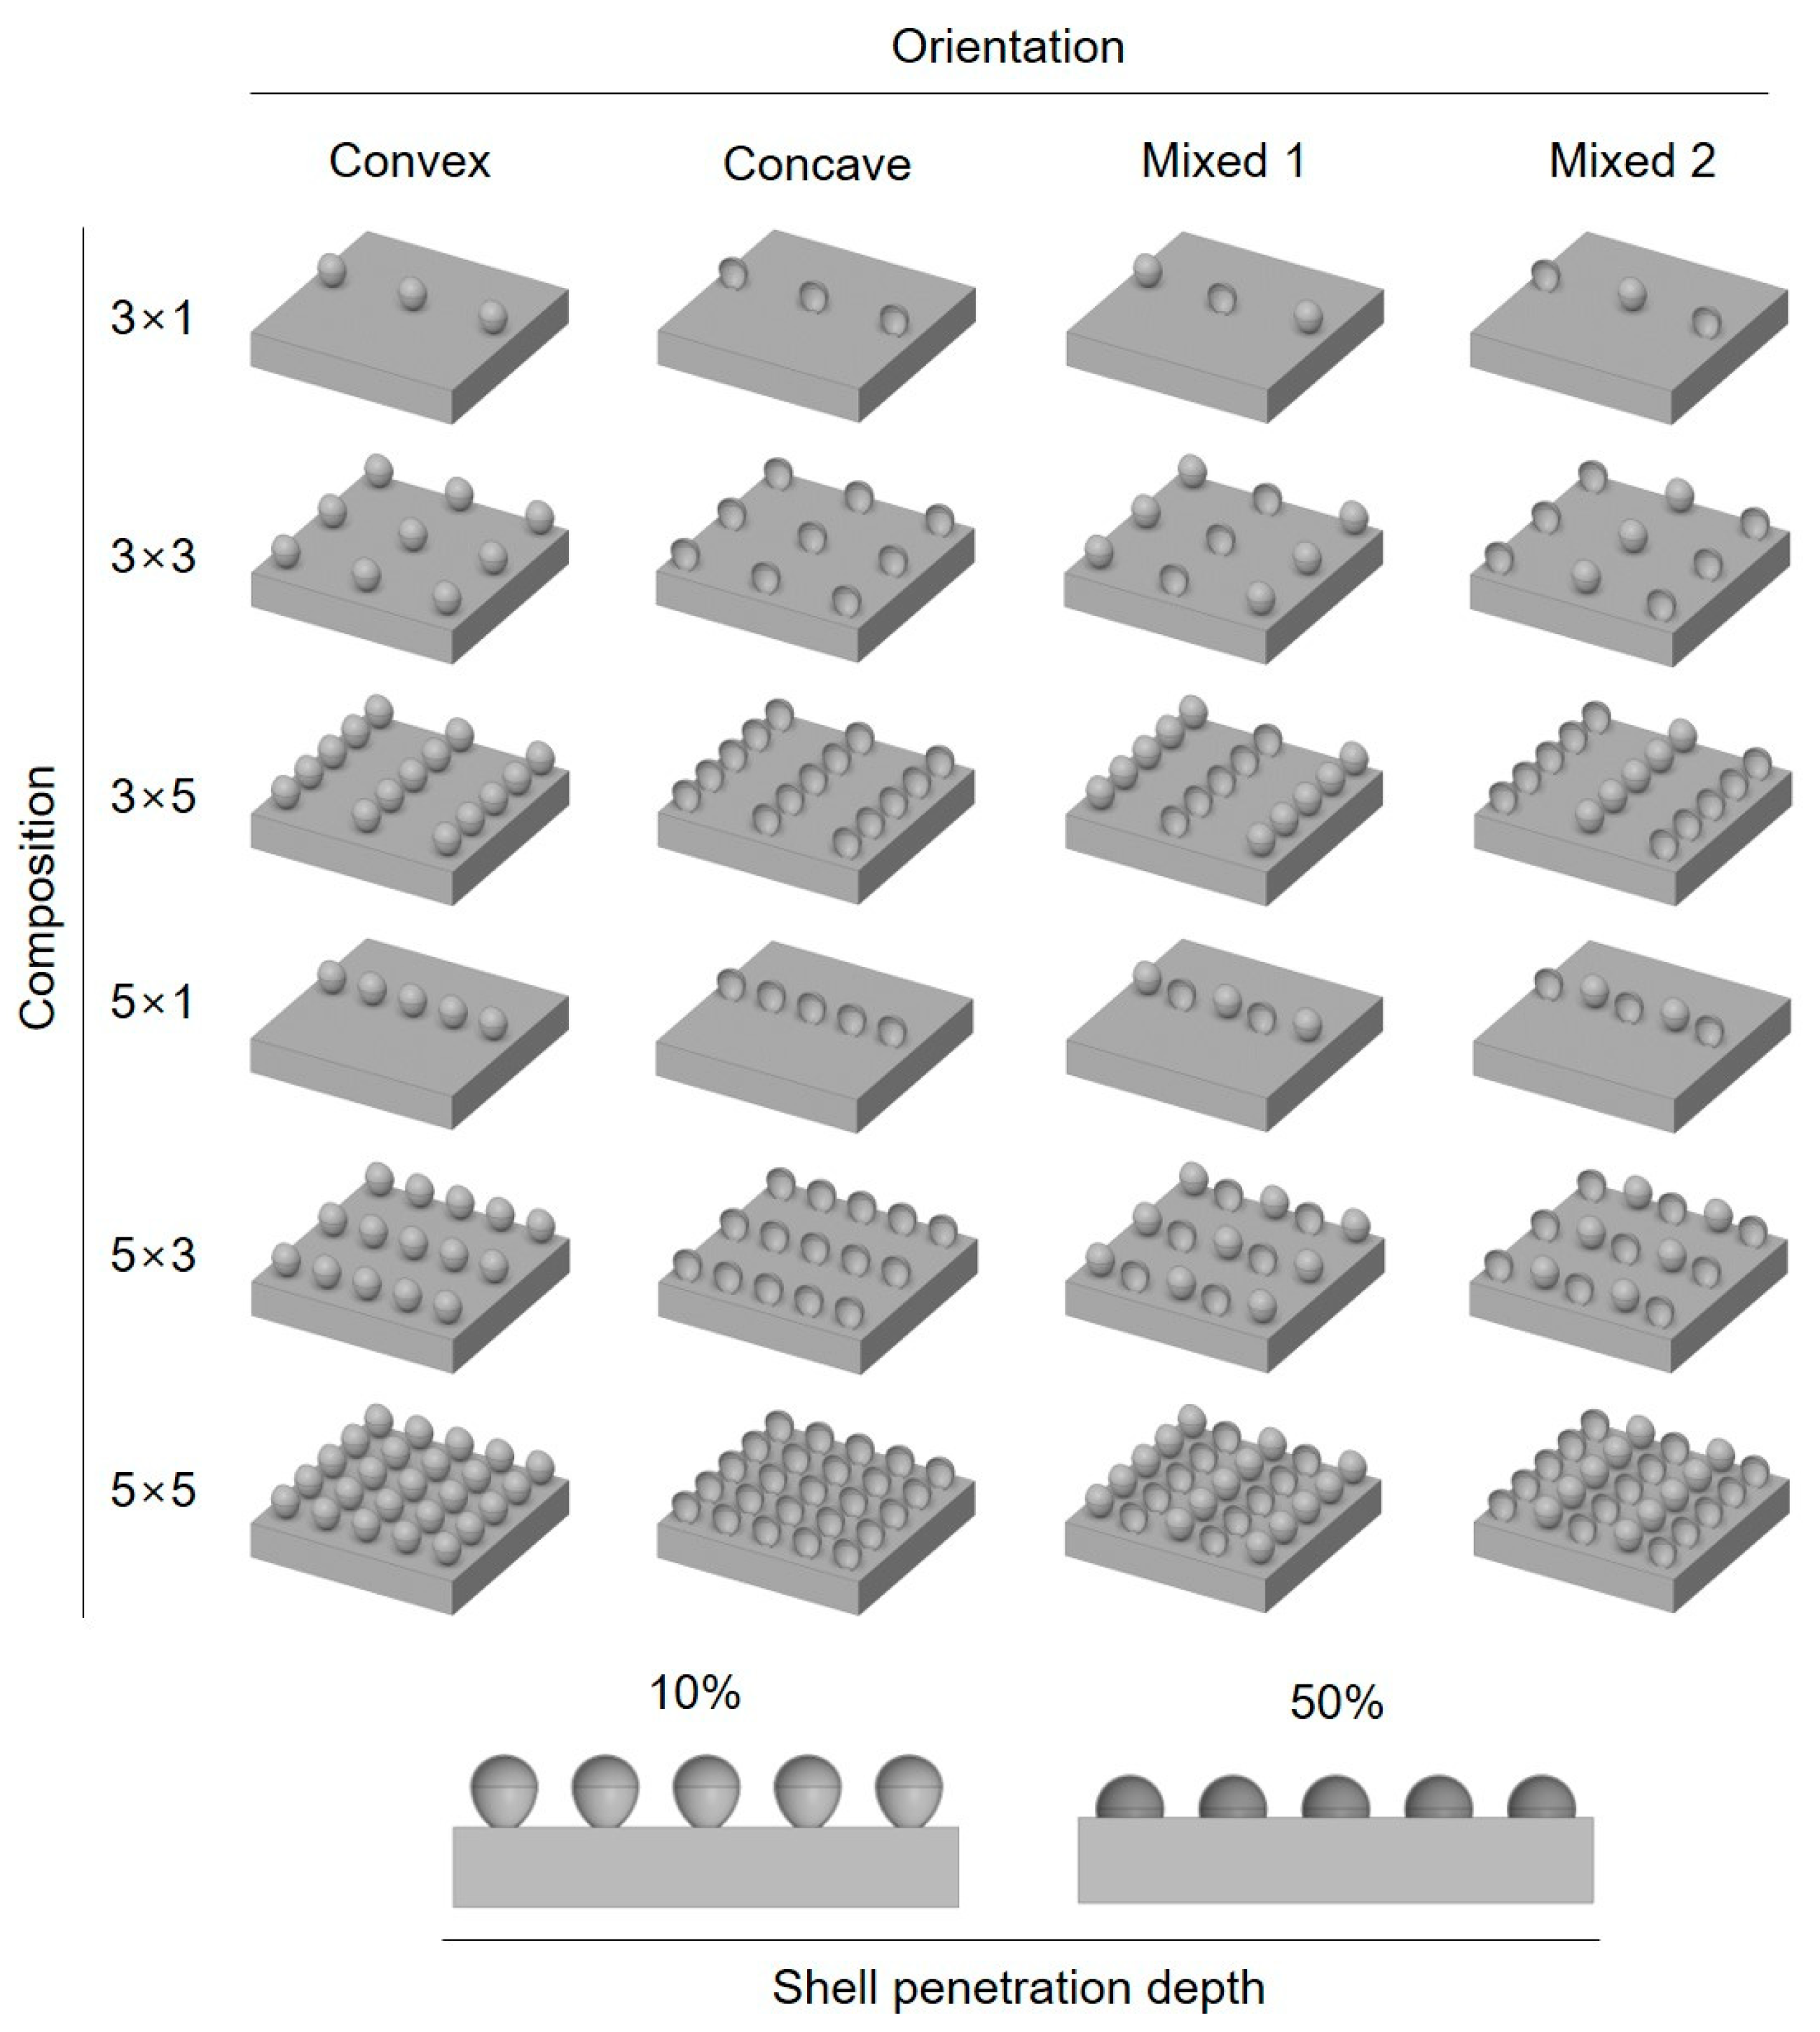
Oysters generally grow faster when living on muddy bottoms, but they are fragile and easily destroyed [30]. We therefore first constructed an initial AOR model by fixing the shells to a flat substrate of 0.3 m (length) × 0.3 m (width) × 0.05 m (height) (Figure 2). We then considered four shell orientations such as convex, concave, mixed 1, and mixed 2 and six compositions such as 3 × 1, 3 × 3, 3 × 5, 5 × 1, 5 × 3, and 5 × 5 (Figure 2); here, the first and second numbers indicate the number of oyster shells perpendicular to and parallel to the inlet flow direction, respectively (Table 1). Moreover, we considered two shell penetration depths of 10% and 50%; hence, the 48 initial AOR models were designed as illustrated in Figure 2.
Oysters grow in a dense ecological space and agglomerate as an oyster reef. Such characteristics create a large number of crevices inside an oyster reef, increasing the substrate surface on which the larvae can settle [31]. Moreover, the flow velocity in such a crevice is small compared to the external flow space, providing a survival space for living organisms [11]. However, it can be difficult to account for these geometric characteristics in an AOR model because ORs grow without any apparent regularity. Therefore, we considered 16 growth stages (GS in figures) of AORs by controlling the number of oyster shells ( N ) from 50 to 200 (Figure 3). Some of the shells were randomly inserted into the substrate to partly reflect the initial models; notably, their penetration depths did not exceed 50%. For each growth (or recruitment) stage, three representative models were made by randomly arranging the oysters; hence, a total of 48 growth AOR models were constructed (Figure 3, Table 2).
It should be noted that the current 48 growth AOR models have certain limitations. First, the oyster shells modeled had the same size (Figure 1), although their orientation, composition, and penetration depth were randomly selected for the 48 growth models (Figure 3). In other words, we modeled the growth stages not by increasing the shell size but by adding oyster shells. Accordingly, a positive reef accretion rate was not fully implemented in this study, although there are some relevant studies (e.g., 7.0–16.9 mm year−1 [10]). Second, the plate substrate remained the same size (0.3 m (length) × 0.3 m (width) × 0.05 m (height)) for all models. This design was intentionally made to allow for an investigation of the effect of the number of shells on the normalized wake volume and the associated evaluation indices. Third, live oysters were not considered in the models. Oysters with the potential to settle and grow on the AORs were modeled as single shell segments rather than closed bivalves.

2.2. Flow Analysis

Using the 96 AOR models, flow analyses were performed using ANSYS-CFX [32], a software package for flow analysis utilizing the element-based finite volume method (EbFVM). The numerical method has been used to obtain wake volumes of artificial reefs on several occasions [28,29,33], mainly because it has the advantage of relatively easy mesh generation [28], taking the merits of both the finite element method and the finite volume method. For example, the EbFVM has been used to calculate wake volumes of various artificial reefs and to subsequently evaluate their efficiency, tranquility, and stability indices [28], efficient placement models [29], and flatly distributed placement models [33]. The governing equation is the Reynolds Averaged Navier Stokes (RANS) equation, and the turbulence equation uses the Shear Stress Transport (SST) turbulence model to improve the predictability of the flow separation on smooth surfaces and prevent excessive prediction of eddy viscosity [34,35].
The size of the flow field was determined to be 3 m (length) × 3 m (width) × 0.5 m (height), a sufficient space to prevent the pressure gradient from occurring at the boundary (Figure 4a). The front surface was set as an inlet with a velocity of 1 m s−1, the rear surface was set as an outlet so that all the flows could escape, the bottom surface and the surface of the AORs were set as a no-slip wall, and all of the other surfaces were set to be symmetric so as not to affect the analysis (Figure 4b).
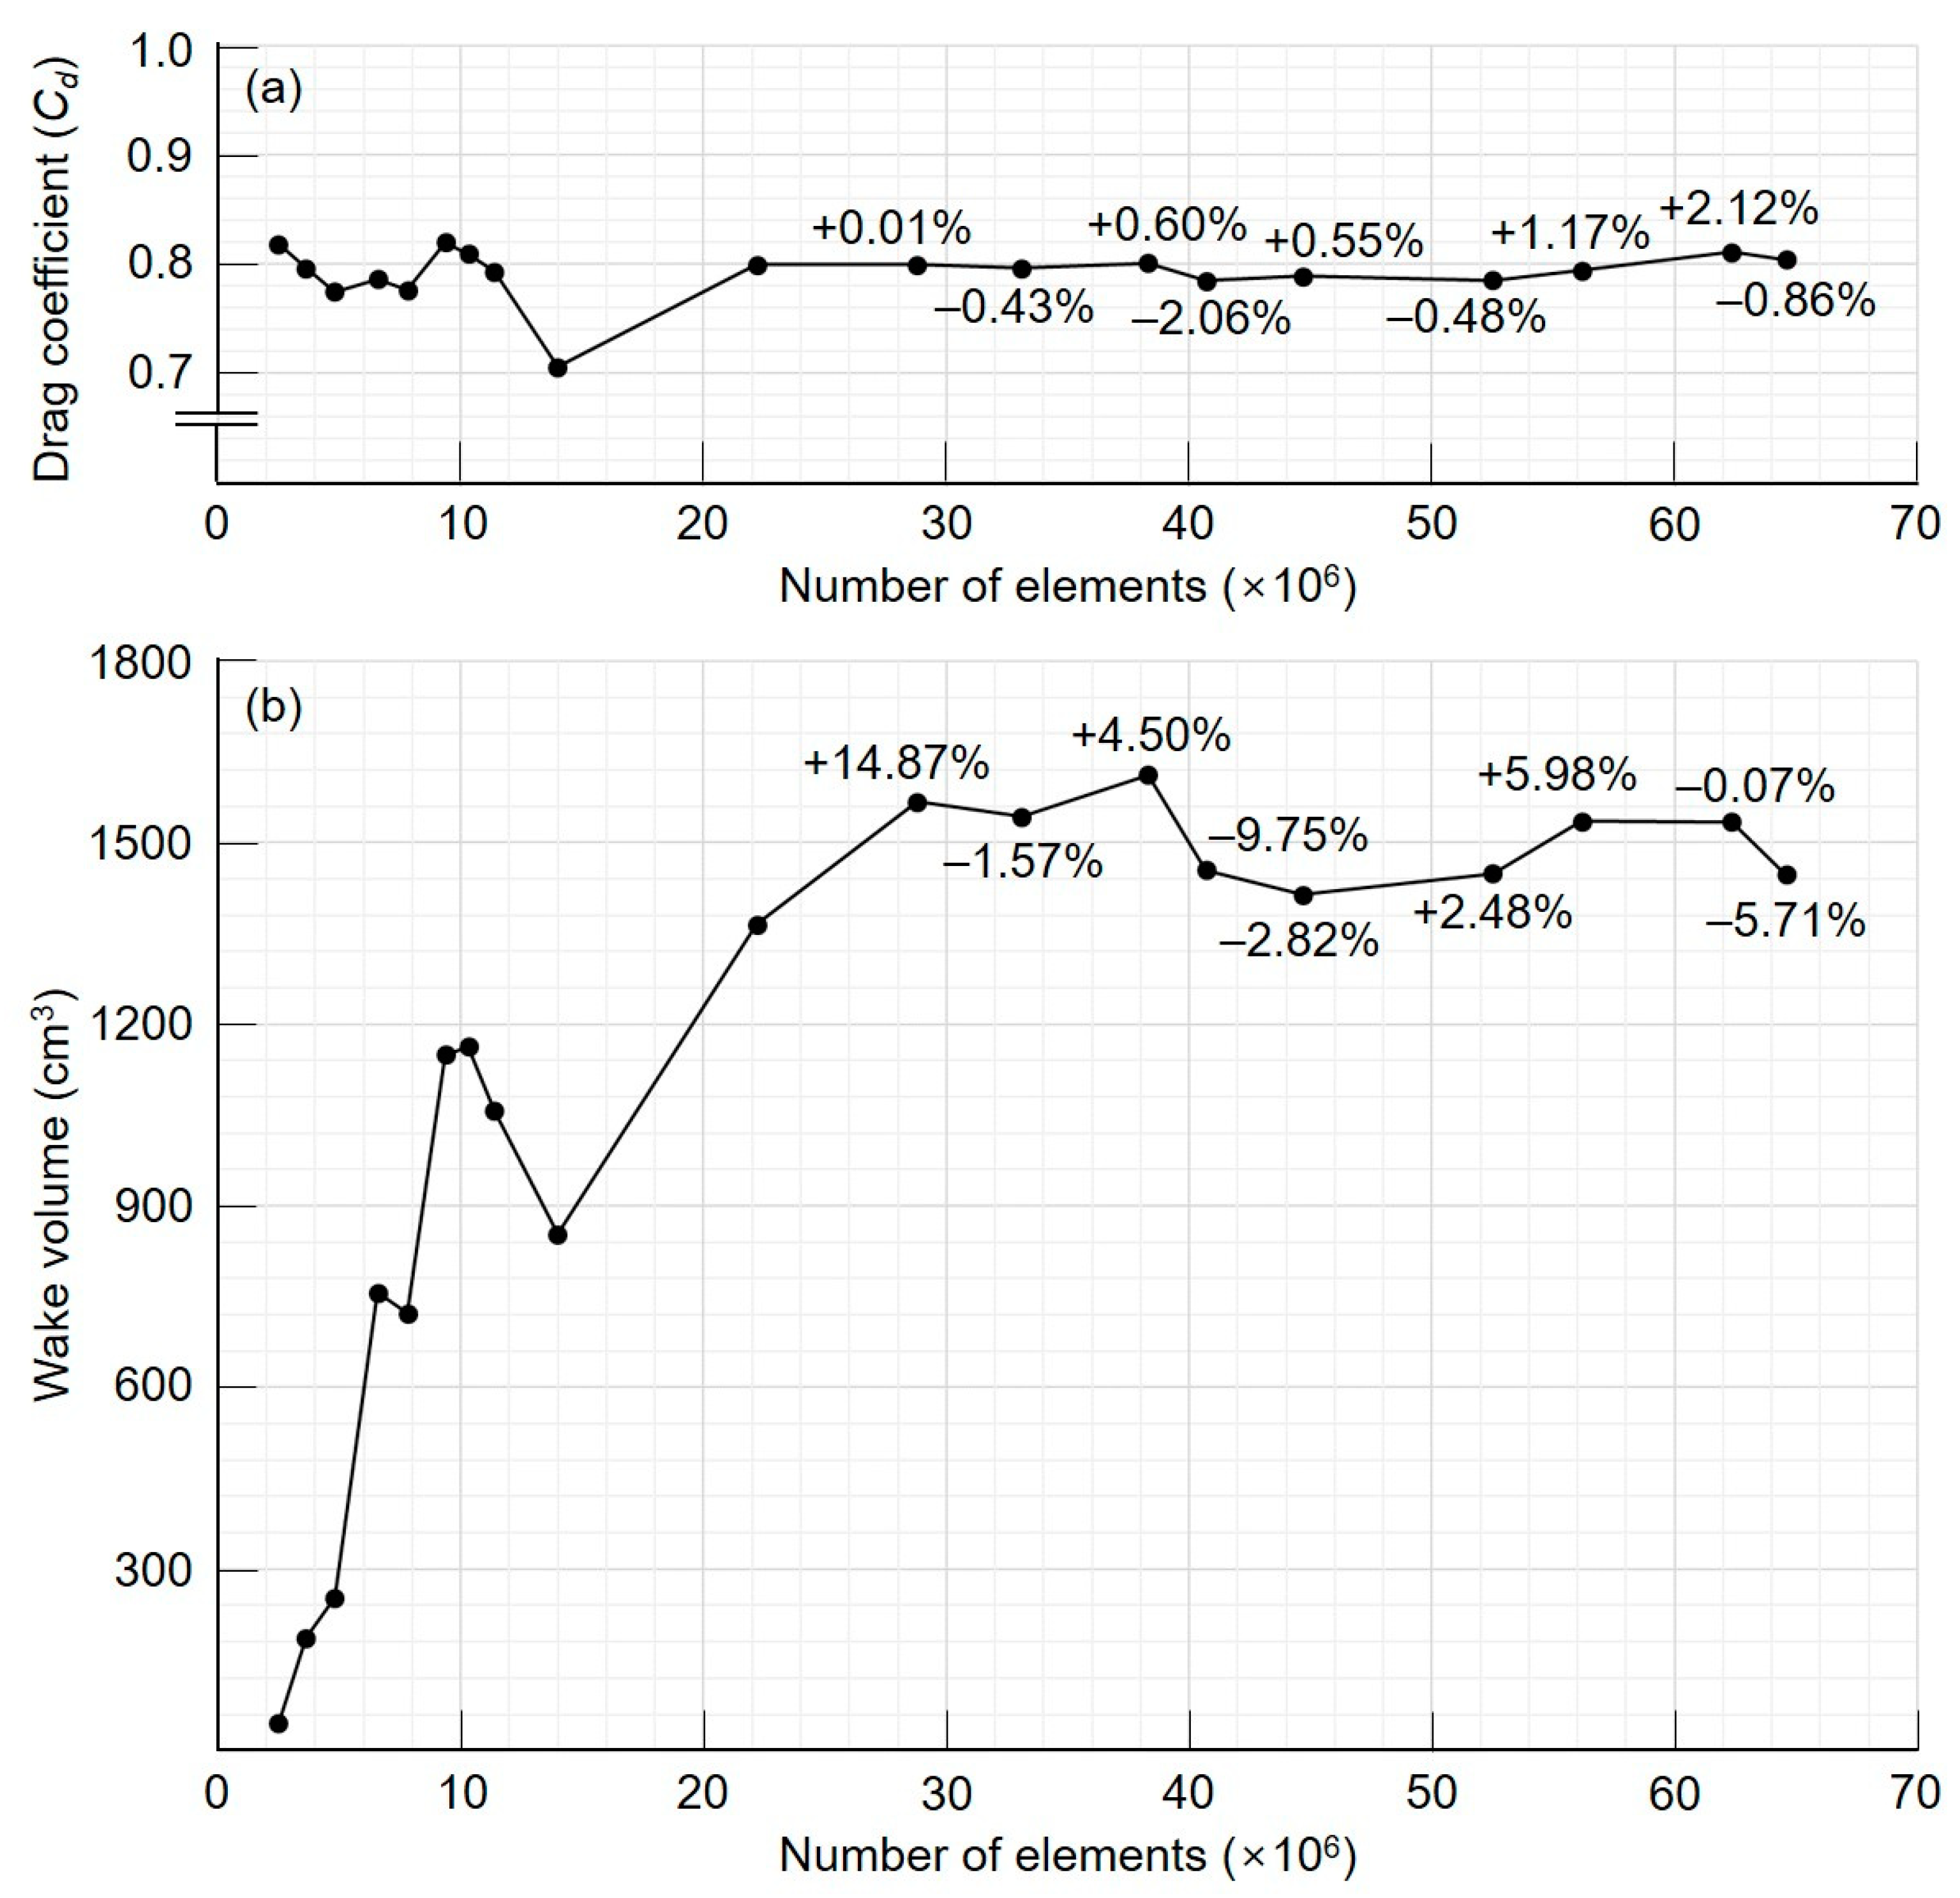
Each AOR model had curved shapes, sharp edges, and irregular surfaces. To reflect these characteristics, all meshes of the flow field were created as tetrahedrons. This is because the tetrahedron meshes can be easily generated, even in a structure having a complex shape, and can yield improved mesh quality. To increase the accuracy of the flow analyses, the mesh quality was checked for all of the models. As a result, the initial AOR models all satisfied the orthogonal quality (minimum 0.15; i.e., more than acceptable) and skewness quality (maximum 0.94; i.e., more than acceptable) [32]. However, due to various crevices, it was difficult for all of the growth AOR models to satisfy the orthogonal and skewness qualities. Thus, we improved the mesh quality of all the growth models until the percentage of meshes satisfying the mesh quality reached 99.995%. We also considered the number of elements in the flow field by adjusting several mesh sizes and examined the mesh independence of the plate model using drag coefficients and wake volumes (Figure 5). The drag coefficients converged with an average of 0.79 for ≥20 million elements, and the wake volumes converged to ~1472 cm3 for ≥40 million elements. As our key focus was to identify the wake volumes of the AOR models, all of the analyses were performed to satisfy the number of elements of 40 million or more.

2.3. Wake Volume and Evaluation Indices

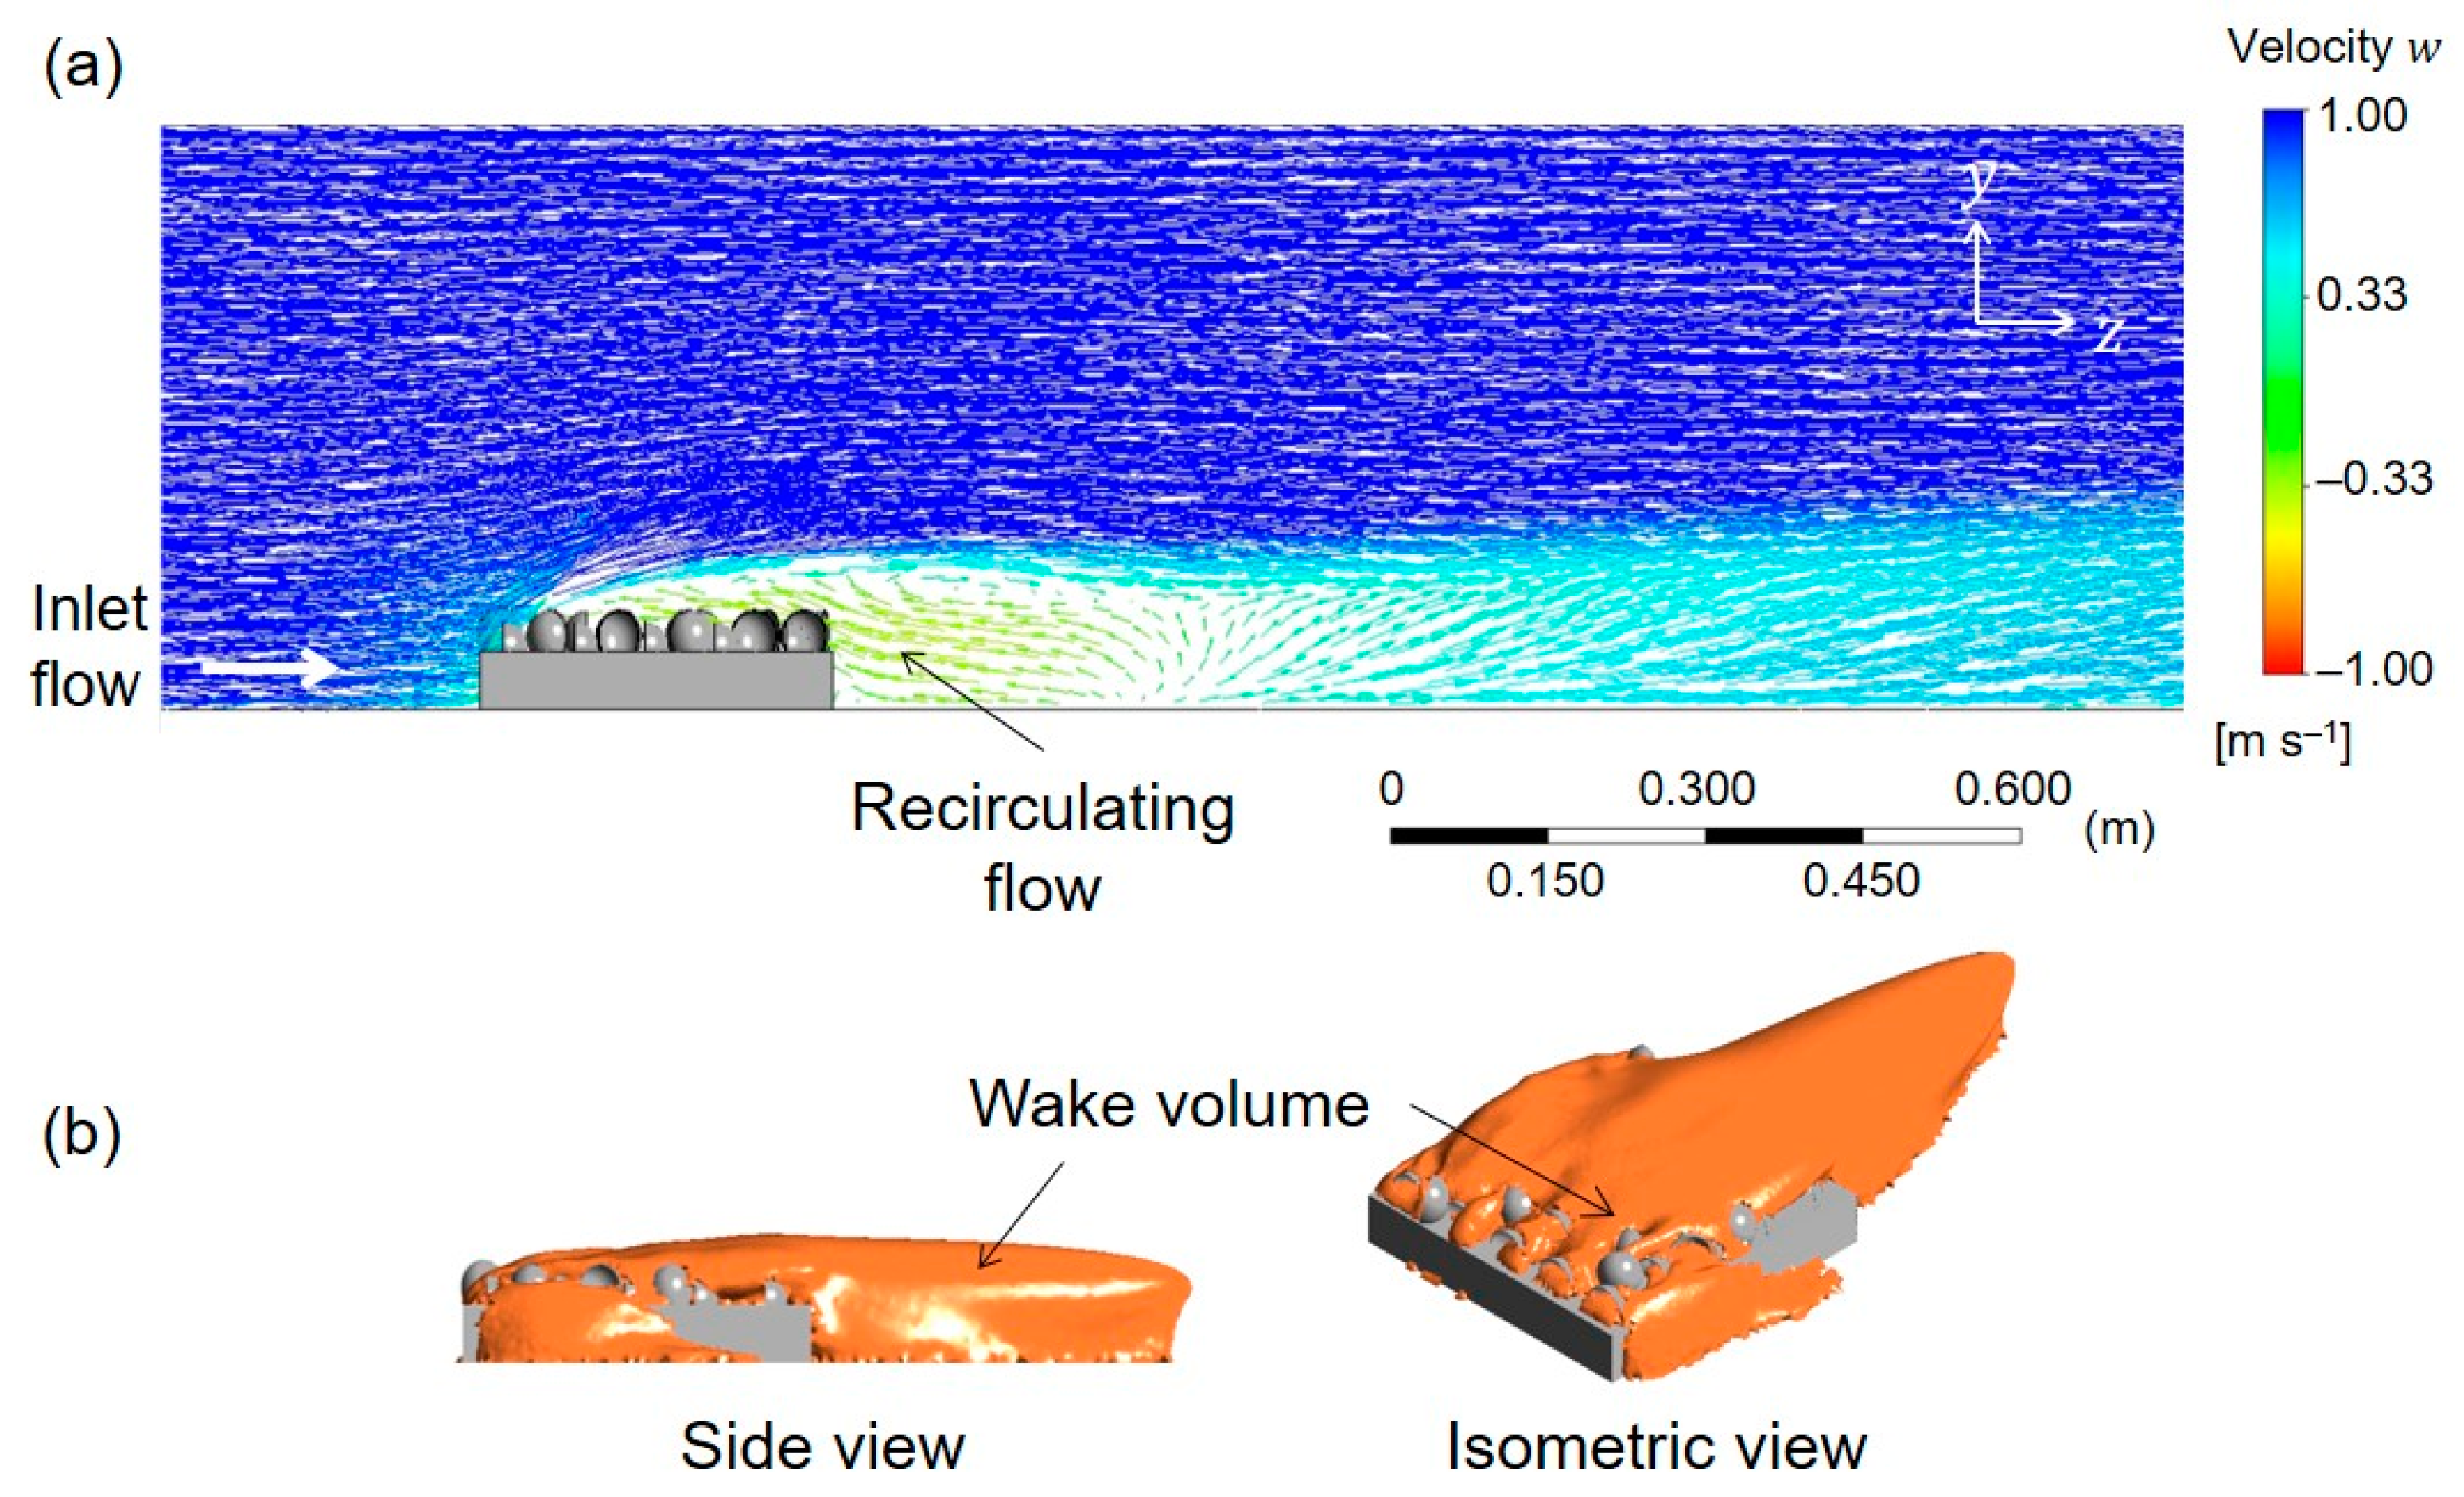
The wake region, an important flow characteristic in artificial reefs research, is a space in a region downstream of the artificial reef where recirculating flow occurs (Figure 6a). This region has a significantly reduced flow velocity compared to the external flow velocity field and contains a large amount of nutrients from the seabed due to the relatively stagnant recirculation flow. For this reason, many marine organisms utilize the wake region as a resting, spawning, and/or feeding ground [36,37,38,39]. Various measures such as wake area and wake length have been used to quantify the wake region [40]. However, wake area and length cannot capture the three-dimensional characteristics of the wake region as these values depend on the selection of a reference plane. To solve this problem, we used the wake volume concept proposed by Kim et al. [41], utilizing the EbFVM, as illustrated Figure 6b. The wake volume of each model was obtained as follows. First, each element was regarded as a finite wake volume if water flows at the nodes were all recirculating water flows. Second, the total wake volume was obtained by collecting the finite wake volumes (or elements). Once the wake volumes ( W V A O R ) of the 96 AOR models were obtained, we normalized these volumes with respect to the wake volume of the plate-only model ( W V p l a t e ), such that W V ¯ = W V A O R / W V p l a t e .
The structural characteristics of submerged structures influence the surrounding flow characteristics [28,42]. Consequently, we established evaluation indices to correlate the structural characteristics with the flow characteristics of the AOR models. First, we used the EI proposed by Kim et al. [28] to quantify the efficiency of the wake volume ( W V A O R ) of the 96 AOR models with respect to their structural volumes ( V A O R ), i.e., E I = W V A O R / V A O R . According to Kim et al. [28], the wake volume efficiency is regarded to be excellent if E I 2 , indicating that the wake volume is more than twice the structural volume. Second, we proposed the improved blocking index (hereinafter, BI), reflecting the blocking index conceptually stated by Kim et al. [43] and clearly proposed by Jung et al. [44]. The original blocking index ( ϕ b ) is defined by the ratio of the actual front surface area ( A f ) to the blocking front surface area ( A f b ), of which the front part of the structure is completely blocked, i.e., ϕ b = A f / A f b . Here, the front surface is the one perpendicular to the inlet flow. This index has been used to quantify the water blocking effect of the front surface area on the wake volume [44]. However, considering the structural characteristics of the AOR models (e.g., irregular aggregations and crevices), the blocking index is not easy to simulate. Thus, we devised an improved B I defined by the ratio of the projection area ( A p ) of each AOR in the inlet flow direction to the front curtain area ( A c ), i.e., B I = A p / A c . Here, the front curtain area is defined by the product of the reef width ( W ) and the water depth ( D ), i.e., A c = W × D . Third, we used the surface complexity index (hereinafter, SI), which is the ratio of the total surface area ( A t ) of each AOR model to its bottom projection area ( A b ), i.e., ϕ s = A t / A b . The bottom projection area is defined by the product of the reef length ( L ) and the reef width ( W ), i.e., A b = L × W . Accordingly, the surface complex index is a surface area-based complexity measure and is similar to the one proposed by Jung et al. [44].

3. Results and Discussion

3.1. Initial AOR Model

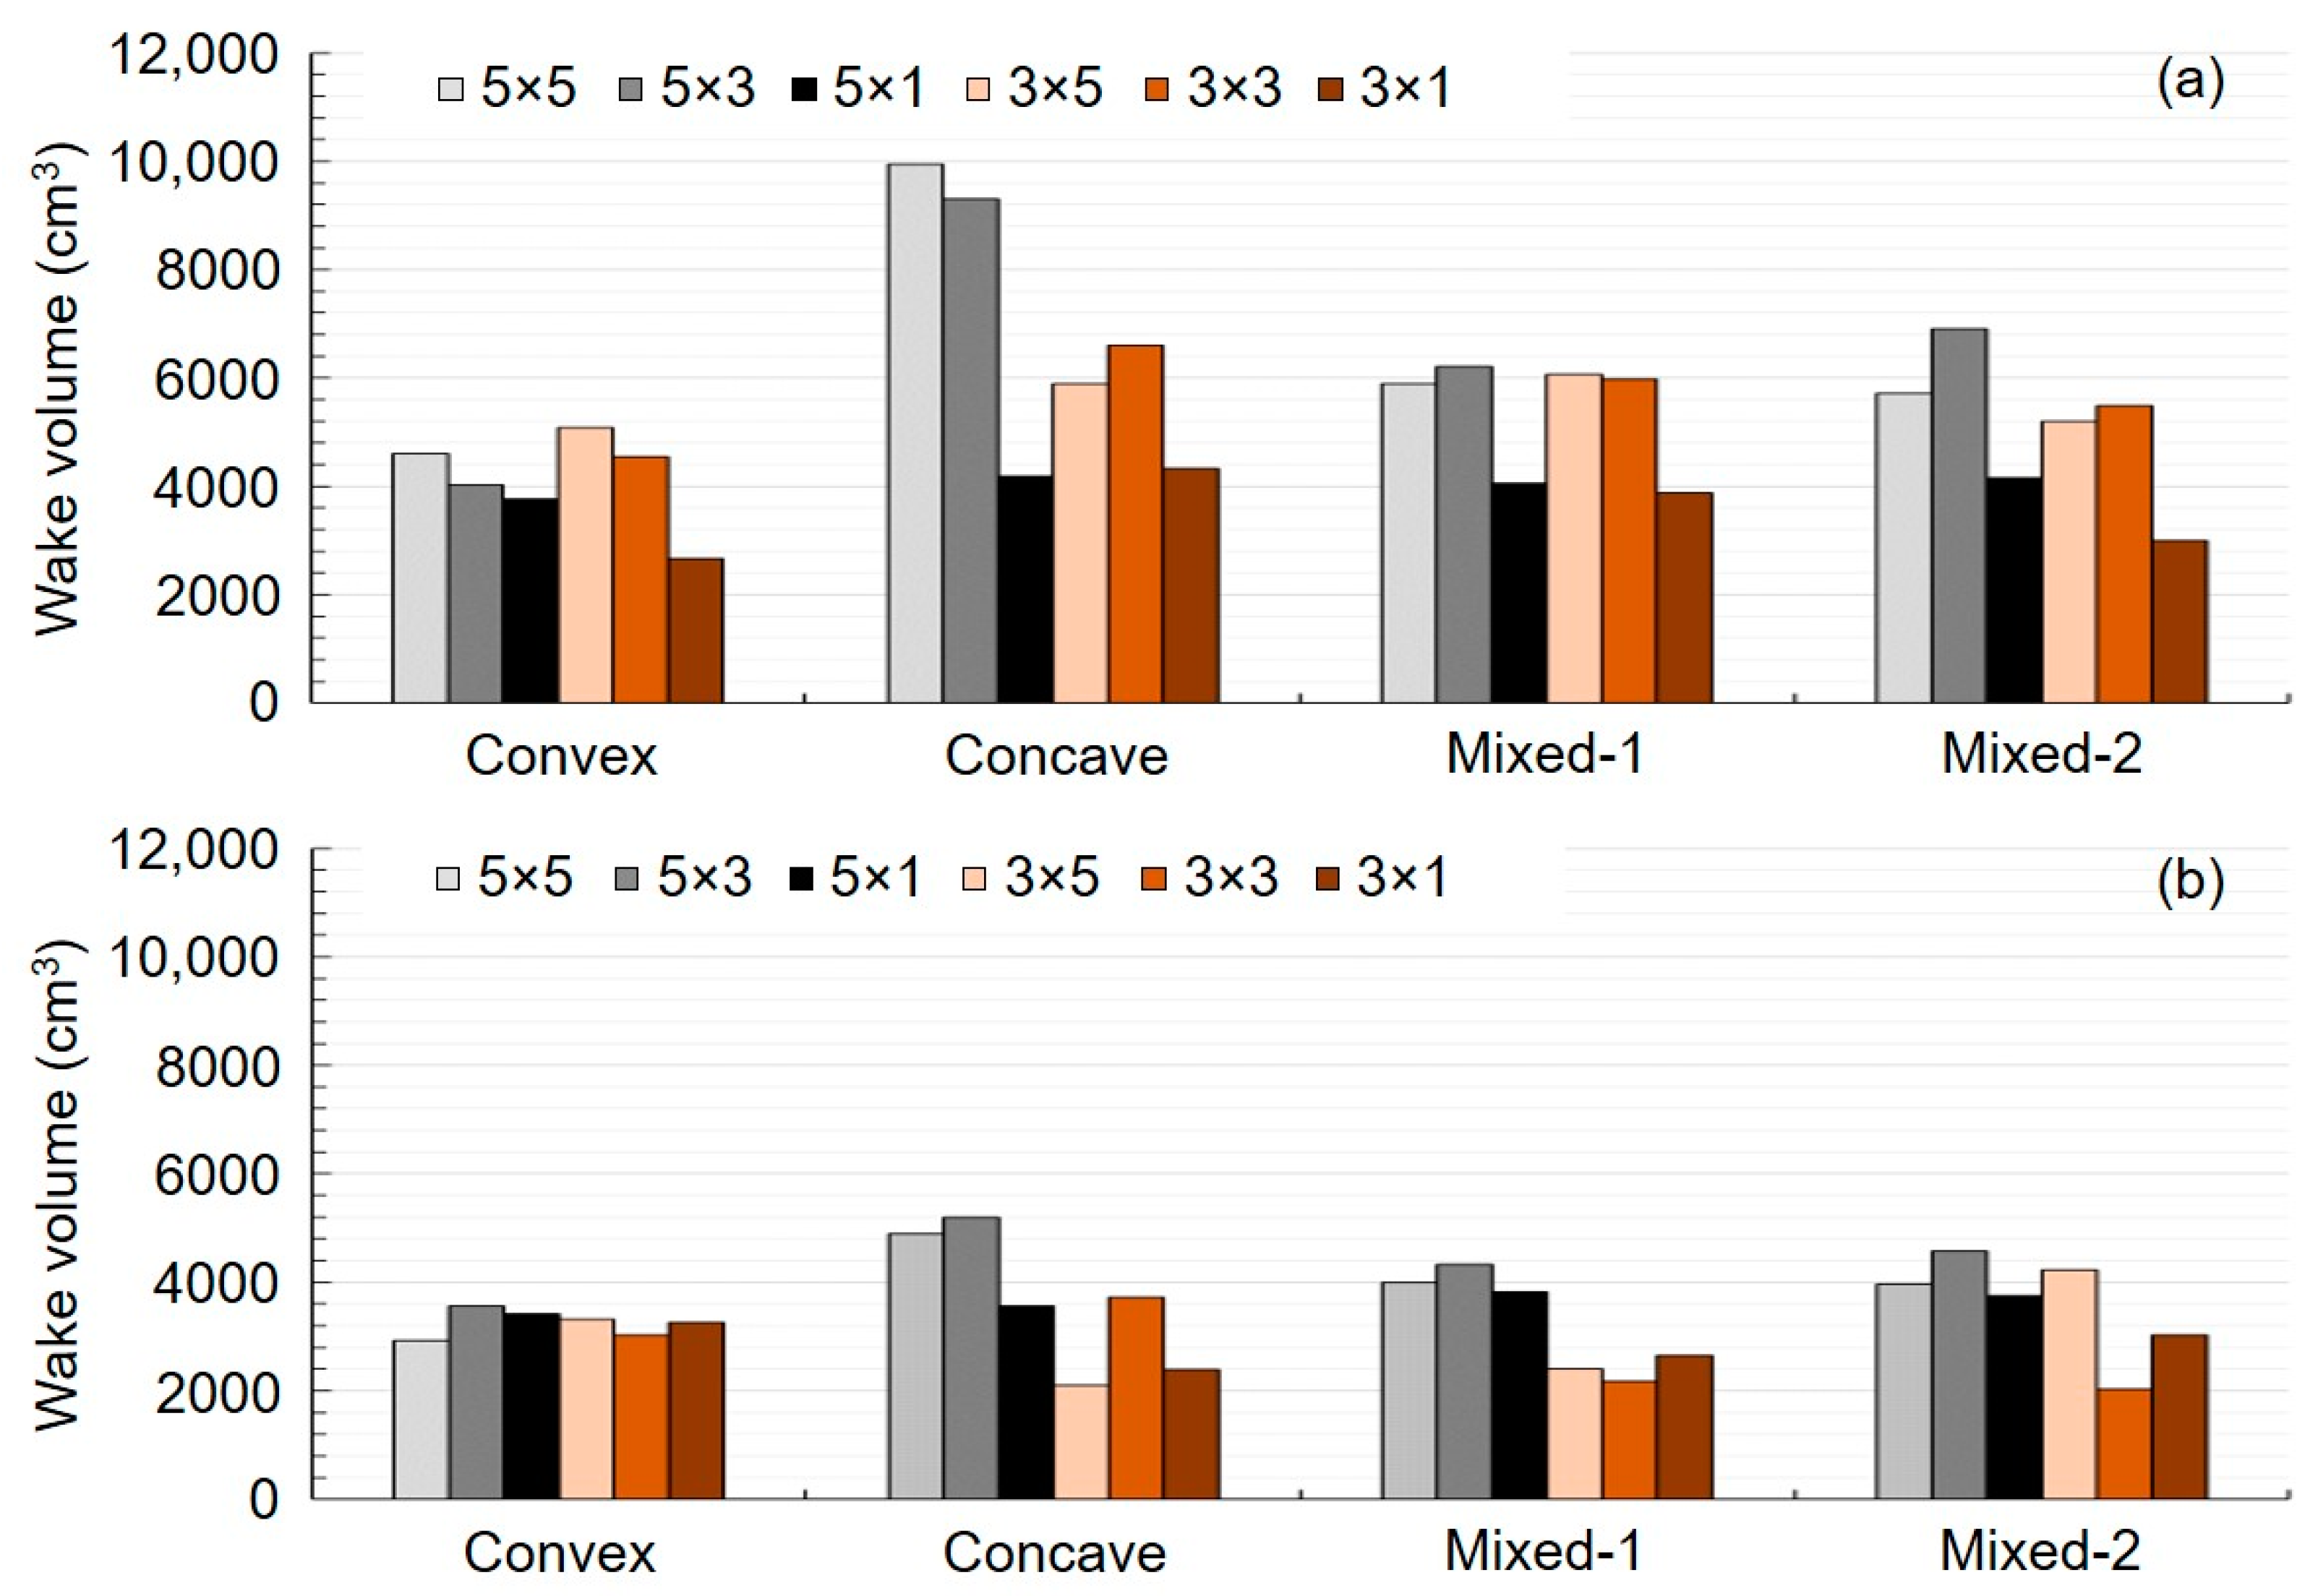
Figure 7a shows the wake volumes of the 48 initial AOR models when the shell penetration depth was 10%. The wake volumes of the 24 models (i.e., 4 orientations × 6 compositions) ranged from 2664–9943 cm3 with an average of 5310 cm3. These wake volumes were 1.83–6.84 times higher than that of the plate model (1454 cm3). Figure 7b shows the 24 wake volumes when the shell penetration depth was 50%. The range of the wake volumes was 2036–5204 cm3 (average: 3431 cm3), 1.40–3.58 times higher than that of the plate model. Our results showed that the high-relief reef models (i.e., 10% penetration depth) resulted in larger wake volumes than the low-relief reef models (i.e., 50% penetration depth). This observation becomes clearer when we compare the wake volumes of the 48 initial AOR models with that of the plate-only model. Considering the shell orientations, the concave orientation resulted in larger wake volumes, particularly when the shell compositions were 5 × 5 and 5 × 3 for both shell penetration depths. Accordingly, the two largest wake volumes of 9943 and 9297 cm3 were generated when the shell penetration depth was 10%, the shell orientation was concave, and the shell compositions were 5 × 5 and 5 × 3, respectively.

3.2. Growth AOR Models

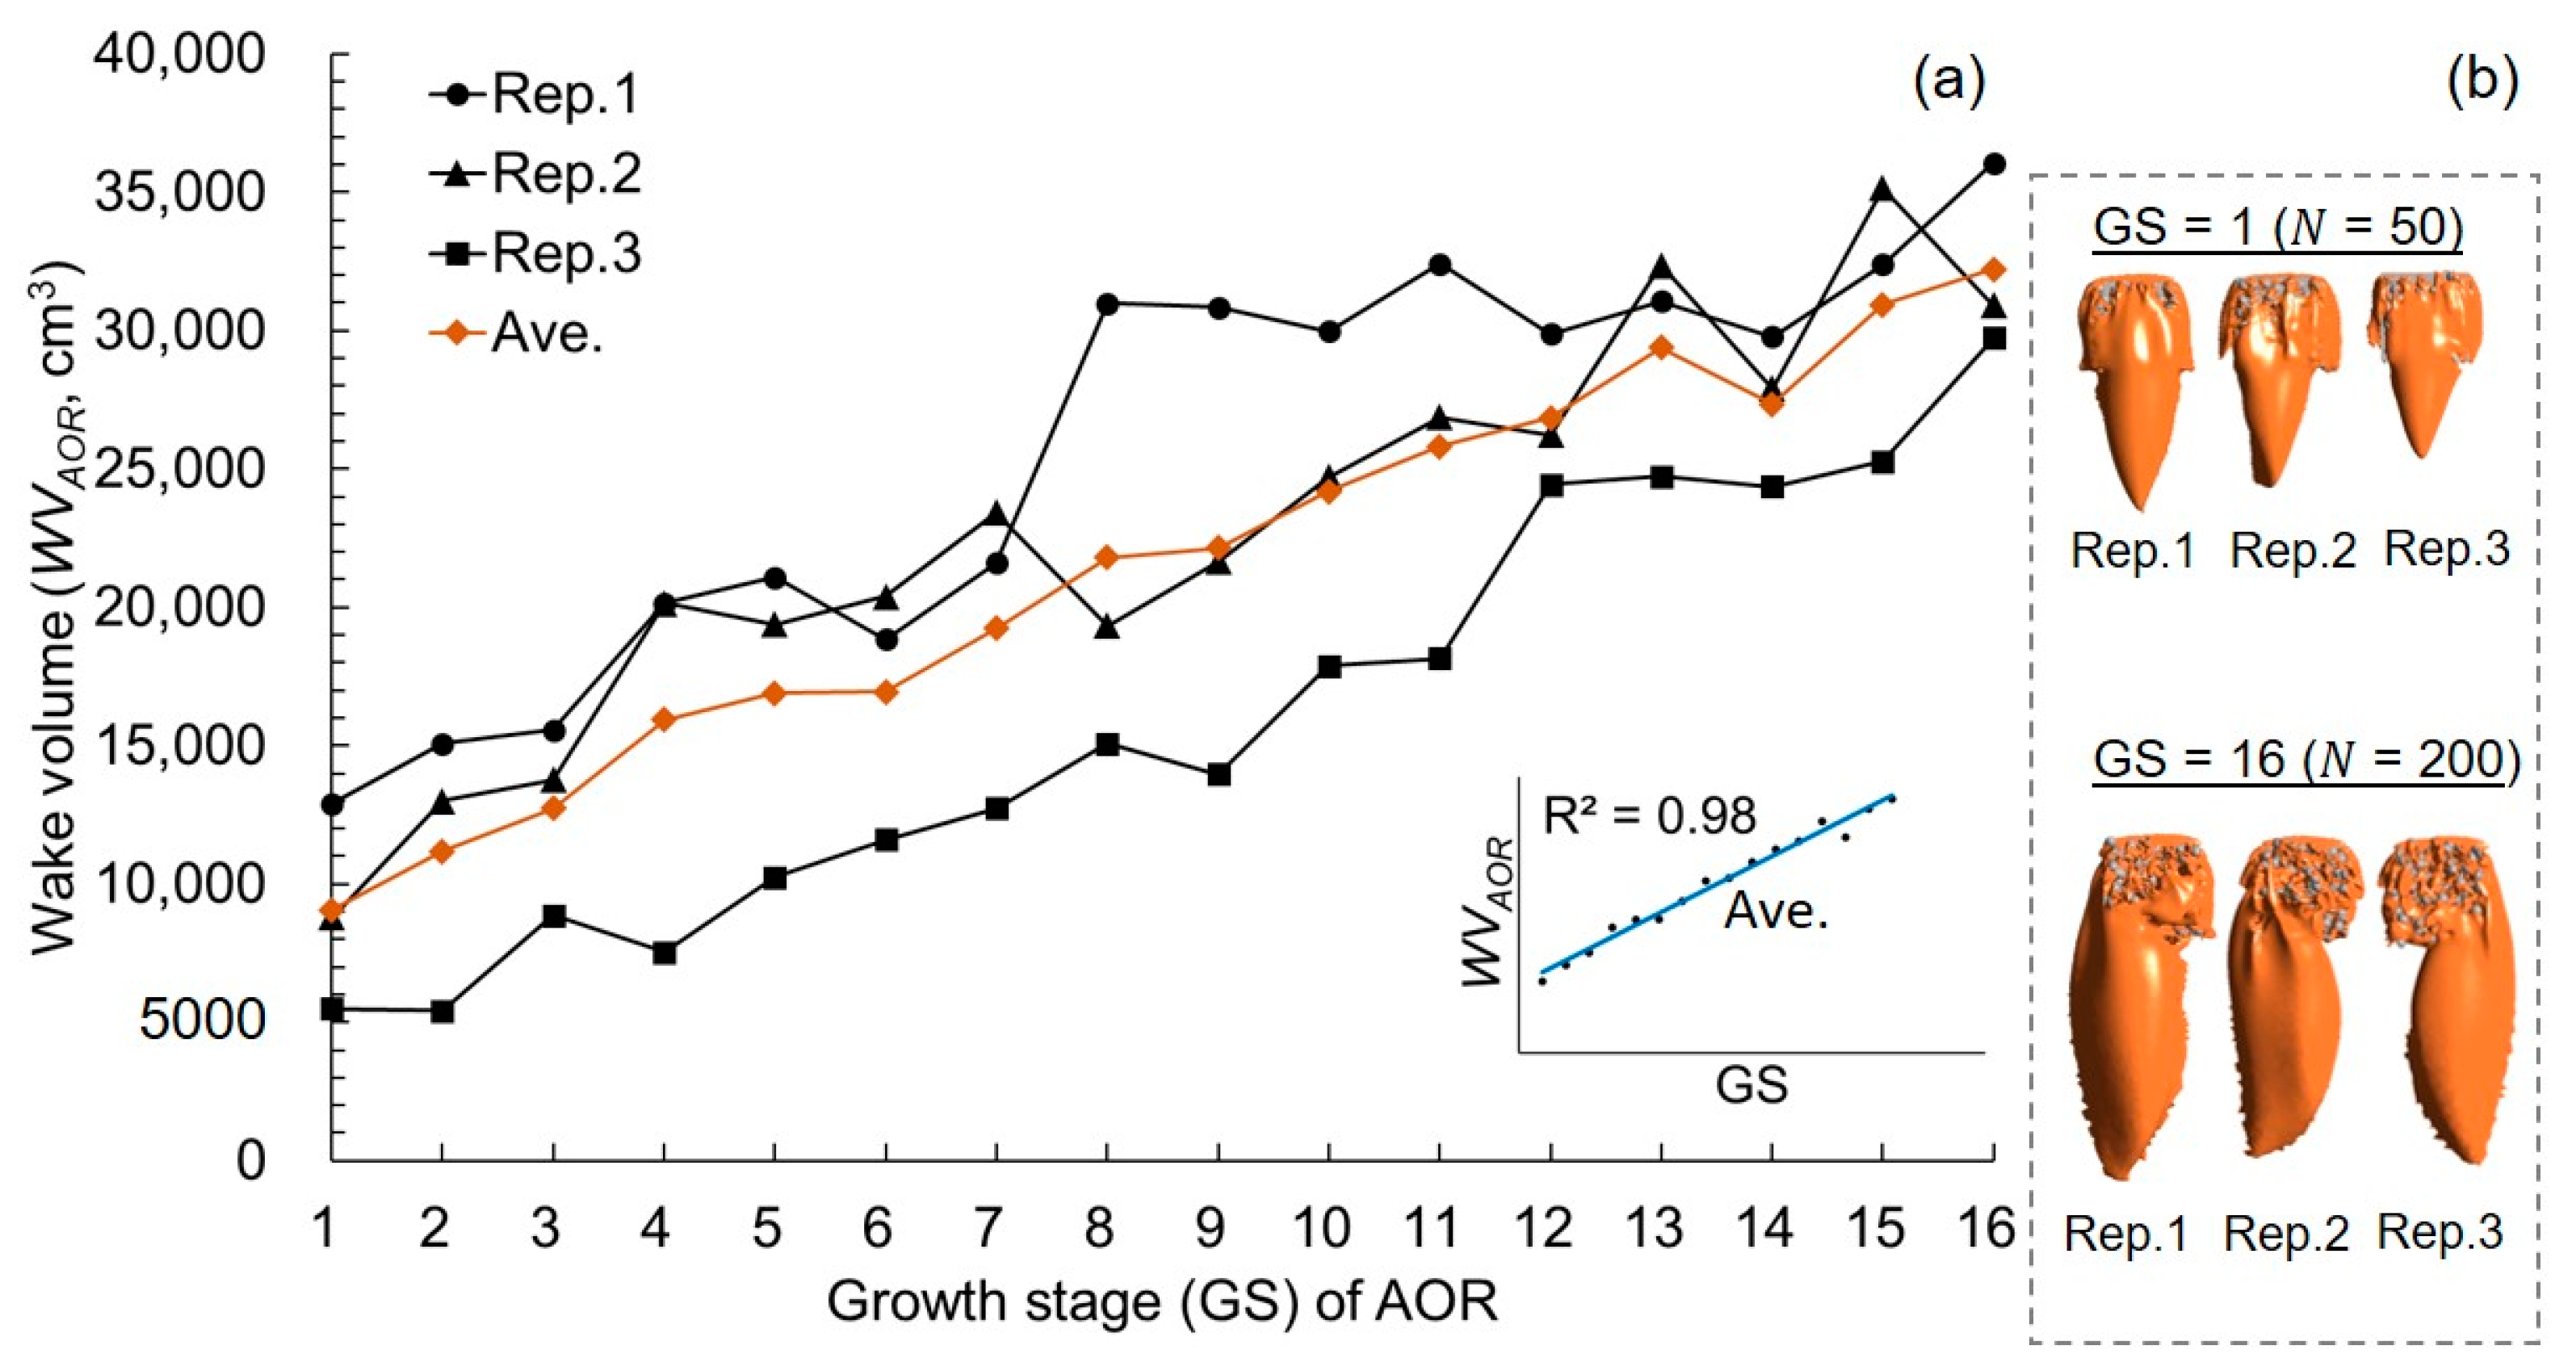
Figure 8a shows the correlation between the growth stages of the AOR models and their wake volumes. The wake volume increased as the growth stage increased, and the correlation coefficient was R 2 = 0.98 when considering the average values. For example, the average wake volumes were 9063 and 32,226 cm3 for the 1st growth stage (50 oyster shells) and the 16th growth stage (200 oyster shells), respectively, indicating an increase of ~3.56 times; these two wake volumes (GS = 1 and GS = 16) are shown in Figure 8b.
Figure 9a shows the normalized wake volumes ( W V ¯ ) of the AOR models and their correlation with the numbers of oyster shells ( N ) introduced to the models. According to the correlation coefficient of R 2 = 0.89 , the positive correlation was linearly significant, indicating that the number of oyster shells is critical in increasing W V ¯ . Figure 9b also shows a positive linear correlation ( R 2 = 0.91 ) between W V ¯ and the structural volumes of the AOR models. Figure 9 therefore indicates that the number of oyster shells is a key factor for increasing the structural volumes of the AOR models and their wake volumes.
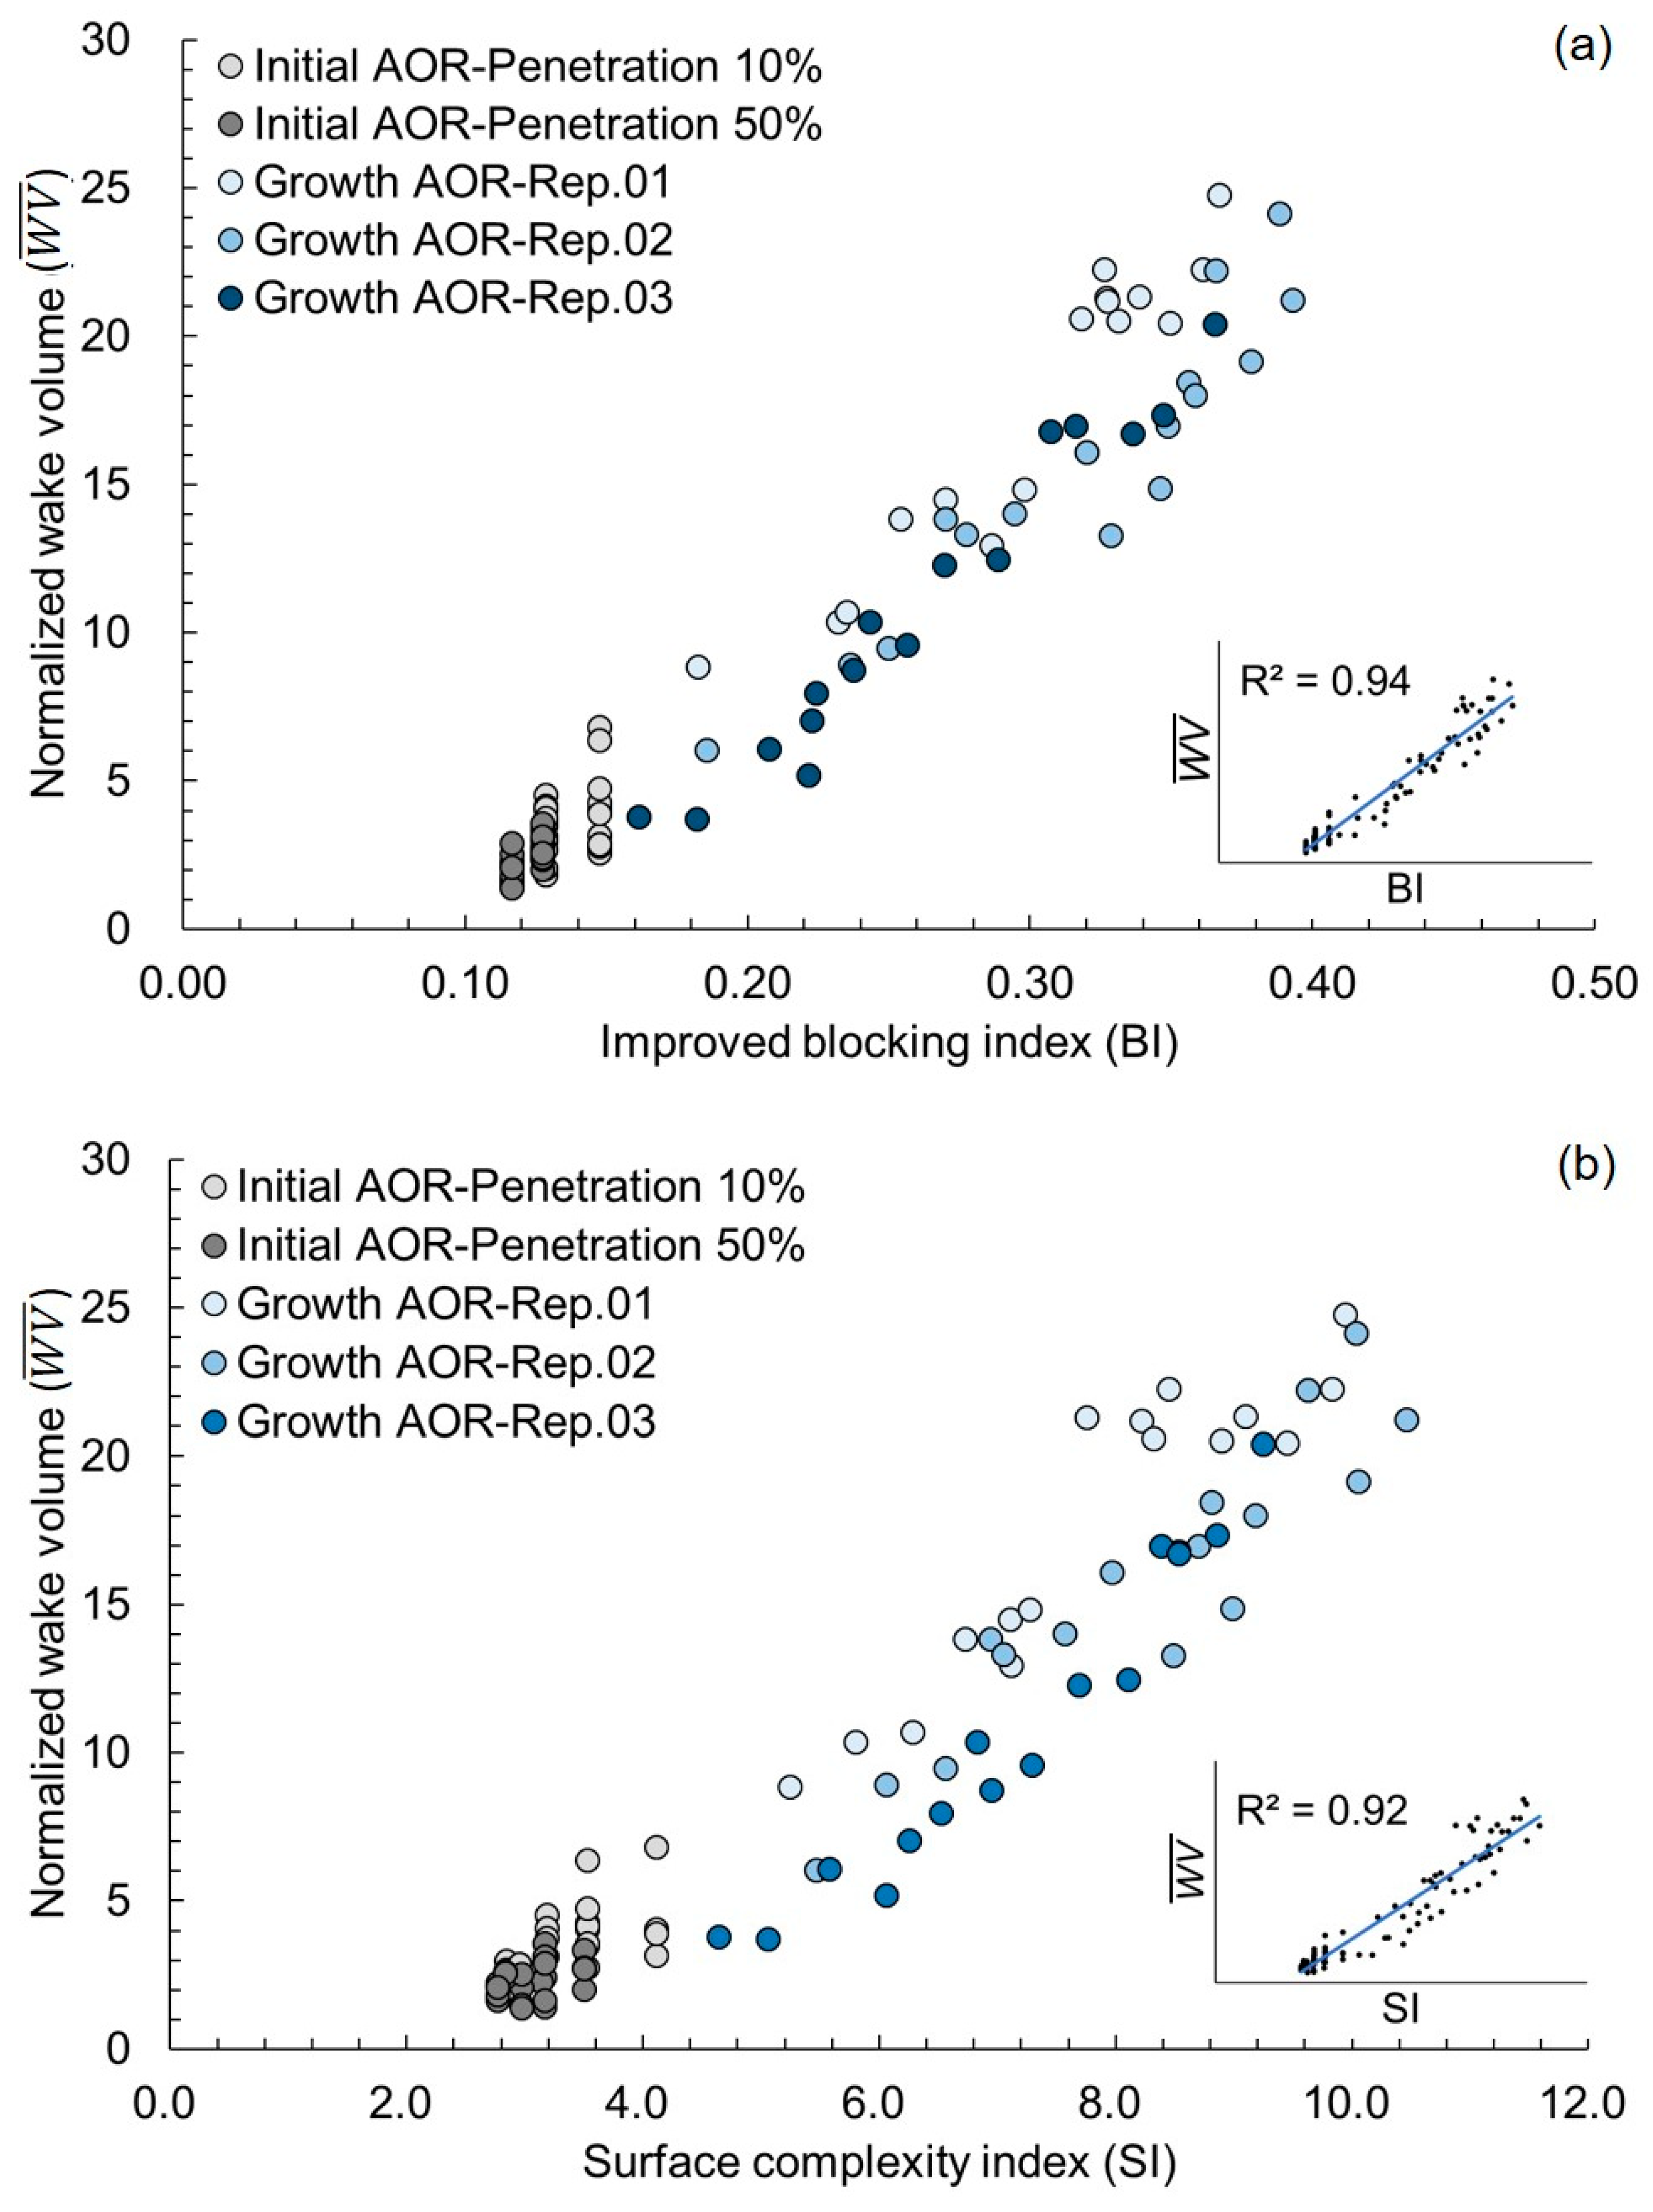
Figure 10a shows W V ¯ of the AOR models and their correlations with the improved BIs. The correlation of the BIs with W V ¯ was significant ( R 2 = 0.94 with a linear trend line); hence, it is shown that the blocking area of an AOR model can help create W V ¯ . A similar observation was made when Jung et al. [44] obtained the BIs of artificial reefs to quantify their wake volumes. Moreover, fluid flow activity around an oyster reef on the seabed causes sediments to accumulate inside over time. This phenomenon is expected to increase the BI and, consequently, the wake volume. Figure 10b shows the correlation between W V ¯ of the AOR models with the surface complexity indices (SIs). The correlation of the SIs with W V ¯ was significant ( R 2 = 0.92 with a linear trend line); this demonstrates that the surface complexity of an AOR model can also help create its wake volume. Considering the ranges of SIs ( 2.77 S I 4.11 and 4.64 S I 10.46 for the initial and growth AOR models, respectively), each growth AOR model increased its surface complexity and W V ¯ .
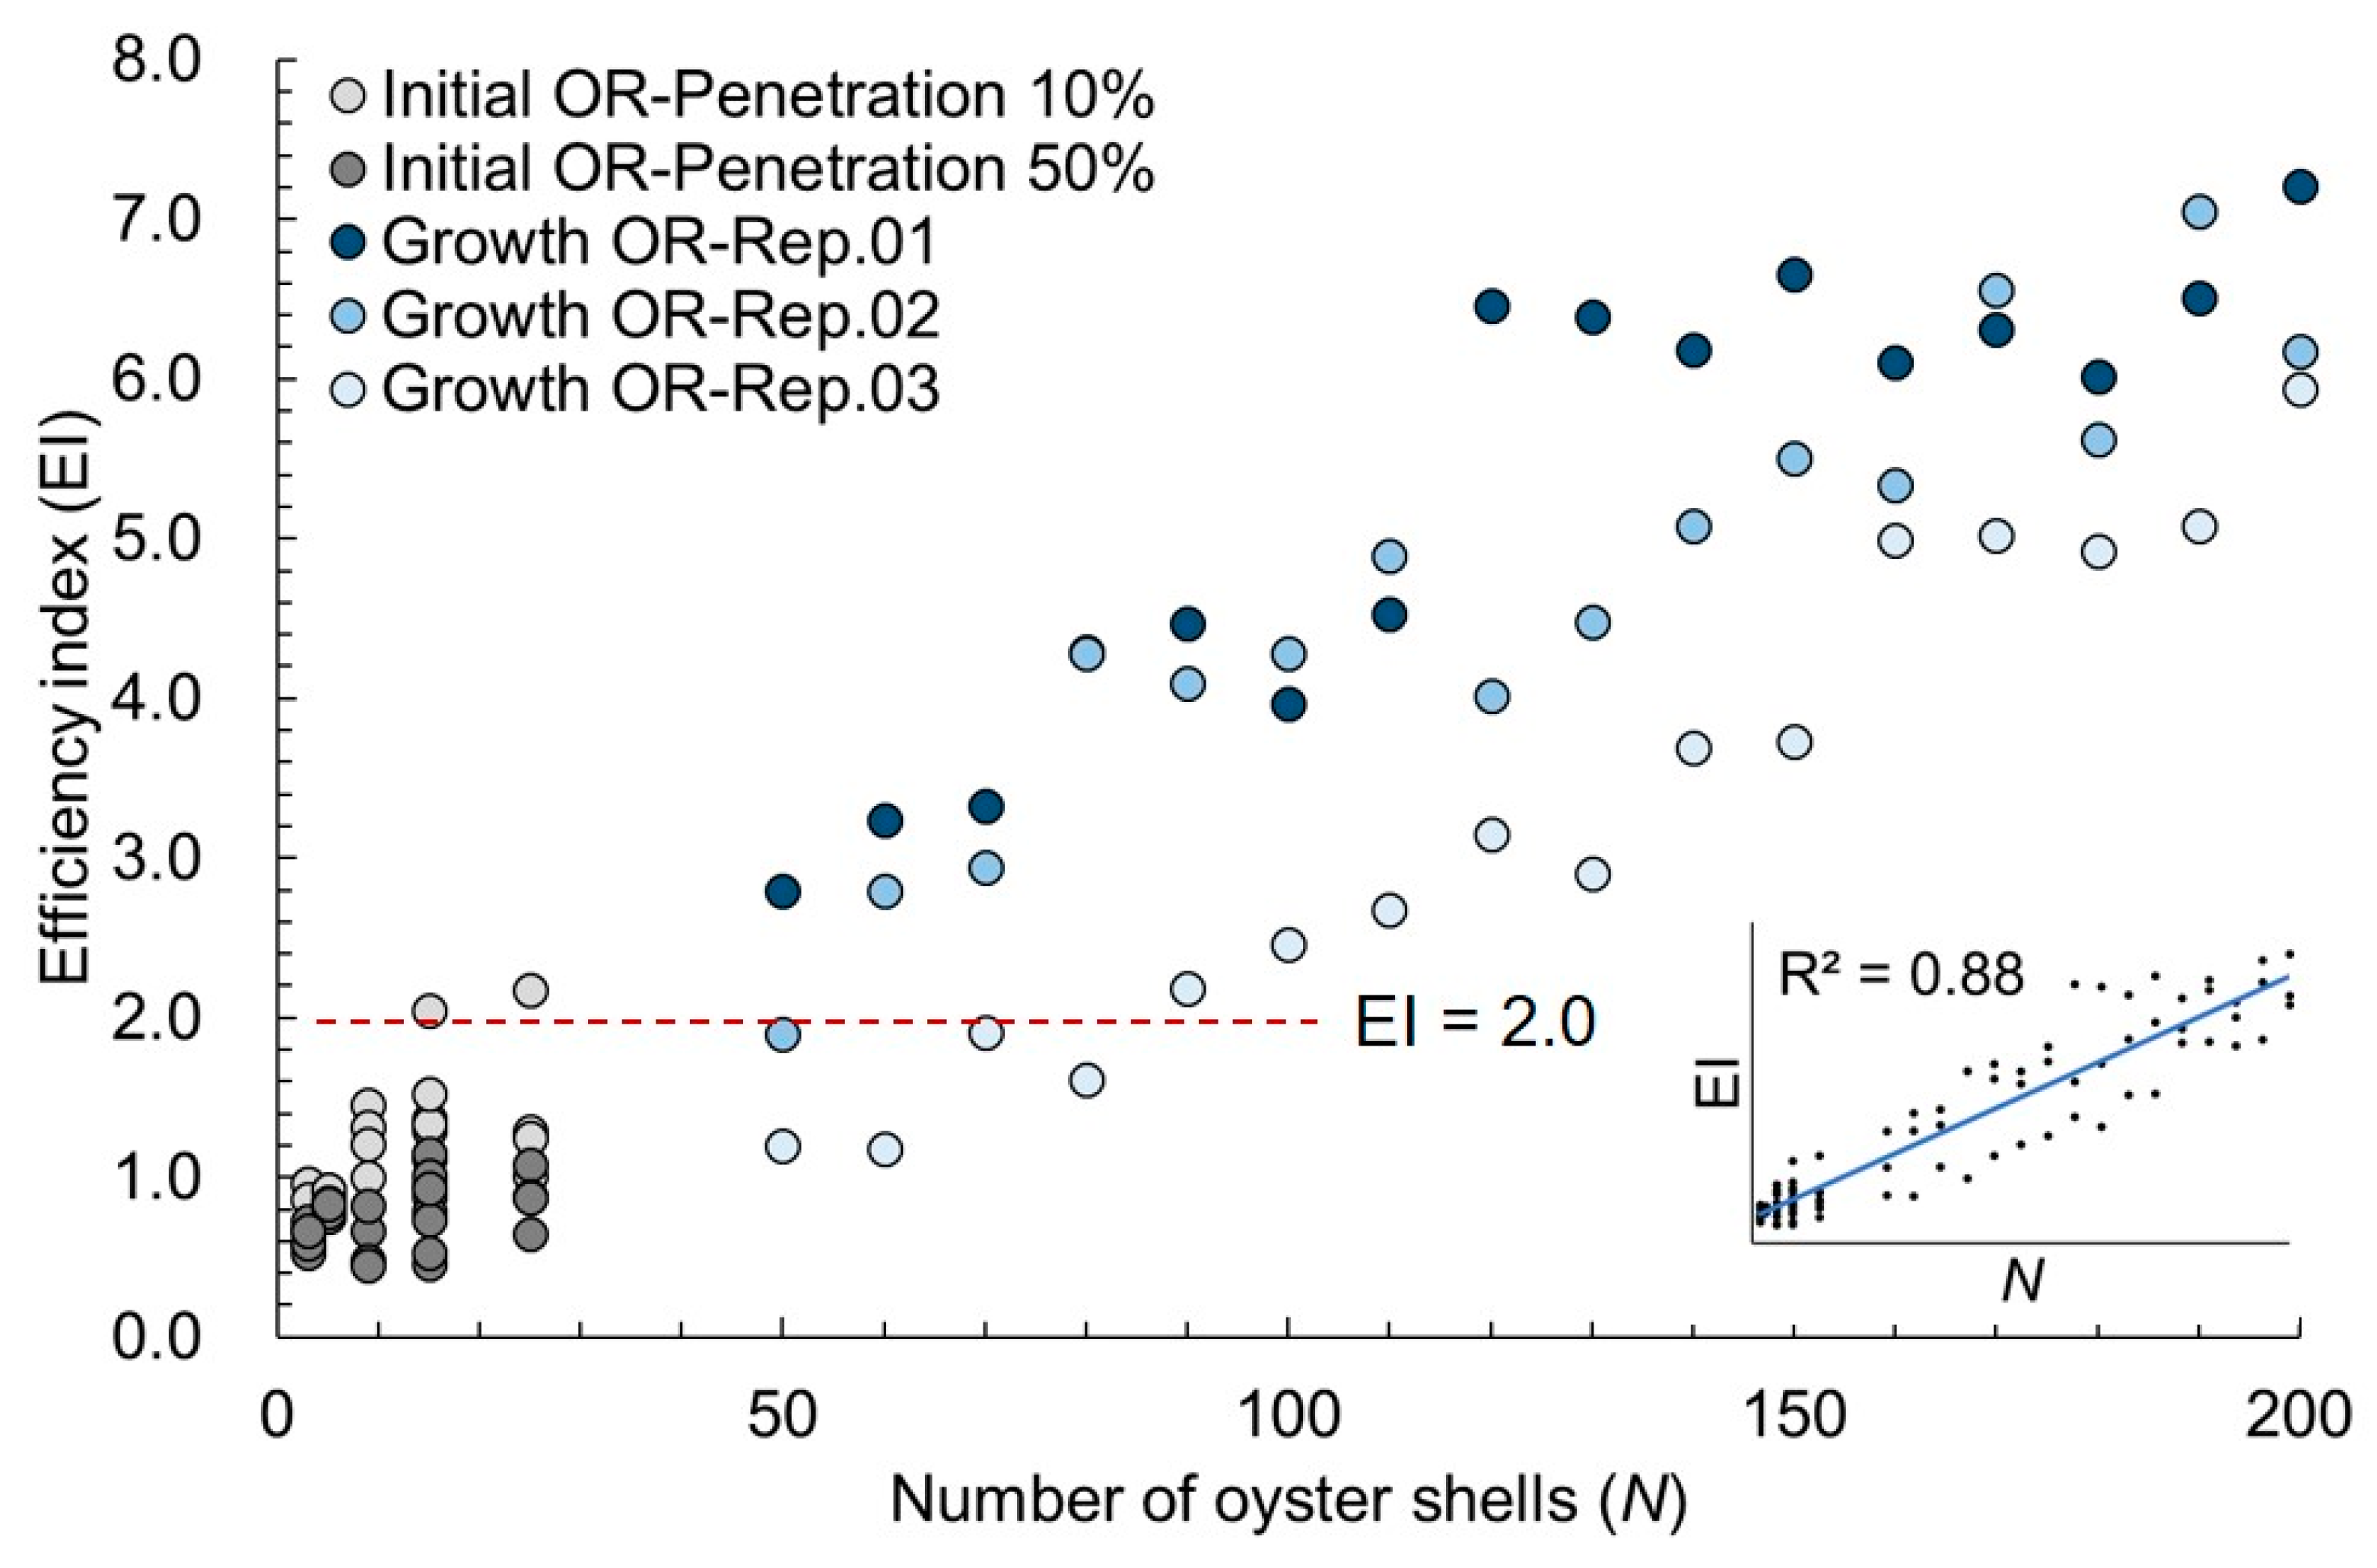
Figure 11 shows the EIs of the 96 AOR models and their correlation with the number of oyster shells ( N ). According to their significant linear correlation (i.e., R 2 = 0.88 with a linear trend line), the EI increased linearly with the number of oyster shells. The EIs ranged from 0.45–7.21, and 89.6% of the growth AOR models (i.e., 43 models among 48) had an E I 2.0 (Figure 11). Reflecting that only 26% of the 34 representative artificial reefs in South Korea satisfy the efficiency range of E I 2.0 [28], growth AOR models would be required to establish the necessary wake volume, as opposed to conventional artificial reef structures. This is because the growth AOR models have surface irregularities (or roughness) due to the oyster shell accumulations. Here, the criterion E I 2.0 indicates that the wake volume generated is more than twice that of the reef volume; hence, the criterion has been recommended as a design condition of an artificial reef [28]. In this respect, such a growth AOR model is ideal if it has a certain number of oyster shells (e.g., N 50 per the plate area of 900 cm2) for the given composition.
So far, it has been shown that W V ¯ increased with the number of oyster shells ( N ), BI, and SI. Moreover, the EI increased with the number of oyster shells ( N ). Therefore, it is necessary to clarify the correlations between the three evaluation indices: EI, BI, and SI. Figure 12 shows a strong linear correlation between each pair of the three indices (i.e., R 2 = 0.94 for EI vs. BI; R 2 = 0.92 for EI vs. SI; and R 2 = 0.98 for SI vs. BI). This indicates that the number of oyster shells simultaneously contributes to EI, BI, and SI, although there are some slight deviations depending on the shell orientation, composition, and penetration depth. According to Jung et al. [44], conventional artificial reefs in South Korea generally do not simultaneously have a certain degree of rugosity (i.e., surface complexity) and a water blocking effect. For example, a tunnel or arch-type artificial reef has a certain degree of rugosity (e.g., 2.0), whereas a cube or box-type artificial reef has a certain degree of water blocking effect (e.g., 0.5). This comparison illustrates that the AOR models (i.e., the oyster shells accumulated on the plate substrate) have relatively good structural characteristics. In other words, the growth stage (or the number of oyster shells) can be regarded as a design variable as it is a necessary component for all three evaluation indices as well as for W V ¯ .
Despite the limitations of the shell models (i.e., equal shell size, equal plate substrate, and single shell segment), the current AOR models provide insight into the construction of AORs in coastal waters. We can control the normalized wake volume simply by adjusting the number of oyster shells on the plate substrate without pinpointing the shell orientation, composition, or penetration depth. Moreover, the criterion for wake volume efficiency (i.e., EI 2.0 ) can be obtained when the number of shells reaches N 50 per 900 cm2.

4. Conclusions

This study proposed the hypothesis that “a unique wake region is formed around an AOR due to its structural characteristics”. To test the hypothesis, we asked whether the structural characteristics of an AOR have an effect on its wake region and what their correlation is. To answer these questions, we established 96 AOR models, carried out flow analyses, and obtained their wake volumes and the related evaluation indices. Considering shell orientation, composition, penetration depth, and growth stage, we found that the growth stage is most critical to the normalized wake volume. This implies that the number of oyster shells is the most critical factor in securing a normalized wake volume considering the establishment of the growth stages in the AOR models. Their correlation was linear and significant ( R 2 = 0.89 ); thus, we can control the normalized wake volume by simply adjusting the number of oyster shells on the plate substrate without pinpointing the shell orientation, composition, or penetration depth. The correlations of the normalized wake volume with the improved BI and SI were linear and significant ( R 2 = 0.94 and R 2 = 0.92 , respectively). This indicates that the number of shells is closely connected to the indices; hence, their strong linear correlations were also verified. The EI also increased with the number of oyster shells, and the linear correlation shows that the criterion for wake volume efficiency (i.e., EI 2.0 ) can be obtained when the number of shells reaches N 50 per 900 cm2. Therefore, the growth stage (or number of oyster shells) can be regarded as a design variable when establishing an AOR in coastal waters as it responds sensitively to both the three evaluation indices (BI, SI, and EI) and the normalized wake volume.

Author Contributions

Conceptualization, M.K. and W.-B.N.; methodology, M.K., S.J. and W.-B.N.; software, M.K., S.J. and T.V.C.; validation, S.J., T.V.C. and W.-B.N.; formal analysis, M.K., S.J. and W.-B.N.; investigation, M.K., S.J., T.V.C. and W.-B.N.; resources, M.K., S.J., T.V.C. and W.-B.N.; data curation, M.K., S.J. and W.-B.N.; writing—original draft preparation, M.K.; writing—review and editing, W.-B.N.; visualization, M.K., S.J. and W.-B.N.; supervision, W.-B.N.; project administration, W.-B.N.; funding acquisition, W.-B.N. All authors have read and agreed to the published version of the manuscript.

Funding

This research was supported by Korea Institute of Marine Science & Technology Promotion (KIMST) and was funded by the Ministry of Ocean and Fisheries (20220252).

Institutional Review Board Statement

Not applicable.

Informed Consent Statement

Not applicable.

Data Availability Statement

Not applicable.

Conflicts of Interest

The authors declare no conflict of interest.

References

  1. Yamaguchi, K. Shell structure and behaviour related to cementation in oysters. Mar. Biol. 1994, 118, 89–100. [Google Scholar] [CrossRef]
  2. Reeves, S.E.; Renzi, J.J.; Fobert, E.K.; Silliman, B.R.; Hancock, B.; Gillies, C.L. Facilitating better outcomes: How positive species interactions can improve oyster reef restoration. Front. Mar. Sci. 2020, 7, 656. [Google Scholar] [CrossRef]
  3. Gillies, C.L.; Castine, S.A.; Alleway, H.K.; Crawford, C.; Fitzsimons, J.A.; Hancock, B.; Koch, P.; McAfee, D.; McLeod, I.M.; zu Ermgassen, P.S.E. Conservation status of the Oyster Reef Ecosystem of Southern and Eastern Australia. Glob. Ecol. Conserv. 2020, 22, e00988. [Google Scholar] [CrossRef]
  4. Sharma, S.; Goff, J.; Moody, R.M.; Byron, D.; Heck, K.L., Jr.; Powers, S.P.; Ferraro, C.; Cebrian, J. Do restored oyster reefs benefit seagrasses? An experimental study in the Northern Gulf of Mexico. Restor. Ecol. 2016, 24, 306–313. [Google Scholar] [CrossRef]
  5. Glenn, M.; Mathieson, A.; Grizzle, R.; Burdick, D. Seaweed communities in four subtidal habitats within the Great Bay estuary, New Hampshire: Oyster farm gear, oyster reef, eelgrass bed, and mudflat. J. Exp. Mar. Biol. Ecol. 2020, 524, 151307. [Google Scholar] [CrossRef]
  6. Barbier, E.B.; Hacker, S.D.; Kennedy, C.; Koch, E.W.; Stier, A.C.; Silliman, B.R. The value of estuarine and coastal ecosystem services. Ecol. Monogr. 2011, 81, 169–193. [Google Scholar] [CrossRef]
  7. Weaver, R.J.; Stehno, A.; Bonanno, N.; Sager, A.; Kenny, A.; Zehnder, J.A.; Glasser, C.; Allen, A. Scale model design of oyster reef structures as part of a showcase living shoreline project. Shore Beach 2017, 85, 41–54. [Google Scholar]
  8. Styles, R. Flow and turbulence over an oyster reef. J. Coast. Res. 2015, 31, 978–985. [Google Scholar] [CrossRef]
  9. Kitsikoudis, V.; Kibler, K.M.; Walters, L.J. In-situ measurements of turbulent flow over intertidal natural and degraded oyster reefs in an estuarine lagoon. Ecol. Eng. 2020, 143, 105688. [Google Scholar] [CrossRef]
  10. Hitzegrad, J.; Brohmann, L.; Pfennings, K.; Hoffmann, T.K.; Eilrich, A.K.; Paul, M.; Welzel, M.; Schlurmann, T.; Aberle, J.; Wehrmann, A.; et al. Oyster reef surfaces in the central Wadden Sea: Intra-reef classification and comprehensive statistical description. Front. Mar. Sci. 2022, 9, 808018. [Google Scholar] [CrossRef]
  11. Humphries, A.T.; La Peyre, M.K.; Decossas, G.A. The effect of structural complexity, prey density, and “predator-free space” on prey survivorship at created oyster reef mesocosms. PLoS ONE 2011, 6, e28339. [Google Scholar] [CrossRef] [PubMed] [Green Version]
  12. Walles, B.; Mann, R.; Ysebaert, T.; Troost, K.; Herman, P.M.J.; Smaal, A.C. Demography of the ecosystem engineer Crassostrea gigas, related to vertical reef accretion and reef persistence. Estuar. Coast. Shelf Sci. 2015, 154, 224–233. [Google Scholar] [CrossRef]
  13. Loke, L.H.L.; Chisholm, R.A. Measuring habitat complexity and spatial heterogeneity in ecology. Ecol. Lett. 2022, 25, 2269–2288. [Google Scholar] [CrossRef] [PubMed]
  14. Windle, A.E.; Puckett, B.; Huebert, K.B.; Knorek, Z.; Johnston, D.W.; Ridge, J.T. Estimation of intertidal oyster reef density using spectral and structural characteristics derived from unoccupied aircraft systems and structure from motion photogrammetry. Remote Sens. 2022, 14, 2163. [Google Scholar] [CrossRef]
  15. Howie, A.H.; Bishop, M.J. Contemporary oyster reef restoration: Responding to a changing world. Front. Ecol. Evol. 2021, 9, 689915. [Google Scholar] [CrossRef]
  16. O’Beirn, F.X.; Luckenbach, M.W.; Nestlerode, J.A.; Coates, G.M. Toward design criteria in constructed oyster reefs: Oyster recruitment as a function of substrate type and tidal height. J. Shellfish Res. 2000, 19, 387–395. [Google Scholar]
  17. Soniat, T.M.; Finelli, C.M.; Ruiz, J.T. Vertical structure and predator refuge mediate oyster reef development and community dynamics. J. Exp. Mar. Biol. Ecol. 2004, 310, 163–182. [Google Scholar] [CrossRef]
  18. McAfee, D.; McLeod, I.M.; Boström-Einarsson, L.; Gillies, C.L. The value and opportunity of restoring Australia’s lost rock oyster reefs. Restor. Ecol. 2020, 28, 304–314. [Google Scholar] [CrossRef]
  19. Christianen, M.J.A.; Lengkeek, W.; Bergsma, J.H.; Coolen, J.W.P.; Didderen, K.; Dorenbosch, M.; Driessen, F.M.F.; Kamermans, P.; Reuchlin-Hugenholtz, E.; Sas, H.; et al. Return of the native facilitated by the invasive? Population composition, substrate preferences and epibenthic species richness of a recently discovered shellfish reef with native European flat oysters (Ostrea edulis) in the North Sea. Mar. Biol. Res. 2018, 14, 590–597. [Google Scholar] [CrossRef] [Green Version]
  20. La Peyre, M.K.; Humphries, A.T.; Casas, S.M.; La Peyre, J.F. Temporal variation in development of ecosystem service from oyster reef restoration. Ecol. Eng. 2014, 63, 34–44. [Google Scholar] [CrossRef]
  21. Fivash, G.S.; Stüben, D.; Bachmann, M.; Walles, B.; van Belzen, J.; Didderen, K.; Temmink, R.J.M.; Lengkeek, W.; van der Heide, T.; Bouma, T.J. Can we enhance ecosystem-based coastal defense by connecting oysters to marsh edges? Analyzing the limits of oyster reef establishment. Ecol. Eng. 2021, 165, 106221. [Google Scholar] [CrossRef]
  22. Cannon, D.; Kibler, K.; Walters, L.; Chambers, L. Hydrodynamic and biogeochemical evolution of a restored intertidal oyster (Crassostrea virginica) reef. Sci. Total Environ. 2022, 831, 154879. [Google Scholar] [CrossRef] [PubMed]
  23. Cannon, D.; Kibler, K.M.; Kitsikoudis, V.; Medeiros, S.C.; Walters, L.J. Variation of mean flow and turbulence characteristics within canopies of restored intertidal oyster reefs as a function of restoration age. Ecol. Eng. 2022, 180, 106678. [Google Scholar] [CrossRef]
  24. Goelz, T.; Vogt, B.; Hartley, T. Alternative substrates used for oyster reef restoration: A review. J. Shellfish Res. 2020, 39, 1–12. [Google Scholar] [CrossRef] [Green Version]
  25. Walles, B.; Troost, K.; van den Ende, D.; Nieuwhof, S.; Smaal, A.C.; Ysebaert, T. From artificial structures to self-sustaining oyster reefs. J. Sea Res. 2016, 108, 1–9. [Google Scholar] [CrossRef]
  26. Kuykendall, K.M.; Moreno, P.; Powell, E.N.; Soniat, T.M.; Colley, S.; Mann, R.; Munroe, D.M. The exposed surface area to volume ratio: Is shell more efficient than limestone in promoting oyster recruitment? J. Shellfish Res. 2015, 34, 217–225. [Google Scholar] [CrossRef] [Green Version]
  27. La Peyre, M.; Furlong, J.; Brown, L.A.; Piazza, B.P.; Brown, K. Oyster reef restoration in the northern Gulf of Mexico: Extent, methods and outcomes. Ocean Cost. Manag. 2014, 89, 20–28. [Google Scholar] [CrossRef]
  28. Kim, D.; Woo, J.; Yoon, H.S.; Na, W.B. Efficiency, tranquillity and stability indices to evaluate performance in the artificial reef wake region. Ocean Eng. 2016, 122, 253–261. [Google Scholar] [CrossRef]
  29. Woo, J.; Kim, D.; Yoon, H.S.; Na, W.B. Efficient placement models of labyrinth-type artificial concrete reefs according to wake volume estimation to support natural submerged aquatic vegetation. Bull. Mar. Sci. 2018, 94, 1259–1272. [Google Scholar] [CrossRef]
  30. Wheaton, F. Review of the properties of Eastern oysters, Crassostrea virginica: Part I. Physical properties. Aquac. Eng. 2007, 37, 3–13. [Google Scholar] [CrossRef]
  31. Whitman, E.R.; Reidenbach, M.A. Benthic flow environments affect recruitment of Crassostrea virginica larvae to an intertidal oyster reef. Mar. Ecol. Prog. Ser. 2012, 463, 177–191. [Google Scholar] [CrossRef] [Green Version]
  32. ANSYS Inc. ANSYS CFX-Solver Theory Guide Release 2020-R1; ANSYS Inc.: Canonsburg, PA, USA, 2020. [Google Scholar]
  33. Kim, D.; Jung, S.; Kim, J.; Na, W.B. Efficiency and unit propagation indices to characterize wake volumes of marine forest artificial reefs established by flatly distributed placement models. Ocean Eng. 2019, 175, 138–148. [Google Scholar] [CrossRef]
  34. Menter, F.R. Review of the shear-stress transport turbulence model experience from an industrial perspective. Int. J. Comput. Fluid Dyn. 2009, 23, 305–316. [Google Scholar] [CrossRef]
  35. Kim, D.; Jung, S.; Na, W.B. Evaluation of turbulence models for estimating the wake region of artificial reefs using particle image velocimetry and computational fluid dynamics. Ocean Eng. 2021, 223, 108673. [Google Scholar] [CrossRef]
  36. Ono, M.; Deguchi, I. Relation between aggregating effect of artificial fish reef and flow pattern around reef. In Coastal Structures 2003; American Society of Civil Engineers: Portland, OR, USA, 2003; pp. 1164–1175. [Google Scholar] [CrossRef]
  37. Miller, D.C.; Norkko, A.; Pilditch, C.A. Influence of diet on dispersal of horse mussel Atrina zelandica biodeposits. Mar. Ecol. Prog. Ser. 2002, 242, 153–167. [Google Scholar] [CrossRef]
  38. Yoon, H.S.; Kim, D.; Na, W.B. Estimation of effective usable and burial volumes of artificial reefs and the prediction of cost-effective management. Ocean Coast. Manag. 2016, 120, 135–147. [Google Scholar] [CrossRef]
  39. Rouse, S.; Porter, J.S.; Wilding, T.A. Artificial reef design affects benthic secondary productivity and provision of functional habitat. Ecol. Evol. 2020, 10, 2122–2130. [Google Scholar] [CrossRef] [PubMed] [Green Version]
  40. Kim, D.; Woo, J.; Yoon, H.S.; Na, W.B. Wake lengths and structural responses of Korean general artificial reefs. Ocean Eng. 2014, 92, 83–91. [Google Scholar] [CrossRef]
  41. Kim, D.; Woo, J.; Na, W.B.; Yoon, H.S. Flow and structural response characteristics of a box-type artificial reef. J. Korean Soc. Coast. Ocean Eng. 2014, 26, 113–119. [Google Scholar] [CrossRef]
  42. Lee, I.C.; Kim, D.; Jung, S.; Na, W.B. Prediction of primary physical measures for cost-effective management of artificial seaweed reefs. Mar. Technol. Soc. J. 2020, 54, 25–43. [Google Scholar] [CrossRef]
  43. Kim, D.; Jung, S.; Na, W.B. Two perspectives for increasing of artificial wake region. J. Fish. Mar. Sci. Educ. 2020, 32, 1623–1631. [Google Scholar] [CrossRef]
  44. Jung, S.; Na, W.B.; Kim, D. Rugosity and blocking indices of artificial reefs and their correlations with wake volume. Ocean Eng. 2022, 261, 112204. [Google Scholar] [CrossRef]
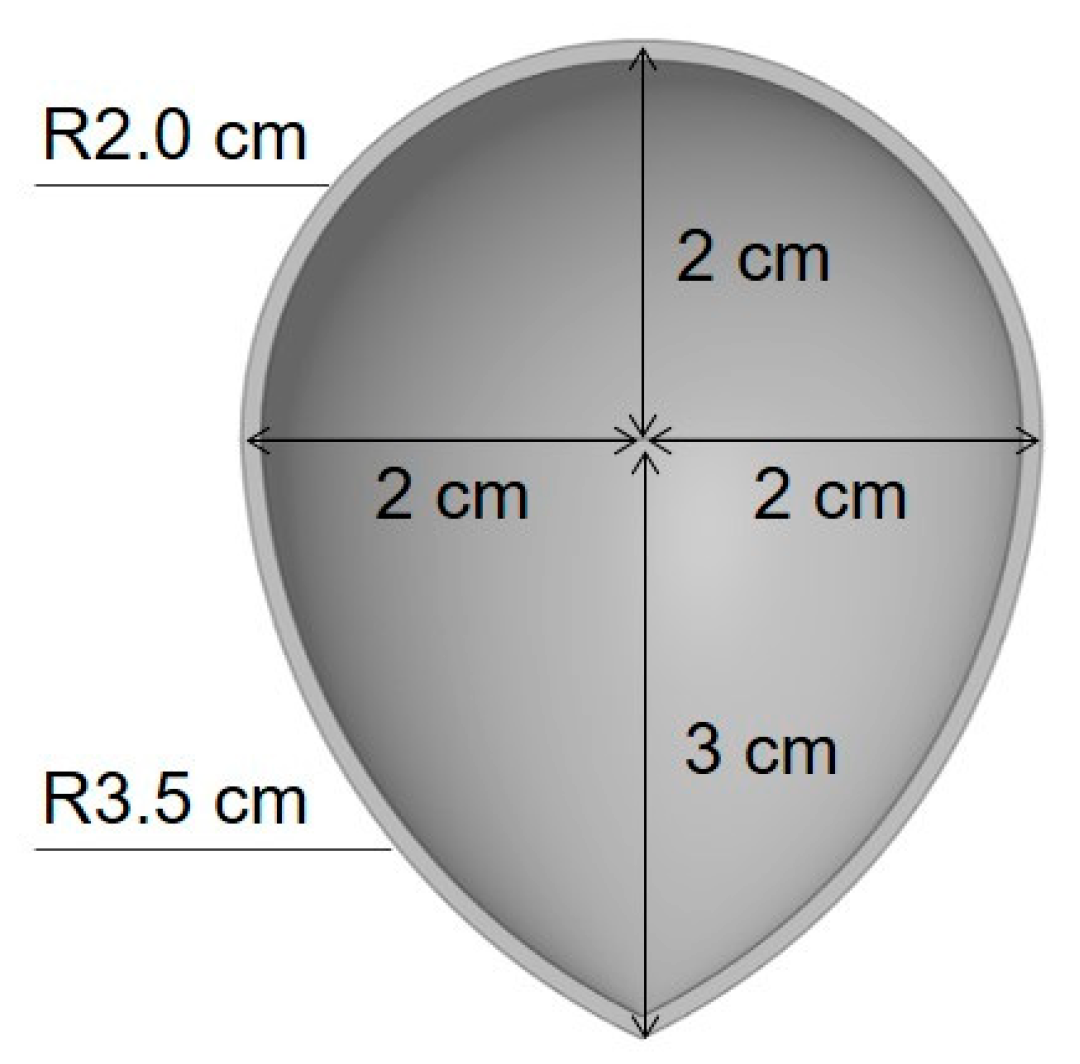
Figure 1. Schematic diagram of oyster shells considered in this study.
Jmse 11 00775 g001
Figure 2. Schematic diagrams of the initial artificial oyster reef (AOR) model (not to scale).
Jmse 11 00775 g002
Figure 3. Schematic diagrams of the 48 growth AOR models from growth stage 1 (GS 1) to 16 (GS 16) (not to scale).
Jmse 11 00775 g003
Figure 4. Flow domain (a) and boundary conditions (b) showing inlet (b1), outlet (b2), bottom (b3), and symmetry (b4).
Jmse 11 00775 g004
Figure 5. Mesh independence: (a) drag coefficient and (b) wake volume.
Jmse 11 00775 g005
Figure 6. Illustration of the wake region of an AOR model (the number of shells N = 50 ): (a) velocity vectors showing recirculating flow and (b) views of the wake volume (orange color).
Jmse 11 00775 g006
Figure 7. Wake volumes of the initial AOR models: (a) shell penetration depth of 10%; (b) shell penetration depth of 50%.
Jmse 11 00775 g007
Figure 8. Wake volumes of the growth AOR models: (a) correlation between the wake volumes and the growth stages (GSs) and (b) plane views of wake volumes when GS = 1 and GS = 16, respectively.
Jmse 11 00775 g008
Figure 9. Normalized wake volume ( W V ¯ ) according to (a) the number of oyster shells ( N ) and (b) the structural volume of AOR ( V A O R ).
Jmse 11 00775 g009
Figure 10. Normalized wake volume ( W V ¯ ) according to (a) the improved blocking index (BI) and (b) the surface complexity index (SI).
Jmse 11 00775 g010
Figure 11. Correlation of the efficiency indices with number of oyster shells ( N ).
Jmse 11 00775 g011
Figure 12. Correlations of the three evaluation indices (EI, BI, and SI): (a) EI vs. BI, (b) EI vs. SI, and (c) SI vs. BI. EI: efficiency index; BI: improved blocking index; SI: surface complexity index.
Jmse 11 00775 g012
Table 1. The initial artificial oyster reef (AOR) model. A total of 48 initial AOR models were constructed by considering four shell orientations, six compositions, and two shell penetration depths.
Shell OrientationShell Composition
Number of Oysters Penperdicular to Flow Direction (Interval)Number of Oysters in Flow Direction (Interval)
Convex
Concave
Mixed 1
Mixed 2
3 (12 cm)1 (–)
3 (12 cm)3 (12 cm)
3 (12 cm)5 (6 cm)
5 (6 cm)1 (–)
5 (6 cm)3 (12 cm)
5 (6 cm)5 (6 cm)
Table 2. Growth stages of the growth AOR models (to be continued).
Growth Stage
GS
Number of Shells N Width W (cm)Length L
(cm)
Height H
(cm)
Volume
(cm3)
Total Surface Area (cm2)Projection Area (cm2)
1Rep. 15030.6630.559.974623.374906.79279.60
Rep. 25030.3530.009.804626.754978.35281.46
Rep. 35030.0030.238.874590.104206.49241.82
2Rep. 16030.6630.5513.454649.255225.37355.33
Rep. 26030.3530.0014.504652.935511.11358.63
Rep. 36030.4030.4212.104613.754678.59276.62
3Rep. 17030.6630.7813.454674.135926.94360.21
Rep. 27030.6930.0014.504678.696035.90383.25
Rep. 37030.4030.4212.124646.655156.80315.48
4Rep. 18030.6630.7816.404694.846344.33389.63
Rep. 28031.5130.0017.504704.366553.99425.60
Rep. 38030.6330.4212.124671.325646.30339.27
5Rep. 19030.9431.2416.804720.666862.75417.85
Rep. 29031.5131.8417.694730.417075.31436.84
Rep. 39032.5130.4212.834697.926181.34362.12
6Rep. 110030.9433.3718.424744.217339.73443.11
Rep. 210031.5131.8417.714756.257594.81463.90
Rep. 310032.5131.4712.834725.186672.37364.56
7Rep. 111032.4233.3719.294770.467863.62482.67
Rep. 211031.5132.3420.054781.968113.50503.89
Rep. 311032.5131.9016.014751.477201.67386.06
8Rep. 112032.4233.3721.814796.228383.68529.98
Rep. 212031.5132.3422.074808.138644.26517.64
Rep. 312032.7334.5116.014778.987706.13397.70
9Rep. 113032.4233.3721.814820.808891.89530.86
Rep. 213031.5132.3422.074833.879156.26545.31
Rep. 313032.7334.5116.064805.348234.50419.21
10Rep. 114033.8733.3721.814846.339401.96538.54
Rep. 214032.1534.5522.074859.069666.91560.63
Rep. 314032.7334.5116.064835.338680.43440.96
11Rep. 115033.8734.5221.814870.189875.24552.31
Rep. 215032.1535.8022.074882.6910,134.06572.38
Rep. 315032.7334.7619.404862.309217.09471.87
12Rep. 116033.8734.5221.814896.1910,397.32561.01
Rep. 216032.4335.8022.074908.5510,655.81581.27
Rep. 316032.7334.7619.404892.849702.75502.82
13Rep. 117033.8735.4221.814922.0810,910.30573.46
Rep. 217032.4335.8022.074934.3211,171.07593.24
Rep. 317033.6136.3619.674919.4710,241.49530.95
14Rep. 118033.8735.7021.814947.5711,420.00592.16
Rep. 218032.4335.8023.784959.0111,666.11613.22
Rep. 318033.6137.4722.524950.1310,738.68564.82
15Rep. 119033.9935.7022.694972.7311,923.42613.67
Rep. 219033.9435.8026.254984.8012,188.37658.90
Rep. 319033.9737.4722.524976.8211,272.94589.31
16Rep. 120035.0735.7022.694998.4512,440.46643.39
Rep. 220033.9435.8026.255010.3712,705.07666.88
Rep. 320033.9737.4724.595006.3711,768.37620.63
Disclaimer/Publisher’s Note: The statements, opinions and data contained in all publications are solely those of the individual author(s) and contributor(s) and not of MDPI and/or the editor(s). MDPI and/or the editor(s) disclaim responsibility for any injury to people or property resulting from any ideas, methods, instructions or products referred to in the content.